more data mining with weka - university of waikato · more data mining with weka class 5 – lesson...
TRANSCRIPT

weka.waikato.ac.nz
Ian H. Witten
Department of Computer ScienceUniversity of Waikato
New Zealand
More Data Mining with Weka
Class 5 – Lesson 1
Simple neural networks

Lesson 5.1: Simple neural networks
Lesson 5.1 Simple neural networks
Lesson 5.2 Multilayer Perceptrons
Lesson 5.3 Learning curves
Lesson 5.4 Performance optimization
Lesson 5.5 ARFF and XRFF
Lesson 5.6 Summary
Class 1 Exploring Weka’s interfaces;working with big data
Class 2 Discretization and text classification
Class 3 Classification rules, association rules, and clustering
Class 4 Selecting attributes andcounting the cost
Class 5 Neural networks, learning curves, and performance optimization

Many people love neural networks (not me)… the very name is suggestive of … intelligence!
Lesson 5.1: Simple neural networks

Set all weights to zero Until all instances in the training data are classified correctly
For each instance i in the training data If i is classified incorrectly
If i belongs to the first class add it to the weight vector else subtract it from the weight vector
Perceptron: simplest form Determine the class using a linear combination of attributes for test instance a, if x > 0 then class 1, if x < 0 then class 2
– Works most naturally with numeric attributes
Lesson 5.1: Simple neural networks
=
=++++=k
jjjkk awawawawwx
022110 ...
Perceptron convergence theorem– converges if you cycle repeatedly through the training data– provided the problem is “linearly separable”

Linear decision boundaries Recall Support Vector Machines (Data Mining with Weka, lesson 4.5)
– also restricted to linear decision boundaries– but can get more complex boundaries with the “Kernel trick” (not explained)
Perceptron can use the same trick to get non-linear boundaries
Voted perceptron (in Weka) Store all weight vectors and let them vote on test examples
– weight them according to their “survival” time
Claimed to have many of the advantages of Support Vector Machines … faster, simpler, and nearly as good
Lesson 5.1: Simple neural networks

Lesson 5.1: Simple neural networks
How good is VotedPerceptron?VotedPerceptron SMO
Ionosphere dataset ionosphere.arff 86% 89%
German credit dataset credit-g.arff 70% 75%
Breast cancer dataset breast-cancer.arff 71% 70%
Diabetes dataset diabetes.arff 67% 77%
Is it faster? … yes

History of the Perceptron 1957: Basic perceptron algorithm
– Derived from theories about how the brain works– “A perceiving and recognizing automaton”– Rosenblatt “Principles of neurodynamics: Perceptrons and
the theory of brain mechanisms”
1970: Suddenly went out of fashion– Minsky and Papert “Perceptrons”
1986: Returned, rebranded “connectionism”– Rumelhart and McClelland “Parallel distributed processing”– Some claim that artificial neural networks mirror brain function
Multilayer perceptrons– Nonlinear decision boundaries– Backpropagation algorithm
Lesson 5.1: Simple neural networks
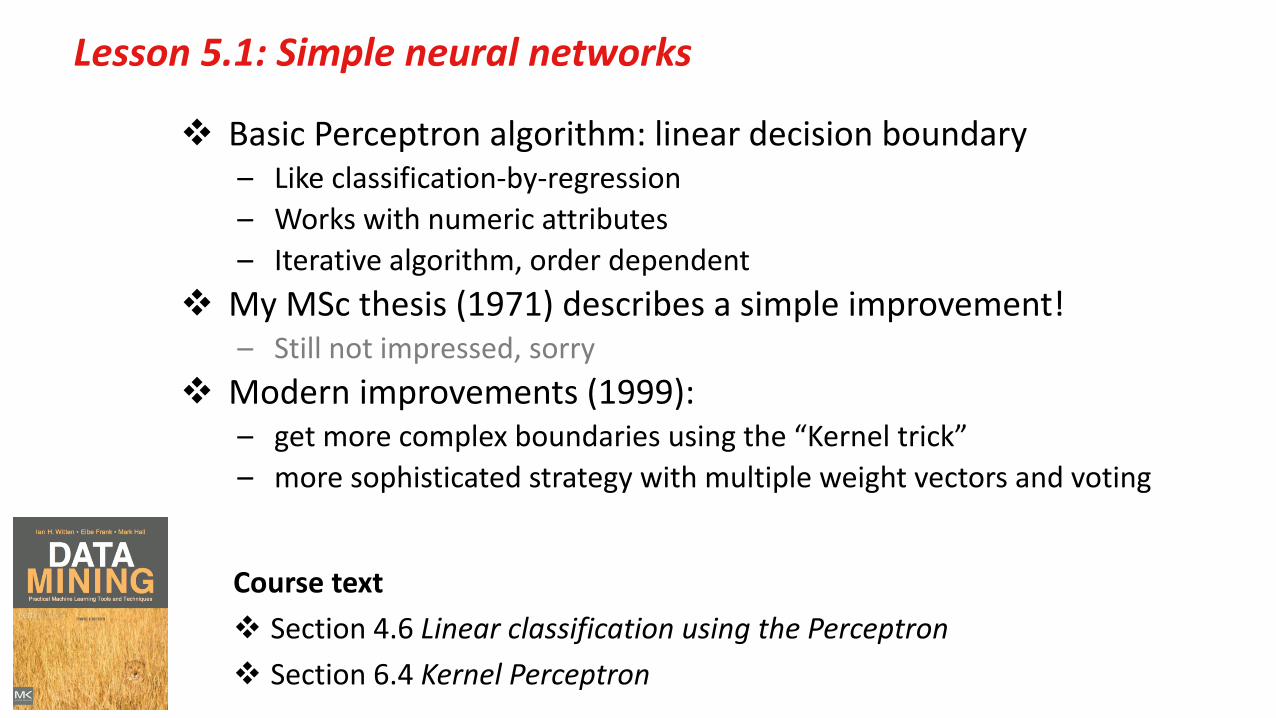
Basic Perceptron algorithm: linear decision boundary– Like classification-by-regression– Works with numeric attributes– Iterative algorithm, order dependent
My MSc thesis (1971) describes a simple improvement!– Still not impressed, sorry
Modern improvements (1999):– get more complex boundaries using the “Kernel trick”– more sophisticated strategy with multiple weight vectors and voting
Course text Section 4.6 Linear classification using the Perceptron Section 6.4 Kernel Perceptron
Lesson 5.1: Simple neural networks

weka.waikato.ac.nz
Ian H. Witten
Department of Computer ScienceUniversity of Waikato
New Zealand
More Data Mining with Weka
Class 5 – Lesson 2
Multilayer Perceptrons

Lesson 5.2: Multilayer Perceptrons
Lesson 5.1 Simple neural networks
Lesson 5.2 Multilayer Perceptrons
Lesson 5.3 Learning curves
Lesson 5.4 Performance optimization
Lesson 5.5 ARFF and XRFF
Lesson 5.6 Summary
Class 1 Exploring Weka’s interfaces;working with big data
Class 2 Discretization and text classification
Class 3 Classification rules, association rules, and clustering
Class 4 Selecting attributes andcounting the cost
Class 5 Neural networks, learning curves, and performance optimization

Network of perceptrons Input layer, hidden layer(s), and output layer Each connection has a weight (a number) Each node performs a weighted sum
of its inputs and thresholds the result– usually with a sigmoid function– nodes are often called “neurons”
Lesson 5.2: Multilayer Perceptrons
input
sigmoid
input
outp
ut
output
input
output
3 hidden layers

How many layers, how many nodes in each? Input layer: one for each attribute (attributes are numeric, or binary) Output layer: one for each class (or just one if the class is numeric) How many hidden layers? — Big Question #1 Zero hidden layers:
– standard Perceptron algorithm– suitable if data is linearly separable
One hidden layer:– suitable for a single convex region of the decision space
Two hidden layers:– can generate arbitrary decision boundaries
How big are they? — Big Question #2– usually chosen somewhere between the input and output layers– common heuristic: mean value of input and output layers (Weka’s default)
Lesson 5.2: Multilayer Perceptrons

What are the weights? They’re learned from the training set Iteratively minimize the error using steepest descent Gradient is determined using the “backpropagation” algorithm Change in weight computed by multiplying the gradient by the “learning rate”
and adding the previous change in weight multiplied by the “momentum”:Wnext = W + ΔWΔW = – learning_rate × gradient + momentum × ΔWprevious
Can get excellent results Often involves (much) experimentation
– number and size of hidden layers– value of learning rate and momentum
Lesson 5.2: Multilayer Perceptrons

Lesson 5.2: Multilayer Perceptrons
MultilayerPerceptron performance Numeric weather data 79%! (J48, NaiveBayes both 64%, SMO 57%, IBk 79%) On real problems does quite well – but slow
Parameters hiddenLayers: set GUI to true and try 5, 10, 20 learningRate, momentum makes multiple passes (“epochs”) through the data training continues until
– error on the validation set consistently increases– or training time is exceeded

Lesson 5.2: Multilayer Perceptrons
Create your own network structure! Selecting nodes
– click to select– right-click in empty space to deselect
Creating/deleting nodes– click in empty space to create– right-click (with no node selected)
to delete
Creating/deleting connections– with a node selected, click on another
to connect to it– … and another, and another– right-click to delete connection
Can set parameters here too

Lesson 5.2: Multilayer Perceptrons
Are they any good? Experimenter with 6 datasets
– Iris, breast-cancer, credit-g, diabetes, glass, ionosphere
9 algorithms– MultilayerPerceptron, ZeroR, OneR, J48, NaiveBayes, IBk, SMO,
AdaBoostM1, VotedPerceptron
MultilayerPerceptron wins on 2 datasets Other wins:
– SMO on 2 datasets– J48 on 1 dataset– IBk on 1 dataset
But … 10–2000 times slower than other methods

Multilayer Perceptrons implement arbitrary decision boundaries– given two (or more) hidden layers, that are large enough– and are trained properly
Training by backpropagation– iterative algorithm based on gradient descent
In practice??– Quite good performance, but extremely slow– Still not impressed, sorry– Might be a lot more impressive on more complex datasets
Course text Section 4.6 Linear classification using the Perceptron Section 6.4 Kernel Perceptron
Lesson 5.2: Multilayer Perceptrons

weka.waikato.ac.nz
Ian H. Witten
Department of Computer ScienceUniversity of Waikato
New Zealand
More Data Mining with Weka
Class 5 – Lesson 3
Learning curves

Lesson 5.3: Learning curves
Lesson 5.1 Simple neural networks
Lesson 5.2 Multilayer Perceptrons
Lesson 5.3 Learning curves
Lesson 5.4 Performance optimization
Lesson 5.5 ARFF and XRFF
Lesson 5.6 Summary
Class 1 Exploring Weka’s interfaces;working with big data
Class 2 Discretization and text classification
Class 3 Classification rules, association rules, and clustering
Class 4 Selecting attributes andcounting the cost
Class 5 Neural networks, learning curves, and performance optimization

Large separate test set? … use it Lots of data? … use holdout Otherwise, use 10-fold cross-validation
– and repeat 10 times, as the Experimenter does
But … how much is a lot? It depends
– on number of classes– number of attributes– structure of the domain– kind of model …
Learning curves
The advice on evaluation (from “Data Mining with Weka”)
training data
performance
Lesson 5.3: Learning curves

Resample filter:replacement vs. no replacement
Sample training set but not test set Meta > FilteredClassifier
Resample (no replacement), 50% sample, J48, 10-fold cross-validation
Glass dataset (214 instances, 6 classes)
Plotting a learning curve
sampleddataset
originaldataset
copy, or move?
Lesson 5.3: Learning curves

An empirical learning curve
training data (%)
Lesson 5.3: Learning curves
0
20
40
60
80
0 20 40 60 80 100
performance (%) ZeroR
J48
100% 66.8%90% 68.7%80% 68.2%70% 66.4%60% 66.4%50% 65.0%45% 62.1%40% 57.0%35% 56.5%30% 59.3%25% 57.0%20% 44.9%10% 43.5%
5% 41.1%2% 33.6%1% 27.6%

An empirical learning curve
training data (%)
Lesson 5.3: Learning curves
0
20
40
60
80
0 20 40 60 80 100
performance (%) ZeroR
J48 (10 repetitions)

An empirical learning curve
training data (%)
Lesson 5.3: Learning curves
performance (%) ZeroR
J48 (1000 repetitions)
0
20
40
60
80
0 20 40 60 80 100

Lesson 5.3: Learning curves
How much data is enough? Hard to say! Plot learning curve? Resampling (with/without replacement) … but don’t sample the test set! meta > FilteredClassifier Note:
performance figure is only an estimate

weka.waikato.ac.nz
Ian H. Witten
Department of Computer ScienceUniversity of Waikato
New Zealand
More Data Mining with Weka
Class 5 – Lesson 4
Meta-learners for performance optimization

Lesson 5.4: Meta-learners for performance optimization
Lesson 5.1 Simple neural networks
Lesson 5.2 Multilayer Perceptrons
Lesson 5.3 Learning curves
Lesson 5.4 Performance optimization
Lesson 5.5 ARFF and XRFF
Lesson 5.6 Summary
Class 1 Exploring Weka’s interfaces;working with big data
Class 2 Discretization and text classification
Class 3 Classification rules, association rules, and clustering
Class 4 Selecting attributes andcounting the cost
Class 5 Neural networks, learning curves, and performance optimization

Recall AttributeSelectedClassifier with WrapperSubsetEval– selects an attribute subset based on how well a classifier performs– uses cross-validation to assess performance
1. CVParameterSelection: selects best value for a parameter– optimizes performance, using cross-validation– optimizes accuracy (classification) or root mean-squared error (regression)
2. GridSearch– optimizes two parameters by searching a 2D grid
3. ThresholdSelector– selects a probability threshold on the classifier’s output– can optimize accuracy, true positive rate, precision, recall, F-measure
“Wrapper” meta-learners in Weka
Lesson 5.4: Meta-learners for performance optimization

J48 has two parameters, confidenceFactor C and minNumObj M– in Data Mining with Weka, I advised not to play with confidenceFactor
Load diabetes.arff, select J48: 73.8% CVParameterSelection with J48 confidenceFactor from 0.1 to 1.0 in 10 steps: C 0.1 1 10
– check More button– use C 0.1 0.9 9
Achieves 73.4% with C = 0.1 minNumObj from 1 to 10 in 10 steps
– add M 1 10 10 (first)
Achieves 74.3% with C = 0.2 and M = 10; simpler tree – takes a while!
Try CVParameterSelection
Lesson 5.4: Meta-learners for performance optimization

CVParameterSelection with multiple parameters– first one, then the other
GridSearch optimizes two parameters together Can explore best parameter combinations for a filter and classifier Can optimize accuracy (classification) or various measures (regression) Very flexible but fairly complicated to set up Take a quick look …
GridSearch
Lesson 5.4: Meta-learners for performance optimization

ThresholdSelector
Lesson 5.4: Meta-learners for performance optimization
In Lesson 4.6 (cost-sensitive classification), we looked at probability thresholds Credit dataset credit-g.arff, NaiveBayes, 75.4% Output predictions Weka chooses good if Pr[good] > Pr[bad],
i.e. threshold = 0.5:– predicts 756 good, with 151 mistakes– 244 bad, with 95 mistakes
Can optimize threshold with ThresholdSelector– though unlikely to do better
actual predicted pgood pbad0 good good 0.999 0.001
50 good good 0.991 0.009100 good good 0.983 0.017150 good good 0.975 0.025200 good good 0.965 0.035250 bad good 0.951 0.049300 bad good 0.934 0.066350 good good 0.917 0.083400 good good 0.896 0.104450 good good 0.873 0.127500 good good 0.836 0.164550 good good 0.776 0.224600 bad good 0.715 0.285650 good good 0.663 0.337700 good good 0.587 0.413750 bad good 0.508 0.492800 good bad 0.416 0.584850 bad bad 0.297 0.703900 good bad 0.184 0.816950 bad bad 0.04 0.96
a b <-- classified as605 95 | a = good151 149 | b = bad

FMEASURE✓ ACCURACY
TRUE_POSTRUE_NEGTP_RATEPRECISIONRECALL
✓ ACCURACY
Credit dataset credit-g.arff, NaiveBayes 75.4% ThresholdSelector, NaiveBayes, optimize Accuracy 75.4%
– NB designatedClass should be the first class value
But you can optimize other things!
Try ThresholdSelector
Lesson 5.4: Meta-learners for performance optimization
a b <-- classified asTP FN | a = goodFP TN | b = bad
number correctly classified as goodtotal number classified as good
TPTP+FP
number correctly classified as goodactual number of good instances
TPTP+FN
2 × Precision × RecallPrecision + Recall
Confusion matrix
Precision =
Recall =
F-measure

Don’t optimize parameters manually– you’ll overfit!
Wrapper method uses internal cross-validation to optimize
1. CVParameterSelection — optimize parameters individually
2. GridSearch — optimize two parameters together
3. ThresholdSelection — select a probability threshold
Course text Section 11.5 Optimizing performance Section 5.7 Recall–Precision curves
Lesson 5.4: Meta-learners for performance optimization

weka.waikato.ac.nz
Ian H. Witten
Department of Computer ScienceUniversity of Waikato
New Zealand
More Data Mining with Weka
Class 5 – Lesson 5
ARFF and XRFF

Lesson 5.5: ARFF and XRFF
Lesson 5.1 Simple neural networks
Lesson 5.2 Multilayer Perceptrons
Lesson 5.3 Learning curves
Lesson 5.4 Performance optimization
Lesson 5.5 ARFF and XRFF
Lesson 5.6 Summary
Class 1 Exploring Weka’s interfaces;working with big data
Class 2 Discretization and text classification
Class 3 Classification rules, association rules, and clustering
Class 4 Selecting attributes andcounting the cost
Class 5 Neural networks, learning curves, and performance optimization

@relation@attribute– nominal, numeric (integer or real), string
@datadata lines (“?” for a missing value)
% comment lines
ARFF format revisited
Lesson 5.5: ARFF and XRFF
@relation weather
@attribute outlook {sunny, overcast, rainy}@attribute temperature numeric@attribute humidity numeric@attribute windy {TRUE, FALSE}@attribute play {yes, no}
@datasunny, 85, 85, FALSE, nosunny, 80, 90, TRUE, no…rainy, 71, 91, TRUE, no
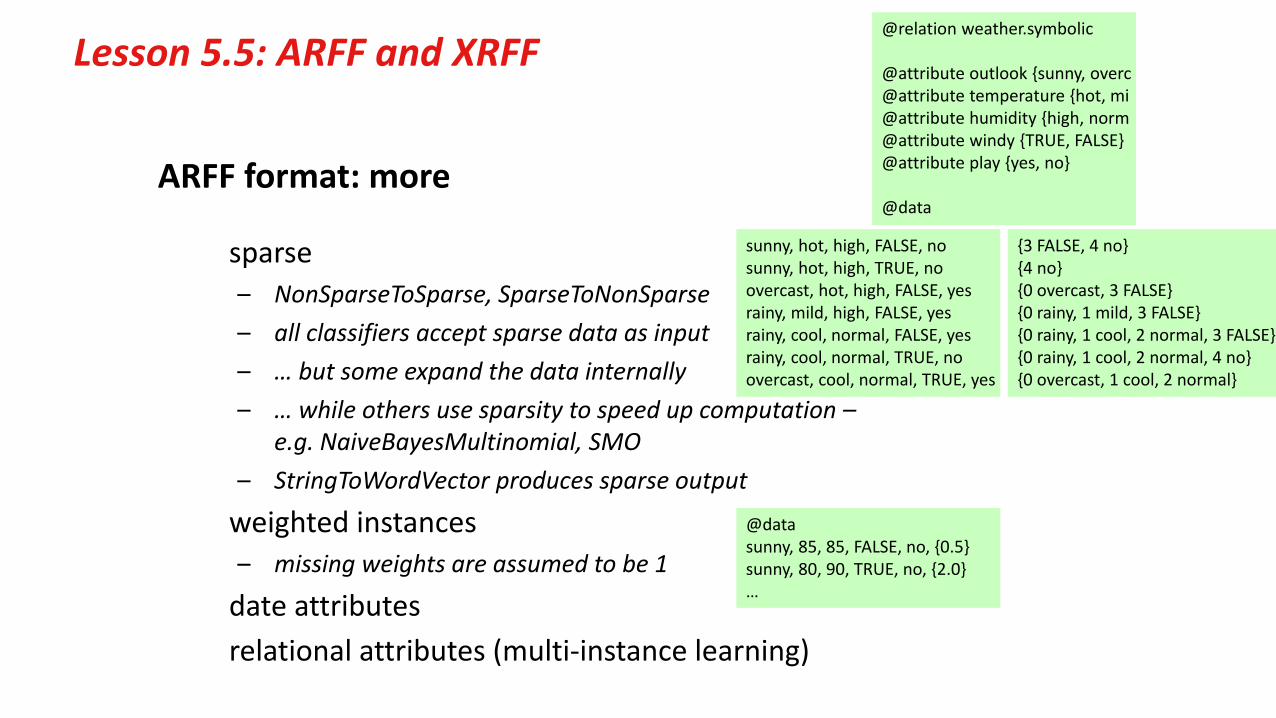
ARFF format: more
Lesson 5.5: ARFF and XRFF
sunny, hot, high, FALSE, nosunny, hot, high, TRUE, noovercast, hot, high, FALSE, yesrainy, mild, high, FALSE, yesrainy, cool, normal, FALSE, yesrainy, cool, normal, TRUE, noovercast, cool, normal, TRUE, yes
{3 FALSE, 4 no}{4 no}{0 overcast, 3 FALSE}{0 rainy, 1 mild, 3 FALSE}{0 rainy, 1 cool, 2 normal, 3 FALSE}{0 rainy, 1 cool, 2 normal, 4 no}{0 overcast, 1 cool, 2 normal}
@datasunny, 85, 85, FALSE, no, {0.5}sunny, 80, 90, TRUE, no, {2.0}…
sparse – NonSparseToSparse, SparseToNonSparse– all classifiers accept sparse data as input– … but some expand the data internally– … while others use sparsity to speed up computation –
e.g. NaiveBayesMultinomial, SMO– StringToWordVector produces sparse output
weighted instances– missing weights are assumed to be 1
date attributesrelational attributes (multi-instance learning)
@relation weather.symbolic
@attribute outlook {sunny, overc@attribute temperature {hot, mi@attribute humidity {high, norm@attribute windy {TRUE, FALSE}@attribute play {yes, no}
@data

XML file format: XRFF
<dataset name="weather.symbolic" version="3.6.10"><header>
<attributes><attribute name="outlook" type="nominal">
<labels><label>sunny</label><label>overcast</label><label>rainy</label>
</labels></attribute>…
</header><body>
<instances><instance>
<value>sunny</value><value>hot</value><value>high</value><value>FALSE</value><value>no</value>
</instance>…
</instances></body>
</dataset>
Explorer can read and write XRFF files Verbose (compressed version: .xrff.gz) Same information as ARFF files
– including sparse option and instance weights
plus a little more– can specify which attribute is the class– attribute weights
Lesson 5.5: ARFF and XRFF
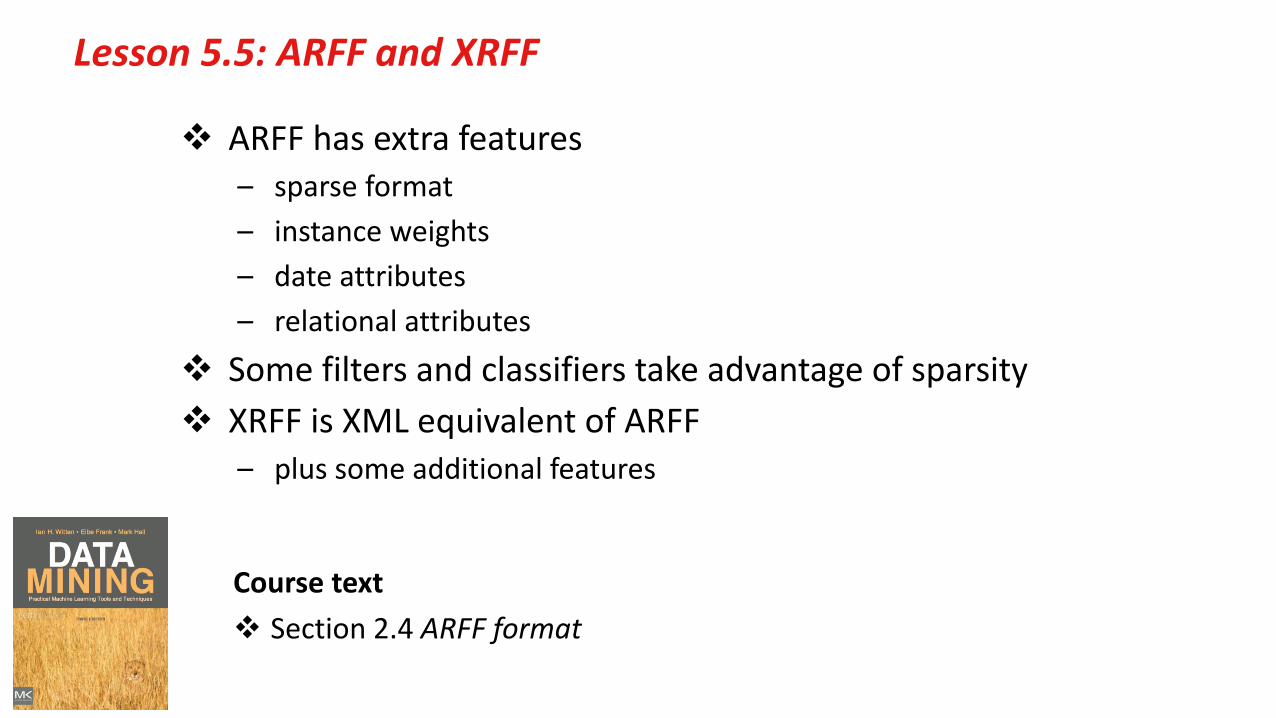
ARFF has extra features– sparse format– instance weights– date attributes– relational attributes
Some filters and classifiers take advantage of sparsity XRFF is XML equivalent of ARFF
– plus some additional features
Course text Section 2.4 ARFF format
Lesson 5.5: ARFF and XRFF

weka.waikato.ac.nz
Ian H. Witten
Department of Computer ScienceUniversity of Waikato
New Zealand
More Data Mining with Weka
Class 5 – Lesson 6
Summary

Lesson 5.6: Summary
Lesson 5.1 Simple neural networks
Lesson 5.2 Multilayer Perceptrons
Lesson 5.3 Learning curves
Lesson 5.4 Performance optimization
Lesson 5.5 ARFF and XRFF
Lesson 5.6 Summary
Class 1 Exploring Weka’s interfaces;working with big data
Class 2 Discretization and text classification
Class 3 Classification rules, association rules, and clustering
Class 4 Selecting attributes andcounting the cost
Class 5 Neural networks, learning curves, and performance optimization

Lesson 5.6 Summary
There’s no magic in data mining– Instead, a huge array of alternative techniques
There’s no single universal “best method”– It’s an experimental science! – What works best on your problem?
Weka makes it easy– … maybe too easy?
There are many pitfalls– You need to understand what you’re doing!
Focus on evaluation … and significance– Different algorithms differ in performance – but is it significant?
From Data Mining with Weka
Lesson 5.6 Summary
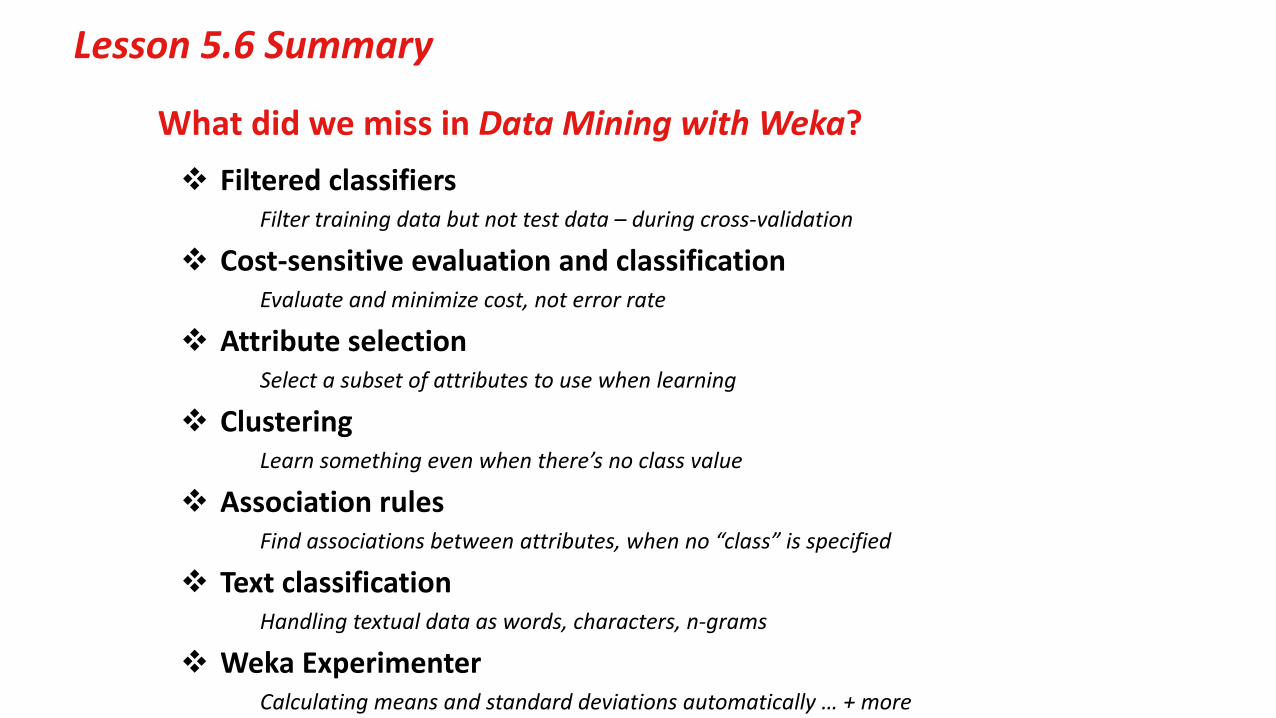
Filtered classifiersFilter training data but not test data – during cross-validation
Cost-sensitive evaluation and classificationEvaluate and minimize cost, not error rate
Attribute selectionSelect a subset of attributes to use when learning
ClusteringLearn something even when there’s no class value
Association rulesFind associations between attributes, when no “class” is specified
Text classificationHandling textual data as words, characters, n-grams
Weka ExperimenterCalculating means and standard deviations automatically … + more
What did we miss in Data Mining with Weka?

Lesson 5.6 Summary
Filtered classifiers ✔Filter training data but not test data – during cross-validation
Cost-sensitive evaluation and classification ✔Evaluate and minimize cost, not error rate
Attribute selection ✔Select a subset of attributes to use when learning
Clustering ✔Learn something even when there’s no class value
Association rules ✔Find associations between attributes, when no “class” is specified
Text classification ✔Handling textual data as words, characters, n-grams
Weka Experimenter ✔Calculating means and standard deviations automatically … + more
What did we do in More Data Mining with Weka? Big data ✔ CLI ✔ Knowledge Flow ✔ Streaming ✔ Discretization ✔ Rules vs trees ✔ Multinomial NB ✔ Neural nets ✔ ROC curves ✔ Learning curves ✔ ARFF/XRFF ✔
Plus …

Lesson 5.6 Summary
Time series analysisEnvironment for time series forecasting
Stream-oriented algorithmsMOA system for massive online analysis
Multi-instance learningBags of instances labeled positive or negative, not single instances
One-class classification Interfaces to other data mining packages
Accessing from Weka the excellent resources provided by the R data mining systemWrapper classes for popular packages like LibSVM, LibLinear
Distributed Weka with Hadoop Latent Semantic Analysis
What have we missed?
These are available as Weka “packages”

Lesson 5.6 Summary
“Data is the new oil”– economic and social importance of data mining will rival that of the
oil economy (by 2020?)
Personal data is becoming a new economic asset class– we need trust between individuals, government, private sector
Ethics– “a person without ethics is a wild beast loosed upon this world”
… Albert Camus
Wisdom– the value attached to knowledge– “knowledge speaks, but wisdom listens” … attributed to Jimi Hendrix

weka.waikato.ac.nz
Department of Computer ScienceUniversity of Waikato
New Zealand
creativecommons.org/licenses/by/3.0/
Creative Commons Attribution 3.0 Unported License
More Data Mining with Weka