morbidity and mortality weekly report in …stacks.cdc.gov/view/cdc/1298/cdc_1298_ds1.pdfmorbidity...
TRANSCRIPT

CENTERS FOR DISEASE CONTROL December 4, 1981 / Vol. 30 / No. 47
International Notes581 Sudden, Unexpected, Nocturnal Deaths
among Southeast Asian Refugees Epidemiologic Notes and Reports
589 Cholera on a G u lf Coast Oil Rig — Texas
590 Occupational Dermatitis Associated w ith Grain Itch Mites — Texas
MORBIDITY AND MORTALITY WEEKLY REPORT
In tern a t ion a I No tes
Sudden, Unexpected, Nocturnal Deaths among Southeast Asian Refugees
Since February 1981, CDC has been notified of 38 cases of sudden death among Southeast Asian refugees that were investigated by medical examiners or coroners . All but one of these refugees were men, and all apparently died during sleep. Thirty-three deaths occurred among Laotian refugees, 25 of whom, including the 1 woman, were Hmong, an ethnic group from the northern Laotian highlands. Four persons who died suddenly were Vietnamese, and 1 was Kampuchean. Information currently available for 34 persons indicates that they had been in the United States from 5 days to 52 months (median 6 months) before death.
Based on approximations of the current Southeast Asian refugee population in the United States, the estimated sudden death rate per 100,000 is 46 for Hmong, 1 2 for other Laotians, 1.6 for Kampucheans, and 1.1 for Vietnamese. Persons who have died ranged in age from 1 9 to 63 years (median 32.5); 31 persons were between 25 and 44 years of age. The rate of sudden death for Laotian men in the United States between the ages of 25 and 44 was 87/100,000 in the past year.
The first such death occurred on Ju ly 15, 1977, and the most recent was on October 28, 1981. The increasing number of reported deaths parallels the accelerating influx of Laotians into the United States since the summer of 1 979 (Figure 1). Deaths have been reported from California (12), Minnesota (8), Oregon (5), Washington (3), Illinois (3), Rhode Island (2), and Iowa, Ohio, Oklahoma, Texas, and Wisconsin (1 each). The geographic distribution of these deaths reflects the distribution of Laotian refugees in this country.
Interviews with the families of 34 persons who died have supplemented information from medical examiners' and coroners' reports. The deaths of 29 persons were witnessed and occurred between 9:30 pm and 7:00 am; 28 persons appeared to be asleep, and one was just falling asleep. All were in good health, and none had complained of significant symptoms before going to bed. Witnesses were alerted or awakened by abnormal respiratory sounds and/or by a brief groan. All victims were unresponsive when discovered. Terminal respirations were described as deep, labored, and irregular, but without stridor or wheezing. Some witnesses heard gurgling and observed frothy sputum, but most did not. Several dying persons developed tonic rigidity during the episode, but the majority remained flaccid. Seven became incontinent of urine and/or stool. The witnesses described no indications of pain or terrifying dreams. Signs of life ceased within minutes. Paramedical personnel documented ventricular fibrillation in 2 persons, but were unable to resuscitate them. Five persons whose deaths were unwitnessed died sometime between midnight and 9:00 am; they were found in bed, and it appeared as though death had occurred during sleep. The circumstances of the 4 deaths for which information was obtained only from the medical examiner's or coroner's report were similar to those of the deaths described in interviews.
U.S. DEPARTMENT OF HEALTH A N D HUM AN SERVICES / PUBLIC H EA LTH SERVICE

582 MMWR December 4, 1981
Nocturnal Deaths — ContinuedInterviews with family members indicated that in the 24-hour period preceding death,
there had been no unusual physical illness, activities, emotional experiences, or food items or pharmacologically active substances consumed by persons who died. None of the persons who died were related, although one was reported to have had a relative (a paternal first cousin) who had died under similar circumstances in Laos. According to their families, none of the victims manifested clinical signs of the sleep-apnea syndrome, such as obesity, snoring, frequent nocturnal awakening, or hypersomnolence.
Results of autopsies and routine toxicologic screening tests have not identified a cause of death in 30 of the 36 case investigations completed to date by medical examiners and coroners and reviewed subsequently by pathologists at CDC. Three deaths were attributed to coronary atherosclerosis on the basis of coronary artery stenosis, but no evidence was found of acute coronary occlusion or myocardial infarction. None of these 3 individuals were known to have had previous symptoms or histories of coronary disease. Three deaths had been attributed to myocarditis; however, the CDC review committee felt that myocardial inflammation was significant in only 1 case. In the 2 most recent cases, gross autopsy showed no underlying disease process, but microscopic and toxicologic evaluations are not yet completed.
A review of medical-examiner records in Portland, Oregon, done to provide a basis for comparison, showed that for non-Laotian adults of all ages and both sexes, only 1 of 35 apparently natural deaths could not be explained after thorough postmortem evaluations. This review was not restricted to sudden deaths.Reported by Vang Pao, Xeu Vang Vangyi, Lao Family Community, Inc; W G Eckert, MD, National Association o f Medical Examiners; B Gates, J Beisner, Orange County Coroner's Office, T Prendergast, MD, Orange County Health and Medical Svcs, Santa Ana, D Stark, M Kreutzer, San Diego County Coroner's Office, D Ramras, MD, San Diego County Health Dept, Bounmy Soukbandith, Kiene Phabmixay. Ker Vue, Quoc Vuong, R Walsh, San Diego, C Brown, Refugee Health Program, Santa Clara County Health Dept, J
FIGURE 1. Sudden unexpected nocturnal deaths. Southeast Asian refugees, and quarterly estimate of Laotian population. United States, July 1977-October 1981
o #> £ o
< 5
‘ October only.
Vol. 30/No. 47 MMWR 583
N octurnal Deaths — ContinuedHauser, MD, San Jose, P Horn, MD, Sacramento County Health Dept, J Masters, MD, Sacramento County Coroner's Office, R Dambacher, R Kornb/um, MD, Los Angeles County Dept o f Chief Medical Examiner- Coroner, J Chin, MD, State Epidemiologist, California Dept o f Health Svcs; M Kalelkar, MD, Cook County Medical Examiner's Office, L Irvin, L Myler, Vermilion County Health Dept, Danville, R Anderson, R Hilbert, MD, Winnebago County Coroner's Office, BJ Francis, MD, State Epidemiologist, Illinois State Dept o f Public Health; R Wooters, MD, Polk County Medical Examiner's Office, LA Wintermeyer, MD, State Epidemiologist, Iowa State Dept o f Health; Xa Vang, Lao Family Community, Inc, St. Paul, J Godes, MPH, St. Paul D iv o f Public Health, M McGee, MD, Ramsey County Medical Examiner's Office, Bounleng Dao Leuang, Lao Association o f Minneapolis, S DuVander, Minnesota State Refugee Office, G Peterson, MD, Hennepin County Medical Examiner's Office, AG Dean, MD, State Epidemiologist, Minnesota State Dept o f Health; Muacha Cherpao, Lao Family Community, Inc., Missoula, Montana; R Fazekas, MD, S Fazekas, MD, Lucas County Coroner's Office, Toledo, TJ Halpin, MD, State Epidemiologist, Ohio State Dept o f Health; R Dix, MD, Comanche County Memorial Hospital, Lawton, MA Roberts, PhD, State Epidemiologist, Oklahoma State Dept o f Health; L Lewman, MD, Multnomah County Medical Examiner's Office, C Schade, MD, Multnomah County Dept o f Health, Kuxeng Yongchu, Portland, JA Googins, MD, State Epidemiologist, Oregon Dept o f Human Resources; W Sturner, MD, Office o f State Medical Examiners, GA Faich, MD, State Epidemiologist, Rhode Island Dept o f Health; N Peerwani, MD, Tarrant County Medical Examiner's Office, Fort Worth, CR Webb, Jr, MD, State Epidemiologist, Texas State Dept o f Health; D Reay, MD, King County Medical Examiner Division, M Hurlich, PhD, Dept o f Anthropology, University o f Washington, Hang Sao, Phengphone Rithvixay, Seattle, J Davelaar, H Lancaster, MD, Pierce County Coroner's Office, Tacoma, J AHard, PhD, State Epidemiologist, Washington State Dept o f Social and Health Svcs; P Russell, A Cordero, MD, Outagamie County Coroner's Office, Appleton, JP Davis, MD, State Epidemiologist, Wisconsin State Dept o f Health and Social Svcs; Virology Div, Pathology Div, Center for Infectious Diseases, Consolidated Surveillance and Communications A ctiv ity, Field Services Div, Epidemiology Program Office, CDC.
Editorial N o te : A study of sudden, nontraumatic deaths that occurred in 1 year in a U.S. population was done in Baltimore (/). All such deaths that occurred among 20- to 39- year-old men could be explained on the basis of underlying diseases. The causes included cardiovascular diseases (40%), cirrhosis and fatty liver (23%), cerebrovascular diseases (10%), pneumonia (6%), and diseases classified as "other" (21%). Sudden death (i.e., within 24 hours of onset of symptoms) occurred at a rate of 65/100,000 and accounted for 40% of all natural deaths in that age group. In 45% of witnessed episodes, death occurred in less than 2 hours; the proportion of deaths that occurred within minutes was not reported.
Although the review of medical-examiner records in Portland was not restricted by age or sex, the findings suggest that deaths including sudden deaths that remain unexplained after thorough postmortem examination are relatively uncommon.
The epidemiology of adult deaths that are both sudden and unexplained has received little attention. The deaths reported here share several features that suggest they may constitute a distinct syndrome. They occurred at night or in the early morning hours during sleep and involved mostly young, apparently healthy men who had no premonitory symptoms. Descriptions of the terminal events suggested that the transition from apparent health to death occurred within minutes. Almost all deaths remained unexplained after thorough postmortem examination, and several of the others may have been attributed to incidental findings. The estimated rate of sudden, unexpected, nocturnal death (87/100,000) during the past year among Laotian men ages 25-44 is comparable to the sum of the rates of the 4 leading causes of natural death (86.9/1 00,000) among U.S. males in that age group. These 4 causes account for 32.2% of all natural deaths in that group (2).
Similar deaths occurring during sleep have been described among young men in Japan (Pokkuri disease) and among Filipino men in the Philippines and Hawaii (Bangungut) (3-5). The consistent autopsy findings were of acute cardiac failure without underlying disease. W itnesses interpreting the terminal groans in these deaths as signs of terror supported the popular notion that deaths resulted from terrifying dreams. Several refugee deaths in this country

N o c tu rn a l Deaths — C on tinuedwere initially described in this manner, and thus were attributed to nightmares. However, careful questioning of the witnesses in the United States indicated that the terminal sounds were those that are often heard following cardiac arrest.
The abruptness of the deaths reported here is compatible with a cardiac dysrhythmia, but the underlying mechanism remains unclear. To date, there is no evidence to suggest a metabolic cause. Several reports of similar deaths occurring at night among young, healthy men in Laos suggest that there might be a genetic or an acquired disorder predisposing these persons to sudden death. To determine whether there is an anatomic basis for these events, a cardiac pathologist is reviewing heart tissue from several cases to reevaluate the findings of the medical examiners, coroners, and the CDC pathologists. Cardiac conduction tissues are being evaluated in 2 instances, and efforts are being made to see that such tissues are obtained in the future. Since these sudden deaths are apparently associated with sleep, studies of selected individuals may be indicated to elucidate physiologic processes during sleep and the possible role of a neurologically mediated triggering mechanism (6).
Data from a study of 26 Laotians who died suddenly and of 77 Laotian controls are being analyzed to determine whether the deaths may be associated with geographic regions of their country, current or past occupations, military experience, chronic stresses, refugee-camp experiences, or dietary changes. Surveillance of refugee deaths is being intensified to deter-
(Continued on page 589)
584 MMWR December 4, 1981
TABLE I. Summary — cases of specified notifiable diseases. United States
DISEASE47thIWEEK ENDING CUMULATIVE, FIRST 47 WEEKS
November 28l 1981
November 22 1980
MEDIAN1976-1980
November 28 1981
i November 22 1980
MEDIAN1976-1980
Aseptic meningitis 154 215 127 8*442 7*135 5 ,9 3 7Brucellosis ♦ 5 5 146 167 167Chicken pox 1.922 2 ,6 3 3 2*326 180*113 168 .747 168 ,747Encephalitis: Primary (arthropod-borne & unspec.) 29 25 24 1*301 1*099 1 ,095
Post-infectious 2 7 6 77 201 201Gonorrhea: Civilian 15*270 22*296 17*003 906*047 912*785 911 .6 65
Military 335 383 383 24*676 2 4 .49 0 2 4 .4 9 0Hepatitis: Type A 427 509 536 22*555 25 ,594 2 6 .77 2
Type B 350 413 276 18*544 16 .43 2 13 .475Type unspecified 149 219 185 9*873 10,529 7*974
Leprosy 2 2 1 218 195 137Malaria 9 32 12 1*221 1 .822 683Measles (rubeola) 30 43 155 2*927 13 .206 25*592Meningococcal infections: Total 67 56 38 3*142 2 .4 3 6 2*183
Civilian 67 56 37 3*130 2 .4 1 8 2*156Military - - - 12‘ 18 19
Mumps 101 80 216 4*007. 7 .9 0 3 15*027Pertussis 19 23 21 1*093 1 .538 1*538Rubella(German measles) 16 37 74 1*929 3 .5 4 8 11*492Syphilis (Primary & Secondary): Civilian 565 528 369 27*933 24 .651 21*669
Military 8 11 9 344 284 284Tuberculosis 491 504 421 24*661 24 .496 26*115Tularemia 2 6 3 241 205 149Typhoid fever 1 2 6 529 466 466Typhus fever, tick-borne (RMSF) 2 3 5 1*155 1 .138 1*023Rabies, animal 67 108 40 6*555 5 .845 2*880
TABLE II. Notifiable diseases of low frequency. United States
CUM. 1981 CUM. 1981Anthrax - Poliomyelitis: Total 7Botulism (Idaho 1, Calif. 1) 76 Paralytic 6Cholera (La. 1, Tex. 1) 19 Psittacosis 95Congenital rubella syndrome 11 Rabies, human 1Diphtheria 4 Tetanus (Okla. 1) 56Leptospirosis (Hawaii 1) 46 Trichinosis 120Plague 9 Typhus fever, flea-borne (endemic, murine) 43

Vol. 30/No.47 MMWR 585
TABLE III. Cases of specified notifiable diseases. United States, weeks ending November 28, 1981 and November 22, 1980 (47th week)
REPORTING AREA
ASEPTICMENINGITIS
BRUCELLOSIS
CHICKEN-POX
ENCEPHALITIS GONORRHEA(Civilian)
HEPATITIS (Viral), by typeLEPROSY
Primary Post-infectious A B Unspecified
1981 CUM.1981 1981 CUM.
1981CUM.1981
CUM.1981
CUM.1980 1981 1981 1981 CUM.
1981
UNITED STATES 154 146 1,922 1,301 77 906,047 912, 785 427 350 149 218
NEW ENGLAND 6 4 213 43 8 22,332 23,150 18 30 15 5Maine — 43 1 — 1, 187 1, 324 1 1 1 —N.H. 1 - 16 4 - 818 804 1 3 - 1Vl _ 1 - - 406 517 4 1 — -Mass. 3 3 73 17 1 9 , 266 9, 770 4 8 12 3R.I. 1 17 1 2 1,344 1,476 3 3 - -Conn. 2 63 20 5 9,311 9, 259 5 14 2 1
MID. ATLANTIC 32 7 67 105 8 108,899 103,300 51 51 27 14Upstate N.Y. 12 3 52 30 3 19,096 18,470 8 15 9 3N.Y. City 11 1 15 19 - 44,378 41,187 18 21 8 9N.J. 3 1 N 16 — 20,532 18,782 25 15 10 2Pa. 6 2 - 40 5 24,893 24,861 U U U “
E.N. CENTRAL 39 7 1,022 467 11 135,505 142,011 82 57 16 21Ohio 20 1 40 230 2 42,470 37,289 16 24 1 1Ind. 2 1 72 141 8 11,232 15,173 22 4 9 -III. 4 - 87 9 — 39,981 44, 647 15 6 3 18Mich. 10 2 549 63 1 29,655 31, 868 26 21 3 2Wis. 3 3 274 24 “ 12,167 13, 034 3 2 ~ “
W.N. CENTRAL 2 21 303 98 6 43,763 43,269 11 12 5 3Minn. _ 5 — 39 3 6,911 7, 250 2 1 4 1Iowa - 7 161 30 2 4,791 4, 591 2 - 1 -Mo. 2 4 2 10 — . 20,410 18,876 2 9 - —N. Dak. — 3 1 — 546 612 1 - - —S. Dak. _ 1 9 1 — 1,163 1, 256 3 - - -Nebr. _ 1 6 4 — 3,248 3,370 - 2 — -Kans. - 3 122 13 1 6,694 7, 314 1 " 2
S. ATLANTIC 13 32 174 140 20 223,027 228,999 48 63 20 12Del. — 1 1 - — 3,529 3, 263 1 2 1 —Md. 1 - - 24 2 26,150 24, 489 1 11 4 2D.C. - - - - 12,684 15,802 - 1 - -Va. 1 9 9 37 4 20,474 20,921 3 12 5 3W. Va. 1 79 21 - 3,304 3, 140 - 1 - -N.C. — 1 N 34 1 34,611 34,998 2 3 - -S.C. — — 30 4 — 21,524 21,415 2 1 — 7Ga. _ 6 I 2 — 46,240 44,859 3 11 - -Fla. 11 14 54 18 13 54,511 60,112 36 21 10 -
E.S. CENTRAL 27 12 35 141 7 75,751 7*,657 8 26 3 _Ky. — 1 32 21 2 9,490 10,804 2 1 - -Tenn. 8 5 N 81 1 28,863 26,907 3 4 2 -Ala. 19 4 2 22 2 22,815 22,544 1 20 1Miss. " 2 1 17 2 14,583 14,402 2 1 “ 1 _
W.S. CENTRAL 8 43 11 115 4 119,275 115, 158 60 19 20 22Ark. _ 5 — 6 — 9,088 9, 346 2 — — 1La. _ 2 N 7 1 20,645 20,571 26 5 6 -Okla. 3 7 - 24 1 13,173 11,508 10 8 5 -Tex. 5 29 11 78 2 76,369 73, 733 22 6 9 21
MOUNTAIN 3 5 15 46 3 35,705 34,916 24 8 5 5Mont. — — - 2 - 1,300 1, 338 - — - —Idaho _ — — - - 1,568 1, 533 3 — - 1Wyo. _ _ - 1 - 944 1, 008 - - - -Colo. 3 1 - 14 1 9,466 9,498 9 2 3 —N. Mex. — — — - 3,880 4, 219 6 4 — —Ariz. U 1 U 19 - 10,762 9, 255 U U U 3Utah - - 9 2 1,780 1, 766 5 — 2 —Nev. - 3 15 1 " . 6 ,005 6, 299 1 2 1
PACIFIC 24 15 82 146 10 141, 790 147,325 125 84 38 136Wash. 1 64 12 1 11,620 12,736 14 8 — 5Oreg. • — — 6 I 8, 399 10,193 15 8 6 5Calif. 14 15 5 119 8 115,382 117,827 91 63 32 87Alaska _ _ 1 5 — 3,648 3, 626 - 5 - —Hawaii 9 12 4 2,741 2,943 5 ~ " 39
Guam U _ U _ _ 81 124 U U U _
P.R. — 5 1 — 3,002 2, 469 1 - 1 2V.l. — — - - — 242 108 - - - -Pac. Trust Terr. u " U 329 384 U u u 16N : N o t n o tifiab le U : U navailable

586 MMWR December 4, 1981
TABLE III (Cont.'d). Cases of specified notifiable diseases. United States, weeks ending November 28,1981 and November 22, 1980 (47th week)
REPORTING AREAMALARIA MEASLES(RUBEOLA)
MENINGOCOCCALINFECTIONS
(Total)MUMPS PERTUSSIS RUBELLA
1981 CUM.1911 1981 CUM.
1981CUM.1980 1981 CUM.
1981 1981 CUM.1981 1981 1981 CUM.
1981CUM.1980
UNITED STATES 9 • 221 30 2,927 13,206 67 3,142 101 4 ,00 7 19 16 1,929 3,548
NEW ENGLAND - 64 - 87 675 4 203 8 226 1 2 127 212Maine — 1 — 5 33 — 24 — 40 - - 33 69N.H. — 3 - 8 331 - 21 — 23 - - 51 40Vt. — 6 — 3 226 - 13 1 9 - - - 3Mass. — 30 — . 61 58 2 65 7 61 1 1 30 70R.I. — 3 - - 2 1 18 - 28 - - - 9Conn. - 21 ~ 10 25 1 62 “ 45 1 13 21
MID. ATLANTIC 4 162 9 946 3,844 14 472 14 652 5 4 227 571Upstate N.Y. 1 35 1 227 714 7 153 6 142 3 4 111 218N.Y. City 2 61 1 102 1,198 1 76 2 89 - - 55 101N.J. 1 49 — 58 851 2 100 2 103 - - 48 101Pa. ~ 17 7 559 1,081 4 143 4 318 2 - 13 151
E.N. CENTRAL 1 61 6 92 2,447 17 387 43 1,181 6 _ 401 848Ohro — 8 4 20 380 13 153 30 288 — - 3 8Ind. — 9 — 9 93 - 46 2 125 4 - 137 359III. — 17 - 25 348 3 95 - 205 - - 102 173Mich. 1 27 — 33 250 1 86 8 352 2 - 37 129Wis. ~ “ 2 5 1,376 - 7 3 211 - 122 179
W.N. CENTRAL - 33 _ 10 1,339 3 147 5 228 1 _ 79 209Minn. — 14 — 3 1,103 - 47 - 8 1 - 8 28Iowa — 4 - 1 20 - 26 1 70 - - 4 9Mo. - 3 — 1 66 2 45 — 22 - - 2 45N. Dak. — 1 — — — — 2 — — - - - 6S. Dak. — 1 — — — 1 9 — 1 _ - _ 2Nebr. — 2 — 4 83 — — — 3 — - 1 4Kans. ~ 8 — 1 67 - 18 4 124 “ - 64 115
& ATLANTIC 2 149 474 1,974 9 716 7 555 1 _ 142 346Del. — 1 — — 3 — 4 — 10 - - I 1Md. — 35 — 5 B3 1 53 1 97 - - 1 68D.C. - 9 — 1 5 — 6 — 3 - - - 1Va. 2 33 - 9 339 6 96 2 127 - - 7 41W. Va. — 4 — 9 10 — 27 — 105 - - 22 26N.C. — 13 — 3 130 1 109 — 22 - - 5 47S.C. - 2 — 2 159 1 89 — 18 - — 8 58Ga. — 8 — 111 826 — 109 - 38 - - 37 -Fla. - 44 14 334 419 - 223 4 135 1 - 61 104
E.S. CENTRAL - 12 - 5 333 3 218 . 95 _ 1 38 88Ky. — — — 1 57 - 61 - 46 - 1 24 43Tenn. — - — 2 170 2 65 - 24 - — 13 40Ala. - 10 — ' 2 22 1 67 — 19 • - - 1 3Miss. " - 2 - - 84 - 25 - 6 - - - 2
W.S. CENTRAL _ 97 - 894 972 8 483 4 228 1 _ 181 142Ark. — ' 4 — ‘ 24 16 2 30 1 8 - - 7 4La. - 10 — ' 4 12 - 110 - 5 - — 9 13Okla. - 9 — 7 775 3 47 - - - - 2 6Tex. * 74 “ 859 169 3 296 3 215 1 - 163 119
MOUNTAIN _ 42 - 37 487 2 126 3 142 _ _ 94 165Mont. — 1 - — 2 - 9 - 14 - - 4 45Idaho — 4 — 1 — — 6 1 7 - — 4 27Wyo. — — — 1 - - 4 - 3 - - 12 1Colo. - 20 - 10 24 - 45 - 47 - - 27 12N. Mex. — 3 — 8 12 - 7 — ' - - - 5 5Ariz. U 7 U 7 392 U 21 U 35 U U 21 41Utah - 4 — - 47 1 6 - 20 - - 9 28Nev. “ ' 3 10 10 1 28 2 16 - - 12 6
PACIFIC 2 601 1 382 1,135 7 390 17 700 4 9 640 967Wash. — 25 - 3 177 3 70 1 161 3 - 93 86Oreg. 2 19 — 5 1 - 57 - ; 69 - - 51 65Calif. — 545 1 367 945 4 246 14 427 1 9 484 800Alaska — 3 — - 6 - 13 1 18 - - 1 12Hawaii “ 9 “ 7 6 4 1 25 - - 11 4
Guam U 2 u 5 6 U _ U 8 U U 1 2P.R. - 11 4 294 167 - 13 1 150 - - 5 25V.l. — 4 — 25 6 — 1 — 18 - - 1 —Pac. Trust Terr. u “ U 1 12 u - U 15 u u 1 1U : Unavailable
Vol. 30/No.47 MMWR 587
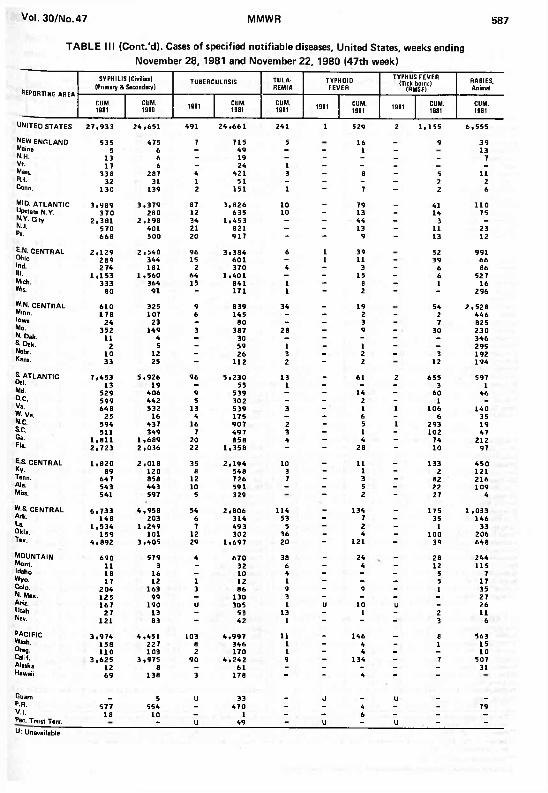
TABLE III (Cont.'d). Cases o f specified notifiable diseases, United States, weeks endingNovember 28, 1981 and November 22, 1980 (47th week)
REPORTING a rea
SYPHILIS (Civilian) (Primary & Secondary) TUBERCULOSIS TULA
REMIATYPHOIDFEVER
TYPHUS FEVER (Tick-borne)
(RMSF)RABIES,Animal
CUM.1981
CUM.1980 1981 CUM.
1981CUM.1981 1981 CUM.
1981 1981 CUM.1981
CUM.1981
UNITED STATES 27,933 24,651 491 24,661 241 1 529 2 1,155 6,555
NEW ENGLAND 535 475 7 715 5 16 _ 9 39Maine 5 6 - 49 - - 1 - 13N.H. 13 6 - 19 — - - _ - 7Vt 17 6 - 24 1 - - - _ • •Mass. 338 287 4 421 3 - 8 - 5 11R.L 32 31 1 51 - - - - 2 2Conn. 130 139 2 151 1 - 7 - 2 6
MID. ATLANTIC 3,989 3,379 87 3,826 10 _ 79 _ 41 110Upstate N.Y. 370 280 12 635 10 - 13 - 14 75N.V. City 2,381 2,198 34 1.453 — — 44 - 3 —N.J. 570 401 21 821 — — 13 - 11 23Pa. 668 500 20 917 - “ 9 “ 13 12
? N. CENTRAL 2,129 2.540 96 3.384 6 1 39 52 991Ohio 289 344 15 601 - 1 11 - 39 66Ind. 2 74 181 2 370 4 - 3 - 6 86III. 1.153 1 ,560 64 1,401 — - 15 - 6 52 7Mich. 333 364 15 841 1 — 8 - 1 16Wis. 80 91 - 171 1 - 2 - - 296
W-N. CENTRAL 610 325 9 839 34 - 19 54 2,528Minn, 178 107 6 145 - — 2 - 2 446Iowa 24 23 - 80 - - 3 - 7 825Mo. 352 149 3 387 28 - 9 - 30 230N. Dak. 11 4 — 30 — — — — — 346S. Dak. 2 5 - 59 1 - 1 - - 295Nebr. 10 12 - 26 3 — 2 - ' 3 192Kans. 33 25 - 112 2 - 2 12 194
£ ATLANTIC 7,453 5,926 96 5,230 13 _ 61 2 655 597Del. 13 19 — 55 1 — - - 3 1Md. 529 406 9 539 — - 14 - 60 46D.C. 599 442 5 302 - - 2 - 1 -Va. 648 532 13 539 3 — ' 1 1 106 140W. Va. 25 16 4 175 — — 6 - 6 35N.C. 594 437 16 907 2 - 5 1 293 19S.C. 511 349 7 497 3 — 1 - 102 47Ga. 1,811 1,689 20 858 4 - 4 - 74 212Fla. 2.723 2,036 22 1,358 “ - 28 - 10 97
E S. CENTRAL 1.820 2,018 35 2,194 10 _ 11 _ 133 450Ky. 89 120 8 548 3 - 1 - 2 121Tenn. 647 858 12 726 7 - 3 - 82 216Ala. 543 443 10 591 - - 5 - 22 109Miss. 541 597 5 329 - 2 - 27 4
W.S. CENTRAL 6.733 4,958 54 2,806 114 _ 134 _ 175 1 ,033Ark. 148 203 6 314 53 — 7 - 35 146La. 1,534 1 ,249 7 493 5 — 2 - 1 33Okla. 159 101 12 302 36 - 4 - 100 206Tex. 4,892 3,405 29 1,697 20 “ 121 - 39 648
m o u n t a in 690 579 4 670 38 - 24 _ 28 244Mont. 11 3 - 32 6 - 4 - 12 115Idaho 18 16 — 10 4 — - - 5 7Wyo. 17 12 1 12 1 - — — 5 17Colo. 204 163 3 86 9 - 9 - 1 35N. Mex. 125 99 — 130 3 — - - - 27Ariz. 167 190 U 305 1 U 10 U - 26Utah 27 13 - 53 13 - 1 - 2 11Nev. 121 83 - 42 1 - - - 3 6
PACIFIC 3 ,974 4,451 103 4,997 11 _ 146 _ 8 563Wash. 158 227 8 346 1 - 4 - 1 15Oreg. 110 103 2 170 1 — 4 - — 10Calif. 3 ,625 3,975 90 4,242 9 — 134 - 7 507Alaska 12 8 — 61 - — - — - 31Hawaii 69 138 3 178 “ “ 4 ” -
Guam _ 5 U 33 _ u _ u _ _P.R. 577 554 - 470 - - 4 - - 79V.l. 18 10 — 1 — — 6 — — —Pac. Trust Terr. - u 49 - u - u - -U: Unavailable

588 MMWR December 4, 198'
TABLE IV. Deaths in 121 U.S. cities,* week endingNovember 28, 1981 (47th week)
REPORTING AREA
ALL CAUSES. BY AGE (YEARS)P S I- TOTAL REPORTING AREA
ALL CAUSES, BY AGE (YEARS)P8l*TOTAALL
AGES >65 45 64 2544 1-24 <1 ALLAGES 2»65 45 64 25-44 1-24 <1
NEW ENGLAND 547 394 97 34 7 14 42 S. ATLANTIC 973 589 252 64 32 36 30Boston, Mass. 152 100 31 14 2 5 16 Atlanta, Ga. 133 81 34 7 4 7 3Bridgeport, Conn. § 47 45 - - I - 4 Baltimore, Md. 209 114 58 17 9 11 5Cambridge, Mass. 19 17 1 1 — - 3 Charlotte, N.C. 43 26 13 2 2 - 3Fall River, Mass. 19 16 1 1 — 1 1 Jacksonville, Fla. 56 37 15 4 — — 1Hartford, Conn. 47 34 6 3 1 3 1 Miami, Fla. 63 43 12 3 2 3 4Lowell, Mass. 19 12 4 2 - 1 1 Norfolk, Va. 53 32 10 4 1 6Lynn, Mass. 17 11 6 — — - — Richmond, Va. 80 49 17 7 3 4 6New Bedford, Mass. 25 18 5 1 1 - 5 Savannah, Ga. 33 20 11 - 2 - 3New Haven, Conn. 36 23 8 2 1 2 - St. Petersburg, Fla. 66 55 8 3 _ - 3Providence, R.l. 45 32 11 2 - - 3 Tampa, Fla. 38 26 7 1 4 - -Somerville, Mass. 7 6 1 — - - 1 Washington, D.C. 168 87 62 12 4 3 2Springfield, Mass. 43 29 11 2 1 - 2 Wilmington, Del. 31 19 5 4 1 2 -Waterbury, Conn. 29 18 8 3 — — 3Worcester, Mass. 42 33 4 3 - 2 2
E.S. CENTRAL 569 336 142 37 26 28 22Birmingham, Ala. 132 75 35 6 6 10 2
MID. ATLANTIC 2,118 1,334 533 138 56 57 72 Chattanooga, Tenn. 44 32 9 - 2 1 1Albany, N.Y. 46 32 9 2 1 2 1 Knoxville, Tenn. 34 23 10 - 1 — IAllentown, Pa. 23 17 6 - - - 1 Louisville, Ky. 88 49 25 11 - 3 7Buffalo, N.Y. 100 55 33 3 3 6 5 Memphis, Tenn. 106 51 26 11 6 12 5Camden, N.J. 38 23 9 4 1 1 1 Mobile, Ala. 46 30 7 4 4 1 3Elizabeth, N.J. 23 17 5 I - - - Montgomery, Ala. 33 20 10 1 2 - 1Erie, Pa.t 52 34 10 1 5 2 2 Nashville, Tenn. 86 56 20 4 5 1 2Jersey City, N.J. 35 24 9 2 — — —N.Y. City, N.Y. 1 ,118 690 274 90 35 29 32Newark, N.J. 34 14 13 2 2 3 2 W.S. CENTRAL 1,053 602 288 80 54 29 28Paterson, N.J. 22 16 3 2 - 1 1 Austin, Tex. 53 31 12 5 1 4 2Philadelphia, Pa.t 173 102 52 12 5 2 6 Baton Rouge, La. 26 11 9 4 2 - "Pittsburgh, Pa. t 103 63 34 5 - 1 7 Corpus Christi, Tex. 41 24 9 1 1 6 2Reading, Pa. 30 23 6 1 — — 1 Dallas, Tex. 168 95 45 16 10 2 2Rochester, N.Y. 120 91 22 3 - 4 4 El Paso, Tex. 18 14 1 1 2 — -Schenectady, N.Y. 35 25 8 2 — — 3 Fort Worth, Tex. 75 51 17 2 2 3 6Scranton, Pa.t 24 19 5 - - - 1 Houston, Tex. 373 191 122 35 21 4 9Syracuse, N.Y. 69 41 16 4 3 5 1 Little Rock, Ark. 49 32 14 1 2 -Trenton, N.J. 21 15 5 1 — - - New Orleans, La. 63 39 12 3 7 2Utica, N.Y. 17 11 5 1 — - 1 San Antonio, Tex. 105 59 30 8 3 5 5Yonkers, N.Y. 35 22 9 2 1 1 3 Shreveport, La. 22 13 7 - - 2 "
Tulsa, Okla. 60 42 10 4 3 1 2
E.N. CENTRAL 1,908 1,212 427 135 62 72 47Akron, Ohio 28 18 6 — 1 3 — MOUNTAIN 532 317 120 48 26 21 25Canton, Ohio 27 14 11 — 2 - - AIbuquerque, N. Mex. 4 5 8 14 12 8 3 1Chicago, III. 456 275 101 48 12 20 11 Colo. Springs, Colo. 30 21 2 5 — 2 2Cincinnati, Ohio 120 76 28 8 4 4 6 Denver, Colo. 119 72 34 10 2 1 5Cleveland, Ohio 170 99 41 18 3 9 2 Las Vegas, Nev. 48 34 8 3 3 - 5Columbus, Ohio 137 94 21 4 11 7 3 Ogden, Utah 26 19 — 3 2 2 3Dayton, Ohio 79 45 25 6 1 2 2 Phoenix, Ariz. 122 67 36 6 5 8 2Detroit, Mich. 195 113 53 21 4 4 5 Pueblo, Colo. 28 22 3 2 1 - 1Evansville, Ind. 46 34 8 - 3 1 - Salt Lake City, Utah 51 31 11 2 3 4 1Fort Wayne, Ind. 54 37 11 — 5 1 1 Tucson, Ariz. 63 43 12 5 2 1 5Gary, Ind. 17 6 8 2 — 1 -Grand Rapids, Mich. 29 21 4 2 - 2 1Indianapolis, Ind. 118 78 31 3 3 3 2 PACIFIC 1 ,407 897 312 95 57 46 52Madison, Wis. 41 24 7 3 1 6 4 Berkeley, Calif. 19 14 5 - — — -Milwaukee, Wis. 92 67 15 2 5 3 1 Fresno, Calif. 41 29 5 2 2 3 3Peoria, III. 27 16 5 4 — 2 — Glendale, Calif. 14 11 3 - - — —Rockford, III. 35 26 5 2 1 1 1 Honolulu, Hawaii 40 24 9 3 4 — 4South Bend, Ind. 32 26 3 1 2 - 1 Long Beach, Calif. 84 58 21 3 1 1 -Toledo, Ohio 118 86 17 8 4 3 4 Los Angeles, Calif. 384 242 80 35 15 12 8Youngstown, Ohio 87 57 27 3 — - 3 Oakland, Calif. 77 49 15 6 2 5 2
Pasadena, Calif. 20 13 5 1 1 - 2Portland, Oreg. 120 78 32 5 1 4 I
W.N. CENTRAL 585 404 123 28 10 20 23 Sacramento, Calif. 68 41 23 2 2 — 5Des Moines, Iowa 34 28 2 2 1 1 1 San Diego, Calif. 44 27 10 4 1 2 4Duluth, Minn. 28 Id 8 2 — - — San Francisco, Calif. 138 84 26 16 6 6 5Kansas City, Kans. 13 11 - - 1 1 2 San Jose, Calif. 144 90 33 9 9 3 10Kansas City, Mo. 108 84 17 3 2 2 5 Seattle, Wash. 138 89 27 6 10 6 4Lincoln, Nebr. 26 24 1 1 — — — Spokane, Wash. 42 25 10 1 2 4 1Minneapolis, Minn. 65 40 17 6 1 1 3 Tacoma, Wash. 34 23 8 2 1 — 3Omaha, Nebr. 95 62 22 6 2 3 2St. Louis, Mo. 131 83 34 6 1 7 8 ..S t Paul, Minn. 51 37 9 1 1 3 - TOTAL 9,692 6,085 2 ,294 659 330 323 341Wichita, Kans. 34 17 13 1 1 2 2
•Mortality data in this table are voluntarily reported from 121 cities in the United States, most of which have populations of 100,000 or more. A death is reported by the place of its occurrence and by the week that the death certificate was filed. Fetal deaths are not included.
"Pneumonia and influenzat Because of changes in reporting methods in these 4 Pennsylvania cities, these numbers are partial counts for the current week. Complete counts will be available in 4 to 6 weeks.
ttTotal includes unknown ages.§Data not available. Figures are estimates based on average of past 4 weeks.
Vol. 30/No. 47 MMWR 589
Nocturnal Deaths — Continuedmine whether the apparently lower rates of sudden death for Kampucheans and Vietnamese reflect real differences or are due to reporting artifact such as that created by enhanced surveillance and media attention focused on the Hmong and other Laotians.References1. Kuller L, Lilienfeld A, Fisher R. Sudden and unexpected deaths in young adults. An epidemiological
study. JAM A 1966; 198:248-52.2. National Center fo r Health Statistics. United States Department of Health and Human Services. Public
Health Service. Vital Statistics of the United States. 1 976. Volume II, Part A.3. Sugai M. A pathological study on sudden and unexpected death, especially on the cardiac deaths au-
topsied by the medical examiners in Tokyo. Acta Path Jap 1 959 ;9 :723-52 .4. Nolasco JB. An inquiry into "Bangungut." Arch Intern Med 1957:99 :905-12 .5. Aponte G. The enigma o f "Bangungut." Ann Intern Med 1960;52:1 258-63.6. Lown B, Temte JV, Reich P, et al. Basis for recurring ventricular fibrillation in the absence o f coronary
heart disease and its management. New Eng J Med 1 976 :294 :623-29 .
Epidemiologic Notes and Reports
Cholera on a Gulf Coast Oil Rig — Texas
Toxigenic Vibrio cholerae O-group 1, biotype El Tor, serotype Inaba, has been isolated in Louisiana from the stool of a 23-year-old man who had diarrheal illness. He became ill on September 20, 1981, 5 days after he began a 7-day tour on an oil rig in the Intracoastal Waterway in Jefferson County, south of Port Arthur, Texas. He had severe watery diarrhea, accompanied by nausea, vomiting, abdominal cramps, and faintness on standing before he finally consulted a physician on September 28 and had a stool specimen taken for culture.
Because the oil rig was owned and operated by a Louisiana firm and employed mainly Louisiana residents, a cooperative investigation was undertaken by the Texas and Louisiana state health departments. Also, 3 oil-rig employees who lived either in Mississippi or Alabama with their families were investigated by their state and local health departments. Interviews with permanent rig employees revealed that 10 of the 13 other individuals present on the rig the week of the patient's tour had experienced diarrheal illness, often severe, beginning on September 22 or 23. In addition, 8 of 43 service personnel who visited the rig for various periods of time during the latter half of September stated that they had diarrhea during that time. None of the 1 6 individuals resident on the rig the week preceding or following the one when the index patient became ill developed diarrhea. Although none of the rectal swab cultures obtained in early and mid October from all workers except the initial patient have yielded V. cholerae, 16 additional V. cholerae 01 infections (1 asymptomatic) have been identified by assays for vibriocidal and antitoxic antibodies in serum specimens from these workers. None of the cultures of Moore swabs ( 1 ) placed in the sewage tank, drinking-water reservoir, and canal water surrounding the rig 2 weeks after the outbreak have yielded V. cholerae 01.
The source of infection for the index case is unknown. The investigation has established that for an undetermined period on September 20-21, an inadvertent cross-contamination occurred between the rig's canal-water system used for drilling and the system for unchlorinated fresh water used for drinking. A raw-sewage discharge pipe was close to the intake port for the drill-water system, and it appears likely that drinking water was contaminated with drilling water and sewage containing V. cholerae 01 shed by the index patient. Drinking water as well as beverages and food prepared using this water may have served as vehicles of transmission for the V. cholerae that caused the September 22-23 outbreak. Presence on the rig on September 21 was highly associated with later having diarrhea (p < 0.001).

590 MMWR December 4,1981
Cholera — ContinuedStool cultures and serum specimens from family members of the workers with cholera
have not yielded any evidence of V. cholerae infection.Reported by B Helton. RN, IME Birch, DVM, State Epidemiologist, Alabama Dept o f Public Health; J Holden, MD, Crowley, WE Percy, MD, Calcasieu Parish, HB Bradford, PhD, R Conley, MD, MPH, LM McFarland, DPH, JR Romero, MD, CT Caraway, DVM, MPH, State Epidemiologist, Louisiana Dept of Health and Human Resources; C Davis, A Ochoa, MD, DL Blakey, MD, State Epidemiologist, M ississippi State Board o f Health; V Bateman, RS, PN Fortney, MD, Jefferson County, L Haggard, MT, A Areata, MD, Port Arthur, R Cross man, PE, D Martin, RN, MN. D Masserang, PhD, J Perdue, CR Webb, Jr, MD, State Epidemiologist, Texas Dept o f Health; EC Lippy, MS, Health Effects Research Laboratory, Environmental Protection Agency, Cincinnati; Field Services Div, Epidemiology Program Office, Enteric Bacteriology and Epidemiology Br, Bacterial Diseases Div, Center fo r Infectious Diseases, CDC.Editorial Note: The 17 V. cholerae 01 infections reported on here represent the largest outbreak of cholera in the United States in the 20th century. No cases known to have been acquired in this country (other than a few laboratory-acquired cases) were identified between 1911 and 1973, when a single case was found in Port Lavaca, Texas (2). Eleven infections caused by eating inadequately cooked crabs were found in Louisiana in 1978 (3). Two more cases were identified in May and June of 1 981 in Texas near the area where the current outbreak occurred (4). The strains from all of these cases have been essentially identical. Thus, toxigenic V. cholerae 01 may have persisted for 8 years along the Gulf Coast.
All but 5 of the 31 infections with toxigenic V. cholerae 01 that have occurred since 1 973 were discovered through public health investigations and surveillance systems, and would probably have escaped identification without such specific efforts. Although epidemics of cholera are not likely to occur in the United States because of high standards of sanitation and hygiene, occasional sporadic cases, without further transmission, can be expected. In addition, outbreaks such as this one may result when breaks in food or water sanitation occur.
Health officials and physicians should be alert to the possible occurrence of cholera in the United States, and particularly in Gulf Coast states. Stools from persons who may have cholera should be cultured on thiosulfate citrate bile salts sucrose (TCBS) agar. Sewage surveillance using Moore swabs can be helpful in determining whether otherwise undetected infections are occurring ( 1 ).References1. Barrett TJ, Blake PA, Morris GK, Puhr ND, Bradford HB, Wells JG. Use of Moore swabs for isolating
Vibrio cholerae from sewage. J Clin Microbiol 1 980; 11 :385-8.2. Weissman JB, DeW itt WE, Thompson J. et al. A case of cholera in Texas, 1973. Am J Epidemiol
1974;100 :487-98 .3. Blake PA, Allegra DT, Snyder JD, et al. Cholera —a possible endemic focus in the United States. N
Engl J Med 1980;302 :305-9 .4. CDC. Cholera-Texas. MMWR 1981;30 :389-90 .
Occupational Dermatitis Associated with Grain Itch M ites — Texas
On June 5, 1981, a 32-year-old resident of Austin, Texas, sought medical attention for a pruritic rash consisting of thin-walled central vesicles and erythematous areolas on her torso and extremities. The lesions, originally diagnosed as chickenpox, increased in number and spread to her face by June 1 6. At that time, the patient also complained of chills, anorexia, diarrhea, and malaise; her temperature was 100 F (37.8 C). Skin scrapings were negative for Sarcoptes scabiei and giant virus cells. A skin biopsy of a fresh lesion obtained on June 1 8 was interpreted as showing acute and chronic dermatitis with intradermal vesicles.
A tentative diagnosis of rickettsialpox was made, and coincident with some improvement

Vol. 30/No. 47 MMWR 591
Grain Itch Mites — Continuedin her clinical condition, the patient was given tetracycline, 250 mg 4 times/day, orally for 7 days. Serum specimens obtained from the patient 3, 4, and 8 weeks after onset of symptoms showed a static indirect fluorescent antibody IgG titer of 64 to Rocky Mountain spotted fever (RMSF) antigen. The 3- and 4-week specimens were nonreactive to rickettsialpox (Rickettsia akari) when tested at the National Institutes of Health Rocky Mountain Laboratories in Hamilton, Montana.
The patient managed a store specializing in goods imported from several parts of the world. Her 2 children and 2 of her store employees had skin lesions similar to hers but had no symptoms (the children's rash had resolved to hypopigmented macules by June 26). The patient's husband, who never entered the store, had no skin lesions. The local health officer and the Texas Department of Health were notified.
The store, located in a shopping-mall complex in Austin, carried a variety of dried flowers and grains sold for decorative purposes; straw baskets, mats, and brooms; and unfinished wood products. Onset of skin lesions had coincided with arrival of a shipment of new decorative merchandise, including so-called Black Beard Wheat ( Triticum, species unknown), a dried stalk of the grain. Microscopy of this product and other selected products revealed many grain itch mites, Pyemotes ( Pediculoides) ventricosus, and a few larval ticks in the Black Beard Wheat only. Mites obtained from the wheat were negative in tests for RMSF-group organisms, including tests in which meadow voles (Microtus pennsylvanicus) were inoculated with material from the mites.
During the site visit, an investigator held a cellophane-wrapped packet of Black Beard Wheat in his hand for about 5 minutes. Within 1-1/2 hours, pruritic welts appeared on his forearm, and over the next 1 5 hours additional welts appeared on his abdominal area, his deltoid region, and the back of his neck. The central vesicles ruptured in 1-2 days, evolved into granulomatous lesions, and healed in 7-10 days. Residual areas of hypopigmentation were still present after 6 weeks.
The Black Beard Wheat had been imported from Spain in a single shipment 3 years earlier and had been fumigated and stored in a warehouse in Los Angeles. Before being informed of this mite infestation, the import chain that distributed and marketed Black Beard Wheat had already contacted the California Department of Agriculture because of complaints about some of its products. Of 92 stores in the import chain, 82 eventually reported bites or skin lesions among their employees. The California State Health Department, the Texas Department of Agriculture, and the United States Department of Agriculture were also notified. The import chain advised all 92 stores to remove Black Beard Wheat and other potentially contaminated products from their stocks. Several stores were fumigated, and the infestation appears to have been eliminated.Reported by DA Baggett, MD, BL Davis, RS, LB Elliott, DrPH, PV Fournier, RPE, SJLerro, MD, JA Rawlings,
The Morbidity and Mortality Weekly Report, circulation 98,000, is published by the Centers for Disease Control, Atlanta, Georgia. The data in this report are provisional, based on weekly telegraphs to CDC by state health departments. The reporting week concludes at close of business on Friday; compiled data on a national basis are officially released to the public on the succeeding Friday.
The editor welcomes accounts of interesting cases, outbreaks, environmental hazards, or other Public health problems of current interest to health officials. Send reports to: Attn: Editor, Morbidity and Mortality Weekly Report, Centers for Disease Control, Atlanta, Georgia 30333.
Send mailing list additions, deletions and address changes to: Attn: Distribution Services, Management Analysis and Services Office, 1-SB-419, Centers for Disease Control, Atlanta, Georgia 30333. When requesting changes be sure to give your former address, including zip code and mailing list code number, or send an old address label.

592 MMWR December 4, 1981
Grain Itch Mites — ContinuedMS, CR Webb Jr. MD, State Epidemiologist, Texas Dept o f Health, Austin ; Field Services Div, Epidemiology Program Office, CDC.
Editorial Note: P. ventricosus dermatitis is characterized by violent itching and a rash resembling chickenpox distributed primarily on the torso; some patients also have fever, malaise, and loss of appetite. The causative agent was first isolated from straw mattresses in 1909 during an investigation by a Public Health Service Officer (1,2) . The mites are small (0.16-0.22 mm) and are barely visible to the unaided eye as white specks. They are primarily parasites of certain insects—particularly those found in stored grain —but the mites will readily attack humans and other mammals when their preferred hosts are unavailable. Human infestation results from contact with contaminated materials such as straw, grain, hay, grass, or wood.
P. ventricosus is endemic in the United States. An outbreak of dermatitis in a Texas grocery chain in 1 962 was linked to P. ventricosus that had infested some puffed wheat (3). Another outbreak of dermatitis in Texas in 1979 affected school children and was associated with homemade fish food prepared from oatmeal that was infested with P. ventricosus (4).
It is not known how frequently dermatitis caused by P. ventricosus occurs in the United States. When identified, the mites can be eliminated from infested products with pyrethrin- based insect foggers available at most supermarkets or with other fumigation measures. Another solution to the problem is to destroy the infested products.
Physicians whose patients have a varicelliform or chigger bite-like dermatitis but do not have a specific history of outdoor exposure should consider the possibility of P. ventricosus infestation of products brought into homes or places of employment. Because P. ventricosus mites do not burrow into the skin, but remain on the surface, ectoparasiticides, such as lindane, should be effective in eliminating them.References1. Goldberger J, Schamberg JF. An epidemic o f an urticaroid dermatitis due to a small m ite (Pedicu-
loides ventricosus) in the straw of mattresses. Public Health Rep. 1 909 :24 :973-5 .2. Schultz MG. Joseph Goldberger and pellagra. Am J Trop Med Hyg 1977;26:1 088-92.3. Micks DW. An outbreak o f dermatitis due to the grain itch mite, Pyemotes ventricosus, Newport. Tex
Rep Biol Med 1962:20 :221-6 .4. Fohn N. Feeding goldfish 'hazardous' in Uvalde third-grade class. Texas Health Bulletin
1979;32 :16-7 .
U.S. DEPARTMENT OF HEALTH AND HUMAN SERVICESPUBLIC HEALTH SERVICE / C ENTERS FOR DISEASE C O N T R O L A T L A N T A , G E O R G IA 30333 OFFIC IAL BUSINESS
Postage and Fees Paid U.S. Department of HHS
Director, Centers for Disease Control HHS 396William H. Foege, M .D.
Director, Epidemiology Program Office Philip S. Brachman, M .D .
EditorMichael B. Gregg, M .D.
Mathematical Statistician Keewhan Choi, Ph.D.
HHS Publication No. (CDC) 81-8017 Redistribution using indicia is illegal.