moose management areas in labrador
TRANSCRIPT

"S
!
!
!
!
!
!
!
!
!
!
!
!
!
!
!
!
!
!
!
!
!
!
!
!
!
!
!
!
!
QUE BEC
LAB RAD OR
Nain
Cat Arm
Forteau
Red Bay
Rigolet
Mud Lake
Makkovik
Hopedale
Postville
Sept-Îles
Sheshatshiu
St. Anthony
Twillingate
Schefferville
Portland Creek
Churchill FallsNorth West River
Labrador City / Wabush
Happy Valley-Goose Bay
58
57
50
60
52
49
51
55
59
5685
53
54
48 53A
0 75 150
Kilometres
Moose Management Areas in Labrador
FIGURE ID: HVDC_ST_550
"S Converter Station
Transmission CorridorSubmarine Cable Crossing Corridor
Moose Management Area
FIGURE 10.3.5-2
Strait of
Belle Isle
G u l f o f
S t . L a w r e n c e
A t l a n t i c O c e a n
Source: Newfoundland and Labrador Department of Environment and Conservation (2011)

"S
!
!
!
!
!
!
!
!
!
!
!
!
!
!
!
St. John's
Corner Brook
4
3
23
37
2
18 25
27
14
28
6
36
155
19
26
10
118
12
17
7
20
13
30
29
45
40
1
22
21
34
39
16
41
38
42
32
935
24
3144
33
29
4347
41
Red Bay
Forteau
Marystown
Deer Lake
St. Anthony
Clarenville
Mary's Harbour
Port Hope Simpson
Channel-Port aux Basques
GanderGrand Falls-Windsor
0 50 100
Kilometres
FIGURE 10.3.5-3
Moose and Black Bear Management Areas in Newfoundland
FIGURE ID: HVDC_ST_551
±
G u l f o f
S t . L a w r e n c e
L A B R A D O R
Q U E B E C"S Converter Station
Transmission CorridorSubmarine Cable Crossing CorridorLarge Game Management Areas
National Park
Soldiers Pond
A t l a n t i c O c e a n
Source: Newfoundland and Labrador Department of Environment and Conservation (2011)

Labrador‐Island Transmission Link Environmental Impact Statement Chapter 10 Existing Biophysical Environment
April 2012 Page 10‐126
Moose densities on the Island of Newfoundland are considerably higher than in Labrador, with densities ranging from a low of 0.11 moose/km2 in MMA 19 (1997 survey) to 6.82 moose/km2 in MMA 43 (1999) (Stantec 2010d). However, between 1966 and 1973, moose populations were considerably reduced on the Island primarily as a result of hunting, with harvest rates in some areas between 24 percent and 55 percent annually (Fryxell et al. 1988). Subsequent reductions in license quotas in the mid‐1970s have resulted in 5 population rebounds throughout the province.
The most recent moose census data available for MMAs on the Island are presented in Stantec (2010d). The MMAs overlapping the transmission corridor on the Island are presented in Table 10.3.5‐1. Similar data are not available for Labrador.
Table 10.3.5‐1 Most Recent Density and Population Estimates of Moose in Newfoundland for MMAs 10 Overlapping the Transmission Corridor
MMA Year Surveyed Population Estimate(a)
Density Estimate (moose/km2)
Adjusted Density ‐ Forest and Scrub Habitat (moose/km2)
2 2008 6,045 2.63 4.00
3 2009 4,626 1.26 1.87
4 2004 2,543 0.69 0.99
13 1997 1,800 0.70 1.16
16 2008 761 0.46 0.65
21 2004 2,584 1.24 1.81
24 1997 1,202 1.42 1.82
27 2009 1,844 0.51 0.88
28 1997 3,090 0.87 1.70
29 1989 3,452 1.52 1.82
31 1996 2,250 2.94 5.33
33 2005 683 1.13 1.87
34 1997 2,770 1.59 3.00
35 2005 759 0.70 1.31
36 1995 3,358 0.96 3.09
39/39A 2006 2,649 1.54 3.17
40 2004 3,500 1.74 3.24
41 2009 1,412 0.88 1.73
42 2009 752 0.51 0.64
44 1997 1,656 2.79 5.41
45 2005 6,435 2.71 5.42
Note: Data provided by the NLDEC Wildlife Division. (a) Population size is estimated using a standard correction factor (2.0) applied to the raw data (Dyke 2011, pers. comm.;
Barney, n.d.).

Labrador‐Island Transmission Link Environmental Impact Statement Chapter 10 Existing Biophysical Environment
April 2012 Page 10‐127
Further, moose densities on the Island of Newfoundland are so high that their abundance has become a hazard to highway driving. According to a recent news publication, the number of moose‐vehicle collisions has prompted the GNL to attempt to curb collisions. Specifically:
The Provincial Government will invest approximately $5 million for a series of initiatives which is hoped will reduce the number of moose‐vehicle collisions in Newfoundland and Labrador. This 5 will include the launch of pilot projects involving wildlife fencing and wildlife detection systems, as well as the immediate enhancement of ongoing brush clearing and public awareness efforts.
These pilot projects announced today will build on previous actions by the Provincial Government to help address moose vehicle collisions. Earlier this year for example, the number of moose licenses was increased by 5,020 along with a one‐week extension to the hunting season on the 10 island portion of the province. This extension is in addition to the three‐week extension announced in 2010.
GNL 2011
Habitat Occurrence in the Study Area
Table 10.3.5‐2 summarizes primary, secondary and tertiary habitat quality present in the Study Area, as 15 identified in the ELC, for moose. Hardwood Forests and Wetlands are among the habitat types with primary importance in the spring / fall Hardwood Forests deliver primary habitat quality because of the food, protection and shelter it provides, and Wetlands provide primary habitat due to the presence of aquatic vegetation that is important at this time. These habitats are of secondary and tertiary importance, respectively, in the fall / winter. Hardwood Forests do not offer much cover, and Wetlands would be frozen, 20 thus preventing access to vegetation.
In the fall / winter, three habitat types provide primary habitat. Conifer Forests are of primary importance in the fall / winter because they provide forage and cover (they have secondary importance in the spring/summer). Cutover is of primary importance in the fall / winter (secondary in the spring / summer) – birch can often be found here, which can be an important food source. The third habitat type with primary 25 importance in the fall / winter is Mixedwood Forest – it provides shelter, and the deciduous portion of it is an important food source. Mixedwood forests have secondary importance in the spring / summer. Kalmia Lichen / Heathland and Scrub / Heathland / Wetland are both of secondary importance to moose year round. They provide some foraging opportunities, and Kalmia Lichen / Heathland can be used in the winter, depending on snow depth. Conifer Scrub offers habitat of secondary importance in the spring / summer, and tertiary 30 importance in the fall / winter, due to some forage that is available seasonally. Because Lichen Heathlands only provide some forage, it is qualified as secondary habitat in the spring / summer and tertiary in the fall / winter.
Other habitat types of tertiary importance year long include alpine vegetated, Black Spruce Lichen Forest, Burn, Exposed Earth, Open Conifer Forest, and Rocky Barrens. These habitats do not provide the forage or cover required to sustain a population of moose. 35
Results of the ELC‐based habitat model indicate that potential moose habitat is found throughout the 15 km wide Study Area. During the spring / summer, Hardwood Forests and Wetlands (particularly those that support aquatic plants) provide particularly important moose habitat. Such primary habitat accounts for 21% (1,204.7 km2) of the Study Area in Labrador, and 1,087.7 km2 (10%) of the Study Area in Newfoundland. Mixedwood and Conifer Forests are considered primary habitat during fall / winter, as well as Cutover habitat 40 on the Island. Primary fall / winter habitat comprises 1,461.7 km2 (25%) of the Study Area in Labrador and 4,504.1 km2 (40%) in Newfoundland.
Secondary moose habitat includes Conifer Forest, Conifer Scrub, Cutover, Lichen Heathland, Mixedwood Forest, Kalmia Lichen / Heathland and Scrub/Heathland / Wetland during spring / summer and Hardwood

Labrador‐Island Transmission Link Environmental Impact Statement Chapter 10 Existing Biophysical Environment
April 2012 Page 10‐128
Forest, Kalmia Lichen / Heathland and Scrub / Heathland / Wetland habitats during fall / winter (Table 10.3.5‐2).
All other habitat types in Table 10.3.5‐2 were considered tertiary, based on limited protection, resting or feeding opportunities.
Table 10.3.5‐2 Habitat Type and Relative Quality for Moose within the Study Area 5
Habitat Type / Habitat Description
Spring / Summer Importance
Fall / Winter Importance
Comments
Alpine Vegetated Tertiary Tertiary Lack of forage and cover available but early regeneration balsam fir may attract moose
Black Spruce Lichen Forest
Tertiary Tertiary May provide cover
Burn Tertiary Tertiary Lack of forage and cover available, although 5 of 8 burn habitats sampled in 2008 had evidence of moose
Conifer Forest Secondary Primary Forage and cover available
Conifer Scrub Secondary Tertiary Some forage available seasonally
Cutover Secondary Primary Moose use of cutover sites is well‐documented where the presence of birch. can be an important food source
Exposed Earth Tertiary Tertiary Lack of forage and cover available
Hardwood Forest Primary Secondary
Provides food, protection and shelter primarily in spring and fall
Little cover during the winter
Lichen Heathland Secondary Tertiary Some forage available
Mixedwood Forest Secondary Primary Deciduous component an important food source and also provides shelter
Open Conifer Forest Tertiary Tertiary Early regeneration balsam fir may attract moose (McLaren et al. 2000)
Rocky Barrens Tertiary Tertiary Lack of forage and cover available
Kalmia Lichen / Heathland
Secondary Secondary Some forage available. Depending on snow depth, can be used in winter
Wetland Primary Tertiary Primary source of aquatic vegetation that is important during spring / summer
Scrub / Heathland / Wetland
Secondary Secondary May provide some aquatic vegetation and other food sources seasonally
Note: Though not included at the scale of the ELC (Stantec 2010d), riparian habitats are considered secondary habitat quality for moose, during both spring / summer and fall / winter.
Limiting Factors
Evidence shows that population growth of moose can be limited due to illegal harvests, wolf and / or bear predation, marginal habitat, parasites, disease, food availability, climate or a combination of these factors 10 (Dussault et al. 2005; Northland Associates and Jacques Whitford 2000; Chubbs and Schaeffer 1997;

Labrador‐Island Transmission Link Environmental Impact Statement Chapter 10 Existing Biophysical Environment
April 2012 Page 10‐129
Dalton 1986). Snow depth over 60 cm also limits populations, as it decreases food availability and increases energy output in transportation (Newbury et al. 2007; Dussault et al. 2005). Increased road access to hunters due to mining and forest operations and management measures to protect pre‐commercially thinned forest stands can also conflict with moose population dynamics. In Labrador in particular, suboptimal habitat and an inadequate supply of willow and alder browse may limit the species (Jacques Whitford 1997b). 5
The availability of habitat, the availability of alternate foods created by agriculture, management of hunting and the presence of natural predators all affect moose populations and their growth (Crete and Daigle 1999).
Black Bear
Life History, Distribution and Densities
The black bear is a large (70 to 135 kg on mainland Canada; 101 to 179 kg on Island of Newfoundland 10 (Mahoney et al. 2001c) omnivorous mammal found historically throughout Canada, Alaska, isolated pockets in the United States of America and southerly into Mexico (although this species presently occupies only 60% of this historical range, no longer occurring throughout the southern part of the continent or throughout southern parts of Canada) (Kolenosky and Samson 2007). Black bear are found throughout Labrador and the Island of Newfoundland. 15
This opportunistic forager eats a large variety of food (insects, fish, small mammals, birds and newborn ungulates) (Mahoney and Virgl 2003) but the diet is largely plant‐based, especially in late summer and early fall when berries and nuts are plentiful. Solitary animals through most of their lives, mating occurs in June / July of each year beginning in the third to fifth year. Although not true hibernators, this species dens each fall and through the winter months. This species experiences delayed implantation and young (generally two) are born 20 in January / February. The young will remain with the female for 16 to 17 months. The lifespan of a wild black bear is up to 10 years.
There are three black Bear Management Areas in Labrador (Figure 10.3.5‐4): (i) the Torngat Mountains; (ii) George River and the Labrador South; and (iii) the transmission corridor only passes through the Labrador South Bear Management Area (Figure 10.3.5‐4). Bear Management Areas on the Island of Newfoundland are 25 the same as those for moose (Figure 10.3.5‐3), and the Project intersects 21 of them (Figure 10.3.5‐3). The hunting quota for resident and non‐residents is two bears (either sex) in all open management areas (GNL 2009).
Black bear are known to be distributed throughout the Study Area in Labrador. The black bear baseline study in support of the Lower Churchill Hydroelectric Generation Project from 2006 to 2009 provides the most 30 comprehensive overview of this species in the region (Stantec 2010d) and indicated that black bear are relatively common in central Labrador. Recurrent use of the river valley was evident, although the home range of bears extended beyond the lower Churchill River watershed (particularly in association with the landfill in Happy Valley‐Goose Bay) (Stantec 2010d). Although the black bear is noted as present within Southeastern Labrador, no detailed data pertaining to its distribution or use in the Study Area could be found. 35
Black bear are found throughout the Island of Newfoundland, although relatively few published studies of black bear are available and of those that are, most focus on morphology and / or genetic distinctions between black bears on the Island compared to other areas in North America.

"S
!
!
!
!
!
!
!
!
!
!
!
!
!
!
!
!
!
!
!
!
!
!
!
!
!
!
!
!
!
QUE BEC
LAB RAD OR
Nain
Cat Arm
Forteau
Red Bay
Rigolet
Mud Lake
Makkovik
Hopedale
Postville
Sept-Îles
Sheshatshiu
St. Anthony
Schefferville
Portland Creek
Churchill FallsNorth West River
Labrador City / Wabush
Happy Valley-Goose Bay
0 75 150
Kilometres
Black Bear Management Areas in Labrador
FIGURE ID: HVDC_ST_552
"S Converter StationTransmission CorridorSubmarine Cable Crossing Corridor
Black Bear Management AreaTorngat Mountains
George River
Labrador South
FIGURE 10.3.5-4
Strai
t of Belle Isle
G u l f o f
S t . L a w r e n c e
A t l a n t i c O c e a n
Source: Newfoundland and Labrador Department of Environment and Conservation (2011)

Labrador‐Island Transmission Link Environmental Impact Statement Chapter 10 Existing Biophysical Environment
April 2012 Page 10‐131
Habitat Occurrence in the Study Area
Table 10.3.5‐3 summarizes primary, secondary and tertiary breeding habitat quality for black bear in the Study Area. Due to the omnivorous diet of black bear and its adaptability to a wide variety of environments, most natural terrestrial environments are either primary or secondary, with the exception of Exposed Earth habitats. Primary spring / early summer habitat consists of black spruce lichen forest, conifer forest, cutover and Open 5 Conifer habitats (Table 10.3.5‐3) and comprises 2,905.2 km2 (50%) of the Study Area in Labrador and 1,905.4 km2 (44%) in Newfoundland. These same habitats are preferred during late summer / fall, in addition to Hardwood, Mixedwood and Burn habitats, and account for 2,992.8 km2 (52%) of the Study Area in Labrador and 2,250.1 km2 (52%) in Newfoundland during this season.
Secondary habitat is represented by Alpine Vegetated, Conifer Scrub, Lichen Heathland, Rocky Barrens, Kalmia 10 Lichen / Heathland, Wetland and Scrub / Heathland / Wetland habitats during both seasons, and Burn, Hardwood and Mixedwood habitats during spring / early summer only.
Table 10.3.5‐3 Habitat Type and Relative Quality for Black Bear within the Study Area
Habitat Type / Habitat Description
Spring / Early Summer Importance
Late Summer / Fall Importance
Notes
Alpine Vegetated Secondary Secondary May provide some forage
Black Spruce Lichen Forest Primary Primary Provides foraging and shelter requirements
Burn Secondary Primary May provide good forage but less commonly shelter
Conifer Forest Primary Primary Provides foraging and shelter options
Conifer Scrub Secondary Secondary Provides seasonal foraging opportunities
Cutover Primary Primary Provides seasonal foraging opportunities
Exposed Earth Tertiary Tertiary Limited foraging and shelter options
Hardwood Forest Secondary Primary Increased importance in late summer and fall due to maturing of food resources
Lichen Heathland Secondary Secondary Provides foraging opportunities
Mixedwood Forest Secondary Primary Increased importance in late summer and fall due to maturing of food resources
Open Conifer Forest Primary Primary Provides foraging and shelter
Rocky Barrens Secondary Secondary Provides some foraging opportunities
Kalmia Lichen / Heathland Secondary Secondary Provides some foraging opportunities
Wetland Secondary Secondary Provides foraging opportunities
Scrub / Heathland / Wetland Secondary Secondary Provides foraging opportunities
Note: 2008 surveys refer to wildlife observations collected as part of the ELC field program (Stantec 2010a). Though not included at the scale of the ELC, riparian habitats are considered primary habitat quality in spring / early summer 15
and secondary habitat quality in late summer / fall.
Limiting Factors
Black bears have few natural predators. Parasites and diseases are common, but rarely fatal (Kolenosky and Samson 2007, internet site). Hunting and vehicle collisions may also be major factors contributing to black bear mortality in boreal forests, though this is not common in most of the Study Area. Forestry operations directly 20 affect availability and quality of primary habitat, increase exposure to, and avoidance of, humans, and increase road access and hunting potential (Dennis et al. 1996).

Labrador‐Island Transmission Link Environmental Impact Statement Chapter 10 Existing Biophysical Environment
April 2012 Page 10‐132
Reproductive success is dependent on food quality and availability (Dennis et al. 1996; Schwartz and Franzmann 1991) and cubs can be subject to cannibalism and starvation, as well as deaths related to being orphaned when mothers are killed by hunters (Schwartz and Franzmann 1991). Low reproductive rates in general, delays in sexual maturity / reproduction and high juvenile mortality rates are also limiting factors (Dennis et al. 1996). 5
Aboriginal Ecological Knowledge
AEK regarding moose and black bear in parts of the Study Area was obtained through interviews completed with Labrador Innu, and land and resource use interviews with members of the NunatuKavut Community Council. This is listed below (Table 10.3.5‐4), and includes information on habitat, diet, behaviour, and their presence along the proposed transmission line corridor. The information provided is generally in keeping with 10 the scientific data obtained through the field studies and literature review conducted for the EA (as reported in Section 10.3.5.2).
Table 10.3.5‐4 Aboriginal Ecological Knowledge of Moose and Black Bear in the Study Area
Group Source Quote (Direct and / or Indirect)
Labrador Innu
Labrador Innu Traditional Knowledge Committee Member, January 26, 2007 (p. 46)(a)
Direct/Indirect
Ushakashku ‐ ‘where there is always black bear’. These are places where berries are plentiful in late summer and the fall, for example, in burnt woods. “The reason they like it here is because there are lots of red berries and blue berries in these burned areas. Their uatashku (dens) are usually far from their berry feeding areas” (P1.26.1.07).
Labrador Innu Traditional Knowledge Committee Member, November 20, 2006 (p. 46)(a)
Indirect
One good place for mashku (black bear) was on the north side of Mishta‐shipu just upstream of the junction with Kamitinishkau‐shipiss. The banks of Mishta‐shipu consist of red mud in this location. Black bears made dens in the hills just above these banks (P1.20.11.06).
Labrador Innu Traditional Knowledge Committee Member, February 12, 2007 (p. 54)(a)
Direct
“Mashku eats berries first before going into the den. When he knows that the snow is coming, he looks for a den.” (P3.12.2.07).
Labrador Innu Traditional Knowledge Committee Member, November 29, 2006 (p. 55)(a)
Direct
“When we are at the garbage dump, the black bears just stand close to us. They are not afraid. They eat at the dump. But in the country, they are wild; they are afraid of Innu. For example, in Akamiuapishku (Mealy Mountains) when the men hunted bear in a burnt area, the bear took off; they couldn’t get close to it” (P2.29.11.06).
Labrador Innu Traditional Knowledge Committee Member, February 12, 2007 (p. 55)(a)
Direct
“Some anishku‐eniku (ant) can fly. But the ants are working insects. They build their house where they live. When mashku comes along, he listens by the hollow trees, or ant hill, and he can hear the ants, so he bites a hole, and sticks his tongue inside to get at the ants” (P3.12.2.07).

Labrador‐Island Transmission Link Environmental Impact Statement Chapter 10 Existing Biophysical Environment
Table 10.3.5‐4 Aboriginal Ecological Knowledge of Moose and Black Bear in the Study Area (continued)
April 2012 Page 10‐133
Group Source Quote (Direct and / or Indirect)
Labrador Innu Traditional Knowledge Committee Members, November 28, 2006 (p. 61)(a)
Mashku (black bear) eat berries, fish and animals, including caribou, insects (ants, spiders, bees), young beavers, partridge, porcupine, young snowshoe hare. They eat plants as well; spring‐times – grasses as well as other types of new growth including pussy willow buds – atimussat (little dogs). “Bear breaks open a rotten tree to get at insects. Bear hears that there are ants in the rotting tree and so he breaks it up and sticks his tongue into it” (P1, P3, P7.28.11.06).
Labrador Innu Traditional Knowledge Committee Member, November 28, 2006 (p. 61)(a)
Direct
“In the spring, mashku (bear) breaks up the beaver lodge to get at the beavers inside. He waits for the beaver to return to fix the lodge, then gets them. Maikan (wolf) eat beavers as well. Wolves and bear wait for beaver to leave the water to chew trees and they get them on dry ground” (P3.28.11.06).
NunatuKavut Community Council
NunatuKavut Land and Resource Use Interview, 2011
Indirect
Black bear is very popular in the transmission link area, especially in the spring when they’re coming out of their dens.
(a) Source: Innu Environmental Knowledge of the Mishta‐shipu (Churchill River) Area of Labrador in Relation to the Proposed Lower Churchill Project (Armitage 2007). Refer to Appendix 10‐1.
10.3.6 Furbearers and Small Mammals
The term furbearer is most often associated with species of furbearing mammals that are and have been traditionally harvested for their pelts in NL. For the purposes of this EA, furbearers include species managed as 5 such by the province, as well as other medium‐sized furbearing mammals, such as snowshoe hare. Furbearers are important economically within the province because they are farmed, trapped and hunted, and their pelts are often sold. Approximately 16,000 people in the province trap furbearers as a means to supplement income or for recreational pursuits (NLDEC, n.d. a, internet site).
Eighteen furbearer species have been confirmed as present in Labrador, while 13 species have been confirmed 10 in Newfoundland. Four of the 13 furbearer species found in Newfoundland have been introduced by humans and a fifth species has colonized Newfoundland within the past few decades. The lower number of furbearer species present in Newfoundland reflects the isolation of the Island from the North American mainland, which has impeded the ability of mammal species to colonize Newfoundland.
Small mammals, such as mice, voles, shrews and lemmings, are important prey items for carnivorous 15 furbearers. These species are important ecologically, and recognized as such by the provincial government which has established the Small Mammal Monitoring Network to monitor the distribution and abundance of small mammals in NL (Rodrigues 2009). Their populations are linked to climatic changes, habitat alteration and natural disturbance, and they are known vectors of disease and parasites (Garland 2008; Trimper 1989). As many of these species are prey for larger mammals and avifauna, understanding their distribution, population 20 trends, and limiting factors are important contributors to the understanding of population dynamics of higher order predators in an ecosystem.
10.3.6.1 Study Area
Existing baseline conditions for furbearers and small mammals are presented in relation to the proposed transmission corridor from Central Labrador to the Island of Newfoundland’s Avalon Peninsula and a 25 surrounding 15 km wide Study Area, as well as considering the location of other Project‐related components and activities (Figure 10.3.6‐1). As for other components, the nature of the information presented in the following section is primarily based on the specific regions and management units for which data are often presented. Overviews of the presence, abundance, and distribution of furbearers and small mammals are provided for Labrador and Newfoundland, with regional differences highlighted as they occur. 30

!
!
!
!
!!
!
!
!
!
!
!
!
!
!
!
!
!
!
"S
"S
G u l fo f
S t . L a w r e n c e
L a b r a d o r S e a
A t l a n t i c O c e a nSt ra
i t of B
e l l e I s le
Nain
Forteau
Red Bay
Cartwright
Mary's Harbour
Churchill Falls North West River
Port Hope Simpson
Labrador City / Wabush Happy Valley-Goose Bay
Gander
Marystown
Deer Lake
St. Anthony
Clarenville
Grand Falls-Windsor
Channel-Port aux Basques
St. John's
Corner Brook
0 100 200
Kilometres
FIGURE 10.3.6-1
Study Area for Furbearers and Small Mammals
FIGURE ID: HVDC_ST_382
±
"S Converter Station
Transmission CorridorStudy Area Region
Central and Southeastern LabradorNorthern PeninsulaCentral and Eastern NewfoundlandAvalon Peninsula
Muskrat Falls
C A N A D A
SoldiersPond

Labrador‐Island Transmission Link Environmental Impact Statement Chapter 10 Existing Biophysical Environment
April 2012 Page 10‐135
10.3.6.2 Information Sources and Data Collection
The following documentation was consulted to assist in the characterization of existing conditions for furbearers and small mammals within the Study Area:
Furbearer and Small Mammal Component Study (Stantec 2010e).
Seven key and representative species were selected to focus the description of furbearers and small 5 mammals relative to the Study Area, based on their status (i.e., listed species), affinities for a particular habitat type and / or representation of a particular group (e.g., terrestrial or semi‐aquatic species):
marten (Martes americana) ‐ including the Newfoundland marten;
wolverine (Gulo gulo);
red fox (Vulpes vulpes); 10
beaver (Castor canadensis);
porcupine (Erethizon dorsatum);
red‐backed vole (Clethrionomys gapperi); and
meadow vole (Microtus pennsylvanicus).
A description of the available information and existing environmental conditions was prepared according 15 to the primary sources of information available, existing conditions and status, habitat associations and distribution along the Study Area, and potential limiting factors for each of the above species.
The ELC habitat classifications (Stantec 2011b, 2010a) formed the basis of the furbearer and small mammal habitat mapping component of this study. Detailed habitat quality maps were generated for four species (i.e., marten, porcupine, red‐backed vole, meadow vole), indicating the abundance of primary, secondary 20 and tertiary quality habitat in the Study Area. Primary habitat was defined as habitat that provides foraging, protection and resting habitat, secondary habitat provides an abundance of one or more (or marginal amounts of all) of these life‐requisite elements and tertiary habitat provides marginal foraging, protection or resting opportunities or may only be used during transit.
Habitat mapping was not prepared for wolverine, red fox or beaver for a variety of reasons. Wolverine 25 habitat mapping was not prepared because this species has not been confirmed as present in NL. The scale at which beaver interact with the environment was too small to permit effective habitat mapping. In addition, key habitat requirements such as stream velocity and bottom type could not be mapped with the available imagery. Habitat potential for red fox was not rated or mapped in the Study Area due to the generalist nature of this species. Red fox could be expected to be present throughout the province 30 wherever suitable prey such as snowshoe hare and microtine rodents are present.
Habitat quality maps were produced for the each of the geographic regions crossed by the Study Area. Maps were colour‐coded to reflect habitat quality and indicate the percentage of primary, secondary and tertiary habitat available within each of the geographic regions. The habitat maps can be viewed in the Furbearer and Small Mammal Component Study (Stantec 2010e) and the Furbearer and Small Mammal 35 Supplementary Report (Stantec 2011f).
For the Newfoundland population of marten, the habitat ranking and mapping exercise described above was conducted to qualify and quantify the available habitat within the Study Area. Information on important habitat for marten as identified by the province was provided by the Wildlife Division (Herdman 2009, pers. comm.). These data include the locations of core habitat areas, estimated numbers of marten 40 associated with each core area, location records of individual marten, and an assessment of habitat quality within each of the core areas.

Labrador‐Island Transmission Link Environmental Impact Statement Chapter 10 Existing Biophysical Environment
April 2012 Page 10‐136
Furbearer and Small Mammal Supplementary Report (Stantec 2011f).
Literature review assembled for the Project.
Small Mammal Monitoring Network Program (Rodrigues 2010; Garland 2008): NLDEC Wildlife Division has established the Small Mammal Monitoring Network, a partnership between industry, government, and interest groups with the goal of documenting small mammal populations and distribution in the province 5 (Rodrigues 2009). The program involves yearly trapping of small mammals at a number of permanent trapping sites in NL.
Labrador‐Island Transmission Link Ecological Land Classification (Stantec 2010a), Vegetation Supplementary Report (Stantec 2011b).
Wildlife Habitat Associations in the Lower Churchill River Valley (Minaskuat Inc. 2008c); Survey for Beaver 10 Colonies in the Lower Churchill River Valley: Environmental Baseline Report (Minaskuat Inc. 2008d) and Reservoir and Transmission Line Wildlife Reconnaissance (Northland Associates Limited 1980b).
The above information was supplemented by trapping information from Statistics Canada (Statistics Canada 2008, internet site), and data and mapping from Wildlife Division, NLDEC, related to of the Newfoundland marten (Martes americana atrata) in Newfoundland. 15
As stated above, a number of baseline field studies were completed for wildlife, either recently or in the past in support of the Project, and used to establish baseline conditions for furbearers and small mammals in the Study Area:
Labrador – Island Transmission Link Ecological Land Classification (Stantec 2010a): Habitat Types within the 15 km wide Study Area from Central Labrador to Soldiers Pond were surveyed in the summer of 2008. 20 Vegetation, site photographs, site conditions and wildlife suitability data were collected for 404 sites. High‐resolution satellite images and aerial photographs were incorporated into a computer‐based GIS and used to define and delineate 15 Habitat Types and several Non‐Habitat Types within the Study Area. for the ELC mapping for the Labrador portion of the Study Area was updated to accommodate changes in the corridor alignment, beginning at Muskrat Falls (Stantec 2011b). As part of the ELC for the Project, selected wildlife 25 species, including furbearers and small mammals and evidence of their presence (e.g., tracks, scat, browse, dams), were recorded by a wildlife biologist during field surveys in July and August 2008, in selected plots in Labrador (67 plots) and on the Island of Newfoundland (337 plots). Potential habitat for these species was classified, where appropriate, according to primary, secondary or tertiary habitat potential. The furbearer species for which evidence of occurrence and assessment of habitat quality were conducted 30 included grey wolf, red fox, lynx (Lynx canadensis), American marten, wolverine, river otter (Lutra canadensis), mink (Neovison vison), ermine (Mustela ermine), porcupine (Erethizon dorsatum), beaver, muskrat (Ondatra zibethicus), ground hog (Marmota monax), red squirrel (Tamiasciurus hudsonius) and snowshoe hare. Terrestrial small mammals were recorded as a group as it is not possible to identify which species are present without conducting a small mammal trapping program. 35
In addition, past studies that were conducted in support of the Project and the Lower Churchill Hydroelectric Generation Project that are applicable to the Study Area include:
Transmission Line Wildlife Reconnaissance: Gull Lake – Strait of Belle Isle (Northland Associates Ltd. 1980c): Northland Associates Limited (1980c) investigated wildlife along a corridor from Gull Lake to the Strait of Belle Isle in Labrador, based on aerial observations of animals and / or tracks, and local (expert) 40 knowledge. Aerial surveys were completed during three days in February and April, 1980 from the lower Churchill River to the Strait of Belle Isle.

Labrador‐Island Transmission Link Environmental Impact Statement Chapter 10 Existing Biophysical Environment
April 2012 Page 10‐137
Wildlife Habitat Associations in the Lower Churchill River Valley (Minaskuat Inc. 2008c): A series of general wildlife surveys were conducted along the lower Churchill River valley in 2006. Rather than estimating abundance, the purpose of these wildlife surveys was to determine relative levels of use between and within habitat types. Seventy‐seven transects (of >3 km in length) representing all habitat types were followed throughout the lower Churchill River valley. Each field team recorded wildlife sign, changes in 5 habitat and time and distance covered in each habitat. Habitat types were graded as primary, secondary or tertiary for each mammal species based on field observations and existing knowledge / experience. Eight small mammal trapping grids were also established in the lower Churchill River valley from 10 to 26 August, 2006.
Survey for Beaver Colonies in the Lower Churchill River Valley (Minaskuat Inc. 2008d): As part of the Lower 10 Churchill Hydroelectric Generation Project baseline studies, surveys of beaver colonies were conducted throughout the watershed (Minaskuat Inc. 2008d). Helicopter surveys examined 63 blocks along the Churchill River from Happy Valley‐Goose Bay to Churchill Falls during October 2006.
Furbearer Winter Habitat Use Study (Sikumiut Environmental Managemnt Ltd. (Sikumiut) 2007): This study repeated several ground transects similar to those conducted by Northland Associates (1980b) from Gull 15 Island through south‐eastern Labrador to the Strait of Belle Isle for winter habitat use by furbearers.
AEK has been collected from consultation initiatives with Aboriginal groups in the Study Area (a summary of all Aboriginal consultation initiatives conducted for the Project can be found in Chapter 7 of the EIS). Sources of AEK include, but are not limited to, land use surveys and interviews, reviews of existing published and unpublished literature and through the provision of information to Nalcor by an the Aboriginal group or 20 organization.
LEK was collected from consultation initiatives with various communities (a summary of all consultation with public stakeholders can be found in Chapter 8 of the EIS) including Open Houses and correspondence. A general literature review and media search was also conducted.
10.3.6.3 Description of Furbearers and Small Mammals 25
Furbearers
Furbearers comprise 18 of 41 mammal species in Labrador, and 13 of 30 mammal species in Newfoundland. In general, furbearers are widely distributed throughout the Study Area, although some species have more restricted ranges. The occurrence of furbearers in Labrador and Newfoundland is outlined in Table 10.3.6‐1.
The number and value of wildlife pelts sold in NL in 2006 is provided in Table 10.3.6‐2. 30
Table 10.3.6‐1 Furbearer Species in Newfoundland and Labrador
Species Common Name
Labrador Newfoundland Comments
Lynx canadensis Canada lynx Native Native Trapping is permitted in Labrador, but not in
Newfoundland
Canis lupus Grey wolf Native Extirpated
Labrador population is large enough to permit fur harvesting
Newfoundland population extirpated in the mid‐nineteenth century

Labrador‐Island Transmission Link Environmental Impact Statement Chapter 10 Existing Biophysical Environment
Table 10.3.6‐1 Furbearer Species in Newfoundland and Labrador (continued)
April 2012 Page 10‐138
Species Common Name
Labrador Newfoundland Comments
Canis latrans Eastern coyote
Native
Non‐native
(Through range expansion in the mid‐1980s)
First confirmed record in Labrador in 1995 (Chubbs and Philips 2005)
First observed coming ashore on sea ice near the Port au Port Peninsula in 1985 and have occasionally been observed on sea ice between Nova Scotia and Newfoundland (NLDEC 2006)
Currently established across most of Newfoundland
Trapped and hunted commercially and recreationally
Focused control programs used for problem coyotes in livestock producing areas or important wildlife areas
Vulpes lagopus Arctic fox (white fox)
Native Vagrant
Patchy distribution in the Study Area Associated with arctic or alpine tundra, but makes
use of the transition zone between forest and tundra during the winter months
Expected to occur along coastal barrens of south‐eastern Labrador (Banfield 1987)
Frequently travel on sea ice and occasionally migrate across the sea ice to the northern end of insular Newfoundland (NLDEC, n.d. a, internet site)
Trapped in Labrador and may be taken incidentally in Newfoundland although few animals are taken
Vulpes vulpes Red fox Native Native Abundant and widely distributed in semi‐open
habitat in both Labrador and Newfoundland (NLDEC, n.d. a, internet site)
Martes americana
(Newfoundland subspecies atrata)
American marten
Native Native
Distributed throughout Labrador and one of the most important furbearer species accounting for the greatest revenue generated by any furbearer species in the province
Restricted to three core habitat areas in Newfoundland, where it is listed as Threatened under SARA (Schedule 1) and the NLESA
Martes pennanti
Fisher Vagrant Not Present
Occurs occasionally in Labrador as a vagrant from Québec
No open trapping season in Labrador Luntra canadensis
Northern river otter
Native Native Populations large enough to support fur harvesting,
although the number of otters captured is relatively low
Neovison vison Mink Native
Non‐native
(Introduced in 1935)
Newfoundland population established following escape of mink from mink farms and deliberate introductions in 1935
Species is common and most abundant species sold at fur auctions in the province in 2006
Mustela ermine Ermine Native Native Common throughout the Study Area

Labrador‐Island Transmission Link Environmental Impact Statement Chapter 10 Existing Biophysical Environment
Table 10.3.6‐1 Furbearer Species in Newfoundland and Labrador (continued)
April 2012 Page 10‐139
Species Common Name
Labrador Newfoundland Comments
Mustela nivalis Least weasel
Undetermined Not Present
Thought to be present in Labrador but no records to confirm its presence
No records of this species in Newfoundland
Gulo gulo Wolverine
No conclusive data to suggest they are present
Not Present
Historically present in much of Labrador but not native to Newfoundland
Numbers trapped in Labrador declined in early twentieth century and last confirmed records of this species in Labrador occurred in 1950s
Number of unconfirmed reports of this species in Labrador (Knox 1994)
Listed as Endangered by SARA (Schedule 1) and NLESA
Castor canadensis subsp. caecator
American beaver
Native Native
One of the most important furbearers in the province
Neither Labrador nor Newfoundland provide ideal habitat as preferred food such as aspen are not widely available (Northcott 1971)
Ondatra zibethicus
Muskrat Native Native Harvested throughout the province
Tamiasciurus hudsonius
Red squirrel Native
Non‐native
(Introduced in 1963)
Relatively few harvested commercially (886 pelts in 2006 (Statistics Canada 2008, internet site) given its common occurrence in the province
Tamias striatus Eastern chipmunk
Not Present
Non‐native
(Introduced in 1962)
Introduced in the early 1960s to Newfoundland
Glaucomys sabrinus
Northern flying squirrel
Native Not Present
Not deliberately trapped as its fur is too soft to be of use in the fur industry (Banfield 1987)
Accidentally caught in traps set for other furbearers as it will feed on bait in traps (Banfield 1987)
Marmota monax
Woodchuck Native Not Present Not commercially harvested
Lepus arcticus Arctic hare Native Native
Occurs in coastal barrens habitat in south‐eastern Labrador but is absent from the more heavily forested interior
Restricted to alpine barrens in highlands in the western half of Newfoundland
Hunted in Labrador, but no open season in Newfoundland
Lepus americanus
Snowshoe hare
Native
Non‐native
(Introduced 1860 to 1880)
Widely distributed and common in both Labrador and Newfoundland
Important as both a prey source for various carnivores and as a game animal
Approximately 1.5 million hare harvested in the province each year (NLDEC, n.d. a, internet site)

Labrador‐Island Transmission Link Environmental Impact Statement Chapter 10 Existing Biophysical Environment
Table 10.3.6‐1 Furbearer Species in Newfoundland and Labrador (continued)
April 2012 Page 10‐140
Species Common Name
Labrador Newfoundland Comments
Erethizon dorsatum
Porcupine Native Not Present
Popular game animal in Labrador
Population decreased substantially in the 1950s but recovered to the point of being added to the list of game animals in 2005 (NLDEC 2007; Newfoundland and Labrador Department of Works, Services and Transportation (NLDWST) 2003)
Source: NLDEC, n.d. a, internet site; SARA 2011, internet site; Chubbs and Phillips 2005; Van Zyll de Jong 1975.
Table 10.3.6‐2 Number and Value of Wildlife Pelts Sold in Newfoundland and Labrador, 2006
Species Total Number of Pelts Dollar Value (Canadian)
Beaver 2,633 $63,139
Coyote 244 $5,290
Ermine 2,192 $11,771
Red fox 2,288 $58,230
White fox 15 $398
Lynx 107 $13,058
Marten (Labrador only) 1,230 $82,016
Mink 2,811 $39,213
Muskrat 1,880 $6,274
Otter 676 $37,903
Squirrel 886 $1,054
Wolf 75 $8,119
Total 14,965 $326,465
Source: Statistics Canada (2008, internet site).
Furbearers represent a diverse group of species that occupy a variety of terrestrial and aquatic habitats in the Study Area. Aquatic furbearers (e.g., river otter, mink, muskrat and beaver) spend most of their life cycle in and 5 around wetlands, rivers and lakes (Table 10.3.6‐3). Other furbearers (e.g., red fox, wolf, lynx, weasel, red squirrel, northern flying squirrel and marten) are found primarily in dryer upland sites, but may use riparian zones.

Labrador‐Island Transmission Link Environmental Impact Statement Chapter 10 Existing Biophysical Environment
April 2012 Page 10‐141
Table 10.3.6‐3 Characteristics of Furbearers Potentially Found in the Study Area
Species Preferred Habitat Behaviour Reproduction Food Habits
Marten Mature coniferous and mixed forest >20% canopy cover
Diurnal / nocturnal, solitary, arboreal and terrestrial
1 litter / year; 1 – 5 young, average 3
Small mammals, hares, birds, carrion, fish, insects, berries
Mink Riparian zones, wetlands
Solitary and nocturnal, terrestrial
1 litter / year; 2 – 10 young, average 4 ‐ 5
Small mammals, muskrat, amphibians, fish, birds, hares, invertebrates
River otter Permanent waterbodies, riparian zones
Nocturnal / crepuscular, family units, aquatic and terrestrial
1 litter / year; 1 – 6 young, average 2 – 3
Fish, invertebrates, amphibians, birds, small mammals
Least weasel Open areas, mixed forest
Nocturnal, solitary, terrestrial
2 + litters / year; 1 – 10 young
Small mammals, insects
Ermine Tundra, forest Nocturnal, solitary, arboreal and terrestrial
1 litter / year; 4 ‐10 young
Small mammals, small birds, fish, amphibians, invertebrates
Red fox Semi‐open habitats, forest edges and clearings
Diurnal / nocturnal, family units in spring / summer, solitary in fall / winter, terrestrial
1 litter / year; 1 – 10 young
Small mammals, birds, berries, carrion, hares
Lynx
Mature and successional forest, riparian zones in river valleys
Nocturnal / crepuscular, solitary, populations cycle with snowshoe hare, terrestrial
1 litter / year; 2 – 5 young
Snowshoe hare, small mammals, birds, caribou and moose calves
Wolf Varied, depends on habitat where prey is located
Nocturnal / crepuscular, gregarious in family units and packs, terrestrial
1 litter / year; 1 – 11 young, average 6 – 7
Caribou, moose, beaver, birds, small mammals
Red squirrel Mature coniferous or mixed forest
Diurnal, solitary, arboreal 1 – 2 litters / year; 1 – 8 young
Conifer cones, berries, fungus, eggs, mice
Northern flying squirrel
Boreal forest Nocturnal, somewhat gregarious, arboreal
1 litter / year; 2 – 4 young
Lichens, leaves, seeds, carrion, birds eggs
Arctic hare Tundra with boulders, Krumholtz, exposed hilltops
Nocturnal and seasonal shifts
1 litter / year 3 young
Summer sedges, herbs, grasses, in winter woody vegetation such as birch and willows
Beaver Slow streams, lakes and ponds in or near forested areas
Nocturnal / crepuscular, gregarious in family units, aquatic and terrestrial
1 litter / year; 3 – 4 young
Aquatic vegetation, bark, leaves, buds and stems of deciduous trees and shrubs
Muskrat
Permanent water that does not freeze to bottom, with herbaceous and aquatic vegetation
Nocturnal / crepuscular, solitary or family units, aquatic and terrestrial
2 – 3 litters / year; 3 – 9 young
Aquatic vegetation, fish, clams, mussels
Porcupine Deciduous / coniferous forest
Nocturnal / crepuscular, solitary, arboreal and terrestrial
1 litter / year; 1 young
Leaves, seedlings, grass, inner bark of trees
Source: Gerrow and Taylor 2007; Gerrow 2003; adapted from DND 1994.

Labrador‐Island Transmission Link Environmental Impact Statement Chapter 10 Existing Biophysical Environment
April 2012 Page 10‐142
Within both of these groups are carnivorous and herbivorous species. Examples of carnivorous furbearers found in the regions containing the Study Area include marten, least weasel (Mustela nivalis), red fox and ermine that feed primarily on voles, lemmings and other small mammals. Some species such as lynx and wolf are quite specialized in their diet. Lynx prey mainly on snowshoe hare (Table 10.3.6‐3). Wolves prey heavily on moose and caribou in Labrador (Trimper et al. 1996), but may feed on a variety of other prey species 5 opportunistically (Carbyn 1987). Mink and red fox are generalist predators that will prey on whatever prey are available. Specialist predator populations tend to fluctuate cyclically in tandem with their preferred prey species. This relationship is well established between lynx and snowshoe hare. Changes in prey abundance can also affect individual fitness, as has been observed in wolves (Messier 1987), or home range size as has been documented for marten (Thompson and Colgan 1987). 10
Furbearers vary substantially in their home range sizes. Small furbearers such as red squirrel and ermine typically have small home ranges. Red squirrels in spruce forests have been documented with home ranges of 0.2 to 0.5 hectares (ha) (Obbard 1987). Large furbearers, such as wolves and lynx, often have much larger home ranges that encompass a variety of habitat types. By way of example, the home ranges of wolves in Alaska have been measured at 683 km2 (Peterson et al. 1984). 15
Representative Furbearer Species
As described above, five representative furbearer species were selected for further consideration with respect to their existing conditions within the Study Area. These are marten, wolverine, red fox, beaver and porcupine. Descriptions of life history, results of the habitat modelling, where applicable, and limiting factors are provided for each of these species. Three furbearer species – lynx, coyote and wolf – are also briefly described as they 20 are species known to prey on wildlife species of concern, including caribou, and are trapped and / or hunted.
Marten
Life History
The American marten is a cat‐sized member of the weasel family. Marten are omnivores that prey on mammals such as snowshoe hare, voles and shrews (Canadian Wildlife Service and Canadian Wildlife 25 Federation (CWS and CWF) 1977, internet site). Also included in their diet when available, are berries, insects and carrion. Marten are agile climbers and will feed on arboreal food sources such as birds and their eggs opportunistically (NLDEC, n.d. b, internet site). The marten’s climbing ability also serves as a means of avoiding predators such as Great Horned Owls (Bubo virginianus) and lynx as well as a means of accessing tree cavities such as woodpecker holes as natal den sites (CWS and CWF 1977, internet site). 30
Mating occurs in July; however, due to delayed implantation in this species, the young are not born until the following March or April (CWS and CWF 1977, internet site). The female establishes a natal den in a hollow tree, woodpecker hole, or in cavities in stone piles where she gives birth to one to five young. The young marten are weaned by six weeks of age (Banfield 1987). Although marten reach adult size within four months, most females do not reach sexual maturity until they are two years old. Generally, the first litter is born at 35 about three years of age (Banfield 1987).
Marten populations are closely linked with small mammal and snowshoe hare prey base. Simon et al. (1999a) noted a reduction in total marten harvest, as well as female to juvenile ratios, following a decrease in small mammal numbers in central Labrador. The importance of snowshoe hare as a prey source for Newfoundland marten in winter has been documented (Bateman 1986); however, the marten studied by Simon et al. (1999a) 40 in central Labrador did not compensate in a year with low small mammal abundance by increasing consumption of hare.
Marten in Newfoundland have a generalist foraging strategy; their diet varies seasonally with the availability of prey and berries. In a comprehensive study by Gosse and Hearn (2005) in which scats and stomach contents collected over a 23 year period in Newfoundland were analyzed, it was found that meadow vole were the most 45 prevalent prey source in both summer (80%) and winter (47%). The recent introduction of the southern red‐backed vole to Newfoundland may alter the distribution and availability of meadow vole (Morris 1969). Marten diet was broader during winter, with snowshoe hare comprising 28% of their diet, and during winter (but not summer) marten moved in response to snowshoe hare distribution (Gosse et al. 2005). Marten diets were also found to include insects, passerines, grouse, ptarmigan, eggshells, southern red‐backed vole, fish, 50 vegetation and carrion (Gosse and Hearn 2005; Martin 1994). Plants found in marten scat in Newfoundland

Labrador‐Island Transmission Link Environmental Impact Statement Chapter 10 Existing Biophysical Environment
April 2012 Page 10‐143
include creeping snowberry (Gaultheria hispidula), wild sarsaparilla (Aralia nudicaulis), blueberry (Vaccinium spp.), bunchberry (Cornus canadensis), common raspberry (Rubus idaeaus) and three‐leaf Solomon’s‐seal (Smilacina trifolia) (Gosse and Hearn 2005). Berries were the second most important food type for marten in summer (Gosse and Hearn 2005).
Marten diet varies considerably in different geographic areas (Martin 1994) and the availability of food may be 5 the most crucial factor affecting marten distribution (Mech and Rogers 1977). The spatial dynamics of marten are linked with cyclic population fluctuations of small mammal prey (Helldin 1999). During the low part of the cycle, home ranges tend to increase in size (Thompson and Colgan 1987) so they can secure enough food resources during the shortage.
Habitat selection by marten generally depends on the availability of dense canopy forest patches within a 10 matrix of bogs and scrub (Smith and Schaefer 2002). Marten favour and are most successful in continuous late‐successional coniferous forests (Poole et al. 2004; Buskirk and Ruggiero 1994; Buskirk 1992). Mature coniferous forest is important because it provides the vertical and horizontal structure thought to be necessary for marten, regardless of tree species composition (Bowman and Robitaille 1997). This structure provides access points to subnivean (under snow) habitat so that marten can effectively hunt small mammals during the 15 winter when many small mammals tend to spend most of their time in snow tunnels. During the rest of the year, the large woody debris in these stands provides cover for small mammals which increases the availability of prey. The large woody debris and root tip‐ups in mature conifer stands also provide shelter for marten. Buskirk and Powell (1994) postulated that this preference was greater in winter than in summer, due to higher vulnerability to predators on a snow surface. 20
Although often linked to coniferous trees, marten may not show selection for tree species composition or cover within productive forests (Smith and Schaefer 2002) as, marten have not been associated with deciduous forests over forests with a substantial conifer component (Buskirk and Ruggiero 1994). Chapin et al. (1997) detected no selection preferences among coniferous, deciduous, or mixed forest types during winter in Maine.
Marten habitat use on the Island of Newfoundland was most recently examined by Hearn et al. (2010), who 25 evaluated habitat selection by this species across landscapes composed of a range of habitat types. The study found that at both the landscape and stand scales, adult resident marten utilized a broad range of habitat types, including recent cuts, regenerating forest, pre‐commercially thinned stands, and mature and overmature forest, indicating that habitat selection by marten in Newfoundland is considerably more general than has traditionally been inferred. It is also important to recognize that while marten are willing to use 30 several different habitat types, home range composition appears to require minimum amounts of high quality habitat (Herdman 2011, pers. comm.)
Several researchers have reported that marten require overstorey canopy closure above certain thresholds for suitable habitat. Fuller and Harrison (2005), Thompson and Harestad (1994), Spencer et al. (1983) and Koehler and Hornocker (1977) considered 30% as the minimum amount of closure considered as habitat. The threshold 35 for habitat is somewhat arbitrary and dependent on the definition of what constitutes habitat. It also depends on the geographic area of study as ecotype preferences and adaptations vary for marten across its North American range. The threshold of 20% canopy closure in south‐east Labrador (Smith and Schaefer 2002) is the most applicable for the Project due to its geographic proximity.
The home range of marten varies by sex. Females generally have a home range of 3 to 5 km2 which is centred 40 on a food source. The home range of males is twice as large and is located to maximize exposure to female marten (Sandell 1989; CWS and CWF 1977, internet site). In south‐eastern Labrador, home range size has been estimated at 45 km2 for males and 28 km2 for females which is more than double the previously recorded home range sizes for marten (Smith and Schaefer 2002). They noted that home range size was related to the amount of less productive habitat such as bog and scrub forest present in the home ranges of marten, with 45 larger home ranges present in areas with large proportions of unproductive habitat. Studies of radio‐collared marten in Terra Nova National Park indicated that the home range size for marten in this area was 15 to 30 km2, much larger than home ranges measured elsewhere. The large size of home range in Terra Nova was believed to be compensatory for a low meadow vole population in that area (Gosse et al. 2005).
Marten are found throughout Labrador in suitable habitat, and once occupied old growth forests throughout 50 Newfoundland (Forsey et al. 1995). The Labrador population is healthy, with between 508 to 1,390 individuals

Labrador‐Island Transmission Link Environmental Impact Statement Chapter 10 Existing Biophysical Environment
April 2012 Page 10‐144
harvested annually. Marten abundance in south‐eastern Labrador has fluctuated over time. Historical trapping data indicate an apparent decline of marten in the lower Churchill River watershed in the 1950s (Northcott 1961). Causes were unknown, but were likely related to availability of suitable prey. Ground surveys conducted in the Churchill River watershed in 1979 indicated that marten were not common near the river, but were moderately abundant on the ridges (Northland Associates Ltd. 1980a). Local residents reported that marten 5 were not abundant in the lower Churchill River watershed at that time. These residents indicated that the area west of Winokapau Lake was the only place where marten were common in the valley. On the eastern side of the valley in the Lake Melville area, Luttich and Folinsbee (1975) stated that marten had decreased in abundance and were not commonly trapped. In areas with extensive road networks such as the Upper Lake Melville area, age and sex ratios provided by trappers suggest that marten in this region have been over‐10 harvested (Simon et al. 1999b).
Marten once occupied old growth forests throughout Newfoundland (Forsey et al. 1995) and likely inhabited the Island since the last glaciation over 10,000 years ago (CWS and CWF 1977, internet site). Since the mid‐1950s, marten populations in Newfoundland have declined considerably, as a result of habitat loss and accidental trapping and snaring. This has led to the cessation of legal trapping since 1934, and the subspecies 15 being listed under the SARA (Schedule 1) and the NLESA as Threatened. Marten were re‐introduced to Terra Nova National Park in Newfoundland in the early 1980s. The first population estimate, in 1985, was as high as 800 individuals (Snyder and Hancock 1985; Bateman 1984). In 1988, the population was estimated at approximately 300, and the 2007 estimates indicate a population size of 300 to 600 animals (COSEWIC 2007a; Bissonette et al. 1988). 20
Currently, there are five subpopulations of marten in Newfoundland distributed among three core areas (near Main River, Terra Nova and west‐central Newfoundland) that overlap or are adjacent to the Study Area (Figure 10.3.6‐2). Core areas are estimates based on visual stratification of locations of adult animals, and includes data from live trapping, accidental captures, radio telemetry, bait stations and sightings, covering an area of 11,238 km2 (Schmelzer 2008). Important or proposed critical (NLDEC 2011e) habitat for marten as identified by the NLDEC 25 Wildlife Division is depicted in Figure 10.3.6‐2 and may be considered “analogous to an area of (marten) occupation” and based on locations of “resident marten in areas of suitable habitat” (Newfoundland Recovery Team 2010). Peripheral marten areas have also been identified adjacent to these three core areas, based on the distribution of both adult and juvenile Newfoundland marten (i.e., habitat use), and account for an additional 12,145 km2 (Schmelzer 2008). Using all data available (e.g., trapper records, effort and density estimates from many 30 studies) over several decades, it has been shown that core and peripheral areas have increased in size considerably in recent years, relative to the small areas that were identified when marten were at their lowest numbers (Newfoundland Recovery Team 2010; Schmelzer 2008). Proposed critical (NLDEC 2011e) habitat for Newfoundland marten has been identified in a draft (but as yet unreleased) provincial recovery plan for this species, which is being considered for adoption by the federal government as a recovery strategy. 35
The population of marten on the Northern Peninsula is concentrated along the Main River, adjacent to Gros Morne National Park (Figure 10.3.6‐3). This area (2,177 km2) has suitable marten habitat over 60% of the landscape and as a result has the ability to support more marten than is currently documented there. This may be important for future recovery of Newfoundland marten (Schmelzer 2008). The marten population in this core area is estimated to be between 94 and 190 individuals (Schmelzer 2008). This area falls within the Main 40 River Study Area, which is a wildlife reserve in which no snowshoe hare snaring is permitted and only trapping methods having low potential to capture marten are permitted. The Project Study Area crosses the Main River core area including an area of important or proposed critical (NLDEC 2011e) marten habitat near the northern portion of the core area (Figure 10.3.6‐3).
The Little Grand Lake / Red Indian Lake marten population encompasses a large area in west‐central 45 Newfoundland (6,232 km2) (Figure 10.3.6‐4). Also included in this core area is a smaller core area just south of Sandy Lake with four adult marten locations documented between 1990 and 2007. To the south of the Little Grand Lake / Red Indian Lake core area is another small core area near Crabbes River. This core area contains an estimated 14 to 16 marten (Schmelzer 2008). The marten population in the Little Grand Lake / Red Indian Lake core area is estimated to be between 237 and 481 individuals (Schmelzer 2008). Provisional, public and 50 wildlife reserves have been established in this area in which only trapping techniques that have low risk to marten are permitted. No snowshoe hare snaring is permitted within much of this core area. The Little Grand Lake / Red Indian Lake marten core area (specifically, the smaller core area south of Sandy Lake) is located just south of the Project Study Area and does not overlap with the core area.
55

2
6b
Clarenville
GanderGrand Falls-Windsor
FIGURE 10.3.6-2
Core Areas for Newfoundland Marten
±
0 25 50
Kilometres
FIGURE ID: HVDC_ST_383
Transmission Corridor
Core AreasImportant or Proposed Critical*Habitat
National ParkStudy Area Region
Northern PeninsulaCentral and Eastern NewfoundlandAvalon Peninsula
Grand Falls-Windsor Gander
Clarenville
Deer Lake
G u l fo f
S t . L a w r e n c e
GR O SMO RN E
NATI ON ALPARK
TE RRA NO V ANATI ON ALPARK
Main RiverCore Area
Terra NovaCore Area
Crabbes RiverCore Area
Little Grand Lake/Red Indian Lake
Core Area
Sandy LakeCore Area
Source: Newfoundland Marten Recovery Team 2010* NLDEC 2011f
N E W F O U N D L A N D
LABRADORQUEBEC

0 6 12
Kilometres
FIGURE 10.3.6-3
Main River Core Area for Newfoundland Marten in the Main River Area, Northern Peninsula
FIGURE ID: HVDC_ST_396
±
Roads
Transmission CorridorAlternative TransmissionCorridor SegmentsCore AreasImportant or Proposed Critical*HabitatGros Morne National Park
Study Area Region
Northern PeninsulaCentral and Eastern Newfoundland
Source: Newfoundland Marten Recovery Team 2010* NLDEC 2011f
N E W F O U N D L A N D
LABRADORQUEBEC

!Corner Brook
FIGURE 10.3.6-4
Little Grand Lake / Red Indian Lake Core Area and Sandy Lake Core Area for Newfoundland Marten, West - Central Newfoundland
±
0 10 20
Kilometres
FIGURE ID: HVDC_ST_395
Transmission CorridorCore AreasImportant or Proposed Critical*Habitat
Study Area RegionCentral and EasternNewfoundland
Source: Newfoundland Marten Recovery Team 2010* NLDEC 2011f
N E W F O U N D L A N D
LABRADORQUEBEC

Labrador‐Island Transmission Link Environmental Impact Statement Chapter 10 Existing Biophysical Environment
April 2012 Page 10‐148
The Terra Nova marten core area (2,829 km2) encompasses Terra Nova National Park which is approximately 10 km north of the Study Area (Figure 10.3.6‐5). The marten population in this core area is estimated to be 47 to 102 individuals (Schmelzer 2008). No trapping is permitted in the park and only trapping techniques having low potential to capture marten are permitted in the adjacent Terra Nova Marten Study Area and Charlottetown Enclave Modified Snaring and Trapping Area. These two areas are wildlife reserves that have 5 been established outside of Terra Nova National Park to provide protection to marten from incidental trapping. The Study Area passes through the Terra Nova Marten Study Area just to the west of the National Park. The transmission corridor primarily crosses through a gap between the two areas of important marten habitat (Figure 10.3.6‐5).
Habitat Occurrence in the Study Area 10
Table 10.3.6‐4 summarizes primary, secondary and tertiary potential habitat quality ratings for marten within the Study Area. Primary habitat is identified as the Conifer Forest habitat type and occupies 1,417 km2 (25%) of the Central and Southeastern Labrador portion of the Study Area. In Newfoundland, primary habitat occupies 1,200 km2 (13%) of the Study Area in the Northern Peninsula and Central and Eastern Newfoundland regions. There are no marten present on the Avalon Peninsula. Secondary habitat is represented by the Black Spruce 15 and Lichen Forest, Open Conifer Forest, Conifer Scrub, Hardwood Forest and Mixedwood Forest habitat types. There is an estimated 2,579 km2 (45%) of secondary habitat in the Central and Southeastern Labrador Study Area. The Newfoundland portion of the Study Area comprises 3,555 km2 (40%) secondary habitat. The remaining habitat types in Table 10.3.6‐4 were classified as tertiary, based on the provision of limited foraging, protection and resting opportunities. 20
Table 10.3.6‐4 Habitat Type and Relative Quality for Marten within the Study Area
Habitat Type Habitat Quality Comments
Alpine Vegetated Tertiary Lack of vertical and horizontal structure
Black Spruce and Lichen Forest
Secondary Vertical structure is marginal
Burn Tertiary Will use these areas for forage if adjacent to mature, coniferous forest
Conifer Forest Primary Cover, and both vertical and horizontal structure are important (Gosse et al. 2005; Smith and Schaefer 2002; Bowman and Robitaille 1997)
Conifer Scrub Secondary Based on association with small mammals
Cutover Tertiary Lack of vertical and horizontal structure
Exposed Bedrock Tertiary lack of vertical and horizontal structure
Hardwood Forest Secondary Labrador only (Chapin et al. 1997)
Kalmia Lichen / Heathland Tertiary May forage on berry species in years of small mammal crashes
Lichen Heathland Tertiary Lack of vertical and horizontal structure
Mixedwood Forest Secondary Where coniferous forest dominates mixedwood would rate as primary
Open Conifer Forest Secondary
Cover and vertical / horizontal structure are important (Gosse et al. 2005; Smith and Schaefer 2002; Bowman and Robitaille 1997)
Also based on association with vole species
Rocky Barrens Tertiary Lack of vertical and horizontal structure
Scrub / Heathland / Wetland Tertiary Lack of vertical and horizontal structure
Wetland Tertiary Lack of vertical and horizontal structure
Source: Stantec (2011f; 2010e).

!
!
!
Clarenville
0 8 16
Kilometres
FIGURE 10.3.6-5
Terra Nova National Park Core Areas for Newfoundland Marten, Eastern Newfoundland
FIGURE ID: HVDC_ST_397
±
Roads
Transmission Corridor
Core AreasImportant or Proposed Critical*HabitatTerra Nova National Park
Study Area RegionCentral and Eastern Newfoundland
Source: Newfoundland Marten Recovery Team 2010* NLDEC 2011f
N E W F O U N D L A N D
LABRADORQUEBEC

Labrador‐Island Transmission Link Environmental Impact Statement Chapter 10 Existing Biophysical Environment
April 2012 Page 10‐150
In the Central and Southeastern Labrador portion of the Study Area, wildlife habitat surveys revealed the presence of marten sign at only four locations as these surveys were completed during summer when observations of sign for this particular species is less obvious (Minaskuat Inc. 2008c). Winter tracking surveys in the same area earlier that year, however, indicated that marten were the most abundant predator with the highest densities occurring in open and closed black spruce habitats (Sikumiut 2007). 5
The Low Subarctic Forest Ecoregion occupies the largest portion of the Study Area in Central and Southeastern Labrador, 31% of which is rated as primary habitat quality for marten. Primary habitat in the Study Area in the two other Ecoregions in the Study Area in Central and Southeastern Labrador is relatively limited (19% and 9% within the String Bog and Forteau Barrens Ecoregions, respectively). Higher proportions of primary habitat (20% and 59%) are found in the remaining two Ecoregions in this area (Mid Boreal Forest and High Boreal 10 Forest Ecoregions, respectively) but these comprise a small proportion (8%) of the Study Area. Much of this region provides suitable secondary habitat for marten, with between 37% and 52% found throughout the Ecoregions.
Although important marten habitat occurs at the southern end of the Northern Peninsula, in general this region offers relatively low amounts of primary marten habitat, with small concentrations located in the Study 15 Area near the northern and southern boundaries of the Northern Peninsula Forest and Long Range Barrens Ecoregions. The Northern Peninsula Forest Ecoregion comprises 50% of the Study Area in this region, 27% of which is primary marten habitat. Primary habitat also occupies 21% of the Long Range Barrens Ecoregion (which comprises 44% of the Study Area in this region) and the Strait of Belle Isle Ecoregion (6% of the Study Area in the Northern Peninsula) provides 14% of primary habitat quality for marten. Secondary habitat 20 represents 38%, 32% and 24% of the Study Area in the Strait of Belle Isle Barrens, Northern Peninsula Forest and Long Range Barrens Ecoregions, respectively. Tertiary habitat is relatively high throughout the Study Area in this region, ranging from 27% to 47% of Ecoregions on the Northern Peninsula.
The Study Area in the Central and Eastern Newfoundland region, in general, offers relatively little primary habitat for marten (7%, 5% and 0% in the Maritime Barrens, Central Newfoundland Forest and Long Range 25 Barrens Ecoregions, respectively). Moderate proportions of secondary habitat are found throughout the region (up to 47% in the Central Newfoundland Forest Ecoregion, which comprises 92% of the Study Area in this region). Tertiary habitat is widely distributed and comprises 80%, 55% and 41% of the Study Area in the Long Range Barrens, Maritime Barrens and Central Newfoundland Forest Ecoregions, respectively.
Marten are not found on the Avalon Peninsula (Schmelzer 2008), therefore no information regarding the 30 amount of primary, secondary and tertiary habitat in this region is presented.
Limiting Factors
Marten are first order carnivores in that they have few natural predators in the province aside from the fisher, which occurs infrequently as a vagrant in southern Labrador. Lynx, Great Horned Owl and Golden Eagle (Aquila chrysaetos) are other species identified as occasional predators of marten (Banfield 1987). 35
The number of licensed trappers in Labrador fluctuates based on the price of furs; current estimates provided by the Wildlife Division place the number of trappers at approximately 400 (NLDEC n.d. a, internet site). The preferred species for trappers is marten, both in terms of number taken and market value. Trapping pressure and habitat loss have not been important factors on the marten in Labrador to‐date, due to limited access (e.g., road network) (Simon et al. 1999b). 40
Fryxell et al. (1999) found marten population growth rates positively correlated with small mammal densities as well as marten density, but negatively correlated with hunting. Home range size is related to availability of small mammals, which may be influenced by both population cycles and habitat quality (forest productivity, which may ultimately influence prey availability) (Gosse et al. 2005; Smith and Schaefer 2002). Studies suggest marten numbers are regulated more by the availability of snowshoe hare and feed on small mammals 45 opportunistically (e.g., Poole and Graf 1996). This is also supported by observations by trappers which suggest that numbers reflect the availability of small mammals (Simon et al. 1999b). Simon et al. (1999a) found that

Labrador‐Island Transmission Link Environmental Impact Statement Chapter 10 Existing Biophysical Environment
April 2012 Page 10‐151
during a year of low small mammal abundance, snowshoe hare consumption did not increase. These authors documented a three year decline in marten following a decline in small mammals in Labrador.
Habitat reduction and disturbance in combination with incidental trapping have been limiting factors of Newfoundland marten. Until recently, it was believed that old growth forests were a habitat requirement of marten. Research conducted in Québec concluded that forest structure (i.e., many tree stems and suitable 5 cover provided by shrubs) rather than forest age may be the important habitat parameter (Godbout and Ouellet 2010). Suitable marten habitat provides escape routes and cover from predators.
Forsey and Baggs (2001) determined that marten tracks decreased noticeably after clear‐cutting occurred and suggested that small disturbances can immediately affect sensitive species. This species is also sensitive to forest fragmentation so landscape connectivity is important. Connectivity between marten habitats may be 10 provided by riparian linkages (Potvin et al. 2000).
As previously noted, the most recent research on Newfoundland marten habitat use suggest that habitat selection is considerably more general than has traditionally been inferred (Hearn et al. 2010).
Wolverine
Life History 15
The wolverine is the largest terrestrial mustelid species found in Canada (CWS and CWF 2001a, internet site). This carnivore has strength uncharacteristic of its size, no natural predators and a fierce reputation (CWS and CWF 2001a, internet site). Although known as a scavenger of carrion (primarily ungulates), wolverine diet varies both seasonally and regionally. As noted in Table 10.3.5‐1 there is no conclusive data to suggest that they are present in Labrador, and this species does not occur in Newfoundland. 20
Found in remote locations, examples from Scandinavia indicate male wolverine home ranges can be quite large (669 km2), while those of females are considerably smaller (170 km2). The home ranges of males often overlap those of several females (Persson et al. 2010).
Wolverine inhabit remote wilderness areas within the boreal forest across Canada (Banfield 1987) have occupy habitats with much diversity. Key to this species is an abundance of both small and large mammals and the 25 presence of efficient predators. Wolverines are primarily scavengers and depend on wolves and other predators to provide carrion. Caribou carrion is the primary food source for wolverine (Magoun and Valkenburg 1983) and also know to take porcupine, beaver, small mammals and snowshoe hare (Lofroth et al. 2007).
Suitable caching, resting and denning habitat is also important, although little research exists on these matters. 30 Denning sites are often associated with rock outcrops, talus slopes and snow formations in tundra that allow for tunnelling (Magoun and Valkenburg 1983). Wolverine mate in summer, generally at two years of age and two to three young are born the following March (delayed implantation).
There are historical records for this species throughout Labrador, although current presence of wolverine in Labrador is unconfirmed. Reports of sightings in the last four decades suggest the species may have occurred 35 throughout all of Labrador, in both inland and coastal areas (Fortin et al. 2005a). A recovery plan has been implemented for this eastern population of the species which includes Labrador (Fortin et al. 2005a). Future activities may include human intervention, such as a re‐introduction of the species to the region (Fortin et al. 2005a).
Wolverine in Québec and Labrador have previously comprised the eastern population of the species. As a 40 furbearer, this species was regularly trapped until the mid‐1900s. Hunting and trapping of wolverine has been prohibited in NL since 1950 (Fortin et al. 2005a). Two captures of wolverine in Labrador in 1965 represent the last confirmed sightings of this species in Labrador. Knox (1994) reviewed records from 1771 to 1992 that indicate tracks and wolverine were anecdotally reported up until April of 1992. This final observation was

Labrador‐Island Transmission Link Environmental Impact Statement Chapter 10 Existing Biophysical Environment
April 2012 Page 10‐152
made approximately 50 km north of Forteau in southern Labrador. If wolverine are present in Labrador, numbers are likely low based on no reported sightings in recent years.
In 1989, the eastern population of wolverine was assessed and listed as Endangered under SARA (Schedule 1), and was confirmed in 2003. The Province of NL also recognized the species as Endangered under the NLESA in 2002. In 2000, the Labrador Wolverine Working Group was formed, in 2003, hair poles were established, and 5 in 2005 the first aerial surveys for wolverine in northern Labrador were conducted. There were no hair samples collected or sightings of wolverine or tracks recorded during these surveys (Schmelzer 2006a). The recovery potential for this species in Labrador is currently being assessed.
Habitat Occurrence in the Study Area
With an abundance of caribou and large areas of undisturbed habitat, Labrador remains seemingly suitable for, 10 yet uncolonized by, wolverine. Fortin et al. (2005a) speculate that the northern regions of Québec and Labrador may be able to support wolverine based on the large herds of caribou that range over thousands of kilometres. As well, more southern coniferous forests with greater moose density may also be considered suitable wolverine habitat. Due to the unconfirmed presence of this species in the Study Area and the huge range sizes that wolverine typically have, regional mapping of habitat types and quality is not possible. 15
Limiting Factors
Wolverine mortality can result due to several factors, including starvation, predation (e.g., wolves, bald eagle (Haliaeetus leucocephalus)) harvesting by humans and potentially habitat loss. Based on the Québec fur market (there are no records for Labrador), the wolverine pelt harvest reached its peak in 1922‐1923, with a total of 24 pelts sold. Trapping pressure may have resulted in extirpation of local populations. The decline of 20 this species may also be related to a considerable decline in caribou, as caribou carrion is important to this scavenger. A decline in wolf populations may also have contributed to a decline in wolverine populations, as they often rely on predators to provide carrion (Fortin et al. 2005a).
Wright and Ernst (2004) suggest that less dense older growth forests may be important as cache sites for wolverine and that current forest harvesting techniques may be detrimental to wolverine. However, this would 25 not be considered a current limiting factor in Labrador.
Red Fox
Life History
The red fox is a generalist predator that has a varied diet. including small mammals, snowshoe hare, birds (including their eggs and nestlings), fish, insects and berries (CWS and CWF 1993, internet site). Carrion is also 30 an important food source. In Newfoundland, 84% of sampled fox feces tested positively for a parasite associated with caribou, suggesting that caribou carrion was an important food source (Khan and Evans 2006). Voles are the dominant prey item and fluctuations in vole numbers can affect the abundance of red fox (Sklepkovych and Montevecchi 1996).
Red fox generally spend time in pairs, but in years of poor prey availability pairs will separate for brief periods 35 to search for food. Breeding occurs in the winter months and 1 to 10 kits are born in the spring (CWS and CWF 1993, internet site). The home ranges of red foxes range from 4 to 8 km2 and are centred on the den site (CWS and CWF 1993, internet site).
Red fox are distributed throughout the northern hemisphere and are found in all provinces and territories of Canada (Banfield 1974). The wide distribution of this species indicates that red fox can survive in a variety of 40 habitats (Voigt 1987). Generally, habitat preferences include semi‐open areas such as tundra, river valleys and forest openings.

Labrador‐Island Transmission Link Environmental Impact Statement Chapter 10 Existing Biophysical Environment
April 2012 Page 10‐153
Data provided by the NLDEC Wildlife Division (ACCDC 2008, internet site) suggest red fox populations in NL are healthy with similar estimates for Labrador and Newfoundland between 10,000 and 100,000. Habitat potential was not rated or mapped in the Study Area for red fox due to the generalist nature of this species. This species is likely present throughout NL wherever suitable prey are present.
Habitat Occurrence in the Study Area 5
The wildlife habitat assessments conducted in the Study Area in conjunction with the ELC surveys found the presence of red fox in four out of seven habitats types sampled in Labrador and eight out of 10 habitat types sampled in Newfoundland (Stantec 2010e). In the portion of the Study Area located in Central and Southeastern Labrador, evidence of red fox was found in all sampled habitat types with the exception of Burn, Conifer Scrub and Hardwood Forest. In the Study Area in Newfoundland, red fox were recorded in all sampled 10 habitat types with the exception of Burn and Open Conifer Forest. These data indicated that red fox tend to use semi‐open habitats most frequently.
Limiting Factors
A variety of anthropogenic factors can lead to fox mortality. Voigt (1987) reports high mortality of fox as a result of shooting, trapping and road kills. Red fox are sought after by trappers for pelts and are hunted by 15 farmers as pests. In 2006, a total of 2,288 red fox pelts were sold in NL (Table 10.3.6‐2) (Statistics Canada 2008, internet site). They are also preyed upon by larger carnivores such as coyote, lynx, and wolves (Labrador only).
The health of fox populations may be jeopardized by disease. Mortality from rabies can also remove the majority of a population during an outbreak (Voigt 1987). Although many carnivore species respond negatively to habitat fragmentation (Crooks 2002), in Finland, it was found that forests fragmented by agricultural land or 20 by clear‐cutting supported an increase in fox numbers (Kurki et al. 1998).
Beaver
Life History
The beaver is the largest member of the rodent family in North America (CWS and CWF 2005, internet site). This species is semi‐aquatic and has a number of adaptations that permit it to live in an aquatic environment 25 including webbed hind feet, nostrils and ears that can be closed, a transparent membrane over the eye and an oily waterproof pelt. Beaver live in colonies composed of a breeding pair of adults, their kits from the current breeding season, and kits from the previous year (Payne 1984). Breeding occurs in January or February, and the kits are born the following May or June.
Beaver are found throughout the forested regions of Canada. Labrador represents the northernmost extent of 30 beaver distribution in eastern Canada (Banfield 1987). Beaver are found in the southern half of Labrador and throughout Newfoundland. Concentrations of beaver in both Labrador and Newfoundland are lower than in other areas of North America (Novak 1987). The density of beaver in Labrador along the lower Churchill River was 0.04 / km2 (Minaskuat Inc. 2008d). In Newfoundland, beaver density on New World Island was found to be 0.14 / km2 (Payne 1982). 35
Beaver are habitat specialists and modify their environment to their benefit by constructing dams. The construction of dams can modify the landscape by creating ponds and wetlands, and thus their ability to alter the landscape makes them a keystone species. These ponds provide a permanent source of surface water, secure location for their lodge, facilitate transportation of food items and provide a means of storing food over the winter months (CWS and CWF 2005, internet site). Locations with extreme annual or seasonal water level 40 fluctuations are not suitable as habitat (Allen 1983), nor will beaver establish colony sites on fast‐flowing streams. Rocky streams are rarely used as habitat nor are large lakes with heavy wave action or water level fluctuations (Novak 1987). Preferred dam sites are located on slow‐flowing streams in narrow valleys with a bedrock foundation (Novak 1987). When establishing dams, beaver preferentially select sites with an abundance of deciduous cover (Northcott 1971) as the primary food is the bark of trees, preferentially aspen 45

Labrador‐Island Transmission Link Environmental Impact Statement Chapter 10 Existing Biophysical Environment
April 2012 Page 10‐154
and birch in Labrador, and trembling aspen in Newfoundland. Northcott (1971) also noted that as a result of sporadic aspen presence, alders were the most important woody food. They will also eat the bark from conifers when deciduous trees are in short supply (Van Gelder 1982). During the summer months, beaver also consume aquatic plants such as pondweed, arrowhead and water lily (Allen 1983).
Habitat Occurrence in the Study Area 5
Habitats that provide foraging, damming, resting, and feeding opportunities for beaver are preferred. In areas of lower productivity that may be found in southern Labrador (i.e., lower quality food sources), beaver are less selective regarding species of forage (Gallant et al. 2004). Willow and alder thickets at the mouths of tributaries and small creeks were described as the best beaver habitat along the lower Churchill River (Northland Associates 1980a). 10
Wildlife habitat surveys conducted in conjunction with the ELC field surveys (Stantec 2010e) indicated that Wetlands was the only habitat in which evidence of the presence of beaver was collected in Central and Southeastern Labrador. Beaver sign was recorded in two of 19 Wetlands sampled.
Observations of beaver lodges and dams were also recorded during aerial surveys along the proposed highway route as a part of the EA for the TLH3 (Happy Valley‐Goose Bay to Cartwright) (Newfoundland and Labrador 15 Department of Works, Services and Transportation (NLDWST) 2003) which overlaps with a portion of the Central and Southeastern Labrador region. The data indicated that although beaver were regionally common, beaver activity varied considerably but was greatest in association with smaller waterbodies and streams with deciduous trees (aspen and birch) nearby.
Helicopter surveys conducted in the lower Churchill River watershed in October 2006 (Minaskuat Inc. 2008d) 20 found active beaver colonies in 17% (9 of 63) of the survey blocks. Sections of the survey along the Churchill River (in the vicinity of the existing transmission lines) had higher incidence of occupancy (1.67 colonies/block) compared to riparian sections along the lower Churchill River (0.53 colonies / block). This density was relatively low compared to studies elsewhere in North America (Minaskuat Inc. 2008d). Most beaver habitat in the survey area was classed as medium to poor quality. During a late winter / early spring furbearer habitat use 25 survey conducted in the lower Churchill River valley, only two instances of beaver browsing were encountered along 85 km of transects (Sikumiut 2007).
In Newfoundland, relatively little work has been conducted in regards to the distribution and abundance of beaver within the vicinity of the Study Area. Wildlife habitat surveys conducted in conjunction with the ELC field surveys (Stantec 2010a) indicated that Wetlands was the only habitat in which evidence of the presence 30 of beavers was collected, in two of 55 Wetlands sampled.
Limiting Factors
The main way in which human activities affect beaver abundance is through trapping. Trapping may be a limiting factor for beaver abundance in Labrador as they are a mainstay of the fur industry and increased access to remote areas may increase mortality and reduce abundance (Nalcor 2009). Beaver numbers in 35 Labrador declined during the nineteenth and early twentieth centuries as a result of heavy trapping pressure (Budgell 1981). The population began to recover in the 1950s. The total number of beaver pelts sold in NL in 2006 was 2,633 (Table 10.3.6‐2) (Statistics Canada 2008, internet site).
Beaver abundance is also affected by a variety of natural factors. This species is prey for several predators including wolf, lynx, river otter and Great Horned Owl (Forbes and Theberge 1996; Reid et al. 1994; Payne 1985). 40
The results of surveys conducted in the lower Churchill River watershed in 2006 (Minaskuat Inc. 2008d) indicated that beaver in this region were restricted to habitat near water with the presence of deciduous vegetation. This combination of habitat attributes is uncommon in NL and may indicate that the availability of suitable beaver habitat may be a limiting factor for beaver populations. Payne (1985) suggested that winter starvation might be a

Labrador‐Island Transmission Link Environmental Impact Statement Chapter 10 Existing Biophysical Environment
April 2012 Page 10‐155
more common source of natural mortality for beaver in Newfoundland than previously suspected. This may relate to the sparse supply of deciduous trees for winter food.
Porcupine
Life History
The porcupine is the second largest rodent in the province. It is a slow moving animal that is protected by 5 quills. Porcupines feed on a wide variety of plants and their diet changes over the course of the year (Speer and Dilworth 1978). During late spring, summer and early fall, they feed mainly on the ground on herbaceous vegetation. At this time of the year, they wander over fairly large areas. From late fall through early spring, porcupine switch from herbaceous vegetation to the bark of various woody species. In late fall they become more arboreal, spending much of their time in trees. They also become more sedentary at this time. Porcupine 10 have a low birth rate compared to other rodents and produce only one young per year (CWS and CWF 2001b, internet site). Young porcupine are precocious, are able to follow their mothers soon after birth, and are weaned within two weeks (Banfield 1987).
Porcupines are present in all Canadian provinces and territories with the exception of Prince Edward Island (Banfield 1987). In NL, they are only present in Labrador (CWS and CWF 2001b, internet site) and are absent 15 from the northern‐most portions of Labrador (Banfield 1987).
Porcupine habitat preference changes seasonally. During the summer months, they use a wide variety of habitat types, but in the winter they tend to remain in forested habitat (Banfield 1987; Woods 1973). The size of porcupine summer home range varies geographically. Summer home ranges in central Labrador (average size 569 ha) were found to be approximately 10 times larger than those in southern parts of the porcupine’s 20 range (average 67 ha) (Schmelzer and Fenske, n.d.). Winter home ranges were found to be of similar size in the northern and southern populations. The large difference in summer home range size was attributed to lower habitat quality in Labrador, which is near the northern limit of the porcupine’s range (Schmelzer and Fenske, n.d.).
Porcupine abundance in south‐eastern Labrador appears to be increasing following a sharp decline in the 25 1950s and 1960s (NLDWST 2003). Population estimates provided by the NLDEC Wildlife Division in 2009 indicate that the Labrador porcupine population ranged from 2,500 to 10,000 individuals (ACCDC 2009). As of 2005, the population was considered to be high enough to permit a hunting season for porcupine (NLDEC 2007).
Habitat Occurrence in the Study Area 30
There have been several studies conducted on porcupine presence within Central and Southeastern Labrador. The presence of porcupine sign at 11 of 73 locations were identified during wildlife habitat assessments conducted as a part of the ELC field program for the Project (Stantec 2010a). Specifically, evidence of porcupine use in four out of seven habitat types were recorded including Open Conifer Forest, Conifer Forest, Hardwood Forest, and Wetlands. 35
Other studies, including Sikumiut (2007), encountered porcupine tracks at 18 locations along 80 km of transect. Aerial surveys conducted along the route of the TLH3 (Happy Valley‐Goose Bay to Cartwright Junction) which cuts across much of south‐eastern Labrador revealed the presence of porcupine and their sign along the entire highway route (NLDWST 2003). In 2006, Minaskuat Inc. (2008c) documented evidence of porcupine at 128 locations over 323 km of transect in the lower Churchill Valley. 40
Table 10.3.6‐5 presents the list of habitat types present in Central and Southeastern Labrador as identified in the ELC (Stantec 2010a). Four of these habitat types were identified as primary habitat for porcupine including Conifer Forest, Conifer Scrub, Mixedwood Forest, and Open Conifer Forest. Black Spruce and Lichen Forest and Hardwood Forest were identified as secondary habitat. Tertiary habitat included Burn, Lichen Heathland and Wetland. 45
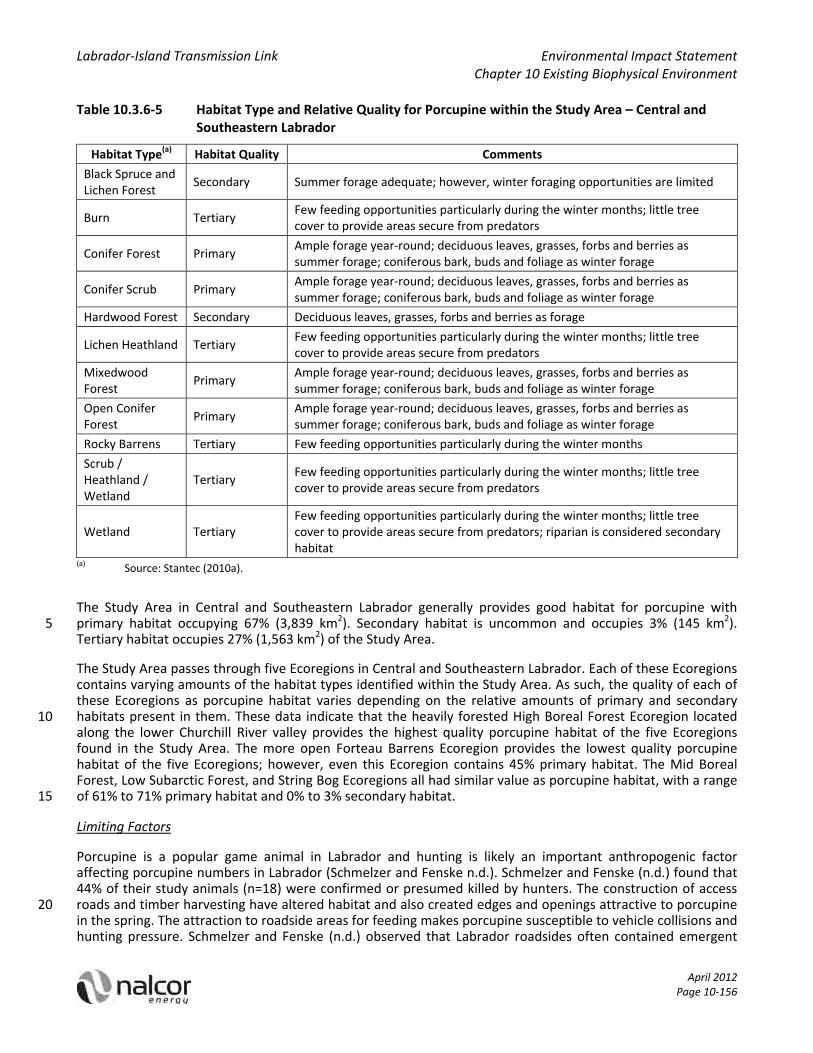
Labrador‐Island Transmission Link Environmental Impact Statement Chapter 10 Existing Biophysical Environment
April 2012 Page 10‐156
Table 10.3.6‐5 Habitat Type and Relative Quality for Porcupine within the Study Area – Central and Southeastern Labrador
Habitat Type(a) Habitat Quality Comments
Black Spruce and Lichen Forest
Secondary Summer forage adequate; however, winter foraging opportunities are limited
Burn Tertiary Few feeding opportunities particularly during the winter months; little tree cover to provide areas secure from predators
Conifer Forest Primary Ample forage year‐round; deciduous leaves, grasses, forbs and berries as summer forage; coniferous bark, buds and foliage as winter forage
Conifer Scrub Primary Ample forage year‐round; deciduous leaves, grasses, forbs and berries as summer forage; coniferous bark, buds and foliage as winter forage
Hardwood Forest Secondary Deciduous leaves, grasses, forbs and berries as forage
Lichen Heathland Tertiary Few feeding opportunities particularly during the winter months; little tree cover to provide areas secure from predators
Mixedwood Forest
Primary Ample forage year‐round; deciduous leaves, grasses, forbs and berries as summer forage; coniferous bark, buds and foliage as winter forage
Open Conifer Forest
Primary Ample forage year‐round; deciduous leaves, grasses, forbs and berries as summer forage; coniferous bark, buds and foliage as winter forage
Rocky Barrens Tertiary Few feeding opportunities particularly during the winter months
Scrub / Heathland / Wetland
Tertiary Few feeding opportunities particularly during the winter months; little tree cover to provide areas secure from predators
Wetland Tertiary Few feeding opportunities particularly during the winter months; little tree cover to provide areas secure from predators; riparian is considered secondary habitat
(a) Source: Stantec (2010a).
The Study Area in Central and Southeastern Labrador generally provides good habitat for porcupine with primary habitat occupying 67% (3,839 km2). Secondary habitat is uncommon and occupies 3% (145 km2). 5 Tertiary habitat occupies 27% (1,563 km2) of the Study Area.
The Study Area passes through five Ecoregions in Central and Southeastern Labrador. Each of these Ecoregions contains varying amounts of the habitat types identified within the Study Area. As such, the quality of each of these Ecoregions as porcupine habitat varies depending on the relative amounts of primary and secondary habitats present in them. These data indicate that the heavily forested High Boreal Forest Ecoregion located 10 along the lower Churchill River valley provides the highest quality porcupine habitat of the five Ecoregions found in the Study Area. The more open Forteau Barrens Ecoregion provides the lowest quality porcupine habitat of the five Ecoregions; however, even this Ecoregion contains 45% primary habitat. The Mid Boreal Forest, Low Subarctic Forest, and String Bog Ecoregions all had similar value as porcupine habitat, with a range of 61% to 71% primary habitat and 0% to 3% secondary habitat. 15
Limiting Factors
Porcupine is a popular game animal in Labrador and hunting is likely an important anthropogenic factor affecting porcupine numbers in Labrador (Schmelzer and Fenske n.d.). Schmelzer and Fenske (n.d.) found that 44% of their study animals (n=18) were confirmed or presumed killed by hunters. The construction of access roads and timber harvesting have altered habitat and also created edges and openings attractive to porcupine 20 in the spring. The attraction to roadside areas for feeding makes porcupine susceptible to vehicle collisions and hunting pressure. Schmelzer and Fenske (n.d.) observed that Labrador roadsides often contained emergent

Labrador‐Island Transmission Link Environmental Impact Statement Chapter 10 Existing Biophysical Environment
April 2012 Page 10‐157
vegetation 7 to 10 days before adjacent forested habitats, and porcupine tended to move into these areas and became vulnerable to hunting. Porcupine have a habit of gnawing wood or any item that has a high salt content such as tool handles, seat backs and even hydraulic lines, as such, they sometimes cause property damage which may result in them being killed as pests.
Lynx 5
Canada lynx is listed as “Secure” provincially (NLDEC 2000, internet site) and not at risk federally (COSEWIC 2011, internet site).
Lynx are tied closely to snowshoe hares, which constitute their primary prey (NLDEC 2011f, internet site; Mowat et al. 2000). Throughout most of their range, lynx densities vary substantially over time and are linked to cycling snowshoe hare populations (Mowat et al. 2000; Boutin et al. 1995). However, lynx are not restricted 10 to snowshoe hares as prey, and they consume other small mammals, carnivores and even ungulates, depending on availability (Murray et al. 2008; Stephenson et al. 1991). Nevertheless, habitat associations for lynx tend to be driven by places where snowshoe hare are found. Studies have identified strong selection for spruce‐fir forests, with a mosaic of both mature and young forests required to meet year‐round habitat requirements (Squires et al. 2010). Lynx spend little time in open habitat and Koehler (1990) suggested that 15 lynx will rarely cross openings >100 m. Mowat et al. (2000) found that although lynx avoided openings, they do move through them.
Denning habitat for lynx tends to be in old forests and dens are associated with patches of fallen and uprooted trees that provide cover and security for kittens (Mowat et al. 2000; Koehler 1990). Although many dens occur in old forests, structural complexity and downed trees appear to be more important than forest age (Murray et 20 al. 2008; Squires et al. 2008).
In general, lynx are considered a resilient species because they have high reproductive potential and good dispersal abilities (Poole 2003). Canada lynx have been described as being sensitive to human disturbance (Apps et al. 2004; Weaver 2001), and increasing road densities may cause range contractions at the southern extent of lynx range in boreal forests (Bayne et al. 2008). The primary threat to lynx may be habitat loss due to 25 deforestation, but range expansion of competing predators (e.g., coyote) associated with development and increasing human presence in lynx habitat also might negatively affect lynx (Bayne et al. 2008; Koehler and Aubry 1994), as may climate change (Murray et al. 2008).
Coyote
The eastern coyote is listed as “Secure” provincially (NLDEC 2000, internet site) and has not been assessed by 30 COSEWIC (COSEWIC 2011, internet site).
The coyote is a relative newcomer to insular Newfoundland, first reported when “wolf‐like dogs” were seen crossing the ice near the Port au Port Peninsula in the spring of 1985 (NLDEC 2011g, internet site). The first confirmed coyote on the Island was a pup hit by a car near Deer Lake in 1987. Blake (2006, internet site) notes that the immigration of coyotes onto Insular Newfoundland has been described as the most significant 35 terrestrial ecological event to occur on the Island since the introduction of moose over 100 years ago.
By the mid‐1990s, coyotes were confirmed throughout most of the Island of Newfoundland and have also been confirmed in central and southern Labrador (NLDEC 2011g, internet site). Coyotes are now considered native to Newfoundland and Labrador because they extended their range naturally and through their own efforts. 40
These carnivores are opportunistic and will eat a wide variety of food items, ranging from fruit and insects to small mammals to large ungulates and livestock, typically consuming items in relation to availability (Wilson and Mittermeier 2009).

Labrador‐Island Transmission Link Environmental Impact Statement Chapter 10 Existing Biophysical Environment
April 2012 Page 10‐158
Coyotes are monogamous, only breeding with one mate at a time. Breeding usually occurs from February to March, producing a litter of 3 to 12 pups about 60 days later in April or May (Blake 2006, internet site). Coyotes do not form packs, but family groups may stay and hunt together for their first winter (NLDEC 2011g, internet site).
Coyotes are territorial and maintain and defend territories (Wilson and Mittermeier 2009), and home range 5 size varies with energetic requirements, physiographic makeup, habitat, and food distribution, and is influenced by social organization. Home ranges of adult paired coyotes are between 140 and 190 km2 (Blake 2006, internet site).
Densities of coyotes varies geographically with food and climate, and seasonally due to mortality, predator density and food abundance (Wilson and Mittermeier 2009), and are considered a pest species in many 10 regions.
Coyotes in Newfoundland are larger than their western counterparts and consequently hunt larger prey (Blake 2006, internet site). Their presence in Newfoundland may be unique in terms of the extirpation of wolves and therefore interactions between coyote and potential prey are likely different than other regions within their range. 15
The role of coyotes as a relatively new predator of caribou in Newfoundland remains unconfirmed. Recent research in Newfoundland has indicated that coyote accounted for 15% of deaths of radio‐collared caribou calves (NLDEC 2009c, internet site); however, data have suggested that calf mortality and resultant poor recruitment is driven by a complex web of predators that includes not only coyote but more importantly, black bear (Blake 2006, internet site) that, along with lynx, could be considered a major predator (Mahoney and 20 Virgil 2003; Snow and Mahoney 1995; Mahoney et al. 1990).
Wolf
Wolves are listed provincially as “Secure” (NLDEC 2000, internet site) in Labrador and extirpated in Newfoundland, and not at risk federally (COSEWIC 2011, internet site). Wolves maintain an important ecological role as top predators and are capable of structuring ecosystems through trophic cascades (Fortin et 25 al. 2005b; Hebblewhite et al. 2005). In addition to their ecological value, wolves have consumptive value within Labrador’s hunting and trapping communities.
Wolves are ecosystem generalists capable of occupying almost any habitat where sufficient prey are available and humans are willing to tolerate wolf presence (Oakleaf et al. 2006; Paquet and Carbyn 2003). Habitat use is strongly affected by abundance and distribution of primary prey, typically ungulates. Wolves prey heavily on 30 moose and caribou in Labrador (Trimper et al. 1996), but may feed on a variety of other prey species opportunistically (Carbyn 1987).
Wolves often select conifer or mixed forest (Paquet and Carbyn 2003; Mladenoff et al. 1995), but also select cut blocks and natural openings under certain circumstances (Houle et al. 2010; Hebblewhite and Merrill 2008). Areas closer to edges between forest and clearcuts or natural meadows and areas with higher ungulate 35 forage biomass might provide the best opportunity to find prey where sufficient cover also is available to facilitate hunting (Houle et al. 2010; Hebblewhite and Merrill 2008).
Gray wolves live in packs, which can include up to 36 individuals, but smaller size packs (5 to 12) are more common, with territories of 75 to 2,500 km2 depending on prey density (Wilson and Mittermeier 2009).
Between April and August, wolves must locate a den for pup‐rearing. Suitable natal den locations tend to occur 40 in sandy or loamy soils and include underground burrows or other sheltered places with higher temperatures and humidity than the surroundings such as hollow logs, spaces between roots of trees, caves or crevices in rocks, abandoned beaver lodges and expanded mammal burrows (Whittington et al. 2005; Paquet and Carbyn 2003). Wolves also have used excavations in snow, surface dens under spruce trees or even in the open,

Labrador‐Island Transmission Link Environmental Impact Statement Chapter 10 Existing Biophysical Environment
April 2012 Page 10‐159
although other types of dens provide better protection for pups from the elements and predators (Paquet and Carbyn 2003).
Wolves appear to be sensitive to human disturbance and therefore are absent from areas with dense human populations or intense agriculture and are prone to extirpation in areas with high livestock density (Oakleaf et al. 2006; Paquet and Carbyn 2003; Mladenoff et al. 1995). The effect of anthropogenic linear features 5 (e.g., roads) on wolves has been well‐studied, and linear features are thought to have an especially important influence on movement and habitat selection. Few areas with wolves in the Great Lakes region had road densities of > 0.45 km/km2 (Mladenoff et al. 1995). Mech et al. (1988) stated that wolves in areas with roads passable by 2‐wheel drive vehicles generally did not occur where road densities were > 0.58 km/km2 and found in their study that no wolves occurred in areas with >0.80 km/km2 of roads. 10
However, the physical presence of roads does not necessarily reduce wolf habitat quality. Rather, human‐caused mortality and disturbance near roads is likely the primary influence of roads on wolves. Thus, human activity that accompanies development must be considered when evaluating habitat suitability for wolves. Indeed, wolves frequently used anthropogenic linear features at night when human activity is low, presumably to take advantage of an easy travel route (Callaghan 2002), and wolves regularly exploit linear features to 15 facilitate travel and hunting efficiency where human use of such features is low (James and Stewart‐Smith 2000).
Small Mammals
Sixteen small mammal species have been recorded in Labrador, fourteen of which are native species (Table 10.3.6‐6). House mouse (Mus musculus) and Norway rat (Rattus norvegicus) are introduced species that 20 are typically restricted to areas of human habitation. Eleven small mammal species have been recorded in insular Newfoundland (Table 10.3.6‐6). Only four of the small mammal species found in Newfoundland are native, including meadow vole, little brown bat (Myotis lucifugus subsp. atrata), northern long‐eared bat (Myotis septentrionalis), and hoary bat (Lasiurus cinereus). The remaining seven species are accidental or deliberate introductions. 25
The lower small mammal species richness in Newfoundland is attributable to the isolation of Newfoundland from continental North America and the relatively poor dispersal capabilities of terrestrial small mammal species. Eastern red bat (Lasiurus borealis) is listed as occurring in Newfoundland accidentally. The breeding range of eastern red bats in Atlantic Canada extends to Nova Scotia and these migratory bats can be blown off course by storms and extralimital occurrences occur regularly (Broder et al. 2003). 30
Figure 10.3.6‐6 shows the locations of the 19 trapping sites that are located within the same Ecoregions that the Study Area crosses. Data collected from these trapping sites are summarized in Table 10.3.6‐7 for Labrador and Table 10.3.6‐8 for Newfoundland.
Seven of the 16 small mammal species recorded historically in Labrador have been captured during the Small Mammal Monitoring Network program between 2007 and 2009 (Rodrigues 2010). Six of these species have 35 been captured at the trapping sites found within the Ecoregions crossed by the Project (Table 10.3.6‐7). The program was not designed to collect information on bat species, and most of the trapping sites are primarily forested areas, including mature, regenerating, and pre‐commercially thinned stand types, as well as bog and barren areas.
40

Labrador‐Island Transmission Link Environmental Impact Statement Chapter 10 Existing Biophysical Environment
April 2012 Page 10‐160
Table 10.3.6‐6 Small Mammal Species in Newfoundland and Labrador
Species Common Name Labrador Newfoundland
Rattus norvegicus Norway rat Non‐native Non‐native
Microtus pennsylvanicus Meadow vole Native Native
Mus musculus House mouse Non‐native Non‐native
Myotis lucifugus subsp. atrata Little brown bat Native Native
Peromyscus maniculatus Deer mouse Native Non‐native (Introduced prior to 1968)
Clethrionomys gapperi Southern red‐backed vole Native Non‐native (First recorded in 1999)
Clethrionomys glareolus Northern bank vole Not present Non‐native (Exotic / alien)
Sorex cinereus Masked shrew Native Non‐native (Introduced in 1958)
Microtus chrotorrhinus Rock vole Native Not present
Phenacomys ungava Eastern heather vole Native Not present
Condylura cristata Star‐nosed mole Native Not present
Zapus hudsonius Meadow jumping mouse Native Not present
Napaeozapus insignis Woodland jumping mouse Native Not present
Dicrostonyx hudsonius Labrador collared lemming Native Not present
Synaptomys borealis Northern bog lemming Native Not present
Sorex hoyi Pygmy shrew Native Not present
Sorex palustris Water shrew Native Not present
Lasiurus cinereus Hoary bat Not present Native
Myotis septentrionalis Northern long‐eared bat Not present Native
Lasiurus borealis Eastern red bat Not present Accidental
Source: NLDEC (n.d. a, internet site); Chubbs and Phillips (2005); van Zyll de Jong (1975).

!(
!(
!(
!(
!(
!(
!(
!(
!(
!(
!(
!(
!(!(
!(
North Pond
Springdale
Goose Pond
Main River
Squid Cove
Parke Lake
Sandy Badger
Crooked Pond
Salmon River
Forkin Bridge
Port Blandford
Innu SouthSide
Anne Marie Lake Ship Harbour
Head
Trans-LabradorHighway
0 50 100
Kilometres
FIGURE 10.3.6-6
Small Mammal Monitoring Network Trapping Sites
FIGURE ID: HVDC_ST_372
±
Transmission Corridor
!( Small Mammal Monitoring Sites
Study Area by Region
Central and Southeastern LabradorNorthern PeninsulaCentral and Eastern NewfoundlandAvalon Peninsula
A t l a n t i cO c e a n
G u l fo f
S t . L a w r e n c e
S t r a i t o f B e l l e I s l e
Q U E B E CL A B R A D O R
N E W F O U N D L A N D
Source: Rodrigues (2010)

Labrador‐Island Transmission Link Environmental Impact Statement Chapter 10 Existing Biophysical Environment
April 2012 Page 10‐162
Table 10.3.6‐7 Small Mammal Species Captured in Central and Southeastern Labrador by the Small Mammal Monitoring Network (2007 to 2009 Surveys)
Site
Bog Lemming Heather Vole Masked Shrew Meadow
Jumping Mouse Meadow Vole Red‐backed Vole Unknown
Mean Total
Captured (2007, 2008, 2009)
Mean
Number
Cap
tured
Percent of To
tal
Cap
tured
Mean
Number
Cap
tured
Percent of To
tal
Cap
tured
Mean
Number
Cap
tured
Percent of To
tal
Cap
tured
Mean
Number
Cap
tured
Percent of To
tal
Cap
tured
Mean
Number
Cap
tured
Percent of To
tal
Cap
tured
Mean
Number
Cap
tured
Percent of To
tal
Cap
tured
Mean
Number
Cap
tured
Percent of To
tal
Cap
tured
Ann Marie Lake
1 1 — — — — — — — — 77 81 18 19 95
Forkin Bridge Road
— — — — 2 11 — — — — 9 52 7 52 18
Innu South Side
1 1 — — 3 4 — — — — 65 91 4 6 71
Parke Lake
10 11 6 6 4 4 — — 0.3 0.3 74 77 4 4 96
Ship Harbour Head
‐ ‐ 3 21 0.3 2 2 14 5 33 5 29 — — 16
Trans‐Labrador Highway
— — — — 1 23 0.3 10 — — 2 67 — — 3
Species Total
12 4 9 3 9 3 3 1 6 2 231 76 33 11 302
Source: Rodrigues (2010).
Note: “—” indicates species not captured at trapping site.

Labrador‐Island Transmission Link Environmental Impact Statement Chapter 10 Existing Biophysical Environment
April 2012 Page 10‐163
Table 10.3.6‐8 Small Mammal Species Captured in Newfoundland by the Small Mammal Monitoring Network (2007 to 2009 Surveys)
Site
Masked Shrew Meadow Vole Red‐backed Vole
Mean Total Captured
(2007, 2008, 2009)
Mean Number Captured
Percent of Total
Captured
Mean Number Captured
Percent of Total
Captured
Mean Number Captured
Percent of Total
Captured
Crooked Pond 40 43 0.3 0.3 52 56 92
Goose Pond 3 11 — — 23 90 25
Main River 2 6 — — 33 94 35
North Pond 29 70 0.3 1 13 30 42
Port Blandford
9 41 1 5 11 54 21
Salmon River 19 100 — — — — 19
Sandy Badger 1 6 0.3 2 11 92 12
Springdale 13 50 0.3 1 13 49 26
Squid Bay 18 91 2 9 — — 19
Species Total 133 46 4 1 155 53 291
Source: Rodrigues (2010).
Note: “—” indicates species not captured at trapping site.
The data for Central and Southeastern Labrador (Table 10.3.6‐7) demonstrate that southern red‐backed vole is 5 by far the most abundant small mammal species in the Ecoregions crossed by the Project. Other species recorded in this region of Labrador during the monitoring program in descending order of abundance included northern bog lemming (Synaptomys borealis), eastern heather vole (Phenacomys ungava), masked shrew (Sorex cinereus), meadow vole, and meadow jumping mouse (Zapus hudsonius). Deer mouse (Peromyscus maniculatus), which was recorded at other trapping sites in Labrador (not included in the table), was not 10 recorded in the Central and Southeastern region in the Small Mammal Monitoring Network program.
The Small Mammal Monitoring Network data indicate that southern red‐backed vole and masked shrew are widely dispersed throughout Central and Southeastern Labrador. However, the other four species captured in this region tended to be patchily distributed throughout the landscape, which is probably reflective of their preferred habitat distribution in the region. Simon et al. (1998) found that meadow voles were more restricted 15 in distribution relative to other small mammal species in Labrador, perhaps due to stricter habitat requirements. Simon et al. (1998) also noted that masked shrews were more restricted in their distribution in comparison to other small mammal species which appears to be contrary to the results obtained by the Small Mammal Monitoring Network.
A comparison of overall small mammal abundance in the region’s trapping sites over the period from 2007 to 20 2009 indicates that small mammal abundance has generally decreased over the three year period, with the highest rate of decline occurring between 2008 and 2009. Total small mammal captures for these sites has declined from 566 in 2007 to 31 in 2009 (Rodrigues 2010). Population declines in this area occurred in all the species captured with the exception of meadow jumping mouse. The low population levels present in 2009 are believed to be the lowest point in the current population cycle and may place pressure on furbearers and 25 other predators that feed heavily on small mammals (Rodrigues 2010). Alternative prey species for these predators may also come under increasing pressure.

Labrador‐Island Transmission Link Environmental Impact Statement Chapter 10 Existing Biophysical Environment
April 2012 Page 10‐164
Small mammal trapping was conducted as part of the wildlife habitat associations surveys conducted along the lower Churchill River valley in 2006 (Minaskuat Inc. 2008c). A total of 238 small mammals were collected over 4,758 trap nights of effort. Southern red‐backed vole was the most frequently captured small mammal (70% of captures), followed by masked shrew (13%), woodland jumping mouse (Napaeozapus insignis) (10%) and meadow vole (7%). Most captures were in the wet spruce forest habitat, the most heavily sampled habitat 5 type. Mixed (fir dominant) habitat had the highest capture rate for southern red‐backed vole and masked shrew. Mixed (spruce dominated) habitat had the second highest capture rate for southern red‐backed vole.
Meadow vole and woodland jumping mouse appeared to prefer some deciduous cover, as they were both captured most often in mixed (deciduous dominant) habitat.
Four of the eleven small mammal species historically recorded in Newfoundland have been captured during 10 the Small Mammal Monitoring Network program between 2007 and 2009, including southern red‐backed vole, meadow vole, deer mouse, and masked shrew. All of these species, with the exception of deer mouse, have been captured at the trapping sites within the Ecoregions crossed by the Study Area (Table 10.3.6‐8). The data for Newfoundland shows that southern red‐backed vole and masked shrew were the most abundant small mammal species in the Ecoregions crossed by the Study Area. Meadow voles only averaged 1% of the total 15 number of animals captured between 2007 and 2009. Masked shrew was found in all of the trapping sites, while southern red‐backed vole was found in most of the sites, with exception of the two trapping sites located at the northern end of the Northern Peninsula. Meadow vole was also widely distributed and was found in six of the nine trapping sites. The program was not designed to collect information on bat species, and most of the trapping sites are primarily forested areas, including mature, regenerating, and pre‐commercially 20 thinned stand types, as well as bog and barren areas.
A comparison of overall small mammal abundance in the selected Newfoundland trapping sites over the period from 2007 to 2009 indicates that small mammal abundance has generally decreased between 2007 and 2008 and recovered to 2007 levels in 2009. This trend was not as well defined as the trend noted in Labrador for the same period. There was more variation between trapping sites and the overall trends for southern red‐25 backed vole, meadow vole, and masked shrew were different, unlike the pattern in Labrador where almost all species declined in unison.
In Newfoundland, southern red‐backed vole abundance increased steadily over 2007 to 2009. Masked shrew abundance decreased steadily over the three years and meadow vole abundance remained relatively stable. The steady increase in southern red‐backed vole abundance may be attributed to the rapid and continuing 30 colonization of Newfoundland by this species. A small mammal survey in Gros Morne National Park in 2001 did not confirm the location of red‐backed vole at that time (GMNP 2002). Meadow vole was also absent from the survey. Between 2007 and 2009, the range of this species expanded at a rate of up to 90 km per year (Rodrigues 2010). It is believed that all of Newfoundland will be colonized by southern red‐backed voles by 2013 (Rodrigues 2010). Note that populations of meadow vole may be negatively affected by the recent 35 occurrence of red‐backed vole on the Island (Morris 1969). Red‐backed vole may also be used as a source of food for marten (NLDEC 2011e).
Representative Small Mammal Species
Two species of vole, the meadow vole and southern red‐backed vole, were selected as representative species of small mammals. These two species were selected because they occupy specific niches, and their populations 40 reflect natural disturbances and habitat changes. The native meadow vole has historically been an important prey source for Newfoundland marten (Folinsbee et al. 1973). In more recent years, the southern red‐backed vole, has garnered more attention as its distribution across Newfoundland is currently expanding (following its relatively recent introduction), and it now also represents an important prey species for the Newfoundland marten (Hearn et al. 2006). Both species are native to Labrador and are found throughout the Central and 45 Southeastern Labrador region in suitable habitat. Protective cover is an essential habitat requirement of both southern red‐backed voles and meadow voles and they may co‐exist in an area, but occupy slightly different microhabitats.

Labrador‐Island Transmission Link Environmental Impact Statement Chapter 10 Existing Biophysical Environment
April 2012 Page 10‐165
Southern Red‐backed Vole
Life History
The southern red‐backed vole is an omnivorous microtine rodent with a varied diet. In spring, new plant shoots are consumed with the addition of berries in the summer and seeds in the fall (Nature Works 2010, internet site). Foods such as fungi, insects, carrion, bark, and roots are consumed opportunistically at any time 5 (Nature Works 2010, internet site).
Breeding takes place between April and October and three to four litters are born each year. Litter size varies from one to eight with an average size of five (Banfield 1987). The young are weaned between 17 and 21 days of age and the young of the spring litter can have their first litter when they are four months old. Southern red‐backed vole has a lifespan of approximately 10 to 20 months (Nature Works 2010, internet site). 10
The home range of the southern red‐backed vole varies seasonally. They may be as large as 3.6 acres in the summer and as small as 0.3 acres in the winter (Banfield 1987). Southern red‐backed vole populations fluctuate widely between years; however, unlike the meadow vole, there does not appear to be a periodicity to their population fluctuations (Banfield 1987). Measured population densities have varied between 0.17 and 4.42 animals per acre (Banfield 1987). It is estimated that the population of southern red‐backed voles in NL is 15 in excess of 1 million individuals (ACCDC 2008, internet site).
Southern red‐backed vole is found throughout Labrador in suitable habitat (Garland 2008). This species is not native to insular Newfoundland, but was introduced in the recent past. The first southern red‐backed vole was found near Little Grand Lake in 1999. It is not known whether it was introduced deliberately or accidentally (Hearn et al. 2006). Since it was discovered, the distribution of the southern red‐backed vole has increased 20 dramatically, and it is currently present throughout Newfoundland with the exceptions being the northern end of the Northern Peninsula (Rodrigues 2010) and the Avalon Peninsula (Garland 2008).
The southern red‐backed vole occupies a variety of habitat types; however, coniferous and mixedwood forest and bogs are the preferred habitats (Nature Works 2010, internet site). Within these habitats, southern red‐backed vole tend to select areas with rotten logs, stumps and brush piles that provide cover for travel, 25 nesting and foraging (Simon et al. 1998). Southern red‐backed vole use both mature and immature forest stands and have been shown to be common in clear‐cuts in western Labrador (Simon et al. 2002). The availability of water is important to this species and they seldom wander far from streams, springs or bogs (Banfield 1987). Small mammal trapping along the lower Churchill River (Minaskuat Inc. 2008c) found that southern red‐backed vole were most frequently captured in wet spruce forest and least frequently in dry 30 spruce forest. Simon et al. (1998) found that southern red‐backed vole in Labrador were associated with older, moist forests and less associated with areas having much lichen cover.
Habitat Occurrence in the Study Area
Table 10.3.6‐9 summarizes primary, secondary and tertiary habitat quality for southern red‐backed vole. Primary habitat includes Black Spruce and Lichen Forest, Conifer Forest, Conifer Scrub, Mixedwood Forest and 35 Cutover and comprises 2,288 km2 (39%) of the Study Area in Central and Southeastern Labrador and 3,871 km2 (36%) in Newfoundland. Secondary habitat is represented by Kalmia Lichen / Heathland, Open Conifer Forest and Scrub / Heathland / Wetland. The remaining Habitat Types in Table 10.3.6‐9 were classified as tertiary, based on limited foraging, nesting, protection or resting opportunities.
40

Labrador‐Island Transmission Link Environmental Impact Statement Chapter 10 Existing Biophysical Environment
April 2012 Page 10‐166
Table 10.3.6‐9 Habitat Type and Relative Quality for Southern Red‐backed Vole within the Study Area
Habitat Type Habitat Quality Comments
Alpine Vegetated Tertiary Negative associations for this species in areas with much lichen coverage (Simon et al. 1998)
Black Spruce and Lichen Forest
Primary
This habitat type would provide conifer seeds as food source; percent ground cover / debris and percent canopy cover would vary from stand to stand and therefore, some of these stands may provide suitable habitat
Minaskuat Inc. (2008c) identified relatively high abundance in this habitat
Burn Tertiary Coarse woody debris necessary for visual cover (Simon et al. 1998)
Conifer Forest Primary Species most abundant on older successional sites in western Labrador; importance of fallen logs (Minaskuat Inc. 2008c; Simon et al. 1998)
Conifer Scrub Primary Sites may be important if enough moisture and course woody debris are available to provide cover and nest sites (Simon et al. 1998)
Cutover Primary In central Labrador, species captured most often in clear‐cut sites (Simon et al. 2002)
Exposed Bedrock Tertiary Necessary cover, forage and nesting material not present
Hardwood Forest Tertiary Necessary cover, forage and nesting material not present
Kalmia Lichen / Heathland
Secondary Cover provided by tree, shrub and ground cover
Lichen Heathland Tertiary Negative associations for this species in areas with much lichen coverage (Simon et al. 1998)
Mixedwood Forest Primary Positive associations for this species found in this forest type in western Labrador with trees >2 m high and containing broad‐leaved shrubs (Simon et al. 1998)
Open Conifer Forest
Secondary Sites may be important if enough moisture and coarse woody debris are available to provide cover and nest sites (Simon et al. 1998)
Rocky Barrens Tertiary Negative associations for this species in areas with much lichen coverage (Simon et al. 1998)
Scrub / Heathland / Wetland
Secondary Scrub habitats preferred as they may provide enough cover for nesting sites (Simon et al. 1998)
Wetland Tertiary Fens not used by this species in western Labrador (Simon et al. 1998)
The southern red‐backed vole is found in suitable habitat throughout southern Labrador (Garland 2008). The Small Mammal Monitoring Network data set indicated that southern red‐backed vole was the most abundant small mammal in south‐eastern Labrador between 2007 and 2009 and was widely distributed through the 5 region (Rodrigues 2010). Southern red‐backed vole were trapped in the lower Churchill River valley in 2002 (IEMR 2003, internet site) and also in the Little Mecatina and St. Augustin River valleys in southern Labrador in 2001 (IEMR 2003, internet site).
Primary southern red‐backed vole habitat is found in varying proportions across Ecoregions crossed by the Study Area in Central and Southeastern Labrador, ranging from 8% to 72%. The heavily forested High Boreal 10 Forest Ecoregion had the highest proportion of primary habitat (72%) of the five Ecoregions found in this region, while the more open Forteau Barrens Ecoregion had the lowest proportion of primary habitat (8%). The String Bog Ecoregion, which contains large tracts of Open Wetland habitat, also contained relatively little primary habitat for southern red‐backed vole (36%).

Labrador‐Island Transmission Link Environmental Impact Statement Chapter 10 Existing Biophysical Environment
April 2012 Page 10‐167
Southern red‐backed vole has been recorded in the southern portion of the Northern Peninsula in the vicinity of the Main River; however, they have not been recorded near the northern end of the peninsula (Rodrigues 2010). The habitat modelling conducted (Stantec 2011f, 2010e) indicates that there is suitable habitat for this species on the Northern Peninsula and given the rapid range expansion of this species, it is anticipated that this area will be colonized by this species within a few years (Rodrigues 2010). Primary southern red‐backed 5 vole habitat is found in greatest proportions in the Study Area in the Northern Peninsula Forest Ecoregion (34%). The Strait of Belle Isle Ecoregion which is characterized by the presence of extensive barrens, had the lowest proportion of primary habitat (15%) of the three Ecoregions found on the Northern Peninsula.
In the Central and Eastern Newfoundland region of the Study Area, the southern red‐backed vole has been documented for a number of years (Rodrigues 2010). Of the three Ecoregions present along this portion of the 10 Study Area, the Central Newfoundland Forest Ecoregion has the highest proportion of primary habitat (45%). The more open Long Range Barrens and the Maritime Barrens Ecoregions contain relatively little primary southern red‐backed vole habitat at 10% and 22%, respectively.
Southern red‐backed vole have not yet been recorded on the Avalon Peninsula; however, given their current rate of range expansion they can be expected to colonize this area within a few years (Rodrigues 2010). Two 15 Ecoregions are present along the portion of the Study Area that passes through this region, the Maritime Barrens Ecoregion and the Avalon Forest Ecoregion. The Avalon Forest Ecoregion contains the highest proportion of southern red‐backed vole primary habitat (55%). and the Maritime Barrens Ecoregion contains 37% primary habitat for this species.
Limiting Factors 20
Southern red‐backed vole may be adversely affected by human activities such as forest harvesting although study results are conflicting. Forest harvesting usually results in a long‐term reduction in southern red‐backed vole densities (Martell 1983; Martell and Rudvanyi 1977; Sim and Bucker 1973). Other studies have shown that in some instances southern red‐backed vole abundance may increase temporarily within the first two years following logging as the voles feed on logging slash (Monthey and Soutiere 1985). Simon et al. (2002) found 25 that southern red‐backed vole were more numerous in clear‐cut areas in western Labrador than in other forest stands. This finding is supported by the presence of coarse woody debris which is important to southern red‐backed vole for travel, nesting and foraging (Simon et al. 1998). Preservation of coarse woody debris during timber harvesting can help reduce the adverse effects on small mammal populations (Simon et al. 2002).
Natural disturbances such as fires have effects on small mammals similar to forest harvesting with a decrease 30 in abundance following forest burning (Sim and Bucker 1973). Southern red‐backed vole is considered an important prey source for predators such as marten and red fox. Predation by these and other species can affect the abundance of southern red‐backed vole. Conversely, fluctuations in the populations of important prey species, such as the southern red‐backed vole, can affect the abundance of predator species.
Meadow Vole 35
Life History
The meadow vole is one of many small mammal species present in Labrador, but is the only native terrestrial small mammal species in Newfoundland. Meadow voles feed primarily on grasses and sedges but will also eat forbs (Banfield 1987) and berries, seeds, insects and snails (NLDEC, n.d. b, internet site). Summer diets usually consist of herbaceous vegetation, but meadow voles will also feed year‐round on plants characteristic of 40 forests (Riewe 1973). Meadow voles may also occasionally scavenge on animal remains (Riewe 1973).
Among mammals, meadow voles have extremely high rates of fecundity. Breeding takes place between April and October and may extend into the winter as late as February if sufficient food is present (Banfield 1987). Under laboratory conditions, as many as 17 litters may be born in a year; however, under natural conditions the average number of litters per year is 3.5 (Banfield 1987). Litter size varies from one to eleven with an 45 average size of six (Banfield 1987). The young are weaned at 12 days of age and juvenile females are able to

Labrador‐Island Transmission Link Environmental Impact Statement Chapter 10 Existing Biophysical Environment
April 2012 Page 10‐168
breed at 25 days of age. Meadow voles have a lifespan of approximately 12 months (NLDEC, n.d. b, internet site).
The home range of the meadow vole varies seasonally, with the largest ranges present in the summer and the smallest in the winter. Home ranges have been calculated to be between 0.08 and 0.23 acres (Banfield 1987). Meadow vole populations fluctuate dramatically in a cyclic manner with peaks of abundance occurring at 5 approximately four year intervals (Banfield 1987). Measured population densities have varied between 15 and 400 animals per acre (Banfield 1987). It is estimated that the population of meadow voles in Labrador is in excess of 1 million individuals while Newfoundland probably supports between 10,000 and 100,000 meadow voles (NLDEC 2005).
Meadow voles are distributed throughout Labrador and Newfoundland, but appear to be patchily distributed 10 across the landscape. Small Mammal Monitoring Network trapping records for 2007 to 2009 revealed the presence of meadow voles in two out of ten trapping sites in Labrador and eight out of fourteen trapping sites in Newfoundland (Rodrigues 2010).
Meadow voles are occasionally found in coniferous forests, barrens and bogs, although they are most often associated with wet meadows and grassland habitats (Sturtevant and Bissonette 1996; Thompson and Curran 15 1995; Folinsbee et al. 1973; NLDEC, n.d. b, internet site). Grass or sedge cover is essential as forage, predator protection and as nesting material (NLDEC, n.d. b, internet site). Abundant woody debris in areas of blowdown and some regenerating cutovers also provide suitable cover and subnivean protection (Adair and Bissonette 1997).
Habitat Occurrence in the Study Area 20
Table 10.3.6‐10 summarizes primary, secondary and tertiary habitat quality for meadow vole. Primary habitat identified for this species includes Conifer Forest, Conifer Scrub, Kalmia Lichen / Heathland, Lichen Heathland, Mixedwood (Labrador), Scrub / Heathland / Wetland and Wetland. Primary habitat occupies 5,356 km2 (93%) of the Study Area in Central and Southeastern Labrador and 8,472 km2 (79%) in Newfoundland. Secondary habitat is represented by Burn, Cutover and Hardwood Forest, which may provide some of the necessary grass 25 or sedge cover depending on individual sites. Remaining habitats in Table 10.3.6‐10 were classified as tertiary, based on limited foraging nesting, protection or resting opportunities.
In Central and Southeastern Labrador, meadow voles were captured in two of the six trapping sites located in the same Ecoregions crossed by the Study Area (Rodrigues 2010). Minaskuat Inc. (2008c) found a total of 17 meadow vole captures over eight study sites in the lower Churchill River valley and it was the least 30 abundant of the four small mammal species captured during the surveys. Meadow voles were most often associated with a deciduous ‐ dominated mixed forest habitat type, but were also detected in both spruce and fir ‐ spruce dominated coniferous forests. This species was also trapped in the Little Mecatina and St. Augustin River valleys in southern Labrador (IEMR 2003, internet site). The meadow vole is found throughout southern Labrador, often in open habitats with herbs and grasses (Simon et al. 1998). 35
The habitat modelling results indicate that most of the habitat within the Central and Southeastern Labrador portion of the Study Area is primary meadow vole habitat. The proportion of primary habitat ranged from 92% to 97% of the Study Area in the five Ecoregions crossed.
Folinsbee et al. (1973) reported that meadow voles were found throughout the Northern Peninsula, although they tended to be scarce and found mainly in grassy areas. The Small Mammal Monitoring Network data 40 indicate that meadow voles are present in the Northern Peninsula, but their distribution during the sampling period (2007 to 2009) was patchy (Rodrigues 2010). As in Labrador (and the remainder of Newfoundland), a high abundance of primary habitat is distributed throughout the Northern Peninsula portion of the Study Area, where primary habitat ranges between 78% and 89% in the various Ecoregions represented. Secondary and tertiary meadow vole habitat in this region is negligible, peaking at 5% in the represented Ecoregions. 45

Labrador‐Island Transmission Link Environmental Impact Statement Chapter 10 Existing Biophysical Environment
April 2012 Page 10‐169
Table 10.3.6‐10 Habitat Type and Relative Quality for Meadow Vole within the Study Area
Habitat Type Habitat Quality
Notes
Alpine Vegetated Tertiary Few grasses and sedges available for forage, cover and nesting material
Black Spruce and Lichen Forest Tertiary Few grasses and sedges available for forage, cover and nesting material
Burn Secondary
In Labrador, at least one of these sites was a recent burn with early successional plant species present
Some meadow voles found on recent burns in western Labrador (Simon et al. 1998)
Conifer Forest Primary Grass and sedge species available for forage, cover and nesting material
Conifer Scrub Primary Conifer areas preferred as few grasses and sedges available for forage, cover and nesting in tuckamore
Cutover Secondary Few grasses and sedges available for forage, cover and nesting Exposed Bedrock Tertiary Small amounts and few species of grasses and sedges
Hardwood Forest Secondary Few grass and sedge species present
Kalmia Lichen / Heathland Primary
Several grass and sedge species provide forage, cover and nesting material
Moisture present
Lichen Heathland Primary Lack of moisture / water and cover are limiting factors for this species (Raphael 1987; Reich 1981; Birney et al. 1976)
Mixedwood Forest Primary
Primary for Labrador more so than for Newfoundland
Several grass and sedge species to provide forage, cover and nesting material
Moisture present
Open Conifer Forest Primary
Primary for Labrador more so than for Newfoundland
Few grass and sedge species present in this forest type in Newfoundland; however, grass and sedge found in Labrador
Rocky Barrens Tertiary Lack of moisture / water and cover are limiting factors for this species (Raphael 1987; Reich 1981; Birney et al. 1976)
Scrub / Heathland / Wetland
Primary (conifer); Tertiary (tuckamore)
Grass and sedge species available for forage, cover and nesting material
This habitat type was mapped conservatively as primary habitat
Wetland Primary Grass and sedge species available for forage, cover and nesting material
In Central and Eastern Newfoundland, the Small Mammal Monitoring Network monitors small mammals annually at five sites within the Ecoregions crossed by the Study Area. Over the course of three years, meadow voles were trapped at all of these sites except one, although meadow vole abundance was low compared to 5 southern red‐backed vole or masked shrew (Rodrigues 2010).

Labrador‐Island Transmission Link Environmental Impact Statement Chapter 10 Existing Biophysical Environment
April 2012 Page 10‐170
Primary meadow vole habitat is also abundant in the Central and Eastern Newfoundland portion of the Study Area. Seventy‐six percent of the Study Area in the Central Newfoundland Forest Ecoregion (4,501 km2) was rated as primary habitat, and that of the relatively minor Ecoregions (i.e., Long Range Barrens and Maritime Barrens) were similarly high (87% and 85%, respectively). Secondary meadow vole habitat is generally low, and is most common in the Central Newfoundland Forest (17%). Tertiary habitat was found only in the Maritime 5 Barrens Ecoregion (2%).
The meadow vole is found throughout the Avalon Peninsula (Garland 2008) and abundant primary habitat is available. The Maritime Barrens Ecoregion comprises 87% of this region of the Study Area, of which 76% is comprised of primary habitat for meadow vole. Seventy‐four percent of the Study Area within the Avalon Forest Ecoregion (making up the remaining 13% of the Study Area region) provides additional primary habitat 10 for this species (74% of 233 km2). Secondary habitat quality is found in much smaller proportions in the two Ecoregions (6% to 12%). Tertiary habitat quality ranges from 0.3% to 5% of the Study Area within the two Ecoregions.
Limiting Factors
Interspecies competition with the recently introduced southern red‐backed vole (Hosett and Steen 2007) may 15 prove to be a limiting factor for the meadow vole (Hearn et al. 2006; Morris 1969; Cameron 1964). Prior to the southern red‐backed vole introduction, meadow vole was the primary small mammal prey species for some predators in Newfoundland (Sturtevant et al. 1996). Capture numbers, as indicated by the efforts of the Small Mammal Monitoring Network (Rodrigues 2010), of both vole species over the last few years have yielded no discernable decline in meadow vole numbers although southern red‐backed vole numbers have increased 20 substantially during the same period.
Meadow voles may be affected by habitat alteration in a number of ways. Monthey and Soutiere (1985) and Martell and Rudvanyi (1977) noted that meadow vole abundance increased following logging when slash was present, and Meadow vole abundance was higher than in either unlogged sites or sites in the early stages of forest succession. Sim and Bucker (1973) found that meadow vole abundance increased following forest 25 burning while other species, including southern red‐backed vole, masked shrew and deer mouse, decreased in abundance following fire. A study on the effects of habitat disturbances on small mammals demonstrated that meadow voles were more abundant along habitat edges than in the habitat interior (Pasitscniack‐Arts and Messier 1998).
Meadow voles are considered an important prey source for predators such as marten and red fox. Predation 30 by these and other species can affect the abundance of meadow voles. Conversely, the pronounced cyclic variations in meadow vole abundance can affect the abundance of the predators that feed on meadow voles.
Aboriginal Ecological Knowledge
AEK regarding furbearers and other small mammals in parts of the Study Area was obtained through interviews completed with Labrador Innu and land and resource use interviews with members of the 35 NunatuKavut Community Council. This is listed below (Table 10.3.6‐11), and includes information on habitat, behaviour, diet, hibernation, their presence in the proposed transmission corridor, health of the population, fluctuations in population size, and disease. The information provided is generally in keeping with the scientific data obtained through the field studies and literature review conducted for the EA (as reported in Section 10.3.6.2). 40

Labrador‐Island Transmission Link Environmental Impact Statement Chapter 10 Existing Biophysical Environment
April 2012 Page 10‐171
Table 10.3.6‐11 Aboriginal Ecological Knowledge of Furbearers and Small Mammals in the Study Area
Group Source Quote (Direct and / or Indirect)
Labrador Innu
Labrador Innu Traditional Knowledge Committee Member, January 26, 2007 (p. 46)(a)
Direct/Indirect
Ushakamishku ‐ ‘where there is always beaver’. These are places where there are lots of alder and willow bushes as well as birch and spruce trees that beaver like to eat. The beaver’s favourite food is willow, alder and ushkatamui, the rhizome of ushteshu (waterlily). “Ushkatamui is like cabbage for the beaver” (P1.26.1.07).
Labrador Innu Traditional Knowledge Committee Member, February 7, 2007 (p. 46)(a)
Direct/Indirect
Sometimes beavers move to new areas because the water is “no good” at their ponds. “After they create the reservoir, the trees die, like burned wood. There’s lots of food there for the beavers. When searching for beaver, you look for signs up a river, such as cuttings. In the spring, they peel the bark off black spruce and other trees” (P4.7.2.07).
Labrador Innu Traditional Knowledge Committee Members, Various Dates, 2006 (p. 46)(a)
Indirect
ITKC members said that in the old days, amishku (beaver) were found during the spring at the mouths of every brook along Mishta‐shipu (Traverspine River), and these are too shallow for beaver lodges, so they would have to travel up the brooks a little, looking for ponds with beavers in them (P1.19.11.06). Nonetheless, some particularly good beaver hunting and trapping areas were identified in the Mishta‐shipu valley including a small channel behind an island on the north side of Mishta‐shipu across from the mouth of Ushkan‐shipiss (P7.20.11.06), along the lower reaches of Manitu‐utshu‐shipiss, as well as about three kilometres up Kamitinishkau‐shipiss and Tepiteu‐shipu. A narrow channel of water, disconnected from Mishta‐shipu, just upstream of Kaishipanikau, was also considered a hotspot. Four of five lodges had been found in this location (P7.20.11.06). There are river channels near the mouth of Manatueu‐shipiss (Traverspine River) that were good for beaver, and three lodges were located there at one time (P7.28.11.06).
Labrador Innu Traditional Knowledge Committee Member, November 28, 2006 (p. 61)(a)
Indirect
Amishku (beaver) eat birch, mitush (trembling aspen), balsam fir, black spruce, tamarack, and alders. Trembling aspen is the most favourite food. He eats the fresh grass in the spring. They also eat ushkatamui (water lily rhizome) (P1.28.11.06).
Labrador Innu Traditional Knowledge Committee Member, November 28, 2006 (p. 61)(a)
Indirect
Amishku (beaver) eat utshashku (muskrat) sometimes. The reason for this is because in the early spring, when the animals run out of food, the beaver may find a muskrat in its lodge, and will kill and eat it. Same thing with otters; they may kill and eat young beavers (P3.28.11.06).

Labrador‐Island Transmission Link Environmental Impact Statement Chapter 10 Existing Biophysical Environment
Table 10.3.6‐11 Aboriginal Ecological Knowledge of Furbearers and Small Mammals in the Study Area (continued)
April 2012 Page 10‐172
Group Source Quote (Direct and / or Indirect)
Labrador Innu Traditional Knowledge Committee Member, December 1, 2006 (p. 52)(a)
Indirect
Nipiu‐apukushish (possibly water shrew – Sorex palustris) are seen everywhere in the country. They live in the marshes, and they swim in small ponds. You see their paths, small ones, in the marshes. Foxes eat them. They can be quite large; up to two inches long. They might eat grass (P4.1.12.06).
Labrador Innu Traditional Knowledge Committee Member, December 1, 2006 (p. 52)(a)
Indirect
Tshinishtui‐apikushish (pygmy shrew) are everywhere in the country, especially by brooks. They get into cloth and take it to their nests to keep them warm. That is why they take fur – for warmth. They can damage people’s furs (P4.1.12.06).
Labrador Innu Traditional Knowledge Committee Member, December 5, 2006 (p. 57)(a)
Indirect
Amishku may open their dams a little to let water out, but if the water is low they shut their dams again. They regulate water levels (P3.5.12.06).
Labrador Innu Traditional Knowledge Committee Member, February 12, 2007 (p. 57)(a)
Indirect
Utshashku (muskrat) makes its own den and gathers food under water. They are innishu (‘intelligent’) in order to survive in the winter (P3.12.2.07).
Labrador Innu Traditional Knowledge Committee Member, February 12, 2007 (p. 57)(a)
Indirect
Pishu (lynx) is innishu. It is a night hunter. It sits on the side of uapush (snowshoe hare) paths waiting for them to run by during the night. It can see at night time. Pishu just claws it (P3.12.2.07).
Labrador Innu Traditional Knowledge Committee Members, November 29, 2006 (p. 62)(a)
Indirect
Upau‐apikushish (little brown bat) eats insects, mosquitoes, butterflies; also a stinging insect that has a long barbed tail (that resembles a smoky horntail or pigeon horntail) (P6, P9.29.11.06).
Labrador Innu Traditional Knowledge Committee Member, November 29, 2006 (p. 63)(a)
Indirect
Upau‐apikushish (brown bat) it is a summer animal. It hibernates like a apikushish (mouse). It is related to apikushish (P9.29.11.06).
Labrador Innu Traditional Knowledge Committee Member, December 1, 2006 (p. 60)(a)
Indirect
Matsheshu (foxes) eat nipiu‐apukushish (possibly water shrew – Sorex palustris) (P4.1.12.06).
Labrador Innu Traditional Knowledge Committee Member, November 28, 2006 (p. 60)(a)
Indirect
Kaku (porcupine), pineu (partridge), uapush (snowshoe hare) eat from trees. Partridge eat berries (P1.28.11.06).

Labrador‐Island Transmission Link Environmental Impact Statement Chapter 10 Existing Biophysical Environment
Table 10.3.6‐11 Aboriginal Ecological Knowledge of Furbearers and Small Mammals in the Study Area (continued)
April 2012 Page 10‐173
Group Source Quote (Direct and / or Indirect)
Labrador Innu Traditional Knowledge Committee Members, November 28, 2006 and February 8, 2007 (p. 61)(a)
Indirect
Kaku (porcupine) eats birch, white spruce, black spruce, tamarack, balsam fir, trembling aspen, alders from the river. They eat grasses in the spring – first growth. Regarding trees the porcupine eats branches, needles, and bark. He eats this from the main trunk (P1.28.11.06) Kaku does not kill the trees. He just eats the bark. They eat something inside the bark. They start to eat this in early September. In summer they eat shakau (bush, shrub) and uapikun (flower plant). They eat the buds of shakau before they flower (P4.7.2.07). Kaku also eat mətshəkəssi(a) (an unidentified leafy plant, lacking berries that grows close to the ground). Its leaves look like inniminanakashi (low sweet blueberry) or uishatshiminakashi (redberry) leaves. Kaku eat this after the snow falls, because the plant sticks out, and this is what they eat (P1.8.2.07).
Labrador Innu Traditional Knowledge Committee Member, November 16, 2006 (P. 76)(a)
Direct
“In the spring, you expect some animals to be very thin which is related to them being cold during the winter. Male caribou are thin in early November after rut. I once found a skinny porcupine that had died on the snow, but there was nothing unusual about this. One October, my sons killed a beaver that was very thin by a culvert near Anikutshash‐shipiss (Cache River) on the Trans‐Labrador Highway. It should have been very fat at this time of the year; beavers are normally thin in the spring only. There was something wrong with the beaver” (P1.16.11.06).
Labrador Innu Traditional Knowledge Committee Member, November 16, 2006 (p. 76)(a)
Direct
“Sometimes porcupine populations crash. This is natural. When marten are gone, they come back again the next year. It’s normal that there are more one year than the next” (P1.16.11.06).
Labrador Innu Traditional Knowledge Committee Member, November 28, 2006 (p. 61)(a)
Direct
Maikan (wolf) eat beavers as well. Wolves and bear wait for beaver to leave the water to chew trees and they get them on dry ground” (P3.28.11.06).

Labrador‐Island Transmission Link Environmental Impact Statement Chapter 10 Existing Biophysical Environment
Table 10.3.6‐11 Aboriginal Ecological Knowledge of Furbearers and Small Mammals in the Study Area (continued)
April 2012 Page 10‐174
Group Source Quote (Direct and / or Indirect)
NunatuKavut Community Council
NunatuKavut Land and Resource Use Interview, May 2011
Indirect
Martin, otter, and fox will be found throughout the St. Augustine River area.
NunatuKavut Land and Resource Use Interview, May 2011
Indirect
If there is country and woods in the transmission corridor, then there would be rabbits and porcupines, and nearby locals would hunt in the area.
NunatuKavut Land and Resource Use Interview, 2011
Indirect
Marten are over trapped, and the stock is very low.
NunatuKavut Land and Resource Use Interview, 2011
Indirect
I am sure beaver and fox are around the Kenamish area.
NunatuKavut Land and Resource Use Interview, 2011
Indirect
Most furbearers (e.g., the fox) have a cycle. There may be a lot of fox around one year, and less the next. They say there is a cycle of 7 years. This typically applies to lynx, rabbit, wolves and marten as well.
NunatuKavut Land and Resource Use Interview, 2011
Indirect
You have to be careful with fox sometimes because they can develop rabies, and become very dangerous.
NunatuKavut Land and Resource Use Interview, 2011
Indirect
Furbearers use the transmission link area the same as they use everywhere else.
NunatuKavut Land and Resource Use Interview, May 2011
Indirect
Furbearers like marten, mink, otter, beaver, weasel, and lynx usually live within a relatively small area, maybe within a 100 km radius.
(a) Source: Innu Environmental Knowledge of the Mishta‐shipu (Churchill River) Area of Labrador in Relation to the Proposed Lower Churchill Project (Armitage 2007). Refer to Appendix 10‐1.
Local Ecological Knowledge
LEK regarding furbearers and other small mammals in parts of the Study Area was obtained through conversation with participants of the 2010 Open House in Hawke’s Bay. This is listed below (Table 10.3.6‐12), 5 and includes information on the presence of marten. The information provided is generally in keeping with the scientific data obtained through the field studies and literature review conducted for the EA (as reported in Section 10.3.6.2).
Table 10.3.6‐12 Local Ecological Knowledge of Furbearers and Small Mammals in the Study Area
Community Source Indirect Quote
Hawke’s Bay, NL Labrador‐Island Transmission Link Open House participant, Hawke’s Bay, April 29, 2010
The pine marten has been seen in the Portland Creek Pond area.
10

Labrador‐Island Transmission Link Environmental Impact Statement Chapter 10 Existing Biophysical Environment
April 2012 Page 10‐175
10.3.7 Avifauna
Avifauna is a term used to refer to birds, and in NL this comprises 387 species (Lepage 2010, internet site). The species of avifauna discussed in this section represent terrestrial and aquatic birds, including waterfowl, raptors (also known as birds of prey), upland game birds and passerines that breed near the Project. A concern for various stakeholders, and also discussed in this section, are avifauna species of special conservation status 5 as assessed by the COSEWIC, the federal SARA, and / or the NLESA.
The Province of NL is large and diverse, and as such, supports a variety of avian communities. Many avian species are at the limit of their continental range in the province and their habitat requirements may be more specific than at the core of their distribution (Stantec 2012b, 2010f). Geographic differences within the province, such as elevation, also influence where species are found. The Atlantic Flyway, one of four major 10 North American routes followed by migratory birds, includes NL. The Atlantic Flyway represents a broad front along which a large number of birds predictably fly between northern (summer) and southern (winter) grounds (Welty 1982).
10.3.7.1 Study Area
Existing baseline conditions for avifauna are presented in relation to the proposed transmission corridor from 15 Central Labrador to the Island of Newfoundland’s Avalon Peninsula and a surrounding 15 km wide Study Area, as well as considering the location of other Project‐related components and activities (Figure 10.3.7‐1). As for other components, the nature of the information presented in the following section is primarily based on the specific regions and management units for which data are often presented. Based on a literature review, regional overviews are provided of the abundance and distribution of waterfowl, passerines, raptors, upland 20 game birds and other species for the various regions that the transmission corridor passes through: Central and Southeastern Labrador; the Northern Peninsula; Central and Eastern Newfoundland, and the Avalon Peninsula. Seabirds associated with the Strait of Belle Isle region are discussed in Section 10.5.10 (Seabirds).
10.3.7.2 Information Sources and Data Collection
The following documentation was consulted to assist in the characterization of existing conditions for avifauna 25 within the Study Area:
Avifauna Component Study (Stantec 2012b, 2010f).
Avifauna Component Study Supplementary Report (Stantec 2011g).
Avifauna Component Study – Revised (Stantec 2012b).
Literature review assembled for the Project. 30
Wildlife habitat association and ELC reports, including Labrador‐Island Transmission Link Ecological Land Classification (Stantec 2010a); Vegetation Component Study Supplementary (Stantec 2011b) Report; Wildlife Habitat Associations in the Lower Churchill River Valley (Minaskuat Inc. 2008c) and Reservoir and Transmission Line Wildlife Reconnaissance (Northland Associates Limited 1980d).
Additionally, baseline studies completed in support of other EAs in the province (e.g., NLDWST 2003, 1998; 35 DND 1994) and data provided by the ACCDC (2010, 2008, internet sites) were also reviewed.

"S
"S
FIGURE 10.3.7-1
Avifauna Study Area
±
0 50 100 150
Kilometres
Transmission Corridor
Avifauna Study Area
Central and Southeastern Labrador
Northern Peninsula
Central and Eastern Newfoundland
Avalon Peninsula
Strait of Belle Isle
L A B R A D O RL A B R A D O RQ U E B E CQ U E B E C
Muskrat Falls
FIGURE ID: HVDC_ST_351 SoldiersPond
N E W F O U N D L A N DN E W F O U N D L A N D
G u l f o f
S t . L a w r e n c e
A t l a n t i c O c e a n

Labrador‐Island Transmission Link Environmental Impact Statement Chapter 10 Existing Biophysical Environment
April 2012 Page 10‐177
A number of baseline field studies were completed either recently or in the past in support of the Project for avifauna and used to establish baseline conditions:
Labrador ‐ Island Transmission Link Ecological Land Classification (Stantec 2010a): Habitat Types within a 15 km wide Study Area from Gull Island to Soldiers Pond were surveyed in the summer of 2008. Vegetation, site photographs, site conditions and wildlife suitability data were collected for 404 sites. High‐5 resolution satellite images and aerial photographs were incorporated into a computer‐based GIS and used to define and delineate 15 Habitat Types and several Non‐Habitat Types within the Study Area. Results of the habitat model were later updated for the Labrador portion of the Study Area to accommodate changes in the corridor alignment, beginning at Muskrat Falls (Stantec 2011b).
Waterfowl Surveys (Stantec 2012b, 2010f; AGRA Earth and Environmental Ltd. and Harlequin Enterprises 10 1999): Baseline data collection on waterfowl in 1998 involved a series of aerial surveys of intersecting rivers, aerial block surveys and ground surveys within the lower Churchill River watershed and proposed transmission corridor from Gull Island to Soldiers Pond (Figure 10.3.7‐2). Dedicated surveys on rivers known to support Harlequin Duck (Histrionicus histrionicus) were also conducted.
Passerine Surveys (Stantec 2012b, 2010f): The 2008 avifauna survey focused on passerines throughout the 15 Study Area from Gull Island to Soldiers Pond (Figure 10.3.7‐3). Primary objectives of the survey were to describe the relative distribution and abundance of breeding passerines in relation to the various Ecoregions crossed by the proposed transmission corridor and to assess species‐habitat relationships. The survey included 321 sampling locations across nine Ecoregions in the province.
Raptor Surveys (Stantec 2012b, 2010f; Jacques Whitford 1999): Raptor surveys performed in 1998 focused 20 on identifying Osprey and Bald Eagle nests (including revisiting known sites) along the Project (and adjacent areas), including: the north and south shorelines of the Churchill River, the shoreline of Atikonak Lake and Lac Joseph, the east and north‐west shore of Lac Brule, between Muskrat Falls and Gull Island, Gull Island to Churchill Falls, and specifically relevant to the Project from Gull Island to Soldiers Pond on Newfoundland’s Avalon Peninsula (Figure 10.3.7‐2). 25
Based on the results of the ELC and the wildlife surveys listed above, detailed habitat quality maps were generated for representative species from waterfowl, passerines, raptors, upland game birds and other species of special conservation status in the Central and Southeastern Labrador, Northern Peninsula, Central and Eastern Newfoundland and Avalon Peninsula regions. The maps indicate the amount and distribution of primary, secondary and tertiary quality habitat for each selected species throughout the Study Area (Stantec 30 2012b, 2011g, 2010f). Primary habitat was defined as habitat that provides foraging, protection, nesting and resting habitat, secondary habitat provides an abundance of one or more (or marginal amounts of all) of these elements and tertiary habitat provides marginal foraging, protection or resting opportunities or may be used only during transit. Maps were colour‐coded to reflect habitat quality and indicate the percentage of primary, secondary and tertiary habitat available on an Ecoregion by Ecoregion basis, within each of the larger 35 geographic regions.
Assignment of for habitat quality rating was challenging for some of the selected representative species at the mapping scale necessary for the Project, as their habitat requirements are based on small‐scale and localized biophysical parameters. In these cases, primary, secondary and tertiary habitat were not quantified based on defined Habitat Types. As well, the evaluation and mapping of potential avifauna habitat suitability is, as a 40 result of the nature and extensive geographic scale of the Project and the regional focus of the ELC upon which it is based, intended to give a general overview of the potential for portions of the Study Area to support particular avifauna species. The mapping is not intended to indicate definitively whether a particular species is currently found in a specific location. Rather, it provides a description of the potential use of an area, at a regional scale, across the Study Area. Detailed mapping is available in the Avifauna Component Study (Stantec 45 2012b, 2010f) and the Avifauna Component Study Supplementary Report (Stantec 2011g).

"S
"S
S tr ai t o
f Be l le I s le
5
89
365
8
8
5
4
7 4
10
6
2a
6d
8c
8a
1b 8b
6b
9
4b
4a
2c1d
1a
4c
3
1e
4d
5
1a
6c
7
6a
4c
3
1c
7
2d1f
7
6b
6b
2b
FIGURE 10.3.7-2
Avifauna (Waterfowl and Raptor) Survey Locations (1998)
±
G u l f o f
S t . L a w r e n c e
A t l a n t i c O c e a n
Soldiers Pond
Muskrat Falls
N E W F O U N D L A N D
L A B R A D O RQ U E B E C
0 30 60 90
Kilometres
FIGURE ID: HVDC_ST_347
Ecoregions of NewfoundlandEcoregions of Labrador1 Low Arctic Tundra (Cape Chidley)
2 Arctic Alpine Tundra (Torngat)
3 High Subarctic Tundra (Kingurutik-Fraser)
4 Coastal Barrens (Okak-Battle Harbour)
5 Mid Subarctic Forest (Michikamau)
6 High Boreal Forest (Lake Melville)
7 Mid Boreal Forest (Paradise River)
8 Low Subarctic Forest (Mecatina River)
9 String Bog (Eagle River Plateau)
10 Forteau Barrens
A Serpentine Range SubregionB Corner Brook SubregionC Port au Port SubregionD St. George's Bay SubregionE Codroy SubregionF Bay d'Espoir Subregion
A Northcentral SubregionB Red Indian SubregionC Portage Pond SubregionD Twillick Steady Subregion
C Northern Coastal SubregionB Beaver Brook Limestone SubregionA Coastal Plain Subregion
A Northeastern Barrens SubregionB Southeastern Barrens SubregionC South Coast Barrens SubregionD Central Barrens Subregion
A Southern Long Range SubregionB Buchans Plateau - Topsails SubregionC Northern Long Range Subregion
D Eastern Long Range Subregion
1 Western Newfoundland Forest
2 Central Newfoundland Forest
3 North Shore Forest
4 Northern Peninsula Forest
5 Avalon Forest
6 Maritime Barrens
7 Eastern Hyper-Oceanic Barrens
8 Long Range Barrens
9 Strait Of Belle Isle Barrens
Transmission Corridor By Region
3
3
1998 Avifauna Survey Area
Avalon Peninsula
Central and Eastern Newfoundland
Northern Peninsula
Central and Southeastern Labrador
Source:Newfoundland and Labrador Departmentof Environment and Conservation (2007)