moodscope: building a mood sensor from smartphone usage ... · rice university moodscope: building...
TRANSCRIPT

RICE UNIVERSITY
MoodScope: Building a Mood Sensor from Smartphone Usage Patterns
by
Robert LiKamWa
A THESIS SUBMITTED IN PARTIAL FULFILLMENT OF THE REQUIREMENTS FOR THE DEGREE
Master of Science
HOUSTON, TEXAS April 2012

ABSTRACT
MoodScope: Building a Mood Sensor from Smartphone Usage Patterns
by
Robert LiKamWa
MoodScope is a first-‐of-‐its-‐kind smartphone software system that learns the
mood of its user based on how the smartphone is used. While commonly available
sensors on smartphones measure physical properties, MoodScope is a sensor that
measures an important mental state of the user and brings mood as an important
context into context-‐aware computing.
We design MoodScope using a formative study with 32 participants and
collect mood journals and usage data from them over two months. Through the
study, we find that by analyzing communication history and application usage
patterns, we can statistically infer a user’s daily mood average with 93% accuracy
after a two-‐month training period. To a lesser extent, we can also estimate Sudden
Mood Change events with reasonable accuracy (74%). Motivated by these results,
we build a service, MoodScope, which analyzes usage history to act as a sensor of
the user’s mood. We provide a MoodScope API for developers to use our system to
create mood-‐enabled applications and create and deploy sample applications.

Acknowledgments
First and foremost, I acknowledge Dr. Lin Zhong for his wonderful
mentorship over the past two years. Under his guidance, I have grown significantly
as a researcher. I am very fortunate to be a part of the Rice Efficient Computing
Group. I would like to thank all of the members of the group, especially Clayton
Shepard and Ahmad Rahmati, whose LiveLab Logger provided the foundation for
my usage logging software in this project. Special thanks also goes to Felix Xiaozhu
Lin, who gave me great research experience by providing me the opportunity to
work on his Reflex project, which was my first graduate research project.
For his support throughout this project, I thank Yunxin Liu, who advised me
and supported me during my internship at Microsoft Research Asia, where this
project began. His guidance helped me carry out high quality research in the
MoodScope project. Many thanks also go to collaborator Nic Lane for his insight and
contribution into our project. His expert suggestions provided a significant amount
of depth to the work.
Back at Rice, I’d like to recognize my Payday Lunch Collaboration, consisting
of Jason Holloway, David Ramirez, and Zhiyong Tan, for our ongoing fellowship.
Every payday, we trade the responsibility of finding a new Houston lunch location
and paying for the meal. We have exchanged many a lively conversation over these
meals and I always look forward to these days of camaraderie. I also deeply thank
my close friends Kathryn Powell and Michael Rog for supporting me at all times and
keeping my life in order.

iv
Most importantly, I profusely thank my parents Patrick and Micheline
LiKamWa for encouraging me to be observant, curious, ambitious, and independent
from an early age. I would be nowhere without their unfailing support in all of my
endeavors, big and small.
I also acknowledge the Rice University Electrical and Computer Engineering
Department, the Texas Instruments Graduate Fellowship, and the National Science
Foundation for academically and financially supporting my graduate career.
Contents
Acknowledgments ...................................................................................................... iii
Contents ..................................................................................................................... v
List of Figures ............................................................................................................ viii
List of Tables ............................................................................................................... ix
Introduction ................................................................................................................ 1
The Science of Mood & Related Work ......................................................................... 6
2.1. The Science of Mood ................................................................................................ 7
2.2. Related Work ........................................................................................................... 9
2.2.1. Recognizing Emotions from Voice and Video .................................................... 9
2.2.2. Alternative Physiological Signals ..................................................................... 10
2.2.3. Leveraging Signals from Smartphones ............................................................ 10
2.2.4. MoodScope’s advantage ................................................................................. 11
User Study and Data Collection ................................................................................. 13
3.1. Participants ............................................................................................................ 13
3.2. Pre-‐Study Focus Group .......................................................................................... 14
3.2.1. Results: Mood Changes/Mood Sharing ........................................................... 14
3.3. Field Study .............................................................................................................. 16
3.3.1. Mood Journaling Application .......................................................................... 17
3.3.2. Smartphone Interaction Logger ...................................................................... 18
3.4. Post-‐Study Focus Group ......................................................................................... 18
3.4.1. Results: Effective Mood Collection .................................................................. 19
3.5. Characteristics of User Mood Entries ..................................................................... 20
3.5.1. Response Rate ................................................................................................. 21
3.5.2. Daily Mood Persistence ................................................................................... 21
3.5.3. Mood Distribution ........................................................................................... 22
3.6. Smartphone Usage Data ........................................................................................ 23
The Design of MoodScope Training Models .............................................................. 24
4.1. Mood Averages as MoodScope Output ................................................................. 25
vi
4.2. Usage Records as MoodScope Input ...................................................................... 25
4.2.1. Social Interaction Records ............................................................................... 26
4.2.2. Routine Activity Records ................................................................................. 26
4.3. Internal Model of MoodScope ............................................................................... 28
4.3.1. Multi-‐Linear Regression ................................................................................... 28
4.3.2. Sequential Forward Selection of Features ....................................................... 29
4.3.3. Personalized Mood Model .............................................................................. 30
4.3.4. All-‐User Mood Model ...................................................................................... 32
4.3.5. Discriminative Features ................................................................................... 34
4.3.6. Positively and Negatively Correlated Features ................................................ 36
4.4. Beyond Daily Mood ................................................................................................ 37
4.4.1. Raw Input Estimation ...................................................................................... 38
4.4.2. Sudden Mood Change Detection .................................................................... 38
4.5. Summary of MoodScope Design ............................................................................ 41
Mood Inference Engine ............................................................................................. 43
5.1. Inference on the Phone ......................................................................................... 44
5.2. Application Programming Interface ....................................................................... 46
5.3. Performance .......................................................................................................... 46
5.3.1. Cloud-‐side Modeling Performance .................................................................. 46
5.3.2. Phone-‐side Inference Performance ................................................................. 47
5.3.3. Communication Overhead .............................................................................. 47
Mood-‐Enabled Applications ...................................................................................... 48
6.1. MoodScope Social Sharing App .............................................................................. 48
6.2. Windows Phone Mockups ...................................................................................... 50
6.2.1. Mood Browser ................................................................................................. 50
6.2.2. Mood Music Player .......................................................................................... 50
6.2.3. Mood Sharing Application ............................................................................... 51
6.2.4. General Feedback ............................................................................................ 51
Discussion and Future Work ...................................................................................... 52
Conclusion ................................................................................................................ 55

vii
References ................................................................................................................ 56

List of Figures
Figure 2.1 -‐ Circumplex mood model .................................................................................7
Figure 3.1 -‐ User Interface for mood journaling and mood history ..................... 16
Figure 3.2 -‐ Distribution of user mood entries, grouped by time-‐of-‐day .......... 22
Figure 4.1 -‐ A user’s daily pleasure averages and MoodScope’s estimation ..... 30
Figure 4.2 -‐ User distributions of squared error. ....................................................... 30
Figure 4.3 -‐ Distribution Functions of Mean-‐Squared-‐Error. ................................. 31
Figure 4.4 -‐ Decrease of MSE as features are added. ................................................. 31
Figure 4.5 -‐ Number of features in reduced feature tables. .................................... 33
Figure 4.6 -‐ Number of most discriminative features in each category. ............. 33
Figure 4.7 – Percentage of users with relevant features in each category. ....... 33
Figure 4.8 -‐ Percentage of features that positively correlate. ................................ 36
Figure 5.1 -‐ Mood Inference Engine ................................................................................ 42

ix
List of Tables
Table 4.1 -‐ Feature Table of Usage Histograms ........................................................... 28
Table 4.2 -‐ Confusion Matrix of Sudden Mood Change Detection ......................... 39
Table 4.3 -‐ Confusion Matrix of Positive Sudden Mood Change Detection ........ 39
Table 4.4 -‐ Confusion Matrix of Negative Sudden Mood Change Detection ....... 39
Table 5.1 -‐ Mood Inference Engine API Specification ............................................... 45

1
Chapter 1
Introduction
Mood is an affective state that plays a significant role in our lives, influencing
how we behave and make decisions, driving social communication, and shifting our
consumer preferences. But in the digital realm of mobile devices, there is a distinct
lack of knowledge about mood unless manually provided. While devices have many
sensors to understand the physical world around them, they are unable to develop
insight about the object that matters the most: the user. We consider the
implementation of a mood sensor as a vital next step in enhancing the context-‐
awareness of mobile devices.
There are numerous ways to employ mood information. Video and music
recommender systems such as Netflix or Spotify would benefit from using mood as
an input to their recommendation algorithms. By knowing the user’s mood and
building preferences based on previously selected items, these providers could
recommend different media to match the user’s current mood. While the system can
2
ask the user to supply their mood, an automatic mood sensor will significantly
improve the system’s usability.
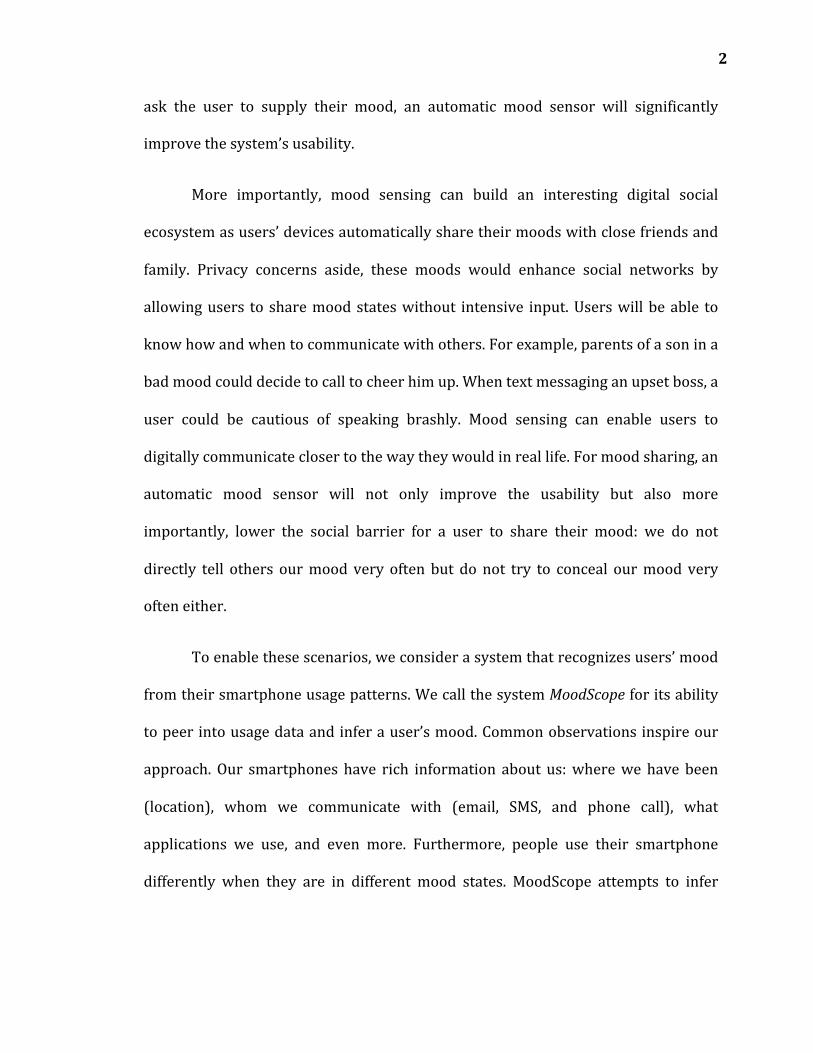
More importantly, mood sensing can build an interesting digital social
ecosystem as users’ devices automatically share their moods with close friends and
family. Privacy concerns aside, these moods would enhance social networks by
allowing users to share mood states without intensive input. Users will be able to
know how and when to communicate with others. For example, parents of a son in a
bad mood could decide to call to cheer him up. When text messaging an upset boss, a
user could be cautious of speaking brashly. Mood sensing can enable users to
digitally communicate closer to the way they would in real life. For mood sharing, an
automatic mood sensor will not only improve the usability but also more
importantly, lower the social barrier for a user to share their mood: we do not
directly tell others our mood very often but do not try to conceal our mood very
often either.
To enable these scenarios, we consider a system that recognizes users’ mood
from their smartphone usage patterns. We call the system MoodScope for its ability
to peer into usage data and infer a user’s mood. Common observations inspire our
approach. Our smartphones have rich information about us: where we have been
(location), whom we communicate with (email, SMS, and phone call), what
applications we use, and even more. Furthermore, people use their smartphone
differently when they are in different mood states. MoodScope attempts to infer
3
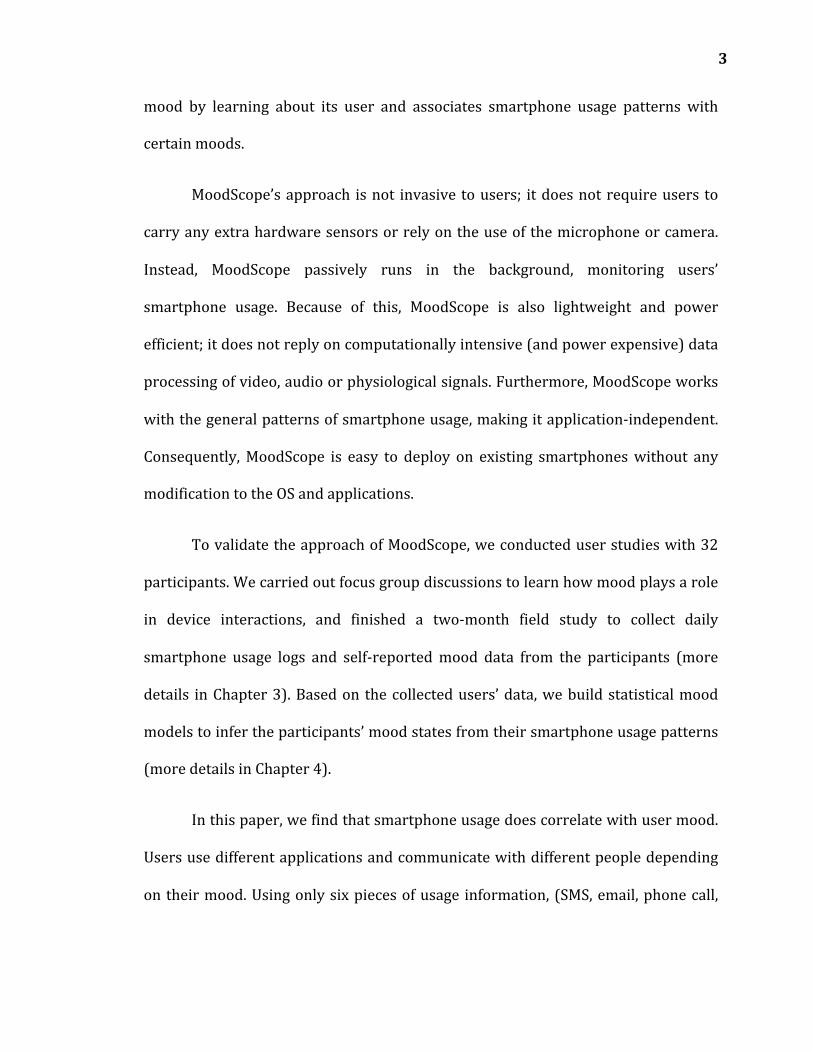
mood by learning about its user and associates smartphone usage patterns with
certain moods.
MoodScope’s approach is not invasive to users; it does not require users to
carry any extra hardware sensors or rely on the use of the microphone or camera.
Instead, MoodScope passively runs in the background, monitoring users’
smartphone usage. Because of this, MoodScope is also lightweight and power
efficient; it does not reply on computationally intensive (and power expensive) data
processing of video, audio or physiological signals. Furthermore, MoodScope works
with the general patterns of smartphone usage, making it application-‐independent.
Consequently, MoodScope is easy to deploy on existing smartphones without any
modification to the OS and applications.
To validate the approach of MoodScope, we conducted user studies with 32
participants. We carried out focus group discussions to learn how mood plays a role
in device interactions, and finished a two-‐month field study to collect daily
smartphone usage logs and self-‐reported mood data from the participants (more
details in Chapter 3). Based on the collected users’ data, we build statistical mood
models to infer the participants’ mood states from their smartphone usage patterns
(more details in Chapter 4).
In this paper, we find that smartphone usage does correlate with user mood.
Users use different applications and communicate with different people depending
on their mood. Using only six pieces of usage information, (SMS, email, phone call,

4
application usage, web browsing, and location), we can build statistical usage
models to estimate mood.
We build a general mood model to infer all participants’ daily-‐average mood
with only 66% accuracy. However, when we personalize the system, building and
testing a model on a participant’s data, we report 93% accuracy on average. This
result suggests that mood inference classifier should be trained on personal data.
Besides inferring users’ daily mood, we can also detect when users’ moods suddenly
change with 74% accuracy.
We provide an implementation of MoodScope as a system service and
describe an API to be used by applications. We develop mood-‐based applications to
show how to provide personalized mood-‐enabled services.
Overall, our experience suggests that it is possible to build a “mood sensor”
from smartphone usage patterns. Our main contributions of this paper are as
follows:
• We demonstrate the feasibility of inferring mood from smartphone usage,
paving the way for energy-‐efficient, privacy-‐preserving systems that
automatically infer user mood. Validated with a two-‐month dataset collected
from 32 users, our system, MoodScope, can estimate users' daily mood averages
with an accuracy of 93% and can detect sudden mood changes with a lower but
still meaningful accuracy, 74%.
• The unprecedented data from 32 users also allows us to make novel discoveries
regarding mood and mood inference: We show that how mood affects
5
smartphone usage is particular to the user; a general model performs
significantly worse than personalized models. We show that categorized
application usage and phone calls are strong indicators of mood for our
participants.
• We describe a lightweight, power-‐efficient, and easy to deploy realization of
MoodScope, including an Application Programming Interface (API) for
developers to interface with the inferred mood. Using the API, we develop and
deploy sample mood-‐enabled applications.
The thesis is organized as follows. In Chapter 2 we provide background on
how mood is measured in psychology research and survey the related work. In
Chapter 3 we describe and evaluate our user studies and how we collect field data.
In Chapter 4 we present the design of MoodScope and how we build mood models
for users. We demonstrate how to build a mood inference engine and provide a
mood API in Chapter 5 and showcase mood-‐based applications in Chapter 6. We
discuss limitations of the paper and future work in Chapter 7 and conclude in
Chapter 8.

6
Chapter 2
The Science of Mood & Related Work
In this chapter, we provide background regarding how mood is measured in
psychology research and survey related work in inferring the mental state of a
human user.

7
2.1. The Science of Mood
Mood is an affective state and has been extensively studied in psychology [2,
3]. Mood is related but different from another important affective state, emotion, in
several important aspects [3]. First, mood is typically less intensely felt by an
individual, while an emotion tends to lasts longer than emotion, e.g., lasting for days
or hours instead of minutes or seconds. Second, mood is normally a reaction to a
cumulative sequence of events while emotion is a more spontaneous reaction or
feeling caused by a specific event. Finally, mood is more private while emotion is
more visible to others. Due to its long-‐lasting and private nature, mood reflects the
underlying feelings of people.
Psychology research has proposed and extensively validated several models
to describe and measure affect. For our goal, we have considered three popular
Figure 2.1 -‐ Circumplex mood model

8
approaches and eventually employ the Circumplex mood model [30], which employs
a small number of dimensions to describe and measure mood. As shown in Figure
2.1, the model consists of two dimensions: the pleasure-‐displeasure dimension and
the degree-‐of-‐arousal dimension. The pleasure dimension measures how one feels,
from positive to negative. The activeness dimension measures whether one is likely
to take an action under the mood state, from active to passive. As demonstrated in
[30], users are able to accurately and consistently place discrete affects in the two-‐
dimensional space. The Circumplex model has also been well validated and widely
used in other studies [5, 31, 34, 37, 38]. We choose to use the Circumplex model
because it is simple, quick to administer, and describes a wide range of mood states.
This makes it suitable for our extensive field study, where the participants are asked
to input their moods multiple times a day.
Another common approach to describe affect is through the use of discrete
categories [9, 35]. For example, a very popular example is Ekman’s six basic
categories: happiness, sadness, fear, anger, disgust and surprise [9]. This approach
is intuitive and matches people’s daily experience well. However, the basic
categories fail to cover a full range of people’s affect displays and it is hard to decide
a common set of independent discrete mood categories. It is also hard to quantify
affect with the approach of discrete categories.
Yet another approach used in psychology is the Positive and Negative Affect
Schedule (PANAS) [8, 37] model. The PANAS model is based on the idea that it is
possible to feel good and bad at the same time [18]. Thus, positive and negative

9
affect should be separately tracked. To perform a measurement, the PANAS model
uses a checklist to measure affect from various aspects. A typical checklist often
consists of more than 20 items [37]. Apparently, the PANAS model is very complex
and the complexity makes it difficult for the participants to provide frequent mood
inputs in both field studies and practical deployment.
2.2. Related Work
In the remainder of this chapter, we survey existing automated approaches
for affect recognition. These methods are mostly sensor-‐based techniques, often
relying on mining speech or facial expressions.
2.2.1. Recognizing Emotions from Voice and Video
Existing work in affect recognition focuses primarily on the recognition of
emotions [36, 39]; and does so largely by leveraging the visual [7, 10, 27] and
acoustic [20, 32] signals found in the speech, actions and faces of people. While
authors sometimes use emotion and mood interchangeably, they almost always
measure transient affective states, not moods. For example, Mood Meter [25]
detects smiles using campus video cameras. But momentary smiles tell us little
about long-‐term mood states unless the larger temporal dynamics of such signals
are considered. Moreover, the facial or spoken expressions of people may not reflect
their true feelings due to professional or social reasons (e.g., to be polite). Finally,
video and audio methods are not suited to the objectives of MoodScope due to the
10
sensing and computational burden they place on a smartphone. Even monitoring
and classifying audio alone can consume around 335 mW continuously (comparable
to sampling raw GPS data) [22].
2.2.2. Alternative Physiological Signals
Physiological indicators offer a more honest signal of how we feel. For
example, skin conductance, heart rate, breath rate, blood pressure and skin
temperature all offer difficult-‐to-‐fake indications of our affective states. A variety of
prototypes leverage such signals (e.g., [1, 13, 28]). The key limitation in this
approach is that it requires additional hardware. This limits the range of
applications to only those that users believe are high utility (e.g., medical) to
compensate for the burden.
2.2.3. Leveraging Signals from Smartphones
Smartphones offer a rich set of user signals that only recently are beginning
to be explored for affect recognition. For example, EmotionSense [29] proposes a
complete end-‐to-‐end smartphone platform by performing audio-‐based emotion
recognition. However, to the best of our knowledge, no existing smartphone system
leverages a broad set of features based on user/smartphone interaction to recognize
affective states. The most closely related systems to MoodScope thus far are [4, 19,
21]. In [19] users emotions are classified based on their typing characteristics.
However, the relationships identified in the typing study have not been clearly
validated as only a single user is studied. In [4], smartphone usage patterns are used

11
to model personality. While the same source of data is exploited, [4] and MoodScope
infer completely different user characteristics with different modeling challenges –
unlike personality, which is constant for each user, moods change frequently. In our
workshop paper [21], we did some initial investigations on inferring users’ mood
from smartphone interactions. This thesis goes significantly further in its
methodologies, realization, and evaluation.
The bulk of existing smartphone affect-‐related research uses the phone as a
data collection tool. A variety of applications have been developed and released as
part of large-‐scale projects to better understand affect in non-‐laboratory settings.
For example, researchers in the UK are investigating user geospatial happiness with
the “mappiness” application, released for Apple iPhones [24]. Another iPhone
application, “gottaFeeling”, allows users to track and share their feeling to improve
their relationships [14]. These (and other) emotion-‐related smartphone
applications do not study mood inference. However, they do provide considerable
motivation for MoodScope as they highlight the willingness and interest of the
public to track and share affective states.
2.2.4. MoodScope’s advantage
Rather than sampling new high-‐density signals and/or requiring additional
equipment, MoodScope exploits pre-‐existing usage patterns of an individual. By
avoiding invasive image and audio data we are able to design a mood recognition

12
engine on current smartphone OSes, able to run continuously in the background
without compromising phone battery life.

13
Chapter 3
User Study and Data Collection
In order to distill the design requirements of MoodScope and to collect user
data under realistic settings, we conducted a longitudinal user study with 32 iPhone
users from China and the USA. The user study consisted of one field study and two
focus group discussions. The field study lasted more than two months in which we
collected a user’s mood and their smartphone usage patterns. Two focus group
discussions, before and after the study, were conducted to gain subjective insights.
3.1. Participants
We recruited 32 participants for our user study. All are existing iPhone users.
26 of the users are college and graduate students but the rest covers a diverse set of
occupations including two software engineers, one web editor, one salesman and
one teacher. They aged between 18 and 29 with 11 females. 25 of the participants
14
were recruited in Beijing, China with advertisements on online forums. The
remaining seven participants were recruited at a US university. Only the
participants from Beijing took part in the two focus group discussions. Every
participant was compensated for RMB500 or $75 USD and became eligible for an
iPad 2 raffle after completion of the study.
3.2. Pre-‐Study Focus Group
We designed a two-‐part pre-‐study focus group to gain motivation and
intuition of automatic mood inference and to gather insight into what data we
should collect from the phones. The first part dealt with the impact of mood changes
on smartphone usage habits. To this end, we asked the participants whether they
use different applications or communicate with different people depending on their
mood.
The second part of the focus group asked for the participants’ opinions on
mood sharing. We asked how they would publish their mood, with whom they
would share their mood, when they would like others to see their mood, whose
moods they would be interested in seeing, how they would like their phone to
automatically adapt to their mood, and how sharing mood would affect their life.
3.2.1. Results: Mood Changes/Mood Sharing
Results from the pre-‐study focus group confirm that smartphone usage
patterns change with mood changes. All but one of the participants told us that they

15
use different applications and/or communicate with different sets of people
depending on their mood. They also reported several mood-‐driven smartphone
usage changes that were not logged in our field study, such as altering ringtones and
wallpapers. All but one of the participants indicated that they would like their
smartphone to automatically change with their moods, e.g., changing color schemes,
reordering applications, and notifying them when their mood changes.
The focus group also showed that most of the participants thought that mood
sharing would be valuable. All but one of the participants responded that they
would like to publish their mood through micro-‐blogs, instant messenger, or other
applications. All of the participants indicated that they would like to share their
mood within certain social circles, e.g., friends or co-‐workers. All participants were
interested in seeing others’ mood, particularly the mood of their friends. One
participant even responded that he would like to know everyone’s mood, including
the mood of strangers around him. Most participants mentioned that sharing mood
would have very positive impacts on their lives, e.g., sharing happiness with friends
or getting rid of bad moods with help from friends.
The results are highly motivational for automatic mood inference, using
usage data already available in smartphones. Because smartphone usage patterns
fluctuate as mood changes, it should be feasible to infer users’ mood changes by
observing their smartphone interaction patterns. The results also highlight that
users do want to use their mood information in various ways, such as sharing mood
with friends and changing smartphone settings based on mood. Therefore, it is

16
valuable if our system can automatically infer users’ mood so that users do not need
to manually share their mood or change the settings of their smartphone.
3.3. Field Study
The field study collected real-‐world data from all 32 participants for over two
months so that we can study the correlation between mood and smartphone
Figure 3.1 -‐ User Interface for mood journaling (top) and mood history (bottom)

17
interactions in order to build MoodScope. The study involves two pieces of custom
developed software: a mood journaling application and a background logger, shown
in Figure 3.1.
3.3.1. Mood Journaling Application
We developed an iPhone application that allows users to report their mood
conveniently. The top picture in Figure 3.1 shows the primary GUI of the Mood
Journaling Application. Two input bars allow the user to set their mood along the
previously described Circumplex pleasure and activeness dimensions. For sake of
simplicity, each bar limits the users to one of five options; and to prevent confusion,
we intentionally omit showing numbers. As the user inputs a mood, it is represented
as a bouncing cartoon face in the center of the screen. As the pleasure bar is
changed, the facial expression and color of the face changes. As the activeness bar is
changed, the speed of the bouncing movement changes. We allow users to see their
previous inputs through a calendar mode (shown on the bottom in Figure 3.1) and
also through a chart mode. To minimize the influence of previous inputs on users’
mood, the input history is shown in a different GUI and not provided to users when
they input their mood.
Users are asked to input their mood at least four times a day, with at least
three hours between each input. This is motivated with a star achievement system,
which gives a user a star for an input if their last star was given more than three
hours prior. The user can gather up to four stars per day and is notified through
18
smartphone alerts when a star is available. This star system enables us to regularly
capture a user’s self-‐reported mood.
3.3.2. Smartphone Interaction Logger
We created a logger to collect a participant’s smartphone interaction to link
with the collected moods. Our logger, similar to the one used by the authors of [33],
captures user behavior by using daemons operating in the background, requiring no
user interaction. The data is archived nightly to a server over a cell data or Wi-‐Fi
connection.
Using this tool, we gather relevant information with the intention of creating
feature tables for our mood models. Application usage, phone calls, email messages,
SMSes, web browsing histories, and location changes are collected as user behavior
features. We ensure that user privacy is properly protected, hashing all private user
data, e.g., contact identifiers used in phone calls and SMSes.
3.4. Post-‐Study Focus Group
After the field study, we conducted another focus group discussion with the
Beijing participants to ask for their opinions regarding the usability and
effectiveness of our mood journaling application. We asked them whether the
application is easy to use, whether four times mood input per day is too frequent,
and how likely they immediately input their mood upon receiving an input
reminder.

19
3.4.1. Results: Effective Mood Collection
In the post-‐study focus group we received positive user feedback, which
demonstrated the effectiveness of our field study in collecting users’ daily mood
data.
Overall, participants found our mood journaling application to be user-‐
friendly. All but one of the participants told us that the mood journal application is
easy to use. (The other participant had suffered a bug of our application, which we
fixed once it was reported.) Users felt that the mood journaling application imposed
very little burden and felt they were able to provide accurate and timely mood data.
Only three of the participants reported that prompting for four mood inputs per day
was too frequent. Two of them explained that their mood didn’t change quickly and
preferred fewer inputs per day. These participants suggested other approaches,
such as inputting mood only when the system thinks the mood has changed. All but
one of the participants stated that they entered their mood immediately after
receiving a reminder at least 50% of the time. The main reasons for non-‐immediate
inputs were that the participants were busy or that it was not convenient to input
their mood when they received a reminder.
We observed one significant limitation of our mood journaling application.
Some participants reported that entering mood with our system could not cover
their affective changes; sometimes their affective state could change faster than
every three hours. While we realized that some users might occasionally have such

20
rapid affective changes, we chose the three-‐hour mood input interval because our
primary focuses were to minimize participant burden of entry and capture long-‐
lasting mood states. From the focus group consensus, our mood journaling tool was
highly effective at achieving these specific goals.
3.5. Characteristics of User Mood Entries
Although the user response to our mood journaling system was highly
positive, we wanted to quantitatively understand the user response to our mood
journaling system. This would further prove the effectiveness of our collection as
well as motivate the design of our mood modeling. We investigate various aspects of
the self-‐reported mood system, including the response rate of the users and the
distribution of the moods entered.
As shown in the user interface displayed earlier in Figure 3.1, users indicate
their mood states with two five-‐level scores representing the two mood dimensions.
For the pleasure dimension, scores of 1-‐5 mean very displeased (P1), displeased
(P2), neutral (P3), pleased (P4) and very pleased (P5). For the arousal dimension,
scores of 1-‐5 mean very inactive (A1), inactive (A2), neutral (A3), active (A4) and
very active (A5).
Although our participants are from two very different countries, we do not
observe any culture difference among their mood entries and smartphone usage

21
data. Thus, unless otherwise stated, we present the aggregated results from all the
participants in this paper.
3.5.1. Response Rate
We first calculated the response rate of the overall mood input, confirming
the reliability of user input into our journaling system. Although we asked users to
enter their mood four times a day, we expected some absence of mood entry due to
the extensive nature of our study. We calculated the daily response rate of our users
and found that over all of the user’s days, 6.6% had only one mood entry, 8.2% had
two entries, 10.2% had three entries, and 75% had four or more entries. We
consider this response rate to be acceptable for our study. This again demonstrates
the effectiveness of our mood journaling application.
3.5.2. Daily Mood Persistence
We next study the persistence of daily user mood to validate the background
research in Chapter 2, which defines mood as a slowly changing affect. We consider
the standard deviation of a user’s mood entries within each day of our dataset. The
average standard deviation of 0.41 supports the existence of an underlying mood, as
it indicates that the mood typically does not waver between any two adjacent mood
levels. That said, the maximum standard deviation within a day is 1.73, indicating
that there are days when large mood swings do occur. For the most part, however,
our persistence finding is consistent with the background psychology research that
states that mood is fairly constant.

22
3.5.3. Mood Distribution
We also analyze the distribution of moods that users enter into the system to
analyze the variation our system would be challenged with estimating. As we
expected, neutral mood states (P3 and A3) occupy a significant percentage of our
dataset. 33.2% of mood entries reported neutral pleasure (P3), and 50.2% of the
mood entries are neutral activeness (A3). Users were generally happy rather than
sad. 44.8% of the total mood entries are pleased (P4) and 11.7% of total mood
entries are very pleased (P5), while only 8.7% and 1.6% of the total mood entries
are displeased (P2) and very displeased (P1).
The mood distributions were fairly consistent during different times,
seemingly unaffected by whether the entry was during workdays, weekends,
mornings, afternoons or evenings. Users were slightly (but not significantly) happier
Figure 3.2 -‐ Distribution of user mood entries, grouped by different times-‐of-‐day. P1-‐P5 are moods entered as “very displeased” to “very pleased”, while A1-‐A5 signify “very inactive” to “very active.”

23
during the weekend than on workdays. The full distribution of moods is presented
in Figure 3.2.
The response rate, mood persistence, and distribution of the entered moods
show MoodScope’s efficacy in collecting a wide variety of moods from the users, and
provide insight into the design of MoodScope.
3.6. Smartphone Usage Data
In total we have collected 15,683 phone calls, 36,989 SMSes, 13,476 emails,
142,633 times of application usage, 27,411 Web visits and 1,146 unique clustered
location records from all the participants. 1,678 unique applications were used
during the whole field study. We use these smartphone usage data and the self-‐
reported mood entries to train mood models in MoodScope.

24
Chapter 4
The Design of MoodScope Training Models
The crux of MoodScope is in its ability to estimate a user’s mood, which we
discuss in this chapter. The data collected from the field study and analysis results
presented in Chapter 3 provide a foundation for us to explore the design of
MoodScope’s models. We use various supervised machine learning techniques to
investigate how a user’s mood can be inferred from usage log analysis. We discuss
the construction of daily mood samples and usage log feature table. We then
construct and evaluate various mood inference models from our collected mood
journals and usage logs.

25
4.1. Mood Averages as MoodScope Output
As explained in Chapter 2, we wish to estimate mood as an underlying affect,
changing slowly over long periods of times. Thus, rather than directly using single
mood inputs, we first separate the mood inputs into their two dimensions and
average all inputs in a calendar day. The resulting average moods for each of the
sixty days of training act as sixty pairs of labels for our mood model.
These daily mood averages, if predictable, can serve a number of purposes. In
addition to simply indicating the current mood of a user, a regression of daily mood
averages can indicate when a user’s mood is different from normal. A robust
estimation of daily mood averages serves as the output of MoodScope’s Mood
Inference Engine.
Daily mood averages, however, have limitations. In particular, daily averages
lack a short time granularity that would be useful for immediate intervention. In
sub-‐section 4.4, we investigate the possibility of estimating user inputs and sudden
mood changes to alleviate this issue.
4.2. Usage Records as MoodScope Input
We build MoodScope’s inference feature table on the usage records collected
by our logger. Literature suggests that mood is strongly correlated with the social
interactions [12] and daily activities [6] of an individual. In our feature table, we
focus on these two categories of mood-‐sensitive behavior: social interaction and
26
routine activity. Our collected data allows us to indirectly observe these patterns
through a variety of social interaction and routine activity relative frequency
histograms.
4.2.1. Social Interaction Records
Collectively, phone calls, text messages (SMS) and emails signal changes in
social interaction. We treat these three types of data separately, but identically,
counting the number of exchanges the user has with their ten most frequently
interacted contacts. For each day, we form a histogram of the exchanges over a 3-‐
day history window and use the normalized frequency count as samples in the
feature table. In addition to counting the number of exchanges, we also use the
length of time of phone calls and number of words used in text messages and emails
to form an additional histogram for each data type. Thus, we create 6 social
interaction histograms in the feature table.
4.2.2. Routine Activity Records
Similarly, we use patterns in browser history, application usage and location
history as coarse indicators of routine activity. Applications are monitored based on
the usage of the ten most frequently used applications, while browser activities are
grouped by unique URL domains. We cluster our time-‐series of location estimates
using the DBSCAN [11] clustering algorithm, which allows us to count user visits to
each approximate location. We form 3-‐day normalized histograms for the top ten
used applications, website domains, and location clusters on the frequency of

27
usage/ visitation. We also form histograms based on the duration of time an
application was used. These 4 routine activity histograms are entered as samples of
the feature table.
We also group applications by type, categorizing them as one of {Built-‐in,
Communication, Entertainment, Finance, Game, Office, Social, Travel, Utilities,
Weather, Other, or “cannot categorize”}. This allows us to use a larger set of
applications, as many users will use applications beyond their top ten. To label the
applications in our dataset, we executed a categorization task on Amazon
Mechanical Turk. We create two application histograms grouped by the 12
categories; one histogram is a normalized count of categorized application usage
instances, while the other is the proportion of time spent in applications of a specific
category.
We also add a time-‐series component to our feature set by including the 2
previous mood averages as features. With 6 social interaction histograms, 6 routine
activity histograms, and 2 pairs of time-‐series components, our initial feature table
has a total of 128 dimensions, as shown in Table 4.1.

28
Data Type Histogram by: Count
Email contacts # Messages 10 # Characters 10
SMS contacts # Messages 10 # Characters 10
Phone call contacts # Calls 10 Call Duration 10
Website domains # Visits 10 Location Clusters # Visits 10
Apps # App launches 10 App Duration 10
Categories of Apps # App launches 12 App Duration 12
Previous Pleasure and Activeness Averages N/A 4
4.3. Internal Model of MoodScope
With our daily mood averages as labels and usage records as a feature table,
we apply a regression algorithm to our data to discern an inference model. We also
use Sequential Forward Selection (SFS) to choose relevant features, reducing the
dimensionality of our feature table. We evaluate the performance of our training of
personalized mood models and a one-‐size-‐fits-‐all mood model.
4.3.1. Multi-‐Linear Regression
Because the daily averages of mood are non-‐integer numerical values,
performing a regression along each mood dimension is a natural choice. In
particular, we use a least-‐squares multiple linear regression to perform the
modeling. This form of analysis requires no additional preparation for our data; we
Table 4.1 -‐ Feature Table of Usage Histograms (and previous mood averages)

29
simply apply the regression to our usage feature table, labeled by the daily averages
of mood.
A cross-‐validation of our regression assesses the robustness of the algorithm.
Because we only have 60 samples per user, we use Leave-‐One-‐Out-‐Cross-‐Validation
(LOOCV). LOOCV trains the model on all but one of the samples (hence the name)
and validates the model on the remaining sample. As a result, each sample from the
original data set is used for validation once. During any iteration of LOOCV, the
cross-‐validation trains the model on 59 samples, allowing for robust model training
on our study’s small dataset.
4.3.2. Sequential Forward Selection of Features
Because of the large dimensionality of features compared to the number of
samples, we choose a subset of relevant features to accelerate the learning process.
For this task, we use Sequential Forward Selection (SFS) [15].
In SFS, our system attempts to pick a subset Y of the feature table that will
give the best regression. In the SFS algorithm, Y starts out as an empty set. SFS then
iterates, finding the feature x (which is not already in Y) that provides the best fit to
the data, minimizing the mean error of the fit. It then adds x to Y and continues to
iterate. SFS will stop running when it reaches a local minimum; at this point, adding
any of the remaining features will increase the error.
Through this process, SFS appropriately selects the data’s most
representative features, reducing the dimensionality of our table.

30
4.3.3. Personalized Mood Model
We create a personalized model for each user by performing multi-‐linear
regression on each user’s data individually. Using individualized multi-‐linear
Figure 4.1 -‐ A user’s daily pleasure averages and MoodScope’s estimation
Figure 4.2 -‐ User distributions of squared error for pleasure model (Top) and activeness model (Bottom). Each stack represents a user’s %ile distribution of errors.

31
Figure 4.3 -‐ Distribution Functions of MSE of Pleasure and Activeness in personalized (1-‐User) and generalized (All-‐User) models.
Figure 4.4 -‐ Decrease of MSE as features are added. Each line represents a different user. A user’s line ends when SFS terminates.
regression to train the pleasure dimension of the models, we report an average
mean squared error (MSE) of 0.075 across all users, with a standard deviation of
0.050, a minimum MSE of 0.002, and a maximum MSE of 0.176. We received similar
numbers when training the activeness dimension. The standard deviation reveals
that mood modeling works better for some users than others, but the MSE numbers
are low enough to suggest that mood can be accurately inferred from smartphone
interactions in our dataset; it takes a squared error of 0.25 to move from the center
of one mood label halfway towards another label. On average, 93% of the daily
32
mood averages have a squared error under 0.25. Figure 4.1 shows one user’s
estimated mood. The distribution of error for each user is shown in Figure 4.2. The
CDFs in Figure 4.3 show the distribution of mean-‐squared-‐error across all users.
On average, SFS chose 17.0 features per user. Some users used as few as 8
features, while others used 29 features to strengthen the model. Figure 4.4 shows
how SFS improves the robustness of our algorithm as it adds more features.
4.3.4. All-‐User Mood Model
While personalized models report high accuracy, they require individual
training over a long period of time. We attempt to reduce the amount of training
required by the training by forming a “one-‐size-‐fits-‐all” mood model created from an
aggregate of all of the users’ data. If successful, this model can be used as an initial
model for a new user, bootstrapping the training procedure.
To test the feasibility of an all-‐user mood model, we remove a user’s data
from our dataset and perform a multi-‐linear regression on the remaining data to
create a model. We then apply the model to the user’s data and compute the mean-‐
squared-‐error of the computed mood.

33
After training, we found that the general model performed surprisingly well
for some users, with a minimum mean-‐squared-‐error of 0.059 among our users.
However, for many users, the mean-‐squared-‐error was quite high, as our dataset
Figure 4.5 -‐ Number of features in reduced feature tables. Solid bars represent statistically significant features (p < 0.05).
Figure 4.6 -‐ Number of most discriminative features in each category.
Figure 4.7 – Percentage of users that have relevant features in each category.

34
had an average mean-‐squared-‐error of 0.20, with standard deviation of 0.10. The
maximum mean-‐squared-‐error from our dataset was 0.79. On average, only 66% of
estimates are off by less than 0.25 squared-‐error. The CDFs in Figure 4.3 show the
distribution of accuracy across all users.
While the all-‐user mood model reports larger mean-‐squared-‐errors than the
personalized models, MoodScope can begin a training process by using the all-‐user
mood model until the user enters enough moods to personalize the system. We
expect the model to perform reasonably well in an online adaptation system as the
user enters corrections, effectively calibrating the model to their particular usage
patterns.
4.3.5. Discriminative Features
While SFS’s primary function is to reduce the feature table to a reasonable
dimension, it comes with the side benefit of highlighting which features are useful in
detecting mood. There are a number of several ways to determine which features
are useful for discrimination. We consider a few of these approaches with our
personalized models.
Count number of occurrences in reduced feature table: After SFS reduces the
feature table, we count the number of features of each type of data that appear in all
reduced tables. Figure 4.5 shows the results. Phone Calls and Applications grouped
by categories are the two most used features after SFS completes the feature
selection.

35
Count number of statistically significant features: With the features used in
the SFS, we performed Pearson Product-‐Moment Correlation on the data to get p-‐
values. We used p-‐values less than 0.05 to indicate statistically significant features
and present this data as the solid bars in Figure 4.5. Phone Calls and Applications
grouped by category, which are the most commonly selected features, also show up
as among the most common significant features. However, they are joined by
significant features from Emails, SMS, and ungrouped Applications.
Count number of most discriminative features: Sequential Feature Selection
selects features in order of how much they help the training. We look at the first
chosen as the most discriminative feature and count the number of times they occur
in Figure 4.6. For Activeness training, Phone Calls and Categorized Applications
again appear on top, in addition to SMS features, and followed closely by Email
features. However, for Pleasure training, Email and SMS features are the common
most-‐discriminative features, followed closely by Phone Call. Amongst our users,
Categorized Applications are only selected once for Pleasure training.
Count number of users who have relevant features in each category: We also
consider each category of feature and count how many users’ models utilize features
from those categories. We show the results in Figure 4.7. Phone Calls and
Categorized Applications again turn out to be the most common entry, as over 69%
of the users used features from those categories.

36
Figure 4.8 -‐ Percentage of features that positively correlate.
Overall, Phone Calls invariably appear as a discriminative feature for
determining mood. Categorized Applications also appear very frequently and
significantly. Emails and SMS follow closely as the next most discriminative features.
Thus, while all features are used in varying combinations to predict mood,
communication history and categorized application usage logs are the discriminative
features that are most linked to mood.
4.3.6. Positively and Negatively Correlated Features
In addition to seeing which selected features were the most helpful, we also
attempted to see if there were types of features whose coefficients appeared more
or less positive than other features. We counted the percentage of positive
coefficients for each type in our personalized multi-‐linear regression models and
display it in Figure 4.8.
37
Previous Mood is frequently negative for either Pleasure (55% negative) or
Activeness (67% negative). This is likely because many users have a strong
tendency towards neutral (e.g., a highly negative mood is often followed by a more-‐
positive mood towards neutral.)
During pleasure model training, Phone Calls, Applications grouped by
category, and Locations are often positive indicators of pleasure, appearing 55% of
the time as positive.
In activeness training, Phone call features again appear for positive
activeness, appearing 59% of the time as positive. A high value in many selected
email features tended to indicate lower activeness, as only 44% of email coefficients
were positive when used in activeness training.
4.4. Beyond Daily Mood
While we estimate daily mood averages with high accuracy, we attempt to
overcome the temporal granularity limitations stated in 4.1 by considering other
estimation schemes.
First, we investigated Raw Input Estimation to attempt to foretell what a user
will enter. By estimating the user input, we could provide a direct representation of
how the users train the mood. This could be used to preset the mood journal to
minimize the user interaction with the entry of a new mood during training.
Unfortunately, we were unable to achieve accurate estimation with our dataset.
38
Instead, we use Sudden Mood Change (SMC) Detection to detect when a user’s
mood is drastically different from normal. Applications could detect when a user’s
mood has shifted and intervene when a user’s mood has shifted positively or
negatively. As we will show in 4.4.2, we are able to recognize SMC events with 74%
accuracy.
4.4.1. Raw Input Estimation
We attempted to estimate the raw unprocessed inputs from the user, but
were not able to regress or classify these with reasonable accuracy.
Because raw inputs occur with finer time granularity than daily mood, we
shorten our histogram windows to 8 hours. We then apply regression and
classification algorithms to our data to attempt to estimate mood inputs.
Multi-‐linear regression with feature selection is unable to robustly estimate
the raw inputs, reporting an average error of 0.4744 when guessing between 1 and
5. Linear discriminant classification of raw inputs performed even worse, reporting
misclassifications for 48% of the inputs. Thus, we were unable to find a suitable
method to estimate raw input.
4.4.2. Sudden Mood Change Detection
Although we are unable to predict the raw inputs of the user, we can
moderately detect Sudden Mood Change (SMC), an event we define as being when
the user enters an input that is significantly different from their normal mood.
39
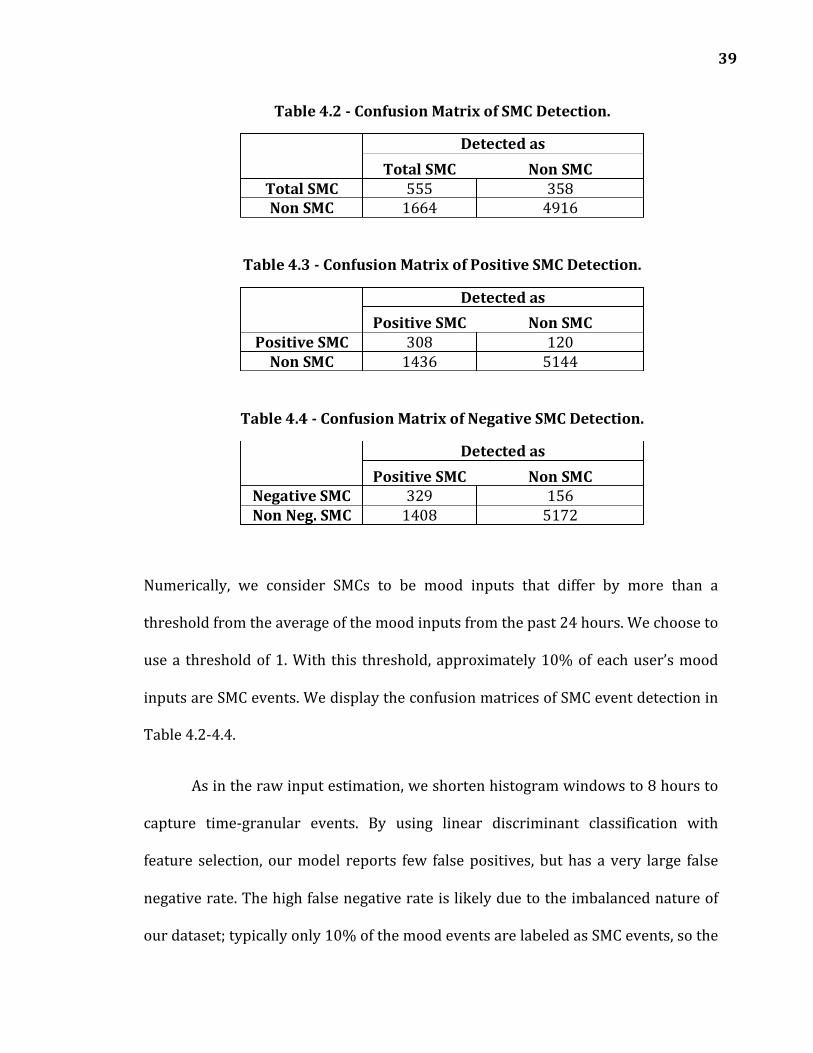
Numerically, we consider SMCs to be mood inputs that differ by more than a
threshold from the average of the mood inputs from the past 24 hours. We choose to
use a threshold of 1. With this threshold, approximately 10% of each user’s mood
inputs are SMC events. We display the confusion matrices of SMC event detection in
Table 4.2-‐4.4.
As in the raw input estimation, we shorten histogram windows to 8 hours to
capture time-‐granular events. By using linear discriminant classification with
feature selection, our model reports few false positives, but has a very large false
negative rate. The high false negative rate is likely due to the imbalanced nature of
our dataset; typically only 10% of the mood events are labeled as SMC events, so the
Table 4.2 -‐ Confusion Matrix of SMC Detection.
Detected as Total SMC Non SMC
Total SMC 555 358 Non SMC 1664 4916
Table 4.3 -‐ Confusion Matrix of Positive SMC Detection.
Detected as Positive SMC Non SMC
Positive SMC 308 120 Non SMC 1436 5144
Table 4.4 -‐ Confusion Matrix of Negative SMC Detection.
Detected as Positive SMC Non SMC
Negative SMC 329 156 Non Neg. SMC 1408 5172
40
model perceives high accuracy when guessing that there are no SMC events. One
solution to overcome imbalance is to randomly oversample the underrepresented
class until there is a uniform density of class labels in the dataset. After applying
oversampling while training our model, we achieved an average false negative rate
of 31.4% and an average false positive rate of 33.7% with an overall error rate of
32.8%.
We also investigated whether we could tell the direction of a SMC. We
considered positive SMC to be changes higher than the normal mood and negative
SMC to be changes lower than the normal mood. We trained the classifier on just
positive SMC events and received an average false negative rate of 30.1% and false
positive rate of 25.9% with an overall error rate of 25.7%. Likewise, we trained the
classifier on negative SMC events and received an average false negative rate of
26.4% and false positive rate of 26.9% with an overall error rate of 26.4%.
Because of the further-‐imbalanced nature of the positive and negative SMC
events, we initially expected the positive/negative SMC event training to perform
worse than the overall SMC training. However, the results show otherwise; we
rationalize that positive and negative SMC events are categorically different from
each other and require separate models to estimate their presence. Even so, the
limited accuracy of our models indicates a need for further investigation into
detection of Sudden Mood Change events.
41
4.5. Summary of MoodScope Design
To predict the daily average of mood from histograms of interactions, we use
multi-‐linear regression, tuned by a Sequential Forward Feature Selection.
Personalized models report high accuracy for most users, while generalized all-‐user
models perform worse. However, MoodScope can use the all-‐user model to predict
moods until it collects enough training data from a new user.
We also used our model training to discriminate which features were more
aligned with mood. Categorized application usage and communication history
(especially phone calls) were the most useful features in determining a user’s mood.
However, amongst all the users, all features were significantly used to determine
mood.
We also looked at the positive and negative correlations of usage with mood
and found that previous mood strongly correlates negatively with current mood.
Phone calls are positive indicators of both pleasure and activity. Features from
applications grouped by category and locations correlate with high pleasure, and
high numbers of emails correlate with low activity. However, positive and negative
correlations are highly user-‐dependent, which indicates why personalized models
perform better than generalized models.
We attempt to estimate the user’s raw mood entries, but are unable to
accurately predict the user’s input. We are however able to predict Sudden Mood

42
Change events with reasonably low false positive and false negative rates, although
further investigation is likely needed to achieve acceptable robustness.
43
Chapter 5
Mood Inference Engine
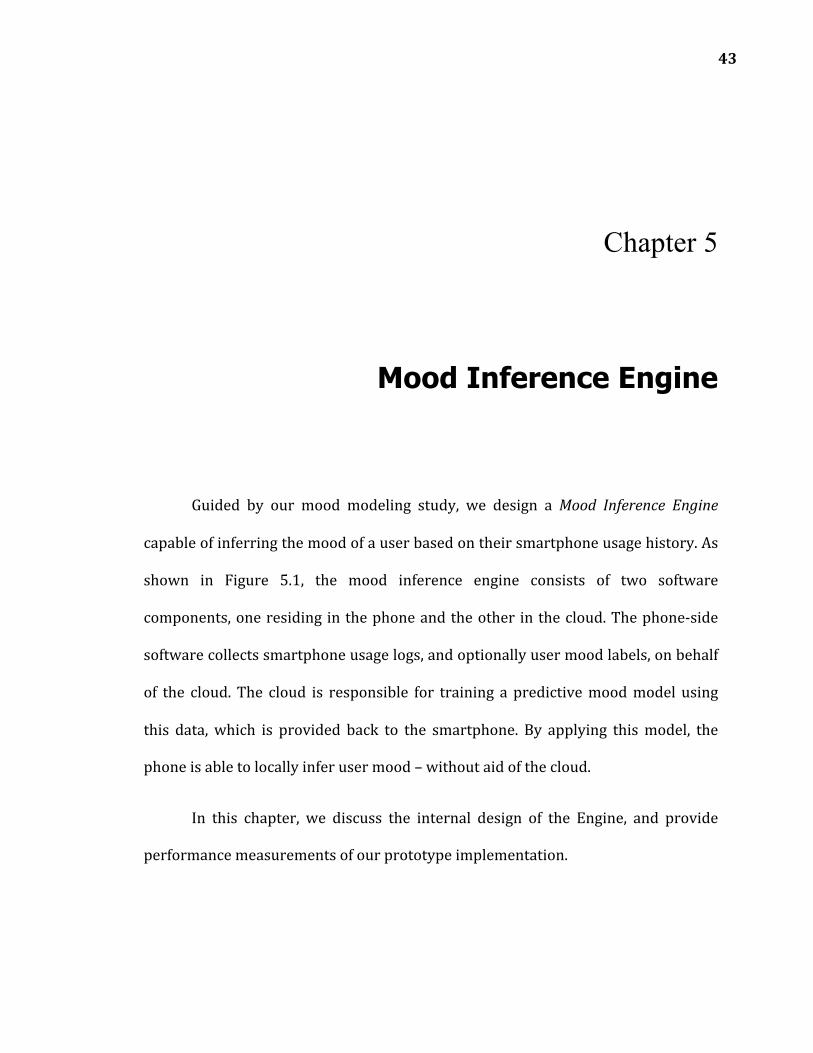
Guided by our mood modeling study, we design a Mood Inference Engine
capable of inferring the mood of a user based on their smartphone usage history. As
shown in Figure 5.1, the mood inference engine consists of two software
components, one residing in the phone and the other in the cloud. The phone-‐side
software collects smartphone usage logs, and optionally user mood labels, on behalf
of the cloud. The cloud is responsible for training a predictive mood model using
this data, which is provided back to the smartphone. By applying this model, the
phone is able to locally infer user mood – without aid of the cloud.
In this chapter, we discuss the internal design of the Engine, and provide
performance measurements of our prototype implementation.

44
Figure 5.1 -‐ Mood Inference Engine
Cloud-‐side software performs a combination of SFS and multi-‐linear
regression, as described in Chapter 4, to train models for each user. Users are
expected to provide some manual self-‐reported mood states during an initial
training period. In the absence of sufficient amounts of user-‐specific training data
the cloud is unable to train a model. In these cases the smartphone must depend on
pre-‐trained general purpose All-‐User mood model. Later, in Chapter 6 we describe
how we build an application that encourages users to input their mood states to
bootstrap the mood inference model.
5.1. Inference on the Phone
Although model training is offloaded to the cloud, mood inference is
performed entirely locally on the smartphone. Feature extraction is light-‐weight,
only involving the updating a number of continuously maintained histograms
45
describing select phone usage patterns, along with a lookup of the current location
within a table of clusters discovered by DBSCAN (performed on the cloud).
Similarly, inference itself requires performing a dot product multiplication between
features. Like most supervised learning techniques inference requires much less
computation than training. We are able to perform feature extraction and model
inference every hour on the phone without perceptible effects on phone usability or
battery lifetime.
Although the phone must transmit all user logs to the cloud for training this
occurs only once per night. Uploading can occur while the user is recharging their
phone, allowing home WiFi networks to be used, and removing any impact to
battery life.
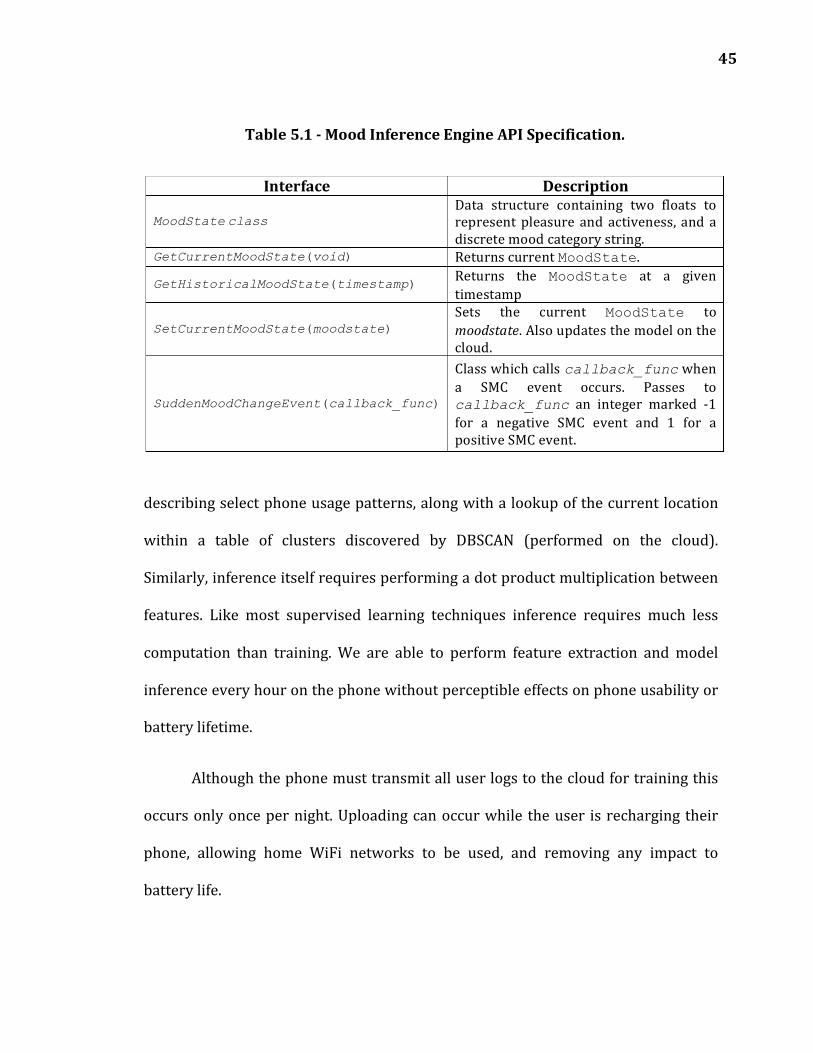
Table 5.1 -‐ Mood Inference Engine API Specification.
Interface Description
MoodState class Data structure containing two floats to represent pleasure and activeness, and a discrete mood category string.
GetCurrentMoodState(void) Returns current MoodState.
GetHistoricalMoodState(timestamp) Returns the MoodState at a given timestamp
SetCurrentMoodState(moodstate) Sets the current MoodState to moodstate. Also updates the model on the cloud.
SuddenMoodChangeEvent(callback_func)
Class which calls callback_func when a SMC event occurs. Passes to callback_func an integer marked -‐1 for a negative SMC event and 1 for a positive SMC event.
46
5.2. Application Programming Interface
Our Inference Engine is implemented as a system service that exposes a
simple API for developers to use. Developers are abstracted away from any
concerns related to machine learning or mood psychology, leaving them free to
innovate. As shown in Table 5.1, the API is very simple. An application can retrieve
a user’s current or historical mood state with two scores of pleasure and activeness,
and a discrete mood category string. The application can also set the user’s current
mood state to update the mood model, and get a notification on SMC events using a
callback function.
Later, in Section 6 we describe some mood-‐based applications we have built
on top of this API.
5.3. Performance
We next provide performance measurements for our prototype MoodScope
Inference Engine, which we implement on an iPhone 4.
5.3.1. Cloud-‐side Modeling Performance
Processing of usage logs is performed with a collection of Unix bash scripts
and Perl scripts. In total, this amounted to 815 lines of code. Models are trained
using calls to MATLAB scripts that perform multi-‐linear regression with feature

47
selection. On a QuadCore 2.4 GHz Intel i7 processor, these two stages take on
average 12 minutes at 100% computation to train a single mood model.
5.3.2. Phone-‐side Inference Performance
Our prototype phone-‐side mood inference service is developed for iOS 5.1
and tested with an iPhone 4. Histogram generation and model inference is
performed using 1012 lines of bash script. This process runs in the background with
no noticeable impairment to the user. To complete all feature and inference stages
requires roughly 13 seconds on an iPhone 4. This process repeats once an hour to
update the current estimated mood for the user. Although this overhead is
acceptable, processing speed could easily be improved by porting to a compiled
executable.
5.3.3. Communication Overhead
The complete user log for a whole day typically is around 1MB after
compression is applied. The complete log must be transmitted (rather than a
summary), as many features require the frequency of usage across multiple days to
be considered (e.g., top 10 SMS contacts spanning multiple days). Transmitting 1MB
while the phone is recharging has a negligible impact on the user.
A mood model can be represented as a series of coefficients, selected features
and location clusters. An uncompressed plaintext encoding requires less than 5 KB
to be downloaded to the phone. This compresses down to less than 3 KB.

48
Chapter 6
Mood-Enabled Applications
With the API provided by MoodScope, application developers can enable
various mood-‐based applications for more personalized services, increasing the
usability of the phone and lowering the social barrier of sharing mood.
6.1. MoodScope Social Sharing App
We design a MoodScope Social Sharing App on top of our iPhone Mood
Inference Engine as an end-‐to-‐end demonstration of a fully functional mood-‐aware
application. Every night, this application determines the user’s mood simply with an
API call to the Inference Engine. Current user mood is then visualized using a pair of
thermometer bars (one for each mood polarity), accessible to the user as a
smartphone application. Users are able to manually correct errors in inferred mood

49
by altering the temperature of either thermometer. If desired, inferred mood can be
shared automatically to the user’s Facebook Timeline.
When first used our application must rely on the generic All-‐User Mood
Model, and potentially suffer from unreliable performance. However, as users
correct inaccurate mood inferences this feedback is provided back to the Engine by
the application. The MoodScope Engine incorporates these new observations into
the model. Overtime, the model will be personalized to specific mood indicators
present the usage logs of the user. Once the accuracy of the mood prediction
stabilizes, the application provides settings for the automatic sharing of mood with
certain social circles of friends and/or family. We envision that easy sharing of
everyday moods will enhance online communication, which lacks many of the subtle
non-‐verbal signals present in face-‐to-‐face interactions.
We deployed our application on three university students after their 2
months of training models in the field study and received positive feedback. During
their 4 days of usage, users reported that the application performed reasonably
well, especially with the user who had diligently journaled his mood for the 2
months. While not all participants wished to share their mood publicly on Facebook,
they all enjoyed seeing the device estimate their mood and were excited about the
potential of using the mood in other applications

50
6.2. Windows Phone Mockups
To further explore potential uses of MoodScope we develop a number of
proof-‐of-‐concept applications for Windows phones. While these do not actually run
MoodScope, they act as examples of how application developers could use the Mood
Inference Engine.
6.2.1. Mood Browser
With our Mood Browser, users can view past mood states, filtered by time
(daily, weekly and monthly) or location. We create this application by combining
calls to our GetHistoricalMoodState function with traces of user mobility. This
application increases user awareness of mood changes and an extension of this
application could allow users to understand the influence of various factors on their
mood.
6.2.2. Mood Music Player
User music preference can be altered by a user’ mood, and typically users
must create their own custom playlist to match how they feel. By using MoodScope,
a music application can automatically select the right set of songs that best match
the current mood of the user. We implement the application by manually tagging the
songs with matching mood states, but automatically tagging is also feasible [23].

51
6.2.3. Mood Sharing Application
This application automatically shares a user’s mood with friends via social
networks. The output of MoodScope is converted into a single sentence describing
how they feel. This application can automatically post single sentences on social
networks, such as “I’m excited!” or “Feeling bad…”
6.2.4. General Feedback
We demonstrated these Windows Phone mood-‐based applications during a
two-‐day internal technical event inside a large software company. More than 200
people used these applications and provided feedback. We received largely positive
feedback from the attendees and many of them mentioned that they wanted to have
these applications on their own smartphones.

52
Chapter 7
Discussion and Future Work
Our findings show MoodScope is a promising and practical approach for
inferring mood with smartphones. However, a number of limitations in our study
must be overcome before MoodScope is ready for widespread usage.
We evaluate MoodScope with a small-‐scale user population that is fairly
homogenous. We have only tens of participants from two cities and most of them
were young students. We do not claim that our results will generalize to other user
groups. Large-‐scale validation of our results remains as future work.
Not every factor that impacts user mood can be captured by their
smartphone. MoodScope is currently oblivious to factors well known to alter mood,
such as face-‐to-‐face arguments (e.g., between a husband and wife), stressful traffic
conditions or even the weather. The aim of our study is to investigate the
relationship between smartphone usage patterns and user moods. We acknowledge

53
that some external factors can go undetected with this approach. Similarly, user
smartphone behavior can change in ways that suggest dramatic shifts in mood –
even when the cause is in fact unrelated to mood. Example situations include, travel
or critical work deadlines. At these times, routine patterns of social contact or daily
activities (e.g., exercise) may sharply decline, even if the underlying mood of the
person remains the same. In future studies we will attempt to detect these inflection
points in user lifestyle to reduce the rate at which false positives/negatives occur.
Our initial approach will be to selectively engage the user to ask when these
situations are suspected. We also plan to investigate how user interactions across
multiple devices (e.g., desktop, tablets) and services – in addition to their
smartphone -‐ can collectively determine if user behavior change is driven by mood
or some other confounding factor.
The privacy preserving mechanisms found within the existing MoodScope
design are insufficient for a release to the general public. Nevertheless, we take
privacy concerns seriously and adopt a variety of data anonymization techniques
when capturing user-‐to-‐smartphone interactions. However, unintended leakage of
information when handling rich high-‐dimensional personal data can easily occur
[26]. Careful study still remains to understand what types of unintended
information an adversary might infer from the specific data we utilize. MoodScope
can operate locally on the phone, and so does not need to record or share the
sensitive underlying information – but this does not solve the privacy problems
faced during model training. In the future we will explore how mood models can be

54
trained using data from multiple people while still providing sufficient guarantees of
privacy to each user.
Our findings demonstrate sizable performance gains result from
personalizing mood models. However, the existing process of bootstrapping models
under MoodScope places too much burden on the user. We are studying hybrid
solutions to model training that exploit groups of similarity users [17]. By
intelligently pooling training data between users who share similar traits (e.g.,
personality) we hope to build models with comparable performance to personalized
models, but are still able to spread the burden of collecting labeled data between
multiple people.
55
Chapter 8
Conclusion
We foresee mood inference as a vital next step for application context-‐
awareness. Such inference would improve the utility of the smartphone and lower
the social barrier for sharing mood socially. To approach this goal, we study mood-‐
inference from smartphone usage analysis. We collect 2 months of usage data and
self-‐reported mood from 32 users. Using machine learning techniques, we robustly
regress daily averages of mood and reasonably classify sudden mood change events.
Our analysis also discerns which features contribute most to mood detection. Phone
calls and applications grouped by category tended to be the strongest predictors of
mood. Based on our findings, we build a Mood Inference Engine that leverages the
cloud as needed to infer the mood efficiently. We design a MoodScope API for
application developers to use our mood inference system to build and enhance their
own custom mood-‐enabled applications.

56
References
[1] The Affectiva Q sensor, http://www.affectiva.com/q-sensor/. [2] C. D. Batson, L. L. Shaw and K.C. Oleson, “Differentiating affect, mood and emotion: toward
functionally-based conceptual distinctions”, Emotion, Newbury Park, 1992. [3] C. J. Beedie, P. C. Terry and A. M. Lane, "Distinctions between emotion and mood", Cognition and
Emotion, vol. 19, issue 6, 2005. [4] G. Chittaranjan, J. Blom and D. Gatica-Perez, “Who’s who with Big-Five: Analyzing and Classifying
Personality Traits with Smartphones”, in ISWC 2011. [5] K. Church, E. Hoggan and N. Oliver, “A study of mobile mood awareness and communication through
MobiMood”, in NordiCHI, 2010. [6] L. A. Clark and D. Watson, “Mood and the mundane: Relations between daily life events and self-
reported mood”, Journal of Personality and Social Psychology, vol 54(2), 1988. [7] J. F. Cohn, “Foundations of Human Computing: Facial Expression and Emotion,” Proc. Eighth ACM
Int’l Conf. Multimodal Interfaces (ICMI ’06), 2006. [8] J. R. Crawford and J. D. Henry, "The positive and negative affect schedule (PANAS): construct
validity, measurement properties and normative data in a large non-clinical sample", British Journal of Clinical Psychology, 43, 245-265, 2004.
[9] P. Ekman, “Universals and Cultural Differences in Facial Expressions of Emotion,” Proc. Nebraska Symp. Motivation, pp. 207-283, 1971.
[10] P. Ekman, W.V. Friesen, and J.C. Hager, “Facial Action Coding System,” A Human Face, 2002. [11] M. Ester, H.-P. Kriegel, J. Sander and X. Xu, "A density-based algorithm for discovering clusters in
large spatial databases with noise", in Second International Conference on Knowledge Discovery and Data Mining. pp. 226–231, 1996.
[12] J. P. Forgas, G. H. Bower and S.E. Krantz, “The influence of mood on perceptions of social interactions”, Journal of Experimental Social Psychology, vol 20(6), 1984.
[13] A. Gluhak, M. Presser, L. Zhu, S. Esfandiyari and S. Kupschick, “Towards mood based mobile services and applications”, in EuroSSC, 2007.
[14] The gottaFeeling application, http://gottafeeling.com/. [15] A. Jain and D. Zongker, "Feature Selection: Evaluation, Application, and Small Sample Performance,"
IEEE Transactions on Pattern Analysis and Machine Intelligence, vol. 19, no. 2, 1997. [16] N. Japkowicz and S. Stephen, "The class imbalance problem: A systematic study," Intelligent Data
Analysis, vol. 6, Issue 5, 2002. [17] N. D. Lane, Y. Xu, H. Lu, S. Hu, T. Choudhury, A. T. Campbell and F. Zhao "Enabling large-scale
human activity inference on smartphones using community similarity networks (CSN)". In UbiComp 2011 355-364.
[18] J. T. Larsen, A. P. McGraw and J. T. Cacioppo, "Can people feel happy and sad at the same time?", Journal of Personality and Social Psychology, vol. 81, no. 4, 1988.
[19] H. Lee, Y. Choi, S. Lee and I. P. Park, "Towards unobtrusive emotion recognition for affective social communication", in IEEE CCNC 2012, 2012.
[20] C.M. Lee and S.S. Narayanan, “Toward Detecting Emotions in Spoken Dialogs,” IEEE Trans. Speech and Audio Processing, vol. 13, no. 2, pp. 293-303, 2005.
[21] R. LiKamWa, Y. Liu, N. D. Lane and L. Zhong, "Can your smartphone infer your mood?", in PhoneSense workshop, 2011.
[22] H. Lu, A. J. B. Brush, B. Priyan-tha, A. K. Karlson, and J. Liu. "SpeakerSense: energy efficient unobtrusive speaker identification on mobile phones", in Pervasive 2011. 188-205.
[23] L. Lu, D. Liu and H. Zhang, "Automatic mood detection and tracking of music audio signals", IEEE Transactions on Audio, Speech and Language Processing, vol. 14, issue 1, 2006.
[24] The mappiness application, http://www.mappiness.org.uk/. [25] MIT Mood Meter, http://moodmeter.media.mit.edu/. [26] A. Narayanan and V. Shmatikov, "Myths and fallacies of Personally Identifiable Information".
Commun. ACM 53, 6 (June 2010), 24-26.
57
[27] M. Pantic and M.S. Bartlett, “Machine Analysis of Facial Expressions,” Face Recognition, K. Delac and M. Grgic, eds., pp. 377-416, I-Tech Education and Publishing, 2007.
[28] R. W. Picard, “Affective computing”, MIT Press, 1997. [29] K. K. Rachuri, M. Musolesi, C. Mascolo, P. J. Rentfrow, C. Longworth and A. Aucinas,
“EmotionSense: a mobile phones based adaptive platform for experimental social psychology research”, in UbiComp, 2010.
[30] J. A. Russell, “A circumplex model of affect”, Journal of Personality and Social Psychology, vol. 39, no. 6, 1980.
[31] J. A. Russell, "Affect grid: a single-item scale of pleasure and arousal", Journal of Personality and Social Psychology, vol. 57, no. 3, 1989.
[32] B. Schuller, R.J. Villar, G. Rigoll, and M. Lang, “Meta-Classifiers in Acoustic and Linguistic Feature Fusion-Based Affect Recognition,” Proc. IEEE Int’l Conf. Acoustics, Speech, and Signal Processing (ICASSP ’05), pp. 325-328, 2005.
[33] C. Shepard, A. Rahmati, C. Tossell, L. Zhong and P. Lortum, “LiveLab: measuring wireless networks and smartphone users in the field”, in ACM SIGMETRICS Perform. Eval. Rev., vol. 38, no. 3, 2010.
[34] J. Tao and T. Tan, “Affective computing: a review”, Affective Computing and Intelligent Interaction, LNCS 3784, Springer, 2005.
[35] S.S. Tomkins, "Affect, Imagery, Consciousness", Springer, 1962. [36] A. Vinciarelli, M. Pantic and H. Bourlard, "Social signal processing: survey of an emerging domain",
Image and Vision Computing, 2009. [37] D. Watson, L.A. Clark, and A. Tellegen, “Development and Validation of Brief Measures of Positive
and Negative Affect: The PANAS Scales,” Journal of Personality and Social Psychology, vol. 54, pp. 1063-1070, 1988.
[38] M. Yik, “Studying Affect Among the Chinese: The Circular Way”, Journal of Personality Assessment, 91(5), 2009.
[39] Z. Zeng, M. Pantic, G. I. Roisman and T. S. Huang, "A survey of affect recognition methods: audio, visual, and spontanenous expressions", IEEE Transactions on Pattern Analysis and Machine Intelligence, vol. 31, no. 1, 2009.