monthly review of the texas economy
TRANSCRIPT

TRMARCH 20181 8 6 2
TECHNICAL REPOR T

1
Monthly Review of the Texas Economy—March 2018 By Ali Anari
The Texas economy continues to outpace the U.S. economy in job creation. The state gained 285,200 nonagricultural jobs from February 2017 to February 2018, an annual growth rate of 2.3 percent, higher than the nation’s employment growth rate of 1.6 percent (Table 1 and Figure 1). The nongovernment sector added 283,500 jobs, an annual growth rate of 2.8 percent, also higher than the nation’s employment growth rate of 1.8 percent in the private sector (Table 1). Texas’ seasonally adjusted unemployment rate in February 2018 was 4 percent, lower than the 4.7 percent rate in February 2017. The nation’s rate decreased from 4.7 to 4.1 percent (Table 1). Texas Employment Growth Rates by Industry Table 2 shows Texas industries ranked by employment growth rate from February 2017 to February 2018. All Texas industries except the information industry had more jobs in February 2018 than in February 2017. The mining and logging industry ranked first in job creation followed by construction; transportation, warehousing, and utilities; professional and business services; leisure and hospitality; and financial activities. Figures 2 to 13 show trends in employment growth rates by industry.
Texas Job Shares by Industry and the Government Sector Table 3 shows Texas industries and the state’s government sector ranked by their shares of Texas jobs in February 2018. Of the 12,422,400 nonagricultural jobs in February 2018, the highest percentage of employment by industry was in the government sector, followed by trade, professional and business services, education and health services, leisure and hospitality, and manufacturing. Since February 2017, professional and business services; leisure and hospitality; financial activities; construction, transportation, and warehousing; utilities; and mining and logging have expanded their shares of Texas employment at the expense of the government sector, trade, education and health services, manufacturing, other services, and the information industry. Figures 14 to 25 show trends in shares of total Texas jobs by industry. Contributions to Texas Employment Growth Rate by Industry Texas’ statewide employment growth rate of 2.3 percent, or more exactly 2.3498 percent, from February 2017 to February 2018 is the weighted average of employment growth rates for all Texas industries for the period. Weights are shares of jobs by industry. The contribution of each industry to the statewide employment growth rate is equal to the employment growth rate of that industry multiplied by its share of Texas jobs. Table 4 shows Texas industries and the state’s government sector ranked by their contributions to Texas employment growth rates from February 2017 to February 2018. The state’s professional and business services ranked first in contribution to job growth followed by leisure and hospitality, construction, mining and logging, trade, and education and health services. Figures 26 to 37 show trends in contributions of Texas industries to Texas job growth rates.
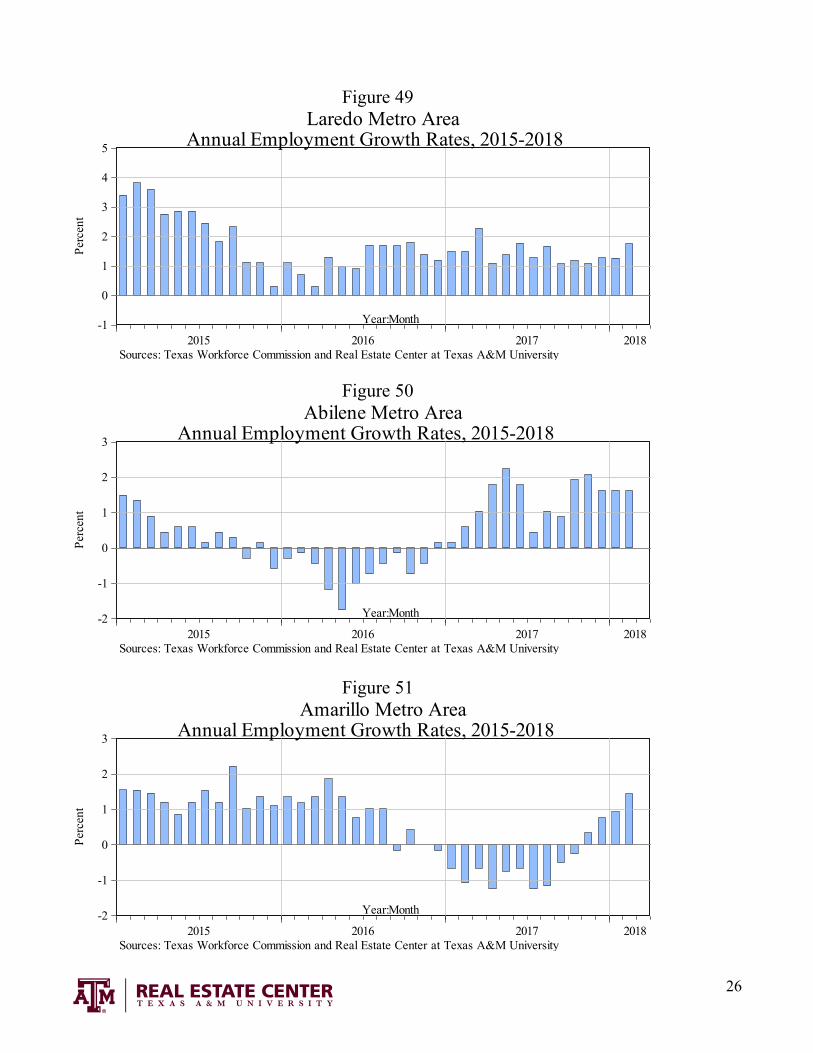
Employment Growth Rates by Texas Metropolitan Areas All Texas metro areas except Brownsville-Harlingen, Victoria, Beaumont-Port Arthur, and Corpus Christi had more jobs in February 2018 than in February 2017 (Table 5). Midland ranked first in job creation followed by Odessa, College Station-Bryan, Austin-Round Rock, Dallas-Plano-Irving, Fort Worth-Arlington, and San Antonio-New Braunfels (Table 5). Figures 38 to 63 show trends in annual employment growth rates for the state’s metropolitan areas.

2
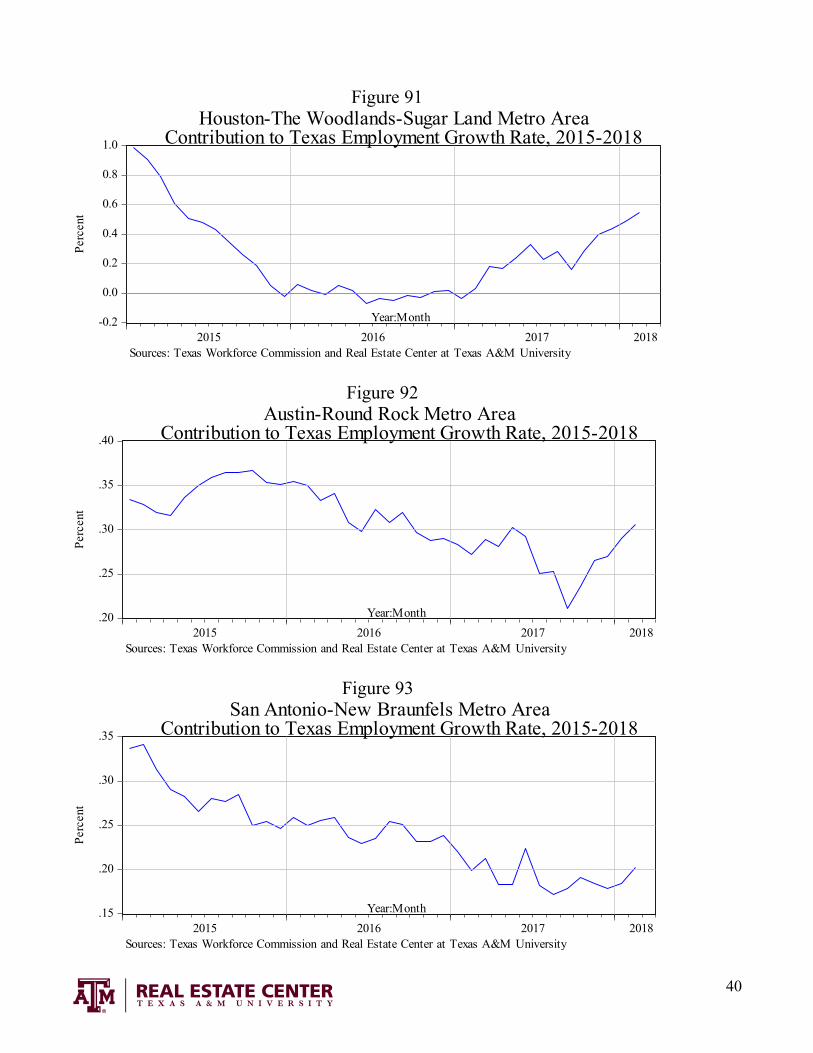
Texas Job Shares by Metropolitan Area Table 6 shows Texas metropolitan areas ranked by their shares of total Texas jobs in February 2018. The Houston-The Woodlands-Sugar Land metro area had the largest share of Texas jobs followed by Dallas-Plano-Irving, Austin-Round Rock, San Antonio-New Braunfels, Fort Worth-Arlington, El Paso, and McAllen-Edinburg-Mission. Figures 64 to 89 show trends in metropolitan shares of total Texas jobs. Contributions to Texas’ Employment Growth Rate by Metropolitan Area The statewide employment growth rate of 2.3498 percent in Texas from February 2017 to February 2018 is the weighted average of employment growth rates of all Texas metros for the period. Weights are shares of jobs by area. The contribution of each metro to the statewide employment growth rate is equal to the employment growth rate in that area multiplied by its share of Texas jobs. Table 7 shows Texas metros ranked by their contributions to Texas employment growth rates from February 2017 to February 2018. Dallas-Plano-Irving ranked first followed by Houston-The Woodlands-Sugar Land, Austin-Round Rock, San Antonio-New Braunfels, Fort Worth-Arlington, Midland, and College Station-Bryan. Figures 90 to 115 show trends in contributions of Texas metros to total Texas job growth rates. Unemployment Rate by Metropolitan Area The state’s actual unemployment rate in February 2018 was 4.1 percent. Midland had the lowest unemployment rate followed by Amarillo, Austin-Round Rock, College Station-Bryan, Lubbock, and Odessa (Table 8).
Employment Growth Rates by Industry in Largest Texas Metropolitan Areas Table 9 shows annual growth rates of employment by industry in the six largest Texas metropolitan areas from February 2017 to February 2018. The current growth rate of Houston-The Woodlands-Sugar Land’s economy is due to job growth rates in professional and business services; mining and construction; financial activities; manufacturing; trade, transportation, and utilities; and leisure and hospitality. Dallas-Plano-Irving is currently experiencing positive employment growth rates in all industries as well as the government sector. San Antonio’s economy is currently driven by mining and construction; leisure and hospitality; professional and business services; other services; trade, transportation, and utilities; and manufacturing. Fort Worth-Arlington’s economy is currently experiencing job growth rates in all industries except information, mining and construction, and other services. Government is the only sector in Austin experiencing job losses. The El Paso economy is currently driven by mining and construction, education and health services, professional and business services, and financial activities.

3
NonFarm Employment February 2018 February 2017 Absolute PercentTexas 12,422,400 12,137,200 285,200 2.3United States 148,177,000 145,896,000 2,281,000 1.6
Private Employment February 2018 February 2017 Absolute PercentTexas 10,483,300 10,199,800 283,500 2.8United States 125,819,000 123,587,000 2,232,000 1.8
Labor Participation Labor Force Unemployed February 2018 February 2017Texas 13,657,100 544,100 4.0 4.7United States 161,921,000 6,706,000 4.1 4.7Sources: Texas Workforce Commission and U.S. Bureau of Labor Statistics
Table 1
ChangeTexas and U.S. Labor Markets
February 2018 Unemployment Rate, Percent
February FebruaryRank Industry 2018 2017 Change %Change
1 Mining and Logging 240,300 212,000 28,300 13.352 Construction 740,200 706,300 33,900 4.803 Transportation, Warehousing, Utilities 553,000 531,300 21,700 4.084 Professional and Business Services 1,718,500 1,654,200 64,300 3.895 Leisure and Hospitality 1,353,900 1,308,400 45,500 3.486 Financial Activities 769,900 747,100 22,800 3.057 Manufacturing 859,800 843,700 16,100 1.918 Education and Health Services 1,683,700 1,658,400 25,300 1.539 Trade 1,934,700 1,909,300 25,400 1.33
10 Other Services 429,600 426,200 3,400 0.8011 Government 1,939,100 1,937,400 1,700 0.0912 Information 199,700 202,900 -3,200 -1.58
Table 2
Sources: Texas Workforce Commission and Real Estate Center at Texas A&M University
Texas Industries and Government Sector Ranked by Employment Growth RateFrom February 2017 to February 2018

4
February February2018 2017
Rank Industry Percent Percent1 Government 15.61 15.962 Trade 15.57 15.733 Professional and Business Services 13.83 13.634 Education and Health Services 13.55 13.665 Leisure and Hospitality 10.90 10.786 Manufacturing 6.92 6.957 Financial Activities 6.20 6.168 Construction 5.96 5.829 Transportation, Warehousing, Utilities 4.45 4.3810 Other Services 3.46 3.5111 Mining and Logging 1.93 1.7512 Information 1.61 1.67
Total 100.00 100.00Sources: Texas Workforce Commission and Real Estate Center at Texas A&M UniversityNote: Components may not add up to totals due to rounding
Table 3Texas Industries' and Government's Shares of Employment
February February2018 2017
Rank Industry Percent Percent1 Professional and Business Services 0.5298 0.26242 Leisure and Hospitality 0.3749 0.23733 Construction 0.2793 0.06854 Mining and Logging 0.2332 -0.14215 Trade 0.2093 0.08526 Education and Health Services 0.2085 0.42377 Financial Activities 0.1879 0.15048 Transportation, Warehousing, Utilities 0.1788 0.14049 Manufacturing 0.1327 -0.1070
10 Other Services 0.0280 0.022611 Government 0.0140 0.266612 Information -0.0264 0.0125
Total 2.3498 1.4205Sources: Texas Workforce Commission and Real Estate Center at Texas A&M UniversityNote: Components may not add up to totals due to rounding
Contributions of Texas Industries and the Government Sector to Texas Employment Growth RateTable 4

5
Rank Metropolitan Area Employment Growth Rate, %1 Midland 8.62 Odessa 7.13 College Station-Bryan 5.14 Austin-Round Rock 3.65 Dallas-Plano-Irving 2.76 Fort Worth-Arlington 2.46 San Antonio-New Braunfels 2.4
Texas 2.38 Tyler 2.39 Houston-The Woodlands-Sugar Land 2.210 Lubbock 1.910 McAllen-Edinburg-Mission 1.912 Laredo 1.713 Abilene 1.614 Amarillo 1.415 Sherman-Denison 1.315 Killeen-Temple-Fort Hood 1.317 San Angelo 1.218 El Paso 1.019 Longview 0.920 Wichita Falls 0.320 Texarkana 0.322 Waco 0.123 Brownsville-Harlingen -0.124 Victoria -0.225 Beaumont-Port Arthur -1.025 Corpus Christi -1.0
Table 5Texas Metropolitan Areas Ranked by Employment Growth Rate
From February 2017 to February 2018
Sources: Texas Workforce Commission and Real Estate Center at Texas A&M University

6
February February2018 2017
Metropolitan Area Percent Percent1 Houston-The Woodlands-Sugar Land 24.6997 24.73552 Dallas-Plano-Irving 21.0354 20.95793 Austin-Round Rock 8.5209 8.41464 San Antonio-New Braunfels 8.4967 8.49455 Fort Worth-Arlington 8.4098 8.40726 El Paso 2.5349 2.56907 McAllen-Edinburg-Mission 2.0978 2.10768 Corpus Christi 1.5408 1.59269 Beaumont-Port Arthur 1.3089 1.3529
10 Lubbock 1.2035 1.208711 Killeen-Temple-Fort Hood 1.1616 1.174112 Brownsville-Harlingen 1.1367 1.165013 Waco 0.9757 0.997814 Amarillo 0.9708 0.979615 College Station-Bryan 0.9692 0.944216 Tyler 0.8541 0.854417 Laredo 0.8436 0.848618 Midland 0.7833 0.738219 Longview 0.7792 0.790120 Odessa 0.6070 0.580021 Abilene 0.5587 0.562722 Texarkana 0.4854 0.495223 Wichita Falls 0.4758 0.485324 San Angelo 0.3985 0.402925 Sherman-Denison 0.3824 0.386426 Victoria 0.3309 0.3395
Micropolitan Texas 8.4388 8.4155Total 100.0000 100.0000
Sources: Texas Workforce Commission and Real Estate Center at Texas A&M University
Note: Components may not add up to totals due to rounding
Rank
Table 6Texas Metropolitan and Micropolitan Shares of Total Texas Jobs

7
February FebruaryRank Metropolitan Area 2018 2017
1 Dallas-Plano-Irving 0.5718 0.62922 Houston-The Woodlands-Sugar Land 0.5446 0.03013 Austin-Round Rock 0.3065 0.27244 San Antonio-New Braunfels 0.2019 0.19895 Fort Worth-Arlington 0.2002 0.15966 Midland 0.0634 0.00507 College Station-Bryan 0.0478 0.01348 Odessa 0.0412 -0.00929 McAllen-Edinburg-Mission 0.0395 0.0443
10 El Paso 0.0255 0.048511 Lubbock 0.0231 0.025112 Tyler 0.0198 0.005013 Killeen-Temple-Fort Hood 0.0148 0.015913 Laredo 0.0148 0.012515 Amarillo 0.0140 -0.010916 Abilene 0.0091 0.003317 Longview 0.0074 -0.017518 Sherman-Denison 0.0049 0.008418 San Angelo 0.0049 -0.004220 Wichita Falls 0.0016 0.007520 Texarkana 0.0016 -0.007522 Waco 0.0008 0.030123 Victoria -0.0008 -0.012524 Brownsville-Harlingen -0.0016 0.009225 Beaumont-Port Arthur -0.0132 -0.012526 Corpus Christi -0.0157 0.0025
Micropolitan Texas 0.2216 -0.0259Total 2.3498 1.4205
Sources: Texas Workforce Commission and Real Estate Center at Texas A&M UniversityNote: Components may not add up to totals due to rounding
Table 7Contributions of Texas Metropolitan and Micropolitan Areas to Total Texas Employment Growth Rate

8
Rank Metropolitan Area Unemployment Rate,%1 Midland 2.52 Amarillo 2.93 Austin-Round Rock 3.03 College Station-Bryan 3.05 Lubbock 3.16 Odessa 3.27 San Angelo 3.38 San Antonio-New Braunfels 3.48 Sherman-Denison 3.4
10 Abilene 3.510 Wichita Falls 3.512 Fort Worth-Arlington 3.613 Dallas-Plano-Irving 3.714 Tyler 3.814 Waco 3.816 Laredo 3.917 Killeen-Temple 4.1
Texas 4.118 Victoria 4.319 El Paso 4.519 Longview 4.521 Houston-The Woodlands-Sugar Land 4.722 Texarkana 4.823 Corpus Christi 5.524 Brownsville-Harlingen 6.725 Beaumont-Port Arthur 6.826 McAllen-Edinburg-Mission 7.1
Sources: Texas Workforce Commission and Real Estate Center at Texas A&M University
Table 8Texas Metropolitan Areas Ranked by Unemployment Rate, February 2018

9
Industry: Houston Dallas San Antonio Fort Worth Austin El PasoMining and Construction 3.78 7.07 10.28 -2.82 6.03 7.33Manufacturing 2.20 3.31 2.08 3.14 2.86 -4.71Trade, Transportation and Utilities 2.03 1.62 2.11 2.13 4.89 -0.74Information -1.86 0.42 -3.35 -1.77 4.08 0.00Financial Activities 2.54 2.48 -0.67 5.15 4.97 1.59Professional and Business Services 5.38 1.93 2.87 4.14 6.66 2.64Education and Health Services 0.63 2.45 1.37 3.22 3.17 2.69Leisure and Hospitality 1.94 5.32 5.57 5.11 4.76 1.17Other Services -0.09 6.56 2.16 -0.79 3.19 0.00Government 0.44 1.85 0.75 1.67 -1.58 0.55Sources: Texas Workforce Commission and Real Estate Center at Texas A&M University
Employment Growth Rates by Industry in Largest Texas Metropolitan AreasTable 9
Annual Growth Rates from February 2017 to February 2018, Percent
Largest Texas Metropolitan Areas

10
Figure 1
Figure 2
Figure 3
-1
0
1
2
3
4
2015 2016 2017 2018
TexasU.S.
Nonfarm Employment Growth Rates for United States and TexasAnnual Employment Growth Rates,2015-2018
Perc
ent
Year:Month
Sources: Texas Workforce Commission and Real Estate Center at Texas A&M University
-30
-20
-10
0
10
20
2015 2016 2017 2018
Texas Mining and Logging IndustryAnnual Employment Growth Rates,2015-2018
Perc
ent
Year:Month
Sources: Texas Workforce Commission and Real Estate Center at Texas A&M University
0
2
4
6
8
10
2015 2016 2017 2018
Texas Construction IndustryAnnual Employment Growth Rates,2015-2018
Perc
ent
Year:Month
Sources: Texas Workforce Commission and Real Estate Center at Texas A&M University

11
Figure 4
Figure 5
Figure 6
-2
0
2
4
6
8
2015 2016 2017 2018
Texas Transportation, Warehousing, and Utilities IndustryAnnual Employment Growth Rates,2015-2018
Perc
ent
Year:Month
Sources: Texas Workforce Commission and Real Estate Center at Texas A&M University
0
2
4
6
2015 2016 2017 2018
Texas Professional and Business Services IndustryAnnual Employment Growth Rates,2015-2018
Perc
ent
Year:Month
Sources: Texas Workforce Commission and Real Estate Center at Texas A&M University
0
2
4
6
2015 2016 2017 2018
Texas Leisure and Hospitality IndustryAnnual Employment Growth Rates,2015-2018
Perc
ent
Year:Month
Sources: Texas Workforce Commission and Real Estate Center at Texas A&M University

12
Figure 7
Figure 8
Figure 9
-1
0
1
2
3
4
5
2015 2016 2017 2018
Texas Financial Activities IndustryAnnual Employment Growth Rates,2015-2018
Perc
ent
Year:Month
Sources: Texas Workforce Commission and Real Estate Center at Texas A&M University
-6
-4
-2
0
2
4
2015 2016 2017 2018
Texas Manufacturing IndustryAnnual Employment Growth Rates,2015-2018
Perc
ent
Year:Month
Sources: Texas Workforce Commission and Real Estate Center at Texas A&M University
0
2
4
6
2015 2016 2017 2018
Texas Education and Health Services IndustryAnnual Employment Growth Rates,2015-2018
Perc
ent
Year:Month
Sources: Texas Workforce Commission and Real Estate Center at Texas A&M University

13
Figure 10
Figure 11
Figure 12
-1
0
1
2
3
4
2015 2016 2017 2018
Texas Trade IndustryAnnual Employment Growth Rates,2015-2018
Perc
ent
Year:Month
Sources: Texas Workforce Commission and Real Estate Center at Texas A&M University
-1
0
1
2
3
2015 2016 2017 2018
Texas Other Services IndustryAnnual Employment Growth Rates,2015-2018
Perc
ent
Year:Month
Sources: Texas Workforce Commission and Real Estate Center at Texas A&M University
-1
0
1
2
3
2015 2016 2017 2018
Texas Government SectorAnnual Employment Growth Rates,2015-2018
Perc
ent
Year:Month
Sources: Texas Workforce Commission and Real Estate Center at Texas A&M University

14
Figure 13
Figure 14
Figure 15
-2
-1
0
1
2
2015 2016 2017 2018
Texas Information IndustryAnnual Employment Growth Rates,2015-2018
Perc
ent
Year:Month
Sources: Texas Workforce Commission and Real Estate Center at Texas A&M University
14
15
16
17
2015 2016 2017 2018
Texas Government SectorShare of Total Texas Jobs,2015-2018
Perc
ent
Year:Month
Sources: Texas Workforce Commission and Real Estate Center at Texas A&M University
15.0
15.5
16.0
16.5
17.0
2015 2016 2017 2018
Texas Trade IndustryShare of Total Texas Jobs,2015-2018
Perc
ent
Year:Month
Sources: Texas Workforce Commission and Real Estate Center at Texas A&M University

15
Figure 16
Figure 17
Figure 18
13.0
13.2
13.4
13.6
13.8
14.0
2015 2016 2017 2018
Texas Professional and Business Services IndustryShare of Total Texas Jobs,2015-2018
Perc
ent
Year:Month
Sources: Texas Workforce Commission and Real Estate Center at Texas A&M University
13.1
13.2
13.3
13.4
13.5
13.6
13.7
2015 2016 2017 2018
Texas Education and Health Services IndustryShare of Total Texas Jobs,2015-2018
Perc
ent
Year:Month
Sources: Texas Workforce Commission and Real Estate Center at Texas A&M University
8
9
10
11
12
2015 2016 2017 2018
Texas Leisure and Hospitality IndustryShare of Total Texas Jobs,2015-2018
Perc
ent
Year:Month
Sources: Texas Workforce Commission and Real Estate Center at Texas A&M University

16
Figure 19
Figure 20
Figure 21
6.8
7.0
7.2
7.4
7.6
7.8
2015 2016 2017 2018
Texas Manufacturing IndustryShare of Total Texas Jobs,2015-2018
Perc
ent
Year:Month
Sources: Texas Workforce Commission and Real Estate Center at Texas A&M University
6.00
6.05
6.10
6.15
6.20
6.25
2015 2016 2017 2018
Texas Financial Activities IndustryShare of Total Texas Jobs,2015-2018
Perc
ent
Year:Month
Sources: Texas Workforce Commission and Real Estate Center at Texas A&M University
5.70
5.75
5.80
5.85
5.90
5.95
6.00
2015 2016 2017 2018
Texas Construction IndustryShare of Total Texas Jobs,2015-2018
Perc
ent
Year:Month
Sources: Texas Workforce Commission and Real Estate Center at Texas A&M University

17
Figure 22
Figure 23
Figure 24
4.20
4.25
4.30
4.35
4.40
4.45
4.50
2015 2016 2017 2018
Texas Transportation, Utilities, Warehousing IndustryShare of Total Texas Jobs,2015-2018
Perc
ent
Year:Month
Sources: Texas Workforce Commission and Real Estate Center at Texas A&M University
3.0
3.2
3.4
3.6
3.8
4.0
2015 2016 2017 2018
Texas Other Services IndustryShare of Total Texas Jobs,2015-2018
Perc
ent
Year:Month
Sources: Texas Workforce Commission and Real Estate Center at Texas A&M University
1.6
1.8
2.0
2.2
2.4
2.6
2.8
2015 2016 2017 2018
Texas Mining and Logging IndustryShare of Total Texas Jobs,2015-2018
Perc
ent
Year:Month
Sources: Texas Workforce Commission and Real Estate Center at Texas A&M University

18
Figure 25
Figure 26
Figure 27
1.60
1.62
1.64
1.66
1.68
1.70
2015 2016 2017 2018
Texas Information IndustryShare of Total Texas Jobs,2015-2018
Perc
ent
Year:Month
Sources: Texas Workforce Commission and Real Estate Center at Texas A&M University
.0
.2
.4
.6
.8
2015 2016 2017 2018
Texas Professional and Business Services IndustryContribution to Texas Employment Growth Rate,2015-2018
Perc
ent
Year:Month
Sources: Texas Workforce Commission and Real Estate Center at Texas A&M University
.1
.2
.3
.4
.5
.6
2015 2016 2017 2018
Texas Leisure and Hospitality IndustryContribution to Texas Employment Growth Rate,2015-2018
Perc
ent
Year:Month
Sources: Texas Workforce Commission and Real Estate Center at Texas A&M University

19
Figure 28
Figure 29
Figure 30
.0
.1
.2
.3
.4
.5
2015 2016 2017 2018
Texas Construction IndustryContribution to Texas Employment Growth Rate,2015-2018
Perc
ent
Year:Month
Sources: Texas Workforce Commission and Real Estate Center at Texas A&M University
-.8
-.6
-.4
-.2
.0
.2
.4
2015 2016 2017 2018
Texas Mining and Logging Industry Contribution to Texas Employment Growth Rate,2015-2018
Perc
ent
Year:Month
Sources: Texas Workforce Commission and Real Estate Center at Texas A&M University
.0
.1
.2
.3
.4
.5
.6
2015 2016 2017 2018
Texas Trade IndustryContribution to Texas Employment Growth Rate,2015-2018
Perc
ent
Year:Month
Sources: Texas Workforce Commission and Real Estate Center at Texas A&M University

20
Figure 31
Figure 32
Figure 33
.1
.2
.3
.4
.5
.6
2015 2016 2017 2018
Texas Education and Health Services IndustryContribution to Texas Employment Growth Rate,2015-2018
Perc
ent
Year:Month
Sources: Texas Workforce Commission and Real Estate Center at Texas A&M University
.10
.12
.14
.16
.18
.20
.22
2015 2016 2017 2018
Texas Financial Activities IndustryContribution to Texas Employment Growth Rate,2015-2018
Perc
ent
Year:Month
Sources: Texas Workforce Commission and Real Estate Center at Texas A&M University
.08
.12
.16
.20
.24
.28
2015 2016 2017 2018
Texas Transportation, Utilities, Warehousing IndustryContribution to Texas Employment Growth Rate,2015-2018
Perc
ent
Year:Month
Sources: Texas Workforce Commission and Real Estate Center at Texas A&M University

21
Figure 34
Figure 35
Figure 36
-.4
-.2
.0
.2
.4
2015 2016 2017 2018
Texas Manufacturing IndustryContribution to Texas Employment Growth Rate,2015-2018
Perc
ent
Year:Month
Sources: Texas Workforce Commission and Real Estate Center at Texas A&M University
-.02
.00
.02
.04
.06
.08
2015 2016 2017 2018
Texas Other Services IndustryContribution to Texas Employment Growth Rate,2015-2018
Perc
ent
Year:Month
Sources: Texas Workforce Commission and Real Estate Center at Texas A&M University
.0
.1
.2
.3
.4
2015 2016 2017 2018
Texas Government SectorContribution to Texas Employment Growth Rate,2015-2018
Perc
ent
Year:Month
Sources: Texas Workforce Commission and Real Estate Center at Texas A&M University

22
Figure 37
Figure 38
Figure 39
-.04
-.02
.00
.02
.04
2015 2016 2017 2018
Texas Information IndustryContribution to Texas Employment Growth Rate,2015-2018
Perc
ent
Year:Month
Sources: Texas Workforce Commission and Real Estate Center at Texas A&M University
-10
-5
0
5
10
2015 2016 2017 2018
Midland Metro AreaAnnual Employment Growth Rates, 2015-2018
Perc
ent
Year:Month
Sources: Texas Workforce Commission and Real Estate Center at Texas A&M University
-12
-8
-4
0
4
8
12
2015 2016 2017 2018
Odessa Metro AreaAnnual Employment Growth Rates, 2015-2018
Perc
ent
Year:Month
Sources: Texas Workforce Commission and Real Estate Center at Texas A&M University

23
Figure 40
Figure 41
Figure 42
0
2
4
6
2015 2016 2017 2018
College Station-Bryan Metro AreaAnnual Employment Growth Rates, 2015-2018
Perc
ent
Year:Month
Sources: Texas Workforce Commission and Real Estate Center at Texas A&M University
0
2
4
6
2015 2016 2017 2018
Austin-Round Rock Metro AreaAnnual Employment Growth Rates, 2015-2018
Perc
ent
Year:Month
Sources: Texas Workforce Commission and Real Estate Center at Texas A&M University
0
2
4
6
2015 2016 2017 2018
Dallas-Plano-Irving Metro AreaAnnual Employment Growth Rates, 2015-2018
Perc
ent
Year:Month
Sources: Texas Workforce Commission and Real Estate Center at Texas A&M University

24
Figure 43
Figure 44
Figure 45
-1
0
1
2
3
4
2015 2016 2017 2018
Fort Worth-Arlington Metro AreaAnnual Employment Growth Rates, 2015-2018
Perc
ent
Year:Month
Sources: Texas Workforce Commission and Real Estate Center at Texas A&M University
-1
0
1
2
3
4
5
2015 2016 2017 2018
San Antonio-New Braunfels Metro AreaAnnual Employment Growth Rates, 2015-2018
Perc
ent
Year:Month
Sources: Texas Workforce Commission and Real Estate Center at Texas A&M University
-1
0
1
2
3
4
5
2015 2016 2017 2018
Tyler Metro AreaAnnual Employment Growth Rates, 2015-2018
Perc
ent
Year:Month
Sources: Texas Workforce Commission and Real Estate Center at Texas A&M University

25
Figure 46
Figure 47
Figure 48
0
2
4
6
2015 2016 2017 2018
Houston-The Woodlands-Sugar Land Metro AreaAnnual Employment Growth Rates, 2015-2018
Perc
ent
Year:Month
Sources: Texas Workforce Commission and Real Estate Center at Texas A&M University
-1
0
1
2
3
4
2015 2016 2017 2018
Lubbock Metro AreaAnnual Employment Growth Rates, 2015-2018
Perc
ent
Year:Month
Sources: Texas Workforce Commission and Real Estate Center at Texas A&M University
-1
0
1
2
3
4
2015 2016 2017 2018
McAllen-Edinburg Metro AreaAnnual Employment Growth Rates, 2015-2018
Perc
ent
Year:Month
Sources: Texas Workforce Commission and Real Estate Center at Texas A&M University
26
Figure 49
Figure 50
Figure 51
-1
0
1
2
3
4
5
2015 2016 2017 2018
Laredo Metro AreaAnnual Employment Growth Rates, 2015-2018
Perc
ent
Year:Month
Sources: Texas Workforce Commission and Real Estate Center at Texas A&M University
-2
-1
0
1
2
3
2015 2016 2017 2018
Abilene Metro AreaAnnual Employment Growth Rates, 2015-2018
Perc
ent
Year:Month
Sources: Texas Workforce Commission and Real Estate Center at Texas A&M University
-2
-1
0
1
2
3
2015 2016 2017 2018
Amarillo Metro AreaAnnual Employment Growth Rates, 2015-2018
Perc
ent
Year:Month
Sources: Texas Workforce Commission and Real Estate Center at Texas A&M University

27
Figure 52
Figure 53
Figure 54
-1
0
1
2
3
4
2015 2016 2017 2018
Sherman-Denison Metro AreaAnnual Employment Growth Rates, 2015-2018
Perc
ent
Year:Month
Sources: Texas Workforce Commission and Real Estate Center at Texas A&M University
-1
0
1
2
3
4
5
2015 2016 2017 2018
Killeen-Temple Metro AreaAnnual Employment Growth Rates, 2015-2018
Perc
ent
Year:Month
Sources: Texas Workforce Commission and Real Estate Center at Texas A&M University
-2
0
2
4
2015 2016 2017 2018
San Angelo Metro AreaAnnual Employment Growth Rates, 2015-2018
Perc
ent
Year:Month
Sources: Texas Workforce Commission and Real Estate Center at Texas A&M University

28
Figure 55
Figure 56
Figure 57
-1
0
1
2
3
4
2015 2016 2017 2018
El Paso Metro AreaAnnual Employment Growth Rates, 2015-2018
Perc
ent
Year:Month
Sources: Texas Workforce Commission and Real Estate Center at Texas A&M University
-6
-4
-2
0
2
4
2015 2016 2017 2018
Longview Metro AreaAnnual Employment Growth Rates, 2015-2018
Perc
ent
Year:Month
Sources: Texas Workforce Commission and Real Estate Center at Texas A&M University
-2
-1
0
1
2
3
2015 2016 2017 2018
Wichita Falls Metro AreaAnnual Employment Growth Rates, 2015-2018
Perc
ent
Year:Month
Sources: Texas Workforce Commission and Real Estate Center at Texas A&M University

29
Figure 58
Figure 59
Figure 60
-2
-1
0
1
2
3
4
2015 2016 2017 2018
Texarkana Metro AreaAnnual Employment Growth Rates, 2015-2018
Perc
ent
Year:Month
Sources: Texas Workforce Commission and Real Estate Center at Texas A&M University
-1
0
1
2
3
4
2015 2016 2017 2018
Waco Metro AreaAnnual Employment Growth Rates, 2015-2018
Perc
ent
Year:Month
Sources: Texas Workforce Commission and Real Estate Center at Texas A&M University
-1
0
1
2
3
4
2015 2016 2017 2018
Brownsville-Harlingen Metro AreaAnnual Employment Growth Rates, 2015-2018
Perc
ent
Year:Month
Sources: Texas Workforce Commission and Real Estate Center at Texas A&M University

30
Figure 61
Figure 62
Figure 63
-8
-4
0
4
2015 2016 2017 2018
Victoria Metro AreaAnnual Employment Growth Rates, 2015-2018
Perc
ent
Year:Month
Sources: Texas Workforce Commission and Real Estate Center at Texas A&M University
-4
-2
0
2
4
6
2015 2016 2017 2018
Beaumont-Port Arthur Metro AreaAnnual Employment Growth Rates, 2015-2018
Perc
ent
Year:Month
Sources: Texas Workforce Commission and Real Estate Center at Texas A&M University
-2
-1
0
1
2
2015 2016 2017 2018
Corpus Christi Metro AreaAnnual Employment Growth Rates, 2015-2018
Perc
ent
Year:Month
Sources: Texas Workforce Commission and Real Estate Center at Texas A&M University

31
Figure 64
Figure 65
Figure 66
24.6
24.8
25.0
25.2
25.4
25.6
2015 2016 2017 2018
Houston-The Woodlands-Sugar Land Metro AreaShare of Total Texas Jobs, 2015-2018
Perc
ent
Year:Month
Sources: Texas Workforce Commission and Real Estate Center at Texas A&M University
20.0
20.4
20.8
21.2
2015 2016 2017 2018
Dallas-Plano-Irving Metro AreaShare of Total Texas Jobs, 2015-2018
Perc
ent
Year:Month
Sources: Texas Workforce Commission and Real Estate Center at Texas A&M University
7.8
8.0
8.2
8.4
8.6
2015 2016 2017 2018
Austin-Round Rock Metro AreaShare of Total Texas Jobs, 2015-2018
Perc
ent
Year:Month
Sources: Texas Workforce Commission and Real Estate Center at Texas A&M University

32
Figure 67
Figure 68
Figure 69
8.2
8.3
8.4
8.5
8.6
2015 2016 2017 2018
San Antonio-New Braunfels Metro AreaShare of Total Texas Jobs, 2015-2018
Perc
ent
Year:Month
Sources: Texas Workforce Commission and Real Estate Center at Texas A&M University
8.32
8.36
8.40
8.44
8.48
2015 2016 2017 2018
Fort Worth-Arlington Metro AreaShare of Total Texas Jobs, 2015-2018
Perc
ent
Year:Month
Sources: Texas Workforce Commission and Real Estate Center at Texas A&M University
2.52
2.54
2.56
2.58
2.60
2015 2016 2017 2018
El Paso Metro AreaShare of Total Texas Jobs, 2015-2018
Perc
ent
Year:Month
Sources: Texas Workforce Commission and Real Estate Center at Texas A&M University

33
Figure 70
Figure 71
Figure 72
2.00
2.05
2.10
2.15
2.20
2015 2016 2017 2018
McAllen-Edinburg-Mission Metro AreaShare of Total Texas Jobs, 2015-2018
Perc
ent
Year:Month
Sources: Texas Workforce Commission and Real Estate Center at Texas A&M University
1.52
1.56
1.60
1.64
1.68
2015 2016 2017 2018
Corpus Christi Metro AreaShare of Total Texas Jobs, 2015-2018
Perc
ent
Year:Month
Sources: Texas Workforce Commission and Real Estate Center at Texas A&M University
1.28
1.32
1.36
1.40
1.44
2015 2016 2017 2018
Beaumont-Port Arthur Metro AreaShare of Total Texas Jobs, 2015-2018
Perc
ent
Year:Month
Sources: Texas Workforce Commission and Real Estate Center at Texas A&M University

34
Figure 73
Figure 74
Figure 75
1.18
1.19
1.20
1.21
1.22
2015 2016 2017 2018
Lubbock Metro AreaShare of Total Texas Jobs, 2015-2018
Perc
ent
Year:Month
Sources: Texas Workforce Commission and Real Estate Center at Texas A&M University
1.14
1.15
1.16
1.17
1.18
2015 2016 2017 2018
Killeen-Temple Metro AreaShare of Total Texas Jobs, 2015-2018
Perc
ent
Year:Month
Sources: Texas Workforce Commission and Real Estate Center at Texas A&M University
1.13
1.14
1.15
1.16
1.17
1.18
2015 2016 2017 2018
Brownsville-Harlingen Metro AreaShare of Total Texas Jobs, 2015-2018
Perc
ent
Year:Month
Sources: Texas Workforce Commission and Real Estate Center at Texas A&M University

35
Figure 76
Figure 77
Figure 78
0.96
0.97
0.98
0.99
1.00
2015 2016 2017 2018
Waco Metro AreaShare of Total Texas Jobs, 2015-2018
Perc
ent
Year:Month
Sources: Texas Workforce Commission and Real Estate Center at Texas A&M University
0.97
0.98
0.99
1.00
1.01
2015 2016 2017 2018
Amarillo Metro AreaShare of Total Texas Jobs, 2015-2018
Perc
ent
Year:Month
Sources: Texas Workforce Commission and Real Estate Center at Texas A&M University
0.80
0.85
0.90
0.95
1.00
2015 2016 2017 2018
College Station-Bryan Metro AreaShare of Total Texas Jobs, 2015-2018
Perc
ent
Year:Month
Sources: Texas Workforce Commission and Real Estate Center at Texas A&M University

36
Figure 79
Figure 80
Figure 81
.850
.855
.860
.865
.870
2015 2016 2017 2018
Tyler Metro AreaShare of Total Texas Jobs, 2015-2018
Perc
ent
Year:Month
Sources: Texas Workforce Commission and Real Estate Center at Texas A&M University
.840
.845
.850
.855
.860
2015 2016 2017 2018
Laredo Metro AreaShare of Total Texas Jobs, 2015-2018
Perc
ent
Year:Month
Sources: Texas Workforce Commission and Real Estate Center at Texas A&M University
.68
.72
.76
.80
.84
2015 2016 2017 2018
Midland Metro AreaShare of Total Texas Jobs, 2015-2018
Perc
ent
Year:Month
Sources: Texas Workforce Commission and Real Estate Center at Texas A&M University

37
Figure 82
Figure 83
Figure 84
.76
.78
.80
.82
.84
.86
.88
2015 2016 2017 2018
Longview Metro AreaShare of Total Texas Jobs, 2015-2018
Perc
ent
Year:Month
Sources: Texas Workforce Commission and Real Estate Center at Texas A&M University
.56
.60
.64
.68
.72
2015 2016 2017 2018
Odessa Metro AreaShare of Total Texas Jobs, 2015-2018
Perc
ent
Year:Month
Sources: Texas Workforce Commission and Real Estate Center at Texas A&M University
.555
.560
.565
.570
.575
.580
2015 2016 2017 2018
Abilene Metro AreaShare of Total Texas Jobs, 2015-2018
Perc
ent
Year:Month
Sources: Texas Workforce Commission and Real Estate Center at Texas A&M University

38
Figure 85
Figure 86
Figure 87
.485
.490
.495
.500
.505
.510
.515
2015 2016 2017 2018
Texarkana Metro AreaShare of Total Texas Jobs, 2015-2018
Perc
ent
Year:Month
Sources: Texas Workforce Commission and Real Estate Center at Texas A&M University
.475
.480
.485
.490
.495
.500
2015 2016 2017 2018
Wichita Falls Metro AreaShare of Total Texas Jobs, 2015-2018
Perc
ent
Year:Month
Sources: Texas Workforce Commission and Real Estate Center at Texas A&M University
.395
.400
.405
.410
.415
.420
.425
2015 2016 2017 2018
San Angelo Metro AreaShare of Total Texas Jobs, 2015-2018
Perc
ent
Year:Month
Sources: Texas Workforce Commission and Real Estate Center at Texas A&M University

39
Figure 88
Figure 89
Figure 90
.378
.380
.382
.384
.386
.388
2015 2016 2017 2018
Sherman-Denison Metro AreaShare of Total Texas Jobs, 2015-2018
Perc
ent
Year:Month
Sources: Texas Workforce Commission and Real Estate Center at Texas A&M University
.32
.34
.36
.38
.40
2015 2016 2017 2018
Victoria Metro AreaShare of Total Texas Jobs, 2015-2018
Perc
ent
Year:Month
Sources: Texas Workforce Commission and Real Estate Center at Texas A&M University
0.4
0.5
0.6
0.7
0.8
0.9
1.0
2015 2016 2017 2018
Dallas-Plano-Irving Metro AreaContribution to Texas Employment Growth Rate, 2015-2018
Perc
ent
Year:Month
Sources: Texas Workforce Commission and Real Estate Center at Texas A&M University
40
Figure 91
Figure 92
Figure 93
-0.2
0.0
0.2
0.4
0.6
0.8
1.0
2015 2016 2017 2018
Houston-The Woodlands-Sugar Land Metro AreaContribution to Texas Employment Growth Rate, 2015-2018
Perc
ent
Year:Month
Sources: Texas Workforce Commission and Real Estate Center at Texas A&M University
.20
.25
.30
.35
.40
2015 2016 2017 2018
Austin-Round Rock Metro AreaContribution to Texas Employment Growth Rate, 2015-2018
Perc
ent
Year:Month
Sources: Texas Workforce Commission and Real Estate Center at Texas A&M University
.15
.20
.25
.30
.35
2015 2016 2017 2018
San Antonio-New Braunfels Metro AreaContribution to Texas Employment Growth Rate, 2015-2018
Perc
ent
Year:Month
Sources: Texas Workforce Commission and Real Estate Center at Texas A&M University

41
Figure 94
Figure 95
Figure 96
.0
.1
.2
.3
.4
.5
.6
2015 2016 2017 2018
Fort Worth-Arlington Metro AreaContribution to Texas Employment Growth Rate, 2015-2018
Perc
ent
Year:Month
Sources: Texas Workforce Commission and Real Estate Center at Texas A&M University
-.08
-.04
.00
.04
.08
2015 2016 2017 2018
Midland Metro AreaContribution to Texas Employment Growth Rate, 2015-2018
Perc
ent
Year:Month
Sources: Texas Workforce Commission and Real Estate Center at Texas A&M University
.00
.02
.04
.06
.08
2015 2016 2017 2018
College Station-Bryan Metro AreaContribution to Texas Employment Growth Rate, 2015-2018
Perc
ent
Year:Month
Sources: Texas Workforce Commission and Real Estate Center at Texas A&M University

42
Figure 97
Figure 98
Figure 99
-.10
-.05
.00
.05
2015 2016 2017 2018
Odessa Metro AreaContribution to Texas Employment Growth Rate, 2015-2018
Perc
ent
Year:Month
Sources: Texas Workforce Commission and Real Estate Center at Texas A&M University
.00
.02
.04
.06
.08
.10
2015 2016 2017 2018
McAllen-Edinburg-Mission Metro AreaContribution to Texas Employment Growth Rate, 2015-2018
Perc
ent
Year:Month
Sources: Texas Workforce Commission and Real Estate Center at Texas A&M University
.00
.02
.04
.06
.08
2015 2016 2017 2018
El Paso Metro AreaContribution to Texas Employment Growth Rate, 2015-2018
Perc
ent
Year:Month
Sources: Texas Workforce Commission and Real Estate Center at Texas A&M University

43
Figure 100
Figure 101
Figure 102
.01
.02
.03
.04
2015 2016 2017 2018
Lubbock Metro AreaContribution to Texas Employment Growth Rate, 2015-2018
Perc
ent
Year:Month
Sources: Texas Workforce Commission and Real Estate Center at Texas A&M University
.00
.01
.02
.03
2015 2016 2017 2018
Tyler Metro AreaContribution to Texas Employment Growth Rate, 2015-2018
Perc
ent
Year:Month
Sources: Texas Workforce Commission and Real Estate Center at Texas A&M University
.00
.01
.02
.03
.04
.05
.06
2015 2016 2017 2018
Killeen-Temple Metro AreaContribution to Texas Employment Growth Rate, 2015-2018
Perc
ent
Year:Month
Sources: Texas Workforce Commission and Real Estate Center at Texas A&M University

44
Figure 103
Figure 104
Figure 105
.00
.01
.02
.03
.04
2015 2016 2017 2018
Laredo Metro AreaContribution to Texas Employment Growth Rate, 2015-2018
Perc
ent
Year:Month
Sources: Texas Workforce Commission and Real Estate Center at Texas A&M University
-.02
-.01
.00
.01
.02
.03
2015 2016 2017 2018
Amarillo Metro AreaContribution to Texas Employment Growth Rate, 2015-2018
Perc
ent
Year:Month
Sources: Texas Workforce Commission and Real Estate Center at Texas A&M University
-.015
-.010
-.005
.000
.005
.010
.015
2015 2016 2017 2018
Abilene Metro AreaContribution to Texas Employment Growth Rate, 2015-2018
Perc
ent
Year:Month
Sources: Texas Workforce Commission and Real Estate Center at Texas A&M University

45
Figure 106
Figure 107
Figure 108
-.06
-.04
-.02
.00
.02
.04
2015 2016 2017 2018
Longview Metro AreaContribution to Texas Employment Growth Rate, 2015-2018
Perc
ent
Year:Month
Sources: Texas Workforce Commission and Real Estate Center at Texas A&M University
-.004
.000
.004
.008
.012
2015 2016 2017 2018
Sherman-Denison Metro AreaContribution to Texas Employment Growth Rate, 2015-2018
Perc
ent
Year:Month
Sources: Texas Workforce Commission and Real Estate Center at Texas A&M University
-.012
-.008
-.004
.000
.004
.008
.012
2015 2016 2017 2018
San Angelo Metro AreaContribution to Texas Employment Growth Rate, 2015-2018
Perc
ent
Year:Month
Sources: Texas Workforce Commission and Real Estate Center at Texas A&M University

46
Figure 109
Figure 110
Figure 111
-.008
-.004
.000
.004
.008
.012
2015 2016 2017 2018
Wichita Falls Metro AreaContribution to Texas Employment Growth Rate, 2015-2018
Perc
ent
Year:Month
Sources: Texas Workforce Commission and Real Estate Center at Texas A&M University
-.010
-.005
.000
.005
.010
.015
.020
2015 2016 2017 2018
Texarkana Metro AreaContribution to Texas Employment Growth Rate, 2015-2018
Perc
ent
Year:Month
Sources: Texas Workforce Commission and Real Estate Center at Texas A&M University
.00
.01
.02
.03
.04
2015 2016 2017 2018
Waco Metro AreaContribution to Texas Employment Growth Rate, 2015-2018
Perc
ent
Year:Month
Sources: Texas Workforce Commission and Real Estate Center at Texas A&M University

47
Figure 112
Figure 113
Figure 114
-.03
-.02
-.01
.00
.01
.02
2015 2016 2017 2018
Victoria Metro AreaContribution to Texas Employment Growth Rate, 2015-2018
Perc
ent
Year:Month
Sources: Texas Workforce Commission and Real Estate Center at Texas A&M University
.00
.01
.02
.03
.04
.05
.06
2015 2016 2017 2018
Brownsville-Harlingen Metro AreaContribution to Texas Employment Growth Rate, 2015-2018
Perc
ent
Year:Month
Sources: Texas Workforce Commission and Real Estate Center at Texas A&M University
-.04
-.02
.00
.02
.04
.06
2015 2016 2017 2018
Beaumont-Port Arthur Metro AreaContribution to Texas Employment Growth Rate, 2015-2018
Perc
ent
Year:Month
Sources: Texas Workforce Commission and Real Estate Center at Texas A&M University

48
Figure 115
-.04
-.02
.00
.02
.04
2015 2016 2017 2018
Corpus Christi Metro AreaContribution to Texas Employment Growth Rate, 2015-2018
Perc
ent
Year:Month
Sources: Texas Workforce Commission and Real Estate Center at Texas A&M University

i
ADVISORY COMMITTEE
MAYS BUSINESS SCHOOL
Texas A&M University 2115 TAMU
College Station, TX 77843-2115
http://recenter.tamu.edu 979-845-2031
DIRECTOR
GARY W. MALER
MARIO A. ARRIAGA Conroe
RUSSELL CAIN Port Lavaca
ALVIN COLLINS Andrews
JACQUELYN K. HAWKINS Austin
DOUG JENNINGS, CHAIRMAN Fort Worth
BESA MARTIN, VICE CHAIRMAN Boerne
TED NELSON HoustonDOUG ROBERTS AustinC. CLARK WELDER San AntonioJAN FITE-MILLER, EX-OFFICIO Dallas