monthly review and comment - credit suisse
TRANSCRIPT

Monthly Review and Comment
April 2011
Monthly Review and Comment
DISCLOSURE APPENDIX AT THE BACK OF THIS REPORT CONTAINS IMPORTANT DISCLOSURES, ANALYST CERTIFICATIONS, AND THE STATUS OF NON-US ANALYSTS. US Disclosure: Credit Suisse does and seeks to do business with companies covered in its research reports. As a result, investors should be aware that the Firm may have a conflict of interest that could affect the objectivity of this report. Investors should consider this report as only a single factor in making their investment decision.
June 2016 Americas / United States
EQUITY RESEARCH Monthly Review and Comment

June 2016
Monthly Review and Comment 2
Table of Contents U.S. FOCUS LIST 3 COVERAGE AND OPINION CHANGES 4 ANALYST STOCK PICKS BY INDUSTRY 5 INVESTMENT STRATEGY AND ECONOMICS (excerpts from recently published macroeconomic reports) 7
Key Macro Forecasts 7 U.S. Economics 8 U.S. Equity Strategy 9 Global Equity Strategy 11 Global Energy Economics 12 Accounting & Tax 13
INDUSTRY REPORTS (excerpts from recently published industry and company research) 14 Consumer Discretionary 15
Media 15 Restaurants 16 Global Luxury Goods 17 Department Stores 18 Home Improvement 19 Specialty Softlines 21
Consumer Staples 23 Food and Drug Retailing 23
Energy 25 Canadian Energy 25 Offshore Services 26 Marine 27 Oilfield Services and Equipment 28
Financials 30 U.S. Large- and Mid-Cap Banks 30 April Real Estate Agents Survey 31 Canadian Banks 32 U.S. Brokers 33
Health Care 34 Hospital Volume Tracker 34 Global Pharmaceuticals 35 Health Care Technology and Distribution 36 Animal Tracks 37
Industrials 38 North American Railroads 38 Electrical Equipment and Multi-Industry 39
Materials 40 Agricultural Sciences Sector 40
INDUSTRY VALUATION TABLES 41 Consumer Discretionary 42
Apparel, Footwear & Specialty Softlines 42
Homebuilding 43 Media, Canada 44 Movie Exhibitors 44 Off Price Retail 45 Restaurants 45 Retail, Mall Anchors 46 Retail, Mass Merchants 46 Specialty Hardlines 47 Travel & Leisure 48 U.S. Media, Cable & Satellite 48
Consumer Staples 49 Agricultural Products & Agribusiness 49 Drug & Food Retail & General
Merchandise Stores 49 Drug & Food Retail, Canada 50 Packaged Foods 51
Energy 52 Alternative Energy 52 Independent Refiners 53 Integrated Oil & Gas 53 Master Limited Partnerships 54 Oil & Gas E&P, Canada/
International 55 Oil & Gas Equipment & Services 56 Oil & Gas Exploration & Production 57
Oil & Gas, Canada 58 Oilfield Equipment & Services 59 Pipelines & Utilities 60
Financials 61 Asset Managers 61 Canadian Financials 62 Capital Markets 63 Diversified Financial Services 63 Large-Cap Banks 64 Mid-Cap Banks 64 Mortgage REITs, Servicers, Insurers,
and BDCs 65 Property & Casualty Insurance 66 REITs 67 Specialty Finance 68
Global Services 69 Business & Professional Services 69 Knowledge Services 69 Payments & Financial Technology 70
Healthcare 71 Animal Health 71 Biotechnology 71 Healthcare Technology &
Distribution 72 Major Pharmaceuticals 73 Managed Care & Healthcare
Facilities 74 Medical Supplies & Devices 74
SMID-Cap Biotechnology 75 Industrials 76
Aerospace & Defense 76 Airfreight & Ground Transport 77 Airlines 78 Electrical Equipment &
Multi-Industry 79 Engineering & Construction 80 Environmental Services 80 Machinery 81 Ocean Shipping 81 SMID-Cap Aerospace & Defense 82 Trading Companies & Distributors 82
Materials 83 Metals & Materials, Canada 83 Paper & Packaging 83 Precious Metals 84 U.S. Chemicals & Agriculture 85 U.S. Metals & Mining 86
Technology 87 Internet 87 IT Hardware, Networking & Telecom
Equipment 88 Semiconductor Equipment 89 Semiconductors 89 Small- & Mid-Cap Software 90 Software 91
Telecommunication Services 92 Wireline 92
PERFORMANCE OF S&P 500 BY INDUSTRY 93 CONFERENCE CALENDAR 97 U.S. EQUITY RESEARCH ANALYSTS 98

June 2016
U.S. Focus List 3
U.S. FOCUS LIST
U.S. Focus List Performance Valuation
5/31 Total Return EPS Estimates1 P/E Ratios* Yield
Price YTD 3 Mos. 1 Mo. FY1 FY2 FY1 FY2 %
Equal Weighted Focus List 427.73 -0.15 13.14 -0.57 21.40 24.14 19.99 17.72 1.5
S&P 500 2096.96 2.59 6.00 1.53 122.65 130.58 17.10 16.06 2.2
DJIA 17787.20 2.08 5.47 0.08 1212.22 1299.47 14.43 13.69 2.7
Nasdaq Composite2 4948.05 -1.19 5.51 3.62 NA NA NA NA 1.3
Focus List Stocks3, 4
2016 Date Added or Return Potential
2015 Year-End 5/31 Relative Price EPS Estimates6
Ticker Date Price Price to S&P5 Price Return FY1 FY2 FY1 FY2 %
Consumer
21st Century Fox Inc. FOXA 5/23 28.19 28.88 0.01 40 38.5 1.74 2.25 16.57 12.84 1.0%
Hanesbrands Inc. HBI 12/31 29.43 27.07 -10.81 39 44.1 1.90 2.17 14.28 12.45 1.5%
Kellogg Company K 4/6 77.78 74.37 -5.53 86 15.6 3.73 4.10 19.94 18.13 1.6%
McDonald's Corp MCD 12/31 118.14 122.06 0.54 135 10.6 5.57 6.32 21.91 19.32 2.9%
Energy
Concho Resources, Inc. CXO 12/31 92.86 121.34 27.10 130 7.1 -0.63 -1.16 NM NM 0.0%
Financials
Affiliated Managers Group AMG 12/31 159.76 173.52 5.05 238 37.2 13.57 15.59 12.79 11.13 0.0%
JPMorgan Chase & Co. JPM 12/31 66.03 65.27 -3.30 75 14.9 5.56 6.47 11.75 10.09 2.7%
Taubman Centers, Inc. TCO 12/31 76.72 68.57 -13.44 85 24.0 3.62 3.89 38.50 37.54 3.4%
Healthcare
Eli Lilly & Co. LLY 12/31 84.26 75.03 -13.30 91 21.3 3.58 3.84 20.94 19.52 2.7%
Industrials
Allison Transmission ALSN 12/31 25.89 28.09 6.24 33 17.5 1.14 1.27 24.67 22.08 2.0%
Southwest Airlines Co. LUV 12/31 43.06 42.48 -4.74 60 41.2 4.29 5.33 9.90 7.96 0.8%
Materials
Sealed Air Corp. SEE 12/31 44.60 46.44 0.85 63 35.7 2.60 3.01 17.87 15.41 1.2%
Technology
Apple Inc AAPL 4/4 111.12 99.86 -11.44 150 50.2 8.18 9.64 12.20 10.36 0.0%
Autodesk Inc. ADSK 12/31 60.93 58.27 -7.93 100 71.6 -0.78 1.41 NM 41.20 0.0%
Facebook Inc. FB 12/31 104.66 118.81 9.95 145 22.0 3.49 4.94 34.07 24.04 0.0%
2011 2012 2013 2014 2015
Focus List Performance Statistics
Credit Suisse US Focus List Performance -5.5 16.5 35.9 15.1 -6.1
S&P 500 Return 2.1 16.0 32.4 11.4 0.0
Relative Performance -7.6 0.5 3.5 3.7 -6.1
Focus List Turnover Statistics
17 20 22 20 20
14 18 20 21 21
11 16 23 19 19
72% 86% 93% 89% 106%Turnover (% )
Average No. of Companies
Added
Deleted
Target
Year
P/E Ratios
1Actual earnings are reported; forecast earnings are First Call consensus operating EPS estimates for the S&P indices (top down) and DJIA (bottom up). 2Nasdaq Composite Index performance does not include dividends.
3 Removed from Focus List in 2016: Devon Energy Corp., 2/24, Marriott International, 2/29, Micron Technology Inc., 3/31, Mondelez, 4/6, and Canadian Pacific Railways, 4/8, Tesla Motors, Inc., 4/20, and Time Warner, Inc., 5/23. 4 Added to Focus List in 2016: Apple, 4/4, Kellogg Company, 4/6, and 21st Century Fox, Inc., 5/23.
5Return for period 12/31/15-5/31/16. The Start Price for stocks added to the Focus List prior to 2015 represents the closing price of the stock on 12/31/15. For stocks added subsequent to 12/31/15, the Start Price reflects the price of the stock on the date it was added to the Focus List. 6Fiscal estimates reflect company fiscal year-end. *P/E – Only profitable companies included. NA – Not available. NM – Not meaningful.
Copies of each analyst’s most recent report on the companies listed above are available on research-and-analytics.credit-suisse.com or by contacting Credit Suisse’s Equity Research Department.
The Credit Suisse U.S. Focus List is a bottom-up portfolio that seeks superior investment performance by identifying and analyzing our best research ideas, with a 12-month investment horizon. Stock selection resides with the U.S. Investment Policy Committee (IPC), which is not constrained by market cap, sector weightings, or market indices. The portfolio is screened against analysts’ “Top Picks” as published in the Monthly Review and Comment, Credit Suisse’s proprietary multifactor quantitative model, and against our HOLT valuation framework. The IPC meets regularly to review the portfolio and discuss analysts’ recommendations. The Focus List performance is calculated on a daily total-return basis and is published in the Monthly Review and Comment and Weekly Insights and is also available through Research & Analytics on the Credit Suisse website.

June 2016
Coverage and Opinion Changes 4
COVERAGE AND OPINION CHANGES
Rating Company Ticker New Date Old Analyst
Initiations
Align Technology, Inc. ALGN OUTPERFORM 11-May-16
Robert Willoughby
Callon Petroleum Company CPE OUTPERFORM 24-May-16
Mark Lear
Intellia Therapeutics, Inc. NTLA OUTPERFORM 31-May-16
Alethia Young
SecureWorks Corp. SCWX NEUTRAL 17-May-16
Philip Winslow
Summit Midstream Partners, LP SMLP NEUTRAL 24-May-16
John Edwards
Tesaro, Inc. TSRO OUTPERFORM 12-May-16
Alethia Young
Teva Pharmaceutical Industries Ltd. TEVA NEUTRAL 04-May-16
Vamil Divan
Reinstating
Baker Hughes Inc. BHI OUTPERFORM 02-May-16 RESTRICTED James Wicklund
DHX Media Ltd DHX.TO OUTPERFORM 13-May-16 RESTRICTED Robert Peters
Halliburton HAL OUTPERFORM 02-May-16 RESTRICTED James Wicklund
Keyera Corp. KEY.TO NEUTRAL 25-May-16 RESTRICTED Andrew M. Kuske
Rating Changes Upgrades
Gibson Energy Inc. GEI.TO NEUTRAL 26-May-16 UNDERPERFORM Andrew M. Kuske
Golar LNG Ltd. GLNG OUTPERFORM 09-May-16 NEUTRAL Gregory Lewis
Johnson Controls Inc JCI OUTPERFORM 23-May-16 NEUTRAL Julian Mitchell
Midcoast Energy Partners, L.P. MEP NEUTRAL 03-May-16 UNDERPERFORM John Edwards
ONEOK Partners, LP OKS NEUTRAL 05-May-16 UNDERPERFORM John Edwards
Toronto Dominion Bank TD.TO OUTPERFORM 03-May-16 NEUTRAL Kevin R. Choquette
Downgrades
Acadian Timber Corp. ADN.TO NEUTRAL 10-May-16 OUTPERFORM Andrew M. Kuske
Alimentation Couche-Tard Inc. ATDB.TO UNDERPERFORM 02-May-16 NEUTRAL David Hartley
Anadarko Petroleum Corp. APC NEUTRAL 04-May-16 OUTPERFORM Edward Westlake
Atento S.A. ATTO NEUTRAL 11-May-16 OUTPERFORM Daniel Federle
Canadian Tire Corporation Limited CTCa.TO UNDERPERFORM 12-May-16 NEUTRAL David Hartley
Kinross Gold Corp. KGC NEUTRAL 03-May-16 OUTPERFORM Anita Soni
Marketo, Inc. MKTO NEUTRAL 31-May-16 OUTPERFORM Philip Winslow
National Bank of Canada NA.TO NEUTRAL 03-May-16 OUTPERFORM Kevin R. Choquette
Portola Pharmaceuticals PTLA NEUTRAL 30-May-16 OUTPERFORM Vamil Divan
SeaWorld Entertainment SEAS UNDERPERFORM 11-May-16 OUTPERFORM Benjamin Chaiken
St Jude Medical STJ NEUTRAL 02-May-16 OUTPERFORM Matthew Keeler

June 2016
Analyst Stock Picks by Industry 5
ANALYST STOCK PICKS BY INDUSTRY
Industry Stock Picks Tkr
Target Price
CONSUMER DISCRETIONARY Apparel, Footwear & Specialty Softlines Hanesbrands Inc. HBI 39.00 lululemon
athletica Inc. LULU 76.00
Nike Inc. NKE 68.00 Homebuilding CalAtlantic Inc. CAA 40.00 Caesarstone Ltd. CSTE 47.00 Taylor Morrison TMHC 18.00 Restaurants Darden
Restaurants, Inc DRI 72.00
McDonald's Corp MCD 135.00 Panera Bread
Company PNRA 225.00
Retail, Mass Merchants Costco Wholesale Corporation
COST 165.00
Specialty Hardlines Home Depot HD 147.00 Sportsman's
Warehouse Holdings, Inc.
SPWH 16.00
Travel & Leisure Vail Resorts MTN 145.00 Six Flags
Entertainment Corp.
SIX 67.00
Marriott Vacations Worldwide
VAC 73.00
U.S. Media, Cable & Satellite CBS Corporation CBS 75.00 21st Century Fox
Inc. FOXA 40.00
Time Warner Inc. TWX 90.00 CONSUMER STAPLES Drug & Food Retail & General Merchandise Stores
Dollar General DG 95.00
Sprouts Farmers Markets
SFM 28.00
Sysco Corporation SYY 55.00 Drug & Food Retail, Canada Loblaw
Companies Limited(C$)
L 77.00
Packaged Foods Kellogg Company K 86.00 Mondelez MDLZ 48.00 J.M. Smucker Co. SJM 142.00 ENERGY Alternative Energy Jinko Solar JKS 40.00 Sunrun RUN 18.00 SolarCity SCTY 38.00 Independent Refiners Marathon MPC 48.00 Integrated Oil & Gas Devon Energy
Corp DVN 42.00
Master Limited Partnerships EQT Midstream Partners, LP
EQM 109.00
Genesis Energy, LP
GEL 46.00
Tallgrass Energy Partners, L.P.
TEP 60.00
Oil & Gas E&P, Canada/International NuVista Energy(C$)
NVA 6.25
Parex Resources Inc.(C$)
PXT 13.00
Seven Generations Energy Ltd.(C$)
VII 26.00
Industry Stock Picks Tkr
Target Price
Oil & Gas Exploration Concho Resources, Inc. CXO 130.00 & Production Noble Energy NBL 42.00 PDC Energy PDCE 81.00 Oil & Gas, Canada Canadian Natural
Resources Limited(C$) CNQ 42.00
Suncor Energy(C$) SU 41.00 Oilfield Equipment & Services Baker Hughes Inc. BHI 56.00 Halliburton HAL 49.00 Schlumberger SLB 87.00 FINANCIALS Asset Managers Affiliated Managers
Group AMG 238.00
Capital Markets Goldman Sachs Group, Inc.
GS 180.00
IntercontinentalExchange, Inc.
ICE 280.00
Lazard Ltd. LAZ 44.00 Large-Cap Banks Bank of America Corp. BAC 18.00 JPMorgan Chase & Co. JPM 75.00 Mid-Cap Banks BB&T Corp. BBT 42.00 KeyCorp KEY 16.00 Zions Bancorporation ZION 30.00 Mortgage REITs, Servicers, Insurers, and BDCs
New Residential NRZ 17.00
Nationstar Mortgage Holdings Inc.
NSM 19.00
PennyMac Mortgage Investment Trust
PMT 16.00
Property & Casualty Insurance Arthur J. Gallagher & Co. AJG 47.00 Allstate Corporation ALL 74.00 CB Limited CB 131.00 REITs Brandywine Realty Trust BDN 16.00 Simon Property Group,
Inc. SPG 230.00
Taubman Centers, Inc. TCO 85.00 Specialty Finance Synchrony Financial SYF 38.00 Visa Inc. V 85.00 GLOBAL SERVICES Business & Professional Services Gartner Inc IT 106.00 Nielsen Holdings NLSN 58.00 ServiceMaster Global
Holdings Inc SERV 44.00
Knowledge Services Houghton Mifflin Harcourt Company
HMHC 23.00
Grand Canyon Education, Inc
LOPE 62.00
Nord Anglia Education Inc.
NORD 23.00
Payments & Financial Technology Global Payments Inc. GPN 68.00 PayPal Holdings, Inc. PYPL 39.00 HEALTHCARE Animal Health Zoetis ZTS 59.00 Biotechnology Biomarin
Pharmaceuticals, Incorporated
BMRN 114.00
Celgene Corporation CELG 140.00 Gilead Sciences,
Incorporated GILD 120.00
Healthcare Technology & Distribution
Cardinal Health CAH 97.00
Express Scripts ESRX 85.00 DENTSPLY-SIRONA XRAY 72.00

June 2016
Analyst Stock Picks by Industry 6
Industry Stock Picks Tkr
Target Price
Major Pharmaceuticals Bristol Myers Squibb Co. BMY 79.00 Eli Lilly & Co. LLY 91.00 Pfizer PFE 39.00 Managed Care & Healthcare Facilities
Centene Corporation CNC 78.00
HCA Holdings, Inc. HCA 90.00 UnitedHealth Group
Incorporated UNH 141.00
Medical Supplies & Devices Boston Scientific Corp BSX 22.00 SMID-Cap Biotechnology Five Prime
Therapeutics, Inc FPRX 55.00
UltraGenyx Pharmaceutical, Inc
RARE 101.00
INDUSTRIALS Aerospace & Defense BE Aerospace Inc. BEAV 58.00 CACI International, Inc. CACI 115.00 Spirit AeroSystems SPR 57.00 Airfreight & Ground Transport Canadian Pacific
Railways CP 163.00
JB Hunt Transport Services
JBHT 96.00
Union Pacific UNP 94.00 Airlines American Airlines Group
Inc. AAL 47.00
Delta Air Lines, Inc. DAL 58.00 Southwest Airlines Co. LUV 60.00 Electrical Equipment & Multi-Industry
Ingersoll-Rand Plc IR 72.00
Johnson Controls Inc JCI 50.00 3M MMM 178.00 Engineering & Construction AECOM ACM 35.00 Chicago Bridge & Iron CBI 51.00 Environmental Services Waste Management, Inc. WM 65.00 Machinery Allison Transmission ALSN 33.00 Cummins Inc. CMI 130.00 Parker Hannifin
Corporation PH 126.00
Industry Stock Picks Tkr
Target Price
Ocean Shipping Euronav NV EURN 20.00 Scorpio Tankers Inc. STNG 10.00 SMID-Cap Aerospace & Defense Allegheny Technologies,
Inc ATI 45.00
Trading Companies & Distributors W. W. Grainger, Inc. GWW 253.00 HD Supply HDS 35.00 MATERIALS Precious Metals Agnico Eagle Mines
Limited AEM 50.00
Paper & Packaging Sealed Air Corp. SEE 63.00 U.S. Chemicals & Agriculture Air Products & Chemicals APD 161.00 CF Industries Holding Inc. CF 38.00 U.S. Metals & Mining Constellium CSTM 10.00 Steel Dynamics, Inc. STLD 27.00 United States Steel Corp. X 22.00 TECHNOLOGY Internet Amazon com Inc. AMZN 880.00 Facebook Inc. FB 145.00 Alphabet GOOGL 920.00 IT Hardware, Networking & Telecom Equipment
Apple Inc AAPL 150.00
Arista Networks ANET 90.00 Nokia NOKIA 7.30 Semiconductor Equipment Lam Research Corp. LRCX 98.00 Semiconductors Broadcom Ltd AVGO 180.00 Intel Corp. INTC 40.00 NXP Semiconductors
N.V. NXPI 120.00
Small- & Mid-Cap Software 2U, Inc TWOU 32.00 The Ultimate Software
Group, Inc. ULTI 225.00
Software Autodesk Inc. ADSK 100.00 Box, Inc. BOX 24.00 Oracle Corporation ORCL 50.00
Note: Boldface names indicate analysts’ new top stock picks.

June 2016
Investment Strategy and Economics 7
INVESTMENT STRATEGY AND ECONOMICS (excerpts from recently published macroeconomic reports)
Key Macro Forecasts Q-to-Q % Change at annual rate 2014A 2015A 2016A 2016E 2016E 2016E 2016E
Q1 Q2 Q3 Q4
Real GDP 2.5 2.0 0.8 2.6 2.3 2.6 2.1
CPI (Y/Y%) 0.4 0.4 1.1 1.0 1.0 1.4 1.4
Core CPI (Y/Y%) 2.0 2.0 2.3 2.2 2.2 2.2 2.2
Core PCE (Y/Y%) 1.4 1.4 1.7 1.6 1.7 1.8 1.8
Industrial Production -1.6 -1.6 -1.5 0.7 2.2 2.7 1.0
Unemployment Rate (qtr. Avg. %) 5.0 5.0 4.9 5.0 4.8 4.7 4.7
Fed Funds Rate (End of Period in %) 0-.25 .25-.50 .25-.50 .25-.50 .50-.75 .75-1.00 .75-1.00
Asset Allocation Benchmark
Recommended
Weight OW (+) UW (-)
Corporate Bonds 5.0 6.0#ERR: Could not find the time series 'GLS_CORPBONDS_T'
Global Equity Strategy Forecasts 2015E 2016E
S&P 500 Index 2,100 2,150
DJ Euro Stoxx 50 3,080 3,350
FTSE 100 6,600 6,600
Nikkei 225 20,500 18,000
MSCI EMF GEM 860 960
MSCI AC World 492 492
Regional Allocation Target Weight Benchmark Active Weight
US 52.7 56.9 -7.4
Europe ex UK 19.2 16.7 15.0
UK 7.5 7.5 0.0
Japan 10.2 8.5 20.0
GEM 10.3 10.3 0.0
Global Energy Forecasts 2015A 2016E 2017E 2018E 2019E Long Term
WTI ($/bbl) 48.8 36.9 52.9 65.0 65.0 67.5
Brent ($bbl) 53.6 37.8 54.3 67.5 67.5 70.0
US Natural Gas NYMEX ($/mcf) 2.7 2.3 3.3 3.5 3.5
Global Commodities Forecasts 2014A 2015A 2016E 2017E 2018E 2019E 2020E 2021E 2022E Long Term
Gold (US$/oz) 1265.5 1160.2 1270.3 1312.5 1250.0 1225.0 1200.0 1211.6 1230.1 1200.0
Silver (US$/oz) 19.0 15.7 16.2 16.5 17.0 17.0 17.5 17.7 18.1 18.0
Platinum (US$/oz) 1384.3 1198.2 1254.4 1550.0 1750.0 1839.0 1876.0 1878.3 1867.6 1700.0
Palladium (US$/oz) 803.0 691.2 757.3 912.5 955.0 973.5 993.0 994.4 988.8 900.0
Copper (US$/lb) 3.1 2.5 2.1 1.9 1.8 2.0 2.0 2.1 2.4 3.0
Nickel (US$/lb) 7.7 5.4 4.7 6.1 6.8 6.8 7.0 7.3 7.9 9.1
Alumina (Spot - US$/t) 330.3 300.9 236.5 250.0 260.0 270.0 280.0 285.4 294.0 300.0
lead (US$/lb) 1.0 0.8 0.8 0.9 0.9 0.9 0.9 0.9 0.9 0.9
Iron ore - fines, qtrly (US$/dMtu) 141.9 81.9 65.8 54.8 53.2 53.2 51.6 59.3 71.5 104.8
Global Foreign Exchange Forecasts 3M 12M
U.S. Dollar per Euro 1.17 1.10
Yen per U.S. Dollar 105.00 105.00
U.S. Dollar per British Pound 1.58 1.49
Swiss Franc per U.S. Dollar 0.97 1.05
U.S. Dollar per Australian Dollar 0.74 0.70
Canadian Dollar per U.S. Dollar 1.30 1.38
Interest Rates Forecasts 2016:Q1 2016:Q2 2016:Q3 2016:Q3
2-Yr Yield 0.70 0.75 0.80 0.90
5-Yr Yield 1.25 1.30 1.35 1.45
10-Yr-Yield 1.80 1.85 1.90 2.00
30-Yr-Yield 2.55 2.60 2.65 2.70
Source: Credit Suisse Group.

June 2016
U.S. Economics 8
From report dated 26 May 2016
Economics
U.S. Economics Research Analyst
James Sweeney 212 538 4648
ECONOMICS
Get Going
■ We still expect two Federal Reserve interest rate hikes of 25 basis points in
2016; however, we now believe that the first will be in July, not September.
Market pricing implies one hike in 2016, with near even chances of one
before August. Although the economic data are now consistent with a June
hike, careful risk management by the Fed suggests that it will delay until
July. The Federal Open Market Committee (FOMC) meets on June 15, and
the Brexit vote is on June 23. If the probability of Brexit really is roughly
25%1, then the Fed may hedge its risks by delaying slightly. A September
hike would occur close to the presidential election and amid potentially
stressful money market reforms. July appears to us as a window.
■ The Fed’s basic framework is consistent with multiple hikes in the coming 12
months. Several FOMC members, doves included, are publicly saying that
the United States is at or near full employment and that inflation is on track to
achieve the Fed’s target. Fed Chair Janet Yellen has said that the
time-varying real neutral rate is near zero, meaning she believes that the Fed
is currently supplying the market with roughly 150 basis points of
accommodation.
■ Our inflation outlook is similar to that of the FOMC. We see a gentle increase
in U.S. core personal consumption expenditure inflation toward 2%. We
recently laid out the details of our inflation view from bottom-up and a top-
down perspectives. In addition, we explored the global factors that are most
relevant to Fed decisions. Although global industrial production has been in a
slump for roughly six quarters, industrial production momentum has recently
improved, giving the Fed room to move. Our report, titled, Show Us Your
Decision Tree, published, February 6, 2015, showed that Fed decisions are
sensitive to global manufacturing indicators.
■ Moreover, we have also written recently about the Fed’s volatility phobia.
Significant dollar strength, equity market weakness, or renewed China
concerns could delay hikes as well as the omnipresent possibility of a broad
U.S. slowdown. However, although hikes may be taken as bad news by
some investors, we believe that the risks of rapid hikes grow the longer the
Fed waits. Hiking once or twice per year is a modest and bearable pace. On
the other hand, if the global growth slump finally ends while inflation is at
target and full employment has been surpassed, the Fed may feel forced to
play catch-up, and that would catch markets off guard in a way that could
harm the labor market.
1 Professor Phil Tetlock’s “Superforecasters” put the probability of a Brexit out vote as just shy of 25%, according to a Bloomberg report. Superforecasters target accurate probability estimates and there is empirical evidence supporting their approach.

June 2016
U.S. Equity Strategy 9
From report dated 09 May 2016
Strategy
■
U.S. Equity Strategy EQUITY STRATEGY
Carving Up the Consensus
■ Institutional investors, particularly contrarians, often ask us what does
everybody love and what does everybody hate. With this in mind, we have
outlined how views and positioning among long and short hedge funds, long-
only actively managed mutual funds, and sell-side analysts stack up by
industry group for U.S. large caps (stocks in the Russell 1000) and small
caps (stocks in the Russell 2000).
■ Our analysis utilizes a unique data set. Our hedge fund positioning data
were compiled by Credit Suisse Prime Services and capture net exposure
including single-stock and sector and industry exchange-traded fund
exposure. We compare April 2016 month-end positioning with averages
since 2010. Our sell-side ratings data capture net buys (industry group less
Russell 1000 or Russell 2000) as of April month-end versus post-2003
averages.
■ Our mutual fund positioning data capture the percent of funds overweight the
group through the first quarter of 2016 versus post-2003 averages. Although
our mutual fund data points are more than one month old, we still consider
them to be insightful, since changes in mutual fund overweights and
underweights tend to emerge gradually. For each of these indicators, we
consider a reading that is high relative to history to indicate that a group is
overly loved or owned and a reading that is low relative to history to indicate
that a group is deeply out of favor.
■ There is considerable variation in which indicator tracks performance most
closely. However, within large cap, sell-side net buys may be the single best
indicator to track, as they show a meaningful correlation with performance
trends for ten out of the 24 Russell 1000 industry groups examined.
■ Over the course of our study, within large cap, hedge fund positioning has
appeared to drive returns within most technology and consumer groups
along with energy. Since 2014, hedge fund net exposure has been a
noticeably strong driver of performance for energy; retailing; food and
staples retailing; autos and components; food, beverage, and tobacco; and
software and services within large cap as well as diversified financials,
retailing, software and services, and capital goods within small cap.
Continued on next page . . .
Research Analyst
Lori Calvasina 212 538 6396

June 2016
U.S. Equity Strategy 10
Top Take-aways
■ We observed more pockets of consensus thinking across the three investor bases
that we examined than we did in our previous update in mid-February 2016. Groups
that appear to be overly loved or owned on our analysis are large-cap banks, small-
cap semiconductors and semiconductor equipment, and small-cap software and
services. This is a risk factor for our overweight on banks and supports our mid-April
downgrades of semiconductors and semiconductor equipment and software and
services to market weight from overweight.
■ Groups that appear to be uniformly unloved and underowned on our analysis are
small-cap retailing, small-cap household and personal products, and large-cap
materials. We believe that this is supportive of our mid-April 2016 upgrades of retail
to market weight from underweight and of household and personal products to
overweight from market weight, and that it highlights the contrarian nature of these
calls. For materials, the results of our ownership analysis challenge our ongoing
underweight on the group (driven mostly by valuation concerns in the large-cap
segment that offset improvement on our earnings revisions indicator).
■ One group also emerged as a uniform neutral on our analysis: large-cap technology
hardware and equipment. We saw signs of a hedge fund retreat from food,
beverage, and tobacco and food and staples retail within large cap, indications of
deep bearishness on energy on the sell-side alongside reengagement by mutual
funds and a lack of capitulation by hedge funds, reasons to stay concerned about
crowding in health care, and evidence of waning enthusiasm for telecommunications.

June 2016
Global Equity Strategy 11
From report dated 31 May 2016
Investment Strategy
Global Equity Strategy Research Analysts
Andrew Garthwaite 44 20 7883 6477
Marina Pronina 44 20 7883 6476
Robert Griffiths 44 20 7883 8885
Nicolas Wylenzek 44 20 7883 6480
Alex Hymers 44 20 7888 9710
STRATEGY
Equities: The Dilemma We maintain our neutral stance on equities and stick to our year-end targets of 2,150 for the S&P 500 and 3,350 for the Euro Stoxx 50.
What has improved but is unlikely to improve further? (1) China: housing (prices rising in 65 out of 70 cities) and infrastructure (state/SoE investment up 23% year over year, a five-year high), but economic lead indicators look like they are rolling over, our policy indicators show tightening, and there has been no rebalancing. (2) Oil: almost all risk trades have been correlated to oil. We believe if oil moves above $50 per barrel, Saudi Arabia does not meet its apparent economic/political objectives, including preventing the U.S. from becoming self-sufficient in energy. Moreover, speculative positions are at all-time highs. (3) The Fed became more dovish as the market rallied, but this is now reversing. (Our economists expect two rate hikes this year; the market expects one.) (4) Bond yields have never decoupled to this extent from ISM new orders, cyclicals, or commodities. (5) Credit: in Europe there has been a 50% retracement in high-yield spreads from their trough in summer 2014. Spreads now look to be at fair value. (6) U.S. earnings revisions have turned positive for the first time since June 2014, but much of this is down to the dollar and commodities and hence this normally positive signal could be misleading. (7) U.S. lead indicators are now unusually ambiguous, and if anything, trending weaker.
What has not improved: (1) Global PMI or global nominal GDP growth (which is the weakest it has been outside of 2008-09). (2) U.S. labor is getting some modest pricing power (which is bad for profit margins) and hence the gap between nominal GDP and wage growth has fallen to its lowest in this cycle. (3) There is above-average political risk (relating to immigration, the Italian referendum, and the U.S. presidential election).
The other worries for equities: (1) Both our fair value models are close to fair value. (U.S. ERP is 5.7% against a warranted of 5.6%.) (2) We have never seen so much disruption to business models from new technology, regulation, and China in an environment where governments are helping labor relative to capital (via taxation and minimum-wage legislation). (3) We marginally raise our 2016 U.S. EPS growth forecast to 1% from zero. The problems for corporates are (1) labor is getting pricing power, (2) operating earnings appear abnormally overstated compared to reported, and (3) one-off factors, which accounted for roughly 60% of margin improvement, are diminished. (4) Buybacks as a style is underperforming. (5) Seasonals are unsupportive: since 1988; May to September has seen flat markets. (6) A fall in the 50-week MA below the 100-week MA sees down markets 56% of the time over the next six months.
We remain benchmark of equities: (1) Fair value for equities could be considered reasonable when bonds/real estate appear so expensive. The cost of equity in the U.S. is 9.1%, still in its normal range (though at the lower end). (2) Risk appetite is pricing in an ISM below 50. (3) Excess liquidity is extremely high, and retail, institutional, and prime positioning is also supportive. (4) Market breadth has improved.
The critical issues to watch are Chinese lead indicators, U.S. wage growth, and U.S. lead indicators.

June 2016
Global Energy Economics 12
From report dated 31 May 2016
Oil & Gas
Global Energy Economics Research Analyst
Jan Stuart 212 325 1013
GLOBAL ENERGY ECONOMICS
OPEC Could Simply Leave Well Enough Alone ■ As OPEC ministers have begun to gather in Vienna, Austria, for their regular
meeting on Thursday, oil market fundamentals appear very close to slipping
into a supply deficit. Large inventory reductions lie in store for the second half
of 2016. We also believe that one of the few remaining outright bearish risks
to prices at this stage is that of an intensifying market share tussle
developing among key sovereign exporters Saudi Arabia, Iran, Iraq, and
Russia.
■ Therefore, we believe that the best possible outcome of tomorrow's meeting
is also the most widely anticipated and likely outcome, which is that nothing
happens. In this scenario, delegates talk mostly about the next secretary
general and other organizational issues and do not quibble about price or
quotas.
■ Tail risks (i.e., those with a probability of less than 2.5%) involve a public fight
resulting in promises of rapid supply increases or, at the other extreme, a
surprise deal to take oil off the market. Sell in May and go away is probably
not the right idea this year, as we believe that the price risk skews up through
the third quarter, not down.
■ More interesting than the OPEC meeting is the oil market context. The most
important background feature is that of falling supply and rising demand
trends. There is a fascinating but largely peripheral debate about the modest
degree in which the ongoing rebalance of supply and demand is accelerated
by outages of supply in Nigeria and Canada, which are partly offset by lower
refiner demand due to labor issues in France.
■ Risks remain, but with all producers excluding Saudi Arabia now pumping at
or near capacity, the short-term bearish risk resides nearly exclusively in
Riyadh. In addition, oil markets, prices, futures time-spreads, and curves
suggest that the worst is over, and our own base-case price forecast for 2016
seems too cautious. In our full report, we highlight in charts and tables the
background details of oil markets and fundamentals.

June 2016
Accounting & Tax 13
From report dated 18 May 2016
Accounting & Tax
Accounting & Tax ACCOUNTING
SEC Squeezing Non-GAAP: Staff Releases
New/Updated Guidance
Exhibit 1: Highlights of the New/Updated Guidance
Source: Credit Suisse Accounting & Tax Research .
■ Non-GAAP is a hot topic (again). You might have noticed a bit more
attention being paid to non-GAAP results recently. (It tends to happen every
ten years or so.) The widening gap between GAAP and non-GAAP earnings
and some noise from the SEC have resulted in a number of articles in the
financial press along with increased investor interest.
■ New/Updated guidance from the SEC may just be the start. The SEC
staff released new interpretations and updated some existing guidance for
the use of non-GAAP financial measures. Some of the key issues clarified
by the SEC include: companies shouldn't come up with their own accounting
rules for individual line items (like accelerating revenue that is recognized
over time); cash flow per share is not allowed regardless of what companies
call it; cash taxes can be used in cash flow measures but not in non-GAAP
earnings, etc. We expect to hear more from the SEC on non-GAAP,
including comment letters to companies that appear to be pushing the
envelope, and we wouldn't be surprised to see the SEC make an example
out of a few companies by investigating them for providing "misleading" non-
GAAP info. If that doesn’t do the trick, the SEC might write some new rules.
■ Be wary of non-GAAP results (not just because of heightened
regulatory risk). Don't be afraid to challenge the consensus. Does the non-
GAAP number better reflect the underlying economics or is management
just trying to paint a prettier picture? Keep an eye out for recurring non-
recurring charges, "non-cash" costs that involve cash, inconsistent
adjustments over time and versus peers, wide GAAP/non-GAAP spreads,
lots of adjustments, non-GAAP diverging from cash flows, etc.
Research Analysts
David Zion, CFA, CPA 212 538 4837
Ravi Gomatam, CFA 212 325 8137

June 2016
Industry Reports 14
INDUSTRY REPORTS (excerpts from recently published industry and company research)

June 2016
Consumer Discretionary 15
CONSUMER DISCRETIONARY
From report dated 22 May 2016
Media
Media Research Analyst
Omar Sheikh 212 325 6818
COMMENT
Viacom and CBS—Redstone Shakes Up
National Amusements Board and Trust
■ On Friday, May 20, 2016, Sumner Redstone removed Philippe Dauman and George Abrams from the boards of National Amusements and Redstone's Trust. Unless this decision is reversed, it has important implications for Viacom (VIAB) and, potentially, for CBS Corporation (CBS). We highlight the following thoughts.
■ A statement from Sumner Redstone's lawyer highlighted that "Mr. Redstone acted after he expressed his concerns regarding Viacom’s performance to Messrs. Abrams and Dauman, both Viacom directors, and received no response from them." If it is true that the controlling shareholder is unhappy with VIAB's performance, this suggests that Redstone could at some point seek to use his roughly 80% voting interest to remove Dauman from the CEO role, as he has done with former CEOs in the past. Public statements from the VIAB board show that it fully supports Dauman; however, it is hard to see how it could prevent his removal if that is Redstone's wish.
■ We note than one press report that suggests "Mr. Redstone was frustrated that he wasn't being heard by the board and management of Viacom on a variety of concerns, including his disapproval of Mr. Dauman’s plan to sell off a minority stake of Paramount Pictures." If true, again, we assume that Mr. Redstone could seek to use his voting interest to halt the sale of a partial stake in Paramount, which VIAB's management team under Dauman was
planning to conclude by the end of June.
■ A spokesman for Dauman responded to his removal from both boards by highlighting that "as court proceedings and other facts have demonstrated, Sumner Redstone now lacks the capacity to have taken these steps." If the CEO of VIAB believes this to be true, we believe that this puts pressure on the boards of VIAB and CBS to take steps to protect the interests of minority shareholders in both companies by independently verifying Redstone's mental competency. If the controlling shareholder does lack the mental capacity to make decisions regarding the strategy of both companies, this could trigger the transfer of control over his approximate 80% voting interest to the five remaining trustees of the Sumner M. Redstone National Amusements, Inc. Trust.
■ We note that a spokesman for Dauman called Redstone's action to remove him and George Abrams "invalid and illegal." This suggests to us that a legal challenge to their removal is possible. We would argue that the outcome of such a challenge would likely need to be seen before the boards of VIAB or
CBS could decide on the appropriate course of action for both companies.

June 2016
Consumer Discretionary 16
From report dated 19 May 2016
Restaurants
Restaurants Research Analyst
Jason West, CFA 617-556-5745
COMMENT
Labor Costs: Thoughts on New Overtime Rules
■ On May 18, 2016, the U.S. Department of Labor released its final rules updating overtime regulations. The overtime salary threshold will be raised to $47,476 per year from $23,660 starting on December 1, 2016. This means that any salaried employee making less than $47,476 will soon be eligible for overtime compensation. As we discussed in our recent report on wage inflation, titled, How Bad Could It Get?, published, May 12, 2016, our contacts often cited a potential change in the overtime rules as even more concerning than minimum wage increases. We believe that the final rules came in slightly favorable to expectations, as most operators with which we spoke had anticipated a higher threshold, no allowance for incentive compensation, and implementation as early as July 2016. We expect most restaurants to find ways to mitigate much of this impact. However, in an industry known for relatively low salaries and long hours, these new rules represent a material change to the operating model.
■ Estimating the financial impact from the new overtime rules is difficult, given the wide variance in operating models and limited disclosures around salaried versus hourly workers. However, we believe that the new rules could potentially add 0-50 basis points to restaurants' labor costs as a percentage of sales. The extent to which a restaurant is affected by the new rules will depend on the proportion of salaried workers making less than $47,476 and working more than 40 hours per week. We believe that casual dining companies will be most affected, given a higher number of salaried employees per store, limited pricing power, and typically a higher mix of company-operated restaurants versus other segments. However, we also expect a large percentage of store managers within quick-service restaurants and fast-casual concepts to be affected. Upscale operators should see a relatively muted impact.
■ We expect restaurants to bump up salaries for managers near the threshold. Operators could then choose to absorb the incremental salary expense or reduce incentive compensation to keep all-in compensation unchanged. The latter option results in no discrete incremental cost, but shrinking the discretionary portion of a manager's total compensation could compromise the incentive structure and raise the overall proportion of fixed versus variable costs in the profit and loss (P&L). We also expect restaurants to convert salaried managers earning well below the threshold to an hourly wage and cap their hours to limit overtime pay. In this case, operators would likely have to hire employees to make up those hours, which could have other knock-off implications for training costs, turnover, morale, and store-level execution. We could see store-level labor costs rising anywhere from a few thousand dollars to perhaps over $10,000 per year, which would affect the typical store-level P&L by 0-50 basis points. Corporate headquarters employees could also be affected by the new rules, which would show up in general and administration expense. We watch for more guidance from companies on this topic in the coming quarters.

June 2016
Consumer Discretionary 17
From report dated 13 May 2016
Luxury Goods
Global Luxury Goods Research Analysts
Guillaume Gauvillé, CFA 44 207 888 0321
Christian Buss 212 325 9667
Isis Wong 852 2101 7109
Catherine Tillson 44 20 7888 6052
Sara Shuler 212 325 7643
Ivy Ji 852 2101 7951
SECTOR REVIEW
Mind the Regional Price Gap
■ Managing regional price gaps increasingly matters. Tourism spending
on luxury goods in Europe and the United States is declining. Chinese
consumers are now buying in China and the development of ecommerce
has enabled easy comparison of prices across markets. Therefore, the
concept of fair pricing for the luxury industry in China has become more
relevant than ever.
■ We analyzed over 1,000 handbag SKUs across six markets. Our
proprietary analysis shows a wide disparity across brands regarding price
gaps. The more affordable U.S. brands like Michael Kors (KORS.N, $44.01,
Neutral, target $47) and Coach (COH.N, $38.18, Neutral, target $42) apply
the largest premiums between China and the U.S. at over 80%. Among
European brands, Tod's (TOD.MI, €61.00, Underperform, target €55) shows
the highest price gap at roughly 50% between China and Europe while Louis
Vuitton (LVMH.PA, €146.45, Outperform, target €168), Bottega Veneta
(owned by Kering [PRTP.PA, €144.35, Underperform, target €140]), SL, and
Prada (1913.HK, HK$27.15, Underperform, target HK$17.50) seem to be
more reasonably priced.
■ Price cuts in China may be necessary. Historically, brands have raised
prices in their home markets to narrow the gap. However, they can no longer
do this or they will face the risk of putting more pressure on an already-weak
domestic consumption. Moreover by persistently keeping high price gaps,
we think luxury brands simply forgo sales opportunities in China. Therefore
the possible adjustment is to cut prices in China to the roughly 30% premium
we deem necessary to cover duties and taxes. The potential price cuts in
China certainly have negative margin implications.
■ LVMH seems to be better placed. We believe companies with a greater
exposure to affordable luxury will see more resilient organic growth in the
current environment. Our proprietary analysis indicates that LV's ASP sits
below its direct peers, Gucci (also owned by Kering) and Prada. We estimate
that some 50% of sales stem from canvas bags, which drive volumes.
Regarding price gaps, the China versus Europe premium does not exceed
30% and, therefore, we see limited risk of LV having to cut prices in China.
Figure 1: Price Differentials Between China and Home Markets (=100)
183 181
149140 139
132 128 126 121 119
Coach MichaelKors
Tod's Gucci Ferragamo Burberry LouisVuitton
Prada SL BottegaVeneta
Source: Company data, Credit Suisse research.

June 2016
Consumer Discretionary 18
From report dated 10 May 2016
Department Stores
Department Stores
Research Analyst
Michael Exstein 212 325 4147
COMMENT
Quality over Quantity, Part II—Identifying the 184 LVP Malls and Retailers' Exposure to Them
■ We recently identified 95 of the most valuable property (MVP) malls in which the mall anchors in our coverage (and Sears [SHLD) have a presence. (See our report, titled, Quality over Quantity: Identifying the "MVP" Malls That Emerging Brands Want to Be In, published, March 17, 2016.) In this follow-up note, we identify 184 of the least valuable property (LVP) malls with these same tenants, at least for now. We identified almost twice as many LVP malls as MVP malls; however, we estimate that the LVP malls generate only 30-40% of the aggregate sales volume generated by the MVP malls owing to their low productivity levels.
■ For the basis of this exercise, we defined LVP malls as those with mortgages in four distressed categories, which tend to occur when a mall has lost (or is about to lose) a major tenant. The prime reason for this happening is the location having very low sales productivity, making it difficult for the tenant to generate a four-walls profit. Nordstrom (JWN) appears to have the highest-quality store base, with only 3% of its locations in LVP malls and 62% in MVP malls. Dillard's (DDS) and SHLD appear worst positioned, with 18% and 16% of locations in LVP malls and only 6% and 5% in MVP malls, respectively.
■ As the industry evolves, the list of LVP malls could grow as more malls struggle to drive traffic as they lose tenants. These malls are likely prime candidates for further future store closures as retailers attempt to adjust their fixed cost base for permanently lower levels of brick-and-mortar sales as sales mix shifts to e-commerce. At the same time, there is likely to be an increased focus on MVP malls and improving the quality and productivity of the existing store base. While the optimum number of stores for traditional retailers remains unclear, we believe that having a strong brick-and-mortar presence will remain a necessity, especially since having a physical store near a customer may affect their decision to purchase online.
Figure 1: Mall Anchors—Percentage of Locations in LVP vs. MVP Malls
18%
16%
12%
11%
10%
3%
6%
5%
3%
11%
62%
50%
0% 20% 40% 60% 80% 100%
Dillard's
Sears
Bon-Ton
JCPenney
Macy's
Nordstrom
Bloomingdale's
% in "LVP" Malls % in Other Malls % in "MVP" Malls
Source: Company data, Credit Suisse estimates.

June 2016
Consumer Discretionary 19
From report dated 09 May 2016
Specialty Hardline
Home Improvement INDUSTRY OUTLOOK
Proprietary Store Analysis Assessing HD versus
LOW Housing Drivers and Near-Term Outlook
■ In our full report, we track the local drivers of demand for Home Depot (HD) and Lowe's (LOW) using data from the Census Bureau, the American Community Survey, and Zillow. Our analysis includes home price appreciation, housing turnover, and inventory availability at the zip code level for all of HD and LOW's stores in the United States. In our report, titled, Store Analysis Shows a More Even Housing Playing Field: It's All About Execution Now, published, October 15, 2015, we helped explain the relative outperformance of HD over the past few years. In this update, we go deeper, cutting the data by market size and market median value, among other characteristics, to help explain and project the differences in sales trends for HD and LOW and assess the sales and margin upside potential (or recoverability in LOW’s case). While the data still favor HD, we believe that the incremental opportunity lies with LOW, as there are signs that the differences in housing trends are starting to neutralize. Therefore, we expect that relative performance comes down to execution, success with the Pro, capitalizing on other market share opportunities (e.g., Sears [SHLD]), omnichannel, other efforts within the store to drive productivity, and keeping
expenses under control.
■ In the short term, the analysis supports an acceleration in first quarter 2016 comps for HD and LOW based on strong housing trends in their respective markets. Data for February and March signal an acceleration from the fourth quarter 2015 9% U.S. comps for HD and LOW of 9% and 5.5%. However, we expect some giveback in April based on a reversal in weather trends after a favorable start to the season, which is consistent with our leading macroeconomic indicator and supplier index. While we are wary of high expectations into the print (as seen with O'Reilly Automotive [ORLY]), HD and LOW should be able to deliver on the relatively high market
expectations.
■ On a relative basis, HD’s average home price appreciation still outperformed in the first quarter 2016; therefore, we are not assuming a significant change in the comps gap. HD may have also benefited more from weather as it relates to big ticket, Pro-oriented projects, which have been outcomping the company average. However, our data signal that the housing gap could be plateauing: HD’s concentration in larger markets, where home price appreciation has been greatest, has contributed to its sales outperformance versus LOW. However, our work suggests that this benefit has started to moderate, as LOW markets pick up or ultra high-end markets moderate. LOW's comps gap with HD should have peaked in late 2015 or early 2016
and should narrow throughout 2016.
Continued on next page . . .
Research Analyst
Seth Sigman 212 538 8043

June 2016
Consumer Discretionary 20
Digging Back into the Gap
■ We tracked the 2006-09 class of stores (around 400 stores, or 22%) that were
opened late in the game after HD had stopped growing. During the downturn, these
stores saw a larger decrease; however, they are currently outperforming the chain.
Data suggest that home price appreciation is still outpacing the LOW store base.
We estimate that this group of stores could add 20-30 basis points incrementally to
comps as they recover and outperform.
■ While the average home price appreciation across HD and LOW’s store bases was
relatively similar to the fourth quarter of 2015, there were noticeably fewer stores for
which the growth accelerated. In the first quarter of 2015, 37% of HD stores and
36% of LOW stores were in markets where median home price growth accelerated
sequentially or was the same as the fourth quarter of 2015. That percent had
previously been tracking over 60%. We assume less appreciation as 2016 goes on,
and HD’s guidance assumes 3.5% growth (200 basis points below that of 2015).
This could point to some moderation in remodel demand through 2016. The key will
be offsets for HD, particularly Interline Brands.

June 2016
Consumer Discretionary 21
9 May 2016
Specialty Softlines
Specialty Softlines Research Analysts
Christian Buss 212 325 9667
Sara Shuler 212 325 7643 [email protected]
Pallavi Bakshi 212 538 8434
INDUSTRY PRIMER
Credit Suisse Private Internet Company
Summit Softlines Take-aways
In early May, we attended Credit Suisse’s Private Internet Company Summit, which brought together executives and investors from across the country. With an eye towards the softlines space, we focused on the structural changes that companies are trying to facilitate in changing consumers’ shopping behavior and their efforts to build efficiencies in customer acquisition, fulfilment, and marketing. Our view remains that 40% of industry sales are likely to migrate online, with radical consequences for traditional brick-and-mortar sales, sourcing and marketing competencies. See our recent report Revolution In The Softlines Brand Landscape: Digital Is The New Wholesale for more detail.
Key takeaways are as follows:
■ eCommerce Has Become Mobile Commerce And The Rules Have Changed. Discussions with eCommerce players highlight the dramatic changes that are occurring as consumers shift their engagement from the desktop into the mobile space. Given limited screen real estate and the challenges navigating large pieces of information on a mobile platform, retailers are struggling to maintain conversion rates and transactional velocity. One solution to this problem appears to be the move away from search-oriented purchasing to discovery-oriented purchasing, where the app or site serves to guide the consumer to a more bounded set of options, using prior purchases, self-identified preferences, and engagement analysis to offer a more limited selection to the consumer. Effectively, this turns the act of shopping into a social and entertainment experience, just as specialty retailers in the 1980’s brought a guided and curated shopping experience to the mall as an improvement of the legacy “everything in one place” model of the department store. Retailers are in essence building recommendation engines with low purchasing hurdles to address the limitations of the form factor.
■ Data Intensity Is Increasing, Metrics Are Changing. As purchasing behavior is increasingly trackable, and consumers are sharing their preferences more explicitly with retailers and brands, we are seeing companies build tools to monitor what consumers choose to buy, but also how they select, what they like, how they share, and when their consumption patterns change. This allows companies to think very differently about how they evaluate their customers, bringing to bear the metrics of the media industry into the eCommerce industry. Questions of customer engagement, time on site, and average pages visited serve to augment the traditional metrics of order velocity, average transaction value, and average unit retail to come up with a more comprehensive view of the lifetime value of the customer. Building robust, comprehensive consumer profiles and mining data to identify different tranches of customers becomes a baseline skill set in order to succeed online, with the goal to increase conversion and improve efficiency of customer acquisition cost.

June 2016
Consumer Discretionary 22
■ Solving a Style Velocity Problem. One of the key problems identified by
companies looking at apparel sales is the increasing velocity of style change within
the industry. The rise of fast fashion has met with the growing presence consumers
have on social media, which is increasing the need to show new looks and new
styles. Effectively, when you wear it once, and post it online, it’s as if you’ve already
worn it for everyone. As a result, companies like Le Tote and Rent The Runway are
trying a model that allows consumers to rent clothing with a low price hurdle for
purchasing and a simple all-you can eat purchase and delivery model, while Wish is
focusing on low price-point impulse purchase product. Underlying many of the
apparel brands and retailers is a further acknowledgement that the ability to keep up
with the pace of change of preference and style is challenging, leaving many brands
and retailers focused on curating product for a targeted audience. In essence, the
brand and retailer become trusted partners in helping a consumer choose a new
look, with low barriers to try, buy and sometimes return.
■ Solving a Convenience Problem. Increasingly, eCommerce providers are looking
to solve convenience problems for consumers. Companies like Adore Me are trying
to ease the hurdle for trying and buying women’s intimates. Bonobos is trying to
lower the fashion hurdle for male consumers. Boxed is trying to build out the
warehouse club bulk-purchase model online with no membership fees and no need
to visit a store. Casper is focused on easing the selection process for mattresses.
ClassPass is building a fitness class marketplace for athletes. Dollar Shave Club is
building a replenishment model for shaving supplies directly with customers. M.
Gemi is trying to bring handcrafted shoes to a broader audience. Stance is bringing
fashion and athletic industry disciplines to bear in the sock category. While none of
these businesses are creating product that doesn’t have an analog in the brick-and-
mortar landscape, they are really changing the means of selection, purchasing, and
fulfillment for industries that have been reliant on mall and catalog distribution for
decades.

June 2016
Consumer Staples 23
CONSUMER STAPLES
From report dated 25 May 2016
Food & Drug Retailing
Food and Drug Retailing Research Analyst
Edward J. Kelly, CFA, CPA 212 325 3241
COMMENT
Small-Box Retailers in the Crosshairs of New
Overtime Rules; Dollar Stores Most at Risk
■ New overtime rules are slated to go into effect on December 1, 2016. The U.S. Department of Labor regulation that was finalized in the previous week will increase the annual salary threshold for most nonwhite-collar workers who qualify for overtime pay to $47,476 from $23,660. The government estimates that approximately 4.2 million Americans will now be eligible for overtime pay who previously were not. This legislation will likely have the most impact on retail store managers that have salaries below the threshold and are asked to work meaningful overtime. Mitigation strategies are possible (raising salaries above the threshold, adjusting hourly wages, capping overtime, and using more part-time workers) but still carry a cost and could take time to implement.
■ To estimate the impact to the stocks in our coverage universe, we used company commentary and Glassdoor.com to focus on salaried store labor currently earning annual pay below the newly announced threshold but above the prior one, as these employees will be eligible for overtime pay in December 2016. Determining the overtime hours worked is more difficult; therefore, we provided a sensitivity analysis based on feedback from industry contacts.
■ The sheer number of dollar stores and their unique low-cost labor model place them straight in the crosshairs of the new overtime rules. With often only two to three employees in a store at any given time, store managers constitute a significant percentage of store labor and are often asked to work 55-60 hours per week. At the same time, store managers at Dollar General (DG) and Dollar Tree (DLTR) on average earn annual salaries that will qualify them for overtime under the new regulation. We estimate that DG and DLTR could face a gross incremental EPS headwind of 5-7% once the rules take effect. We believe that the companies would likely be able to mitigate at least one-half of this via increased use of part-time labor or adjusting hourly wages. At DLTR, raising salaries to the threshold level and averting overtime pay altogether is a likely step that the company could take. Big Lots (BIG) may have some exposure, as Glassdoor data indicate that only assistant managers earn salaries that will qualify them for overtime in December; however, these employees typically work less overtime. Five Below (FIVE) should see less impact given its smaller store base.
■ Drugstores have less exposure to new overtime rules, as store managers typically earn above the new threshold. Risk could lie in the assistant manager population; however, this employee typically works less overtime and accounts for a smaller percentage of total store labor given high pharmacy-related costs. We estimate the EPS impact of the new rules to be $0.01-0.03 at most.
Continued on next page . . .

June 2016
Consumer Staples 24
Food Retailers
■ Within our coverage universe, it appears that food retailers could see the least
impact from the change in overtime rules. Grocery store managers appear to
already earn annual salaries above the new $47,476 threshold, and a significant
portion of store labor tends to be part-time. Many assistant managers could be
newly eligible for overtime pay come December; however, these employees likely
work fewer hours per week than do store managers. Five hours of overtime per
week registered by each assistant manager would have de minimis impact on
Kroger (KR) or SUPERVALU (SVU). Store managers and assistant managers
appear to already earn salaries above the new threshold at Whole Foods Market
(WFM).
■ We are not changing forward estimates for our covered companies at this time as
we await further color from management teams in the upcoming earnings season.
While the gross impact from the finalized rules appears sizable for dollar stores in
particular, the net impact could be mitigated as aforementioned. We will watch for
incremental clarity on this timely issue with earnings prints from DG, DLTR and BIG
later this week.
June 2016
Energy 25
ENERGY
From report dated 11 May 2016
Energy
Canadian Energy Research Analysts
Andrew M. Kuske 416 352 4561
Jason Frew 403 476 6022
Jan Stuart 212 325 1013
David Phung 403 476 6023
John Edwards, CFA 713 890 1594
Paul Tan 416 352 4593
Brian Ho 403 476 6009
Robert Loebach 403 476 6021
CONNECTIONS SERIES
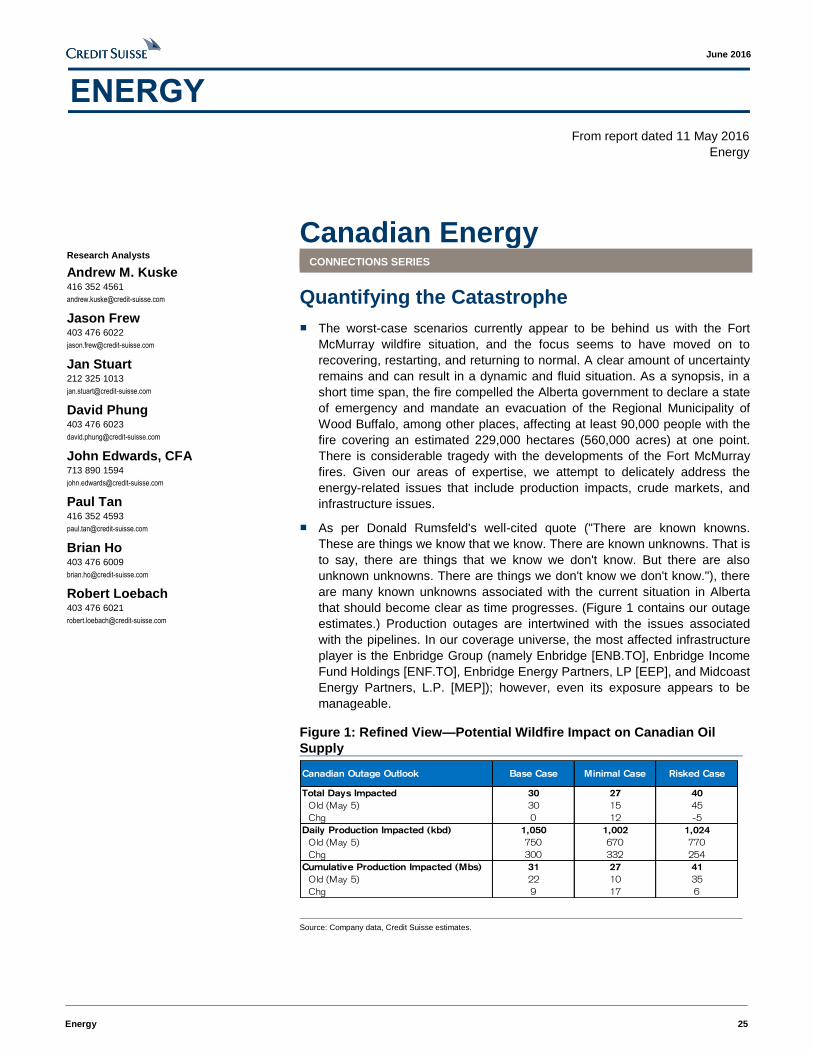
Quantifying the Catastrophe
■ The worst-case scenarios currently appear to be behind us with the Fort
McMurray wildfire situation, and the focus seems to have moved on to
recovering, restarting, and returning to normal. A clear amount of uncertainty
remains and can result in a dynamic and fluid situation. As a synopsis, in a
short time span, the fire compelled the Alberta government to declare a state
of emergency and mandate an evacuation of the Regional Municipality of
Wood Buffalo, among other places, affecting at least 90,000 people with the
fire covering an estimated 229,000 hectares (560,000 acres) at one point.
There is considerable tragedy with the developments of the Fort McMurray
fires. Given our areas of expertise, we attempt to delicately address the
energy-related issues that include production impacts, crude markets, and
infrastructure issues.
■ As per Donald Rumsfeld's well-cited quote ("There are known knowns.
These are things we know that we know. There are known unknowns. That is
to say, there are things that we know we don't know. But there are also
unknown unknowns. There are things we don't know we don't know."), there
are many known unknowns associated with the current situation in Alberta
that should become clear as time progresses. (Figure 1 contains our outage
estimates.) Production outages are intertwined with the issues associated
with the pipelines. In our coverage universe, the most affected infrastructure
player is the Enbridge Group (namely Enbridge [ENB.TO], Enbridge Income
Fund Holdings [ENF.TO], Enbridge Energy Partners, LP [EEP], and Midcoast
Energy Partners, L.P. [MEP]); however, even its exposure appears to be
manageable.
Figure 1: Refined View—Potential Wildfire Impact on Canadian Oil
Supply
Canadian Outage Outlook Base Case Minimal Case Risked Case
Total Days Impacted 30 27 40
Old (May 5) 30 15 45
Chg 0 12 -5
Daily Production Impacted (kbd) 1,050 1,002 1,024
Old (May 5) 750 670 770
Chg 300 332 254
Cumulative Production Impacted (Mbs) 31 27 41
Old (May 5) 22 10 35
Chg 9 17 6
Source: Company data, Credit Suisse estimates.

June 2016
Energy 26
From report dated 20 May 2016
Oil & Gas Equipment & Services
■
Offshore Services SECTOR REVIEW
Seasonal Pickup Should Help
Exhibit 1: Oil Price Versus Decommissioning Activity
$0
$30
$60
$90
$120
0
40
80
120
160
2000 2002 2004 2006 2008 2010 2012 2014 2016
Platforms Decomissioned Oil Price
Source: Bloomberg, BOEM, Credit Suisse estimates.
■ We expect to see a pickup in demand for plug and abandon (P&A) work in
the near term in the Gulf of Mexico. We believe that the following factors
should drive the pickup in work: (1) the Bureau of Ocean Energy
Management's (BOEM) continued push to clean up neglected platforms
(decommissioning platforms); (2) ample idle capacity (e.g., intervention
assets, rigs, and boats); and (3) seasonal pickup in construction activity.
■ Platforms and wells need to be decommissioned, and while maintenance
and decommissioning can be deferred, we expect some urgency on the
BOEM's part following concerns that some operators may not be around
forever. (Two oil and gas companies recently declared bankruptcy.) We
expect the BOEM to highlight the Idle Iron policy (2010) that requires
operators to decommission platforms that typically run $3-10 million.
■ Estimates put the number at 400 fixed platforms that are eligible for
decommissioning in the Gulf of Mexico. This work is done primarily with well
intervention boats, offshore supply vessels, liftboats, and rigs. Well
intervention vessels are about 25-30% more efficient than rigs; however, the
type of P&A matters. Offshore supply vessels can be a cheaper alternative
depending on scope of work. We note that P&A is not a game changer for
the industry; however, every little bit helps in the current market.
■ We view Helix Energy Solutions (HLX) and Tetra Technologies (TTI) as the
largest beneficiaries from a pickup in P&A work; however, names such as
Hornbeck Offshore (HOS), SEACOR Holdings (CKH, liftboats), and TTI
should also benefit from the pickup in activity.
Research Analyst
Gregory Lewis 212 325 6418

June 2016
Energy 27
From report dated 09 May 2016
Marine
Marine SECTOR FORECAST
Offshore Midstream Liquefied Natural Gas
Outlook; Upgraded Golar LNG to Outperform
■ Liquefied natural gas (LNG) spot rates are hovering around $30,000 per day,
or down 60% year over year. Gone are the days of 2013 when spot rates
averaged $100,000 per day. The reasons are plenty: (1) fewer cargoes
moving east and west, (2) limited cargo demand, and (3) too many ships.
The year 2016 is shaping up to be the trough in the conventional LNG
shipping market, which is usually a pretty good time to buy. We may be a
bit early in our call; however, we believe that the road to the recovery is
being built.
■ We expect approximately 45 million tons per annum (mtpa) of LNG capacity
start-ups over the coming two years (roughly 140 mtpa over the coming ten
years), which should reduce tonnage in the spot market. Current charter
rates that are generating negative 15% internal rates of return are
unsustainable. This has put a dead stop on new orders and has even
resulted in some retirements. We see the market as healing slowly.
■ With Petronas’s floating liquefied natural gas (FLNG) 1 delivering in 2016,
we expect the kickoff of a multidecade FLNG trend in resource development.
In our view, Golar LNG (GLNG) is positioned to benefit in the near and
medium term with its FLNG solution. We upgraded GLNG to Outperform
from Neutral and increased our target price to $30 from $20. In our view,
GLNG is a story stock with many of chapters to be written. We expect FLNG
to capture 3-4% of the LNG market by 2025 and see much potential.
■ Given LNG master limited partnerships are yielding 10%-plus, we stressed
the models against current spot rates. Holding distributions fixed, GasLog
Partners LP (GLOP), Teekay LNG Partners (TGP), and Golar LNG Partners
(GMLP) appear covered through 2018, while Dynagas LNG Partners LP
(DLNG) likely needs some help (think dropdowns). More importantly, current
coverage ratios imply charter rates of $50,000-60,000 per day, which is
in-line with the long-term average.
Research Analyst
Gregory Lewis, CFA 212 325 6418

June 2016
Energy 28
From report dated 3 May 2016
Oil & Gas Equipment & Services
Oilfield Services and Equipment Research Analyst
James Wicklund 214 979 4111
COMMENT
Offshore Technology Conference Take-aways
■ We are back in Houston, Texas for the Offshore Technology Conference
(OTC), the granddaddy of tradeshows for the oil and gas industry, for the
Credit Suisse 24th annual OTC tour. The key take-away in 2015 was that
deepwater was not dead. Flash forward to today, and while the industry does
not expect a pickup in activity anytime soon, we are at least one year closer
to the recovery. On day one, we had the opportunity to meet with the Reach
Group, Technip (TECF.PA), Frank's International (FI), Rowan Companies
(RDC), Oceaneering (OII), and Deep Gulf Energy.
■ Probably the most optimistic on the timing of the recovery was TECF.PA
(and it was not bullish), which makes sense given its focus on engineering
and construction and its Forsys joint venture with FMC Technologies (FTI).
The whole point of front-end engineering design studies is to get in on the
ground floor of a project; therefore, TECF.PA should see a pickup in activity
before others. The least optimistic was OII mostly owing to the uncertainty
around the timing of a deepwater rig activity recovery. While OII is best in
class, we understand its angst, given our expectation of another approximate
25% decline in the working floater count (currently 150).
■ Two years into the downcycle, companies are generally accepting that
low-hanging cost reductions are in the rearview mirror. While costs remain a
focus, global footprints need to be maintained to capture the eventual
upcycle. In addition, the Reach Group noted an increased focus on
maintaining safety and balancing efficiency by operators and service
providers. There is still work to be done, and the industry will likely appear
different when the market recovers.
■ A common question asked to nearly every presenter on day one was a
variation of what is the breakeven oil price for an offshore field. The answer
consistently was that it depends. Deepwater projects, specifically subsea
tiebacks, can be economic in the current environment; the problem is that
these types of projects do not require significant capital investment. Oil
prices need to continue upward for significant investment to occur, which we
do not see as a surprise.
Continued on next page . . .

June 2016
Energy 29
Day Two Take-aways
■ Day two at OTC was eventful, as we met with Schlumberger (SLB), National Oilwell
Varco (NOV), Helix Energy Solutions (HLX), Fieldwood Energy, SCF Partners,
Canyon Oak Energy, and many others. While this is an offshore industry event,
much of the focus at investor meetings has been centered on onshore and short-
cycle work that will come back first when the cycle finally turns. Given nearly
everyone in the industry agrees that onshore will be the first place to see an activity
pickup, it is no surprise that attendance at the 2016 conference is down. Times are
tough.
■ For months, investors and companies have discussed onshore North America as
the first market to see a recovery. SLB made the case that conventional onshore
and shelf activity could come back at the same time, if not before, North American
onshore activity. The notion that any type of offshore work could come back sooner
rather than later is a sign of life for many companies that need something to hang
their hat on.
■ To no one's surprise, NOV made the point that a new offshore rig order may not be
seen for years. The interest by SLB and private equity in the land drilling space may
have surprised some. New rigs of the future are destined to further crowd the land
rig market in short order, internationally (SLB) and domestically (private equity).
■ The state of the offshore industry is well understood by companies and investors;
therefore, companies are positioning themselves and telling their stories in ways
that focus on short-cycle work. On the offshore side, HLX drove home its exposure
to well intervention activity, while NOV discussed its ability to take advantage of the
shorter useful life of Tier 1 land rigs.
■ There was a general consensus among the companies that the relatively strong
decremental margins seen in the first quarter of 2016 will be harder to replicate in
the second quarter for the following reasons: (1) companies are beginning to
position (i.e., holding costs) for increased activity in short-cycle businesses, and (2)
low-hanging fruit cost cuts are largely complete. We note that incremental margins
after the second quarter should be better than many are currently modeling owing to
the deep and structural nature of many of the cuts that have been made this
downcycle.

June 2016
Financials 30
FINANCIALS
From report dated 31 May 2016
Banks
U.S. Large- and Mid-Cap Banks SECTOR FORECAST
2016 Comprehensive Capital Analysis and
Review Expectations
■ As soon as Thursday, June 2, 2016, at 4:30 PM EST, the Federal Reserve
will release the results of the 2016 Dodd-Frank Act Stress Test (DFAST).
Disclosure will include minimum capital ratios and revenue and loss
estimates under the severely adverse scenario. DFAST assumes no change
to dividend payments and no common stock buybacks (to provide
comparability across banks). Results reveal the Fed’s determination of
capital adequacy (absolute and relative to the banks’ forecasts) relative to
minimum thresholds.
■ One week after that, as early as Wednesday, June 8, 2016, at 4:30 PM EST,
the Fed will release the results of the Comprehensive Capital Analysis and
Review (CCAR). CCAR results detail quantitatively-derived poststress
capital ratios under adverse and severely adverse scenarios inclusive of
requested capital actions over the course of the nine-quarter horizon. The
Fed will also provide its qualitative assessment through nonobjection,
objection, or conditional nonobjection to a given bank’s capital plans
■ We expect all of the large and mid-cap banks under Credit Suisse coverage
to pass the quantitative element of CCAR (above 4.5% Common Equity Tier
1 and other stressed minimums). We also expect the total net capital return
ask (dividends and buybacks) increases to 76% with 2016 CCAR from
68% in 2015 CCAR inclusive of a dividend payout of 31% in 2016 versus
26% in 2015.
■ We believe that the best positioned are American Express (AXP), Morgan
Stanley (MS), The Bank of New York Mellon (BK), State Street (STT), and
Regions Financial (RF) and expect them to return the greatest percentage of
capital (around 85-100% of earnings). In our view, Zions Bancorporation
(ZION), Bank of America (BAC), Citigroup (C) and M&T Bank (MTB) will
exhibit the most incremental capital return with greatest year-over-year
improvement, with Synchrony Financial (SYF), and Ally Financial (ALLY)
returning common for the first time.
■ We believe that ZION, Huntington Bancshares (HBAN), SYF, and BAC will be
at the lower end of payout range and expect them to seek the least amount of
capital return in CCAR 2016 (around 50-60% of earnings). Success is less
clear on the qualitative aspect of the CCAR process. We expect more
conditional nonobjections to capital plans as well as potentially select
objections. In our view, those submitting for the first time are more at risk.
Research Analyst
Susan Roth Katzke 212 325 1237

June 2016
Financials 31
From report dated 09 May 2016
Homebuilding
April Real Estate Agents Survey PROPIETARY SURVEY
Growing Spring Traffic Faced with Still Limited
Inventories
■ Our buyer traffic index rose to 53 in April 2016 from 49 in March, suggesting
that traffic remained in-line with agents’ expectations. Our weighted traffic
index was up 2 points month over month. Agents highlighted strengthening
spring demand met with persistently tight inventory, making competitive
multiple-offer situations commonplace in many markets and contributing to
widespread price appreciation. Sellers remain elusive, likely given the lack of
available product to which to trade up, although in a few places, agents
observed a marginal loosening in supply. Markets with typically high
international demand continued to see depressed foreign buyer activity. In
terms of price points, agents cited consistently slower demand for high-end
property in several markets. By region, Florida experienced a strong
sequential increase (still below expectations) and the Pacific Northwest was
flat at high levels. The Southwest and Midwest saw healthy improvement,
while California and Texas were up modestly, with Houston traffic continuing
to edge higher (although still the weakest in the state). New York City
remained weak.
■ In April 2016, 17 of the 40 markets that we survey saw higher-than-expected
traffic (14 in March), 11 saw traffic in-line (11 in March), and 12 saw
lower-than-expected traffic (15 in March). California edged up closer to the
average, led by improvement in San Francisco and Sacramento, although
Los Angeles and the Inland Empire pulled back. In Texas, Dallas was flat,
while Austin and San Antonio declined slightly and Houston improved.
Seattle and Portland softened a touch but remained very strong. Each
Florida market improved from March, although the state remained the
weakest region. New York City edged further below expectations.
■ Our price index increased 4 points month over month, continuing to indicate
broad gains. Of the 40 markets that we survey, 36 saw higher prices (36 in
March), 4 indicated flat prices (2 in March), and none saw lower prices (2 in
March). Agents observed price gains driven by the seasonal escalation in
demand against tight inventories across markets. Prices accelerated in
several Southeast markets, while markets including Dallas, Portland,
Raleigh, Sacramento, and Seattle were robust. Houston rebounded to flat
sequentially after six straight months of declines.
Research Analyst
Michael Dahl 212 325 5882

June 2016
Financials 32
From report dated 03 May 2016
Multinational Banks
■
Canadian Banks COMMENT
Upgraded TD.TO to Outperform and
Downgraded NA.TO to Neutral
■ Canadian banks have rallied 19% off 2016 lows and are up 9% in 2016 to
date, outperforming the Toronto Stock Exchange at up 7%. In addition, U.S.
major banks are down 7% and Canadian lifecos are down 3%. Short interest
remains near record highs; however, given the strength in the rally and risk
of higher energy provisions in the second quarter (February and March
redeterminations), while manageable, we see some near-term trading risk.
We also expect continued high volatility in bank stocks given the elevated
short interest.
■ As a result, we downgraded National Bank of Canada (NA.TO) to Neutral
from Outperform on its strong 2016-to-date stock performance of up 10%,
valuation recovery, and its higher-than-industry average exposure to energy
at 2.7% of loans ($3.0 billion producers [40% investment grade] and
$0.2 billion services [56% investment grade]).
■ In addition, we upgraded Toronto Dominion Bank (TD.TO) to Outperform
from Neutral based on its lagging stock price performance of up 2% in 2016
to date, the lowest of the major banks, as well as its industry-low exposure to
oil and gas (0.8% of loans), with continued benefits expected from the
December 2015 U.S. Federal Reserve rate hike, U.S. dollar (although
slowing), and large restructuring charge (positive operating leverage).
■ We also increased our bank target prices by 7%, as we expect resilient
earnings to result in higher valuations and continue to believe that the
pending credit cycle (housing and West Texas Intermediate) has been fully
discounted by the market and short sellers. We increased our target P/E
multiple to 12.3 from 11.5 on our 2016 EPS estimate.
■ We remain constructive on the bank group, with Outperform ratings on Royal
Bank of Canada (RY.TO) as our top pick, followed by TD.TO; Neutral ratings
on Bank of Montreal (BMO.TO), NA.TO, and Bank of Nova Scotia (BNS.TO)
(in that order); and Underperform ratings on Canada Imperial Bank of
Commerce (CM.TO), Canadian Western Bank (CWB.TO), and Laurentian
Bank of Canada (LB.TO).
Research Analyst
Kevin R. Choquette, CFA, CPA, CMA 416-352-4585

June 2016
Financials 33
From report dated 3 May 2016
Diversified Financials
U.S. Brokers Research Analysts
Christian Bolu 212 538 9805
Susan Roth Katzke 212 325 1237
SECTOR FORECAST
Fixed Income, Currencies, and Commodities—
The Inflection Is Nigh
■ Fixed income, currencies, and commodities (FICC) revenues have declined
in five of the past six years, and the first quarter of 2016 marked yet another
low for the business. However, we believe that the inflection point and a
path to sustainable growth could be closer than investors appreciate. Macro
businesses bottomed in the third quarter of 2014 and are now growing. In
our view, the reason is because diverging global monetary policy has
spurred increased client hedging and speculative activity. Spread
businesses were a drag as dealers struggled to manage inventory, given the
headwinds of the energy-driven credit spread widening in the second half of
2014 and 2015.
■ The current credit spread widening cycle (the sixth over the past 30 years) is
almost two years old and peaked in February 2016. Credit spreads are
currently down meaningfully from the peak owing to continued tightening
coupled with growth in macro businesses that should drive overall FICC
growth in the second half of 2016 and into 2017. The addressable market
for Group of Ten (G-10) rates has increased significantly following the
financial crisis. Global monetary policy normalization over the coming
decade increases the demand for hedging, and uncertainty around timing of
that normalization drives good volatility and increases speculative activity,
all of which should generate revenue growth. In addition, we see less
revenue risk in G-10 rates from the equitization of FICC.
■ In our view, Goldman Sachs (GS) should be a winner, given its leverage to
FICC (26% of revenues versus 16% for peers). However, the macro
powerhouses (JPMorgan Chase [JPM] and Citigroup [C]) could have better
long-term growth prospects given their product mix. Despite the recent rally
in broker stocks (up 21% on average from 2016 lows), we do not believe
that they are embedding any FICC growth; a modest recovery could drive
15-20% upside to valuations.
■ The following are risks to our call. To the extent that economic growth slows
significantly, the U.S. rate tightening cycle could be pushed back, driving
lower foreign exchange volatility. In addition, market illiquidity could slow
down the recovery in spread revenues. However, we see many signs that
the brokers are increasingly less sensitive to moves in credit markets.
Moreover, to the extent that the recent current credit spread tightening is
just a pause in a long-term widening cycle (similar to what happened in the
early stages of the 1997-2002 cycles), then spread businesses could remain
a drag on FICC.

June 2016 June 2016
Health Care 34
HEALTH CARE
From report dated 24 May 2016
Managed Care & Healthcare Facilities
Hospital Volume Tracker Research Analyst
Scott Fidel 212 538 0812
THEME
April Volume Trends Softened Across Inpatient
and Outpatient Categories
■ The Credit Suisse Hospital Volume Tracker is a proprietary and exclusive
monthly product which tracks key hospital-based volume metrics for 450+
acute care hospitals across the United States. The first cut of data from our
proprietary Hospital Volume Tracker shows that hospital utilization declined
in April 2016, retreating from positive volume growth seen in February and
March. As a result, the April volume data reads cautiously for hospital stocks
but more favorably for managed care. Our April snapshot includes volume
data from 187 hospitals across the United States. While the growth rate of
inpatient discharges had already moderated in March (up 0.5% year over
year [y/y]) from February (up 3.9% y/y), inpatient discharges turned negative
(down 2.2% y/y) in April. Hospitals saw lower inpatient volumes in April even
though the Easter holiday fell in March versus April in 2015. This should
have provided a positive timing boost to y/y volume comps in April 2016;
however, this did not occur. Hospital volumes have bounced in between
positive and negative territory throughout the first four months of 2016 and
have been unable to show a clear directional trend so far.
■ The reversal of the positive recent volume growth trends was most
pronounced in the outpatient setting during April 2016. Growth in outpatient
surgeries (down 3.1% y/y in April, up 5.5% y/y March, and up 13.9% y/y in
February) and total outpatient visits (down 1.3% y/y in April, up 7.9% y/y in
March, and up 9.5% y/y in February) declined during April, reflecting a
significant reversal from the outsized outpatient surgical growth that we had
noted in February and March. We recall that same-hospital outpatient
surgeries increased 7% y/y at Universal Health Services (UHS) in the first
quarter of 2016, followed by Tenet Healthcare (THC), up 5.6% y/y; HCA
Holdings (HCA), up 4.4% y/y; and LifePoint Health (LPNT), up 3.6% y/y.
Outpatient surgical volumes had declined 0.1% y/y in April of 2015,
presenting what should have been an easier hurdle for growth in this metric
for April 2016.
■ Based on our survey, during April 2016, self-pay inpatient discharges (up
3.3% y/y) grew faster than overall inpatient volumes (down 2.2% y/y) for only
the second time since the implementation of the Affordable Care Act.
Medicaid inpatient discharges increased slightly in April (up 0.8%), although
growth slowed sharply from up 6.2% in April 2015. Medicare inpatient
discharges decreased 3.4% in April (most among payer types) while
managed care organization and commercial discharges also declined 2.3%
y/y in April.

June 2016 June 2016
Health Care 35
From report dated 17 May 2016
Pharmaceuticals & Biotechnology
■
Global Pharmaceuticals IDEAS ENGINE
Predicting U.S. Rebate Pressure to 2019
■ We present our proprietary analysis of gross and net U.S. drug prices for 25
companies in our coverage universe, with reported U.S. drug revenues of
$228 billion. In our full report, we analyze the recent trends in rebating and
project forward to 2019 expected rebates based on portfolio mix changes.
We rank the companies on their power to defend against managed care
pressure based on exposure to the United States, current portfolio
uniqueness, and how we expect this to change into 2019. We also look at
exposure to Medicare and Medicaid for which additional access controls
have notably slowed the adoption of new products.
■ The U.S. market continues to see high list price rises averaging more than
10% in 2015 and the first quarter of 2016 despite the political scrutiny in an
election year. A significant proportion of the gross price rises is rebated
away. We estimate nearly $130 billion of rebates in 2015, which we consider
as promotional spend alongside traditional SG&A.
■ U.S. net drug pricing remains a key driver of overall industry profit growth,
adding an estimated 8% to overall net income in 2015 and accounting for
more than 100% of the reported net income growth of only 2% in 2015.
■ Rebates have been rising faster than sales. We have seen a rise of 10
percentage points in rebates over the past five years for companies with an
average level of unique products. We project an extra rise of 5-10
percentage points by 2019. We believe that the level of unique products in a
portfolio is the best form of defense.
■ We conclude that GlaxoSmithKline (GSK.L), Novartis (NOVN.S), Teva
Pharmaceutical (TEVA, specialty), and UCB (UCB.BR) as well as
biotechnology's Biomarin (BMRN), Vertex (VRTX), and Celgene (CELG)
should see the most benign exposure to rebate pressures into 2019. In our
view, Novo Nordisk (NOVOb.CO) and Amgen (AMGN) have the most
negative exposure. We look to the initial 2017 formulary listings from July,
progress toward implementation of proposed Part B changes, and continued
health care commentary from the U.S. presidential candidates.
Research Analysts
European Pharma Team 44 207 888 0304
Vamil Divan, MD 212 538 5394

June 2016 June 2016
Health Care 36
From report dated 17 May 2016
Healthcare Technology & Distribution
Health Care Technology and Distribution
Research Analyst
Robert Willoughby 212 325 1497
COMMENT
Pharmacy Benefit Manager Industry Update
■ Our Global Pharmaceuticals team issued an industry report, titled, Predicting
US Rebate Pressure to 2019, published, May 17, 2016, that assesses the
state of U.S. pharmaceutical rebates through 2019. The report provides a
convenient platform to comment on the valuable role of pharmacy benefit
managers (PBMs) in the U.S. pharmaceutical supply chain. As
manufacturers have worked diligently to raise branded drug prices, PBMs
have worked equally diligently to combat the financial impact that these price
increases have on payors and, ultimately, patients.
■ Higher bargaining power of the larger PBMs, including Express Scripts
(ESRX) and CVS Health (CVS), are evident in what our research team
identifies as manufacturer rebates that are increasing faster than overall
sales for the industry. This trend should continue, with rebate levels for the
manufacturer universe that the team tracks increasing to 47% by 2019 from
37% of the list price. PBMs share in the savings that they generate for their
payor customers, and therefore, our conviction in higher profit assumptions
in the coming years for ESRX and CVS remains intact. High industry
retention rates well in excess of 90% support the PBM value proposition; we
note that IMS Health (IMS) indicates that rebates passed along to customers
reached a record level in 2015.
■ CVS and ESRX should debut the changes to their national formularies for
2017 in early August 2016. This has historically been a platform to exclude
more drugs from their preferred offerings to drive greater rebates from
remaining manufacturers. Given more clients are adopting these national
formularies, we believe that their integrity is rising and forecasts for higher
manufacturer rebates (and PBM profitability) are justified.
Figure 1: PBM Profitability per Adjusted Claim
$0
$1
$2
$3
$4
$5
$6
$7
$8
2010 2011 2012 2013 2014 2015
ESRX GP per adjusted claim CVS GP per adjusted claim
Source: Company data, Credit Suisse estimates.

June 2016 June 2016
Health Care 37
From report dated 1 May 2016
Animal Health
Animal Tracks Research Analyst
Erin Wilson 212 538 4080
SECTOR REVIEW
First Quarter EPS Drivers in Animal Health
■ First quarter 2016 results from leading animal health companies provide a positive read-through for Zoetis (ZTS) into its EPS report on May 4, 2016. The latest results heighten our conviction in its near-term prospects, suggesting potential upside to our operational revenue growth forecast of 6.4%, including the impact of restructuring. In the first quarter, more diversified companies, by geography, species, and therapeutic class, fared better than others with more concentrated portfolios. On this front, we believe that ZTS is well positioned with the broadest portfolio in the sector. In the first quarter, we saw robust trends in companion and livestock, particularly in the United States.
■ We were heartened to see VCA (WOOF) post one of its best quarters in a decade, with accelerating same-store trends across its hospital (up 8%) and laboratory (up 9%) businesses, consistent with results from IDEXX Laboratories (IDXX) and our survey work. U.S. companion animal veterinary demand is strengthening, and we remain bullish on ZTS, for which the segment represents 23% of revenues, its second largest species segment
by geography.
■ Sanofi's (SASY.PA) Merial saw revenues accelerate 18% despite a tough comp, driven by impressive companion (up 20%) and production animal (up 12%) experiences. Traction continues to build for its new chewable parasiticide NexGard (a sizable $3 billion category that ZTS entered with its Simparica launch in March 2016), consistent with our survey work on the therapeutic category. While U.S. companion animal benefited from NexGard and distribution shifts, we are particularly encouraged by the strength in livestock, for which it noted strength in U.S. cattle, which is likely more
relevant to ZTS.
■ Eli Lilly's (LLY) Elanco saw revenues improve 5% on respectable volume (up 3%). U.S. segment revenues were robust, rising 10% on strength in companion (up 14%) and livestock (up 8%), while outside the U.S., sales were essentially flat. It noted strength in U.S. cattle (ZTS's largest segment at 26% of revenues) and U.S. poultry, offsetting a decline in international companion animal. We view the trends as encouraging into ZTS's report, as
LLY is the third largest and relatively diversified animal health company.

June 2016 June 2016
Industrials 38
INDUSTRIALS
From report dated 20 May 2016
Railroads
North American Railroads Research Analyst
Allison M. Landry 212 325 3716
SECTOR REVIEW
The Second Quarter Is Shaping Up to Be the
Bottom of the Bottom
■ We updated our estimates for the Class I rails, with approximately one-half
of second quarter 2016 rail volumes currently on the books. In the second
quarter of 2016 to date, rail carloads have been tracking below our
estimates by roughly 3% on average. However, we decreased our second
quarter EPS forecasts by just 0.5% as a result of better mix and continued
execution on the cost front. We also point out that the volume declines have
stabilized (albeit at low levels) over the past six weeks.
■ The shortfall is almost entirely driven by intermodal, as high retail inventories
and excess truckload supply and contract rate weakness have finally caught
up with what has been an otherwise relative bright spot within rail traffic.
Following a 1% increase in the first quarter of 2016, intermodal volumes are
tracking down about 7% year over year (y/y) in the second quarter to date.
We estimate that weakness in intermodal in the second quarter has
accounted for nearly 80% of the sequential step-down in y/y volumes
relative to the first quarter.
■ Although the weakness in intermodal is concerning (particularly given the
dismal results that we have seen from several retailers recently), the good
news is that it should help from a freight mix perspective. We recall that
intermodal revenue per unit (RPU) is just 0.5 times the corporate average
RPU. At the same time, relatively high yielding agricultural products (which
carry an RPU that is 1.6 times the corporate average) have generally
trended better than expected, particularly at Union Pacific (UNP, agricultural
commodities are up 1% y/y in the second quarter of 2016 to date versus our
estimate of down 1%) and at Kansas City Southern (KSU, grain is up 18%
y/y in the second quarter to date versus our estimate of up 15%). Looking
toward the second half of 2016, grain could continue to help from a mix
standpoint, given high inventory levels along with expectations for a solid
harvest, which could force some product to market.
■ According to the Surface Transportation Board's rail employment data, the
April 2016 headcount was at the lowest level since August 2010. On a y/y
basis, the total rail employee count was down 12%, a modest acceleration
from down 11% in March and down 10% in the first quarter. This is
important, as it suggests that the rails continue to manage resources down
at a pace slightly faster than volume declines.

June 2016 June 2016
Industrials 39
From report dated 17 May 2016
Electrical Equipment
Electrical Equipment and Multi-Industry
Research Analyst
Julian Mitchell 212 325 6668
COMMENT
Sunny Place for Shady Top-Line Outlooks;
Software, M&A Possible Differentiators
■ Although Longboat Key, Florida is not exactly the French Riviera, the tone at
the electrical products group (EPG) conference on revenue outlooks brought
to mind Somerset Maugham's aphorism. Most of the investment community
has given up on assuming any kind of meaningful organic growth in the
years ahead for the sector; it sounds as if most companies do not disagree
(United Technologies [UTX] is one notable exception, guiding for 4-10%
medium-term growth across its various segments), and companies that have
guided for an imminent improvement in demand (Emerson [EMR]) have
come unstuck. Several companies highlighted their software and digital
offerings as one potential lever of growth, although others disagreed. We are
relatively comfortable with our forecast for sector-wide average organic sales
growth to accelerate to 2% exiting 2016 from 0% currently, as this is largely
attributable to easier comps. In our full report, we show our specific notes on
the EPG presentations by the electrical equipment and multi-industry
companies under our coverage universe.
■ Few companies mentioned an improvement in demand; however, there were
a couple of exceptions: (1) a slightly better outlook in China construction
noted by UTX, and Honeywell (HON) is seeing double-digit automation and
control solutions growth still in China; (2) power quality (datacenter demand)
was an area that Eaton (ETN) highlighted had been better than expected
after a couple of tough years; (3) Textron (TXT) is seeing the better Cessna
demand trend in the late first quarter of 2016 relative to the turn of the year
continue; and (4) Danaher (DHR) believes that the destocking in dental
should be over now. On the negative side, we note that UTX cited cool
weather, which means that Carrier's residential heating, ventilation, and air
conditioning (HVAC) business might come in below its 5% sales growth
guidance for 2016, and EMR cited weakness in U.S. and Middle East HVAC.
Hubbell (HUBB) has seen a cooling in U.S. electrical demand in the second
quarter of 2016 relative to the first quarter, whereas its guidance of 3-5%
growth for nonresidential demand had seemed conservative earlier in 2016;
this market has now settled somewhat. Oil and gas (O&G) is mixed. Dover
(DOV) noted that the U.S. rig count may bottom in the late second or third
quarter, and its sales are trending in-line with the 10% sequential sales drop
in the second quarter for which it had guided. HUBB cited some order activity
in O&G as well as some increase in customer inquiries, and management is
more positive on O&G than it was at the beginning of the first quarter or
during 2015. HON highlighted that it has seen decent bookings in UOP in the
second quarter to date. On the other hand, EMR noted that a key reason for
its shortfall in its April orders relative to prior expectations was U.S. O&G.

June 2016 June 2016
Materials 40
MATERIALS
From report dated 12 May 2016
Agricultural Chemicals/Biotech
Agricultural Sciences Sector Research Analyst
Christopher S. Parkinson 212 538 6286
CHANNEL CHECK
Live from Lincoln—It's Planting Season!
■ We recently had the opportunity to visit some friends in Nebraska, Iowa, and
Indiana. The following are our key thoughts on the U.S. planting season.
Based on our conversations with growers and recent updates, it appears that
the U.S. corn crop is off to a solid start. We highlight that planting in Iowa,
Illinois, and Indiana is only slightly behind 2015 owing to recent rains in the
previous week; however, planting still remains 26% ahead of their five-year
trend lines; these three states constitute around 40% of U.S. corn production.
Our visit to Nebraska (roughly 12% of U.S. corn production) indicates that
growers are making the most between rains, which should become evident in
the coming update. Most growers we spoke to feel better than they did at the
start of 2015, but we would characterize the general theme as cautiously
optimistic. Based on our visits, industry commentary, etc., we are
implementing a 2016-17 acreage estimate of 92.5 million at a yield of
approximately 169 bushels per acre; however, we are the first to stress that
precipitation rates in late June and July will be the delta in aggregate
production. We believe that this will result in corn prices in the range of
$3.50-4.00 per bushel; this range is also what most in the agricultural
community appear to be prepping for heading into the season. The soy crop
is likely to start off slightly behind 2015 owing to recent rains, but we believe
that it is two weeks too early to make a call here.
■ While the general tone from our visits was cautiously optimistic on the yield
front (and consequent revenue per acre), no one we spoke to was intending
to increase purchasing, large or small (equipment down to side-dress
fertilizer). In contrast to our preconceived assumption prior to our trip, we did
not hear of any intentions in the areas that we visited to switch more acreage
into soybeans following the recent run-up in prices; we will be curious if any
acreage switches occur in the northern tier where fertilizer applications went
on a bit later. We were also surprised to hear that anecdotal evidence
indicates that cash rents have hung on despite lower crop prices, which has
made squeezing a profit all the more difficult in certain areas. We would
characterize our overall view for the season as cautious, given we believe
that farming spending patterns are still likely to be flat to down in the
midsingle digits, whereas the market has been speculating that global
agricultural economics may actually improve materially in 2016. Despite some
recent headline risk (mainly prior to the recent agricultural rally), we saw no
evidence of any intention to cut on nitrogen. While not entirely broad based,
there was some evidence of skimming on phosphorus and potassium, which
we believe will keep a lid on year-over-year U.S. demand.

June 2016
Industry Valuation Tables 41
INDUSTRY VALUATION TABLES

Ju
ne 2
016
Ind
ustry
Valu
atio
n T
ab
les
42
Consumer Discretionary Apparel, Footwear & Specialty Softlines Christian Buss (212) 325-9667
Target Fiscal Annual EPS P/E vs. % 5 Yr. Indicated Mkt
05/31 Price 52-Wk Year Estimate1 ABS P/E S&P 500 Total Returns Growth Dividend Value
Apparel Tkr Rating Price 12 m Range End FYA FY1 FY2 FY1 FY2 FY1 FY2 1 Mon. 3 Mons. 12 Mons. EPS Div Rate Yld (Mil.)
Columbia COLM N 53.17 60.00 72-44 12/15 2.46 2.68 2.93 19.8 18.1 114 118 -11.38 -11.03 -5.68 0 0 0.18* 0.00* 3,704
lululemon athletica Inc. LULU O 65.03 76.00 69-44 01/15 1.86 2.21 2.66 29.5 24.5 169 159 -2.53 5.26 8.42 0 0.00 0.0 11,151
Michael Kors KORS N 42.72 49.00 59-36 03/15 4.28 4.41 4.32 9.7 9.9 55 64 -19.32 -25.30 -10.52 0 0.00 0.0 7,665
Phillips-Van Heusen PVH N 93.80 102.00 119-66 01/16 7.04 6.53 7.11 14.4 13.2 82 86 -3.21 9.77 -10.39 0.07* 0.00* 7,602
Ralph Lauren RL N 94.33 102.00 140-83 03/16 6.36 6.70 7.29 14.1 12.9 81 84 -0.95 -1.50 -28.32 0 0 0.56* 0.01* 7,820
Under Armour, Inc. UA N 37.73 35.00 54-35 12/15 0.53 0.60 0.73 63.0 52.0 361 338 -13.74 -12.10 -7.10 0 * * 16,296
VF Corporation VFC N 62.32 58.00 77-54 12/15 3.08 3.21 3.63 19.4 17.2 111 112 -3.60 -6.05 -11.24 0 0 0.37* 0.01* 25,989
Footwear
Deckers Brands DECK N 52.59 53.00 76-42 03/16 3.72 4.19 4.50 12.6 11.7 72 76 -10.33 -9.06 -23.06 0 0.00 0.0 1,684
Nike Inc. NKE O 55.22 68.00 67-51 05/15 1.85 2.13 2.41 26.0 22.9 149 149 -7.33 -10.17 8.53 0 0 0.16* 0.00* 93,030
Wolverine World WWW N 18.21 22.00 30-15 12/15 1.45 1.37 1.56 13.3 11.6 76 76 -3.80 -8.86 -37.51 0 0.00 0.0 1,813
Specialty Softlines
Abercrombie & Fitch Co. ANF U 19.89 18.00 32-16 01/16 1.13 0.85 0.94 23.3 21.1 134 137 -26.90 -36.13 -2.50 0.28* 0.01* 1,344
DSW Inc DSW N 21.16 19.00 36-19 01/16 1.54 1.32 1.38 16.1 15.4 92 100 -14.19 -19.36 -39.33 0 0.00 0.0 1,729
Finish Line Inc FINL N 18.13 17.00 29-16 02/16 1.22 1.54 1.67 11.7 10.9 67 71 -8.66 -2.94 -30.40 0 0 0.10* 0.01* 766
Foot Locker, Inc. FL N 55.92 64.00 76-54 01/16 4.30 4.70 5.00 11.9 11.2 68 73 -9.86 -11.57 -11.55 0 0.00 0.0 7,610
Hanesbrands Inc. HBI O 27.07 39.00 34-24 12/15 1.67 1.90 2.17 14.3 12.5 82 81 -7.64 -8.64 -15.46 0 0 0.11* 0.00* 10,219
L Brands, Inc. LB N 68.55 66.00 98-61 01/16 3.98 3.77 3.77 18.2 18.2 104 118 -13.82 -20.92 -18.72 0.55* 0.01* 19,674
The Gap, Inc. GPS U 17.99 21.00 39-17 01/16 2.38 1.92 2.15 9.4 8.4 54 55 -21.71 -36.97 -52.51 0 0 0.23* 0.01* 7,158
Tiffany & Co TIF N 61.96 59.00 96-61 01/16 3.89 3.66 3.90 16.9 15.9 97 104 -13.99 -10.33 -33.93 0 0 0.0 7,808
Tumi Holdings TUMI N 26.83 20.00 27-15 12/15 0.97 0.96 1.13 27.8 23.8 159 155 0.07 2.40 37.87 0 0.0 1,815
Urban Outfitters URBN N 28.53 34.00 36-21 01/16 1.78 2.05 2.35 13.9 12.1 80 79 -4.93 4.01 -18.39 0 0.0 3,341
Zumiez ZUMZ N [V] 14.88 15.00 30-14 01/15 1.10 0.88 0.99 16.9 15.0 97 98 -10.68 -27.94 -49.47 0 0 0.0 379
Textiles
Coach Inc COH N 39.42 42.00 42-27 06/15 1.92 1.87 2.21 21.1 17.9 121 116 -4.64 1.62 10.08 0 0.00 0.0 10,960
O=OUTPERFORM N=NEUTRAL U=UNDERPERFORM R=RESTRICTED [V]=VOLATILE
1Fiscal estimates reflect company fiscal year-end.
* Data reflect current quarter, not actual year.
Note: Boldface type indicates analyst’s top stock picks.
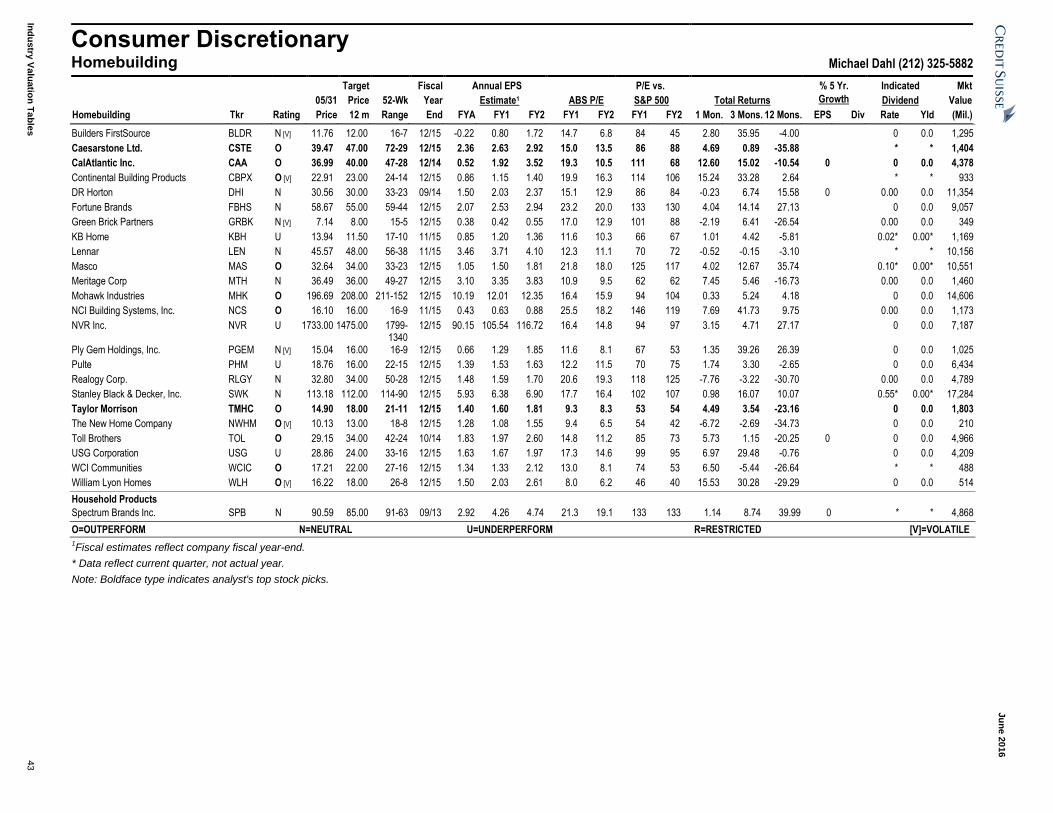
Ju
ne 2
016
Ind
ustry
Valu
atio
n T
ab
les
43
Consumer Discretionary Homebuilding Michael Dahl (212) 325-5882
Target Fiscal Annual EPS P/E vs. % 5 Yr. Indicated Mkt
05/31 Price 52-Wk Year Estimate1 ABS P/E S&P 500 Total Returns Growth Dividend Value
Homebuilding Tkr Rating Price 12 m Range End FYA FY1 FY2 FY1 FY2 FY1 FY2 1 Mon. 3 Mons. 12 Mons. EPS Div Rate Yld (Mil.)
Builders FirstSource BLDR N [V] 11.76 12.00 16-7 12/15 -0.22 0.80 1.72 14.7 6.8 84 45 2.80 35.95 -4.00 0 0.0 1,295
Caesarstone Ltd. CSTE O 39.47 47.00 72-29 12/15 2.36 2.63 2.92 15.0 13.5 86 88 4.69 0.89 -35.88 * * 1,404
CalAtlantic Inc. CAA O 36.99 40.00 47-28 12/14 0.52 1.92 3.52 19.3 10.5 111 68 12.60 15.02 -10.54 0 0 0.0 4,378
Continental Building Products CBPX O [V] 22.91 23.00 24-14 12/15 0.86 1.15 1.40 19.9 16.3 114 106 15.24 33.28 2.64 * * 933
DR Horton DHI N 30.56 30.00 33-23 09/14 1.50 2.03 2.37 15.1 12.9 86 84 -0.23 6.74 15.58 0 0.00 0.0 11,354
Fortune Brands FBHS N 58.67 55.00 59-44 12/15 2.07 2.53 2.94 23.2 20.0 133 130 4.04 14.14 27.13 0 0.0 9,057
Green Brick Partners GRBK N [V] 7.14 8.00 15-5 12/15 0.38 0.42 0.55 17.0 12.9 101 88 -2.19 6.41 -26.54 0.00 0.0 349
KB Home KBH U 13.94 11.50 17-10 11/15 0.85 1.20 1.36 11.6 10.3 66 67 1.01 4.42 -5.81 0.02* 0.00* 1,169
Lennar LEN N 45.57 48.00 56-38 11/15 3.46 3.71 4.10 12.3 11.1 70 72 -0.52 -0.15 -3.10 * * 10,156
Masco MAS O 32.64 34.00 33-23 12/15 1.05 1.50 1.81 21.8 18.0 125 117 4.02 12.67 35.74 0.10* 0.00* 10,551
Meritage Corp MTH N 36.49 36.00 49-27 12/15 3.10 3.35 3.83 10.9 9.5 62 62 7.45 5.46 -16.73 0.00 0.0 1,460
Mohawk Industries MHK O 196.69 208.00 211-152 12/15 10.19 12.01 12.35 16.4 15.9 94 104 0.33 5.24 4.18 0 0.0 14,606
NCI Building Systems, Inc. NCS O 16.10 16.00 16-9 11/15 0.43 0.63 0.88 25.5 18.2 146 119 7.69 41.73 9.75 0.00 0.0 1,173
NVR Inc. NVR U 1733.00 1475.00 1799-1340
12/15 90.15 105.54 116.72 16.4 14.8 94 97 3.15 4.71 27.17 0 0.0 7,187
Ply Gem Holdings, Inc. PGEM N [V] 15.04 16.00 16-9 12/15 0.66 1.29 1.85 11.6 8.1 67 53 1.35 39.26 26.39 0 0.0 1,025
Pulte PHM U 18.76 16.00 22-15 12/15 1.39 1.53 1.63 12.2 11.5 70 75 1.74 3.30 -2.65 0 0.0 6,434
Realogy Corp. RLGY N 32.80 34.00 50-28 12/15 1.48 1.59 1.70 20.6 19.3 118 125 -7.76 -3.22 -30.70 0.00 0.0 4,789
Stanley Black & Decker, Inc. SWK N 113.18 112.00 114-90 12/15 5.93 6.38 6.90 17.7 16.4 102 107 0.98 16.07 10.07 0.55* 0.00* 17,284
Taylor Morrison TMHC O 14.90 18.00 21-11 12/15 1.40 1.60 1.81 9.3 8.3 53 54 4.49 3.54 -23.16 0 0.0 1,803
The New Home Company NWHM O [V] 10.13 13.00 18-8 12/15 1.28 1.08 1.55 9.4 6.5 54 42 -6.72 -2.69 -34.73 0 0.0 210
Toll Brothers TOL O 29.15 34.00 42-24 10/14 1.83 1.97 2.60 14.8 11.2 85 73 5.73 1.15 -20.25 0 0 0.0 4,966
USG Corporation USG U 28.86 24.00 33-16 12/15 1.63 1.67 1.97 17.3 14.6 99 95 6.97 29.48 -0.76 0 0.0 4,209
WCI Communities WCIC O 17.21 22.00 27-16 12/15 1.34 1.33 2.12 13.0 8.1 74 53 6.50 -5.44 -26.64 * * 488
William Lyon Homes WLH O [V] 16.22 18.00 26-8 12/15 1.50 2.03 2.61 8.0 6.2 46 40 15.53 30.28 -29.29 0 0.0 514
Household Products
Spectrum Brands Inc. SPB N 90.59 85.00 91-63 09/13 2.92 4.26 4.74 21.3 19.1 133 133 1.14 8.74 39.99 0 * * 4,868
O=OUTPERFORM N=NEUTRAL U=UNDERPERFORM R=RESTRICTED [V]=VOLATILE
1Fiscal estimates reflect company fiscal year-end.
* Data reflect current quarter, not actual year.
Note: Boldface type indicates analyst's top stock picks.

Ju
ne 2
016
Ind
ustry
Valu
atio
n T
ab
les
44
Consumer Discretionary Media, Canada Robert Peters (416) 352-4550
Target Fiscal Annual EPS P/E vs. % 5 Yr. Indicated Mkt
05/31 Price 52-Wk Year Estimate1 ABS P/E S&P 500 Total Returns Growth Dividend Value
Aerospace & Defense Tkr Rating Price 12 m Range End FYA FY1 FY2 FY1 FY2 FY1 FY2 1 Mon. 3 Mons. 12 Mons. EPS Div Rate Yld (Mil.)
MacDonald, Dettwiler and Associates Ltd.(C$)
MDA O 86.44 97.00 99-73 12/15 6.10 6.22 6.72 13.9 12.9 75 84 -1.05 -2.25 -12.67 0 NA 0.37* 0.00* 3,134
Cable TV
Shaw Communications (NVS)(C$) SJR.B N 25.08 26.00 28-23 08/15 1.80 1.38 1.44 18.2 17.4 99 114 7.55 7.96 -9.62 0 0 1.19* 0.05* 12,053
Entertainment
Great Canadian Gaming Corporation(C$)
GC N 17.69 20.00 24-15 12/15 1.10 1.33 1.39 13.3 12.7 72 84 -1.72 1.14 -27.23 0 0 0.0 1,124
New Media
DHX Media Ltd(C$) DHX.B O 6.70 10.50 10-6 06/15 0.31 0.36 0.40 18.6 16.9 101 111 -11.02 -6.94 -29.62 0 0 0.0 906
Publishing & Information Services
Aimia(C$) AIM N 8.44 10.50 15-7 12/15 0.92 0.87 0.91 9.6 9.2 52 61 -1.06 -2.65 -42.62 0 0 * * 1,282
Quebecor, Inc.(C$) QBR.B O 37.40 39.00 38-27 12/15 1.94 2.39 2.72 15.6 13.8 85 90 10.62 11.18 16.62 0 0 0.10* 0.00* 4,596
Thomson Reuters Corporation TRI O 42.05 46.00 42-35 12/15 1.86 2.04 2.38 20.6 17.7 118 115 1.91 14.95 5.05 0 0 1.36* 0.03* 31,729
Radio & TV Broadcasting
Corus Entertainment Inc (NVS)(C$) CJR.B N 12.58 10.50 18-9 08/15 1.57 1.26 1.31 10.0 9.6 54 63 1.62 18.90 -29.41 0 0 1.14* 0.09* 2,378
Software
CGI Group(C$) GIB.A O 61.33 65.00 63-46 09/15 3.13 3.50 3.67 17.5 16.7 95 110 6.96 5.78 16.00 0 0 0.0 19,538
O=OUTPERFORM N=NEUTRAL U=UNDERPERFORM R=RESTRICTED [V]=VOLATILE
1Fiscal estimates reflect company fiscal year-end.
* Data reflect current quarter, not actual year.
Consumer Discretionary Movie Exhibitors Anthony Nemoto (212) 325-6065
Target Fiscal Annual EPS P/E vs. % 5 Yr. Indicated Mkt
05/31 Price 52-Wk Year Estimate1 ABS P/E S&P 500 Total Returns Growth Dividend Value
Advertising Tkr Rating Price 12 m Range End FYA FY1 FY2 FY1 FY2 FY1 FY2 1 Mon. 3 Mons. 12 Mons. EPS Div Rate Yld (Mil.)
National CineMedia NCMI O 14.60 21.00 17-13 12/15 0.51 0.53 0.70 27.8 20.9 159 136 1.74 -1.88 -8.98 0 NA 0.22* 0.02* 1,066
Entertainment
AMC Entertainment Holdings, Inc. AMC O 28.74 34.00 33-20 12/15 1.13 1.38 1.72 20.8 16.7 119 109 -0.52 11.83 2.64 0 0.20* 0.01* 2,800
Cinemark Holdings, Inc CNK N 36.18 33.00 42-27 12/15 1.97 1.99 2.31 18.2 15.6 104 102 2.12 11.36 -10.29 0 0 0.25* 0.01* 4,203
Regal Entertainment Group RGC N 21.03 20.00 22-17 12/15 1.08 1.09 1.30 19.3 16.2 110 106 -0.85 3.75 0.62 0 0 * * 3,297
O=OUTPERFORM N=NEUTRAL U=UNDERPERFORM R=RESTRICTED [V]=VOLATILE
1Fiscal estimates reflect company fiscal year-end.
* Data reflect current quarter, not actual year.

Ju
ne 2
016
Ind
ustry
Valu
atio
n T
ab
les
45
Consumer Discretionary Off Price Retail Michael Exstein (212) 325-4147
Target Fiscal Annual EPS P/E vs. % 5 Yr. Indicated Mkt
05/31 Price 52-Wk Year Estimate1 ABS P/E S&P 500 Total Returns Growth Dividend Value
Off Price Retail Tkr Rating Price 12 m Range End FYA FY1 FY2 FY1 FY2 FY1 FY2 1 Mon. 3 Mons. 12 Mons. EPS Div Rate Yld (Mil.)
Burlington Stores, Inc. BURL N 60.36 58.00 61-41 01/16 2.31 2.85 NA 21.2 NA 121 4.56 9.39 13.29 0.00 0.0 4,317
Ross Stores ROST N 53.40 46.50 59-45 01/16 2.51 2.70 NA 19.8 NA 114 -7.28 -7.69 10.65 0 0.0 21,456
Stein Mart, Inc. SMRT N 6.95 8.00 11-6 01/16 0.52 0.56 NA 12.4 NA 71 -4.14 -6.21 -35.29 * * 322
The TJX Companies, Inc. TJX N 76.12 70.00 79-64 01/16 3.33 3.42 NA 22.3 NA 128 -2.16 1.20 16.95 * * 50,322
O=OUTPERFORM N=NEUTRAL U=UNDERPERFORM R=RESTRICTED [V]=VOLATILE
1Fiscal estimates reflect company fiscal year-end.
* Data reflect current quarter, not actual year.
Consumer Discretionary Restaurants Jason West (617) 556-5745
Target Fiscal Annual EPS P/E vs. % 5 Yr. Indicated Mkt
05/31 Price 52-Wk Year Estimate1 ABS P/E S&P 500 Total Returns Growth Dividend Value
Restaurants Tkr Rating Price 12 m Range End FYA FY1 FY2 FY1 FY2 FY1 FY2 1 Mon. 3 Mons. 12 Mons. EPS Div Rate Yld (Mil.)
Bloomin' Brands Inc BLMN O 19.05 22.00 24-15 12/15 1.27 1.39 1.61 13.7 11.8 78 77 -0.47 6.01 -14.92 0 0.07* 0.00* 2,194
Buffalo Wild Wings, Inc BWLD U 145.39 120.00 206-129 12/15 4.96 5.72 6.90 25.4 21.1 146 137 6.19 -12.62 -4.71 0 0 0.0 2,737
Chipotle Mexican Grill, Inc. CMG O 441.96 500.00 758-404 12/15 15.10 1.87 9.43 235.7 46.8 1351 305 1.95 -15.70 -28.12 0 0 0.0 12,906
Darden Restaurants, Inc DRI O 67.83 72.00 68-54 05/15 2.63 3.52 4.02 19.3 16.9 110 110 6.63 4.64 15.13 0 0 0.50* 0.01* 8,596
Del Frisco's Restaurant Group Inc. DFRG N 15.46 17.00 19-13 12/15 0.79 0.86 1.01 17.9 15.3 103 100 -4.57 -7.48 -16.43 0 0 0.0 364
Dunkin' Brands Group DNKN O 43.29 51.00 57-38 12/15 1.93 2.23 2.47 19.4 17.5 111 114 -7.28 -8.79 -17.93 0 0 0.30* 0.01* 3,967
Fogo de Chao FOGO N [V] 13.44 16.00 26-13 12/15 0.93 0.94 1.07 14.3 12.6 82 82 -20.28 -18.15 0 0.0 378
McDonald's Corp MCD O 122.06 135.00 132-91 12/15 4.97 5.57 6.32 21.9 19.3 126 126 -4.79 4.60 26.86 0 0 0.89* 0.01* 107,129
Noodles & Company NDLS N [V] 9.38 11.00 17-9 12/15 0.13 0.04 0.11 230.5 89.0 1321 580 -17.50 -23.74 -35.49 0 0 0.0 261
Panera Bread Company PNRA O 219.15 225.00 219-166 12/15 6.21 6.61 7.65 33.2 28.7 190 187 2.13 1.87 20.87 0 0.0 5,236
Starbucks SBUX N 54.89 61.00 64-50 09/15 1.58 1.90 2.17 28.9 25.3 166 165 -4.31 -7.03 5.11 0 0 0.20* 0.00* 80,408
Texas Roadhouse, Inc TXRH N 44.81 42.00 45-34 12/15 1.37 1.79 2.04 25.1 21.9 144 143 6.54 6.11 27.74 0 0 0.19* 0.00* 3,151
Wendy's Company WEN N 10.28 10.50 11-9 12/15 0.32 0.38 0.40 26.7 25.5 153 166 -8.87 5.44 -7.55 0 0 0.06* 0.01* 2,740
Yum! Brands, Inc. YUM N 82.09 84.00 93-65 12/15 3.18 3.65 4.18 22.5 19.6 129 128 1.38 7.46 -9.06 0 0 0.46* 0.01* 33,447
Zoe's Kitchen, Inc ZOES U [V] 36.92 32.00 46-24 12/15 0.10 0.12 0.23 313.1 157.6 1795 1026 -4.05 4.00 15.05 0 0 0.0 717
O=OUTPERFORM N=NEUTRAL U=UNDERPERFORM R=RESTRICTED [V]=VOLATILE
1Fiscal estimates reflect company fiscal year-end.
* Data reflect current quarter, not actual year.
Note: Boldface type indicates analyst's top stock picks.

Ju
ne 2
016
Ind
ustry
Valu
atio
n T
ab
les
46
Consumer Discretionary Retail, Mall Anchors Michael Exstein (212) 325-4147
Target Fiscal Annual EPS P/E vs. % 5 Yr. Indicated Mkt
05/31 Price 52-Wk Year Estimate1 ABS P/E S&P 500 Total Returns Growth Dividend Value
Department Stores Tkr Rating Price 12 m Range End FYA FY1 FY2 FY1 FY2 FY1 FY2 1 Mon. 3 Mons. 12 Mons. EPS Div Rate Yld (Mil.)
Dillard's Inc. DDS N 59.11 63.00 117-55 01/16 6.90 6.45 NA 9.2 NA 53 -17.22 -30.08 -49.01 0.2857 0.0 2,105
JC Penney JCP N [V] 7.79 7.00 12-6 01/16 -1.68 0.04 NA 182.3 NA 1045 -19.02 -28.14 -8.35 0 0.0 2,395
Kohl's Corporation KSS N 36.04 38.00 66-35 01/16 3.46 3.95 NA 9.1 NA 52 -20.04 -22.89 -44.27 * * 6,673
Macy's Inc. M O 33.21 40.00 73-30 01/16 3.22 3.02 NA 11.0 NA 63 -16.79 -24.68 -50.29 1.34 0.0 10,354
Nordstrom JWN N 37.98 40.00 74-36 01/16 3.15 2.60 NA 14.6 NA 84 -26.38 -28.42 -44.47 * * 6,568
Stage Stores, Inc. SSI N [V] 5.53 10.00 18-5 01/16 0.12 0.20 NA 28.0 NA 161 -25.87 -21.11 -65.29 0 0.0 149
The Bon-Ton Stores, Inc. BONT U [V] 1.51 1.50 6-1 01/16 -2.89 -1.66 NA NM NA NM -35.74 -19.25 -73.08 * * 33
O=OUTPERFORM N=NEUTRAL U=UNDERPERFORM R=RESTRICTED [V]=VOLATILE
1Fiscal estimates reflect company fiscal year-end.
* Data reflect current quarter, not actual year.
Consumer Discretionary Retail, Mass Merchants Michael Exstein (212) 325-4147
Target Fiscal Annual EPS P/E vs. % 5 Yr. Indicated Mkt
05/31 Price 52-Wk Year Estimate1 ABS P/E S&P 500 Total Returns Growth Dividend Value
General Merchandise Stores Tkr Rating Price 12 m Range End FYA FY1 FY2 FY1 FY2 FY1 FY2 1 Mon. 3 Mons. 12 Mons. EPS Div Rate Yld (Mil.)
Costco Wholesale Corporation COST O 148.77 165.00 169-133 08/15 5.43 5.26 5.85 28.3 25.4 162 166 -1.43 -1.87 4.48 0 0.0 65,315
Target Corporation TGT N 68.78 72.00 85-67 01/15 3.46 5.25 4.40 13.1 15.6 75 102 -14.15 -13.71 -13.50 2.11* 0.03* 40,530
Wal-Mart Stores, Inc. WMT N 70.78 62.00 75-56 01/16 4.57 4.21 NA 16.8 NA 96 4.72 7.02 -5.29 1.96* 0.03* 222,162
O=OUTPERFORM N=NEUTRAL U=UNDERPERFORM R=RESTRICTED [V]=VOLATILE
1Fiscal estimates reflect company fiscal year-end.
* Data reflect current quarter, not actual year.
Note: Boldface type indicates analyst’s top stock pick.
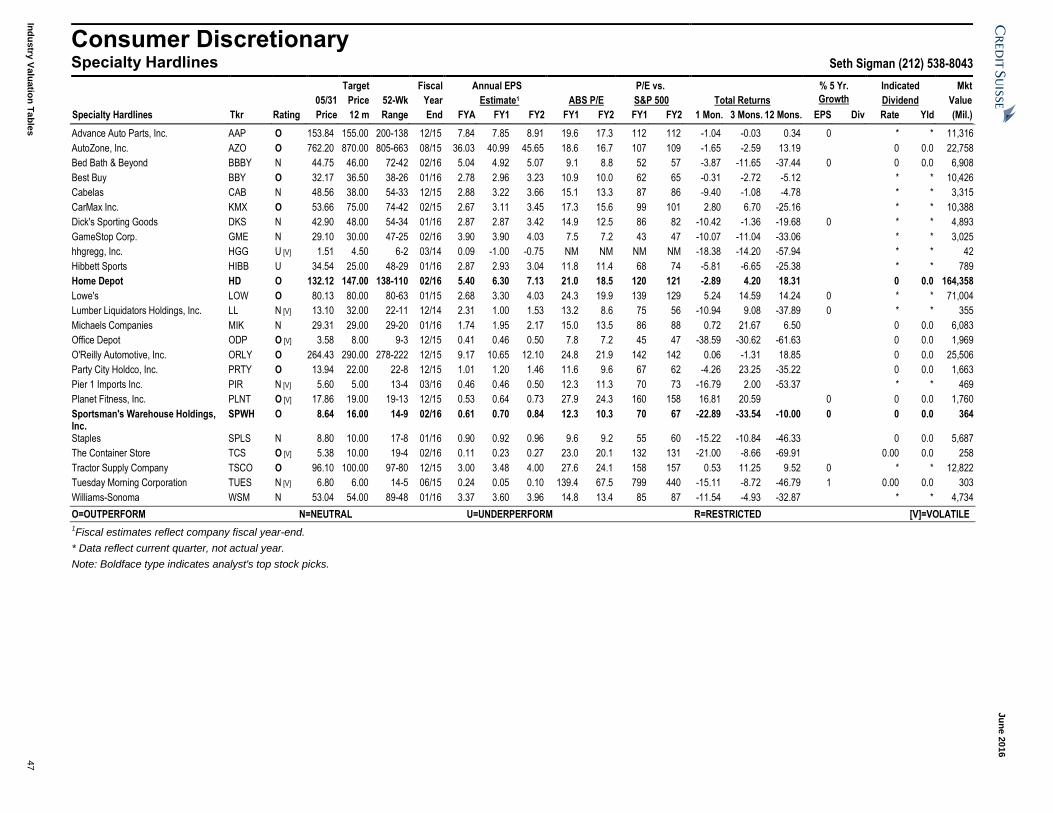
Ju
ne 2
016
Ind
ustry
Valu
atio
n T
ab
les
47
Consumer Discretionary Specialty Hardlines Seth Sigman (212) 538-8043
Target Fiscal Annual EPS P/E vs. % 5 Yr. Indicated Mkt
05/31 Price 52-Wk Year Estimate1 ABS P/E S&P 500 Total Returns Growth Dividend Value
Specialty Hardlines Tkr Rating Price 12 m Range End FYA FY1 FY2 FY1 FY2 FY1 FY2 1 Mon. 3 Mons. 12 Mons. EPS Div Rate Yld (Mil.)
Advance Auto Parts, Inc. AAP O 153.84 155.00 200-138 12/15 7.84 7.85 8.91 19.6 17.3 112 112 -1.04 -0.03 0.34 0 * * 11,316
AutoZone, Inc. AZO O 762.20 870.00 805-663 08/15 36.03 40.99 45.65 18.6 16.7 107 109 -1.65 -2.59 13.19 0 0.0 22,758
Bed Bath & Beyond BBBY N 44.75 46.00 72-42 02/16 5.04 4.92 5.07 9.1 8.8 52 57 -3.87 -11.65 -37.44 0 0 0.0 6,908
Best Buy BBY O 32.17 36.50 38-26 01/16 2.78 2.96 3.23 10.9 10.0 62 65 -0.31 -2.72 -5.12 * * 10,426
Cabelas CAB N 48.56 38.00 54-33 12/15 2.88 3.22 3.66 15.1 13.3 87 86 -9.40 -1.08 -4.78 * * 3,315
CarMax Inc. KMX O 53.66 75.00 74-42 02/15 2.67 3.11 3.45 17.3 15.6 99 101 2.80 6.70 -25.16 * * 10,388
Dick's Sporting Goods DKS N 42.90 48.00 54-34 01/16 2.87 2.87 3.42 14.9 12.5 86 82 -10.42 -1.36 -19.68 0 * * 4,893
GameStop Corp. GME N 29.10 30.00 47-25 02/16 3.90 3.90 4.03 7.5 7.2 43 47 -10.07 -11.04 -33.06 * * 3,025
hhgregg, Inc. HGG U [V] 1.51 4.50 6-2 03/14 0.09 -1.00 -0.75 NM NM NM NM -18.38 -14.20 -57.94 * * 42
Hibbett Sports HIBB U 34.54 25.00 48-29 01/16 2.87 2.93 3.04 11.8 11.4 68 74 -5.81 -6.65 -25.38 * * 789
Home Depot HD O 132.12 147.00 138-110 02/16 5.40 6.30 7.13 21.0 18.5 120 121 -2.89 4.20 18.31 0 0.0 164,358
Lowe's LOW O 80.13 80.00 80-63 01/15 2.68 3.30 4.03 24.3 19.9 139 129 5.24 14.59 14.24 0 * * 71,004
Lumber Liquidators Holdings, Inc. LL N [V] 13.10 32.00 22-11 12/14 2.31 1.00 1.53 13.2 8.6 75 56 -10.94 9.08 -37.89 0 * * 355
Michaels Companies MIK N 29.31 29.00 29-20 01/16 1.74 1.95 2.17 15.0 13.5 86 88 0.72 21.67 6.50 0 0.0 6,083
Office Depot ODP O [V] 3.58 8.00 9-3 12/15 0.41 0.46 0.50 7.8 7.2 45 47 -38.59 -30.62 -61.63 0 0.0 1,969
O'Reilly Automotive, Inc. ORLY O 264.43 290.00 278-222 12/15 9.17 10.65 12.10 24.8 21.9 142 142 0.06 -1.31 18.85 0 0.0 25,506
Party City Holdco, Inc. PRTY O 13.94 22.00 22-8 12/15 1.01 1.20 1.46 11.6 9.6 67 62 -4.26 23.25 -35.22 0 0.0 1,663
Pier 1 Imports Inc. PIR N [V] 5.60 5.00 13-4 03/16 0.46 0.46 0.50 12.3 11.3 70 73 -16.79 2.00 -53.37 * * 469
Planet Fitness, Inc. PLNT O [V] 17.86 19.00 19-13 12/15 0.53 0.64 0.73 27.9 24.3 160 158 16.81 20.59 0 0 0.0 1,760
Sportsman's Warehouse Holdings, Inc.
SPWH O 8.64 16.00 14-9 02/16 0.61 0.70 0.84 12.3 10.3 70 67 -22.89 -33.54 -10.00 0 0 0.0 364
Staples SPLS N 8.80 10.00 17-8 01/16 0.90 0.92 0.96 9.6 9.2 55 60 -15.22 -10.84 -46.33 0 0.0 5,687
The Container Store TCS O [V] 5.38 10.00 19-4 02/16 0.11 0.23 0.27 23.0 20.1 132 131 -21.00 -8.66 -69.91 0.00 0.0 258
Tractor Supply Company TSCO O 96.10 100.00 97-80 12/15 3.00 3.48 4.00 27.6 24.1 158 157 0.53 11.25 9.52 0 * * 12,822
Tuesday Morning Corporation TUES N [V] 6.80 6.00 14-5 06/15 0.24 0.05 0.10 139.4 67.5 799 440 -15.11 -8.72 -46.79 1 0.00 0.0 303
Williams-Sonoma WSM N 53.04 54.00 89-48 01/16 3.37 3.60 3.96 14.8 13.4 85 87 -11.54 -4.93 -32.87 * * 4,734
O=OUTPERFORM N=NEUTRAL U=UNDERPERFORM R=RESTRICTED [V]=VOLATILE
1Fiscal estimates reflect company fiscal year-end.
* Data reflect current quarter, not actual year.
Note: Boldface type indicates analyst's top stock picks.

Ju
ne 2
016
Ind
ustry
Valu
atio
n T
ab
les
48
Consumer Discretionary Travel & Leisure Benjamin Chaiken (212) 325-2585
Target Fiscal Annual EPS P/E vs. % 5 Yr. Indicated Mkt
05/31 Price 52-Wk Year Estimate1 ABS P/E S&P 500 Total Returns Growth Dividend Value
Travel & Leisure Tkr Rating Price 12 m Range End FYA FY1 FY2 FY1 FY2 FY1 FY2 1 Mon. 3 Mons. 12 Mons. EPS Div Rate Yld (Mil.)
Carnival CCL O 47.74 60.00 55-42 11/15 2.71 3.38 4.10 14.1 11.6 81 76 -3.61 -0.65 2.05 0.30* 0.01* 36,243
Cedar Fair LP FUN O 60.03 69.00 60-50 12/15 1.99 3.61 3.58 16.6 16.8 95 109 2.42 3.82 2.67 0.83* 0.01* 3,366
Diamond Resorts International DRII O [V] 22.93 31.00 35-17 12/14 0.79 2.04 3.14 11.2 7.3 64 48 11.85 0.92 -27.67 1 0.00 0.0 1,599
Intrawest Resort Holdings SNOW O 10.87 12.00 13-7 06/15 -0.15 0.67 0.13 16.3 83.0 94 540 24.23 25.96 -12.34 0 0.0 432
Marriott Vacations Worldwide VAC O 60.60 73.00 92-47 12/14 2.92 3.63 4.52 16.7 13.4 96 87 -2.04 -2.96 -31.92 1 0.25* 0.00* 1,710
Norwegian Cruise Line NCLH O 46.41 71.00 64-38 12/15 2.88 3.82 5.06 12.2 9.2 70 60 -6.86 -7.18 -15.25 0.00 0.0 10,535
Royal Caribbean Cruises RCL O 77.39 100.00 103-66 12/14 3.40 4.83 6.18 16.0 12.5 92 81 -1.69 2.25 1.62 0 0 0.38* 0.00* 16,658
SeaWorld Entertainment SEAS U 17.46 15.00 22-17 12/15 0.74 0.55 0.70 31.8 24.9 182 162 -11.46 -3.22 -18.37 0.21* 0.01* 1,548
Six Flags Entertainment Corp. SIX O 57.69 67.00 61-42 12/15 1.60 1.88 1.40 30.7 41.3 176 269 -3.35 11.07 18.24 0.58* 0.01* 5,381
Vail Resorts MTN O 131.25 145.00 134-101 07/15 3.07 4.07 4.92 32.2 26.7 185 174 0.37 2.16 25.51 0.62* 0.00* 4,758
Wyndham Worldwide Corp WYN N 67.39 63.00 87-62 12/15 5.11 5.78 6.31 11.7 10.7 67 69 -4.99 -10.87 -20.60 0.50* 0.01* 7,544
O=OUTPERFORM N=NEUTRAL U=UNDERPERFORM R=RESTRICTED [V]=VOLATILE
1Fiscal estimates reflect company fiscal year-end.
* Data reflect current quarter, not actual year.
Note: Boldface type indicates analyst's top stock picks.
Consumer Discretionary U.S. Media, Cable & Satellite Omar Sheikh (212) 325-6818
Target Fiscal Annual EPS P/E vs. % 5 Yr. Indicated Mkt
05/31 Price 52-Wk Year Estimate1 ABS P/E S&P 500 Total Returns Growth Dividend Value
Entertainment Tkr Rating Price 12 m Range End FYA FY1 FY2 FY1 FY2 FY1 FY2 1 Mon. 3 Mons. 12 Mons. EPS Div Rate Yld (Mil.)
21st Century Fox Inc. FOXA O 28.88 40.00 34-24 06/15 1.71 1.74 2.25 16.6 12.8 95 84 -4.87 3.74 -14.00 0 0 0.15 0.0 54,993
CBS Corporation CBS O 55.20 75.00 62-39 12/15 3.31 4.05 4.62 13.6 11.9 78 78 -2.25 7.23 -10.24 0 0 0.17* 0.00* 25,132
Discovery Communications Inc. DISCA N 27.85 25.00 35-24 12/15 1.75 1.87 2.06 14.9 13.5 86 88 -0.29 0.80 -17.92 0 0 0.0 11,021
Manchester United Plc MANU O 17.07 20.00 19-13 06/15 0.02 0.19 0.30 87.6 56.8 347 255 -0.47 18.79 0.41 0 * * 1,930
The Walt Disney Company DIS O 99.22 128.00 122-89 10/15 5.15 5.80 6.16 17.1 16.1 98 105 -4.93 0.40 -10.58 0 0 0.71 0.0 160,979
Time Warner Inc. TWX O 75.66 90.00 91-60 12/15 4.75 5.40 6.08 14.0 12.4 80 81 0.45 9.94 -10.34 0 0 0.40* 0.01* 59,499
Viacom Inc. VIAB O 44.37 55.00 68-31 09/15 5.44 5.00 5.65 8.9 7.9 51 51 5.69 13.71 -33.49 0 0 0.40* 0.01* 17,762
Satellite Services
Cablevision CVC N 34.68 34.90 35-23 12/14 0.94 0.85 0.91 40.8 38.3 234 249 3.06 4.30 40.75 1 0 0.15* 0.00* 9,583
DISH Network Corporation DISH N 49.90 53.00 76-40 12/15 2.54 2.60 2.53 19.2 19.7 110 128 2.00 1.24 -30.76 0 0 0.0 23,189
O=OUTPERFORM N=NEUTRAL U=UNDERPERFORM R=RESTRICTED [V]=VOLATILE
1Fiscal estimates reflect company fiscal year-end.
* Data reflect current quarter, not actual year.
Note: Boldface type indicates analyst's top stock picks.

Ju
ne 2
016
Ind
ustry
Valu
atio
n T
ab
les
49
Consumer Staples Agricultural Products & Agribusiness Robert Moskow (212) 538-3095
Target Fiscal Annual EPS P/E vs. % 5 Yr. Indicated Mkt
05/31 Price 52-Wk Year Estimate1 ABS P/E S&P 500 Total Returns Growth Dividend Value
Agricultural Products & Agribusiness Tkr Rating Price 12 m Range End FYA FY1 FY2 FY1 FY2 FY1 FY2 1 Mon. 3 Mons. 12 Mons. EPS Div Rate Yld (Mil.)
Archer Daniels Midland Inc. ADM N 42.77 40.00 53-31 12/15 2.60 2.53 2.91 16.9 14.7 97 96 6.23 16.13 -19.35 0.30* 0.01* 25,388
Bunge Limited BG O 67.07 78.00 93-48 12/15 4.83 5.80 6.50 11.6 10.3 66 67 7.28 24.16 -26.83 0.38* 0.01* 9,387
Tyson Foods TSN N 63.78 70.00 69-40 09/15 3.21 4.31 4.40 14.8 14.5 85 94 -4.33 -3.39 51.07 0.60* 0.01* 23,732
Meat, Poultry & Fish
Hormel Foods HRL N 34.41 38.00 44-28 10/15 1.32 1.59 1.69 21.7 20.4 124 133 -11.11 -21.96 20.59 0.58* 0.02* 18,234
=OUTPERFORM N=NEUTRAL U=UNDERPERFORM R=RESTRICTED [V]=VOLATILE
1Fiscal estimates reflect company fiscal year-end.
* Data reflect current quarter, not actual year.
Consumer Staples Drug & Food Retail & General Merchandise Stores Edward Kelly (212) 325-3241
Target Fiscal Annual EPS P/E vs. % 5 Yr. Indicated Mkt
05/31 Price 52-Wk Year Estimate1 ABS P/E S&P 500 Total Returns Growth Dividend Value
Drug Retail Tkr Rating Price 12 m Range End FYA FY1 FY2 FY1 FY2 FY1 FY2 1 Mon. 3 Mons. 12 Mons. EPS Div Rate Yld (Mil.)
CVS Health CVS O 97.17 120.00 113-90 12/15 5.18 5.80 6.59 16.8 14.7 104 104 0.60 2.83 -6.45 0 0 0.44* 0.00* 106,740
Rite Aid Corporation RAD N 7.95 9.00 9-6 02/15 0.27 0.18 0.27 44.7 29.1 278 205 2.05 0.76 -0.38 0 0.00 0.0 8,319
Walgreens Boots Alliance, Inc. WBA O 78.94 100.00 97-73 08/15 3.88 4.55 5.15 17.3 15.3 108 108 -0.98 -5.25 -4.98 0 0 0.36* 0.00* 85,156
Food Distributors
Sysco Corporation SYY O 48.11 55.00 50-36 06/15 1.84 2.04 2.20 23.6 21.9 135 142 -1.03 6.91 29.22 0 0 0.31* 0.01* 27,111
Food Retail
Kroger Co. KR N 35.76 34.00 43-34 01/16 2.08 2.15 2.37 16.7 15.1 96 98 0.93 -5.40 -2.01 0 0 0.11* 0.00* 34,107
Performance Food Group Company PFGC O [V] 24.83 30.00 27-19 06/15 0.79 0.91 1.07 27.2 23.3 156 152 -4.46 5.17 1 0 0.0 2,548
Smart & Final Stores, Inc. SFS N 15.87 16.00 19-14 12/15 0.73 0.75 0.87 21.1 18.3 121 119 -4.05 -2.46 -8.27 0 0.00 0.0 1,170
Sprouts Farmers Markets SFM O 24.76 28.00 30-20 12/15 0.86 0.97 1.12 25.5 22.1 146 144 -12.32 -13.64 -18.71 0 0.00 0.0 3,732
SUPERVALU INC. SVU N 4.63 6.00 9-4 02/16 0.80 0.74 0.76 6.2 6.1 36 40 -7.77 -12.81 -47.51 0 0.00 0.0 1,230
Whole Foods Market WFM O 32.35 40.00 42-29 09/15 1.62 1.50 1.42 21.6 22.8 124 148 11.36 -1.19 -21.23 0 0 0.16* 0.01* 10,385
General Merchandise Stores
Big Lots, Inc. BIG U 52.30 40.00 52-36 01/16 2.97 3.42 3.75 15.3 13.9 88 91 12.62 24.85 16.51 0 0 0.0 2,598
Dollar General DG O 89.90 95.00 90-60 01/16 3.96 4.64 5.00 19.4 18.0 111 117 8.97 19.83 23.47 0 0.25* 0.00* 25,512
Dollar Tree DLTR U 90.54 76.00 91-61 01/16 3.00 3.84 4.52 23.6 20.0 135 131 11.94 16.90 17.61 0 0.00 0.0 21,328
Five Below, Inc. FIVE O 41.86 47.00 43-28 01/16 1.05 1.30 1.60 32.2 26.1 185 170 0.22 11.03 23.59 0 0.00 0.0 2,290
Ollie's Bargain Outlet OLLI R [V] 25.07 R 28-15 01/16 0.72 R R R R R R R 23.56 R R 0.00 0.0 1,504
O=OUTPERFORM N=NEUTRAL U=UNDERPERFORM R=RESTRICTED [V]=VOLATILE
1Fiscal estimates reflect company fiscal year-end.
* Data reflect current quarter, not actual year.
Note: Boldface type indicates analyst’s top stock picks.

Ju
ne 2
016
Ind
ustry
Valu
atio
n T
ab
les
50
Consumer Staples Drug & Food Retail, Canada David Hartley (416) 352-4580
Target Fiscal Annual EPS P/E vs. % 5 Yr. Indicated Mkt
05/31 Price 52-Wk Year Estimate1 ABS P/E S&P 500 Total Returns Growth Dividend Value
Apparel Tkr Rating Price 12 m Range End FYA FY1 FY2 FY1 FY2 FY1 FY2 1 Mon. 3 Mons. 12 Mons. EPS Div Rate Yld (Mil.)
Gildan Activewear Incorporated(C$) GIL O 39.07 43.00 46-32 12/15 1.46 1.55 1.84 25.3 21.2 105 107 -0.38 10.84 -1.98 0 0 0.08* 0.00* 7,048
Department Stores
Hudson's Bay Company(C$) HBC O 14.82 23.00 29-15 02/16 0.28 0.42 0.61 35.0 24.2 190 159 -11.36 -12.87 -41.93 0 0 0.05* 0.00* 2,700
Drug Retail
Jean Coutu Group Inc(C$) PJC.A U 20.73 17.50 24-17 03/16 1.15 1.17 1.22 17.7 17.1 96 112 8.88 4.22 -11.94 0 0 0.48* 0.02* 3,833
Food Producers
Saputo Incorporated(C$) SAP N 39.95 33.00 42-29 03/15 1.45 1.52 1.75 26.3 22.9 143 150 0.23 1.27 18.02 0 0 0.13* 0.00* 15,901
Food Retail
Alimentation Couche-Tard Inc.(C$) ATD.B U 57.70 47.00 64-48 04/15 1.79 2.09 2.09 27.5 27.6 114 139 3.96 -4.09 19.46 0 0 0.06* 0.00* 21,037
CST Brands, Inc. CST N 37.93 37.00 41-32 12/15 2.17 1.51 1.79 25.1 21.1 144 138 0.26 10.87 -4.63 0 0 0.06* 0.00* 2,871
Empire Company Limited(C$) EMP.A U 22.47 21.00 31-20 05/15 1.87 1.38 1.46 16.3 15.4 88 101 6.54 -12.50 -24.66 0 0 0.10* 0.00* 3,899
George Weston Limited(C$) WN O 113.37 131.00 117-98 12/15 5.61 6.34 7.25 17.9 15.6 97 103 2.96 2.60 11.53 0 0 1.76* 0.02* 14,506
Loblaw Companies Limited(C$) L O 71.07 77.00 74-62 12/15 3.42 3.98 4.56 17.9 15.6 97 102 2.42 1.80 12.72 0 0 1.04* 0.01* 28,955
Metro Inc.(C$) MRU U 44.43 37.00 45-33 09/15 2.07 2.34 2.49 19.0 17.8 103 117 4.47 3.76 30.83 0 0 0.14* 0.00* 10,602
General Merchandise Stores
Canadian Tire Corporation Limited(C$) CTC.A U 143.20 128.00 145-104 12/15 8.28 8.79 9.52 16.3 15.0 88 99 2.97 8.63 9.20 0 0 0.58* 0.00* 9,960
Dollarama Inc.(C$) DOL N 90.30 84.00 93-71 01/16 3.01 3.38 4.00 26.8 22.6 145 148 0.58 19.44 26.59 0 0 0.40* 0.00* 10,928
Household Durables
Sleep Country Canada Holdings Incorporated(C$)
ZZZ O [V] 23.12 25.00 24-14 12/15 1.06 1.29 1.48 17.9 15.6 97 102 18.69 17.96 0 0.13* 0.01* 931
Restaurants
Restaurant Brands International QSR N 41.76 43.00 44-30 12/15 1.17 1.60 1.84 26.2 22.7 150 148 -3.42 13.32 8.69 0 0 0.16* 0.00* 20,819
Soft Drinks
Cott Corporation COT O 14.48 16.00 15-9 12/15 0.22 0.34 0.54 42.7 27.0 245 176 8.38 14.29 52.26 0 NA 0.06* 0.00* 1,776
O=OUTPERFORM N=NEUTRAL U=UNDERPERFORM R=RESTRICTED [V]=VOLATILE
1Fiscal estimates reflect company fiscal year-end.
* Data reflect current quarter, not actual year.
Note: Boldface type indicates analyst's top stock picks.
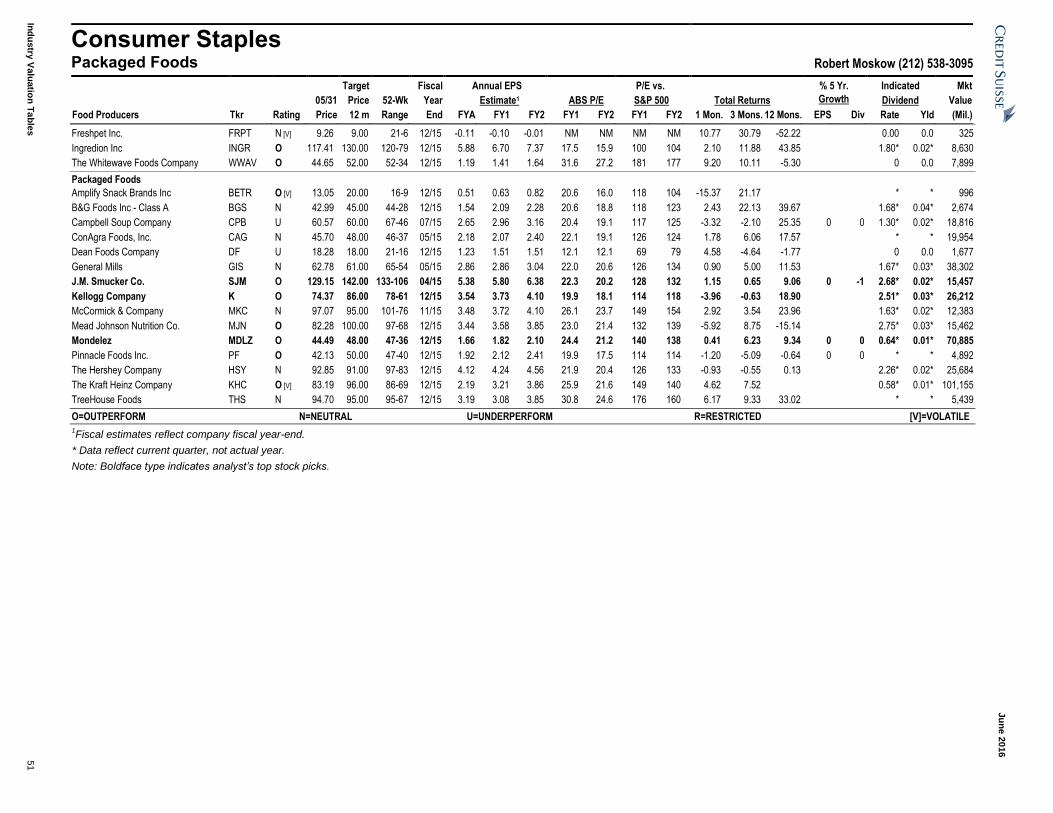
Ju
ne 2
016
Ind
ustry
Valu
atio
n T
ab
les
51
Consumer Staples Packaged Foods Robert Moskow (212) 538-3095
Target Fiscal Annual EPS P/E vs. % 5 Yr. Indicated Mkt
05/31 Price 52-Wk Year Estimate1 ABS P/E S&P 500 Total Returns Growth Dividend Value
Food Producers Tkr Rating Price 12 m Range End FYA FY1 FY2 FY1 FY2 FY1 FY2 1 Mon. 3 Mons. 12 Mons. EPS Div Rate Yld (Mil.)
Freshpet Inc. FRPT N [V] 9.26 9.00 21-6 12/15 -0.11 -0.10 -0.01 NM NM NM NM 10.77 30.79 -52.22 0.00 0.0 325
Ingredion Inc INGR O 117.41 130.00 120-79 12/15 5.88 6.70 7.37 17.5 15.9 100 104 2.10 11.88 43.85 1.80* 0.02* 8,630
The Whitewave Foods Company WWAV O 44.65 52.00 52-34 12/15 1.19 1.41 1.64 31.6 27.2 181 177 9.20 10.11 -5.30 0 0.0 7,899
Packaged Foods
Amplify Snack Brands Inc BETR O [V] 13.05 20.00 16-9 12/15 0.51 0.63 0.82 20.6 16.0 118 104 -15.37 21.17 * * 996
B&G Foods Inc - Class A BGS N 42.99 45.00 44-28 12/15 1.54 2.09 2.28 20.6 18.8 118 123 2.43 22.13 39.67 1.68* 0.04* 2,674
Campbell Soup Company CPB U 60.57 60.00 67-46 07/15 2.65 2.96 3.16 20.4 19.1 117 125 -3.32 -2.10 25.35 0 0 1.30* 0.02* 18,816
ConAgra Foods, Inc. CAG N 45.70 48.00 46-37 05/15 2.18 2.07 2.40 22.1 19.1 126 124 1.78 6.06 17.57 * * 19,954
Dean Foods Company DF U 18.28 18.00 21-16 12/15 1.23 1.51 1.51 12.1 12.1 69 79 4.58 -4.64 -1.77 0 0.0 1,677
General Mills GIS N 62.78 61.00 65-54 05/15 2.86 2.86 3.04 22.0 20.6 126 134 0.90 5.00 11.53 1.67* 0.03* 38,302
J.M. Smucker Co. SJM O 129.15 142.00 133-106 04/15 5.38 5.80 6.38 22.3 20.2 128 132 1.15 0.65 9.06 0 -1 2.68* 0.02* 15,457
Kellogg Company K O 74.37 86.00 78-61 12/15 3.54 3.73 4.10 19.9 18.1 114 118 -3.96 -0.63 18.90 2.51* 0.03* 26,212
McCormick & Company MKC N 97.07 95.00 101-76 11/15 3.48 3.72 4.10 26.1 23.7 149 154 2.92 3.54 23.96 1.63* 0.02* 12,383
Mead Johnson Nutrition Co. MJN O 82.28 100.00 97-68 12/15 3.44 3.58 3.85 23.0 21.4 132 139 -5.92 8.75 -15.14 2.75* 0.03* 15,462
Mondelez MDLZ O 44.49 48.00 47-36 12/15 1.66 1.82 2.10 24.4 21.2 140 138 0.41 6.23 9.34 0 0 0.64* 0.01* 70,885
Pinnacle Foods Inc. PF O 42.13 50.00 47-40 12/15 1.92 2.12 2.41 19.9 17.5 114 114 -1.20 -5.09 -0.64 0 0 * * 4,892
The Hershey Company HSY N 92.85 91.00 97-83 12/15 4.12 4.24 4.56 21.9 20.4 126 133 -0.93 -0.55 0.13 2.26* 0.02* 25,684
The Kraft Heinz Company KHC O [V] 83.19 96.00 86-69 12/15 2.19 3.21 3.86 25.9 21.6 149 140 4.62 7.52 0.58* 0.01* 101,155
TreeHouse Foods THS N 94.70 95.00 95-67 12/15 3.19 3.08 3.85 30.8 24.6 176 160 6.17 9.33 33.02 * * 5,439
O=OUTPERFORM N=NEUTRAL U=UNDERPERFORM R=RESTRICTED [V]=VOLATILE
1Fiscal estimates reflect company fiscal year-end.
* Data reflect current quarter, not actual year.
Note: Boldface type indicates analyst’s top stock picks.

Ju
ne 2
016
Ind
ustry
Valu
atio
n T
ab
les
52
Energy Alternative Energy Patrick Jobin (212) 325-0843
Target Fiscal Annual EPS P/E vs. % 5 Yr. Indicated Mkt
05/31 Price 52-Wk Year Estimate1 ABS P/E S&P 500 Total Returns Growth Dividend Value
Alternative Energy Tkr Rating Price 12 m Range End FYA FY1 FY2 FY1 FY2 FY1 FY2 1 Mon. 3 Mons. 12 Mons. EPS Div Rate Yld (Mil.)
BioAmber Inc. BIOA O [V] 3.74 10.00 9-3 12/15 -1.89 -1.27 -0.57 NM NM NM NM -14.22 -14.02 -55.05 0 0.00 0.0 108
Energy Recovery Inc. ERII O [V] 10.75 15.00 13-2 12/15 -0.22 0.75 0.07 14.2 149.9 82 976 -12.60 39.97 310.31 1 0.00 0.0 563
EnerNOC ENOC O [V] 6.60 10.00 11-3 12/15 -2.80 -3.10 -2.93 NM NM NM NM -8.46 -2.94 -33.40 0.00 0.0 202
First Solar FSLR N [V] 49.65 65.00 73-41 12/15 5.33 4.34 2.53 11.4 19.6 66 128 -9.48 -28.78 -0.50 0 0.00 0.0 5,076
Itron ITRI N 44.05 38.00 44-28 12/15 1.02 2.10 2.34 21.0 18.8 121 122 6.84 6.61 23.60 0 0.00 0.0 1,669
JA Solar Holdings JASO N 7.97 9.69 10-7 12/15 1.58 1.64 1.87 4.9 4.3 28 28 -6.89 -13.56 -3.98 0 0.00 0.0 379
Jinko Solar JKS O [V] 21.74 40.00 32-16 12/15 5.36 5.75 6.60 3.8 3.3 22 21 -2.95 -8.23 -23.48 0 0.00 0.0 682
ReneSola Ltd SOL U [V] 1.36 1.50 2-1 12/15 -0.05 0.11 0.05 12.2 25.9 70 168 3.82 -9.33 -4.90 0 0 0.0 138
Silver Spring Networks SSNI N [V] 13.05 14.00 16-10 12/15 0.09 0.10 0.19 127.0 69.6 728 453 -8.36 0.62 -3.83 0 0 0.0 710
SolarCity SCTY O [V] 22.39 38.00 61-17 12/15 -7.78 -9.48 -7.94 NM NM NM NM -24.23 -0.44 -63.10 0 0.0 2,201
SunPower Corp. SPWR O [V] 17.53 32.00 33-15 12/15 2.16 1.15 1.55 15.2 11.3 87 73 -9.69 -26.87 -41.63 0 0 0.0 2,420
Sunrun RUN O [V] 6.34 18.00 14-5 12/15 -0.55 -0.72 -0.57 NM NM NM NM -20.45 -0.94 0.00 0.0 646
Trina Solar Ltd TSL N [V] 8.03 12.00 13-8 12/15 0.74 1.14 1.27 7.0 6.3 40 41 -15.30 -23.23 -33.64 0 0 0.0 742
Vivint Solar, Inc. VSLR N [V] 3.59 5.00 16-2 12/15 0.11 -1.30 -1.54 NM NM NM NM 11.84 -23.62 -74.39 0 0.0 385
Yingli Green Energy Holding YGE U [V] 3.82 3.00 14-3 12/15 -48.45 1.03 -1.03 3.7 NM 21 NM 6.11 -15.11 -63.27 0 0 0.0 69
O=OUTPERFORM N=NEUTRAL U=UNDERPERFORM R=RESTRICTED [V]=VOLATILE
1Fiscal estimates reflect company fiscal year-end.
* Data reflect current quarter, not actual year.
Note: Boldface type indicates analyst's top picks.

Ju
ne 2
016
Ind
ustry
Valu
atio
n T
ab
les
53
Energy Independent Refiners Edward Westlake (212) 325-6751
Target Fiscal Annual EPS P/E vs. % 5 Yr. Indicated Mkt
05/31 Price 52-Wk Year Estimate1 ABS P/E S&P 500 Total Returns Growth Dividend Value
Independent Refiners Tkr Rating Price 12 m Range End FYA FY1 FY2 FY1 FY2 FY1 FY2 1 Mon. 3 Mons. 12 Mons. EPS Div Rate Yld (Mil.)
Holly Frontier Corp. HFC N 26.76 36.00 54-27 12/15 4.72 1.72 3.09 15.5 8.7 89 56 -24.60 -24.79 -35.35 0.33* 0.01* 4,614
Marathon MPC O 34.83 48.00 59-31 12/15 5.87 3.03 4.12 11.5 8.5 66 55 -9.72 -6.67 -32.73 0.32* 0.01* 18,454
PBF ENERGY INC PBF O 26.37 38.00 41-26 12/15 4.25 2.26 4.68 11.7 5.6 67 37 -18.23 -18.99 -0.30 0.31* 0.01* 2,710
Phillips 66 PSX N 80.36 85.00 94-71 12/15 7.67 5.28 7.33 15.2 11.0 87 71 -2.24 -6.66 1.27 0.55* 0.01* 42,287
Master Limited Partnerships
CVR Refining LP CVRR N 10.16 13.00 23-10 12/15 2.44 1.44 1.42 7.1 7.2 40 47 -10.56 -9.20 -47.19 0.00* 0.00* 1,500
Northern Tier Energy, LP NTI N 21.30 24.00 29-21 12/15 4.25 1.52 2.08 14.0 10.2 80 67 -6.91 -9.28 -12.70 0 0 0.54* 0.03* 1,982
Oil & Gas Refining & Marketing
Alon USA Energy, Inc. ALJ N [V] 7.55 13.00 23-7 12/15 1.12 -0.44 0.36 NM 21.2 NM 138 -27.05 -31.18 -56.41 0.16* 0.02* 538
Alon USA Partners LP ALDW N [V] 9.45 13.00 26-9 12/15 2.51 0.80 1.30 11.8 7.3 68 47 -5.41 -10.00 -51.69 0.45* 0.05* 591
Delek US Holdings, Inc. DK O [V] 13.78 22.00 40-13 12/15 1.95 -0.78 0.43 NM 31.8 NM 207 -12.06 -14.99 -63.54 0.15* 0.01* 852
Tesoro Corp. TSO O 78.08 100.00 118-69 12/15 11.44 8.33 7.62 9.4 10.3 54 67 -3.64 -9.20 -10.91 0.51* 0.01* 9,368
Valero Energy Corporation VLO N 54.70 68.00 73-54 12/15 9.11 6.00 6.83 9.1 8.0 52 52 -8.56 -14.32 -6.94 0.61* 0.01* 25,698
Western Refining Inc. WNR O 21.24 31.00 50-21 12/15 4.88 1.69 2.07 12.6 10.3 72 67 -20.45 -26.22 -50.65 0.38* 0.02* 1,939
O=OUTPERFORM N=NEUTRAL U=UNDERPERFORM R=RESTRICTED [V]=VOLATILE
1Fiscal estimates reflect company fiscal year-end.
* Data reflect current quarter, not actual year.
Note: Boldface type indicates analyst's top stock pick.
Energy Integrated Oil & Gas Edward Westlake (212) 325-6751
Target Fiscal Annual EPS P/E vs. % 5 Yr. Indicated Mkt
05/31 Price 52-Wk Year Estimate1 ABS P/E S&P 500 Total Returns Growth Dividend Value
Integrated Oil & Gas Tkr Rating Price 12 m Range End FYA FY1 FY2 FY1 FY2 FY1 FY2 1 Mon. 3 Mons. 12 Mons. EPS Div Rate Yld (Mil.)
Chevron Corp. CVX N 101.00 100.00 104-70 12/15 3.31 0.64 4.50 156.8 22.4 899 146 -2.24 15.39 -1.59 0 0 1.08* 0.01* 190,355
ConocoPhillips COP N 43.79 44.00 64-32 12/15 -1.39 -3.28 -0.88 NM NM NM NM -6.53 13.56 -31.16 0 0 0.25* 0.01* 54,228
ExxonMobil Corporation XOM U 89.02 78.00 90-69 12/15 3.78 2.45 4.25 36.4 21.0 208 136 -0.12 8.03 4.57 0 0 0.76* 0.01* 369,678
Hess Corporation HES N 59.93 65.00 70-34 12/15 -3.92 -5.52 -2.60 NM NM NM NM 1.61 24.85 -10.23 0 0.25* 0.00* 18,982
Marathon Oil Corp MRO O [V] 13.07 18.00 28-7 12/15 -1.28 -1.45 -0.44 NM NM NM NM -3.54 31.09 -51.75 0 0 0.05* 0.00* 11,079
Oil & Gas Exploration & Production
Anadarko Petroleum Corp. APC N [V] 51.86 57.00 85-31 12/15 -2.00 -4.08 -1.33 NM NM NM NM -0.17 20.66 -38.14 0.05* 0.00* 26,471
Apache Corp. APA N 57.14 59.00 60-34 12/15 -0.27 -1.79 0.45 NM 127.6 NM 830 5.35 26.72 -2.94 0.25* 0.00* 22,540
Cobalt International Energy CIE N [V] 2.24 8.00 11-2 12/15 -1.28 -0.57 -0.57 NM NM NM NM -31.91 -30.00 -77.42 0 0.00 0.0 930
Devon Energy Corp DVN O [V] 36.09 42.00 65-19 12/15 2.52 -1.61 0.53 NM 68.4 NM 446 4.43 64.05 -44.02 0.06* 0.00* 19,312
Kosmos Energy Ltd KOS O [V] 5.74 10.00 9-4 12/15 -0.17 -0.53 -0.40 NM NM NM NM -9.32 5.90 -35.29 0 0.00 0.0 2,211
Murphy Oil Corp. MUR N [V] 30.91 33.00 44-16 12/15 -3.05 -2.32 0.24 NM 126.5 NM 824 -12.04 45.46 -27.30 0 0 0.35* 0.01* 5,322
Occidental Petroleum OXY N 75.44 72.00 79-60 12/15 0.12 -1.64 0.82 NM 92.2 NM 600 -1.17 7.02 -4.33 0 0 0.74* 0.01* 57,714
O=OUTPERFORM N=NEUTRAL U=UNDERPERFORM R=RESTRICTED [V]=VOLATILE
1Fiscal estimates reflect company fiscal year-end.
* Data reflect current quarter, not actual year.
Note: Boldface type indicates analyst’s top stock pick.

Ju
ne 2
016
Ind
ustry
Valu
atio
n T
ab
les
54
Energy Master Limited Partnerships
Bhavesh Lodaya (212) 325-2337
John Edwards (713) 890-1594
Target Fiscal Annual EPS P/E vs. % 5 Yr. Indicated Mkt 05/31 Price 52-Wk Year Estimate1 ABS P/E S&P 500 Total Returns Growth Dividend Value Gas Utilities Tkr Rating Price 12 m Range End FYA FY1 FY2 FY1 FY2 FY1 FY2 1 Mon. 3 Mons. 12 Mons. EPS Div Rate Yld (Mil.)
CenterPoint Energy Inc CNP N 22.53 24.00 23-16 12/15 1.08 1.16 1.20 19.4 18.7 111 122 3.82 19.97 11.42 0 0 0.26* 0.01* 9,702
Master Limited Partnerships
AmeriGas Partners, L.P. APU U 45.88 36.00 49-32 09/15 1.92 2.05 2.71 22.3 16.9 128 110 5.91 6.45 -6.16 0 0 0.92* 0.02* 4,263 Antero Midstream Partners LP AM O [V] 24.60 34.00 29-17 12/15 0.80 0.96 0.96 25.6 25.6 147 167 1.91 9.28 -13.68 0.24* 0.01* 4,334 Archrock Partners, LP APLP O [V] 14.27 15.00 26-6 12/15 1.15 0.60 0.44 23.9 32.8 137 213 12.90 86.54 -43.89 0 0 0.29* 0.02* 857 Boardwalk Pipeline Partners, LP BWP O 17.66 22.00 18-10 12/15 0.87 1.12 1.22 15.7 14.5 90 95 7.49 29.76 10.65 0 0 0.10* 0.01* 4,420 Calumet Specialty Products Partners, L.P. CLMT U [V] 4.38 6.00 28-4 12/15 1.31 -1.60 -1.27 NM NM NM NM 1.86 -59.74 -83.53 0.685 0.2 333 Cheniere Energy Partners, LP CQP O 28.91 41.00 34-20 12/14 -1.72 -1.31 -0.70 NM NM NM NM -0.79 6.01 -13.88 0 NA 0.43* 0.01* 9,668 Cheniere Energy Partners, LP Holdings LLC
CQH O 19.95 30.00 25-12 12/14 0.08 0.08 0.08 253.2 253.2 1,451 1,648 3.10 12.52 -18.90 0.02* 0.00* 8,466 Cheniere Energy, Inc. LNG O 32.13 86.00 75-24 12/14 -2.45 -1.55 -0.73 NM NM NM NM -17.59 -13.28 -57.19 0 0 0.0 7,567 Columbia Pipeline Partners, LP CPPL O 14.73 23.00 27-11 12/15 0.83 1.02 1.15 14.4 12.8 83 84 3.44 -21.69 -45.40 0.19* 0.01* 1,483 CONE Midstream Partners, LP CNNX O [V] 15.50 20.00 20-8 12/15 1.21 1.64 1.63 9.5 9.5 54 62 9.00 36.08 -20.88 74 0.26* 0.02* 904 DCP Midstream Partners, LP DPM N [V] 33.53 34.00 38-16 12/15 0.89 1.67 1.89 20.0 17.7 115 115 1.85 43.17 -11.39 0 0 0.78* 0.02* 3,847 Enable Midstream Partners ENBL O [V] 14.54 14.00 17-6 12/15 -1.72 0.77 0.79 19.0 18.4 109 120 23.64 118.98 -13.19 0.32* 0.02* 6,141 Enbridge Energy Partners, LP EEP N 21.74 25.00 37-15 12/15 -0.25 -1.00 -1.15 NM NM NM NM 0.56 23.66 -41.12 0 0.58* 0.03* 7,521 Energy Transfer Equity, LP ETE R [V] 12.64 R 35-4 12/14 1.15 R R R R R R R 60.00 -62.91 R R 0.29* 0.02* 13,206 Energy Transfer Partners, LP ETP O 36.26 42.00 56-20 12/15 -0.08 -0.39 1.13 NM 32.1 NM 209 3.78 26.34 -35.20 1 0 1.06* 0.03* 18,809 EnLink Midstream ENLC N [V] 15.67 16.00 34-7 12/15 -2.14 -2.84 NA NM NA NM 10.74 55.46 -52.59 0.26* 0.02* 2,821 EnLink Midstream Partners ENLK O [V] 15.74 18.00 25-8 12/15 3.66 -1.96 NA NM NA NM 15.31 42.31 -37.24 0.39* 0.02* 5,238 Enterprise Products Partners, LP EPD N 27.76 30.00 32-20 12/15 1.26 1.41 1.53 19.7 18.1 113 118 7.10 15.14 -13.63 0 0 0.40* 0.01* 57,783 EQT GP Holdings, LP EQGP O 26.10 34.00 35-18 12/15 0.42 0.77 0.81 34.0 32.2 195 209 -0.27 7.14 -17.01 0.15* 0.01* 6,947 EQT Midstream Partners, LP EQM O 75.37 109.00 85-59 12/15 4.69 5.39 5.11 14.0 14.7 80 96 -2.87 1.85 -10.47 0 0 0.78* 0.01* 5,960 Genesis Energy, LP GEL O 37.67 46.00 50-20 12/15 0.85 1.43 1.73 26.3 21.8 151 142 17.72 37.28 -22.41 0 0 0.69* 0.02* 4,143 Green Plains Partners, LP GPP O [V] 14.40 18.00 16-13 12/15 1.11 1.66 1.89 8.7 7.6 50 49 0.49 10.94 0.41* 0.03* 458 Kinder Morgan, Inc. KMI N 18.08 22.00 41-12 12/15 0.78 0.70 0.85 25.9 21.2 149 138 2.79 -4.34 -56.21 0 0 0.13* 0.01* 40,347 Magellan Midstream Partners , LP MMP U 70.05 70.00 79-55 12/15 3.60 3.70 3.85 18.9 18.2 108 118 -2.42 -0.17 -11.41 0 0 0.82* 0.01* 15,956 Midcoast Energy Partners, L.P. MEP N [V] 8.15 6.00 13-4 12/14 1.39 -3.55 -0.95 NM NM NM NM 17.27 89.53 -32.37 0.35* 0.04* 376 MPLX LP MPLX O [V] 31.90 40.00 76-17 12/15 1.23 1.41 1.92 22.6 16.6 129 108 -0.53 19.25 -56.64 0 0 0.51* 0.02* 11,062 Niska Gas Storage Partners, LLC NKA N 4.14 4.00 4-1 03/15 -9.31 -0.54 -0.29 NM NM NM NM 18.29 16.29 146.43 0 -1 0 0.0 157 NuStar Energy, LP NS N [V] 49.17 46.00 63-27 12/15 3.30 2.28 2.41 21.6 20.4 124 133 -0.85 31.75 -20.69 1 NA 1.10* 0.02* 3,830 NuStar GP Holdings, LLC NSH N [V] 25.03 24.00 40-13 12/15 1.68 1.51 1.55 16.6 16.1 95 105 2.33 37.75 -35.39 0 NA 0.55* 0.02* 1,075 ONEOK Partners, LP OKS N 37.95 40.00 40-22 12/15 1.43 2.28 2.58 16.6 14.7 95 96 8.12 21.83 -3.11 0 0 0.79* 0.02* 10,847 ONEOK, Inc. OKE N [V] 43.25 42.00 43-19 12/15 1.16 1.97 2.25 21.9 19.2 126 125 20.21 62.59 4.70 0 0 0.63* 0.01* 9,087 PBF Logistics, LP PBFX N 21.79 24.00 25-16 12/15 2.15 2.03 2.22 10.7 9.8 62 64 3.12 19.73 -6.60 78 0.44* 0.02* 812 Phillips 66 Partners, LP PSXP O [V] 54.93 82.00 75-45 12/15 2.25 2.68 3.32 20.5 16.5 117 108 -2.64 -8.71 -24.89 0 0 0.51* 0.01* 5,158 Plains All American Pipeline, LP PAA N [V] 23.13 26.00 48-15 12/15 0.86 1.61 2.30 14.4 10.1 82 65 3.58 2.80 -50.92 0 0 0.70* 0.03* 9,200 Plains GP Holdings, LP PAGP N [V] 9.39 11.00 28-5 12/15 1.45 0.18 0.23 51.4 41.6 294 271 1.29 18.11 -65.93 0 0 0.23* 0.02* 5,860 Spectra Energy Partners, LP SEP N 44.94 56.00 51-38 12/15 3.27 3.25 3.41 13.8 13.2 79 86 -9.72 -4.55 -10.87 0 0 0.66* 0.01* 13,076 Suburban Propane Partners, LP SPH U 34.56 32.00 43-21 09/15 1.39 0.21 1.77 164.4 19.6 942 127 16.48 18.07 -20.42 0 0 0.89* 0.03* 2,100 Summit Midstream Partners, LP SMLP N [V] 20.94 27.00 35-12 12/15 -3.16 -0.22 0.03 NM 780.8 NM 5083 -2.15 49.68 -38.83 0 0 0.58* 0.03* 1,423 Sunoco Logistics Partners, LP SXL N [V] 27.45 31.00 40-16 12/15 1.70 0.92 1.32 29.8 20.8 171 136 -5.86 -1.47 -30.49 0 0 0.50* 0.02* 8,117 Sunoco, LP SUN N 33.17 37.00 47-23 12/15 1.09 3.03 3.22 11.0 10.3 63 67 -6.38 0.52 -27.34 0 0 0.83* 0.02* 3,707 Tallgrass Energy GP, LP TEGP O [V] 24.04 28.00 33-10 12/15 0.20 1.05 1.44 22.8 16.7 131 109 11.50 46.50 -26.30 0.24* 0.01* 3,780 Tallgrass Energy Partners, L.P. TEP O 45.26 60.00 51-26 12/15 1.92 2.49 3.12 18.2 14.5 104 94 6.37 24.20 -9.48 1 0 0.74* 0.02* 3,301 Targa Resources Corp. TRGP N [V] 42.83 42.00 94-15 12/15 1.51 -0.27 -0.27 NM NM NM NM 10.05 48.97 -53.25 0.91* 0.02* 6,878 Tesoro Logistics, LP TLLP N 49.15 57.00 60-37 12/15 2.30 3.09 3.52 15.9 14.0 91 91 9.32 11.17 -15.30 0 0 0.84* 0.02* 4,695 Valero Energy Partners, LP VLP N [V] 46.27 60.00 54-38 12/15 2.02 2.45 2.74 18.9 16.9 108 110 -1.07 -4.87 -10.81 0 1 0.36* 0.01* 3,119 VTTI Energy Partners, LP VTTI N 20.30 24.00 28-15 12/15 1.09 1.39 0.74 14.6 27.4 84 178 4.21 7.69 -22.16 65 0.32* 0.02* 887 Western Gas Equity Partners, L.P. WGP N 42.05 39.00 64-20 12/15 0.83 1.66 2.11 25.3 20.0 145 130 5.36 31.16 -33.88 0 0 0.42* 0.01* 9,206 Western Gas Partners, LP WES N 49.83 56.00 68-27 12/15 -0.03 2.14 3.30 23.2 15.1 133 98 2.43 18.02 -26.69 0 0 0.83* 0.02* 7,225 Western Refining Logistics, LP WNRL N 23.61 28.00 32-17 12/15 1.26 1.58 1.62 15.0 14.6 86 95 -7.45 7.86 -16.78 1 0 0.42* 0.02* 1,205 Williams Companies, Inc WMB R [V] 22.16 R 61-11 12/14 2.92 R R R R R R R 22.50 -56.82 R R 0.64* 0.03* 16,632 Williams Partners, LP WPZ N [V] 31.92 32.00 56-13 12/15 -3.14 1.22 1.85 26.2 17.3 150 112 4.01 37.94 -42.85 0 0 0.85* 0.03* 19,278 Natural Gas
NiSource Inc. NI N 23.86 24.00 24-16 12/15 1.38 1.03 1.18 23.1 20.2 132 131 3.92 6.80 29.02 0.16* 0.01* 7,672
O=OUTPERFORM N=NEUTRAL U=UNDERPERFORM R=RESTRICTED [V]=VOLATILE
1Fiscal estimates reflect company fiscal year-end.
* Data reflect current quarter, not actual year.
Note: Boldface type indicates analysts' top stock picks.

Ju
ne 2
016
Ind
ustry
Valu
atio
n T
ab
les
55
Energy Oil & Gas E&P, Canada/International David Phung (403) 476-6023
Target Fiscal Annual EPS P/E vs. % 5 Yr. Indicated Mkt
05/31 Price 52-Wk Year Estimate1 ABS P/E S&P 500 Total Returns Growth Dividend Value
Oil & Gas Exploration & Production Tkr Rating Price 12 m Range End FYA FY1 FY2 FY1 FY2 FY1 FY2 1 Mon. 3 Mons. 12 Mons. EPS Div Rate Yld (Mil.)
Advantage Oil & Gas(C$) AAV N 7.71 7.50 8-6 12/15 0.13 0.10 0.23 78.3 33.8 424 222 9.05 11.10 2.39 1 0.00 0.0 1,422
Bankers Petroleum Ltd.(C$) BNK N [V] 2.05 2.20 3-1 12/15 -0.01 -0.08 -0.03 NM NM NM NM 6.77 88.07 -32.79 0 0 0.0 410
Bellatrix Exploration Ltd(C$) BXE N [V] 1.25 1.50 4-1 12/15 -2.31 -0.19 -0.07 NM NM NM NM -9.42 -33.51 -65.37 0.00 0.0 240
Birchcliff Energy(C$) BIR N [V] 5.74 5.00 8-3 12/15 -0.08 -0.38 0.14 NM 39.6 NM 260 13.66 12.33 -27.06 0 0 0.0 874
Bonavista Energy Corporation(C$) BNP N [V] 3.29 2.25 8-1 12/15 -3.45 -0.15 -0.22 NM NM NM NM 8.22 6.82 -57.44 0 0 0.03* 0.01* 705
Crew Energy Inc(C$) CR N [V] 5.51 5.25 6-3 12/15 -0.40 -0.51 -0.35 NM NM NM NM 10.42 50.96 -5.00 0 0.00 0.0 786
Gran Tierra GTE N [V] 2.98 2.50 3-2 12/15 -0.94 -0.66 -0.39 NM NM NM NM 3.47 7.58 2.05 0 0.0 858
Kelt Exploration Ltd(C$) KEL N [V] 4.71 4.50 9-3 12/15 -0.91 -0.56 -0.26 NM NM NM NM 4.90 16.58 -45.23 0 0.0 820
NuVista Energy(C$) NVA O [V] 6.69 6.25 8-3 12/15 -1.16 -0.27 -0.28 NM NM NM NM 17.16 38.22 -12.55 0 0.00 0.0 1,026
Painted Pony Petroleum Ltd(C$) PPY N [V] 7.26 5.25 9-3 12/15 -0.05 -0.43 -0.41 NM NM NM NM 26.04 67.28 -12.53 0 0 0.0 726
Paramount Resources Ltd(C$) POU U [V] 8.91 5.50 33-3 12/15 -8.52 -1.96 -1.49 NM NM NM NM 4.95 14.67 -72.16 0 0 0.0 947
Parex Resources Inc.(C$) PXT O [V] 13.49 13.00 14-7 12/15 -0.30 -0.97 -0.52 NM NM NM NM 9.41 30.09 33.30 0 0 0.0 1,568
Peyto Exploration & Development Corp.(C$)
PEY N 34.38 29.50 34-22 12/15 0.87 0.48 1.12 71.9 30.6 390 201 8.66 22.26 1.63 0 0 0.33* 0.01* 5,660
Seven Generations Energy Ltd.(C$) VII O [V] 26.40 26.00 26-11 12/15 -0.75 0.20 0.47 135.0 56.0 732 367 22.00 53.31 54.93 0 0.0 7,338
Tourmaline Oil Corp(C$) TOU O 31.38 32.00 41-21 12/15 0.37 -0.95 0.48 NM 65.5 NM 430 10.65 18.64 -23.01 0 0 0.0 7,320
TransGlobe Energy Corp.(C$) TGL N [V] 2.22 2.00 5-2 12/15 -1.44 -0.50 -0.18 NM NM NM NM -9.02 2.30 -56.13 0 0.025 0.0 123
Trilogy Energy Corp(C$) TET U [V] 4.88 3.50 7-2 12/15 -1.09 -0.85 -0.36 NM NM NM NM -7.05 50.15 -32.97 -1 0 0.0 514
O=OUTPERFORM N=NEUTRAL U=UNDERPERFORM R=RESTRICTED [V]=VOLATILE
1Fiscal estimates reflect company fiscal year-end.
* Data reflect current quarter, not actual year.
Note: Boldface type indicates analyst’s top stock pick.
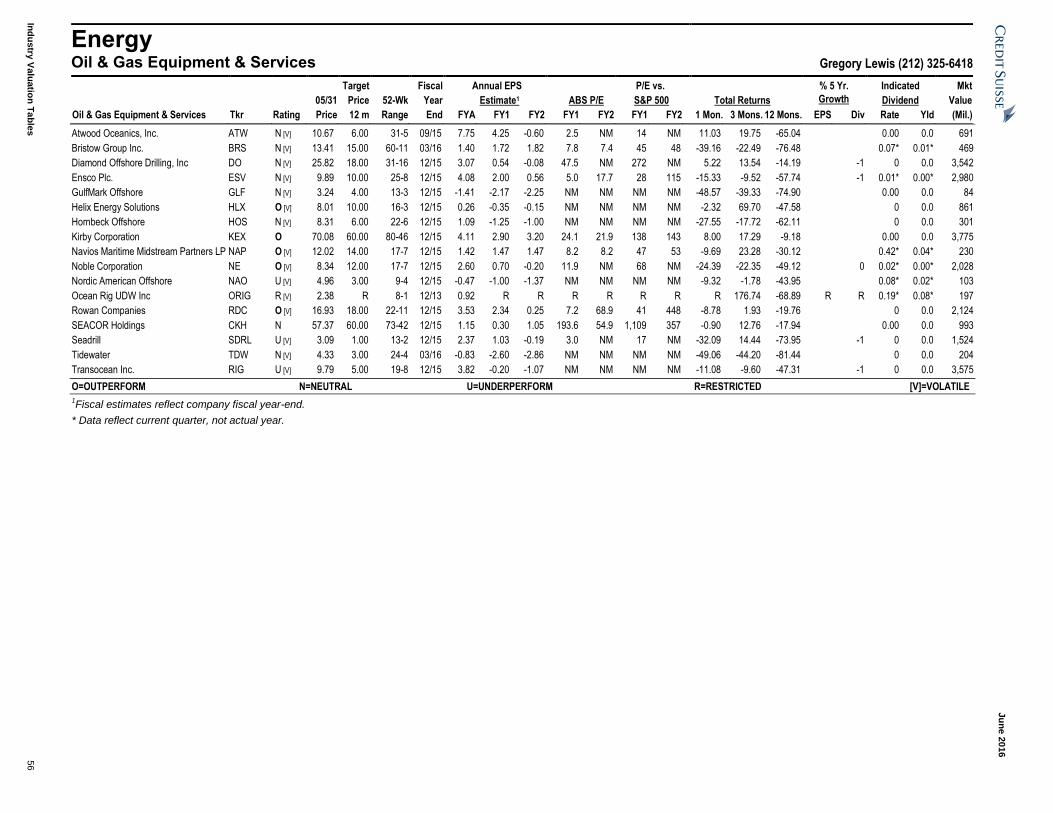
Ju
ne 2
016
Ind
ustry
Valu
atio
n T
ab
les
56
Energy Oil & Gas Equipment & Services Gregory Lewis (212) 325-6418
Target Fiscal Annual EPS P/E vs. % 5 Yr. Indicated Mkt
05/31 Price 52-Wk Year Estimate1 ABS P/E S&P 500 Total Returns Growth Dividend Value
Oil & Gas Equipment & Services Tkr Rating Price 12 m Range End FYA FY1 FY2 FY1 FY2 FY1 FY2 1 Mon. 3 Mons. 12 Mons. EPS Div Rate Yld (Mil.)
Atwood Oceanics, Inc. ATW N [V] 10.67 6.00 31-5 09/15 7.75 4.25 -0.60 2.5 NM 14 NM 11.03 19.75 -65.04 0.00 0.0 691
Bristow Group Inc. BRS N [V] 13.41 15.00 60-11 03/16 1.40 1.72 1.82 7.8 7.4 45 48 -39.16 -22.49 -76.48 0.07* 0.01* 469
Diamond Offshore Drilling, Inc DO N [V] 25.82 18.00 31-16 12/15 3.07 0.54 -0.08 47.5 NM 272 NM 5.22 13.54 -14.19 -1 0 0.0 3,542
Ensco Plc. ESV N [V] 9.89 10.00 25-8 12/15 4.08 2.00 0.56 5.0 17.7 28 115 -15.33 -9.52 -57.74 -1 0.01* 0.00* 2,980
GulfMark Offshore GLF N [V] 3.24 4.00 13-3 12/15 -1.41 -2.17 -2.25 NM NM NM NM -48.57 -39.33 -74.90 0.00 0.0 84
Helix Energy Solutions HLX O [V] 8.01 10.00 16-3 12/15 0.26 -0.35 -0.15 NM NM NM NM -2.32 69.70 -47.58 0 0.0 861
Hornbeck Offshore HOS N [V] 8.31 6.00 22-6 12/15 1.09 -1.25 -1.00 NM NM NM NM -27.55 -17.72 -62.11 0 0.0 301
Kirby Corporation KEX O 70.08 60.00 80-46 12/15 4.11 2.90 3.20 24.1 21.9 138 143 8.00 17.29 -9.18 0.00 0.0 3,775
Navios Maritime Midstream Partners LP NAP O [V] 12.02 14.00 17-7 12/15 1.42 1.47 1.47 8.2 8.2 47 53 -9.69 23.28 -30.12 0.42* 0.04* 230
Noble Corporation NE O [V] 8.34 12.00 17-7 12/15 2.60 0.70 -0.20 11.9 NM 68 NM -24.39 -22.35 -49.12 0 0.02* 0.00* 2,028
Nordic American Offshore NAO U [V] 4.96 3.00 9-4 12/15 -0.47 -1.00 -1.37 NM NM NM NM -9.32 -1.78 -43.95 0.08* 0.02* 103
Ocean Rig UDW Inc ORIG R [V] 2.38 R 8-1 12/13 0.92 R R R R R R R 176.74 -68.89 R R 0.19* 0.08* 197
Rowan Companies RDC O [V] 16.93 18.00 22-11 12/15 3.53 2.34 0.25 7.2 68.9 41 448 -8.78 1.93 -19.76 0 0.0 2,124
SEACOR Holdings CKH N 57.37 60.00 73-42 12/15 1.15 0.30 1.05 193.6 54.9 1,109 357 -0.90 12.76 -17.94 0.00 0.0 993
Seadrill SDRL U [V] 3.09 1.00 13-2 12/15 2.37 1.03 -0.19 3.0 NM 17 NM -32.09 14.44 -73.95 -1 0 0.0 1,524
Tidewater TDW N [V] 4.33 3.00 24-4 03/16 -0.83 -2.60 -2.86 NM NM NM NM -49.06 -44.20 -81.44 0 0.0 204
Transocean Inc. RIG U [V] 9.79 5.00 19-8 12/15 3.82 -0.20 -1.07 NM NM NM NM -11.08 -9.60 -47.31 -1 0 0.0 3,575
O=OUTPERFORM N=NEUTRAL U=UNDERPERFORM R=RESTRICTED [V]=VOLATILE
1Fiscal estimates reflect company fiscal year-end.
* Data reflect current quarter, not actual year.

Ju
ne 2
016
Ind
ustry
Valu
atio
n T
ab
les
57
Energy Oil & Gas Exploration & Production Mark Lear (212) 538-0239
Target Fiscal Annual EPS P/E vs. % 5 Yr. Indicated Mkt
05/31 Price 52-Wk Year Estimate1 ABS P/E S&P 500 Total Returns Growth Dividend Value
Oil & Gas Exploration & Production Tkr Rating Price 12 m Range End FYA FY1 FY2 FY1 FY2 FY1 FY2 1 Mon. 3 Mons. 12 Mons. EPS Div Rate Yld (Mil.)
Antero Resources Corporation AR O [V] 29.03 35.00 40-19 12/15 0.57 0.45 0.34 64.9 85.9 372 559 7.12 21.52 -26.56 0 0.00 0.0 8,053
Bonanza Creek Energy Inc. BCEI N [V] 2.63 2.00 21-1 12/15 -0.45 -1.62 -0.71 NM NM NM NM -24.43 77.70 -87.11 -1 * * 131
Callon Petroleum Company CPE O [V] 11.39 14.00 12-5 12/15 0.15 0.17 0.49 66.7 23.2 382 151 5.17 66.52 45.84 1 0 0.0 1,383
Carrizo Oil & Gas Inc. CRZO O [V] 38.50 38.00 53-18 12/15 1.07 0.40 0.87 95.5 44.4 547 289 8.94 50.68 -23.06 0 0 0.0 2,263
Chesapeake Energy Corp. CHK N [V] 4.29 4.00 14-2 12/15 -0.20 -0.29 0.48 NM 8.9 NM 58 -34.90 0.47 -69.05 0 0 0.0 2,937
Comstock Resources, Inc. CRK U [V] 0.66 0.70 4-1 12/15 -4.15 -3.04 -2.13 NM NM NM NM -13.17 -4.35 -80.81 0 0.00 0.0 40
Concho Resources, Inc. CXO O [V] 121.34 130.00 126-73 12/15 0.97 -0.63 -1.16 NM NM NM NM 3.66 24.80 0.90 0 0.0 15,962
Denbury Resources DNR U [V] 4.01 1.00 7-1 12/15 0.37 -0.31 -0.04 NM NM NM NM 4.16 88.26 -42.96 0.00 0.0 1,406
Diamondback Energy, Inc. FANG O 90.95 99.00 93-58 12/15 1.78 0.13 1.85 722.2 49.2 4140 321 3.81 25.43 15.18 0 0 0.0 6,521
Emerald Oil Inc EOX R [V] 1.37 R 6-1 12/14 2.82 R R R R R R #N/A 39.80 -76.34 R R 0 0.0 12
Energen Corporation EGN O [V] 47.62 48.00 75-23 12/15 0.81 -1.60 -0.55 NM NM NM NM 10.46 57.68 -31.96 0 -1 0 0.0 4,622
EOG Resources EOG N 81.36 79.00 91-60 12/15 0.06 -2.75 -0.39 NM NM NM NM -1.72 17.49 -8.34 0 0.0 44,770
EP Energy Corp. EPE N [V] 5.65 4.00 14-2 12/15 0.78 1.21 -0.33 4.7 NM 27 NM 19.20 90.88 -55.96 0 0.0 1,428
Gulfport Energy GPOR O [V] 30.74 39.00 45-20 12/15 -0.16 0.34 1.20 91.7 25.6 526 167 2.40 21.65 -29.61 0 0.00 0.0 3,853
Laredo Petroleum LPI N [V] 12.11 8.00 15-4 12/15 0.21 0.36 0.17 34.0 73.3 195 477 -0.08 83.21 -14.48 0 0 0.0 2,699
Newfield Exploration NFX O [V] 40.77 43.00 41-22 12/15 1.02 0.01 0.82 4373.2 49.4 25068 322 9.69 39.81 9.22 0 * * 8,092
Noble Energy NBL O 35.75 42.00 47-26 12/15 0.53 -1.67 -0.97 NM NM NM NM -1.89 12.17 -17.49 0 0.0 15,501
OASIS Petroleum OAS N [V] 10.04 10.00 17-4 12/15 0.78 -0.76 -0.65 NM NM NM NM 7.96 50.07 -40.20 0 0.0 1,812
Parsley Energy PE O [V] 26.07 28.00 26-14 12/15 -0.18 0.05 0.32 519.6 80.9 2,978 526 9.86 40.69 50.17 0.00 0.0 5,358
PDC Energy PDCE O 58.05 81.00 65-42 12/15 1.43 -0.58 -0.91 NM NM NM NM -9.64 13.53 -1.88 0 0.00 0.0 2,689
Pioneer Natural Resources PXD O 160.32 183.00 169-107 12/15 -0.12 -1.33 0.08 NM 2068.5 NM 13465 -3.19 24.99 7.04 0 * * 26,221
Range Resources RRC R [V] 42.59 R 56-20 12/14 1.58 R R R R R R R 38.59 -22.52 R R 0 0.0 7,229
Rex Energy Corp. REXX U [V] 0.74 0.50 6-1 12/15 -0.78 -1.19 -0.87 NM NM NM NM -26.72 -35.08 -84.77 0 0.0 54
Sanchez Energy Corp. SN O [V] 7.84 10.00 11-2 12/15 -1.83 -0.52 -1.09 NM NM NM NM -11.21 67.88 -20.00 * * 511
Southwestern Energy Co. SWN N [V] 13.67 8.00 25-5 12/15 0.19 -0.62 0.38 NM 36.4 NM 237 6.80 86.24 -46.33 0 0.0 5,368
Whiting Petroleum Corp. WLL N [V] 12.35 13.00 36-4 12/15 -0.79 -2.52 -1.22 NM NM NM NM 14.46 95.72 -61.98 0 0.0 2,592
O=OUTPERFORM N=NEUTRAL U=UNDERPERFORM R=RESTRICTED [V]=VOLATILE
1Fiscal estimates reflect company fiscal year-end.
* Data reflect current quarter, not actual year.
Note: Boldface type indicates analyst’s top stock pick.

Ju
ne 2
016
Ind
ustry
Valu
atio
n T
ab
les
58
Energy Oil & Gas, Canada Jason Frew (403) 476-6022
Target Fiscal Annual EPS P/E vs. % 5 Yr. Indicated Mkt
05/31 Price 52-Wk Year Estimate1 ABS P/E S&P 500 Total Returns Growth Dividend Value
Integrated Oil & Gas Tkr Rating Price 12 m Range End FYA FY1 FY2 FY1 FY2 FY1 FY2 1 Mon. 3 Mons. 12 Mons. EPS Div Rate Yld (Mil.)
Husky Energy Inc.(C$) HSE N 15.14 19.00 25-12 12/15 0.17 -0.90 0.41 NM 36.8 NM 241 -0.33 -3.26 -37.77 0 0 * * 15,223
Imperial Oil Ltd(C$) IMO N 41.79 44.00 50-38 12/15 1.71 0.12 1.83 346.1 22.8 1876 150 3.21 -4.44 -15.51 0 0 * * 35,421
Suncor Energy(C$) SU O 36.22 41.00 40-28 12/15 1.01 -0.57 1.30 NM 28.0 NM 183 1.80 8.41 0.08 0 0 * * 57,303
Oil & Gas Exploration & Production
ARC Resources Ltd.(C$) ARX O 21.57 22.00 23-15 12/15 -0.66 -0.15 0.31 NM 70.0 NM 459 3.50 15.72 -3.27 0 0 * * 7,557
Baytex Energy Corp.(C$) BTE N [V] 6.39 5.50 22-2 12/15 -0.59 -1.34 -0.81 NM NM NM NM 1.91 44.90 -69.77 -1 * * 1,346
Canadian Natural Resources Limited(C$)
CNQ O 38.97 42.00 39-23 12/15 0.24 -2.31 0.60 NM 65.2 NM 428 6.30 18.63 2.34 0 0 * * 42,765
Cenovus Energy Inc.(C$) CVE O 19.77 20.00 22-14 12/15 -0.49 -0.99 -0.29 NM NM NM NM 2.54 20.99 -4.12 0 0 * * 16,472
Crescent Point Energy Corp(C$) CPG N [V] 22.20 22.00 28-12 12/15 -1.92 -0.64 -0.17 NM NM NM NM 7.82 24.86 -20.80 0 0 * * 11,241
Encana Corp. ECA R [V] 7.96 R 13-3 12/14 1.35 R R R R R R R 61.46 -35.55 R R 0.07* 0.01* 6,765
Enerplus Corporation(C$) ERF O [V] 7.15 9.00 12-3 12/15 0.03 -0.57 -0.16 NM NM NM NM 7.52 50.53 -39.71 0 0 * * 1,719
Lightstream Resources Ltd(C$) LTS U [V] 0.17 0.25 1-0 12/15 -0.52 -1.15 -0.80 NM NM NM NM -28.26 -62.92 -84.43 -1 * * 33
MEG Energy CORP(C$) MEG R [V] 6.06 R 21-4 12/14 -0.47 R R R R R R R 3.77 -68.97 R R 0 0.0 1,363
Pengrowth Energy Corp.(C$) PGF U [V] 2.27 1.25 3-1 12/15 -0.01 -0.07 -0.18 NM NM NM NM 14.65 99.12 -30.15 0 -1 * * 1,243
Penn West Petroleum Ltd.(C$) PWT U [V] 0.86 0.50 3-1 12/15 -2.97 -0.70 -0.40 NM NM NM NM -33.85 -43.42 -65.87 0 -1 * * 432
Vermilion Energy Inc.(C$) VET N 43.39 38.00 56-32 12/15 0.66 -0.73 0.39 NM 112.6 NM 739 3.78 8.39 -17.84 0 0 * * 4,922
O=OUTPERFORM N=NEUTRAL U=UNDERPERFORM R=RESTRICTED [V]=VOLATILE
1Fiscal estimates reflect company fiscal year-end.
* Data reflect current quarter, not actual year.
Note: Boldface type indicates analyst's top stock picks.

Ju
ne 2
016
Ind
ustry
Valu
atio
n T
ab
les
59
Energy Oilfield Equipment & Services James Wicklund (214) 979-4111
Target Fiscal Annual EPS P/E vs. % 5 Yr. Indicated Mkt
05/31 Price 52-Wk Year Estimate1 ABS P/E S&P 500 Total Returns Growth Dividend Value
Master Limited Partnerships Tkr Rating Price 12 m Range End FYA FY1 FY2 FY1 FY2 FY1 FY2 1 Mon. 3 Mons. 12 Mons. EPS Div Rate Yld (Mil.)
Hi-Crush Partners, LP HCLP O [V] 8.72 12.00 32-4 12/15 2.13 -0.73 0.70 NM 12.4 NM 81 27.30 85.14 -70.20 0 0.00 0.0 376
Oil & Gas Equipment & Services
Baker Hughes Inc.** BHI O 46.38 56.00 65-39 12/15 -0.48 -1.57 -0.02 NM NM NM NM -2.15 -0.37 -27.89 0 0.00 0.0 20,310
C&J Energy Services CJES N [V] 0.53 1.00 15-0 12/15 -1.63 -2.70 -1.32 NM NM NM NM -60.90 -67.37 -96.38 0 0.0 64
FMC Technologies, Inc. FTI N 27.23 26.00 43-23 12/15 2.23 1.14 1.11 23.9 24.6 137 160 -9.11 2.95 -34.64 0 0 0.0 6,176
Forum Energy Technologies, Inc. FET N [V] 16.78 16.00 22-9 12/15 0.41 -0.92 -0.14 NM NM NM NM -2.04 31.09 -18.19 0 0 0.0 1,531
Frank's International FI N 16.01 16.00 21-12 12/15 0.60 0.10 0.28 156.7 57.8 898 376 -2.20 7.02 -20.98 0 0 0.0 2,488
Halliburton** HAL O 42.18 49.00 46-28 12/15 1.56 -0.11 1.54 NM 27.5 NM 179 0.31 23.44 -6.76 0 0.00 0.0 36,244
Helmerich & Payne, Inc. HP U 61.15 48.00 75-43 09/15 2.98 -1.10 -1.28 NM NM NM NM -3.01 3.68 -15.08 0 0.69* 0.01* 6,607
Nabors Industries, Ltd. NBR N [V] 9.40 9.00 15-6 12/15 -0.29 -1.98 -1.64 NM NM NM NM 1.29 12.44 -34.95 0.00 0.0 2,650
National Oilwell Varco NOV U 32.95 19.00 50-26 12/15 2.74 -1.06 -0.83 NM NM NM NM -5.23 3.75 -32.86 -1 0 0.0 12,424
Newpark Resources, Inc. NR O [V] 4.59 6.00 9-3 12/15 -0.20 -0.48 -0.05 NM NM NM NM -7.83 7.75 -47.24 0 0 0.0 386
Oceaneering Intl, Inc. OII N 33.06 27.00 51-26 12/15 2.74 1.01 0.21 32.6 160.4 187 1044 -9.10 12.76 -35.20 -1 0.27* 0.01* 3,242
Oil States International OIS N 32.86 33.00 43-22 12/15 0.85 -1.25 -0.47 NM NM NM NM -4.23 14.53 -19.10 0 0 0.0 1,688
Patterson-UTI Energy, Inc. PTEN U [V] 18.61 15.00 21-11 12/15 -1.00 -2.39 -2.07 NM NM NM NM -3.22 9.73 -6.95 0.00 0.0 2,743
Precision Drilling Corporation PDS U [V] 4.71 3.00 7-3 12/15 -0.37 -0.69 -0.58 NM NM NM NM -6.18 14.88 -27.76 0 0.0 1,803
RPC, Inc. RES N [V] 14.75 13.00 15-9 12/15 -0.47 -0.84 -0.32 NM NM NM NM 0.89 1.44 3.65 0 -1 0 0.0 3,210
Schlumberger SLB O 76.30 87.00 92-61 12/15 3.37 1.04 2.46 73.0 31.0 419 202 -3.90 1.94 -15.83 0 0 0.43* 0.01* 106,088
Superior Energy Services, Inc. SPN N [V] 17.24 16.00 24-9 12/15 -1.19 -2.09 -0.89 NM NM NM NM 2.07 33.44 -25.08 0 0 0.0 2,610
Tetra Technologies, Inc. TTI O [V] 5.47 9.00 9-5 12/15 0.32 -0.79 -0.06 NM NM NM NM -23.39 -7.45 -12.76 0 0.00 0.0 440
U.S. Silica SLCA O [V] 28.53 32.00 33-14 12/15 0.10 -0.66 0.12 NM 239.4 NM 1559 14.39 35.09 -4.49 0 0 0.06* 0.00* 1,812
Weatherford International, Inc. WFT O [V] 5.61 7.00 14-5 12/15 -0.33 -0.98 -0.26 NM NM NM NM -31.59 -23.36 -59.78 0 0.00 0.0 5,025
O=OUTPERFORM N=NEUTRAL U=UNDERPERFORM R=RESTRICTED [V]=VOLATILE
1Fiscal estimates reflect company fiscal year-end.
* Data reflect current quarter, not actual year.
Note: Boldface type indicates analyst's top stock picks.
**Denotes analyst's new top stock picks.

Ju
ne 2
016
Ind
ustry
Valu
atio
n T
ab
les
60
Energy Pipelines & Utilities
Andrew M. Kuske (416) 352-4561
Paul Tan (416) 352-4593
Target Fiscal Annual EPS P/E vs. % 5 Yr. Indicated Mkt
05/31 Price 52-Wk Year Estimate1 ABS P/E S&P 500 Total Returns Growth Dividend Value
Electric Utilities Tkr Rating Price 12 m Range End FYA FY1 FY2 FY1 FY2 FY1 FY2 1 Mon. 3 Mons. 12 Mons. EPS Div Rate Yld (Mil.)
Emera Inc.(C$) EMA O 46.21 54.00 49-39 12/15 2.25 2.53 2.77 18.3 16.7 99 109 1.61 0.70 9.79 0.48* 0.01* 6,847
Hydro One Limited(C$) H N [V] 24.44 24.00 24-22 12/15 1.16 1.16 1.21 21.1 20.2 114 133 3.52 3.69 0.21* 0.01* 14,542
Multi Utilities
Brookfield Infrastructure Partners LP BIP R 42.76 R 45-32 12/14 0.53 R R R R R R R 14.45 -0.74 R R 0.53* 0.01* 6,934
Canadian Utilities Limited(C$) CU N 36.25 38.00 37-29 12/15 1.82 2.09 2.33 17.3 15.6 94 102 -0.74 5.62 -1.12 0.33* 0.01* 9,684
Fortis Inc.(C$) FTS N 41.02 42.00 41-34 12/15 2.07 2.18 2.46 18.8 16.7 102 110 1.36 5.53 7.10 0.38* 0.01* 11,613
Pipelines
Enbridge Inc.(C$) ENB N 52.28 54.00 61-41 12/15 2.17 2.36 2.56 22.2 20.4 120 134 1.00 10.48 -13.56 0.53* 0.01* 48,574
Enbridge Income Fund Holdings(C$) ENF N 31.02 32.00 38-25 12/15 1.42 1.81 1.93 17.2 16.0 93 105 7.15 8.39 -19.16 0.47* 0.02* 3,813
Gibson Energy Inc.(C$) GEI N 15.36 16.00 25-13 12/15 -2.23 0.18 0.23 83.3 66.9 452 439 -18.34 -14.09 -36.40 0.33* 0.02* 1,943
Keyera Corp.(C$) KEY N 39.12 42.00 44-34 12/15 1.19 1.44 1.41 27.2 27.8 148 183 -1.88 1.80 -6.05 0.38* 0.01* 7,145
Pembina Pipeline Corporation(C$) PPL O 38.47 40.00 42-27 12/15 1.01 1.03 1.49 37.5 25.8 203 170 2.26 14.84 -4.11 0.46* 0.01* 14,505
TransCanada Corp.(C$) TRP O 54.34 64.00 55-41 12/15 2.48 2.56 2.88 21.2 18.8 115 124 4.00 10.25 1.49 0 0 0.57* 0.01* 38,174
Power
Brookfield Renewable Energy Partners(C$)
BEP.UN N 37.93 40.00 39-31 12/15 0.38 0.37 0.64 101.7 59.2 422 298 4.00 0.64 -0.71 0 0 0.45* 0.02* 4,155
Capital Power Corporation(C$) CPX U 19.29 18.00 24-15 12/15 0.99 0.88 0.89 21.9 21.6 119 142 7.71 7.17 -19.42 0.37* 0.02* 1,854
TransAlta Corporation(C$) TA U 6.30 6.00 11-4 12/15 -0.17 0.08 0.10 80.6 62.2 437 408 -4.55 4.83 -41.07 0.04* 0.01* 1,814
O=OUTPERFORM N=NEUTRAL U=UNDERPERFORM R=RESTRICTED [V]=VOLATILE
1Fiscal estimates reflect company fiscal year-end.
* Data reflect current quarter, not actual year.

Ju
ne 2
016
Ind
ustry
Valu
atio
n T
ab
les
61
Financials Asset Managers Craig Siegenthaler (212) 325-3104
Target Fiscal Annual EPS P/E vs. % 5 Yr. Indicated Mkt
05/31 Price 52-Wk Year Estimate1 ABS P/E S&P 500 Total Returns Growth Dividend Value
Asset Managers Tkr Rating Price 12 m Range End FYA FY1 FY2 FY1 FY2 FY1 FY2 1 Mon. 3 Mons. 12 Mons. EPS Div Rate Yld (Mil.)
Affiliated Managers Group AMG O 173.52 238.00 228-118 12/15 12.54 13.57 15.59 12.8 11.1 73 72 0.97 15.67 -22.22 0 0.00 0.0 9,337
AllianceBernstein AB N 23.51 28.00 32-17 12/15 1.87 1.75 1.93 13.4 12.2 77 79 -1.38 10.53 -26.14 0 0 0.40* 0.02* 2,313
Ares Management ARES R 14.10 R 21-11 12/15 0.87 R R R R R R #N/A 13.25 -28.61 R R 0.21* 0.01* 3,004
Artisan Partners APAM O 32.68 32.00 47-24 12/15 2.69 2.32 2.49 14.1 13.1 81 85 1.11 11.80 -25.24 0 0 0.60* 0.02* 2,434
BlackRock BLK O 363.85 426.00 367-290 12/15 19.60 19.81 23.09 18.4 15.8 105 103 0.65 12.60 -0.12 0 0 2.29* 0.01* 59,441
Calamos Investments CLMS U 7.69 6.00 13-7 12/15 0.18 0.05 0.11 170.7 71.6 979 466 -5.88 -10.06 -35.92 0 0 0.15* 0.02* 158
Eaton Vance EV N 36.36 32.00 41-27 10/15 2.29 2.09 2.33 17.4 15.6 100 101 4.84 17.18 -10.51 0 0 0.27* 0.01* 4,233
Federated Investors FII U 32.32 28.00 35-23 12/15 1.62 1.92 2.10 16.8 15.4 97 100 2.80 17.31 -7.47 0 0 0.22* 0.01* 3,361
Fifth Street Asset Management FSAM N [V] 4.39 2.00 10-1 12/15 0.73 0.51 0.50 8.5 8.7 49 57 21.61 31.04 -56.23 0 0.10* 0.02* 214
Fortress Investment Group FIG N 5.05 6.00 8-4 12/15 0.72 0.58 0.68 8.8 7.5 50 49 4.07 8.67 -34.33 0 0 0.09* 0.02* 1,949
Franklin Resources BEN U 37.35 33.00 51-31 09/15 3.31 2.75 2.75 13.6 13.6 78 88 -1.03 -1.40 -26.64 0 0 0.18* 0.00* 21,847
Invesco IVZ N 31.40 37.00 40-25 12/15 2.45 2.28 2.69 13.7 11.7 79 76 1.09 9.79 -21.24 0 0 0.28* 0.01* 13,102
Janus Capital Group JNS N 15.18 16.00 19-11 12/15 0.92 0.92 1.09 16.6 13.9 95 90 2.99 9.13 -17.41 0 0 0.11* 0.01* 2,803
Legg Mason LM O 34.50 46.00 55-25 03/16 -0.32 2.01 3.12 17.2 11.1 99 72 8.15 8.32 -35.55 0 0 0.22* 0.01* 3,636
Manning and Napier MN N [V] 9.42 8.00 12-6 12/15 0.92 0.71 0.69 13.3 13.6 76 89 10.05 35.54 -19.42 0 0 0.16* 0.02* 142
Medley Management Inc. MDLY N [V] 6.07 6.00 12-4 12/15 0.62 0.61 0.66 10.0 9.1 57 59 -5.01 6.49 -47.67 0 0.20* 0.03* 177
Och-Ziff Capital Management OZM N 4.03 4.00 13-3 12/15 0.50 -0.21 0.67 NM 6.0 NM 39 0.75 -11.82 -67.76 0 0 0.09* 0.02* 731
Old Mutual Asset Management OMAM O 15.18 18.00 20-10 12/15 1.24 1.21 1.35 12.6 11.3 72 73 10.08 27.89 -21.14 0 0.08* 0.01* 1,825
T. Rowe Price Group TROW N 77.06 69.00 81-65 12/15 4.60 4.44 4.77 17.3 16.2 99 105 1.81 6.52 -4.64 0 0 0.54* 0.01* 19,127
Virtus Investment Partners VRTS N 81.41 83.00 141-67 12/15 7.54 5.25 5.70 15.5 14.3 89 93 3.43 -18.20 -35.08 0 0.45* 0.01* 673
Waddell & Reed Financial WDR U 21.37 20.00 50-19 12/15 2.94 1.76 1.80 12.2 11.9 70 77 5.53 -16.33 -55.37 0 0 0.46* 0.02* 1,741
WisdomTree Investments WETF O [V] 12.40 17.00 26-10 12/15 0.58 0.31 0.37 40.3 33.6 231 219 13.55 -6.20 -40.83 0 0.08* 0.01* 1,692
Brokerage
Apollo Global Management LLC APO N 16.42 21.00 23-13 12/15 0.95 1.01 2.37 16.2 6.9 93 45 -5.20 -0.91 -26.30 0 0 0.34* 0.02* 6,791
Blackstone Group BX O 26.19 36.00 43-23 12/15 1.81 2.36 3.03 11.1 8.6 64 56 -5.25 -8.23 -38.63 0 0 0.42* 0.02* 31,229
Oaktree Capital Group, LLC OAK N 45.82 50.00 55-40 12/15 1.61 2.42 3.54 18.9 13.0 108 84 -4.26 -2.16 -16.08 0 0 0.52* 0.01* 7,105
The Carlyle Group L.P. CG N 16.06 21.00 31-12 12/15 1.16 1.49 2.38 10.8 6.7 62 44 -5.97 -3.43 -48.14 0 0 0.35* 0.02* 5,206
Diversified Financial Services
KKR and Co LP KKR R 13.51 R 25-11 12/15 1.21 R R R R R R R 4.08 -40.93 R R * * 10,907
O=OUTPERFORM N=NEUTRAL U=UNDERPERFORM R=RESTRICTED [V]=VOLATILE
1Fiscal estimates reflect company fiscal year-end.
* Data reflect current quarter, not actual year.
Note: Boldface type indicates analyst's top stock pick.

Ju
ne 2
016
Ind
ustry
Valu
atio
n T
ab
les
62
Financials Canadian Financials Kevin R. Choquette (416) 352-4585
Target Fiscal Annual EPS P/E vs. % 5 Yr. Indicated Mkt
05/31 Price 52-Wk Year Estimate1 ABS P/E S&P 500 Total Returns Growth Dividend Value
Life Insurance Tkr Rating Price 12 m Range End FYA FY1 FY2 FY1 FY2 FY1 FY2 1 Mon. 3 Mons. 12 Mons. EPS Div Rate Yld (Mil.)
Great-West Lifeco Inc.(C$) GWO U 35.34 39.00 38-32 12/15 2.77 2.85 3.10 12.4 11.4 67 75 -4.51 2.82 -2.35 1.38* 0.04* 35,095
Industrial-Alliance Insurance Company(C$)
IAG N 42.59 46.00 46-36 12/15 3.57 4.30 4.55 9.9 9.4 54 61 2.40 15.61 0.61 1.28* 0.03* 4,367
Manulife Financial Corporation(C$) MFC O 19.52 22.00 24-16 12/15 1.68 1.90 2.15 10.3 9.1 56 60 6.26 6.14 -14.91 0.74* 0.04* 38,500
Sun Life Financial(C$) SLF O 45.42 50.00 46-37 12/15 3.76 3.85 4.20 11.8 10.8 64 71 5.58 11.84 13.92 1.62* 0.04* 27,827
Multinational Banks
Bank of Montreal(C$) BMO N 82.30 95.00 84-66 10/15 7.00 7.10 7.50 11.6 11.0 63 72 0.78 7.81 8.36 0.86* 0.01* 52,965
Bank of Nova Scotia(C$) BNS N 64.14 74.00 67-52 10/15 5.72 5.85 6.20 11.0 10.3 59 68 -1.58 9.42 -2.64 0.72* 0.01* 77,143
Canada Imperial Bank of Commerce(C$)
CM U 101.75 112.00 103-83 10/15 9.45 9.75 10.00 10.4 10.2 57 67 1.25 9.77 7.35 1.21* 0.01* 40,156
National Bank of Canada(C$) NA N 43.52 50.00 50-36 10/15 4.70 4.60 4.80 9.5 9.1 51 59 -2.25 12.54 -10.62 0.54* 0.01* 14,685
Royal Bank of Canada(C$) RY O 78.83 96.00 81-65 10/15 6.74 6.80 7.30 11.6 10.8 63 71 1.44 11.42 NA 0.81* 0.01* 117,316
Toronto Dominion Bank(C$) TD O 57.11 68.00 58-49 10/15 4.61 4.85 5.15 11.8 11.1 64 73 2.51 6.81 5.37 0.55* 0.01* 105,868
O=OUTPERFORM N=NEUTRAL U=UNDERPERFORM R=RESTRICTED [V]=VOLATILE
1Fiscal estimates reflect company fiscal year-end.
* Data reflect current quarter, not actual year.

Ju
ne 2
016
Ind
ustry
Valu
atio
n T
ab
les
63
Financials Capital Markets
Ashley Serrao (212) 538-8424 Christian Bolu (212) 538-9805
Susan Roth Katzke (212) 325-1237
Target Fiscal Annual EPS P/E vs. % 5 Yr. Indicated Mkt
05/31 Price 52-Wk Year Estimate1 ABS P/E S&P 500 Total Returns Growth Dividend Value
Brokerage Tkr Rating Price 12 m Range End FYA FY1 FY2 FY1 FY2 FY1 FY2 1 Mon. 3 Mons. 12 Mons. EPS Div Rate Yld (Mil.)
CBOE Holdings Inc. CBOE U 63.65 60.00 72-57 12/15 2.39 2.40 2.60 26.6 24.5 152 159 0.92 -0.20 9.63 0 0 0.24* 0.00* 5,181
CME Group Inc. CME N 97.89 100.00 99-82 12/15 3.86 4.30 4.60 22.8 21.3 130 139 4.56 3.76 7.28 0 0 3.50* 0.04* 33,149
E*TRADE Financial ETFC O 27.89 30.00 31-20 12/15 0.60 1.50 1.60 18.6 17.4 107 113 8.44 10.50 -5.41 0 0 0.0 7,774
Goldman Sachs Group, Inc. GS O 159.48 180.00 218-141 12/15 12.14 14.30 16.95 11.2 9.4 64 61 -4.03 2.67 -23.26 0 0 0.65* 0.00* 66,247
Greenhill & Co. Inc. GHL N 20.62 18.00 42-19 12/15 0.82 1.03 1.23 20.0 16.7 115 109 -5.72 -13.47 -46.55 0 NA 0.45* 0.02* 615
IntercontinentalExchange, Inc. ICE O 271.12 280.00 271-222 12/15 12.16 13.75 14.85 19.7 18.3 113 119 10.81 14.43 15.11 0 0 0.85* 0.00* 32,276
Lazard Ltd. LAZ O 35.18 44.00 57-30 12/15 3.61 3.05 3.40 11.6 10.3 66 67 -1.10 -5.63 -34.27 0 0 0.35* 0.01* 4,565
LPL Financial Holdings Inc LPLA O 27.89 28.00 48-17 12/15 1.74 1.80 2.00 15.5 13.9 89 91 7.43 32.31 -34.52 0 0 0.25* 0.01* 2,483
MarketAxess MKTX U 139.94 93.00 141-85 12/15 2.55 2.85 3.16 49.0 44.3 281 288 13.49 15.88 57.31 0 0 0.26* 0.00* 5,257
Morgan Stanley MS N 27.37 25.00 41-22 12/15 2.91 2.00 2.55 13.7 10.7 78 70 0.40 4.71 -29.06 0 0 0.15* 0.01* 53,016
NASDAQ Group Inc. NDAQ O 66.01 68.00 67-48 12/15 3.40 3.73 4.19 17.7 15.8 102 103 4.76 1.24 28.20 0 0 0.25* 0.00* 10,860
TD Ameritrade Holding Corp. AMTD N 32.67 36.00 39-26 09/15 1.49 1.53 1.65 21.3 19.7 122 129 8.90 5.25 -11.61 0 0 0.17* 0.01* 17,278
The Charles Schwab Corp SCHW O 30.58 32.00 35-22 12/15 1.03 1.25 1.50 24.4 20.4 140 133 6.22 12.80 -2.74 0 0 0.07* 0.00* 40,417
Diversified Financial Services
Evercore Partners Inc. EVR O 52.00 54.00 59-43 12/15 3.23 3.36 3.76 15.5 13.8 89 90 0.08 3.30 0.60 0 0.00 0.0 2,281
Investment Technology Group Inc. ITG O [V] 18.44 25.00 28-13 12/15 0.86 0.42 1.10 43.5 16.8 250 109 -6.30 -7.01 -32.97 0 0 0.0 612
Moelis & Company MC N 26.66 29.00 30-23 12/15 1.63 1.70 1.82 15.7 14.6 90 95 -7.66 1.87 -4.49 0 0.30* 0.01* 1,378
Raymond James Financial, Inc. RJF O 56.07 52.00 61-40 09/15 3.43 3.40 3.80 16.5 14.8 94 96 6.19 21.05 -3.46 0 0 0.20* 0.00* 7,936
Stifel Financial Corp SF U 37.78 27.00 60-27 12/15 2.46 2.27 2.35 16.7 16.1 96 105 13.90 20.90 -31.08 0 0.00 0.0 2,511
Virtu Financial Inc VIRT U 17.81 18.50 25-17 12/15 1.34 1.19 1.23 15.0 14.5 86 94 -16.15 -20.31 -18.71 0 0 0.24* 0.01* 2,471
Multinational Banks
Northern Trust NTRS N 74.10 71.00 79-55 12/15 3.90 4.25 4.75 17.4 15.6 100 102 3.12 15.01 -0.20 0 0 0.38* 0.01* 16,907
State Street Corp. STT N 63.06 65.00 81-52 12/15 4.89 4.71 5.42 13.4 11.6 77 76 0.24 8.63 -18.57 0 0 0.36* 0.01* 24,968
The Bank of New York Mellon Corp. BK N 42.06 42.00 45-33 12/15 2.86 3.14 3.52 13.4 11.9 77 78 3.16 11.59 -2.00 0 0 0.17* 0.00* 45,257
O=OUTPERFORM N=NEUTRAL U=UNDERPERFORM R=RESTRICTED [V]=VOLATILE
1Fiscal estimates reflect company fiscal year-end.
* Data reflect current quarter, not actual year.
Note: Boldface type indicates analysts' top stock picks.
Financials Diversified Financial Services Andrew M. Kuske (416) 352-4561
Target Fiscal Annual EPS P/E vs. % 5 Yr. Indicated Mkt
05/31 Price 52-Wk Year Estimate1 ABS P/E S&P 500 Total Returns Growth Dividend Value
Diversified Financial Services Tkr Rating Price 12 m Range End FYA FY1 FY2 FY1 FY2 FY1 FY2 1 Mon. 3 Mons. 12 Mons. EPS Div Rate Yld (Mil.)
Brookfield Asset Management BAM N 35.10 36.00 37-27 12/15 2.23 1.32 1.55 26.7 22.6 153 147 3.30 12.28 -0.79 0 0 0.18* 0.01* 34,643
O=OUTPERFORM N=NEUTRAL U=UNDERPERFORM R=RESTRICTED [V]=VOLATILE
1Fiscal estimates reflect company fiscal year-end.
* Data reflect current quarter, not actual year.

Ju
ne 2
016
Ind
ustry
Valu
atio
n T
ab
les
64
Financials Large-Cap Banks Susan Roth Katzke (212) 325-1237
Target Fiscal Annual EPS P/E vs. % 5 Yr. Indicated Mkt
05/31 Price 52-Wk Year Estimate1 ABS P/E S&P 500 Total Returns Growth Dividend Value
Large Cap Banks Tkr Rating Price 12 m Range End FYA FY1 FY2 FY1 FY2 FY1 FY2 1 Mon. 3 Mons. 12 Mons. EPS Div Rate Yld (Mil.)
Bank of America Corp. BAC O 14.79 18.00 18-11 12/15 1.31 1.30 1.55 11.4 9.5 65 62 0.14 9.56 -10.63 0 1 0.05* 0.00* 151,922
Citigroup Inc. C O 46.57 55.00 60-35 12/15 5.41 4.72 5.45 9.9 8.5 57 56 -0.24 8.73 -14.47 0 1 0.05* 0.00* 136,973
JPMorgan Chase & Co. JPM O 65.27 75.00 70-53 12/15 6.00 5.56 6.47 11.7 10.1 67 66 2.32 8.86 -1.23 0 0 0.44* 0.01* 239,007
PNC Financial Services Group PNC N 89.74 90.00 100-78 12/15 7.39 7.20 8.00 12.5 11.2 71 73 2.08 3.65 -5.16 0 0 0.51* 0.01* 44,809
SunTrust Banks Inc. STI U 43.82 40.00 45-31 12/15 3.58 3.45 3.75 12.7 11.7 73 76 4.01 19.89 4.38 0 0 0.24* 0.01* 21,959
U.S. Bancorp USB N 42.82 44.00 46-37 12/15 3.17 3.24 3.50 13.2 12.2 76 80 -0.35 5.03 -0.35 0 0 0.26* 0.01* 73,925
Wells Fargo & Company WFC O 50.72 58.00 59-45 12/15 4.12 4.05 4.30 12.5 11.8 72 77 0.26 1.91 -9.49 0 0 0.38* 0.01* 257,508
O=OUTPERFORM N=NEUTRAL U=UNDERPERFORM R=RESTRICTED [V]=VOLATILE
1Fiscal estimates reflect company fiscal year-end.
* Data reflect current quarter, not actual year.
Note: Boldface type indicates analyst's top stock picks.
Financials Mid-Cap Banks Jill Shea (212) 325-5801
Target Fiscal Annual EPS P/E vs. % 5 Yr. Indicated Mkt
05/31 Price 52-Wk Year Estimate1 ABS P/E S&P 500 Total Returns Growth Dividend Value
Mid Cap Banks Tkr Rating Price 12 m Range End FYA FY1 FY2 FY1 FY2 FY1 FY2 1 Mon. 3 Mons. 12 Mons. EPS Div Rate Yld (Mil.)
BB&T Corp. BBT O 36.37 42.00 42-30 12/15 2.75 2.90 3.30 12.5 11.0 72 72 2.71 6.13 -7.15 0 0 0.27* 0.01* 29,541
Citizens Financial Group, Inc. CFG N 23.55 25.00 28-18 12/15 1.58 1.80 2.10 13.1 11.2 75 73 2.12 9.84 -12.62 0 0.12* 0.01* 12,457
Comerica CMA N 47.10 37.00 53-31 12/15 2.85 2.38 3.00 19.8 15.7 114 102 6.22 26.58 -2.69 0 0 0.22* 0.00* 8,249
Fifth Third Bancorp FITB U 18.87 19.00 22-14 12/15 1.54 1.58 1.74 11.9 10.9 68 71 2.28 11.92 -5.96 0 0 0.14* 0.01* 14,487
Huntington Bancshares Incorporated HBAN N 10.45 11.00 12-8 12/15 0.85 0.87 0.97 12.0 10.8 69 70 2.55 8.85 -5.34 0 0 0.07* 0.01* 8,348
KeyCorp KEY O 12.82 16.00 16-10 12/15 1.10 1.12 1.35 11.5 9.5 66 62 2.89 11.77 -11.65 0 0 0.09* 0.01* 10,799
M&T Bank Corporation MTB N 119.50 130.00 133-101 12/15 7.63 8.40 9.25 14.2 12.9 82 84 0.46 8.78 -0.29 0 0 0.70* 0.01* 19,000
Regions Financial Corporation RF N 9.83 9.50 11-7 12/15 0.77 0.84 0.93 11.7 10.6 67 69 4.02 18.72 -1.50 0 0 0.06* 0.01* 12,452
Zions Bancorporation ZION O 28.02 30.00 32-20 12/15 1.63 1.75 2.15 16.0 13.1 92 85 1.89 18.93 -2.03 0 0 0.06* 0.00* 5,734
O=OUTPERFORM N=NEUTRAL U=UNDERPERFORM R=RESTRICTED [V]=VOLATILE
1Fiscal estimates reflect company fiscal year-end.
* Data reflect current quarter, not actual year.
Note: Boldface type indicates analyst's top stock picks.

Ju
ne 2
016
Ind
ustry
Valu
atio
n T
ab
les
65
Financials Mortgage REITs, Servicers, Insurers, and BDCs Douglas Harter (212) 538-5983
Target Fiscal Annual EPS P/E vs. % 5 Yr. Indicated Mkt
05/31 Price 52-Wk Year Estimate1 ABS P/E S&P 500 Total Returns Growth Dividend Value
Diversified Financial Services Tkr Rating Price 12 m Range End FYA FY1 FY2 FY1 FY2 FY1 FY2 1 Mon. 3 Mons. 12 Mons. EPS Div Rate Yld (Mil.)
Five Oaks Investment Company OAKS N 5.00 6.50 10-4 12/15 1.14 0.80 0.75 6.2 6.7 36 44 -16.94 -8.93 -50.30 0 0 0.18* 0.04* 73
MGIC Investment Corporation MTG N 7.05 8.00 12-6 12/15 1.07 0.77 0.90 9.2 7.9 53 51 -2.22 -6.87 -34.48 1 0 0.0 2,401
Newcastle Investment Corp NCT O 4.49 5.00 5-3 12/15 0.56 0.43 0.35 10.5 12.7 60 83 1.81 27.20 -12.48 0.12* 0.03* 299
Radian Group, Inc. RDN N 12.41 14.50 19-9 12/15 1.40 1.55 1.80 8.0 6.9 46 45 -3.57 5.35 -30.59 1 NA 0.00* 0.00* 2,659
Mortgage Finance
AG Mortgage Investment Trust MITT N 14.01 15.00 19-11 12/15 2.30 1.72 1.70 8.1 8.2 47 54 4.01 6.78 -26.65 0 0 0.48* 0.03* 395
Ares Commercial Real Estate Corp ACRE N 11.98 13.00 13-9 12/15 1.20 1.05 1.15 11.5 10.4 66 68 -0.50 18.85 1.70 0 0 0.26* 0.02* 341
Arlington Asset Investment Corp AI R 13.30 R 21-10 12/15 5.92 R R R R R R R 3.66 -37.06 R R 0.63* 0.05* 306
Blackstone Mortgage Trust BXMT O 28.19 30.00 30-23 12/15 2.38 2.55 2.60 11.1 10.9 63 71 2.70 8.84 -7.30 0 0 0.62* 0.02* 2,647
Ellington Financial LLC EFC O 17.24 20.00 20-15 12/15 1.13 1.56 1.90 11.1 9.1 63 59 0.94 0.52 -12.22 0 0 0.50* 0.03* 566
Ellington Residential Mortgage REIT EARN N 12.99 12.50 16-10 12/15 2.43 2.10 1.80 6.2 7.2 35 47 6.04 4.34 -17.73 0 0 0.45* 0.03* 118
Essent Group LTD ESNT N 21.86 24.00 29-17 12/15 1.67 2.20 2.70 9.9 8.1 57 53 6.37 9.74 -14.44 0 0 0.0 2,035
Nationstar Mortgage Holdings Inc. NSM O [V] 12.76 19.00 20-9 12/15 1.19 1.56 2.15 8.2 5.9 47 39 10.67 7.77 -35.56 0 0.00 0.0 1,313
New Residential NRZ O 13.58 17.00 17-10 12/15 1.92 1.95 1.95 6.9 7.0 40 45 11.59 21.25 -20.54 0 0 0.46* 0.03* 3,130
New York Mortgage Trust Inc NYMT U 5.95 5.50 8-4 12/15 0.62 0.70 0.85 8.4 7.0 48 46 15.76 33.71 -24.97 0 0 0.24* 0.04* 651
PennyMac Financial Services PFSI N 13.77 15.00 20-11 12/15 2.17 2.20 2.55 6.3 5.4 36 35 1.70 13.43 -27.53 0 0 0.0 304
Starwood Property Trust STWD O 20.62 24.00 24-17 12/15 2.19 2.05 2.25 10.1 9.2 58 60 6.34 11.52 -13.98 0 0 0.48* 0.02* 4,901
Stonegate Mortgage Corporation SGM N [V] 3.79 6.00 11-4 12/15 0.24 -0.10 0.25 NM 15.2 NM 99 -34.09 -12.87 -61.17 0 0 0.0 98
ZAIS Financial Corp ZFC O 14.45 17.50 18-13 12/14 1.34 1.86 1.91 7.8 7.6 45 49 -0.14 2.48 -17.71 0 0 0.40* 0.03* 115
Specialty Finance
American Capital Agency AGNC R 18.89 R 21-16 12/15 2.36 R R R R R R R 2.77 -8.79 R R 0.60* 0.03* 6,253
American Capital Mortgage Investment Corp
MTGE N 15.83 15.50 18-12 12/15 1.72 1.85 1.80 8.5 8.8 49 57 7.47 11.20 -10.16 0 0 0.40* 0.03* 724
Annaly Capital Management NLY N 10.58 10.50 11-9 12/15 1.28 1.18 1.04 9.0 10.1 52 66 1.63 3.12 2.22 0 0 0.30* 0.03* 9,785
Anworth Mortgage Asset Corp ANH N 4.63 4.75 5-4 12/15 0.58 0.56 0.57 8.3 8.1 47 53 -1.07 -3.54 -11.13 0 0 0.15* 0.03* 447
Apollo Residential Mortgage AMTG N 13.46 14.00 16-10 12/15 2.06 2.06 1.95 6.5 6.9 37 45 -1.32 3.14 -15.88 0 0 0.48* 0.04* 429
Armour Residential REIT ARR U 19.40 20.00 24-18 12/15 3.87 2.77 2.45 7.0 7.9 40 52 -7.84 -4.20 -19.44 0 0 0.71* 0.04* 712
Chimera Investment CIM N 14.99 13.50 15-11 12/15 2.14 2.19 2.05 6.8 7.3 39 48 6.69 14.71 7.12 0 0 0.48* 0.03* 2,814
CYS Investments. Inc CYS U 8.17 7.50 9-6 12/15 1.13 1.05 0.95 7.8 8.6 45 56 1.24 1.49 -8.72 0 0 0.26* 0.03* 1,238
Dynex Capital DX N 6.69 6.75 8-6 12/15 0.93 0.82 0.70 8.2 9.5 47 62 3.40 1.21 -14.67 0 0 0.21* 0.03* 328
Goldman Sachs BDC, Inc. GSBD N 19.82 19.50 25-17 12/15 2.14 2.13 2.10 9.3 9.5 53 62 0.35 5.65 -11.83 0 0 0.45* 0.02* 720
Hatteras Financial Corp HTS N 16.09 15.50 18-11 12/15 1.94 1.70 1.65 9.4 9.8 54 64 1.07 13.95 -10.76 0 0 0.45* 0.03* 1,521
Invesco Mortgage Capital IVR O 14.38 14.50 16-10 12/15 1.73 1.70 1.65 8.5 8.7 48 57 12.61 18.16 -9.96 0 0 0.40* 0.03* 1,604
MFA Financial MFA N 7.21 7.00 8-6 12/15 0.71 0.67 0.67 10.7 10.7 61 70 4.34 5.72 -9.54 0 0 0.20* 0.03* 2,675
PennyMac Mortgage Investment Trust
PMT O 15.39 16.00 19-11 12/15 1.25 1.55 1.80 10.0 8.5 57 56 14.94 13.83 -17.39 0 0 0.47* 0.03* 1,056
Two Harbors Investment TWO O 8.48 9.50 11-7 12/15 0.89 0.88 1.00 9.6 8.5 55 55 9.00 7.48 -20.82 0 0 0.23* 0.03* 2,947
Walter Investment Management WAC N [V] 4.97 4.00 23-4 12/15 1.98 -0.84 0.60 NM 8.3 NM 54 -30.97 -27.87 -71.30 0 0 0.0 178
O=OUTPERFORM N=NEUTRAL U=UNDERPERFORM R=RESTRICTED [V]=VOLATILE
1Fiscal estimates reflect company fiscal year-end.
* Data reflect current quarter, not actual year.
Note: Boldface type indicates analyst’s top stock picks..

Ju
ne 2
016
Ind
ustry
Valu
atio
n T
ab
les
66
Financials Property & Casualty Insurance Ryan Tunis (212) 325-6306
Target Fiscal Annual EPS P/E vs. % 5 Yr. Indicated Mkt
05/31 Price 52-Wk Year Estimate1 ABS P/E S&P 500 Total Returns Growth Dividend Value
Insurance Brokers Tkr Rating Price 12 m Range End FYA FY1 FY2 FY1 FY2 FY1 FY2 1 Mon. 3 Mons. 12 Mons. EPS Div Rate Yld (Mil.)
Aon plc AON U 109.27 90.00 109-85 12/15 6.17 6.53 7.04 16.7 15.5 96 101 2.49 11.25 8.28 0 * * 28,948
Arthur J. Gallagher & Co. AJG O 48.33 47.00 49-36 12/15 2.59 2.90 3.16 16.7 15.3 96 99 3.05 18.78 -0.45 0 0.00 0.0 8,560
Marsh & McLennan Companies, Inc. MMC N 66.07 55.00 66-51 12/15 3.05 3.40 3.75 19.4 17.6 111 115 3.80 14.41 13.60 0 0 0.0 34,438
Willis Towers Watson WLTW N 128.02 108.00 130-107 12/15 2.78 7.55 8.90 17.0 14.4 97 94 1.64 9.42 1.51 0 0.00 0.0 17,723
Multi Line Insurance
American International Group Inc. AIG N 57.88 58.00 65-50 12/15 2.21 4.19 5.61 13.8 10.3 79 67 2.28 10.73 -1.36 0 0 0.0 64,770
Hartford Financial Services HIG O 45.17 52.00 50-38 12/15 3.93 3.72 4.27 12.2 10.6 70 69 0.47 4.13 10.14 0 0 0.21* 0.00* 17,769
Property & Casualty Insurance
Allstate Corporation ALL O 67.51 74.00 69-57 12/15 5.18 4.60 6.33 14.7 10.7 84 69 3.29 3.37 0.88 0 0.00 0.0 25,274
Arch Capital Group Ltd. ACGL N 72.66 67.00 78-64 12/15 4.48 4.29 4.53 17.0 16.1 97 104 2.06 4.64 13.42 0 0 0.0 8,871
CB Limited CB O 126.61 131.00 127-100 12/15 9.93 10.21 10.90 12.4 11.6 71 76 6.44 7.44 19.03 0 0 0.0 58,808
Progressive Corporation PGR U 33.30 30.00 35-27 12/15 2.03 1.81 2.16 18.4 15.5 106 101 0.70 -0.57 21.80 0.00 0.0 19,414
Travelers Companies, Inc. TRV N 114.14 109.00 118-96 12/15 10.91 8.88 9.29 12.9 12.3 74 80 2.91 3.95 13.00 0 0 0.0 33,374
W.R. Berkley Corporation WRB U 57.03 45.00 58-48 12/15 3.41 3.23 3.05 17.6 18.7 101 122 1.86 7.20 15.99 0 0 0.0 6,992
XL Group plc XL N 34.35 38.00 40-32 12/15 2.43 2.70 3.65 12.7 9.4 73 61 6.51 -4.18 -8.69 0 0.00 0.0 9,734
O=OUTPERFORM N=NEUTRAL U=UNDERPERFORM R=RESTRICTED [V]=VOLATILE
1Fiscal estimates reflect company fiscal year-end.
* Data reflect current quarter, not actual year.
Note: Boldface type indicates analyst's top stock picks.
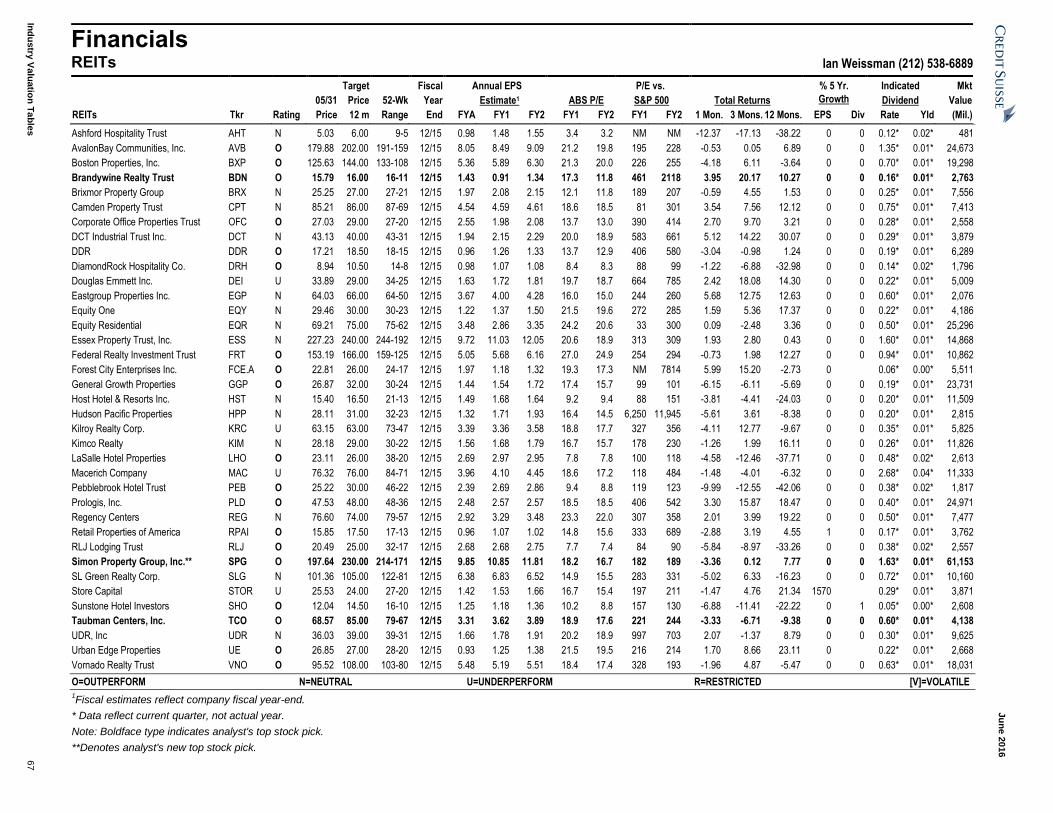
Ju
ne 2
016
Ind
ustry
Valu
atio
n T
ab
les
67
Financials REITs Ian Weissman (212) 538-6889
Target Fiscal Annual EPS P/E vs. % 5 Yr. Indicated Mkt
05/31 Price 52-Wk Year Estimate1 ABS P/E S&P 500 Total Returns Growth Dividend Value
REITs Tkr Rating Price 12 m Range End FYA FY1 FY2 FY1 FY2 FY1 FY2 1 Mon. 3 Mons. 12 Mons. EPS Div Rate Yld (Mil.)
Ashford Hospitality Trust AHT N 5.03 6.00 9-5 12/15 0.98 1.48 1.55 3.4 3.2 NM NM -12.37 -17.13 -38.22 0 0 0.12* 0.02* 481
AvalonBay Communities, Inc. AVB O 179.88 202.00 191-159 12/15 8.05 8.49 9.09 21.2 19.8 195 228 -0.53 0.05 6.89 0 0 1.35* 0.01* 24,673
Boston Properties, Inc. BXP O 125.63 144.00 133-108 12/15 5.36 5.89 6.30 21.3 20.0 226 255 -4.18 6.11 -3.64 0 0 0.70* 0.01* 19,298
Brandywine Realty Trust BDN O 15.79 16.00 16-11 12/15 1.43 0.91 1.34 17.3 11.8 461 2118 3.95 20.17 10.27 0 0 0.16* 0.01* 2,763
Brixmor Property Group BRX N 25.25 27.00 27-21 12/15 1.97 2.08 2.15 12.1 11.8 189 207 -0.59 4.55 1.53 0 0 0.25* 0.01* 7,556
Camden Property Trust CPT N 85.21 86.00 87-69 12/15 4.54 4.59 4.61 18.6 18.5 81 301 3.54 7.56 12.12 0 0 0.75* 0.01* 7,413
Corporate Office Properties Trust OFC O 27.03 29.00 27-20 12/15 2.55 1.98 2.08 13.7 13.0 390 414 2.70 9.70 3.21 0 0 0.28* 0.01* 2,558
DCT Industrial Trust Inc. DCT N 43.13 40.00 43-31 12/15 1.94 2.15 2.29 20.0 18.9 583 661 5.12 14.22 30.07 0 0 0.29* 0.01* 3,879
DDR DDR O 17.21 18.50 18-15 12/15 0.96 1.26 1.33 13.7 12.9 406 580 -3.04 -0.98 1.24 0 0 0.19* 0.01* 6,289
DiamondRock Hospitality Co. DRH O 8.94 10.50 14-8 12/15 0.98 1.07 1.08 8.4 8.3 88 99 -1.22 -6.88 -32.98 0 0 0.14* 0.02* 1,796
Douglas Emmett Inc. DEI U 33.89 29.00 34-25 12/15 1.63 1.72 1.81 19.7 18.7 664 785 2.42 18.08 14.30 0 0 0.22* 0.01* 5,009
Eastgroup Properties Inc. EGP N 64.03 66.00 64-50 12/15 3.67 4.00 4.28 16.0 15.0 244 260 5.68 12.75 12.63 0 0 0.60* 0.01* 2,076
Equity One EQY N 29.46 30.00 30-23 12/15 1.22 1.37 1.50 21.5 19.6 272 285 1.59 5.36 17.37 0 0 0.22* 0.01* 4,186
Equity Residential EQR N 69.21 75.00 75-62 12/15 3.48 2.86 3.35 24.2 20.6 33 300 0.09 -2.48 3.36 0 0 0.50* 0.01* 25,296
Essex Property Trust, Inc. ESS N 227.23 240.00 244-192 12/15 9.72 11.03 12.05 20.6 18.9 313 309 1.93 2.80 0.43 0 0 1.60* 0.01* 14,868
Federal Realty Investment Trust FRT O 153.19 166.00 159-125 12/15 5.05 5.68 6.16 27.0 24.9 254 294 -0.73 1.98 12.27 0 0 0.94* 0.01* 10,862
Forest City Enterprises Inc. FCE.A O 22.81 26.00 24-17 12/15 1.97 1.18 1.32 19.3 17.3 NM 7814 5.99 15.20 -2.73 0 0.06* 0.00* 5,511
General Growth Properties GGP O 26.87 32.00 30-24 12/15 1.44 1.54 1.72 17.4 15.7 99 101 -6.15 -6.11 -5.69 0 0 0.19* 0.01* 23,731
Host Hotel & Resorts Inc. HST N 15.40 16.50 21-13 12/15 1.49 1.68 1.64 9.2 9.4 88 151 -3.81 -4.41 -24.03 0 0 0.20* 0.01* 11,509
Hudson Pacific Properties HPP N 28.11 31.00 32-23 12/15 1.32 1.71 1.93 16.4 14.5 6,250 11,945 -5.61 3.61 -8.38 0 0 0.20* 0.01* 2,815
Kilroy Realty Corp. KRC U 63.15 63.00 73-47 12/15 3.39 3.36 3.58 18.8 17.7 327 356 -4.11 12.77 -9.67 0 0 0.35* 0.01* 5,825
Kimco Realty KIM N 28.18 29.00 30-22 12/15 1.56 1.68 1.79 16.7 15.7 178 230 -1.26 1.99 16.11 0 0 0.26* 0.01* 11,826
LaSalle Hotel Properties LHO O 23.11 26.00 38-20 12/15 2.69 2.97 2.95 7.8 7.8 100 118 -4.58 -12.46 -37.71 0 0 0.48* 0.02* 2,613
Macerich Company MAC U 76.32 76.00 84-71 12/15 3.96 4.10 4.45 18.6 17.2 118 484 -1.48 -4.01 -6.32 0 0 2.68* 0.04* 11,333
Pebblebrook Hotel Trust PEB O 25.22 30.00 46-22 12/15 2.39 2.69 2.86 9.4 8.8 119 123 -9.99 -12.55 -42.06 0 0 0.38* 0.02* 1,817
Prologis, Inc. PLD O 47.53 48.00 48-36 12/15 2.48 2.57 2.57 18.5 18.5 406 542 3.30 15.87 18.47 0 0 0.40* 0.01* 24,971
Regency Centers REG N 76.60 74.00 79-57 12/15 2.92 3.29 3.48 23.3 22.0 307 358 2.01 3.99 19.22 0 0 0.50* 0.01* 7,477
Retail Properties of America RPAI O 15.85 17.50 17-13 12/15 0.96 1.07 1.02 14.8 15.6 333 689 -2.88 3.19 4.55 1 0 0.17* 0.01* 3,762
RLJ Lodging Trust RLJ O 20.49 25.00 32-17 12/15 2.68 2.68 2.75 7.7 7.4 84 90 -5.84 -8.97 -33.26 0 0 0.38* 0.02* 2,557
Simon Property Group, Inc.** SPG O 197.64 230.00 214-171 12/15 9.85 10.85 11.81 18.2 16.7 182 189 -3.36 0.12 7.77 0 0 1.63* 0.01* 61,153
SL Green Realty Corp. SLG N 101.36 105.00 122-81 12/15 6.38 6.83 6.52 14.9 15.5 283 331 -5.02 6.33 -16.23 0 0 0.72* 0.01* 10,160
Store Capital STOR U 25.53 24.00 27-20 12/15 1.42 1.53 1.66 16.7 15.4 197 211 -1.47 4.76 21.34 1570 0.29* 0.01* 3,871
Sunstone Hotel Investors SHO O 12.04 14.50 16-10 12/15 1.25 1.18 1.36 10.2 8.8 157 130 -6.88 -11.41 -22.22 0 1 0.05* 0.00* 2,608
Taubman Centers, Inc. TCO O 68.57 85.00 79-67 12/15 3.31 3.62 3.89 18.9 17.6 221 244 -3.33 -6.71 -9.38 0 0 0.60* 0.01* 4,138
UDR, Inc UDR N 36.03 39.00 39-31 12/15 1.66 1.78 1.91 20.2 18.9 997 703 2.07 -1.37 8.79 0 0 0.30* 0.01* 9,625
Urban Edge Properties UE O 26.85 27.00 28-20 12/15 0.93 1.25 1.38 21.5 19.5 216 214 1.70 8.66 23.11 0 0.22* 0.01* 2,668
Vornado Realty Trust VNO O 95.52 108.00 103-80 12/15 5.48 5.19 5.51 18.4 17.4 328 193 -1.96 4.87 -5.47 0 0 0.63* 0.01* 18,031
O=OUTPERFORM N=NEUTRAL U=UNDERPERFORM R=RESTRICTED [V]=VOLATILE
1Fiscal estimates reflect company fiscal year-end.
* Data reflect current quarter, not actual year.
Note: Boldface type indicates analyst's top stock pick.
**Denotes analyst's new top stock pick.

Ju
ne 2
016
Ind
ustry
Valu
atio
n T
ab
les
68
Financials Specialty Finance Moshe Orenbuch (212) 538-6795
Target Fiscal Annual EPS P/E vs. % 5 Yr. Indicated Mkt
05/31 Price 52-Wk Year Estimate1 ABS P/E S&P 500 Total Returns Growth Dividend Value
Consumer Finance Tkr Rating Price 12 m Range End FYA FY1 FY2 FY1 FY2 FY1 FY2 1 Mon. 3 Mons. 12 Mons. EPS Div Rate Yld (Mil.)
Ally Financial Inc. ALLY O 17.94 28.00 24-15 12/15 2.04 2.27 2.70 7.9 6.6 45 43 0.73 -3.34 -21.18 0.00 0.0 8,678
OneMain Holdings OMF O [V] 31.26 50.00 51-19 12/15 2.36 4.35 5.85 7.2 5.3 41 35 -1.79 20.14 -32.86 0.00 0.0 4,212
Synchrony Financial SYF O 31.20 38.00 36-24 12/15 2.65 2.82 3.10 11.1 10.1 63 65 -0.41 9.24 -3.73 0 0.0 26,018
Diversified Financial Services
Avolon Holdings Ltd AVOL N 30.93 31.00 31-22 12/14 1.73 2.71 2.92 11.4 10.6 65 69 NA NA 30.01 0.00 0.0 2,550
Navient Corporation NAVI O 13.71 17.00 20-8 12/15 1.81 1.89 1.98 7.3 6.9 42 45 0.44 21.65 -29.11 0.16* 0.01* 4,531
Leasing & Logistics
AerCap Holdings AER O 39.09 55.00 50-26 12/15 6.00 5.37 5.90 7.3 6.6 42 43 -3.19 2.90 -18.97 * * 7,695
Air Lease AL O 30.05 43.00 38-23 12/15 2.76 3.44 3.83 8.7 7.8 50 51 -3.25 -4.60 -21.00 0.05* 0.00* 3,090
Aircastle AYR N 21.14 24.00 25-15 12/15 2.57 1.90 2.29 11.1 9.2 64 60 -3.60 -0.75 -12.64 0.22* 0.01* 1,666
Mortgage Finance
Hudson City Bancorp HCBK U 10.12 10.50 11-9 12/13 0.38 0.32 0.04 32.0 266.5 187 1697 3.90 -1.84 4.87 * * 5,359
Regional Banks
New York Community Bancorp, Inc. NYCB R 15.74 R 19-14 12/14 1.10 R R R R R R R -1.13 -11.07 R R 0.25* 0.02* 7,666
Specialty Finance
American Express Co. AXP U 65.76 62.00 81-51 12/15 5.05 5.60 5.20 11.7 12.7 67 82 0.12 13.20 -17.25 0.29* 0.00* 62,540
Capital One Financial Corp. COF N 73.24 90.00 92-59 12/15 7.56 7.55 8.55 9.7 8.6 56 56 -0.46 5.14 -12.17 0.40* 0.01* 37,506
CIT Group Inc. CIT N 34.26 42.00 49-26 12/15 5.72 3.53 4.03 9.7 8.5 56 55 -0.78 6.86 -25.47 0.15* 0.00* 6,910
Credit Acceptance Corp. CACC N 187.34 235.00 273-162 12/15 14.28 15.50 18.50 12.1 10.1 69 66 -2.50 -9.72 -18.67 1.00* 0.01* 3,808
Discover Financial Services DFS O 56.81 62.00 60-43 12/15 5.13 5.70 6.10 10.0 9.3 57 61 0.73 16.51 -2.59 0.28* 0.00* 23,419
MasterCard Inc. MA O 95.90 108.00 102-81 12/15 3.36 3.55 4.24 27.0 22.6 155 147 -1.91 6.86 3.61 0.19* 0.00* 103,901
Nelnet Inc. NNI O 36.68 47.00 45-29 12/15 5.89 4.97 5.40 7.4 6.8 42 44 -12.83 -5.92 -11.59 0.15* 0.00* 1,558
Santander Consumer USA SC O 12.86 20.00 27-9 12/15 2.43 2.20 2.70 5.8 4.8 34 31 -2.43 21.55 -47.60 0 0.0 4,606
SLM Corp SLM O 6.87 11.00 10-5 12/15 0.60 0.52 0.71 13.3 9.7 76 63 0.73 9.22 -33.37 0 0.0 2,940
Visa Inc. V O 78.94 85.00 81-67 12/15 2.58 2.83 3.30 27.9 23.9 160 155 0.61 6.81 14.22 0.14* 0.00* 188,265
O=OUTPERFORM N=NEUTRAL U=UNDERPERFORM R=RESTRICTED [V]=VOLATILE
1Fiscal estimates reflect company fiscal year-end.
* Data reflect current quarter, not actual year.
Note: Boldface type indicates analyst's top stock picks.

Ju
ne 2
016
Ind
ustry
Valu
atio
n T
ab
les
69
Global Services Business & Professional Services Anjaneya Singh (212) 325-7306
Target Fiscal Annual EPS P/E vs. % 5 Yr. Indicated Mkt
05/31 Price 52-Wk Year Estimate1 ABS P/E S&P 500 Total Returns Growth Dividend Value
Business & Professional Services Tkr Rating Price 12 m Range End FYA FY1 FY2 FY1 FY2 FY1 FY2 1 Mon. 3 Mons. 12 Mons. EPS Div Rate Yld (Mil.)
Aramark Holdings Corp ARMK O 33.29 38.00 34-29 09/15 1.57 1.69 1.88 19.7 17.7 113 116 -1.80 3.55 6.26 0.09* 0.00* 8,084
Avis Budget Group, Inc. CAR O [V] 30.00 34.00 52-22 12/15 3.17 2.87 3.33 10.4 9.0 60 59 21.80 6.23 -41.41 0.00 0.0 2,838
Gartner Inc IT O 101.62 106.00 102-80 12/15 2.35 2.79 3.25 36.5 31.3 209 204 15.06 20.67 16.97 0.00 0.0 8,384
H&R Block, Inc. HRB N 21.36 22.00 37-19 04/15 1.76 1.59 1.78 13.4 12.0 77 78 5.64 -35.08 -32.96 0.20* 0.01* 4,793
Hertz Global Holdings Inc. HTZ N [V] 9.69 12.00 21-7 12/15 0.79 0.98 1.14 9.9 8.5 56 55 7.19 -3.20 -50.76 0.00 0.0 4,113
IHS IHS N 122.93 122.00 134-94 11/15 5.98 6.18 6.89 19.9 17.8 114 116 -0.32 12.19 -0.24 0.00 0.0 8,289
Kforce Inc. KFRC O 18.70 22.00 29-15 12/15 1.52 1.74 1.97 10.7 9.5 61 62 -1.84 6.98 -15.61 0 0.0 519
ManpowerGroup Inc. MAN O 79.75 88.00 97-70 12/15 5.42 5.95 6.51 13.4 12.3 77 80 3.32 -0.68 -6.62 0.80* 0.01* 5,702
Nielsen Holdings NLSN O 53.39 58.00 54-43 12/15 2.63 2.85 3.11 18.8 17.1 108 112 1.68 4.22 19.09 0.31* 0.01* 19,263
Robert Half International Inc. RHI N 41.59 45.00 58-37 12/15 2.69 2.96 3.20 14.1 13.0 81 85 8.48 -0.26 -26.58 0.22* 0.01* 5,462
ServiceMaster Global Holdings Inc SERV O 38.24 44.00 42-32 12/15 1.80 2.03 2.25 18.8 17.0 108 111 0.08 1.43 13.30 0 0.0 5,191
Verisk Analytics Inc. VRSK N 79.39 81.00 82-66 12/15 2.81 3.14 3.45 25.3 23.0 145 150 2.07 4.25 7.91 0.00 0.0 13,351
Education Services
Nord Anglia Education Inc. NORD O 17.25 23.00 27-15 08/15 0.44 0.68 0.84 25.5 20.5 157 134 -14.94 -10.39 -13.92 0.00 0.0 1,796
O=OUTPERFORM N=NEUTRAL U=UNDERPERFORM R=RESTRICTED [V]=VOLATILE
1Fiscal estimates reflect company fiscal year-end.
* Data reflect current quarter, not actual year.
Note: Boldface type indicates analyst's top stock picks.
Global Services Knowledge Services Trace Urdan (415) 249-7926
Target Fiscal Annual EPS P/E vs. % 5 Yr. Indicated Mkt
05/31 Price 52-Wk Year Estimate1 ABS P/E S&P 500 Total Returns Growth Dividend Value
Business & Professional Services Tkr Rating Price 12 m Range End FYA FY1 FY2 FY1 FY2 FY1 FY2 1 Mon. 3 Mons. 12 Mons. EPS Div Rate Yld (Mil.)
Bright Horizons Family Solutions, Inc BFAM O 64.78 74.00 70-50 12/15 1.85 2.18 2.51 29.7 25.8 174 171 0.19 -3.02 24.46 0 0.00 0.0 3,908
Education Services
Capella Education Co. CPLA O 52.64 57.00 68-41 12/15 3.59 3.57 4.11 14.8 12.8 86 85 10.36 13.89 -19.83 0.00 0.0 617
DeVry Education Group Inc. DV O 17.27 29.00 38-17 06/15 2.08 0.54 2.85 31.8 6.1 186 40 -7.45 -31.77 -49.21 0 0.0 1,091
Grand Canyon Education, Inc LOPE O 42.74 62.00 46-34 12/15 2.78 3.01 3.24 14.2 13.2 83 88 5.50 6.53 -2.42 0.00 0.0 1,987
Houghton Mifflin Harcourt Company HMHC O 19.94 23.00 27-16 12/15 -0.88 -0.97 -0.39 NM NM NM NM 2.31 -8.45 -14.38 0.00 0.0 2,453
Nord Anglia Education Inc. NORD O 20.89 23.00 27-15 08/15 0.44 0.68 0.84 30.8 24.8 180 165 5.35 3.01 -9.65 0 0.0 2,175
Strayer Education, Inc. STRA N 48.75 56.00 63-42 12/14 4.35 3.83 3.77 12.7 12.9 74 86 6.76 -18.91 -11.36 0 0 0.0 544
O=OUTPERFORM N=NEUTRAL U=UNDERPERFORM R=RESTRICTED [V]=VOLATILE
1Fiscal estimates reflect company fiscal year-end.
* Data reflect current quarter, not actual year.
Note: Boldface type indicates analyst's top stock picks.

Ju
ne 2
016
Ind
ustry
Valu
atio
n T
ab
les
70
Global Services Payments & Financial Technology Paul Condra (212) 325-8903
Target Fiscal Annual EPS P/E vs. % 5 Yr. Indicated Mkt
05/31 Price 52-Wk Year Estimate1 ABS P/E S&P 500 Total Returns Growth Dividend Value
Computer Services & IT Consulting Tkr Rating Price 12 m Range End FYA FY1 FY2 FY1 FY2 FY1 FY2 1 Mon. 3 Mons. 12 Mons. EPS Div Rate Yld (Mil.)
Alliance Data Systems Corporation ADS N 220.00 225.00 310-177 12/14 12.57 15.05 16.93 14.6 13.0 85 86 2.64 -20.45 -25.32 0.00 0.0 13,038
Blackhawk Network Holdings, Inc. HAWK O 34.30 47.00 48-33 12/15 2.34 2.48 2.85 13.8 12.1 81 80 -2.33 -22.42 -6.00 0 0.0 1,914
First Data Corporation FDC O [V] 12.94 12.00 18-9 12/15 0.74 1.17 1.27 11.1 10.2 65 68 1.57 -19.23 0 0.0 11,669
Fiserv, Inc. FISV N 102.58 101.00 103-77 12/14 3.37 3.87 4.38 26.5 23.4 155 155 5.45 12.16 28.90 0.00 0.0 22,869
Fleetcor Technologies, Inc. FLT N 148.75 133.00 164-113 12/15 6.26 6.49 7.34 22.9 20.3 134 135 9.99 4.07 -2.47 0.00 0.0 13,777
Global Payments Inc. GPN O 65.30 68.00 73-46 05/15 2.52 2.88 3.14 22.7 20.8 132 138 4.95 1.22 42.22 0 0.0 8,440
Heartland Payment Systems, Inc. HPY N 96.57 100.00 97-49 12/14 2.26 2.89 3.33 33.5 29.0 196 193 2.34 1.85 98.46 0 0.0 3,573
PayPal Holdings, Inc.** PYPL O [V] 38.60 39.00 41-31 12/15 1.29 1.49 1.76 25.9 21.9 151 145 -1.43 6.63 0 0.0 47,195
Total System Services, Inc. TSS R 47.58 R 56-38 12/14 1.97 R R R R R R R -4.46 25.34 R R 0 0.0 8,715
Vantiv, Inc. VNTV O 53.88 55.00 54-38 12/15 2.24 2.60 2.87 20.7 18.7 121 124 3.80 13.62 43.41 0 0.0 10,311
VeriFone Systems, Inc. PAY N 28.24 32.00 39-21 10/14 1.51 1.84 2.23 15.4 12.6 90 84 13.83 0.79 -18.33 0 0.0 3,112
WEX, Inc. WEX O 83.36 82.00 119-58 12/15 4.87 3.99 4.94 20.9 16.9 122 112 18.21 -5.70 -22.76 0 0.0 3,221
Diversified Commercial Services
DH Corporation(C$) DH O 38.63 40.00 44-29 12/15 2.78 2.60 2.80 14.9 13.8 85 95 1.60 22.17 -1.05 0.00 0.0 4,112
Diversified Financial Services
Fidelity National Information Services Inc
FIS N 63.31 67.00 74-56 12/15 3.23 3.77 4.11 16.8 15.4 98 102 5.66 4.47 -6.48 0.00 0.0 17,863
Software
ACI Worldwide Inc ACIW N 20.79 22.00 26-16 12/15 0.81 0.41 0.55 51.2 38.1 299 253 4.21 -2.85 -3.93 0.00 0.0 2,476
O=OUTPERFORM N=NEUTRAL U=UNDERPERFORM R=RESTRICTED [V]=VOLATILE
1Fiscal estimates reflect company fiscal year-end.
* Data reflect current quarter, not actual year.
Note: Boldface type indicates analyst's top stock picks.
**Denotes analyst's new top stock pick.

Ju
ne 2
016
Ind
ustry
Valu
atio
n T
ab
les
71
Healthcare Animal Health Erin Wilson (212) 538-4080
Target Fiscal Annual EPS P/E vs. % 5 Yr. Indicated Mkt
05/31 Price 52-Wk Year Estimate1 ABS P/E S&P 500 Total Returns Growth Dividend Value
Animal Health Tkr Rating Price 12 m Range End FYA FY1 FY2 FY1 FY2 FY1 FY2 1 Mon. 3 Mons. 12 Mons. EPS Div Rate Yld (Mil.)
ABAXIS ABAX U 46.02 39.00 58-39 03/16 1.36 1.45 1.59 31.8 28.9 182 188 3.32 13.83 -13.15 2.77* 0.06* 1,035
Aratana Therapeutics PETX O [V] 7.13 11.00 20-3 12/15 -2.45 -1.65 -1.06 NM NM NM NM 15.93 80.05 -47.15 0.00 0.0 252
IDEXX Laboratories IDXX O 87.57 91.00 90-62 12/15 2.11 2.24 2.53 39.1 34.6 224 225 2.69 15.99 29.23 0 0.00 0.0 7,840
Nexvet NVET O [V] 3.35 8.00 6-3 06/15 -1.04 -1.84 -2.02 NM NM NM NM 10.93 1.82 -23.86 0.00 0.0 39
PetMed Express PETS U 18.83 13.00 19-16 03/16 1.02 1.05 1.10 17.9 17.1 103 112 4.38 11.62 12.42 * * 385
Phibro Animal Health PAHC O [V] 18.99 35.00 40-18 06/15 1.72 1.59 1.80 12.0 10.6 69 69 -9.05 -29.64 -45.34 0 0.11* 0.01* 748
VCA WOOF O 64.93 70.00 65-45 12/15 2.38 2.90 3.15 22.4 20.6 129 134 0.71 22.72 24.08 * * 5,248
Zoetis ZTS O 47.42 59.00 55-39 12/15 1.77 1.89 2.34 25.1 20.3 144 132 -1.27 15.43 -4.74 0 0.0 23,530
O=OUTPERFORM N=NEUTRAL U=UNDERPERFORM R=RESTRICTED [V]=VOLATILE
1Fiscal estimates reflect company fiscal year-end.
* Data reflect current quarter, not actual year.
Note: Boldface type indicates analyst's top stock pick.
Healthcare Biotechnology Alethia Young (212) 538-0640
Target Fiscal Annual EPS P/E vs. % 5 Yr. Indicated Mkt
05/31 Price 52-Wk Year Estimate1 ABS P/E S&P 500 Total Returns Growth Dividend Value
Biotechnology Tkr Rating Price 12 m Range End FYA FY1 FY2 FY1 FY2 FY1 FY2 1 Mon. 3 Mons. 12 Mons. EPS Div Rate Yld (Mil.)
Alexion Pharmaceuticals Incorporated ALXN N 150.90 195.00 208-128 12/15 5.01 5.00 6.47 30.2 23.3 173 152 7.38 3.46 -8.42 0 0.00 0.0 33,805
Alnylam Pharmaceuticals, Incorporated ALNY O [V] 71.72 150.00 139-52 12/15 -2.91 -3.98 -5.30 NM NM NM NM 4.26 19.57 -45.34 0.00 0.0 6,122
Amgen, Inc. AMGN O 157.95 206.00 177-132 12/15 10.39 11.84 11.75 13.3 13.4 76 88 -0.65 8.30 0.59 0 0 * * 118,655
Biogen, Inc. BIIB N 289.73 322.00 418-245 12/15 17.01 18.33 18.48 15.8 15.7 91 102 5.86 7.85 -26.34 0 0.00 0.0 63,466
Biomarin Pharmaceuticals, Incorporated
BMRN O 89.65 114.00 149-65 12/15 -0.87 -0.52 0.09 NM 1004.0 NM 6,536 3.16 0.09 -27.72 1 0.00 0.0 14,552
Celgene Corporation CELG O 105.52 140.00 139-97 12/15 4.71 5.60 7.06 18.8 14.9 108 97 0.52 2.72 -7.80 0 0.00 0.0 81,736
Coherus BioSciences, Inc. CHRS O [V] 18.65 29.00 37-13 12/15 -5.56 -5.21 -6.54 NM NM NM NM -6.61 3.27 -25.37 0 0 0.0 795
Gilead Sciences, Incorporated GILD O 87.06 120.00 122-82 12/15 12.61 12.18 12.92 7.1 6.7 41 44 -2.18 -0.88 -23.69 0 * * 115,948
Incyte Corporation INCY O [V] 84.41 100.00 131-63 12/15 0.44 0.52 1.55 163.1 54.5 935 354 13.52 16.33 -23.04 1 0 0.0 15,837
Intellia Therapeutics, Inc. NTLA O [V] 29.57 39.00 30-22 12/15 -0.66 -0.46 -0.81 NM NM NM NM * * 1,038
Intercept Pharmaceuticals, Incorporated ICPT O [V] 148.36 200.00 280-94 12/15 -7.76 -12.87 -12.26 NM NM NM NM -1.36 18.91 -42.45 0 0.0 3,649
Mesoblast MESO O [V] 7.07 10.00 11-4 12/15 -0.30 -0.20 -0.23 NM NM NM NM -14.51 -24.79 0 0.00 0.0 1,003
PTC Therapeutics, Inc. PTCT O [V] 8.16 12.00 62-5 12/15 -4.05 -3.48 -2.50 NM NM NM NM 5.29 33.77 -85.59 0 0 0.0 280
Regeneron Pharmaceuticals, Inc. REGN N 398.93 481.00 592-360 12/15 12.07 10.45 14.94 38.2 26.7 219 174 3.75 -0.75 -22.36 0 0 0.0 41,919
Tesaro, Inc. TSRO O [V] 46.30 56.00 66-32 12/15 -5.67 -6.46 -4.91 NM NM NM NM 10.45 5.83 -23.81 0 12.00* 0.26* 2,123
Vertex Pharmaceuticals Incorporated VRTX O 93.15 112.00 141-78 12/15 -1.11 0.95 2.83 98.2 32.9 563 214 12.23 4.14 -26.54 0 0 0.0 23,041
Xenoport, Inc XNPT U [V] 7.09 4.00 8-3 12/15 -1.14 0.06 -0.45 125.0 NM 717 NM 57.21 54.13 13.80 0 0 0.0 450
O=OUTPERFORM N=NEUTRAL U=UNDERPERFORM R=RESTRICTED [V]=VOLATILE
1Fiscal estimates reflect company fiscal year-end.
* Data reflect current quarter, not actual year.
Note: Boldface type indicates analyst's top stock picks.

Ju
ne 2
016
Ind
ustry
Valu
atio
n T
ab
les
72
Healthcare Healthcare Technology & Distribution Robert Willoughby (212) 325-1497
Target Fiscal Annual EPS P/E vs. % 5 Yr. Indicated Mkt
05/31 Price 52-Wk Year Estimate1 ABS P/E S&P 500 Total Returns Growth Dividend Value
Drug Retail Tkr Rating Price 12 m Range End FYA FY1 FY2 FY1 FY2 FY1 FY2 1 Mon. 3 Mons. 12 Mons. EPS Div Rate Yld (Mil.)
CVS Health CVS O 96.45 115.00 113-90 12/15 5.17 5.80 6.55 16.6 14.7 95 96 -4.93 -2.95 -5.91 0 0 0.39* 0.00* 103,589
Rite Aid RAD O 7.70 9.00 9-6 02/16 0.17 0.24 0.30 31.8 25.3 182 165 -4.23 -3.39 -11.09 0 0.0 8,075
Walgreens Boots Alliance WBA O 77.40 95.00 97-73 08/15 3.91 4.48 5.05 17.3 15.3 99 100 -3.92 -3.15 -9.98 0 0 0.36* 0.00* 83,611
Pharmaceutical Distribution
AmerisourceBergen ABC O 74.98 98.00 115-74 09/15 4.96 5.50 5.80 13.6 12.9 78 84 -12.03 -15.01 -33.80 0 0 0.34* 0.00* 16,185
Cardinal Health CAH O 78.95 97.00 91-76 06/15 4.38 5.27 5.75 15.0 13.7 86 89 -0.69 -5.57 -10.71 0 0 0.39* 0.00* 25,723
DENTSPLY-SIRONA XRAY O 62.16 72.00 63-50 12/15 2.61 2.75 3.10 22.6 20.0 129 130 3.17 2.54 18.83 0 0 0.07* 0.00* 14,560
Diplomat Pharmacy DPLO N [V] 32.58 30.00 51-24 12/15 0.74 0.95 1.10 34.3 29.7 197 193 7.17 18.56 -14.51 0 0.00 0.0 2,150
Express Scripts ESRX O 75.55 85.00 94-66 12/15 5.53 6.40 6.90 11.8 11.0 68 71 2.62 4.35 -12.15 0 0.00 0.0 47,808
Henry Schein HSIC N 173.73 171.00 174-129 12/15 5.96 6.63 7.35 26.2 23.6 150 154 1.60 3.60 21.51 0 0 0.0 14,257
LabCorp of America LH O 127.95 135.00 128-101 12/15 7.90 8.75 9.65 14.6 13.3 84 86 1.66 14.32 7.81 0 0.00 0.0 13,102
McKesson MCK N 183.14 175.00 238-150 03/16 12.08 13.60 14.05 13.5 13.0 77 85 8.73 12.56 -23.14 * * 41,210
Owens & Minor OMI U 37.29 34.00 41-32 12/15 2.02 2.01 2.00 18.5 18.7 106 121 3.58 -6.14 11.31 0 0 * * 2,342
Patterson Companies PDCO O 48.81 55.00 52-39 04/16 2.47 2.65 3.00 18.4 16.3 106 106 11.92 9.46 1.75 * * 4,837
PharMerica PMC O 26.57 31.00 37-20 12/15 2.10 2.05 2.30 12.9 11.6 74 75 10.16 14.53 -21.06 0 0 0.0 817
Quest Diagnostics DGX N 77.17 72.00 78-61 12/15 4.88 5.08 5.40 15.2 14.3 87 93 2.69 10.70 2.24 0 0 0.40* 0.01* 10,916
Service Corp INTL SCI O 27.40 32.00 32-22 12/15 1.18 1.24 1.35 22.2 20.3 127 132 0.96 11.97 -6.00 0 0 0.10* 0.00* 5,308
O=OUTPERFORM N=NEUTRAL U=UNDERPERFORM R=RESTRICTED [V]=VOLATILE
1Fiscal estimates reflect company fiscal year-end.
* Data reflect current quarter, not actual year.
Note: Boldface type indicates analyst's top stock picks.

Ju
ne 2
016
Ind
ustry
Valu
atio
n T
ab
les
73
Healthcare Major Pharmaceuticals Vamil Divan (212) 538-5394
Target Fiscal Annual EPS P/E vs. % 5 Yr. Indicated Mkt
05/31 Price 52-Wk Year Estimate1 ABS P/E S&P 500 Total Returns Growth Dividend Value
Biotechnology Tkr Rating Price 12 m Range End FYA FY1 FY2 FY1 FY2 FY1 FY2 1 Mon. 3 Mons. 12 Mons. EPS Div Rate Yld (Mil.)
Aimmune Therapeutics AIMT O [V] 21.39 44.00 26-20 12/14 -0.64 -0.74 -1.19 NM NM NM NM 14.57 0 0.0 1,026
Alder Biopharmaceuticals ALDR O [V] 37.26 50.00 53-11 12/14 0.30 -1.70 -1.85 NM NM NM NM -15.00 -36.70 158.36 0 0 0.0 1,858
Alkermes plc ALKS O 73.36 77.00 74-40 12/14 0.35 -0.37 -0.39 NM NM NM NM -1.25 -6.98 36.86 0.00 0.0 10,669
Esperion Therapeutics ESPR N [V] 28.41 51.00 115-18 12/14 -2.22 -2.25 -3.34 NM NM NM NM -49.74 -71.63 -3.56 0 0.00 0.0 1,071
Galapagos NV GLPG O 47.21 46.00 59-10 12/14 -1.24 -2.44 -2.19 NM NM 111 NM -29.78 -21.08 205.05 0 0.0 1,974
Portola Pharmaceuticals PTLA O [V] 49.61 59.00 57-25 12/14 -3.19 -4.51 -1.28 NM NM NM NM -6.47 -7.04 68.59 0 * * 2,600
Major Pharmaceuticals
AbbVie Inc. ABBV O 62.93 67.00 71-48 12/15 4.29 4.82 5.61 13.1 11.2 75 73 2.43 12.52 -5.98 0 0 0.53* 0.01* 101,804
Bristol Myers Squibb Co. BMY O 71.70 79.00 73-57 12/15 2.01 2.57 3.18 27.9 22.6 160 147 -0.36 10.31 7.85 0 0 0.38* 0.01* 119,689
Eli Lilly & Co. LLY O 75.03 91.00 90-69 12/15 3.43 3.58 3.84 20.9 19.5 120 127 -2.24 2.43 -5.03 0 0 0.51* 0.01* 82,870
Johnson & Johnson JNJ N 112.69 112.00 115-91 12/15 6.20 6.56 6.92 17.2 16.3 98 106 -0.05 5.66 12.64 0 0 0.80* 0.01* 309,970
Merck & Co., Inc. MRK N 56.26 57.00 61-48 12/15 3.59 3.69 3.65 15.3 15.4 87 100 1.74 7.98 -7.39 0 0 0.45* 0.01* 155,729
Pfizer PFE O 34.70 39.00 36-29 12/15 2.20 2.42 2.62 14.3 13.3 82 86 5.79 16.09 0.41 0 0 0.30* 0.01* 210,450
Medical Supplies & Devices
Johnson & Johnson JNJ N 93.35 109.00 109-91 12/14 5.97 6.17 6.37 15.1 14.7 86 92 1.37 -5.17 -12.42 0 0 0.75* 0.01* 258,413
Specialty Pharmaceuticals
Adamas Pharmaceuticals, Inc. ADMS O [V] 16.82 30.00 31-12 12/15 -2.86 -3.12 -1.56 NM NM NM NM -1.06 17.87 -6.76 0 * * 364
Aimmune Therapeutics AIMT O [V] 15.35 35.00 26-13 12/15 -1.08 -1.77 -2.37 NM NM NM NM 17.00 -14.15 0.00 0.0 648
Alder Biopharmaceuticals ALDR O [V] 30.07 38.00 53-17 12/15 -2.11 -3.06 -3.47 NM NM NM NM 9.43 49.08 -28.15 0 0.00 0.0 1,503
Alkermes plc ALKS O [V] 46.41 45.00 80-29 12/15 -0.36 -0.30 0.23 NM 205.5 NM 1,338 14.99 41.02 -23.07 0 0.00 0.0 7,016
Corvus Pharmaceuticals, Inc. CRVS O [V] 14.05 25.00 16-10 12/15 -1.54 -1.96 -2.36 NM NM NM NM 16.50 0 0.0 287
Edge Therapeutics, Inc. EDGE O [V] 8.28 18.00 23-7 12/15 -4.01 -1.57 -1.21 NM NM NM NM -1.55 -6.76 0 0 0.0 239
Esperion Therapeutics ESPR N [V] 17.12 23.00 106-14 12/15 -2.26 -3.71 -4.19 NM NM NM NM 6.80 -1.21 -83.54 0 0.00 0.0 386
Galapagos NV GLPG N [V] 51.78 48.00 59-33 12/15 -3.32 1.07 -2.07 48.5 NM 267 NM 19.86 29.22 1.27 0.00 0.0 2,388
MyoKardia, Inc. MYOK O [V] 12.36 16.00 16-7 12/15 -1.24 -0.32 -1.45 NM NM NM NM 4.75 64.36 0 0 0.0 334
Portola Pharmaceuticals PTLA N [V] 27.48 30.00 57-19 12/15 -4.36 -4.38 0.59 NM 46.9 NM 305 12.39 -10.63 -31.32 0 0.00 0.0 1,552
Teva Pharmaceutical Industries Ltd. TEVA N 51.87 60.00 72-50 12/15 5.42 5.39 5.99 9.6 8.7 55 56 -3.03 -6.71 -13.99 0 0 0.34* 0.01* 53,024
Versartis, Inc. VSAR U [V] 9.21 7.00 21-6 12/15 -2.84 -3.89 -3.29 NM NM NM NM 1.21 18.69 -40.35 0 2.00* 0.22* 271
O=OUTPERFORM N=NEUTRAL U=UNDERPERFORM R=RESTRICTED [V]=VOLATILE
1Fiscal estimates reflect company fiscal year-end.
* Data reflect current quarter, not actual year.
Note: Boldface type indicates analyst's top stock picks.

Ju
ne 2
016
Ind
ustry
Valu
atio
n T
ab
les
74
Healthcare Managed Care & Healthcare Facilities Scott Fidel (212) 538-0812
Target Fiscal Annual EPS P/E vs. % 5 Yr. Indicated Mkt
05/31 Price 52-Wk Year Estimate1 ABS P/E S&P 500 Total Returns Growth Dividend Value
Managed Care & Healthcare Facilities Tkr Rating Price 12 m Range End FYA FY1 FY2 FY1 FY2 FY1 FY2 1 Mon. 3 Mons. 12 Mons. EPS Div Rate Yld (Mil.)
Aetna Inc. AET N 113.23 120.00 133-94 12/15 7.71 8.00 8.85 14.1 12.8 81 83 -0.54 3.27 -5.34 0 0 0.0 39,698
Centene Corporation** CNC O 62.35 78.00 81-53 12/15 3.12 4.21 4.90 14.8 12.7 85 83 -0.83 3.37 -17.85 0 0.00 0.0 10,629
HCA Holdings, Inc. HCA O 78.02 90.00 95-63 12/14 4.71 5.59 6.65 14.0 11.7 80 76 -3.93 6.98 -5.30 0 0.00 0.0 30,510
Humana Inc. HUM N 172.51 185.00 215-157 12/15 7.40 8.85 10.00 19.5 17.2 112 112 -2.87 -5.85 -19.73 0 0.00 0.0 25,707
LifePoint Health, Inc. LPNT O 66.29 79.00 88-60 12/15 4.08 3.80 4.40 17.4 15.1 100 98 -1.06 0.59 -11.91 0 0 0.0 2,878
Molina Healthcare, Inc. MOH N 48.43 51.00 82-45 12/15 3.13 2.60 3.60 18.6 13.4 107 88 -2.73 -25.33 -32.99 0 0 0.0 2,740
Tenet Healthcare Corporation THC N [V] 28.94 35.00 61-23 12/15 2.05 1.75 2.68 16.5 10.8 95 70 -8.53 3.03 -45.65 0 0.00 0.0 2,874
UnitedHealth Group Incorporated UNH O 133.67 141.00 134-109 12/15 6.45 7.90 9.10 16.9 14.7 97 96 1.19 9.73 11.52 0 0 0.0 127,094
Universal Health Services, Inc. UHS N 134.86 140.00 146-102 12/15 6.87 7.55 8.30 17.9 16.3 102 106 0.51 14.77 2.92 0 0 0.10* 0.00* 13,088
WellCare Health Plans, Inc. WCG U 101.42 85.00 101-70 12/15 3.60 4.63 5.62 21.9 18.0 126 117 12.86 8.35 18.86 0 0.00 0.0 4,488
O=OUTPERFORM N=NEUTRAL U=UNDERPERFORM R=RESTRICTED [V]=VOLATILE
1Fiscal estimates reflect company fiscal year-end.
* Data reflect current quarter, not actual year.
Note: Boldface type indicates analyst's top stock picks.
**Denotes analyst's new top stock pick.
Healthcare Medical Supplies & Devices Matthew Keeler (212) 325-9008
Target Fiscal Annual EPS P/E vs. % 5 Yr. Indicated Mkt
05/31 Price 52-Wk Year Estimate1 ABS P/E S&P 500 Total Returns Growth Dividend Value
Medical Supplies & Devices Tkr Rating Price 12 m Range End FYA FY1 FY2 FY1 FY2 FY1 FY2 1 Mon. 3 Mons. 12 Mons. EPS Div Rate Yld (Mil.)
Abbott Laboratories ABT O 39.63 47.00 51-36 12/15 2.16 2.24 2.52 17.7 15.7 101 102 2.01 2.09 -19.02 0 0 0.26* 0.01* 58,385
Baxalta Incorporated BXLT O [V] 45.23 42.00 46-30 12/15 2.08 2.11 2.36 21.4 19.2 123 125 7.33 15.09 0 0.00 0.0 30,917
Baxter International Inc. BAX N 43.16 47.00 46-32 12/15 1.38 1.64 1.88 26.4 23.0 151 150 -3.47 9.74 19.74 0.00 0.0 23,836
Boston Scientific Corp BSX O 22.71 22.00 23-16 12/15 0.92 1.08 1.20 21.0 18.9 120 123 3.23 30.44 22.69 0 0 0.0 30,814
Edwards LifeSciences Corp. EW O 98.50 116.00 109-66 12/15 2.29 2.74 3.25 36.0 30.3 206 197 -7.82 13.06 49.03 0 0 0.0 20,859
Endologix ELGX O 12.67 14.00 17-7 12/15 -0.53 -0.80 -0.45 NM NM NM NM 10.17 43.33 -25.03 0 0 0.0 1,037
HeartWare International Inc HTWR O 29.40 38.00 91-26 12/15 -2.91 -3.47 -2.78 NM NM NM NM -14.81 -1.93 -60.71 0 0.00 0.0 516
Lantheus Medical Imaging, Inc. LNTH N [V] 1.95 4.00 9-2 12/15 0.57 0.39 0.50 5.0 3.9 28 25 -7.14 -4.88 0 0 0.0 64
MacroCure Ltd. MCUR N [V] 1.14 1.00 15-1 12/14 -2.15 -1.46 -0.84 NM NM NM NM 16.33 22.58 -90.40 0 0.00 0.0 19
MediWound ltd. MDWD O [V] 7.70 16.00 10-5 12/15 -1.00 -1.00 -0.20 NM NM NM NM -7.23 -1.03 39.24 0 0 0.0 168
Medtronic MDT O 80.48 85.00 82-65 04/16 4.37 4.68 5.15 17.2 15.6 99 102 1.42 7.42 4.93 0 0 0.44* 0.01* 112,756
St Jude Medical STJ N 78.36 81.00 78-49 12/15 3.94 4.09 4.53 19.2 17.3 110 113 2.70 42.47 5.34 0 0 0.32* 0.00* 22,276
Stryker Corporation SYK O 111.16 110.00 112-88 12/15 5.12 5.79 6.38 19.2 17.4 110 113 1.11 8.03 15.65 0 0 0.40* 0.00* 41,572
Vital Therapies, Inc. VTL N [V] 8.13 9.00 27-3 12/15 -2.07 -1.30 -1.48 NM NM NM NM -3.67 -6.44 -62.55 0 0 0.0 252
Zimmer Biomet Holdings ZBH O 122.11 107.00 123-92 12/15 7.38 7.85 8.74 15.5 14.0 89 91 5.33 23.48 6.40 0 0 0.20* 0.00* 24,329
O=OUTPERFORM N=NEUTRAL U=UNDERPERFORM R=RESTRICTED [V]=VOLATILE
1Fiscal estimates reflect company fiscal year-end.
* Data reflect current quarter, not actual year.
Note: Boldface type indicates analyst's top stock pick.

Ju
ne 2
016
Ind
ustry
Valu
atio
n T
ab
les
75
Healthcare SMID-Cap Biotechnology Kennen MacKay (212) 538-5241
Target Fiscal Annual EPS P/E vs. % 5 Yr. Indicated Mkt
05/31 Price 52-Wk Year Estimate1 ABS P/E S&P 500 Total Returns Growth Dividend Value
Biotechnology Tkr Rating Price 12 m Range End FYA FY1 FY2 FY1 FY2 FY1 FY2 1 Mon. 3 Mons. 12 Mons. EPS Div Rate Yld (Mil.)
Acceleron Pharma, Inc XLRN O [V] 34.21 42.00 50-22 12/15 -1.94 -1.45 -1.62 NM NM NM NM 12.79 22.31 6.71 0 0.00 0.0 1,273
Agios Pharmaceuticals, Inc AGIO O [V] 55.95 70.00 124-36 12/15 -3.15 -1.22 -8.93 NM NM NM NM 12.48 30.24 -54.22 0 0.0 2,122
Akebia Therapeutics, Inc AKBA N [V] 8.91 10.00 13-6 12/15 -2.30 0.62 -2.41 14.4 NM 83 NM -6.21 16.47 14.08 0 0 0.0 338
Clovis Oncology, Inc CLVS N [V] 16.83 14.00 115-12 12/15 -9.80 -7.88 -5.15 NM NM NM NM 15.75 -21.65 -80.66 0 0 0.0 646
Endocyte, Inc. ECYT O [V] 3.92 10.00 6-3 12/15 -0.99 -1.22 -0.98 NM NM NM NM 0.51 19.15 -35.84 0 0 0.0 165
FibroGen, Inc FGEN O [V] 18.66 38.00 31-15 12/15 -1.42 -0.95 -2.21 NM NM NM NM 1.58 -0.59 6.63 0 0.00 0.0 1,165
Five Prime Therapeutics, Inc.** FPRX O [V] 45.72 55.00 50-15 12/15 9.23 -2.25 -0.26 NM NM NM NM -5.71 36.52 86.00 0 0 0.0 1,289
Ignyta, Inc RXDX O [V] 6.79 13.00 18-5 12/15 -3.44 -2.59 -2.01 NM NM NM NM -5.10 -2.93 -54.46 0 0 0.0 283
Medivation, Inc MDVN O [V] 60.46 63.00 64-27 12/15 1.45 1.19 1.39 50.7 43.6 291 284 4.22 58.27 -5.77 0 0 0.0 9,953
OvaScience, Inc OVAS U [V] 7.39 4.00 39-5 12/15 -2.70 -3.10 -3.71 NM NM NM NM -10.75 6.18 -79.11 0 0.00 0.0 255
Prothena Corporation Plc PRTA O [V] 48.54 64.00 75-30 12/15 -2.66 -4.21 -3.79 NM NM NM NM 10.65 34.83 21.50 0 0 0.0 1,667
Puma Biotechnology, Inc PBYI O [V] 37.79 50.00 170-22 12/15 -7.45 -8.84 -8.02 NM NM NM NM 26.39 -19.10 -77.77 0.00 0.0 1,228
Seattle Genetics, Inc SGEN O [V] 40.43 51.00 52-27 12/15 -0.93 -1.30 -1.49 NM NM NM NM 11.16 28.06 -6.82 0 0.0 5,667
UltraGenyx Pharmaceutical, Inc RARE O [V] 73.10 101.00 134-51 12/15 -3.96 -5.59 -4.66 NM NM NM NM 5.24 15.34 -15.64 0 0 0.0 2,852
O=OUTPERFORM N=NEUTRAL U=UNDERPERFORM R=RESTRICTED [V]=VOLATILE
1Fiscal estimates reflect company fiscal year-end.
* Data reflect current quarter, not actual year.
Note: Boldface type indicates analyst's top stock pick.
**Denotes analyst's new top stock pick.

Ju
ne 2
016
Ind
ustry
Valu
atio
n T
ab
les
76
Industrials Aerospace & Defense Robert Spingarn (212) 538-1895
Target Fiscal Annual EPS P/E vs. % 5 Yr. Indicated Mkt
05/31 Price 52-Wk Year Estimate1 ABS P/E S&P 500 Total Returns Growth Dividend Value
Aerospace & Defense Tkr Rating Price 12 m Range End FYA FY1 FY2 FY1 FY2 FY1 FY2 1 Mon. 3 Mons. 12 Mons. EPS Div Rate Yld (Mil.)
AAR AIR N 24.41 26.00 33-19 05/15 -1.40 1.34 2.17 18.2 11.3 104 73 1.45 11.16 -17.37 0 0.00 0.0 848
BE Aerospace Inc. BEAV O 47.64 58.00 58-38 12/15 3.03 3.27 3.71 14.6 12.9 83 84 -2.36 4.57 -17.03 0 0.00 0.0 4,869
Boeing BA N 126.15 148.00 149-108 12/15 7.71 8.28 9.53 15.2 13.2 87 86 -5.87 5.47 -10.69 0 0 1.09* 0.01* 80,359
Bombardier Inc (SVS)(C$) BBD.B O [V] 1.97 2.56 3-1 12/15 0.15 -0.09 -0.03 NM NM NM NM 1.55 61.48 -23.35 -1 0 0.00 0.0 2,913
Esterline Technologies ESL O 67.41 82.00 109-52 09/15 5.74 4.40 5.81 15.3 11.6 88 76 -4.38 12.73 -37.67 0 0.00 0.0 1,979
Garmin Ltd GRMN U 42.52 36.00 47-32 12/15 2.52 2.28 2.38 18.6 17.8 107 116 -1.14 3.86 -6.49 0 0 0.54* 0.01* 8,039
General Dynamics Corporation GD O 141.87 164.00 153-124 12/15 9.08 9.45 10.00 15.0 14.2 86 92 0.03 4.52 1.16 0 0 0.00 0.0 43,362
Heico Corp HEI N 66.55 62.00 67-48 10/15 1.97 2.32 2.57 28.7 25.9 164 169 7.53 12.53 15.18 0 0 0.09* 0.00* 4,529
Hexcel Corporation HXL N 43.67 43.00 54-38 12/15 2.32 2.45 2.95 17.8 14.8 102 96 -2.83 2.92 -11.06 0 0.10* 0.00* 4,140
Huntington Ingalls HII N 153.41 149.00 156-104 12/15 8.75 10.00 10.05 15.3 15.3 88 99 5.10 14.88 26.02 0 0 0.50* 0.00* 7,214
L-3 Communications LLL O 137.21 155.00 138-102 12/15 6.91 7.69 8.35 17.8 16.4 102 107 2.75 13.82 16.36 0 0 0.73* 0.01* 10,559
Lockheed Martin Corporation LMT N 236.23 225.00 245-186 12/15 11.45 11.90 13.65 19.9 17.3 114 113 1.28 8.10 23.64 0 0 1.61* 0.01* 71,997
Moog MOG.A N 53.93 49.00 72-39 09/15 3.47 3.35 4.02 16.1 13.4 92 87 5.39 18.27 -21.84 0 0 0.0 1,951
Northrop Grumman Corporation NOC N 212.67 198.00 218-157 12/15 10.39 10.62 11.66 20.0 18.2 115 119 2.09 10.70 32.97 0 0 0.82* 0.00* 38,377
Orbital ATK Inc. OA O 87.03 100.00 95-68 12/15 5.02 5.60 6.40 15.5 13.6 89 89 -0.09 7.78 17.02 0.29* 0.00* 5,096
Raytheon Company RTN O 129.67 138.00 132-96 12/15 6.72 7.14 7.93 18.2 16.4 104 106 1.99 3.81 25.27 0 0 0.73* 0.01* 38,509
Rockwell Collins, Inc. COL N 88.40 91.00 96-78 09/15 5.19 5.45 5.76 16.2 15.3 93 100 -1.01 -0.90 -6.96 0 0 0.38* 0.00* 11,509
Spirit AeroSystems** SPR O 46.78 57.00 57-41 12/15 3.92 4.53 4.94 10.3 9.5 59 62 -0.95 1.30 -14.95 0 0 0.0 6,193
TransDigm TDG O 263.54 270.00 264-187 09/15 9.01 11.30 11.90 23.3 22.1 134 144 16.87 19.99 15.46 0 0 0.0 13,962
Triumph Group Inc TGI O 37.73 44.00 69-24 03/16 5.35 5.05 5.63 7.5 6.7 43 44 5.63 18.76 -43.35 0 0 0.04* 0.00* 1,868
Woodward Inc WWD N 56.94 49.00 57-40 09/15 2.75 2.70 3.23 21.1 17.7 121 115 3.58 15.31 10.01 0 -1 0.10* 0.00* 3,479
Computer Services & IT Consulting
CACI International, Inc.** CACI O 100.77 115.00 110-74 06/15 5.17 5.53 6.53 18.2 15.4 104 101 3.35 -0.54 17.23 0 0.00 0.0 2,451
Leidos LDOS N 49.40 53.00 59-38 12/15 2.88 2.84 3.05 17.4 16.2 100 105 -0.58 7.95 15.50 0 0.00 0.0 3,590
ManTech International Corp. MANT N 35.93 34.00 36-25 12/15 1.35 1.47 1.57 24.4 22.9 140 149 3.25 22.96 25.06 0 NA 0.21* 0.01* 1,355
O=OUTPERFORM N=NEUTRAL U=UNDERPERFORM R=RESTRICTED [V]=VOLATILE
1Fiscal estimates reflect company fiscal year-end.
* Data reflect current quarter, not actual year.
Note: Boldface type indicates analyst's top stock picks.
**Denotes analyst's new top stock pick.

Ju
ne 2
016
Ind
ustry
Valu
atio
n T
ab
les
77
Industrials Airfreight & Ground Transport Allison Landry (212) 325-3716
Target Fiscal Annual EPS P/E vs. % 5 Yr. Indicated Mkt
05/31 Price 52-Wk Year Estimate1 ABS P/E S&P 500 Total Returns Growth Dividend Value
Air Freight & Couriers Tkr Rating Price 12 m Range End FYA FY1 FY2 FY1 FY2 FY1 FY2 1 Mon. 3 Mons. 12 Mons. EPS Div Rate Yld (Mil.)
FedEx Corporation FDX O 164.97 185.00 185-123 05/15 8.98 10.85 12.13 15.2 13.6 87 89 -1.56 14.67 -5.93 0 0.00 0.0 44,282
United Parcel Service Inc. UPS N 103.09 111.00 107-89 12/15 5.44 5.85 6.35 17.6 16.2 101 106 -1.59 3.48 3.63 0 0 0.78* 0.01* 90,994
Leasing & Logistics
CH Robinson CHRW U 74.98 68.00 76-61 12/15 3.51 3.72 3.96 20.2 18.9 116 123 4.41 4.85 20.72 0 0 * * 10,705
Echo Global Logistics ECHO O 22.66 29.00 34-17 12/15 1.15 1.26 1.57 18.0 14.4 103 94 -5.82 -12.98 -30.32 0 0.00 0.0 683
Expeditors International of Washington EXPD U 48.55 45.00 52-42 12/15 2.40 2.35 2.53 20.6 19.2 118 125 -3.40 4.10 4.76 0 0 0.36* 0.01* 8,839
Landstar System Inc. LSTR N 67.85 63.00 73-54 12/15 3.37 3.16 3.57 21.5 19.0 123 124 2.79 11.14 3.19 0 0.08* 0.00* 2,872
XPO Logistics, Inc. XPO O [V] 29.26 38.00 50-20 12/15 -0.65 0.69 1.51 42.4 19.3 243 126 -5.67 19.67 -39.93 0 0.00 0.0 3,219
Railroads
Canadian National CNI N 59.29 64.00 66-48 12/15 4.45 4.44 4.83 13.4 12.3 100 104 -3.64 2.38 0.53 0 0 0.38* 0.00* 60,403
Canadian Pacific Railways CP O 129.59 163.00 170-104 12/15 10.12 10.91 12.61 11.9 10.3 89 87 -10.90 6.24 -22.50 0 0 0.35* 0.00* 25,927
CSX Corporation CSX O 26.43 28.00 36-22 12/15 2.00 1.71 1.95 15.5 13.6 89 88 -3.47 6.14 -22.81 0 0 0.18* 0.01* 25,264
Genesee & Wyoming, Inc. GWR O 60.07 71.00 85-45 12/15 3.70 3.58 3.75 16.8 16.0 96 104 -8.86 0.13 -27.46 0 7.00* 0.12* 2,757
Kansas City Southern KSU N 93.10 96.00 101-64 12/15 4.50 4.61 5.20 20.2 17.9 116 117 -2.25 7.73 0.63 0 0 0.33* 0.00* 10,054
Norfolk Southern NSC O 84.06 97.00 98-67 12/15 5.10 5.69 6.40 14.8 13.1 85 86 -7.34 9.17 -9.38 0 0 0.59* 0.01* 24,860
Union Pacific UNP O 84.19 94.00 102-69 12/15 5.49 5.18 5.93 16.2 14.2 93 92 -4.46 5.22 -17.40 0 0 0.55* 0.01* 70,807
Trucking
JB Hunt Transport Services JBHT O 82.72 96.00 89-65 12/15 3.66 4.10 4.70 20.2 17.6 116 114 -0.82 5.35 -1.11 0 0 0.20* 0.00* 9,329
Knight Transportation KNX O 26.12 28.00 30-21 12/15 1.49 1.29 1.50 20.3 17.4 116 113 -2.25 4.65 -8.32 0 0 0.06* 0.00* 2,095
Old Dominion Freight Line ODFL O 64.35 71.00 74-51 12/15 3.57 3.67 4.18 17.6 15.4 101 100 -2.50 -4.30 -5.94 0 0.00 0.0 5,369
Werner Enterprises, Inc. WERN N 24.89 26.00 29-21 12/15 1.71 1.52 1.72 16.3 14.5 94 94 -2.16 -6.11 -9.23 0 0.05* 0.00* 1,793
YRC Worldwide, Inc. YRCW R [V] 9.21 R 21-7 NA R R R R R R #N/A 4.19 -30.23 R R * * 306
O=OUTPERFORM N=NEUTRAL U=UNDERPERFORM R=RESTRICTED [V]=VOLATILE
1Fiscal estimates reflect company fiscal year-end.
* Data reflect current quarter, not actual year.
Note: Boldface type indicates analyst's top stock picks.

Ju
ne 2
016
Ind
ustry
Valu
atio
n T
ab
les
78
Industrials Airlines Julie Yates (212) 325-3706
Target Fiscal Annual EPS P/E vs. % 5 Yr. Indicated Mkt
05/31 Price 52-Wk Year Estimate1 ABS P/E S&P 500 Total Returns Growth Dividend Value
Airlines Tkr Rating Price 12 m Range End FYA FY1 FY2 FY1 FY2 FY1 FY2 1 Mon. 3 Mons. 12 Mons. EPS Div Rate Yld (Mil.)
Alaska Air Group, Inc. ALK N 66.40 82.00 86-61 12/15 6.55 7.34 7.75 9.0 8.6 52 56 -5.86 -15.14 0.47 0 0 0.28* 0.00* 8,184
Allegiant Travel Company ALGT N 139.02 166.00 232-136 12/15 12.95 13.81 14.86 10.1 9.4 58 61 -12.68 -19.52 -12.86 0 0.70* 0.01* 2,298
American Airlines Group Inc. AAL O 31.91 47.00 47-31 12/15 8.90 5.49 6.07 5.8 5.3 33 34 -7.32 -23.81 -27.77 0 0.10* 0.00* 18,449
Delta Air Lines, Inc. DAL O 43.46 58.00 52-40 12/15 4.64 6.51 7.03 6.7 6.2 38 40 3.06 -10.92 -2.01 0 1 0.14* 0.00* 33,533
JetBlue Airways Corporation JBLU N 17.93 19.00 27-18 12/15 1.98 2.13 2.24 8.4 8.0 48 52 -9.63 -19.42 -13.38 0 0.00 0.0 5,774
Southwest Airlines Co. LUV O 42.48 60.00 50-32 12/15 3.51 4.29 5.33 9.9 8.0 57 52 -3.48 1.07 12.23 0 0 0.11* 0.00* 27,131
Spirit Airlines, Inc. SAVE N 43.47 44.00 66-34 12/15 4.38 3.82 4.34 11.4 10.0 65 65 -0.80 -13.30 -33.49 0 0.00 0.0 3,095
United Continental Holdings, Inc. UAL O 45.09 64.00 62-44 12/15 11.90 8.65 8.47 5.2 5.3 30 35 -3.36 -22.71 -19.93 0 0.00 0.0 15,137
Virgin America Inc. VA N [V] 55.98 57.00 56-27 12/15 4.54 3.72 4.23 15.0 13.2 86 86 0.11 84.08 93.10 0 0 0.0 2,862
O=OUTPERFORM N=NEUTRAL U=UNDERPERFORM R=RESTRICTED [V]=VOLATILE
1Fiscal estimates reflect company fiscal year-end.
* Data reflect current quarter, not actual year.
Note: Boldface type indicates analyst's top stock pick.

Ju
ne 2
016
Ind
ustry
Valu
atio
n T
ab
les
79
Industrials Electrical Equipment & Multi-Industry
Julian Mitchell (212) 325-6668
Ronnie Weiss (212) 538-6404
Target Fiscal Annual EPS P/E vs. % 5 Yr. Indicated Mkt
05/31 Price 52-Wk Year Estimate1 ABS P/E S&P 500 Total Returns Growth Dividend Value
Aerospace & Defense Tkr Rating Price 12 m Range End FYA FY1 FY2 FY1 FY2 FY1 FY2 1 Mon. 3 Mons. 12 Mons. EPS Div Rate Yld (Mil.)
Honeywell International Inc. HON N 113.83 114.00 116-92 12/15 6.10 6.67 7.26 17.1 15.7 98 102 -0.73 5.42 9.39 0 0 0.61* 0.01* 86,752
United Technologies Corp UTX N 100.58 109.00 119-85 12/15 6.30 6.55 6.88 15.4 14.6 88 95 -3.63 4.65 -14.03 0 0 0 0.0 84,158
Electrical Equipment
Allegion ALLE O 67.64 77.00 68-54 12/15 3.03 3.35 3.85 20.2 17.6 116 114 1.71 4.32 9.03 0 0 11.51* 0.17* 6,475
Eaton Corporation ETN O 61.63 69.00 73-47 12/15 4.30 4.15 4.51 14.8 13.7 85 89 -2.88 6.57 -13.90 0 0 0.57* 0.01* 28,229
Emerson EMR O 52.02 59.00 60-42 12/15 3.18 3.08 3.35 16.9 15.5 97 101 -5.78 2.42 -13.65 0 0 0.48* 0.01* 33,467
ExOne XONE U [V] 10.52 9.00 15-6 12/15 -1.79 -1.05 -0.60 NM NM NM NM -13.06 -3.13 -13.13 0 -6.00 -0.6 169
General Electric GE O 30.23 34.00 32-23 12/15 1.31 1.48 1.77 20.4 17.1 117 111 -2.14 0.03 10.81 0 0 * * 280,690
Ingersoll-Rand Plc IR O 66.81 72.00 70-49 12/15 3.73 4.08 4.48 16.4 14.9 94 97 1.01 16.05 -3.16 0 0 0.32* 0.00* 17,201
Lennox International LII N 137.35 130.00 142-107 12/15 5.14 6.61 7.17 20.8 19.1 119 125 1.17 6.88 21.08 0 0 0.36* 0.00* 5,989
Luxfer LXFR O 13.22 16.00 14-9 12/15 1.08 1.12 1.27 11.8 10.4 68 68 3.12 22.41 6.18 0 0 0.13* 0.01* 357
Materialise MTLS O 7.11 12.00 10-5 12/15 -0.06 0.04 0.22 168.8 31.7 870 185 -3.13 -11.57 -16.06 * * 309
Rockwell Automation ROK N 116.05 108.00 127-90 09/15 6.40 5.97 6.30 19.4 18.4 111 120 2.48 8.48 -6.28 0 0 0.56* 0.00* 15,320
SPX SPXC O 16.57 19.00 19-8 12/15 1.89 1.14 1.35 14.6 12.2 84 80 1.41 28.35 -11.45 0 0.0 696
SPX Flow, Inc. FLOW N [V] 29.97 27.00 41-16 12/15 3.36 1.96 2.32 15.3 12.9 88 84 -1.54 50.45 0 0.00 0.0 1,249
Tyco International, Ltd TYC N 42.62 36.00 43-30 09/15 1.74 2.07 2.20 20.6 19.4 118 126 11.22 18.00 5.84 0 0 0.21* 0.00* 18,135
Electronic Equipment & Instruments
Johnson Controls Inc.** JCI O 44.15 50.00 54-34 09/15 3.42 3.90 4.26 11.3 10.4 65 67 7.42 16.83 -16.22 0 0 0.30* 0.01* 28,605
Industrial Machinery
Danaher Corporation DHR N 98.36 95.00 100-82 12/15 4.30 4.90 5.31 20.1 18.5 115 121 1.00 8.29 13.19 0 1 0.16* 0.00* 67,740
Kennametal Inc. KMT N 24.48 24.00 36-16 06/15 2.02 1.10 1.41 22.3 17.3 128 113 3.25 14.23 -31.26 0 0 0.20* 0.01* 1,951
Valmont Industries VMI U 138.32 115.00 144-94 12/15 5.63 6.34 7.02 21.8 19.7 125 128 -1.38 19.36 11.16 0 0 0.38* 0.00* 3,138
Multi-Industry
3M MMM O 168.32 178.00 170-137 12/15 7.58 8.26 9.03 20.4 18.6 117 121 -0.01 5.61 5.87 0 0 1.11* 0.01* 102,089
Cubic Corporation CUB O 40.80 54.00 50-31 09/15 0.85 1.32 2.61 31.0 15.6 178 102 -1.99 11.66 -16.43 0 0 0.14 0.0 1,101
Dover Corporation DOV O 66.75 73.00 76-53 12/15 3.74 3.46 3.98 19.3 16.8 110 109 1.91 6.89 -11.20 0 0 0.00 0.0 10,356
Milacron Holdings Corp. MCRN N [V] 16.40 18.00 21-12 12/15 1.64 1.48 1.61 11.1 10.2 63 66 -3.98 13.34 0 0.0 1,102
Regal Beloit RBC O 57.13 64.00 78-49 12/15 5.33 4.60 4.68 12.4 12.2 71 79 -12.16 -0.02 -26.34 0 0 0.27* 0.00* 2,555
Rexnord Corporation RXN O 20.74 24.00 27-15 03/16 1.47 1.50 1.69 13.8 12.2 79 80 -5.64 9.56 -19.27 0 6.00* 0.29* 2,109
Textron TXT O 38.06 45.00 46-31 12/15 2.50 2.68 2.98 14.2 12.8 81 83 -2.44 13.14 -15.70 0 0 0.00 0.0 10,232
O=OUTPERFORM N=NEUTRAL U=UNDERPERFORM R=RESTRICTED [V]=VOLATILE
1Fiscal estimates reflect company fiscal year-end.
* Data reflect current quarter, not actual year.
Note: Boldface type indicates analyst's top stock picks.
**Denotes analyst's new top stock pick.

Ju
ne 2
016
Ind
ustry
Valu
atio
n T
ab
les
80
Industrials Engineering & Construction Jamie Cook (212) 538-6098
Target Fiscal Annual EPS P/E vs. % 5 Yr. Indicated Mkt
05/31 Price 52-Wk Year Estimate1 ABS P/E S&P 500 Total Returns Growth Dividend Value
Engineering & Construction Tkr Rating Price 12 m Range End FYA FY1 FY2 FY1 FY2 FY1 FY2 1 Mon. 3 Mons. 12 Mons. EPS Div Rate Yld (Mil.)
AECOM ACM O 32.11 35.00 35-23 09/15 3.08 3.20 3.35 10.0 9.6 58 62 -2.13 9.59 -4.26 0 0 0.0 4,925
Babcock & Wilcox Enterprises BW N [V] 21.75 22.00 24-16 12/15 1.25 1.37 1.45 15.8 15.0 91 98 -4.52 13.05 0 0 0.0 1,102
Chicago Bridge & Iron CBI O [V] 38.24 51.00 57-32 12/15 5.86 5.00 4.75 7.7 8.0 44 52 -3.14 7.33 -31.22 0 0 0.00 0.0 4,026
Fluor FLR O 52.78 62.00 57-41 12/15 2.86 3.45 3.35 15.3 15.8 88 103 -4.00 7.96 -6.58 0 NA 0.60* 0.01* 7,349
Jacobs Engineering JEC O 50.69 53.00 51-35 09/15 3.26 3.10 3.25 16.3 15.6 94 101 12.95 24.91 16.66 0 0 0.0 6,180
KBR Inc. KBR O 14.55 18.00 21-12 12/15 1.52 1.35 1.15 10.8 12.6 62 82 -3.13 1.46 -24.34 0 0.00 0.0 2,072
McDermott International MDR N [V] 4.75 4.41 6-2 12/15 0.23 0.06 0.10 77.5 49.7 444 323 6.98 23.38 -13.95 0 0.00 0.0 1,142
Quanta Services PWR O 24.03 26.00 30-17 12/15 1.11 1.75 1.95 13.7 12.3 79 80 0.46 11.72 -18.54 0 0 0.0 3,629
Willbros Group Inc. WG U [V] 3.24 1.90 3-1 12/15 0.54 -0.20 0.10 NM 32.5 NM 212 -0.61 78.02 92.86 * * 203
Trading Companies & Distributors
Fastenal Co FAST N 46.03 44.00 50-36 12/15 1.78 1.80 1.92 25.5 24.0 146 156 -2.11 -2.06 10.44 0 0 * * 13,281
HD Supply HDS O 35.30 35.00 37-22 01/15 0.90 1.74 2.46 20.2 14.3 116 93 1.00 22.57 7.25 0 0 0.0 7,082
MSC Industrial Direct Co. MSM N 74.95 70.00 78-55 08/15 3.77 3.65 3.90 20.5 19.2 118 125 -2.54 6.64 7.62 0 0 0.43* 0.01* 4,600
NOW Inc. DNOW N 17.34 18.00 23-12 12/15 -0.60 -1.77 -0.47 NM NM NM NM -3.13 -2.47 -24.11 0 0.00 0.0 1,863
Univar Inc. UNVR N [V] 18.66 18.00 27-11 12/15 0.14 0.77 1.03 24.3 18.1 140 118 5.19 12.82 0 0 0.0 2,575
W. W. Grainger, Inc. GWW O 228.35 253.00 245-183 12/15 11.92 12.15 13.30 18.8 17.2 108 112 -2.60 2.99 -5.25 0 0 1.18* 0.01* 14,003
Wesco International WCC O 58.33 65.00 74-36 12/15 4.19 3.98 4.30 14.7 13.6 84 88 -2.03 23.58 -19.47 0 0.00 0.0 2,462
O=OUTPERFORM N=NEUTRAL U=UNDERPERFORM R=RESTRICTED [V]=VOLATILE
1Fiscal estimates reflect company fiscal year-end.
* Data reflect current quarter, not actual year.
Note: Boldface type indicates analyst's top stock picks.
Industrials Environmental Services Andrew Buscaglia (212) 325-5870
Target Fiscal Annual EPS P/E vs. % 5 Yr. Indicated Mkt
05/31 Price 52-Wk Year Estimate1 ABS P/E S&P 500 Total Returns Growth Dividend Value
Environmental Services Tkr Rating Price 12 m Range End FYA FY1 FY2 FY1 FY2 FY1 FY2 1 Mon. 3 Mons. 12 Mons. EPS Div Rate Yld (Mil.)
Covanta Holding Corp CVA N 16.67 16.00 23-13 12/15 0.07 0.12 0.27 140.5 61.1 805 398 2.96 10.32 -24.60 1 0 0.25* 0.01* 2,177
Progressive Waste Solutions Ltd. BIN N 31.61 66.46 70-32 12/15 1.25 1.30 1.40 24.4 22.6 140 147 -53.18 -50.13 -45.43 0 0 0.26* 0.01* 1,664
Republic Services, Inc. RSG N 48.28 50.00 49-39 12/15 2.06 2.15 2.34 22.5 20.6 129 134 1.51 2.27 19.74 0 0 0.30* 0.01* 16,603
Waste Connections, Inc. WCN O 65.47 75.00 70-46 12/15 1.98 2.12 2.45 30.9 26.8 177 174 -3.61 2.60 35.13 0 0 0.13* 0.00* 8,034
Waste Management, Inc. WM O 60.95 65.00 62-46 12/15 2.61 2.82 3.11 21.6 19.6 124 127 1.62 6.43 22.54 0 0 0.41* 0.01* 27,101
O=OUTPERFORM N=NEUTRAL U=UNDERPERFORM R=RESTRICTED [V]=VOLATILE
1Fiscal estimates reflect company fiscal year-end.
* Data reflect current quarter, not actual year.
Note: Boldface type indicates analyst's top stock pick.

Ju
ne 2
016
Ind
ustry
Valu
atio
n T
ab
les
81
Industrials Machinery Jamie Cook (212) 538-6098
Target Fiscal Annual EPS P/E vs. % 5 Yr. Indicated Mkt
05/31 Price 52-Wk Year Estimate1 ABS P/E S&P 500 Total Returns Growth Dividend Value
Construction & Farm Machinery Tkr Rating Price 12 m Range End FYA FY1 FY2 FY1 FY2 FY1 FY2 1 Mon. 3 Mons. 12 Mons. EPS Div Rate Yld (Mil.)
AGCO Corp AGCO N 51.93 53.00 58-44 12/15 3.25 2.30 2.50 22.6 20.8 130 135 -2.46 1.70 3.14 0 0 0.13* 0.00* 4,283
Caterpillar Inc. CAT O 72.51 87.00 88-58 12/15 5.47 3.50 3.75 20.7 19.3 119 126 -6.85 1.06 -15.22 0 0 * * 42,338
Deere & Co. DE O 82.29 87.00 97-72 10/15 5.78 3.85 4.00 21.4 20.6 122 134 -2.37 -1.65 -11.17 0 0 0.60* 0.01* 25,860
Terex Corporation TEX R [V] 21.18 R 27-14 12/14 2.33 R R R R R R R -7.79 -15.18 R R 0.05* 0.00* 2,313
The Manitowoc Company, Inc MTW N [V] 5.70 5.50 6-3 12/15 1.03 0.12 0.23 46.2 25.0 265 163 -1.21 59.22 39.75 0 0 0.0 781
Industrial Machinery
Allison Transmission ALSN O 28.09 33.00 31-22 12/15 1.03 1.14 1.27 24.7 22.1 141 144 -2.23 12.09 -8.17 0 0 * * 4,767 Cummins Inc. CMI O 114.47 130.00 138-84 12/15 9.00 8.15 7.30 14.0 15.7 80 102 -1.77 13.06 -15.35 0 0 0.98* 0.01* 19,500 Illinois Tool Works, Inc. ITW N 106.03 106.00 106-80 12/15 5.13 5.50 6.00 19.3 17.7 111 115 1.01 9.80 13.06 0 -1 0.49* 0.00* 38,262 Oshkosh Corporation OSK U 45.91 42.00 52-30 09/15 3.03 2.70 3.50 17.0 13.1 98 85 -5.98 25.71 -8.67 0 0.17* 0.00* 3,368 Paccar Inc PCAR N 55.75 58.00 64-44 12/15 4.51 4.00 3.65 13.9 15.3 80 100 -4.98 3.13 -10.34 0 -1 * * 19,538 Parker Hannifin Corporation PH O 114.84 126.00 121-87 06/15 7.24 6.25 6.60 18.4 17.4 105 113 -0.57 7.65 -4.67 0 0 0.63* 0.01* 15,638 Rush Enterprises, Inc. RUSHA N 22.02 19.00 28-15 12/15 1.66 1.10 1.35 20.1 16.4 115 107 13.10 19.61 -20.85 0 0.00 0.0 927
O=OUTPERFORM N=NEUTRAL U=UNDERPERFORM R=RESTRICTED [V]=VOLATILE
1Fiscal estimates reflect company fiscal year-end.
* Data reflect current quarter, not actual year.
Note: Boldface type indicates analyst’s top stock pick.
Industrials Ocean Shipping Gregory Lewis (212) 325-6418
Target Fiscal Annual EPS P/E vs. % 5 Yr. Indicated Mkt
05/31 Price 52-Wk Year Estimate1 ABS P/E S&P 500 Total Returns Growth Dividend Value
Leasing & Logistics Tkr Rating Price 12 m Range End FYA FY1 FY2 FY1 FY2 FY1 FY2 1 Mon. 3 Mons. 12 Mons. EPS Div Rate Yld (Mil.)
World Fuel Svc INT N 45.97 45.00 51-34 12/15 2.69 2.80 3.10 16.4 14.8 94 96 -2.13 -5.04 -7.67 0.06* 0.00* 3,366
Marine
Costamare Inc. CMRE N [V] 9.84 9.00 20-6 12/15 1.67 1.60 1.65 6.1 6.0 35 39 4.13 10.19 -49.72 0.29* 0.03* 738 Danaos Corporation DAC N 3.50 4.00 7-3 12/15 1.37 1.64 1.64 2.1 2.1 12 14 -6.91 -16.67 -46.65 0 0.0 384 Diana Shipping DSX N [V] 2.61 3.00 8-2 12/15 -0.89 -1.67 -1.37 NM NM NM NM -24.35 -2.25 -59.35 0 0 0.0 221 Dynagas LNG Partners LP DLNG O [V] 14.29 15.00 19-7 12/15 1.61 1.75 1.72 8.2 8.3 47 54 -3.25 42.05 -25.50 0 1 0.42* 0.03* 508 Euronav NV EURN O 10.51 20.00 16-10 12/15 2.22 2.30 2.40 4.6 4.4 26 28 -4.28 5.31 -22.44 0.82* 0.08* 1,673 Frontline FRO N [V] 8.88 10.00 17-7 12/15 0.80 1.10 1.10 8.1 8.1 46 53 6.86 -0.78 -35.18 0.16* 0.02* 1,389 GasLog Partners LP GLOP O [V] 20.32 20.00 26-10 12/15 2.25 2.17 2.40 9.4 8.5 54 55 9.36 20.52 -20.63 0.48* 0.02* 656 Golar LNG Ltd. GLNG O [V] 17.40 30.00 51-10 12/15 -1.64 -1.62 -0.27 NM NM NM NM 1.87 -4.34 -63.95 0.05* 0.00* 1,623 Safe Bulkers Inc SB N [V] 1.14 1.00 4-0 12/15 -0.44 -0.67 -0.32 NM NM NM NM -0.87 64.03 -65.97 0.01* 0.01* 95 Scorpio Bulkers Inc. SALT N [V] 3.97 3.00 30-2 12/15 -3.58 -2.78 -1.54 NM NM NM NM 5.59 2.06 -86.22 0 0.0 197 Scorpio Tankers Inc. STNG O 5.88 10.00 12-5 12/15 1.21 0.70 1.19 8.4 4.9 48 32 -6.67 -1.51 -36.91 1 0 0.0 1,017 Seaspan Corporation SSW N 14.99 16.00 21-14 12/15 1.12 1.20 1.20 12.5 12.5 72 81 -10.29 -15.79 -25.20 0.38* 0.03* 1,563 Teekay Corporation TK N [V] 10.52 6.00 48-5 12/15 0.99 0.86 0.64 12.3 16.4 70 107 -2.14 25.54 -77.73 0.06* 0.01* 765 Teekay Tankers LTD. TNK O [V] 3.54 8.00 8-3 12/15 1.32 1.50 1.60 2.4 2.2 13 14 -11.50 -6.84 -53.60 1 0 0.09* 0.03* 545 Tsakos Energy Navigation Ltd TNP O [V] 6.47 13.00 10-5 12/15 1.66 1.79 2.00 3.6 3.2 21 21 1.41 4.69 -32.88 0.08* 0.01* 557
O=OUTPERFORM N=NEUTRAL U=UNDERPERFORM R=RESTRICTED [V]=VOLATILE
1Fiscal estimates reflect company fiscal year-end.
* Data reflect current quarter, not actual year.
Note: Boldface type indicates analyst's top stock pick.

Ju
ne 2
016
Ind
ustry
Valu
atio
n T
ab
les
82
Industrials SMID-Cap Aerospace & Defense Julie Yates (212) 325-3706
Target Fiscal Annual EPS P/E vs. % 5 Yr. Indicated Mkt
05/31 Price 52-Wk Year Estimate1 ABS P/E S&P 500 Total Returns Growth Dividend Value
Aerospace & Defense Tkr Rating Price 12 m Range End FYA FY1 FY2 FY1 FY2 FY1 FY2 1 Mon. 3 Mons. 12 Mons. EPS Div Rate Yld (Mil.)
Allegheny Technologies, Inc ATI O 14.18 45.00 37-14 12/13 1.43 0.21 1.50 67.1 9.4 466 61 -23.68 -52.01 -61.78 0 0 0.18* 0.01* 1,900
Carpenter Technology Corp CRS O 29.77 60.00 53-29 06/14 2.48 2.34 3.42 12.7 8.7 81 62 -20.66 -24.77 -34.06 0 NA 0.18* 0.01* 1,667
Haynes International, Inc. HAYN N 37.84 58.00 52-35 09/13 1.75 0.02 2.16 2358.4 17.5 12,785 105 1.34 -23.59 -17.72 0 0 0.22* 0.01* 451
RTI International Metals RTI N 28.26 30.00 40-21 12/13 0.51 0.99 1.60 28.6 17.6 162 110 NA -10.14 14.60 1 0 0.0 870
O=OUTPERFORM N=NEUTRAL U=UNDERPERFORM R=RESTRICTED [V]=VOLATILE
1Fiscal estimates reflect company fiscal year-end.
* Data reflect current quarter, not actual year.
Note: Boldface type indicates analyst's top stock picks.
Industrials Trading Companies & Distributors Jamie Cook (212) 538-6098
Target Fiscal Annual EPS P/E vs. % 5 Yr. Indicated Mkt
05/31 Price 52-Wk Year Estimate1 ABS P/E S&P 500 Total Returns Growth Dividend Value
Trading Companies & Distributors Tkr Rating Price 12 m Range End FYA FY1 FY2 FY1 FY2 FY1 FY2 1 Mon. 3 Mons. 12 Mons. EPS Div Rate Yld (Mil.)
Fastenal Co FAST N 46.03 44.00 50-36 12/15 1.78 1.80 1.92 25.5 24.0 146 156 -2.11 -2.06 10.44 0 0 * * 13,281
HD Supply HDS O 35.30 35.00 37-22 01/15 0.90 1.74 2.46 20.2 14.3 116 93 1.00 22.57 7.25 0 0.00 0.0 7,082
MSC Industrial Direct Co. MSM N 74.95 70.00 78-55 08/15 3.77 3.65 3.90 20.5 19.2 118 125 -2.54 6.64 7.62 0 0 0.43* 0.01* 4,600
NOW Inc. DNOW N 17.34 18.00 23-12 12/15 -0.60 -1.77 -0.47 NM NM NM NM -3.13 -2.47 -24.11 0 0.00 0.0 1,863
Univar Inc. UNVR N [V] 18.66 18.00 27-11 12/15 0.14 0.77 1.03 24.3 18.1 140 118 5.19 12.82 0 0.00 0.0 2,575
W. W. Grainger, Inc. GWW O 228.35 253.00 245-183 12/15 11.92 12.15 13.30 18.8 17.2 108 112 -2.60 2.99 -5.25 0 0 1.18* 0.01* 14,003
Wesco International WCC O 58.33 65.00 74-36 12/15 4.19 3.98 4.30 14.7 13.6 84 88 -2.03 23.58 -19.47 0 0 0.0 2,462
O=OUTPERFORM N=NEUTRAL U=UNDERPERFORM R=RESTRICTED [V]=VOLATILE
1Fiscal estimates reflect company fiscal year-end.
* Data reflect current quarter, not actual year.
Note: Boldface type indicates analyst's top stock picks.

Ju
ne 2
016
Ind
ustry
Valu
atio
n T
ab
les
83
Materials Metals & Materials, Canada Ralph Profiti (416) 352-4563
Target Fiscal Annual EPS P/E vs. % 5 Yr. Indicated Mkt
05/31 Price 52-Wk Year Estimate1 ABS P/E S&P 500 Total Returns Growth Dividend Value
Diversified Metals & Mining Tkr Rating Price 12 m Range End FYA FY1 FY2 FY1 FY2 FY1 FY2 1 Mon. 3 Mons. 12 Mons. EPS Div Rate Yld (Mil.)
Cameco Corporation(C$) CCO N 15.28 19.00 19-15 12/15 0.88 0.86 1.07 17.8 14.2 96 93 -1.23 -9.75 -19.24 0 NA 0.10* 0.01* 6,048
Capstone Mining Corp.(C$) CS N [V] 0.67 0.40 1-0 12/15 -0.08 -0.05 -0.16 NM NM NM NM -15.19 17.54 -45.97 0.00 0.0 198
Denison Mines Corp.(C$) DML N [V] 0.63 0.80 1-0 12/15 -0.20 -0.02 -0.01 NM NM NM NM -16.00 -3.08 -38.83 0 0.00 0.0 250
First Quantum Minerals Ltd.(C$) FM N [V] 8.60 9.00 18-2 12/15 0.39 0.20 0.02 43.4 513.0 180 2576 -19.17 29.52 -47.21 0 0 0.0 4,487
HudBay Minerals Inc.(C$) HBM O [V] 5.08 7.00 12-2 12/15 0.00 -0.06 -0.14 NM NM NM NM -16.31 -0.59 -55.16 0 0 0.01* 0.00* 914
Labrador Iron Ore Royalty Corporation(C$)
LIF N [V] 11.80 15.00 17-7 12/15 0.83 0.31 -0.28 37.6 NM 204 NM -16.96 6.50 -26.98 0 0.25* 0.02* 755
Lundin Mining Corp.(C$) LUN O [V] 4.35 6.00 6-3 12/15 -0.37 -0.09 -0.08 NM NM NM NM -5.43 9.02 -22.74 0.00 0.0 2,395
Nautilus Minerals Inc(C$) NUS O [V] 0.15 0.25 0-0 12/15 -0.05 -0.02 -0.04 NM NM NM NM -3.23 -28.57 -67.74 0 0 0.0 73
Paladin Energy(C$) PDN U [V] 0.21 0.25 0-0 06/15 0.10 -0.02 0.01 NM 16.7 NM 84 -12.50 10.53 -31.15 0 0.00 0.0 275
Teck Resources Ltd(C$) TCK.B N [V] 12.61 15.00 15-4 12/15 0.33 0.40 0.44 31.6 28.4 172 187 -17.20 29.20 -12.67 0 0 0.05 0.0 7,149
Thompson Creek Metals Co. Inc.(C$) TCM U [V] 0.44 0.30 1-0 12/15 -0.22 -0.21 -0.11 NM NM NM NM -30.16 7.32 -61.74 0 0.0 75
Turquoise Hill Resources Ltd(C$) TRQ N [V] 3.71 4.75 5-2 12/15 0.22 0.00 -0.10 1317.6 NM 5466 NM 0.27 8.16 -31.93 0 0 0.0 5,712
Precious Metals
Pan American Silver Corp.(C$) PAA N [V] 18.53 18.00 21-8 12/15 0.76 0.14 0.15 135.8 124.0 564 623 -2.73 37.26 57.57 0 0 0.01* 0.00* 2,176
Silver Standard Resources Inc.(C$) SSO N [V] 11.84 11.00 13-5 12/15 -0.09 0.26 0.10 46.0 117.6 191 591 1.54 36.25 50.44 0 0.00 0.0 732
Silver Wheaton Corp.(C$) SLW N [V] 24.45 28.00 26-15 12/15 0.53 0.57 0.60 42.5 40.6 176 204 -3.59 13.25 2.17 0 0 0.05* 0.00* 8,231
Tahoe Resources Inc.(C$) THO O [V] 15.66 17.50 18-10 12/15 0.48 0.66 0.70 23.8 22.5 99 113 -10.62 23.40 -9.90 0 0.06* 0.01* 3,555
O=OUTPERFORM N=NEUTRAL U=UNDERPERFORM R=RESTRICTED [V]=VOLATILE
1Fiscal estimates reflect company fiscal year-end.
* Data reflect current quarter, not actual year.
Materials Paper & Packaging Lars Kjellberg 46 8 5450 7926
Target Fiscal Annual EPS P/E vs. % 5 Yr. Indicated Mkt
05/31 Price 52-Wk Year Estimate1 ABS P/E S&P 500 Total Returns Growth Dividend Value
Packaging Tkr Rating Price 12 m Range End FYA FY1 FY2 FY1 FY2 FY1 FY2 1 Mon. 3 Mons. 12 Mons. EPS Div Rate Yld (Mil.)
Avery Dennison Corp AVY N 74.38 79.00 77-56 12/15 3.44 3.84 4.52 19.4 16.5 111 107 0.04 9.00 20.20 0 0 0.41* 0.01* 6,753
Bemis Company, Inc. BMS N 50.34 49.00 54-39 12/15 2.56 2.79 3.17 18.0 15.9 103 103 -0.38 -0.32 9.48 0 0 0.29* 0.01* 4,767
Berry Plastics Group BERY O 39.17 48.00 39-28 09/15 1.70 2.24 2.54 17.5 15.4 100 100 6.53 23.76 16.02 0 0 0.0 4,687
Crown Holdings Inc. CCK N 52.17 58.00 56-44 12/15 3.59 3.90 4.53 13.4 11.5 77 75 -3.16 8.42 -5.68 0 0 0.0 7,277
Multi Packaging Solutions MPSX R [V] 15.82 R 18-14 06/15 0.38 R R R R R R R -1.19 R R 0 0.0 1,186
Owens Illinois OI O 18.90 25.00 25-12 12/15 2.00 2.36 2.63 8.0 7.2 46 47 1.56 24.18 -22.41 0 0.00 0.0 3,060
Sealed Air Corp. SEE O 46.44 63.00 55-38 12/15 2.60 2.60 3.01 17.9 15.4 102 100 -4.54 -0.17 -5.57 0 0 0.16* 0.00* 9,155
WestRock WRK O [V] 39.61 48.00 59-27 09/15 3.86 2.62 2.99 15.1 13.2 87 86 6.27 16.54 0 0 0.38* 0.01* 10,006
Paper Products
International Paper Co. IP N 42.16 47.00 52-33 12/15 3.65 3.46 3.77 12.2 11.2 70 73 -2.99 10.05 -18.64 0 0 0.44* 0.01* 17,335
O=OUTPERFORM N=NEUTRAL U=UNDERPERFORM R=RESTRICTED [V]=VOLATILE
1Fiscal estimates reflect company fiscal year-end.
* Data reflect current quarter, not actual year.
Note: Boldface type indicates analyst's top stock picks.

Ju
ne 2
016
Ind
ustry
Valu
atio
n T
ab
les
84
Materials Precious Metals Anita Soni (416) 352-4587
Target Fiscal Annual EPS P/E vs. % 5 Yr. Indicated Mkt
05/31 Price 52-Wk Year Estimate1 ABS P/E S&P 500 Total Returns Growth Dividend Value
Precious Metals Tkr Rating Price 12 m Range End FYA FY1 FY2 FY1 FY2 FY1 FY2 1 Mon. 3 Mons. 12 Mons. EPS Div Rate Yld (Mil.)
Agnico Eagle Mines Limited AEM O [V] 44.92 50.00 48-21 12/15 0.16 0.54 0.94 82.8 47.6 475 310 -3.93 30.77 39.94 0 0 0.08* 0.00* 10,095
Alamos Gold Inc. AGI N [V] 6.40 7.25 7-2 12/15 -0.17 0.07 0.14 91.5 45.2 524 294 -9.48 24.76 0 0 0.01* 0.00* 1,686
AuRico Gold Inc. AUQ N [V] 2.86 3.00 3-3 12/14 -0.15 -0.11 0.01 NM 324.7 NM 2114 NA NA -12.00 0 0.04* 0.02* 806
Barrick Gold Corp ABX O [V] 16.77 17.00 19-6 12/15 0.30 0.64 0.90 26.1 18.6 150 121 -12.24 20.56 41.88 0 0 0.02* 0.00* 19,541
Detour Gold Corporation(C$) DGC O [V] 25.91 29.00 29-11 12/15 -0.24 0.32 0.83 79.8 31.2 331 157 -2.92 20.29 94.52 0 0 0.0 3,431
Eldorado Gold EGO O [V] 4.24 6.00 5-2 12/15 0.03 0.14 0.17 31.3 25.2 180 164 1.68 30.86 -11.11 0 0.0 3,038
Franco Nevada Corporation FNV N 63.36 72.00 70-39 12/15 0.57 0.77 0.94 81.8 67.7 469 441 -7.91 9.79 24.02 0 0 0.80* 0.01* 11,440
Goldcorp Inc. GG N [V] 16.82 17.00 20-10 12/15 -0.11 0.33 0.59 50.6 28.7 290 187 -13.74 12.36 -5.08 0 0 0.08* 0.00* 14,266
Golden Star GSS U [V] 0.52 0.40 1-0 12/15 -0.10 0.01 0.13 55.8 4.0 320 26 -26.24 -0.95 55.22 0 0 0.0 135
IAMGold IAG U [V] 3.26 3.00 4-1 12/15 -0.43 -0.03 0.26 NM 12.7 NM 83 -2.69 26.85 61.39 0 -1 0 0.0 1,323
Kinross Gold Corp. KGC N [V] 4.26 5.25 6-1 12/15 -0.08 0.12 0.23 35.4 18.3 203 119 -24.47 38.76 80.51 0 0.00 0.0 5,321
New Gold NGD N [V] 3.83 5.00 5-2 12/15 -0.02 0.05 0.09 82.4 41.0 472 267 -16.01 3.79 19.31 0 0 0.0 1,969
Newmont Mining NEM O [V] 32.41 37.00 36-16 12/15 0.98 1.55 1.83 20.9 17.7 120 115 -5.62 20.84 19.29 0 0 0.13* 0.00* 17,195
Yamana Gold AUY N [V] 4.18 4.50 5-1 12/15 -0.08 0.04 0.01 97.0 349.1 556 2273 -11.25 37.95 17.09 0 0 0.02* 0.00* 3,959
O=OUTPERFORM N=NEUTRAL U=UNDERPERFORM R=RESTRICTED [V]=VOLATILE
1Fiscal estimates reflect company fiscal year-end.
* Data reflect current quarter, not actual year.
Note: Boldface type indicates analyst’s top stock pick.

Ju
ne 2
016
Ind
ustry
Valu
atio
n T
ab
les
85
Materials U.S. Chemicals & Agriculture Christopher Parkinson (212) 538-6286
Target Fiscal Annual EPS P/E vs. % 5 Yr. Indicated Mkt
05/31 Price 52-Wk Year Estimate1 ABS P/E S&P 500 Total Returns Growth Dividend Value
Agricultural Chemicals/Biotech Tkr Rating Price 12 m Range End FYA FY1 FY2 FY1 FY2 FY1 FY2 1 Mon. 3 Mons. 12 Mons. EPS Div Rate Yld (Mil.)
Arcadia Biosciences, Inc. RKDA O [V] 1.51 8.00 9-1 12/14 -0.56 -0.49 -0.30 NM NM NM NM -29.77 -48.81 -81.67 0 0.0 67
DuPont de Nemours and Co. DD N 65.41 67.00 75-47 12/15 3.57 3.15 3.75 20.8 17.4 119 113 -1.00 5.65 -3.89 0.38* 0.01* 57,136
Evogene Ltd. EVGN O 6.84 19.00 10-6 12/14 -0.58 -0.72 -0.69 NM NM NM NM -7.94 -7.69 -30.91 0 0.0 174
Monsanto Company MON R 112.47 R 117-83 NA R R R R R R R 32.41 -3.55 R R * * 49,132
Fertilizers
Agrium Inc. AGU O 90.20 93.00 109-82 12/15 7.26 5.75 6.70 15.7 13.5 90 88 4.88 2.30 -12.70 0.88* 0.01* 12,463
CF Industries Holding Inc. CF O 27.66 38.00 69-28 12/15 3.82 2.50 3.05 11.1 9.1 63 59 -17.04 -23.57 -56.32 0.30* 0.01* 6,447
Compass Minerals Int'l Inc. CMP N 77.95 71.00 88-67 12/15 4.70 3.40 4.10 22.9 19.0 131 124 4.10 11.48 -10.12 0.70* 0.01* 2,633
Intrepid Potash Inc. IPI U [V] 1.27 1.00 12-1 12/15 -0.40 -0.53 -0.24 NM NM NM NM 4.10 33.68 -88.74 0.00 0.0 97
Mosaic Co. MOS N 25.23 22.00 47-22 12/15 2.90 0.85 1.15 29.8 21.9 171 143 -11.54 -11.44 -44.38 1.10* 0.04* 8,826
Potash Corp - Saskatchewan POT U 16.33 12.00 32-15 12/15 1.52 0.65 0.75 25.3 21.9 145 143 -6.58 -12.39 -47.37 0.38* 0.02* 13,703
Major Chemicals
Dow Chemical Company DOW O 51.36 57.00 57-39 12/15 3.51 3.50 4.10 14.7 12.5 84 82 -2.45 3.55 -1.72 0.46* 0.01* 57,617
Specialty Chemicals
Air Products & Chemicals APD O 142.64 161.00 149-116 09/15 6.57 7.50 8.10 19.0 17.6 109 115 -2.21 5.75 -3.26 0.81* 0.01* 30,822
Ashland Inc. ASH O 113.36 122.00 128-89 09/15 7.01 7.05 8.00 16.1 14.2 92 92 0.49 13.50 -11.50 0 0 0.39* 0.00* 7,035
Axalta Coating Systems AXTA R 28.15 R 36-21 12/15 1.05 R R R R R R R 7.12 -19.11 R R 0 0.0 6,722
Ecolab ECL N 117.24 112.00 122-100 12/15 4.37 4.50 5.10 26.0 23.0 149 150 2.60 11.40 1.89 0.35* 0.00* 34,426
FMC Corporation FMC N 47.49 44.00 58-33 12/15 2.52 2.65 3.25 17.9 14.6 103 95 8.87 23.00 -16.10 0.17* 0.00* 6,352
Platform Specialty Products PAH N [V] 9.49 10.00 28-6 12/15 0.63 0.65 0.80 14.6 11.9 84 78 -4.91 21.98 -65.19 0 0.0 2,352
PPG Industries, Inc PPG O 107.68 117.00 118-85 12/15 5.70 6.25 7.15 17.2 15.1 99 98 -3.20 7.36 -5.97 0 0 0.40* 0.00* 28,724
Praxair Inc. PX N 109.86 117.00 124-96 12/15 5.71 5.60 6.05 19.6 18.2 112 118 -6.42 3.80 -10.29 0.75* 0.01* 31,339
Sherwin-Williams Company SHW O 291.09 319.00 300-219 12/15 11.18 12.67 13.72 23.0 21.2 132 138 0.55 7.02 0.99 0 0 0.84* 0.00* 26,924
Valspar VAL N 108.32 106.00 108-71 10/15 4.63 4.90 5.25 22.1 20.6 127 134 1.31 33.83 29.72 0 -1 0.33* 0.00* 8,567
W.R. Grace & Co. GRA O 77.64 86.00 84-63 12/15 4.78 3.05 3.45 25.5 22.5 146 146 -1.12 7.95 -0.79 0 0.00 0.0 5,474
O=OUTPERFORM N=NEUTRAL U=UNDERPERFORM R=RESTRICTED [V]=VOLATILE
1Fiscal estimates reflect company fiscal year-end.
* Data reflect current quarter, not actual year.
Note: Boldface type indicates analyst's top stock pick.
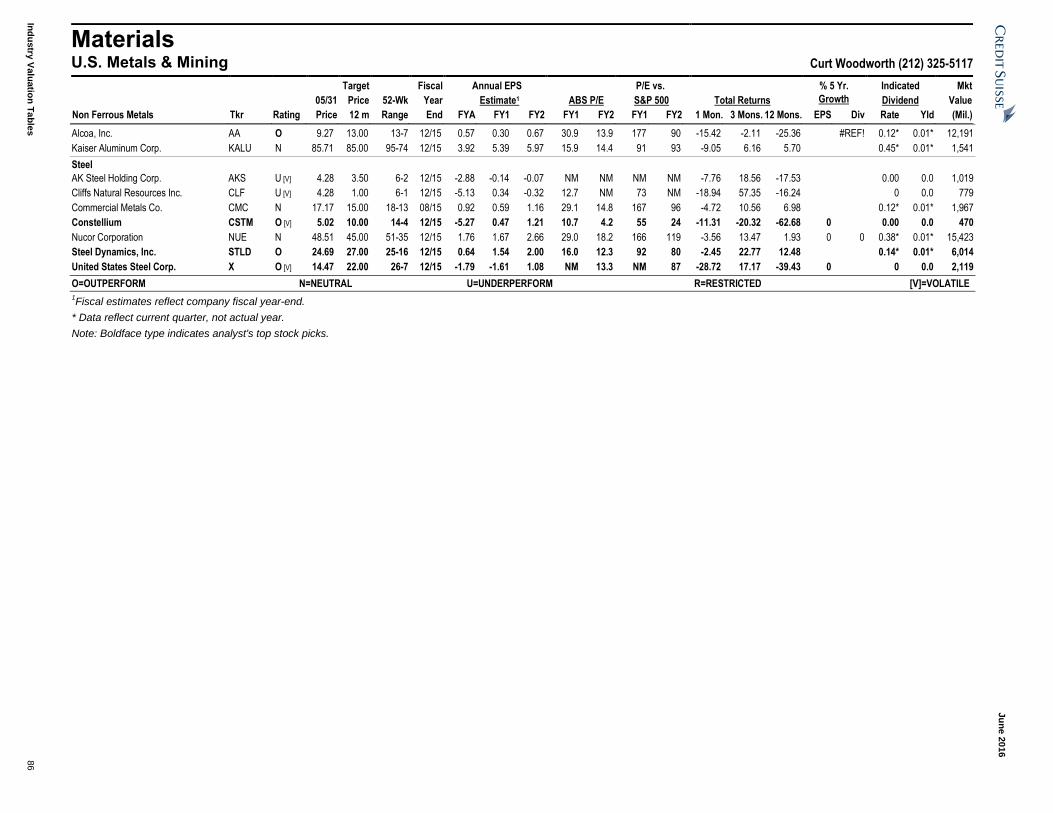
Ju
ne 2
016
Ind
ustry
Valu
atio
n T
ab
les
86
Materials U.S. Metals & Mining Curt Woodworth (212) 325-5117
Target Fiscal Annual EPS P/E vs. % 5 Yr. Indicated Mkt
05/31 Price 52-Wk Year Estimate1 ABS P/E S&P 500 Total Returns Growth Dividend Value
Non Ferrous Metals Tkr Rating Price 12 m Range End FYA FY1 FY2 FY1 FY2 FY1 FY2 1 Mon. 3 Mons. 12 Mons. EPS Div Rate Yld (Mil.)
Alcoa, Inc. AA O 9.27 13.00 13-7 12/15 0.57 0.30 0.67 30.9 13.9 177 90 -15.42 -2.11 -25.36 #REF! 0.12* 0.01* 12,191
Kaiser Aluminum Corp. KALU N 85.71 85.00 95-74 12/15 3.92 5.39 5.97 15.9 14.4 91 93 -9.05 6.16 5.70 0.45* 0.01* 1,541
Steel
AK Steel Holding Corp. AKS U [V] 4.28 3.50 6-2 12/15 -2.88 -0.14 -0.07 NM NM NM NM -7.76 18.56 -17.53 0.00 0.0 1,019
Cliffs Natural Resources Inc. CLF U [V] 4.28 1.00 6-1 12/15 -5.13 0.34 -0.32 12.7 NM 73 NM -18.94 57.35 -16.24 0 0.0 779
Commercial Metals Co. CMC N 17.17 15.00 18-13 08/15 0.92 0.59 1.16 29.1 14.8 167 96 -4.72 10.56 6.98 0.12* 0.01* 1,967
Constellium CSTM O [V] 5.02 10.00 14-4 12/15 -5.27 0.47 1.21 10.7 4.2 55 24 -11.31 -20.32 -62.68 0 0.00 0.0 470
Nucor Corporation NUE N 48.51 45.00 51-35 12/15 1.76 1.67 2.66 29.0 18.2 166 119 -3.56 13.47 1.93 0 0 0.38* 0.01* 15,423
Steel Dynamics, Inc. STLD O 24.69 27.00 25-16 12/15 0.64 1.54 2.00 16.0 12.3 92 80 -2.45 22.77 12.48 0.14* 0.01* 6,014
United States Steel Corp. X O [V] 14.47 22.00 26-7 12/15 -1.79 -1.61 1.08 NM 13.3 NM 87 -28.72 17.17 -39.43 0 0 0.0 2,119
O=OUTPERFORM N=NEUTRAL U=UNDERPERFORM R=RESTRICTED [V]=VOLATILE
1Fiscal estimates reflect company fiscal year-end.
* Data reflect current quarter, not actual year.
Note: Boldface type indicates analyst's top stock picks.

Ju
ne 2
016
Ind
ustry
Valu
atio
n T
ab
les
87
Technology Internet Stephen Ju (212) 325-8662
Target Fiscal Annual EPS P/E vs. % 5 Yr. Indicated Mkt
05/31 Price 52-Wk Year Estimate1 ABS P/E S&P 500 Total Returns Growth Dividend Value
Consumer Internet Tkr Rating Price 12 m Range End FYA FY1 FY2 FY1 FY2 FY1 FY2 1 Mon. 3 Mons. 12 Mons. EPS Div Rate Yld (Mil.)
Activision Blizzard, Inc ATVI O 39.26 43.00 40-24 12/15 1.32 1.77 2.52 22.1 15.6 127 101 13.53 24.56 54.60 0 0 0.0 28,983
Alphabet GOOGL O 748.85 920.00 794-540 12/15 29.59 31.71 39.29 23.6 19.1 135 124 4.82 2.36 36.35 0 0.00 0.0 509,618
Amazon com Inc. AMZN O 722.79 880.00 723-424 12/15 6.29 12.22 17.25 59.1 41.9 339 273 5.69 25.16 67.73 0 0.00 0.0 341,033
Bazaarvoice Inc. BV O 3.72 5.00 6-3 04/15 -0.18 -0.08 0.00 NM NM NM NM 10.06 5.98 -35.08 0.00 0.0 305
Cnova N.V. CNV U 5.19 5.50 6-2 12/15 -0.41 -0.26 -0.21 NM NM NM NM 45.38 131.70 -11.43 0 0.0 2,059
eBay Inc. EBAY N 24.46 28.00 30-22 12/15 1.83 1.88 2.08 13.0 11.8 74 77 0.82 2.17 -7.10 0 0.0 28,102
Electronic Arts, Inc EA O 76.75 90.00 77-56 03/16 3.14 3.50 4.08 21.9 18.8 126 123 22.04 18.44 22.04 0.00 0.0 23,149
Endurance International Group Holdings, Inc.
EIGI O [V] 9.42 18.00 22-8 12/15 1.23 1.49 1.77 6.3 5.3 36 35 -12.21 -18.02 -52.99 0 0.00 0.0 1,323
Expedia EXPE N 111.24 134.00 137-92 12/15 3.72 5.05 6.05 22.0 18.4 126 120 -4.53 2.52 3.53 0 0 0.0 16,551
Facebook Inc. FB O 118.81 145.00 121-80 12/15 2.28 3.49 4.94 34.1 24.0 195 156 0.20 8.42 47.98 0 0.00 0.0 339,833
Groupon Inc. GRPN N [V] 3.54 5.00 6-2 12/15 0.12 0.05 0.11 77.0 30.8 441 201 1.43 -27.16 -43.63 0 0 0.0 2,053
LendingClub Corporation LC N [V] 4.76 11.00 19-4 12/15 0.13 0.18 0.31 27.1 15.4 155 101 -39.97 -50.21 -75.05 1 0.00 0.0 1,817
LinkedIn LNKD O 136.50 176.00 256-101 12/15 2.83 3.32 3.92 41.1 34.8 236 227 5.94 16.64 -32.01 0 0 0.0 18,229
MercadoLibre Inc. MELI O 136.50 150.00 151-86 12/15 3.13 2.64 3.86 51.6 35.3 296 230 7.95 28.13 -5.00 0 0 0.0 6,027
RetailMeNot, INC. SALE N [V] 7.22 10.00 21-6 12/15 0.76 0.61 0.60 11.8 12.0 68 78 -15.06 -13.43 -64.28 0 0.00 0.0 352
Rocket Fuel Inc. FUEL O [V] 2.57 7.00 9-2 12/15 -3.91 -0.79 -0.13 NM NM NM NM -8.87 -31.83 -68.85 0 0.00 0.0 113
Take-Two Interactive Software Inc. TTWO N 38.91 37.00 39-27 03/16 2.11 1.25 4.01 31.1 9.7 178 63 9.82 6.40 42.63 0 0 0.0 3,301
The Priceline Group Inc PCLN O 1264.33 1580.00 1470-974 12/15 58.36 63.35 70.92 20.0 17.8 114 116 -6.81 -2.97 8.37 0 0 0.0 62,761
Tremor Video, Inc. TRMR O [V] 1.81 4.00 3-2 12/15 -0.71 -0.15 0.07 NM 24.9 NM 162 -9.50 7.74 -36.93 0 0 0.0 95
TripAdvisor, Inc. TRIP O 67.74 74.00 93-54 12/15 2.07 1.62 2.21 41.9 30.7 240 200 4.39 3.31 -11.46 0 0 0.0 9,870
Yahoo Inc. YHOO N 37.94 46.00 43-27 12/15 0.63 0.61 0.70 62.1 54.1 356 352 3.86 15.39 -12.48 0 0 0.0 36,040
Yelp YELP O [V] 26.19 46.00 49-15 12/15 0.37 0.52 0.73 50.0 36.0 287 234 21.76 20.41 -44.76 0 0 0.0 2,003
Zynga Inc ZNGA U 2.57 2.87 3-2 12/14 -0.01 -0.01 0.05 NM 51.4 NM 335 8.44 13.22 -12.59 0 0 0.0 2,245
New Media
InterActiveCorp IAC N 55.88 62.00 85-40 12/15 3.04 2.92 3.00 19.2 18.7 110 121 16.83 18.11 -27.35 0 0 0.0 4,425
Netflix, Inc. NFLX N [V] 102.57 116.00 131-83 12/15 0.60 0.40 1.19 258.8 86.3 1,484 562 10.16 4.74 15.24 0 0.00 0.0 43,931
Pandora Media P N [V] 11.79 17.00 22-8 12/15 0.08 -0.47 0.00 NM NM NM NM 30.85 8.36 -35.99 1 0.00 0.0 2,697
Quinstreet QNST U [V] 3.70 4.00 7-3 06/15 0.04 0.06 0.20 64.7 18.7 371 122 2.49 14.91 -36.54 0 0.00 0.0 168
O=OUTPERFORM N=NEUTRAL U=UNDERPERFORM R=RESTRICTED [V]=VOLATILE
1Fiscal estimates reflect company fiscal year-end.
* Data reflect current quarter, not actual year.
Note: Boldface type indicates analyst's top stock picks.

Ju
ne 2
016
Ind
ustry
Valu
atio
n T
ab
les
88
Technology IT Hardware, Networking & Telecom Equipment Kulbinder Garcha (212) 325-4795
Target Fiscal Annual EPS P/E vs. % 5 Yr. Indicated Mkt
05/31 Price 52-Wk Year Estimate1 ABS P/E S&P 500 Total Returns Growth Dividend Value
IT Hardware Tkr Rating Price 12 m Range End FYA FY1 FY2 FY1 FY2 FY1 FY2 1 Mon. 3 Mons. 12 Mons. EPS Div Rate Yld (Mil.)
Apple Inc AAPL O 99.86 150.00 132-90 09/15 9.20 8.18 9.64 12.2 10.4 70 67 6.64 -1.62 -23.50 0 0.0 546,976
F5 Networks FFIV O 110.20 110.00 134-87 09/15 6.63 7.23 8.00 15.2 13.8 87 90 6.32 9.68 -11.92 * * 7,381
Gigamon GIMO O [V] 31.15 40.00 35-19 12/15 0.80 1.08 1.39 28.8 22.4 165 146 -1.74 10.85 -0.57 0.00 0.0 1,088
Hewlett Packard HPQ O 13.38 19.00 15-9 10/15 1.72 1.59 1.63 8.4 8.2 48 54 10.40 20.43 -12.70 * * 23,103
Hewlett Packard Enterprise HPE O [V] 18.47 21.00 18-12 10/15 1.95 1.94 2.05 9.5 9.0 55 59 12.62 35.81 0.00 0.0 31,705
International Business Machines Corp. IBM U 153.74 110.00 173-118 12/15 14.94 13.49 13.18 11.4 11.7 65 76 5.83 11.57 -9.66 1.30* 0.01* 147,585
Lexmark International LXK N 37.86 40.50 47-24 12/15 3.53 2.35 2.63 16.1 14.4 92 94 -1.89 17.10 -17.06 0.00 0.0 2,372
NetApp NTAP N 25.53 25.00 35-21 04/16 2.15 2.28 2.24 11.2 11.4 64 74 9.57 -2.07 -23.00 * * 7,380
Networking Equipment
Arista Networks ANET O [V] 73.29 90.00 88-53 12/15 2.44 3.03 3.51 24.2 20.9 139 136 9.27 9.23 4.98 0 0.0 5,030
Cisco Systems Inc. CSCO U 29.05 24.00 29-23 07/15 2.21 2.34 2.34 12.4 12.4 71 81 6.14 8.11 -0.45 * * 146,113
Juniper Networks JNPR N 23.41 27.00 32-22 12/15 2.05 2.04 2.14 11.5 10.9 66 71 0.26 -5.98 -13.49 0.00 0.0 8,988
Ubiquiti Networks, Inc UBNT N [V] 39.86 30.00 40-27 06/15 1.97 2.36 2.44 16.9 16.3 97 106 9.81 19.88 28.75 0 0.0 3,305
Office Electronics
Xerox XRX N 9.97 10.00 12-9 12/15 1.07 1.10 1.10 9.0 9.1 52 59 3.32 -4.13 -13.00 0.06* 0.01* 10,100
Storage & Data Networking
EMC Corp EMC R 27.95 R 28-23 12/14 1.90 R R R R R R R 6.19 4.76 R R 0 0.0 54,583
Telecommunications Equipment
BlackBerry BBRY U [V] 7.27 6.00 10-6 02/16 -0.24 -0.39 -0.42 NM NM NM NM 2.97 -7.27 -23.55 * * 3,799
CommScope COMM R 31.15 R 33-20 12/15 1.88 R R R R R R #N/A 14.86 -0.37 R R * * 5,977
Motorola Solutions MSI O 69.27 80.00 76-57 12/15 3.33 4.56 5.00 15.2 13.9 87 90 -8.86 -2.78 16.13 * * 12,100
Nokia NOK O 5.70 8.32 8-5 12/15 0.65 0.22 0.42 26.1 13.7 150 89 -3.88 -6.25 -21.49 0 0 * * 33,367
Nokia NOKIA O 5.14 7.30 7-5 12/15 0.59 0.19 0.36 26.8 14.4 165 98 -0.68 -7.14 -22.94 0 0 * * 29,993
QUALCOMM Inc. QCOM O 54.92 67.00 70-43 09/15 4.66 4.17 5.03 13.2 10.9 76 71 7.45 4.85 -20.88 * * 80,673
O=OUTPERFORM N=NEUTRAL U=UNDERPERFORM R=RESTRICTED [V]=VOLATILE
1Fiscal estimates reflect company fiscal year-end.
* Data reflect current quarter, not actual year.
Note: Boldface type indicates analyst's top stock picks.

Ju
ne 2
016
Ind
ustry
Valu
atio
n T
ab
les
89
Technology Semiconductor Equipment Farhan Ahmad (415) 249-7929
Target Fiscal Annual EPS P/E vs. % 5 Yr. Indicated Mkt
05/31 Price 52-Wk Year Estimate1 ABS P/E S&P 500 Total Returns Growth Dividend Value
Semiconductor Equipment Tkr Rating Price 12 m Range End FYA FY1 FY2 FY1 FY2 FY1 FY2 1 Mon. 3 Mons. 12 Mons. EPS Div Rate Yld (Mil.)
Applied Materials Inc. AMAT O 24.42 25.00 24-14 10/15 1.19 1.53 1.72 16.0 14.2 92 92 20.24 25.55 20.24 0.09* 0.00* 26,597
ASML Holding N.V. ASML N 89.40 84.00 102-72 12/14 2.72 3.20 3.11 27.9 28.7 154 197 5.39 4.28 -12.22 0 0 0 0.0 38,740
Brooks Automation Inc. BRKS U 10.98 9.80 12-8 12/15 0.45 0.37 0.65 29.3 17.0 168 110 15.82 10.91 -6.79 * * 753
KLA-Tencor Corp. KLAC N 72.93 81.00 73-46 06/15 2.99 4.30 4.79 17.0 15.2 97 99 4.08 6.16 21.98 0.40* 0.01* 11,356
Lam Research Corp. LRCX O 82.81 98.00 84-62 06/14 4.43 5.05 6.21 16.4 13.3 94 87 8.12 10.61 -0.70 0 4.00* 0.05* 13,216
Rudolph Technologies RTEC O 14.60 15.00 15-11 12/15 0.82 0.90 1.01 16.3 14.5 93 94 3.84 10.36 13.88 * * 451
Teradyne Inc. TER N 19.81 20.00 22-17 12/15 1.23 1.35 1.36 14.7 14.5 84 95 4.26 0.30 -6.60 0.00 0.0 4,025
O=OUTPERFORM N=NEUTRAL U=UNDERPERFORM R=RESTRICTED [V]=VOLATILE
1Fiscal estimates reflect company fiscal year-end.
* Data reflect current quarter, not actual year.
Note: Boldface type indicates analyst's top stock pick.
Technology Semiconductors John Pitzer (212) 538-4610
Target Fiscal Annual EPS P/E vs. % 5 Yr. Indicated Mkt
05/31 Price 52-Wk Year Estimate1 ABS P/E S&P 500 Total Returns Growth Dividend Value
Semiconductor Devices Tkr Rating Price 12 m Range End FYA FY1 FY2 FY1 FY2 FY1 FY2 1 Mon. 3 Mons. 12 Mons. EPS Div Rate Yld (Mil.)
Advanced Micro Devices, Inc. AMD U [V] 4.57 3.50 5-2 12/15 -0.61 -0.32 -0.14 NM NM NM NM 22.19 85.77 103.11 0 0.0 3,626
Analog Devices Inc. ADI O 58.50 72.00 69-49 10/15 3.16 2.73 3.25 21.4 18.0 123 117 2.61 5.46 -14.91 0 0.0 17,980
Broadcom Ltd AVGO O 154.36 180.00 159-109 10/14 5.31 8.98 10.48 17.2 14.7 99 96 5.67 12.40 5.28 0 * * 60,270
Cypress Semiconductor Corp. CY N 10.63 9.00 14-6 12/15 0.56 0.48 0.78 22.0 13.7 126 89 10.84 26.25 -23.08 0.00 0.0 3,314
Fairchild Semiconductor International Inc.
FCS N 19.87 20.00 21-13 12/15 0.55 0.75 1.02 26.6 19.4 153 126 -0.50 -1.58 0.56 0 0.0 2,278
Intel Corp. INTC O 31.59 40.00 35-26 12/15 2.33 2.40 2.70 13.2 11.7 75 76 3.20 3.30 -6.83 0 0.0 149,168
Intersil Corp. ISIL N 13.52 11.00 14-10 12/15 0.52 0.48 0.55 28.0 24.7 161 161 14.38 -0.95 1.50 0.00 0.0 1,825
Linear Technology Corp. LLTC N 47.32 40.00 48-37 06/15 2.13 2.01 2.15 23.5 22.0 135 143 5.48 11.34 -0.91 0.32* 0.01* 11,314
Marvell Technology Group Ltd. MRVL N 10.23 9.00 15-8 01/15 1.15 0.40 0.41 25.8 25.0 148 163 4.92 4.39 -27.37 0 0.0 5,295
Maxim Integrated Products MXIM N 37.96 42.00 42-30 06/15 1.53 1.63 2.04 23.4 18.6 134 121 4.26 11.16 9.49 0 0.0 10,792
Mellanox Technologies Ltd. MLNX O 47.40 60.00 56-37 12/15 1.83 2.39 3.46 19.8 13.7 114 89 8.89 -7.10 -5.50 0 0.0 2,259
Microchip Technology Inc. MCHP O 51.68 52.00 52-40 03/16 2.46 2.78 3.25 18.6 15.9 107 103 4.72 12.06 5.28 0 0.0 11,102
Micron Technology Inc. MU O [V] 12.72 20.00 28-10 08/15 2.72 0.11 1.07 112.7 11.9 646 78 19.77 7.89 -55.24 0.00 0.0 13,191
NXP Semiconductors N.V. NXPI O 94.49 120.00 112-64 12/14 4.74 5.59 5.58 16.9 16.9 97 110 9.44 26.80 -15.62 0 0 0.0 23,788
ON Semiconductor Corp. ON O 9.77 11.50 13-7 12/15 0.84 0.87 1.05 11.3 9.3 65 60 0.93 9.28 -25.36 0 0.0 4,053
Texas Instruments Inc. TXN N 60.60 65.00 61-44 12/15 2.99 3.19 3.47 19.0 17.5 109 114 4.75 10.44 8.78 0.11* 0.00* 60,856
Xilinx XLNX N 47.39 43.00 50-39 03/16 2.05 2.15 2.25 22.1 21.1 127 137 8.34 -0.98 -1.94 0 0.0 12,024
O=OUTPERFORM N=NEUTRAL U=UNDERPERFORM R=RESTRICTED [V]=VOLATILE
1Fiscal estimates reflect company fiscal year-end.
* Data reflect current quarter, not actual year.
Note: Boldface type indicates analyst’s top stock picks.

Ju
ne 2
016
Ind
ustry
Valu
atio
n T
ab
les
90
Technology Small- & Mid-Cap Software Michael Nemeroff (212) 325-2052
Target Fiscal Annual EPS P/E vs. % 5 Yr. Indicated Mkt
05/31 Price 52-Wk Year Estimate1 ABS P/E S&P 500 Total Returns Growth Dividend Value
Software Tkr Rating Price 12 m Range End FYA FY1 FY2 FY1 FY2 FY1 FY2 1 Mon. 3 Mons. 12 Mons. EPS Div Rate Yld (Mil.)
2U, Inc TWOU O [V] 27.84 32.00 39-15 12/15 -0.34 -0.19 -0.14 NM NM NM NM -1.97 13.73 -1.38 0 0.0 1,293
Adobe Systems Inc. ADBE N 99.47 105.00 100-74 11/15 2.08 2.82 3.70 35.2 26.9 202 175 4.82 14.06 24.54 0 0 0.0 49,756
Alarm.com Holdings Inc. ALRM O [V] 21.20 25.00 24-11 12/15 0.29 0.48 0.55 43.7 38.8 251 253 -9.67 -5.40 0 0.0 966
Apigee Corporation APIC O [V] 10.83 17.00 15-5 07/15 -1.81 -1.15 -0.76 NM NM NM NM 11.19 41.57 -25.62 0 0 0.0 324
AppFolio Inc. APPF N [V] 14.00 14.00 20-12 12/15 -0.68 -0.35 -0.20 NM NM NM NM 10.32 20.38 0.00 0.0 470
CA Inc. CA N 32.32 33.00 32-26 03/16 2.45 2.54 2.68 12.7 12.1 73 79 9.15 8.42 7.34 0.26* 0.01* 13,470
Callidus Software Inc. CALD O 18.56 22.00 21-12 12/15 0.20 0.28 0.37 67.0 50.0 384 326 1.70 32.71 29.70 0 0.0 1,054
Cornerstone OnDemand, Inc. CSOD O 40.01 42.00 40-24 12/15 -0.39 0.03 0.28 1166.3 145.3 6,686 946 16.65 30.07 27.34 0.00 0.0 2,204
Intuit Inc. INTU N 106.66 100.00 108-80 07/15 2.58 3.64 4.30 29.3 24.8 168 162 4.35 9.16 0.23 0 0 0.30* 0.00* 27,291
Mindbody Inc. MB O [V] 13.39 18.00 18-9 12/15 -0.77 -0.53 -0.22 NM NM NM NM -0.81 8.69 0 0.0 531
Ooma Inc. OOMA O [V] 6.90 12.00 11-6 01/16 -0.84 -0.24 0.14 NM 48.2 NM 314 1.32 4.70 0 0.0 119
Open Text Corporation OTEX N 58.68 49.00 59-37 06/15 3.46 3.57 3.89 16.5 15.1 94 98 5.31 17.27 39.05 0 0.0 7,118
Paycom Software, Inc. PAYC O [V] 40.44 47.00 46-23 12/15 0.40 0.67 0.88 60.5 46.1 347 300 3.83 23.94 16.37 0 0.0 2,423
RealPage, Inc. RP U 21.75 19.00 24-16 12/15 0.55 0.72 0.84 30.4 25.9 174 169 -3.50 6.10 18.98 0.00 0.0 1,741
Shopify Inc. SHOP O [V] 29.29 34.00 40-19 12/15 -0.13 -0.23 -0.07 NM NM NM NM -6.75 20.68 7.17 0 0.0 2,375
Synchronoss Technologies, Inc. SNCR O [V] 35.27 47.00 50-22 12/15 2.24 2.44 3.00 14.5 11.8 83 77 10.46 19.60 -16.97 0 0.0 1,577
Textura Corp TXTR N [V] 26.00 26.00 31-13 12/15 0.20 0.43 0.75 60.3 34.5 346 225 -0.61 45.58 -13.07 0 0.0 681
The Ultimate Software Group, Inc. ULTI O 204.48 225.00 211-152 12/15 2.65 3.28 4.06 62.3 50.3 357 328 3.46 13.50 25.51 0 0.0 5,905
Verint Systems Inc. VRNT U 32.99 29.00 66-30 01/16 3.04 3.05 3.20 10.8 10.3 62 67 -4.27 -12.33 -49.49 0 0.0 2,052
Workiva, Inc. WK O 13.80 18.00 19-11 12/15 -0.81 -1.16 -1.12 NM NM NM NM 14.14 21.05 4.47 0.00 0.0 565
O=OUTPERFORM N=NEUTRAL U=UNDERPERFORM R=RESTRICTED [V]=VOLATILE
1Fiscal estimates reflect company fiscal year-end.
* Data reflect current quarter, not actual year.
Note: Boldface type indicates analyst’s top stock picks.

Ju
ne 2
016
Ind
ustry
Valu
atio
n T
ab
les
91
Technology Software
Philip Winslow (212) 325-6157
Sitikantha Panigrahi (212) 325-2686
Target Fiscal Annual EPS P/E vs. % 5 Yr. Indicated Mkt
05/31 Price 52-Wk Year Estimate1 ABS P/E S&P 500 Total Returns Growth Dividend Value
Software Tkr Rating Price 12 m Range End FYA FY1 FY2 FY1 FY2 FY1 FY2 1 Mon. 3 Mons. 12 Mons. EPS Div Rate Yld (Mil.)
Akamai Technologies Inc. AKAM N 54.58 45.00 77-40 12/15 2.52 2.69 3.07 20.3 17.8 116 116 7.15 -1.91 -27.45 0 0.00 0.0 9,584
Autodesk Inc. ADSK O 58.27 100.00 65-43 01/16 0.84 -0.78 1.41 NM 41.2 NM 268 -5.05 6.35 7.13 0 0.00 0.0 13,087
Box, Inc. BOX O 12.56 24.00 19-9 01/16 -1.12 -0.83 0.11 NM 113.6 NM 739 -2.71 0.80 -28.23 0 0 0.0 1,591
Check Point Software Technologies Ltd. CHKP O 84.97 95.00 90-73 12/15 4.17 4.56 5.20 18.6 16.3 107 106 2.63 -0.26 0.34 0 * * 15,367
Citrix Systems Inc. CTXS O 84.92 110.00 86-62 12/15 4.33 5.01 5.70 16.9 14.9 97 97 2.72 14.83 29.12 0 0 0.0 13,171
Commvault Systems Inc. CVLT N 45.28 40.00 46-30 03/16 0.92 0.91 1.06 49.5 42.6 284 277 1.91 18.04 0.80 0 0 0.0 2,002
Hortonworks, Inc. HDP O [V] 11.68 35.00 28-7 12/15 -3.08 -2.38 -1.66 NM NM NM NM -4.73 1.04 -56.25 0 * * 847
Marketo, Inc. MKTO N [V] 35.23 35.25 35-15 12/15 -0.61 -0.47 0.00 NM NM NM NM 60.87 91.68 20.32 0 * * 1,569
Microsoft Corporation MSFT O 53.00 62.50 57-40 06/15 2.71 2.65 2.88 20.0 18.4 114 120 4.72 1.24 12.22 0 0 0.36* 0.01* 416,605
NetSuite Inc. N O 79.31 90.00 100-53 12/15 0.22 0.47 0.74 169.7 106.7 973 694 -2.82 24.23 -14.03 0 0.00 0.0 6,380
Oracle Corporation ORCL O 40.20 50.00 45-34 05/15 2.74 2.61 2.82 15.4 14.3 88 93 -0.25 6.10 -8.20 0 0 0.15* 0.00* 166,825
Palo Alto Networks PANW O 130.46 225.00 197-116 07/15 0.86 1.67 2.58 78.2 50.6 448 329 -14.10 -14.18 -23.48 1 * * 11,690
Proofpoint PFPT O [V] 58.62 85.00 75-37 12/15 -0.35 -0.14 0.43 NM 136.2 NM 886 -0.75 17.85 -0.34 0 0 0.0 2,432
Qualys QLYS O [V] 31.19 35.00 48-17 12/15 0.70 0.79 1.03 39.4 30.4 226 198 20.01 17.26 -22.82 0 0 0.0 1,089
Rackspace Hosting Inc. RAX N 25.00 20.00 40-17 12/15 0.85 1.07 1.12 23.4 22.3 134 145 8.46 7.02 -36.68 0 0 0.0 3,143
Red Hat, Inc. RHT O 77.46 95.00 84-61 02/16 1.91 2.24 2.64 34.6 29.4 198 191 4.22 12.80 0.94 0 0 0.0 14,054
Salesforce.com Inc. CRM O 83.71 115.00 84-54 01/16 0.75 1.02 1.40 82.2 59.9 471 390 8.36 18.23 14.51 0 * * 56,714
SAP SAP O 72.96 85.00 75-56 12/15 3.76 3.94 4.26 18.5 17.1 150 153 5.81 4.50 8.05 0 0 1.10* 0.02* 89,634
ServiceNow NOW N 71.63 65.00 90-47 12/15 0.40 0.70 1.25 102.0 57.4 585 374 -0.54 22.74 -5.35 1 0 0.0 11,672
Splunk SPLK O [V] 57.45 85.00 75-31 01/16 0.18 0.30 0.61 193.7 94.6 1110 616 8.99 24.51 -13.56 1 * * 7,614
Symantec Corporation SYMC N 17.36 16.50 20-15 03/16 1.03 1.07 1.38 16.3 12.6 93 82 3.64 5.08 -12.68 0 0 * * 10,629
Tableau Software, Inc. DATA O [V] 51.44 60.00 129-37 12/15 0.62 0.61 0.79 84.3 65.1 483 424 -1.34 19.29 -54.44 0 0.00 0.0 3,827
Teradata Corp TDC U 28.34 23.50 40-23 12/15 2.06 2.37 2.21 12.0 12.8 69 84 11.88 7.23 -26.62 0 0 0.0 3,684
VeriSign Inc. VRSN U 85.46 65.00 93-61 12/15 3.05 3.50 3.62 24.4 23.6 140 154 -3.03 -3.59 35.09 0 0.00 0.0 9,270
VMware Inc. VMW R 60.56 R 91-44 12/15 4.07 R R R R R R R 22.52 -30.56 R R * * 25,694
Zendesk ZEN O 24.49 29.00 27-15 12/15 -0.30 -0.32 -0.07 NM NM NM NM 4.21 25.85 8.65 0 0 0.0 2,247
O=OUTPERFORM N=NEUTRAL U=UNDERPERFORM R=RESTRICTED [V]=VOLATILE
1Fiscal estimates reflect company fiscal year-end.
* Data reflect current quarter, not actual year.
Note: Boldface type indicates analysts' top stock picks.

Ju
ne 2
016
Ind
ustry
Valu
atio
n T
ab
les
92
Telecommunication Services Wireline Robert Peters (416) 352-4550
Target Fiscal Annual EPS P/E vs. % 5 Yr. Indicated Mkt
05/31 Price 52-Wk Year Estimate1 ABS P/E S&P 500 Total Returns Growth Dividend Value
Wireline Tkr Rating Price 12 m Range End FYA FY1 FY2 FY1 FY2 FY1 FY2 1 Mon. 3 Mons. 12 Mons. EPS Div Rate Yld (Mil.)
BCE Inc.(C$) BCE N 60.45 56.00 61-52 12/15 3.35 3.50 3.71 17.3 16.3 94 107 3.09 5.96 10.67 0 0 2.73* 0.05* 52,475
Rogers Communications (NVS)(C$) RCI.B N 50.00 52.00 54-41 12/15 2.89 2.91 3.25 17.2 15.4 93 101 2.02 NA 16.52 0 0 * * 25,751
TELUS Corporation(C$) T O 41.57 45.00 45-36 12/15 2.29 2.43 2.71 17.1 15.3 93 101 4.34 6.05 -2.33 0 0 1.60* 0.04* 24,584
O=OUTPERFORM N=NEUTRAL U=UNDERPERFORM R=RESTRICTED [V]=VOLATILE
1Fiscal estimates reflect company fiscal year-end.
* Data reflect current quarter, not actual year.

June 2016
Performance of S&P 500 by Industry 93
PERFORMANCE OF S&P 500 BY INDUSTRY
% of Relative Price Performance
As of May 31, 2016 S&P 500 1 Mo. 3 Mos. 6 Mos. 9 Mos. 12 Mos.
CONSUMER DISCRETIONARY 12.84 -1.53 -2.18 -2.47 -0.89 4.41
Auto Components 0.31 -2.28 -0.60 -14.15 -9.67 -21.51
Auto Parts & Equipment 0.27 -1.90 2.00 -13.32 -9.33 -22.52
Tires & Rubber 0.04 -4.98 -16.43 -19.82 -12.01 -12.99
Automobiles 0.55 -2.73 -2.25 -8.78 -7.44 -11.02
Automobile Manufacturers 0.51 -2.56 -2.40 -9.14 -5.39 -10.95
Motorcycle Manufacturers 0.04 -4.54 -0.73 -4.90 -24.68 -12.41
Household Durables 0.50 0.56 3.80 -0.46 -4.96 1.02
Consumer Electronics 0.07 -0.65 -5.58 -10.46 -14.25 -23.69
Home Furnishings 0.11 0.53 1.33 4.81 -2.99 5.48
Homebuilding 0.14 -0.16 1.52 -8.44 -12.65 4.66
Household Appliances 0.07 -1.26 4.86 7.23 -0.57 -5.90
Housewares & Specialties 0.12 3.19 14.71 5.06 7.64 21.10
Leisure Equipment & Products 0.11 1.29 -1.05 24.18 20.89 22.79
Leisure Products 0.11 1.29 -1.05 24.18 20.89 22.79
Textiles Apparel & Luxury Goods 1.06 -7.82 -15.91 -11.57 -14.17 -2.28
Apparel Accessories & Luxury Goods 0.59 -7.79 -13.53 -5.72 -19.35 -11.18
Footwear 0.47 -7.84 -18.23 -16.89 -7.90 9.23
Hotels, Restaurants & Leisure 1.71 -3.12 -6.99 -1.51 -2.02 5.56
Casinos & Gaming 0.05 7.39 7.81 44.23 25.92 -1.45
Hotels Resorts & Cruise Lines 0.45 -4.59 -6.30 -7.43 -11.44 -5.41
Restaurants 1.21 -3.00 -7.58 -0.74 0.18 9.27
Diversified Consumer Services 0.02 4.00 -40.89 -42.34 -44.74 -32.26
Education Services NA -1.53 -6.00 0.27 -9.57 0.70
Specialized Consumer Services 0.02 4.00 -40.89 -42.34 -44.74 -32.26
Media 3.08 -1.38 0.41 -1.52 0.66 -2.99
Advertising 0.15 0.09 1.03 8.39 19.26 13.99
Broadcasting & Cable TV 0.30 -1.80 -0.23 0.33 7.45 -12.27
Movies & Entertainment 1.74 -3.85 -0.74 -7.84 -5.92 -12.18
Publishing 0.07 -5.48 4.41 -17.59 -17.28 -18.99
Distributors 0.12 0.37 -0.87 8.20 10.87 9.09
Distributors 0.12 0.37 -0.87 8.20 10.87 9.09
Internet & Catalog Retail 2.38 5.20 10.09 0.99 18.22 43.91
Internet Retail 2.38 5.20 10.09 0.99 18.22 43.91
Multiline Retail 0.56 -7.33 -12.92 1.68 -16.45 -13.54
Department Stores 0.12 -20.74 -30.32 -22.37 -48.66 -46.42
General Merchandise Stores 0.44 -3.29 -7.30 10.18 -2.11 2.46
Specialty Retail 2.44 -2.66 -3.90 -2.42 -3.22 5.83
Apparel Retail 0.55 -6.75 -13.34 -4.02 -9.79 0.54
Computer & Electronics Retail 0.05 -1.25 -6.27 0.81 -21.83 -11.16
Home Improvement Retail 1.18 -0.90 2.22 0.19 7.71 17.75
Specialty Stores 0.24 -3.46 -3.25 -9.27 -19.69 -16.45
Automotive Retail 0.38 -1.48 -6.82 -3.27 -7.22 2.90
Homefurnishing Retail 0.03 -6.76 -15.48 -16.68 -36.04 -36.74
continued

June 2016
Performance of S&P 500 by Industry 94
% of Relative Price Performance
As of May 31, 2016 S&P 500 1 Mo. 3 Mos. 6 Mos. 9 Mos. 12 Mos.
CONSUMER STAPLES 10.74 -0.89 -3.60 6.00 4.15 8.49
Food & Staples Retailing 2.74 -0.85 -6.34 2.85 -7.01 -2.80
Drug Retail 0.94 -4.93 -8.58 -2.32 -15.89 -6.84
Food Distributors 0.14 2.90 1.95 17.50 13.54 29.92
Food Retail 0.22 1.70 -15.45 -3.11 -5.34 -7.04
Hypermarkets & Super Centres 1.44 2.24 -2.47 8.24 0.06 -1.22
Beverages 2.30 -2.09 -2.68 2.23 4.57 11.20
Brewers 0.11 2.18 8.61 6.72 40.03 36.41
Distillers & Vintners 0.25 -2.44 -1.58 3.66 5.24 21.10
Soft Drinks 1.94 -2.25 -3.27 1.87 3.34 9.32
Food Products 2.02 0.29 -0.95 9.59 5.40 10.93
Agricultural Products 0.13 5.55 14.55 16.81 -10.88 -18.65
Packaged Foods & Meats 0.13 -0.15 -2.12 9.00 7.03 14.50
Tobacco 1.75 -0.66 -1.35 11.08 14.81 23.34
Tobacco 1.75 -0.66 -1.35 11.08 14.81 23.34
Household Products 1.77 -0.44 -5.44 6.98 8.65 6.71
Household Products 1.77 -0.44 -5.44 6.98 8.65 6.71
Personal Products 0.17 -5.80 -6.67 8.21 9.27 5.32
Personal Products 0.17 -5.80 -6.67 8.21 9.27 5.32
ENERGY 6.64 -2.70 8.69 -0.78 -3.13 -12.21
Energy Equipment & Services 0.98 -5.76 2.65 -4.53 -11.70 -16.74
Oil & Gas Drilling 0.07 -8.56 9.08 -14.46 -21.72 -33.00
Oil & Gas Equipment & Services 0.91 -5.58 2.19 -3.66 -10.82 -14.97
Oil, Gas & Consumable Fuels 5.66 -2.15 9.85 -0.08 -1.41 -11.32
Integrated Oil & Gas 3.09 -1.63 5.55 8.08 13.92 2.44
Oil & Gas Exploration & Production 1.59 -3.25 29.07 -4.05 -8.68 -22.80
Oil & Gas Refining & Marketing 0.48 -6.95 -11.42 -25.56 -16.90 -10.34
Oil & Gas Storage & Transportation 0.49 4.00 -40.89 -42.34 -44.74 -32.26
Coal & Consumable Fuels NA -1.53 7.82 19.34 -37.29 -62.28
FINANCIALS 15.90 0.29 2.75 -4.02 -4.62 -2.87
Commercial Banks 5.29 0.48 3.91 -8.74 -9.19 -6.25
Diversified Banks 4.36 0.27 3.15 -9.37 -9.95 -6.91
Regional Banks 0.93 1.46 7.48 -5.83 -5.64 -3.22
Thrifts & Mortgage Finance NA -1.53 -6.00 0.27 4.56 7.68
Thrifts & Mortgage Finance NA -1.53 -6.00 0.27 4.56 7.68
Diversified Financial Services 2.40 -1.73 -0.36 3.68 -0.42 0.67
Other Diversified Financial Services NA -1.53 -6.00 0.27 -9.57 0.70
Multi-Sector Holdings 1.77 -4.69 -3.06 3.26 -2.37 -1.98
Specialized Finance 0.63 5.68 6.28 4.68 4.29 7.25
Consumer Finance 0.77 -0.51 7.96 -5.73 -12.25 -12.18
Consumer Finance 0.77 -0.51 7.96 -5.73 -12.25 -12.18
Capital Markets 2.00 0.72 4.12 -10.24 -11.10 -14.17
Asset Management & Custody Banks 1.15 1.36 6.46 -5.14 -4.87 -9.95
Investment Banking & Brokerage 0.85 -0.15 0.99 -16.55 -18.73 -19.47
Insurance 2.53 2.11 3.64 -0.34 0.43 5.66
Insurance Brokers 0.45 2.37 7.15 12.06 9.82 7.58
Life & Health Insurance 0.77 0.85 6.80 -7.65 -7.08 -5.48
Multi-Line Insurance 0.52 1.61 4.16 -6.19 -8.37 1.38
Property & Casualty Insurance 0.79 3.51 -1.25 5.78 9.98 19.03
continued

June 2016
Performance of S&P 500 by Industry 95
% of Relative Price Performance
As of May 31, 2016 S&P 500 1 Mo. 3 Mos. 6 Mos. 9 Mos. 12 Mos.
FINANCIALS continued
Real Estate Investment Trusts 2.85 -0.20 -0.10 3.49 5.56 6.98
Diversified REITS NA -1.53 -6.00 0.27 -9.57 0.70
Industrial REITS 0.13 3.14 12.00 9.11 19.10 19.17
Office REITS 0.24 -3.45 1.10 -5.15 -0.13 -6.99
Residential REITS 0.41 0.98 -2.76 -1.77 2.43 5.67
Retail REITS 0.68 -2.66 -5.82 5.51 5.82 8.12
Specialized REITS 1.03 1.65 3.25 6.00 12.14 16.81
Real Estate Investment Management & Development 0.05 -0.79 5.80 -20.57 -13.74 -21.73
HEALTH CARE 13.69 0.45 -0.62 -1.15 -5.75 -4.53
Health Care Equipment & Supplies 2.22 0.13 5.30 7.90 5.49 8.42
Health Care Equipment 2.14 0.04 5.62 8.21 5.50 8.35
Health Care Supplies 0.07 2.76 -3.13 0.58 12.94 19.53
Health Care Providers & Services 2.53 -1.35 -1.03 0.85 -8.21 -6.89
Health Care Distributors 0.51 1.11 -2.85 -7.40 -13.64 -16.24
Health Care Services 0.44 1.22 2.80 -5.71 -10.62 -6.69
Health Care Facilities 0.22 -3.41 7.65 7.59 -16.98 -6.61
Managed Health Care 1.36 -2.74 -2.59 6.22 -3.29 -2.57
Health Care Technology 0.09 -2.48 2.03 -7.29 -16.68 -17.29
Health Care Technology 0.09 -2.48 2.03 -7.29 -16.68 -17.29
Biotechnology 3.06 1.00 -2.12 -7.13 -13.85 -11.29
Biotechnology 3.06 1.00 -2.12 -7.13 -13.85 -11.29
Pharmaceuticals 5.22 0.71 -2.16 -1.84 -4.16 -4.06
Pharmaceuticals 5.22 0.71 -2.16 -1.84 -4.16 -4.06
Life Sciences Tools & Services 0.57 5.16 2.26 1.29 7.44 7.42
Life Sciences Tools & Services 0.57 5.16 2.26 1.29 7.44 7.42
INDUSTRIALS 9.48 -2.34 -1.05 1.71 3.16 1.18
Aerospace & Defense 2.38 -2.57 0.34 1.97 3.91 4.75
Aerospace & Defense 2.38 -2.57 0.34 1.97 3.91 4.75
Building Products 0.09 3.63 2.90 4.48 13.07 25.24
Building Products 0.09 3.63 2.90 4.48 13.07 25.24
Construction & Engineering 0.09 1.65 11.22 9.58 8.04 -3.14
Construction & Engineering 0.09 1.65 11.22 9.58 8.04 -3.14
Electrical Equipment 0.50 -3.01 -0.07 3.71 0.03 -10.69
Electrical Components & Equipment 0.50 -3.01 -0.07 3.71 0.03 -10.69
Industrial Conglomerates 2.33 -2.36 -3.07 1.68 13.92 10.24
Industrial Conglomerates 2.33 -2.36 -3.07 1.68 13.92 10.24
Machinery 1.20 -2.85 3.50 7.49 -1.18 -4.86
Construction & Farm Machinery & Heavy Trucks 0.41 -6.90 1.15 7.79 -13.31 -15.49
Industrial Machinery 0.67 0.02 6.75 8.04 9.58 4.72
Trading Companies & Distributors 0.17 -2.51 -0.70 7.42 1.90 -3.71
Trading Companies & Distributors 0.17 -2.51 -0.70 7.42 1.90 -3.71
Commercial Services & Supplies 0.42 2.74 -0.39 8.20 3.11 7.91
Commercial Printing NA -1.53 -6.00 0.27 -9.57 0.70
Human Resource & Employment Services 0.03 7.03 -4.56 -19.80 -26.24 -25.88
Environmental & Facilities Services 0.26 1.65 -5.28 4.76 -1.58 8.36
Office Services & Supplies 0.02 -12.69 -6.00 -12.43 -12.99 -14.15
Air Freight & Logistics 0.78 -2.29 2.45 1.19 -0.42 2.24
Air Freight & Logistics 0.78 -2.29 2.45 1.19 -0.42 2.24
Airlines 0.51 -3.64 -19.62 -15.10 -13.91 -8.74
Airlines 0.51 -3.64 -19.62 -15.10 -13.91 -8.74
Road & Rail 0.72 -5.13 1.33 -3.00 -6.88 -15.02
Railroads 0.66 -5.44 1.08 -3.59 -7.07 -15.31
continued
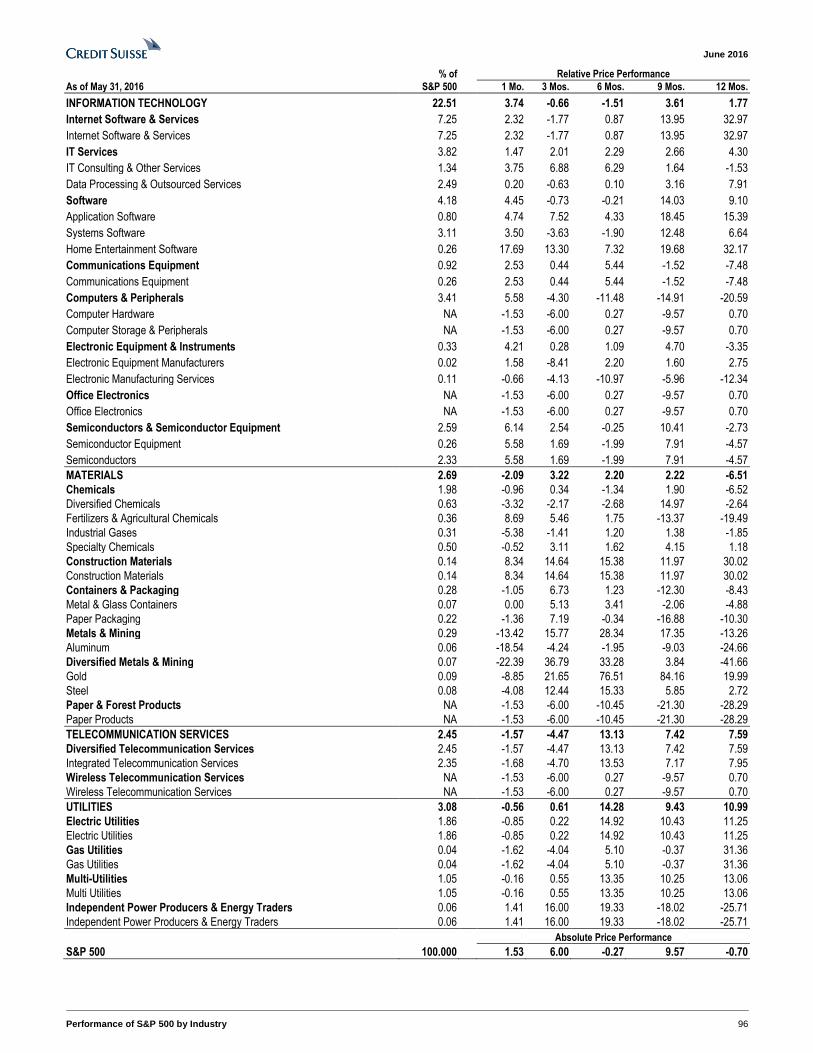
June 2016
Performance of S&P 500 by Industry 96
% of Relative Price Performance
As of May 31, 2016 S&P 500 1 Mo. 3 Mos. 6 Mos. 9 Mos. 12 Mos.
INFORMATION TECHNOLOGY 22.51 3.74 -0.66 -1.51 3.61 1.77
Internet Software & Services 7.25 2.32 -1.77 0.87 13.95 32.97
Internet Software & Services 7.25 2.32 -1.77 0.87 13.95 32.97
IT Services 3.82 1.47 2.01 2.29 2.66 4.30
IT Consulting & Other Services 1.34 3.75 6.88 6.29 1.64 -1.53
Data Processing & Outsourced Services 2.49 0.20 -0.63 0.10 3.16 7.91
Software 4.18 4.45 -0.73 -0.21 14.03 9.10
Application Software 0.80 4.74 7.52 4.33 18.45 15.39
Systems Software 3.11 3.50 -3.63 -1.90 12.48 6.64
Home Entertainment Software 0.26 17.69 13.30 7.32 19.68 32.17
Communications Equipment 0.92 2.53 0.44 5.44 -1.52 -7.48
Communications Equipment 0.26 2.53 0.44 5.44 -1.52 -7.48
Computers & Peripherals 3.41 5.58 -4.30 -11.48 -14.91 -20.59
Computer Hardware NA -1.53 -6.00 0.27 -9.57 0.70
Computer Storage & Peripherals NA -1.53 -6.00 0.27 -9.57 0.70
Electronic Equipment & Instruments 0.33 4.21 0.28 1.09 4.70 -3.35
Electronic Equipment Manufacturers 0.02 1.58 -8.41 2.20 1.60 2.75
Electronic Manufacturing Services 0.11 -0.66 -4.13 -10.97 -5.96 -12.34
Office Electronics NA -1.53 -6.00 0.27 -9.57 0.70
Office Electronics NA -1.53 -6.00 0.27 -9.57 0.70
Semiconductors & Semiconductor Equipment 2.59 6.14 2.54 -0.25 10.41 -2.73
Semiconductor Equipment 0.26 5.58 1.69 -1.99 7.91 -4.57
Semiconductors 2.33 5.58 1.69 -1.99 7.91 -4.57
MATERIALS 2.69 -2.09 3.22 2.20 2.22 -6.51
Chemicals 1.98 -0.96 0.34 -1.34 1.90 -6.52
Diversified Chemicals 0.63 -3.32 -2.17 -2.68 14.97 -2.64
Fertilizers & Agricultural Chemicals 0.36 8.69 5.46 1.75 -13.37 -19.49
Industrial Gases 0.31 -5.38 -1.41 1.20 1.38 -1.85
Specialty Chemicals 0.50 -0.52 3.11 1.62 4.15 1.18
Construction Materials 0.14 8.34 14.64 15.38 11.97 30.02
Construction Materials 0.14 8.34 14.64 15.38 11.97 30.02
Containers & Packaging 0.28 -1.05 6.73 1.23 -12.30 -8.43
Metal & Glass Containers 0.07 0.00 5.13 3.41 -2.06 -4.88
Paper Packaging 0.22 -1.36 7.19 -0.34 -16.88 -10.30
Metals & Mining 0.29 -13.42 15.77 28.34 17.35 -13.26
Aluminum 0.06 -18.54 -4.24 -1.95 -9.03 -24.66
Diversified Metals & Mining 0.07 -22.39 36.79 33.28 3.84 -41.66
Gold 0.09 -8.85 21.65 76.51 84.16 19.99
Steel 0.08 -4.08 12.44 15.33 5.85 2.72
Paper & Forest Products NA -1.53 -6.00 -10.45 -21.30 -28.29
Paper Products NA -1.53 -6.00 -10.45 -21.30 -28.29
TELECOMMUNICATION SERVICES 2.45 -1.57 -4.47 13.13 7.42 7.59
Diversified Telecommunication Services 2.45 -1.57 -4.47 13.13 7.42 7.59
Integrated Telecommunication Services 2.35 -1.68 -4.70 13.53 7.17 7.95
Wireless Telecommunication Services NA -1.53 -6.00 0.27 -9.57 0.70
Wireless Telecommunication Services NA -1.53 -6.00 0.27 -9.57 0.70
UTILITIES 3.08 -0.56 0.61 14.28 9.43 10.99
Electric Utilities 1.86 -0.85 0.22 14.92 10.43 11.25
Electric Utilities 1.86 -0.85 0.22 14.92 10.43 11.25
Gas Utilities 0.04 -1.62 -4.04 5.10 -0.37 31.36
Gas Utilities 0.04 -1.62 -4.04 5.10 -0.37 31.36
Multi-Utilities 1.05 -0.16 0.55 13.35 10.25 13.06
Multi Utilities 1.05 -0.16 0.55 13.35 10.25 13.06
Independent Power Producers & Energy Traders 0.06 1.41 16.00 19.33 -18.02 -25.71
Independent Power Producers & Energy Traders 0.06 1.41 16.00 19.33 -18.02 -25.71
Absolute Price Performance
S&P 500 100.000 1.53 6.00 -0.27 9.57 -0.70

June 2016
Conference Calendar 97
CONFERENCE CALENDAR
2016 Conferences Event Location
June 7, 2016 Corporate Hybrid Conference London
June 8-9, 2016 Global Energy Conference London
June 14, 2016 2016 Boston Semiconductor Supply Chain Conference Boston
June 16, 2016 2016 European Building Conference London
June 21, 2016 2016 Global Chemicals and Agriculture Conference London
June 22-23, 2016 2016 Boston Basic Materials Conference Boston
August 3-4, 2016 10th Annual Midsummer LatAm Conference New York
September 1-2, 2016 2016 European Telecoms Conference London
September 7 -9, 2016 17th Annual Asian Technology Conference Taipei
September 8-9, 2016 2016 Japan Kyoto Conference Kyoto, Japan
September 8-9, 2016 3rd Annual Homebuilding & Building Products Conference New York
September 13-15, 2016 29th Annual Basic Materials Conference New York
September 14-15, 2016 2016 European Industrials Conference London
September 14-15, 2016 7th Annual US Small & Mid Cap Conference New York
September 22, 2016 2nd Annual Chicago Consumer Roundup Chicago
September 28-29, 2016 2016 Paris Auto Show Conference Paris
September 28-29, 2016 2nd Annual Oilfield Services Bus Tour Houston
November 2-4, 2016 7th Annual China Investment Conference Shenzhen
November 28-December 1, 2016 20th Annual Technology, Media & Telecom Conference Scottsdale, AZ
February 13-16, 2017 22nd Annual Energy Summit Vail, CO
*Invitation only event. Please contact your Credit Suisse salesperson.
Certain events have limited availability.
For further information, please contact your Credit Suisse sales representative directly.

June 2016
U.S. Equity Research Analysts 98
U.S. EQUITY RESEARCH ANALYSTS
Stefano Natella, Head of Global Markets Research 212 325 4217
John McNulty, Director of U.S. Equity Research 212 325 4385
Glen Santangelo, Director of U.S. Equity Research 212 538 5678
Katheryn Iorio, COO of U.S. Equity Research 212 538 6386
CONSUMER DISCRETIONARY
Apparel, Footwear, and Softlines Christian Buss ............................................................................... 212 325 9667
Homebuilding Michael Dahl ................................................................................. 212 325 5882
Media, Cable & Satellite Omar Sheikh ................................................................................. 212 325 6818
Movie Exhibitors Anthony Nemoto ........................................................................... 212 325 6065
Restaurants Jason West ................................................................................... 617 556 5745
Retail, Mall Anchors Michael Exstein ............................................................................. 212 325 4147
Retail, Mass Merchants Michael Exstein ............................................................................. 212 325 4147
Retail, Specialty Hardlines Seth Sigman.................................................................................. 212 538 8043
Travel & Leisure Ben Chaiken.................................................................................. 212 325 2585
CONSUMER STAPLES
Agribusiness Robert Moskow ............................................................................. 212 538 3095
Packaged Foods Robert Moskow ............................................................................. 212 538 3095
Retail, Food and Drug Edward Kelly ................................................................................. 212 325 3241
ENERGY
Clean Technologies Patrick Jobin.................................................................................. 212 325 0843
Independent Refiners Edward Westlake .......................................................................... 212 325 6751
Integrated Oil & Gas Edward Westlake .......................................................................... 212 325 6751
Master Limited Partnerships John Edwards ............................................................................... 713 890 1594 Bhavesh Lodaya ........................................................................... 212 325 2337
Oil & Gas Equipment & Services Gregory Lewis ............................................................................... 212 325 6418
Oil & Gas Exploration & Production Mark Lear ...................................................................................... 212 538 0239 Edward Westlake .......................................................................... 212 325 6751
Oilfield Services James Wicklund ............................................................................ 214 979 4111
Small-Cap Oil & Gas E&P Mark Lear ...................................................................................... 212 538 0239
FINANCIALS
Asset Managers Craig Siegenthaler ........................................................................ 212 325 3104
Capital Markets Christian Bolu ................................................................................ 212 538 9805
Ashley Serrao................................................................................ 212 538 8424
Large-Cap Banks Susan Roth Katzke ....................................................................... 212 325 1237
Mid-Cap Banks Jill Shea ........................................................................................ 212 325 5801
Specialty Finance Moshe Orenbuch .......................................................................... 212 538 6795
Mortgage REITs Douglas Harter ............................................................................. 212 538 5983
Property & Casualty Insurance Ryan Tunis.................................................................................... 212 325 6306
REITs Ian Weissman ............................................................................... 212 538 6889
GLOBAL SERVICES
Business Services Anjaneya Singh ............................................................................ 212 325 7306
Knowledge Services Trace Urdan .................................................................................. 415 249 7926
Payments & Financial Technology Paul Condra ................................................................................. 212 325 8903
HEALTHCARE
Animal Health Erin Wilson .................................................................................... 212 538 4080
Biotechnology Alethia Young ............................................................................... 212 538 0640
Healthcare Technology & Distribution Robert Willoughby ........................................................................ 212 325 1497
Major Pharmaceuticals Vamil Divan................................................................................... 212 538 5394
Managed Care & Health Care Facilities Scott Fidel ..................................................................................... 212 538 0812
Medical Supplies & Devices Matthew Keeler ............................................................................. 212 325 9008
SMID-Cap Biotechnology Kennen MacKay ........................................................................... 212 538 5241
INDUSTRIALS
Aerospace & Defense Robert Spingarn ........................................................................... 212 538 1895 Julie Yates .................................................................................... 212 325 3706
Airlines Julie Yates .................................................................................... 212 325 3706
Electrical Equipment & Multi-Industry Julian Mitchell ............................................................................... 212 325 6668 Ronnie Weiss................................................................................ 212 538 6404
Engineering & Construction Jamie Cook ................................................................................... 212 538 6098
Environmental Services Andrew Buscaglia ......................................................................... 212 325 5870
Machinery Jamie Cook ................................................................................... 212 538 6098
Ocean Shipping Gregory Lewis............................................................................... 212 325 6418
Trading Companies & Distributors Jamie Cook ................................................................................... 212 538 6098
Transportation Allison Landry ............................................................................... 212 325 3716

June 2016
U.S. Equity Research Analysts 99
MATERIALS
Chemicals & Agriculture Christopher Parkinson .................................................................. 212 538 6286
Metals & Mining Curt Woodworth ............................................................................ 212 325 5117
Paper & Packaging Lars Kjellberg ............................................................................ 46 8 545 07 926
TECHNOLOGY
Consumer Internet Stephen Ju .................................................................................... 212 325 8662
Global Technology Research Strategist John Pitzer .................................................................................... 212 538 4610
Global Telecommunications Equipment Kulbinder Garcha .......................................................................... 212 325 4795
IT Hardware Kulbinder Garcha .......................................................................... 212 325 4795
Semiconductor Devices John Pitzer .................................................................................... 212 538 4610
Semiconductor Equipment Farhan Ahmad .............................................................................. 415 249 7929
Small- & Mid-Cap Internet Stephen Ju .................................................................................... 212 325 8662
Small- & Mid-Cap Software Michael Nemeroff .......................................................................... 212 325 2052 Kyle Chen ...................................................................................... 212 325 7514
Software Philip Winslow ............................................................................... 212 325 6157 Siti Panigrahi ................................................................................. 212 325 2686
TELECOMMUNICATION SERVICES
Wireline & Wireless Telecom Services Joseph Mastrogiovanni ................................................................. 212 325 3757
MACRO
Global Equity Strategy Andrew Garthwaite .................................................................. 44 20 7883 6477
U.S. Equity Strategy Lori Calvasina ............................................................................... 212 538 6396
U.S. Economics James Sweeney ............................................................................ 212 538 4648
Global Energy Economics Jan Stuart ...................................................................................... 212 325 1013
Accounting & Tax David Zion ..................................................................................... 212 538 4837
RESEARCH PRODUCT MANAGER
Andrew St Pierre .................................................................... 212 325 5618
GLOBAL HARD DOLLAR SALES & MARKETING
Mara Lipner................................................................................... 212 325 3786
CANADIAN EQUITY RESEARCH TEAM
Andrew M. Kuske, Director of Canadian Equity Research .......... 416 352 4561
CONSUMER DISCRETIONARY
Media Robert Peters………………………………………………………….416 352 4550
CONSUMER STAPLES
Grocery Industry David Hartley ................................................................................ 416 352 4580
ENERGY
Oil & Gas Jason Frew ................................................................................... 416 352 4585 David Phung ................................................................................. 403 476 6023
Pipelines & Utilities Andrew M. Kuske ......................................................................... 416 352 4561 Paul Tan ....................................................................................... 416 352 4593
FINANCIALS
Banks Kevin R. Choquette ...................................................................... 416 352 4585 Nick Stogdill .................................................................................. 416 352 4592
Diversified Financial Services Andrew M. Kuske ......................................................................... 416 352 4561
Life Insurance Kevin R. Choquette ...................................................................... 416 352 4585 Nick Stogdill .................................................................................. 416 352 4592
MATERIALS
Diversified Metals & Mining Ralph Profiti .................................................................................. 416 352 4563
Gold & Precious Metals Anita Soni ..................................................................................... 416 352 4587
Forest Products Andrew M. Kuske ......................................................................... 416 352 4561
TELECOMMUNICATION SERVICES
Cable and Telecommunications Robert Peters………………………………………………………….416 352 4550

June 2016
Disclosure Appendix 100
DISCLOSURE APPENDIX
Important Global Disclosures
The analysts identified in this report each certify, with respect to the companies or securities that the individual analyzes, that (1) the views expressed in this report accurately reflect his or her personal views about all of the subject companies and securities and (2) no part of his or her compensation was, is or will be directly or indirectly related to the specific recommendations or views expressed in this report.
The analyst(s) responsible for preparing this research report received Compensation that is based upon various factors including Credit Suisse's total revenues, a portion of which are generated by Credit Suisse's investment banking activities
As of December 10, 2012 Analysts’ stock rating are defined as follows:
Outperform (O) : The stock’s total return is expected to outperform the relevant benchmark* over the next 12 months.
Neutral (N) : The stock’s total return is expected to be in line with the relevant benchmark* over the next 12 months.
Underperform (U) : The stock’s total return is expected to underperform the relevant benchmark* over the next 12 months.
*Relevant benchmark by region: As of 10th December 2012, Japanese ratings are based on a stock’s total return relative to the analyst's coverage universe which consists of all companies covered by the analyst within the relevant sector, with Outperforms representing the most attractive, Neutrals the less attrac tive, and Underperforms the least attractive investment opportunities. As of 2nd October 2012, U.S. and Canadian as well as Europea n ratings are based on a stock’s total return relative to the analyst's coverage universe which consists of all companies covered by the analyst within the relevant sector, with Outperforms representing the most attractive, Neutrals the less attractive, and Underperforms the least attractive investment opportunities. For Latin American and non -Japan Asia stocks, ratings are based on a stock’s total return relative to the average total return of the relevant country or regional benchmark; prior to 2nd October 2012 U.S. and Canadian ratings were based on (1) a stock’s absolute total return potential to its current share price and (2) the relative attractiveness of a stock’s total return potential within an analyst’s coverage universe. For Australian and New Zealand stocks, the expected total return (ETR) calculation includes 12-month rolling dividend yield. An Outperform rating is assigned where an ETR is greater than or equal to 7.5%; Underperform where an ETR less than or equal to 5%. A Neutral may be assigned where the ETR is between -5% and 15%. The overlapping rating range allows analysts to assign a rating that puts ETR in the context of associated risks. Prior to 18 May 2015, ETR ranges for Outperform and Underperform ratings did not overlap with Neutral thresholds between 15% and 7.5%, which was in operation from 7 July 2011.
Restricted (R) : In certain circumstances, Credit Suisse policy and/or applicable law and regulations preclude certain types of communications, including an investment recommendation, during the course of Credit Suisse's engagement in an investment banking transaction and in certain other circumstances.
Volatility Indicator [V] : A stock is defined as volatile if the stock price has moved up or down by 20% or more in a month in at least 8 of the past 24 months or the analyst expects significant volatility going forward.
Analysts’ sector weightings are distinct from analysts’ stock ratings and are based on the analyst’s expectations for the fundamentals and/or valuation of the sector* relative to the group’s historic fundamentals and/or valuation:
Overweight : The analyst’s expectation for the sector’s fundamentals and/or valuation is favorable over the next 12 months.
Market Weight : The analyst’s expectation for the sector’s fundamentals and/or valuation is neutral over the next 12 months.
Underweight : The analyst’s expectation for the sector’s fundamentals and/or valuation is cautious over the next 12 months.
*An analyst’s coverage sector consists of all companies covered by the analyst within the relevant sector. An analyst may cover multiple sectors.
Credit Suisse's distribution of stock ratings (and banking clients) is:
Global Ratings Distribution
Rating Versus universe (%) Of which banking clients (%)
Outperform/Buy* 56% (38% banking clients)
Neutral/Hold* 34% (21% banking clients)
Underperform/Sell* 9% (44% banking clients)
Restricted 1%
*For purposes of the NYSE and NASD ratings distribution disclosure requirements, our stock ratings of Outperform, Neutral, an d Underperform most closely correspond to Buy, Hold, and Sell, respectively; however, the meanings are not the same, as our stock ratings are determined on a relative basis. (Please refer to definitions above.) An investor's decision to buy or sell a security should be based on investment objectives, current holdings, and other individual factors.
Credit Suisse’s policy is to update research reports as it deems appropriate, based on developments with the subject company, the sector or the market that may have a material impact on the research views or opinions stated herein.
Credit Suisse's policy is only to publish investment research that is impartial, independent, clear, fair and not misleading. For more detail please refer to Credit Suisse's Policies for Managing Conflicts of Interest in connection with Investment Research: http://www.csfb.com/research-and-analytics/disclaimer/managing_conflicts_disclaimer.html
Credit Suisse does not provide any tax advice. Any statement herein regarding any US federal tax is not intended or written to be used, and cannot be used, by any taxpayer for the purposes of avoiding any penalties.
This material is intended for your use only and not for general distribution. This material is not intended to promote or procure a particular outcome in the UK referendum on membership of the European Union (the “Referendum”). Credit Suisse does not promote or endorse either campaign in the Referendum. This material does not constitute, and should not be interpreted as, a recommendation by Credit Suisse as to the merits of a particular outcome of the Referendum.

June 2016
Disclosure Appendix 101
Credit Suisse has a material conflict of interest with the subject company (FB.OQ) . Credit Suisse has been named as a defendant in various
putative shareholder class-action lawsuits relating to Facebook, Inc.’s May 2012 initial public offering. Credit Suisse’s practice is not to comment in
research reports on pending litigations to which it is a party. Nothing in this report should be construed as an opinion on the merits or potential
outcome of the lawsuits.
Important Regional Disclosures
Singapore recipients should contact Credit Suisse AG, Singapore Branch for any matters arising from this research report.
The analyst(s) involved in the preparation of this report may participate in events hosted by the subject company, including site visits. Credit Suisse does not accept or permit analysts to accept payment or reimbursement for travel expenses associated with these events.
Restrictions on certain Canadian securities are indicated by the following abbreviations: NVS--Non-Voting shares; RVS--Restricted Voting Shares; SVS--Subordinate Voting Shares.
Individuals receiving this report from a Canadian investment dealer that is not affiliated with Credit Suisse should be advised that this report may not contain regulatory disclosures the non-affiliated Canadian investment dealer would be required to make if this were its own report.
For Credit Suisse Securities (Canada), Inc.'s policies and procedures regarding the dissemination of equity research, please visit https://www.credit-suisse.com/sites/disclaimers-ib/en/canada-research-policy.html.
As of the date of this report, Credit Suisse acts as a market maker or liquidity provider in the equities securities that are the subject of this report.
Principal is not guaranteed in the case of equities because equity prices are variable.
Commission is the commission rate or the amount agreed with a customer when setting up an account or at any time after that.
Important Credit Suisse HOLT Disclosures
With respect to the analysis in this report based on the Credit Suisse HOLT methodology, Credit Suisse certifies that (1) the views expressed in this report accurately reflect the Credit Suisse HOLT methodology and (2) no part of the Firm’s compensation was, is, or will be directly related to the specific views disclosed in this report.
The Credit Suisse HOLT methodology does not assign ratings to a security. It is an analytical tool that involves use of a set of proprietary quantitative algorithms and warranted value calculations, collectively called the Credit Suisse HOLT valuation model, that are consistently applied to all the companies included in its database. Third-party data (including consensus earnings estimates) are systematically translated into a number of default algorithms available in the Credit Suisse HOLT valuation model. The source financial statement, pricing, and earnings data provided by outside data vendors are subject to quality control and may also be adjusted to more closely measure the underlying economics of firm performance. The adjustments provide consistency when analyzing a single company across time, or analyzing multiple companies across industries or national borders. The default scenario that is produced by the Credit Suisse HOLT valuation model establishes the baseline valuation for a security, and a user then may adjust the default variables to produce alternative scenarios, any of which could occur.
Additional information about the Credit Suisse HOLT methodology is available on request.
The Credit Suisse HOLT methodology does not assign a price target to a security. The default scenario that is produced by the Credit Suisse HOLT valuation model establishes a warranted price for a security, and as the third-party data are updated, the warranted price may also change. The default variable may also be adjusted to produce alternative warranted prices, any of which could occur.
CFROI®, HOLT, HOLTfolio, ValueSearch, AggreGator, Signal Flag and “Powered by HOLT” are trademarks or service marks or registered trademarks or registered service marks of Credit Suisse or its affiliates in the United States and other countries. HOLT is a corporate performance and valuation advisory service of Credit Suisse.
For Credit Suisse disclosure information on other companies mentioned in this report, please visit the website at https://rave.credit-suisse.com/disclosures or call +1 (877) 291-2683.


June 2016
Americas / United States
Equity Research
MR0024.doc
References in this report to Credit Suisse include all of the subsidiaries and affiliates of Credit Suisse operating under its investment banking division. For more information on our structure, please use the following link: https://www.credit-suisse.com/who_we_are/en/.This report may contain material that is not directed to, or intended for distribution to or use by, any person or entity who is a citizen or resident of or located in any locality, state, country or other jurisdiction where such distribution, publication, availability or use would be contrary to law or regulation or which would subject Credit Suisse AG or its affiliates ("CS") to any registration or licensing requirement within such jurisdiction. All material presented in this report, unless specifically indicated otherwise, is under copyright to CS. None of the material, nor its content, nor any copy of it, may be altered in any way, transmitted to, copied or distributed to any other party, without the prior express written permission of CS. All trademarks, service marks and logos used in this report are trademarks or service marks or registered trademarks or service marks of CS or its affiliates. The information, tools and material presented in this report are provided to you for information purposes only and are not to be used or considered as an offer or the solicitation of an offer to sell or to buy or subscribe for securities or other financial instruments. CS may not have taken any steps to ensure that the securities referred to in this report are suitable for any particular investor. CS will not treat recipients of this report as its customers by virtue of their receiving this report. The investments and services contained or referred to in this report may not be suitable for you and it is recommended that you consult an independent investment advisor if you are in doubt about such investments or investment services. Nothing in this report constitutes investment, legal, accounting or tax advice, or a representation that any investment or strategy is suitable or appropriate to your individual circumstances, or otherwise constitutes a personal recommendation to you. CS does not advise on the tax consequences of investments and you are advised to contact an independent tax adviser. Please note in particular that the bases and levels of taxation may change. Information and opinions presented in this report have been obtained or derived from sources believed by CS to be reliable, but CS makes no representation as to their accuracy or completeness. CS accepts no liability for loss arising from the use of the material presented in this report, except that this exclusion of liability does not apply to the extent that such liability arises under specific statutes or regulations applicable to CS. This report is not to be relied upon in substitution for the exercise of independent judgment. CS may have issued, and may in the future issue, other communications that are inconsistent with, and reach different conclusions from, the information presented in this report. Those communications reflect the different assumptions, views and analytical methods of the analysts who prepared them and CS is under no obligation to ensure that such other communications are brought to the attention of any recipient of this report. CS may, to the extent permitted by law, participate or invest in financing transactions with the issuer(s) of the securities referred to in this report, perform services for or solicit business from such issuers, and/or have a position or holding, or other material interest, or effect transactions, in such securities or options thereon, or other investments related thereto. In addition, it may make markets in the securities mentioned in the material presented in this report. CS may have, within the last three years, served as manager or co-manager of a public offering of securities for, or currently may make a primary market in issues of, any or all of the entities mentioned in this report or may be providing, or have provided within the previous 12 months, significant advice or investment services in relation to the investment concerned or a related investment. Additional information is, subject to duties of confidentiality, available on request. Some investments referred to in this report will be offered solely by a single entity and in the case of some investments solely by CS, or an associate of CS or CS may be the only market maker in such investments. Past performance should not be taken as an indication or guarantee of future performance, and no representation or warranty, express or implied, is made regarding future performance. Information, opinions and estimates contained in this report reflect a judgment at its original date of publication by CS and are subject to change without notice. The price, value of and income from any of the securities or financial instruments mentioned in this report can fall as well as rise. The value of securities and financial instruments is subject to exchange rate fluctuation that may have a positive or adverse effect on the price or income of such securities or financial instruments. Investors in securities such as ADR's, the values of which are influenced by currency volatility, effectively assume this risk. Structured securities are complex instruments, typically involve a high degree of risk and are intended for sale only to sophisticated investors who are capable of understanding and assuming the risks involved. The market value of any structured security may be affected by changes in economic, financial and political factors (including, but not limited to, spot and forward interest and exchange rates), time to maturity, market conditions and volatility, and the credit quality of any issuer or reference issuer. Any investor interested in purchasing a structured product should conduct their own investigation and analysis of the product and consult with their own professional advisers as to the risks involved in making such a purchase. Some investments discussed in this report may have a high level of volatility. High volatility investments may experience sudden and large falls in their value causing losses when that investment is realised. Those losses may equal your original investment. Indeed, in the case of some investments the potential losses may exceed the amount of initial investment and, in such circumstances, you may be required to pay more money to support those losses. Income yields from investments may fluctuate and, in consequence, initial capital paid to make the investment may be used as part of that income yield. Some investments may not be readily realisable and it may be difficult to sell or realise those investments, similarly it may prove difficult for you to obtain reliable information about the value, or risks, to which such an investment is exposed. This report may provide the addresses of, or contain hyperlinks to, websites. Except to the extent to which the report refers to website material of CS, CS has not reviewed any such site and takes no responsibility for the content contained therein. Such address or hyperlink (including addresses or hyperlinks to CS's own website material) is provided solely for your convenience and information and the content of any such website does not in any way form part of this document. Accessing such website or following such link through this report or CS's website shall be at your own risk. This report is issued and distributed in Europe (except Switzerland) by Credit Suisse Securities (Europe) Limited, One Cabot Square, London E14 4QJ, England, which is regulated in the United Kingdom by The Financial Services Authority ("FSA"). This report is being distributed in Germany by Credit Suisse Securities (Europe) This report is being distributed in the United States and Canada by Credit Suisse Securities (USA) LLC; in Switzerland by Credit Suisse AG; in Brazil by Banco de Investimentos Credit Suisse (Brasil) S.A or its affiliates; in Mexico by Banco Credit Suisse (México), S.A. (transactions related to the securities mentioned in this report will only be effected in compliance with applicable regulation); in Japan by Credit Suisse Securities (Japan) Limited, Financial Instruments Firm, Director-General of Kanto Local Finance Bureau (Kinsho) No. 66, a member of Japan Securities Dealers Association, The Financial Futures Association of Japan, Japan Investment Advisers Association, Type II Financial Instruments Firms Association; elsewhere in Asia/ Pacific by whichever of the following is the appropriately authorised entity in the relevant jurisdiction: Credit Suisse (Hong Kong) Limited, Credit Suisse Equities (Australia) Limited, Credit Suisse Securities (Thailand) Limited, having registered address at 990 Abdulrahim Place, 27 Floor, Unit 2701, Rama IV Road, Silom, Bangrak, Bangkok 10500, Thailand, Tel. +66 2614 6000, Credit Suisse Securities (Malaysia) Sdn Bhd, Credit Suisse AG, Singapore Branch, Credit Suisse Securities (India) Private Limited regulated by the Securities and Exchange Board of India (registration Nos. INB230970637; INF230970637; INB010970631; INF010970631), having registered address at 9th Floor, Ceejay House, Dr.A.B. Road, Worli, Mumbai - 18, India, T- +91-22 6777 3777, Credit Suisse Securities (Europe) Limited, Seoul Branch, Credit Suisse AG, Taipei Securities Branch, PT Credit Suisse Securities Indonesia, Credit Suisse Securities (Philippines ) Inc., and elsewhere in the world by the relevant authorised affiliate of the above. Research on Taiwanese securities produced by Credit Suisse AG, Taipei Securities Branch has been prepared by a registered Senior Business Person. Research provided to residents of Malaysia is authorised by the Head of Research for Credit Suisse Securities (Malaysia) Sdn Bhd, to whom they should direct any queries on +603 2723 2020. This report has been prepared and issued for distribution in Singapore to institutional investors, accredited investors and expert investors (each as defined under the Financial Advisers Regulations) only, and is also distributed by Credit Suisse AG, Singapore branch to overseas investors (as defined under the Financial Advisers Regulations). By virtue of your status as an institutional investor, accredited investor, expert investor or overseas investor, Credit Suisse AG, Singapore branch is exempted from complying with certain compliance requirements under the Financial Advisers Act, Chapter 110 of Singapore (the "FAA"), the Financial Advisers Regulations and the relevant Notices and Guidelines issued thereunder, in respect of any financial advisory service which Credit Suisse AG, Singapore branch may provide to you. This research may not conform to Canadian disclosure requirements. In jurisdictions where CS is not already registered or licensed to trade in securities, transactions will only be effected in accordance with applicable securities legislation, which will vary from jurisdiction to jurisdiction and may require that the trade be made in accordance with applicable exemptions from registration or licensing requirements. Non-U.S. customers wishing to effect a transaction should contact a CS entity in their local jurisdiction unless governing law permits otherwise. U.S. customers wishing to effect a transaction should do so only by contacting a representative at Credit Suisse Securities (USA) LLC in the U.S. Please note that this research was originally prepared and issued by CS for distribution to their market professional and institutional investor customers. Recipients who are not market professional or institutional investor customers of CS should seek the advice of their independent financial advisor prior to taking any investment decision based on this report or for any necessary explanation of its contents. This research may relate to investments or services of a person outside of the UK or to other matters which are not regulated by the FSA or in respect of which the protections of the FSA for private customers and/or the UK compensation scheme may not be available, and further details as to where this may be the case are available upon request in respect of this report. CS may provide various services to US municipal entities or obligated persons ("municipalities"), including suggesting individual transactions or trades and entering into such transactions. Any services CS provides to municipalities are not viewed as "advice" within the meaning of Section 975 of the Dodd-Frank Wall Street Reform and Consumer Protection Act. CS is providing any such services and related information solely on an arm's length basis and not as an advisor or fiduciary to the municipality. In connection with the provision of the any such services, there is no agreement, direct or indirect, between any municipality (including the officials, management, employees or agents thereof) and CS for CS to provide advice to the municipality. Municipalities should consult with their financial, accounting and legal advisors regarding any such services provided by CS. In addition, CS is not acting for direct or indirect compensation to solicit the municipality on behalf of an unaffiliated broker, dealer, municipal securities dealer, municipal advisor, or investment adviser for the purpose of obtaining or retaining an engagement by the municipality for or in connection with Municipal Financial Products, the issuance of municipal securities, or of an investment adviser to provide investment advisory services to or on behalf of the municipality. If this report is being distributed by a financial institution other than Credit Suisse AG, or its affiliates, that financial institution is solely responsible for distribution. Clients of that institution should contact that institution to effect a transaction in the securities mentioned in this report or require further information. This report does not constitute investment advice by Credit Suisse to the clients of the distributing financial institution, and neither Credit Suisse AG, its affiliates, and their respective officers, directors and employees accept any liability whatsoever for any direct or consequential loss arising from their use of this report or its content. Principal is not guaranteed. Commission is the commission rate or the amount agreed with a customer when setting up an account or at any time after that.
Copyright © 2016 CREDIT SUISSE AG and/or its affiliates. All rights reserved.
Investment principal on bonds can be eroded depending on sale price or market price. In addition, there are bonds on which investment principal can be eroded due to changes in redemption amounts. Care is required when investing in such instruments.
When you purchase non-listed Japanese fixed income securities (Japanese government bonds, Japanese municipal bonds, Japanese government guaranteed bonds, Japanese corporate bonds) from CS as a seller, you will be requested to pay the purchase price only.