monthly research piece: update of our yearly forecast
TRANSCRIPT

THE FRED REPORT 4514 Chamblee-Dunwoody Rd, Suite 112 Dunwoody, GA 30338 Phone: (404) 875-FRED e-mail: [email protected] See us at: www.thefredreport.com
Positive Negative Neutral Highlight
↔ Change
Current Opinion
Previous Months Opinion Market Review Page
Price Charts
↔ ↔ SPY – SPDR S & P 500 ETF 4 ↔ ↔ MDY – SPDR S & P 400 ETF 5 ↔ ↔ IJR – iShares S & P 600 Index 6
↔ ↔ IYT - iShares Dow Jones Transportation Average 7
↔ ↔ Daily - Fred’s Price Oscillator 8 ↔ ↔ Weekly - Fred’s Price Oscillator 9
Internal Momentum
Daily Fred’s Breadth Oscillator 10 Weekly Fred’s Breadth Oscillator 11
↔ ↔ Fred’s New Highs/New Lows Indicator 12 McClellan Oscillator 13
Sentiment
Put/Call Ratio 14 ↔ Investors Intelligence % Bears Indicator 15
Current Opinion
Previous Months Opinion Other Markets Page
Bonds
TLT – iShares Barclays 20+ Year Treasury Bond 16 ↔ ↔ BWX – SPDR Barclays Capital Intl Treasury Bond 17 LQD – iShares iBoxx $ Invest Grade Corp Bond 18
↔ ↔ HYG – iShares iBoxx $ High Yield Corp Bond 19 International
↔ ↔ EEM – iShares MSCI Emerging Markets 20 ↔ ↔ EFA – iShares MSCI EAFE Index 21 Currencies
FXE – Currency Shares Euro Trust 22 FXY – Currency Shares Japanese Yen Trust 23 FXA – Currency Shares Australian Dollar Trust 24 US Dollar Index 25
Commodities
DBC – Power Shares DB Commodity Index 26 GLD – SPDR Gold Shares 27
↔ ↔ USO – United States Oil 28 ↔ ↔ UNG – United States Natural Gas 29
Sector Review
Equal Equal ETF Sector Charts: Consumer Discretionary (XLY) 30 Overweight Overweight ETF Sector Charts: Consumer Staples (XLP) 31 Underweight Underweight ETF Sector Charts: Energy (XLE) 32
Equal Equal ETF Sector Charts: Financials (XLF) 33 Equal Equal ETF Sector Charts: Health Care (XLV) 34
Overweight Overweight ETF Sector Charts: Industrial (XLI) 35 Equal Equal ETF Sector Charts: Materials (XLB) 36 Equal Equal ETF Sector Charts: Utilities (XLU) 37 Equal Equal ETF Sector Charts: Technology (IYW) 38
Underweight Underweight ETF Sector Charts: Telecom (IYZ) 39
Research Piece or Guest Column 40
The FRED Report – Monthly Review Monthly Research Piece: Update of Our Yearly Forecast
Volume 8, Issue 6 June 2016 Charts as of 05/27/16
Financial Research, Education & Data

Page 2
ASSET CLASSES:
STOCKS:
Rating the three Market Principles: As readers know, we break the stock market down into three basic market principles: (a) Sentiment, (b) Internal Momentum, and (c) External Momentum. I will review these here.
Sentiment: We use two indicators to measure sentiment. These are options activity and certain sentiment polls. For options, we use total CBOE volume and take the figure directly from the CBOE website. For our sentiment poll numbers, we prefer using % Bears from Investors Intelligence. We use only the % Bear’s number because, in our opinion, the bears almost always take action. It is rare to find a complacent bear. Sentiment is what we call a “Condition Indicator”. By this we mean it has nothing to do with timing trades – rather it is part of the overall mosaic of market activity.
Our current reading of the sentiment indicators is NEUTRAL. %Bears remains in buy mode but has started to come down sharply. This indicator is almost in bearish territory. The Put/Call indicator weakened last month as prices advanced, and suggests skepticism at these levels. Market Vane and Consensus, Inc. figures are showing more bulls – we do not give charts but these are now weakening. We are rating sentiment Neutral here because the intermediate sentiment indicator is still up, although weak, while the daily readings are still in negative territory.
Internal Momentum: We use several Breadth indicators to measure internal momentum. We publish three indicators in this Monthly Review: The McClellan Oscillator, an Indicator of New Highs on the NYSE vs. New Lows, and our own breadth oscillator – called Fred’s Breadth Oscillator, or FBO. The McClellan gives great trading signals, while the last two are also “Condition Indicators”.
Our current reading of the internal momentum indicators is NEUTRAL, mostly because of the daily FBO. The intermediate FBO is at resistance. We now consider this a neutral signal. The daily FBO gave a breadth surge, a positive, but is weakening more than expected. The McClellan Oscillator is showing waning momentum. New Highs/New Lows is now at resistance. This indicator broke the downtrend from 2015. Small and Mid-Cap stocks have improved but continue to lag, and more time is needed to repair this discrepancy. Transports are still weak. The oversold monthly FPO’s from February have moved to neutral. The market rallied at the end of May, but indicators are overbought intermediate-term. This is another key level for stocks, and failure is possible after end of month seasonality ends.
External Momentum: We use several price indicators to measure this, and these are primarily tactical indicators. We use the 5 and 20 period moving averages, and a simple crossover to determine trend. We use Stochastics, another standard indicator, to measure overbought/oversold levels, or as we prefer to consider them, areas of risk and reward. The one criticism of Stochastics is that they are too sensitive, so we also have our own Price Oscillator we publish, called Fred’s Price Oscillator, or the FPO.
Summary of Monthly Piece
The FRED Report – Monthly Review

Page 3
Summary of Monthly Piece…..continued The FRED Report – Monthly Revie
Our current rating of the External Momentum indicators is NEGATIVE. Stochastics are overbought on a weekly basis, and the dailies are overbought with most in sell mode. The weekly FPO’s are still up, and the dailies are overbought, and suggesting this rally is over. The divergences are so obvious that many are noting these, but they remain a concern nonetheless. There is a Dow Theory sell signal in place, and this will take a while to resolve. Transports are weaker than the broad market.
CONCLUSION: The bear market structure at the end of 2015 has improved but it has not been repaired. We have been in short-term rally mode, but the market is at resistance. The general tone of the market has improved, but non-confirmations still exist. Until the structure corrects the market is vulnerable, although some downside objectives were met. We are more vulnerable now than any time since the beginning of 2016, and we are still cautious. How June goes will give us an idea of how 2016 ends. Our forecast is a stronger market in the second half, but this may fail here and then rally in the fourth quarter.
FIXED INCOME: TLT may have made a top in this area. While some other instruments finally rallied this looks late. LQD had a sharp rally to resistance. HYG and the junk bond ETFs have hit downside targets and have rallied – now they have hit upside trading targets. The bond rally this year has been concentrated in treasuries and such rallies have proved to be ephemeral in the past. The picture is more mixed than it was at the beginning of 2015 however. We continue to be cautious on bonds, and use alternatives such as PCY and CWB, and dividend stock ETFs.
COMMODITIES: We have seen a rally in some commodities, and this is a bright spot in the current environment. GLD continues to rally, and the monthly moving averages have gone positive for the first time since 2013. This suggests a move to the 160-area on GLD is likely. The oil rally continues but trend indicators are still negative, and it has not exceeded major resistance. Our favorite broad-based commodity index ETF, DBC, rallied but is still weaker than expected. We had strong oversold buy signal on the CRB, and it rallied enough to correct the oversold condition. Both DBC and CRB are at resistance.
INTERNATIONAL: International markets are challenging. Emerging markets rallied to resistance and failed, but it looks better than developed markets. The Dollar Index (DX#F or UUP) has started to rally. We want to be careful as the monthly FPO on the dollar is in oversold territory, and the dollar might continue a “surprise” rally that could spook the markets. We believe more Greek problems could emerge, so we are using country ETFs, and not broad based European units. China continues to have problems.
SECTORS: We remain over weight on XLI and XLP. We remain underweight XLE and IYZ. The XLF has been a disappointment and if rates fail to rise, we would be concerned. Objectively, QE has failed to produce worldwide growth and the idea of “negative interest rates” is doubling down on an ineffective policy, in our view. If equity markets start to see things this way, then we could have another decline in world stock markets. IYW has had several major components report less than stellar earnings, sparking a decline. Most Tech stocks are languishing. XLV is weak, and we may move back to an underweight on this sector. Biotech may underperform longer than many believe is possible. XLB and XLE are potentially improving charts, as they are rallying short-term. The biggest concern we have when looking at the sector charts is that some of the sectors have Head and Shoulders topping patterns, and if these start to mature we could see a much more difficult market than currently exists. With our 5 and 20 moving average on the monthly SPY negative, we remain cautious although we note some improvements in the indicators. We continue to believe the “elephant in the room” is commodity deflation and China weakness. A pullback in commodities would spook the markets, in our view.

Page 4
The SPY is overbought on the stochastic, and the weekly remains overbought: Stocks fulfilled the sell signal given on the stochastics to start 2016. The daily is overbought, and price is at resistance. A break of 202 would suggest the short-term uptrend has ended. We bought the last daily buy signal, and believe this is the best chance for a breakout, and stops were moved to breakeven at 205. The overall market internals have started to weaken, but this could change. Areas of concern on the downside if the market corrects are 202, 197 – 195 and 180.
Market Review: Price Charts – SPY – SP 500 ETF
The FRED Report – Monthly Review

Page 5
The MDY is stronger than SPY short-term, but still weaker long term: The short term stochastic is overbought. This rebound has served to get weekly indicators overbought once again, and the short-term chart is positive relative to SPY, a plus. This suggests that the market has started to broaden out, but this process is just beginning and should have more time to correct itself. MDY is trading above 260, a plus. Below 260 would be a concern. This is an improving chart but still weaker than SPY
Market Review: Price Charts – MDY – MidCap SPDRS ETF
The FRED Report – Monthly Review

Page 6
The Small Cap ETF is slightly weaker than MDY and SPY: While the healing process for the market has begun, this index is trading just a bit worse than MDY and SPY. We have closed above 110 on IJR, a plus. Ideally, this will improve relative to SPY and MDY, and hold 110 - 108.There is improvement, but we need more relative to large caps to be bullish. Stochastics are overbought short-term, and in sell mode on the weekly chart, and if the daily rolls over there could be a summer correction.
Market Review: Price Charts – IJR – IShares S&P SmallCap 600 Index ETF
The FRED Report – Monthly Review

Page 7
The IYT remains weaker than the primary indexes, as 150 is not being tested on this rally: This index is our favorite measure of economic strength. The Transports usually peak ahead of Industrials, and there was weakness in Transports relative to Industrials throughout 2015. The Monthly FPO on the Transports was extremely oversold at the end of January, and has resolved this condition. Transports had a down April andIYT failed to challenge 150, worse than other indexes. In other words, this is weaker than SPY, enough to be a concern, and unlike last month this is getting worse. Be cautious if this moves back below 135, which was recently tested.
Market Review: Price Charts – IYT - Transportation
The FRED Report – Monthly Review

Page 8
-30
-25
-20
-15
-10
-5
0
5
10
15
20
25
30
35
40
45
50
7-Jun-14
1-Jul-14
25-Jul-14
18-Aug-
14
11-Sep-
14
5-Oct-14
29-Oct-14
22-Nov-
14
16-Dec-14
9-Jan-15
2-Feb-15
26-Feb-15
22-Mar-15
15-Apr-15
9-May-
15
2-Jun-15
26-Jun-15
20-Jul-15
13-Aug-
15
6-Sep-
15
30-Sep-
15
24-Oct-15
17-Nov-
15
11-Dec-15
4-Jan-16
28-Jan-16
21-Feb-16
16-Mar-16
9-Apr-16
3-May-
16
27-May-
16
50055060065070075080085090095010001050110011501200125013001350140014501500155016001650170017501800185019001950200020502100215022002250
SPX
FPO DAILY
Oversold
Overbought
The daily FPO is overbought, suggesting some consolidation could occur: Last month this was oversold enough to spark a rally and this has occurred. We thought last month’s set up might give enough ”energy” to punch through the 210 resistance on SPY and while stocks have rallied, in some respects this rally has been weaker than we would have liked to see. It took longer to materialize (note the complex bottom on the daily stochastic rather than a sharp advance). Stocks could continue this advance, and we have recommended staying long, albeit with breakeven stops, for aggressive advisors. Failure here could, however, lead to a summer correction.
Market Review: Price Charts – Daily - Fred’s Price Oscillator
The FRED Report – Monthly Review
Page 9
-25
-20
-15
-10
-5
0
5
10
15
20
25
30
35
40
45
50
29-Mar-12
17-Jun-12
5-Sep-12
24-Nov-12
12-Feb-13
3-May-
13
22-Jul-13
10-Oct-13
29-Dec-13
19-Mar-14
7-Jun-14
26-Aug-14
14-Nov-14
2-Feb-15
23-Apr-15
12-Jul-15
30-Sep-15
19-Dec-15
8-Mar-16
27-May-
16
-500-400-300-200-100010020030040050060070080090010001100120013001400150016001700180019002000210022002300
SPX
FPO WEEKLY
OVERSOLD
OVERBOUGHT
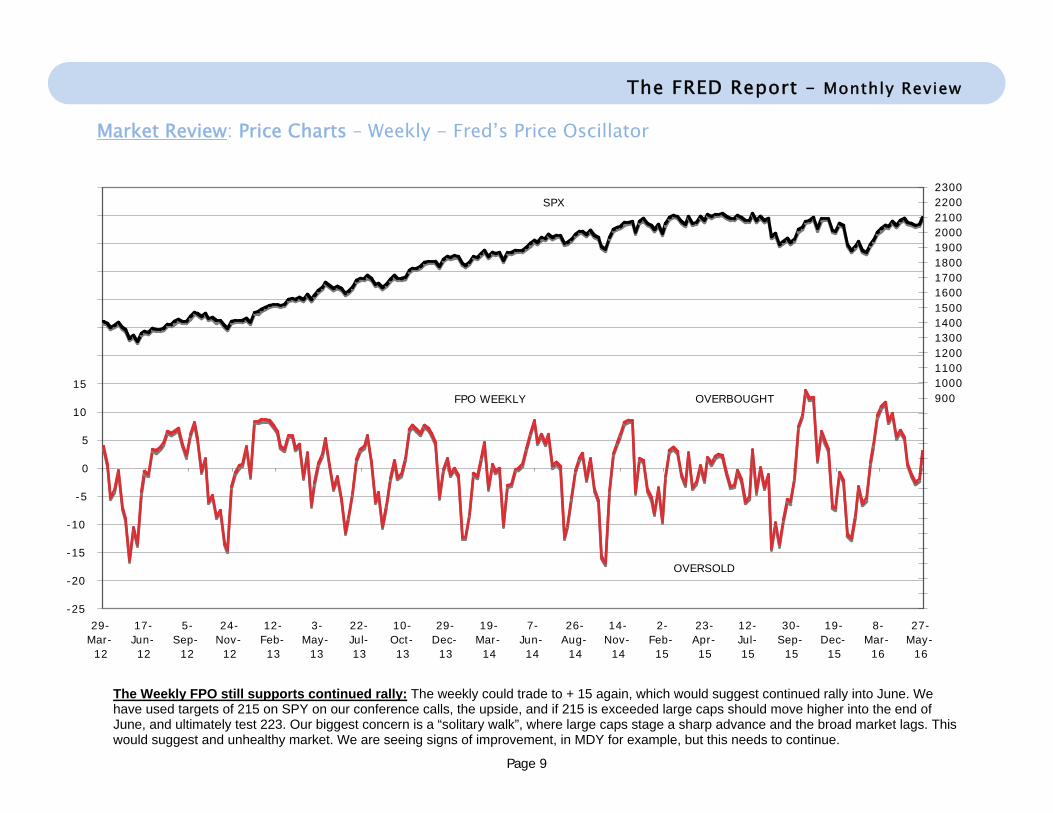
The Weekly FPO still supports continued rally: The weekly could trade to + 15 again, which would suggest continued rally into June. We have used targets of 215 on SPY on our conference calls, the upside, and if 215 is exceeded large caps should move higher into the end of June, and ultimately test 223. Our biggest concern is a “solitary walk”, where large caps stage a sharp advance and the broad market lags. This would suggest and unhealthy market. We are seeing signs of improvement, in MDY for example, but this needs to continue.
Market Review: Price Charts – Weekly - Fred’s Price Oscillator
The FRED Report – Monthly Review

Page 10
600650700750800850900950
100010501100115012001250130013501400145015001550160016501700175018001850190019502000205021002150
7-Feb-14
19-Mar-14
28-Apr-14
7-Jun-14
17-Jul-14
26-Aug-14
5-Oct-14
14-Nov-14
24-Dec-14
2-Feb-15
14-Mar-15
23-Apr-15
2-Jun-15
12-Jul-15
21-Aug-15
30-Sep-15
9-Nov-15
19-Dec-15
28-Jan-16
8-Mar-16
17-Apr-16
27-May-
16
8
9
10
11
12
13
14
15
16
17
18
19
20
21
22
23
24
25
26
27
28
29
30
SPX Daily
FBO Daily OVERBOUGHT
OVERSOLD
Market Review: Internal Momentum – Daily Fred’s Breadth Oscillator
The FRED Report – Monthly Review
The daily FBO had a bullish breadth surge, but this is now weakening enough to be a concern: Weak breadth momentum for much of 2015 led to a decline as forecast by this indicator. The recent breadth surge was a plus and noted as such, but recent action has been weaker than we would like to see. This indicator should have turned up on this advance and failed to do so, suggesting a bit more weakness than we believed we would see. Breadth says caution is indicated once again.

Page 11
200
300
400
500
600
700
800
900
1000
1100
1200
1300
1400
1500
1600
1700
1800
1900
2000
2100
2200
19-May-
10
6-Sep-10
25-Dec-10
14-Apr-11
2-Aug-11
20-Nov-11
9-Mar-12
27-Jun-12
15-Oct-12
2-Feb-13
23-May-
13
10-Sep-13
29-Dec-13
18-Apr-14
6-Aug-14
24-Nov-14
14-Mar-15
2-Jul-15
20-Oct-15
7-Feb-16
27-May-
16
6
8
10
12
14
16
18
20
22
24
26
28
30
32
34
36
38
40
Weekly SPX
Weekly FBO
The Intermediate FBO has also weakened, but this is not as significant as the daily pattern: Weekly breadth momentum hit oversold territory and the buy pattern resolved in upside behavior. There is improvement but the indicator still has not broken out, instead moving up to and holding resistance. There is enough improvement here to suggest the market could be choppy without another major correction, but strong rallies generally do not emerge from this formation without more of an initial surge. A little caution is warranted because of the daily readings.
Market Review: Internal Momentum – Weekly Fred’s Breadth Oscillator
The FRED Report – Monthly Review

Page 12
200
300
400
500
600
700
800
900
1000
1100
1200
1300
1400
1500
1600
1700
1800
1900
2000
2100
2200
2300
17-Jun-12
5-Sep-
12
24-Nov-12
12-Feb-13
3-May-
13
22-Jul-13
10-Oct-13
29-Dec-13
19-Mar-14
7-Jun-14
26-Aug-14
14-Nov-14
2-Feb-15
23-Apr-15
12-Jul-15
30-Sep-
15
19-Dec-15
8-Mar-16
27-May-
16
-150
-100
-50
0
50
100
150
200
250
300
350
400
SPX Weekly
NH/NL Indicator
New Highs/New Lows has improved, and exceeded the late 2015 high, but it too is weakening: This tool measures the difference between the amount of new highs and new lows on the NYSE. The data was negative for much of December and January, and this hit a second selling climax. This indicator is stalling, and in the face of increased bullish sentiment. The formation of this indicator, and some of the others in this monthly, is not generally indicative of a potential continuation pattern on the market. Rather, it suggests consolidation could occur.
Market Review: Internal Momentum – Fred’s New Highs/New Lows Indicator
The FRED Report – Monthly Review

Page 13
700740780820860900940980
1020106011001140118012201260130013401380142014601500154015801620166017001740178018201860190019401980202020602100214021802220
4-Nov-14
4-Dec-14
3-Jan-15
2-Feb-15
4-Mar-15
3-Apr-15
3-May-
15
2-Jun-15
2-Jul-15
1-Aug-15
31-Aug-15
30-Sep-15
30-Oct-15
29-Nov-15
29-Dec-15
28-Jan-16
27-Feb-16
28-Mar-16
27-Apr-16
27-May-
16
-460-410-360-310-260-210-160-110-60-104090140190240290340390440490540590640690740790
SPX Daily
McClellan
Oversold
Overbought
`
The McClellan Oscillator is weak relative to the market, a concern: The pattern on this indicator is suggesting that breadth momentum has continued to weaken after a strong push in early March. How this resolves will tell us much about the rest of 2016, but the risk is that it is forecasting a short-term peak in this area, and a correction. While not an extremely negative pattern, we have concerns that this divergence is suggesting weakness rather than strength.
Market Review: Internal Momentum – McClellan Oscillator
The FRED Report – Monthly Review

Page 14
0.6
0.7
0.8
0.9
1
1.1
1.2
1.3
1.4
1.5
1.6
1-Jan-13
24-Feb-13
19-Apr-13
12-Jun-13
5-Aug-
13
28-Sep-
13
21-Nov-
13
14-Jan-14
9-Mar-
14
2-May-
14
25-Jun-14
18-Aug-
14
11-Oct-14
4-Dec-
14
27-Jan-15
22-Mar-
15
15-May-
15
8-Jul-15
31-Aug-
15
24-Oct-15
17-Dec-
15
9-Feb-16
3-Apr-16
27-May-
16
400450500550600650700750800850900950100010501100115012001250130013501400145015001550160016501700175018001850190019502000205021002150
SPX Daily
Put/Call Ratio Indicator
The Put/Call ratio moved into slight bearish mode and is now neutral: Sentiment indicators are “condition” indicators for us, and not timing tools. Put/Call is more of a short-term indicator. This indicator was strong for much of the month, but we now see a shift in sentiment over the last week. This is contrarian bearish. The overall view we hear is that “this move is the breakout”, and should the market fail to exceed 215 on SPY there could be concerns.
Market Review: Sentiment – Put/Call Ratio
The FRED Report – Monthly Review

Page 15
-200-100
0100200300400500600700800900
10001100120013001400150016001700180019002000210022002300
23-Jun-11
1-Oct-11
9-Jan-12
18-Apr-12
27-Jul-12
4-Nov-
12
12-Feb-13
23-May-
13
31-Aug-
13
9-Dec-13
19-Mar-14
27-Jun-14
5-Oct-14
13-Jan-15
23-Apr-15
1-Aug-
15
9-Nov-
15
17-Feb-16
27-May-
16
10
15
20
25
30
35
40
45
50
55
60
65
70
75
80
85
90
95
100
SPX Weekly
% Bears Indicator
Investor’s Intelligence %Bears indicator sharply rolled over but remains in buy territory: The action in the Investors Intelligence numbers is starting to weaken, with daily readings around 20. The indicator is still in bull territory intermediate-term, but may leave this in June. We have had a decent rally off the low, and this indicator is still elevated. While we do not measure the % bulls, in fact it has increased over the last few weeks, a concern. Overall sentiment is still positive, but less so than last month, not a surprise.
The FRED Report – Monthly Review
Market Review: Sentiment – Investors Intelligence % Bears Indicator (moving averages)

Page 16
The TLT is in a consolidation and the weekly stochastic is in sell mode: TLT has had a sharp rally, but now a topping formation looks under way. This market could have made a significant peak in this area. For investors, we would consider a sale at this time, and a switch into SPHD, SDOG or DVY with some of the money. We believe hot money entered TLT, and timing the exit of this money will be difficult. One concern we have is that stocks and bonds may start to move together and not opposite, similar to the relationship that persisted in the 1980’s – 1990’s. We would be cautious on bonds and if TLT breaks down through 125 - 124 it could test 115 and then 96 – 92.
Other Markets: Bonds – TLT – iShares Barclays 20+ Year Treasury Bond
The FRED Report – Monthly Review
Page 17
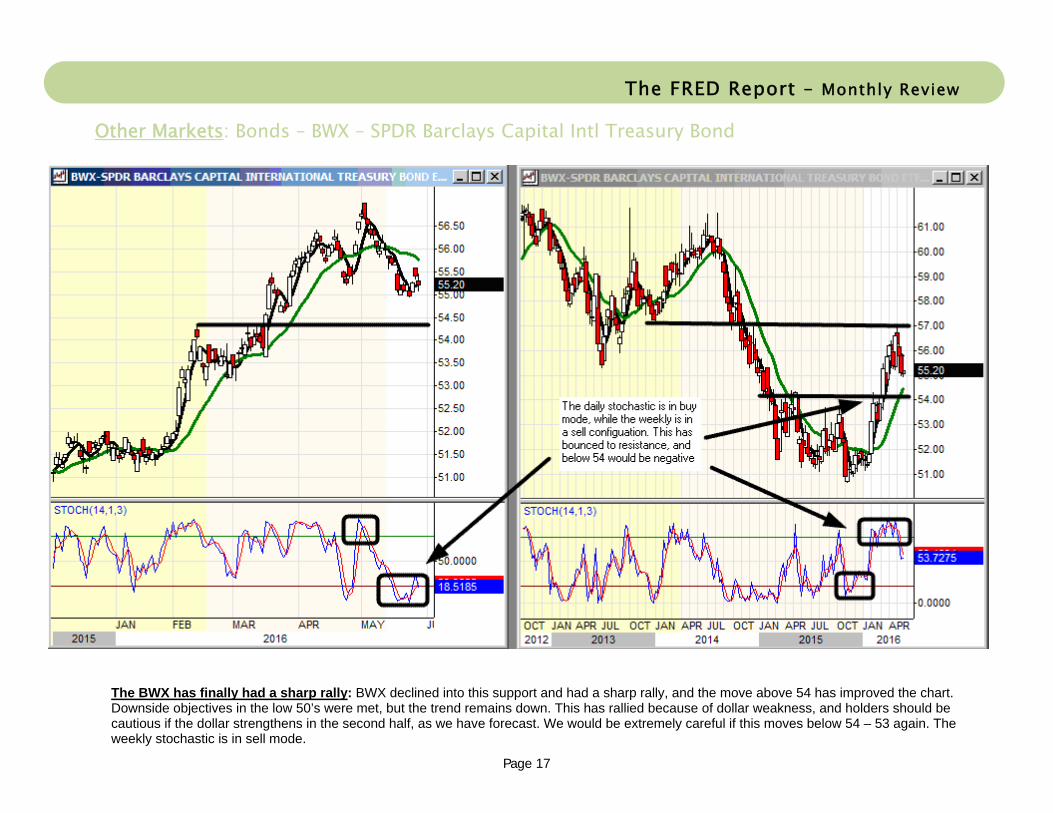
The BWX has finally had a sharp rally: BWX declined into this support and had a sharp rally, and the move above 54 has improved the chart. Downside objectives in the low 50’s were met, but the trend remains down. This has rallied because of dollar weakness, and holders should be cautious if the dollar strengthens in the second half, as we have forecast. We would be extremely careful if this moves below 54 – 53 again. The weekly stochastic is in sell mode.
Other Markets: Bonds – BWX – SPDR Barclays Capital Intl Treasury Bond
The FRED Report – Monthly Review

Page 18
The Corporate Bond ETF broke the 115 support, and revalidated: LQD is not trading with TLT – look at the relative positions of the of the price charts to verify this. LQD has moved below 115 but revalidated and the trend moved to neutral above 117.50, in many respects acting like a typical false breakdown chart. If LQD moves below 117 again, there could be a period of sustained weakness. We have suggested using this limited bond strength to move into dividend stocks for long-term investors, as failure in this area could be a long-term problem.
Other Markets: Bonds – LQD – iShares iBoxx $ Invest Grade Corp Bond
The FRED Report – Monthly Review

Page 19
The High Yield Bond has bounced but is now in resistance and is overbought: HYG came close to our 75-area target on the downside. We recommended a trade in this for aggressive advisors and it has moved up to our 82.50 target. This ETF still carries a high degree of risk, although it remains above 82.50. The stochastics are overbought, with the daily in slight sell mode. Cautious traders should consider sale of this here, as 85 is strong resistance and this should pause there even in the best of circumstances.
Other Markets: Bonds – HYG – iShares iBoxx $ High Yield Corp Bond
The FRED Report – Monthly Review
Page 20
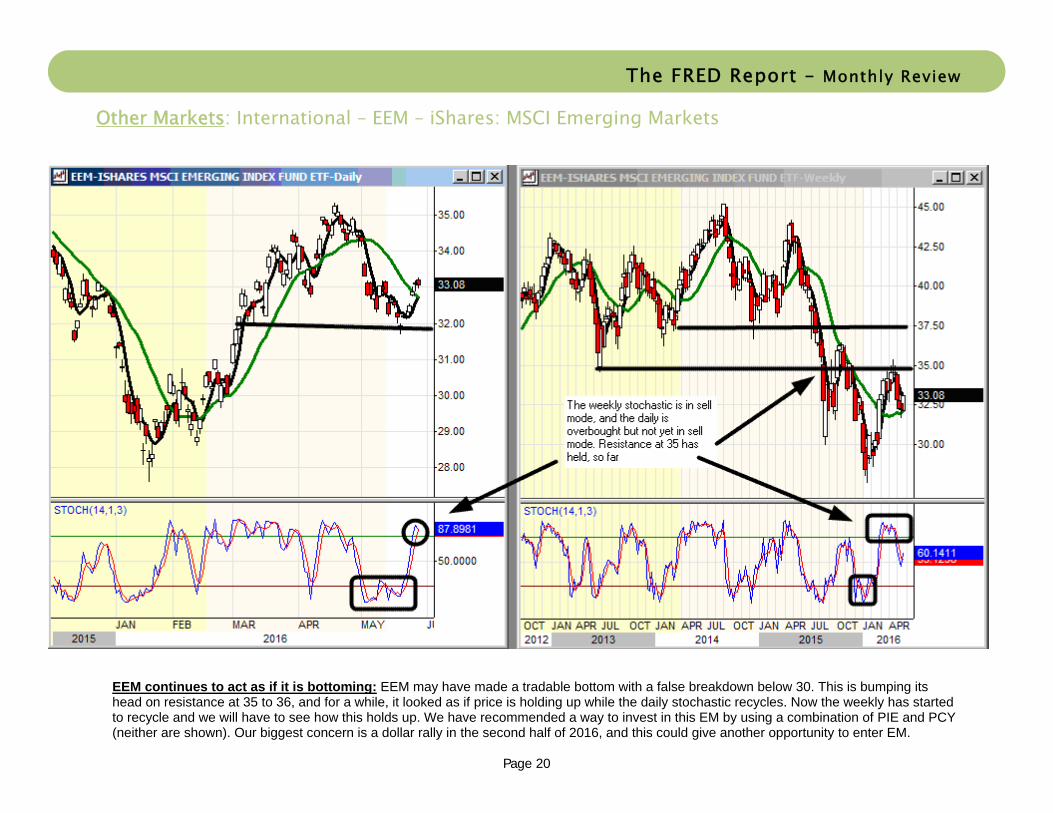
EEM continues to act as if it is bottoming: EEM may have made a tradable bottom with a false breakdown below 30. This is bumping its head on resistance at 35 to 36, and for a while, it looked as if price is holding up while the daily stochastic recycles. Now the weekly has started to recycle and we will have to see how this holds up. We have recommended a way to invest in this EM by using a combination of PIE and PCY (neither are shown). Our biggest concern is a dollar rally in the second half of 2016, and this could give another opportunity to enter EM.
Other Markets: International – EEM – iShares: MSCI Emerging Markets
The FRED Report – Monthly Review

Page 21
The EFA broke 57-area support but has rebounded: EFA broke support in the 57 area, tested secondary support quickly at 52, and is back above 57 but not by much. The pattern is improving, but has less potential, in our view, than even EEM and U.S. stocks. The weekly stochastic has gone negative, suggesting a new decline is possible and below 51 would concern us. We continue to like EWL and EWGS for developed markets – these have some relative strength and could be the best of a bad lot. We still do not have any good signals to buy international.
Other Markets: International – EFA – iShares: MSCI EAFE Index
The FRED Report – Monthly Review

Page 22
The Euro ETF has rallied and the intermediate chart is still a base: The Euro held our downside target of 105 – 103 at first, and retested this area. The first rally tested our first objective of 110 to 112 or so, and the second has tested 115. The latest rally is testing 112 again. Basing between 103 and 115 is possible. See the chart of the dollar on p.25, as it could advance and if this occurs, the Euro could make new lows. The stochastic pattern has deteriorated and there is risk that this could weaken in the second part of 2015.
Other Markets: Currencies – FXE – CurrencyShares Euro Trust
The FRED Report – Monthly Review

Page 23
The Japanese Yen ETF has rallied to our 90-area target, and the weekly stochastic is negative: Support held, and FXY rallied in the face of negative news. FXY is now in a weekly stochastic sell, and could retrace some of the recent rise, although the pattern is favorable. New lows remain possible and if 85 breaks, a test of 80 should occur, but this is unlikely. The risk here is that the dollar strengthens in the second half of 2016, which means FXY pulls back, although we think the lows should hold. FXY should outperform FXE.
Other Markets: Currencies – FXY – CurrencyShares Japanese Yen Trust
The FRED Report – Monthly Review

Page 24
The Aussie Dollar may have peaked – unless back above 75 soon new lows are possible: This currency trades with gold most of the time, and FXA is weakening on short-term weakness in gold. We thought FXA probably would undergo a period of basing and this may be occurring, but unless back above 75 there could be problems with this view. The indicators are interesting, as the daily is in the cellar, and the weekly is oversold. If this fails to turn up, then we could have strong concerns. So far, this chart is indicative of a false breakdown but the risk is that it fails on a dollar rally.
Other Markets: Currencies – FXA – CurrencyShares Australian Dollar Trust
The FRED Report – Monthly Review

Page 25
The Dollar has held support and rallied ahead of our target of 91: Dollar bullish sentiment is dropping, and DXY has started to rally before hitting our target of 91. The weekly stochastic has turned up, and the monthly FPO (not shown) is oversold. Our forecast for the dollar has been a weak first half, and this occurred. We are looking for a stronger second half of the year. Below 91 would suggest this rally will fail, but otherwise we look for a test of 100 on DXY.
Other Markets: Currencies – DXY - US Dollar Index
The FRED Report – Monthly Review

Page 26
This has advanced to test 15-area resistance: DBC looks to have formed a bottom, and is at 15 resistance. This chart is still intermediate-term negative and will remain so unless above 15, but this area is being challenged. Two months ago, the monthly FPO on the CRB index gave a strong oversold buy signal and it has relieved this condition. Failure at 15 could produce a double bottom, not a bad pattern. DBC is around 50% oil, and oil has rallied into June, somewhat of a surprise. A dollar rally could hurt this but it may not react badly if the dollar is up.
Other Markets: Commodities – DBC – PowerShares DB Commodity Index
The FRED Report – Monthly Review

Page 27
Gold is pulling back and could test the gap at 112.50: GLD rallied to resistance in the 120-area, and it is pulling back from that resistance. The gap at 112.50 is support and as long as that holds this could have a sustained advance. While the monthly FPO is overbought, monthly moving averages have gone positive for the first time since 2013, suggesting a new bull market in GLD. We would look to buy this decline, right here if you are not in GLD, and look to add to positions at 113 if you are already in.
Other Markets: Commodities – GLD – SPDR Gold Shares
The FRED Report – Monthly Review

Page 28
USO may have a tradable bottom, but unless back above 12.50 – 13 this month it is still a downtrend: The weekly stochastic is overbought, and the daily is overbought and in slight sell mode. Back above 13 on USO would repair much of the damage on this chart. Oil is testing resistance both on USO and the nearby contract, and if it turns down, we could see more market turbulence. The bottom line is that oil is much improved but could still retest the low. Caution if below 10.50. Today starts OPEC’s semiannual meeting.
Other Markets: Commodities – USO – United States Oil
The FRED Report – Monthly Review

Page 29
This made a trading bottom at 7 but the short-term rally failed and UNG has made new lows: We note here that there have been issues surrounding the viability of the UNG due to contango. Readers should check with their compliance departments regarding this. We had a chance for an intermediate bottom but price failed to advance, and unless above 7.50, then 10, there could be continued weakness. We have no urgent need to buy this market and would stand aside for now. USO or UGA are much better. Seasonal strength occurs in the fall.
Other Markets: Commodities – UNG – United States Natural Gas
The FRED Report – Monthly Review

Page 30
Consumer Discretionary is fully testing resistance and may have a Head and Shoulders top, as drawn: This sector remains long-term positive. However, the chart, and the potential Head and Shoulders from last month, remains extant. The weekly stochastic is in sell mode, while the daily has advanced without breaking through the high of the right shoulder. We downgraded this sector three months ago, to an equal weight. The longer-term outlook for Industrials is stronger than Discretionary on a technical basis and we believe XLY is a crowded trade. It is not a horrible chart but there may be more risk here than consensus believes. EQUAL WEIGHT
ETF Sector Charts: Consumer Discretionary (XLY)
The FRED Report – Monthly Review

Page 31
Consumer Staples is pulling back from new highs but remains a strong chart: XLP continues to be a favorite sector given market conditions, and while defensive is still near all-time highs. The market has rallied, but is at resistance and the weekly stochastic is in sell mode. The daily suggests more upside, and if it becomes overbought and we have not made new highs, we will watch carefully. The chart remains strong as long as above 45, short-term above 51.50, now a double bottom. OVER WEIGHT
ETF Sector Charts: Consumer Staples (XLP)
The FRED Report – Monthly Review

Page 32
XLE has rebounded to test the 70-area resistance: XLE broke most support, including the 2012 low. The last daily buy signal finally moved XLE above 60, and now it has failed at 70-area resistance. Both daily and weekly stochastics are in sell mode, and our question still is whether XLE will decline similar to March of 2015? XLE is still a negative chart. We remain an underweight as we had false bottoming indications in March 2015 as well. There was a nice rally in energy and energy stocks at that time, but it gave way to lower lows. We had a trading buy on this, but this is likely over as both stochastics are overbought and 70 has held the chart. Careful if below 62, then 60. UNDER WEIGHT
ETF Sector Charts: Energy (XLE)
The FRED Report – Monthly Review

Page 33
XLF improved in May: XLF remains weak relative to other sectors on a very long-term basis, but the short and intermediate charts are improving again. XLF still has favorable fundamentals to us – we think rates should continue to rise in the second half of 2016 especially year over year. Further, we think that if this does not happen, then the result will cause huge problems. However, we would be concerned about this sector until it moves, once again, above 24, now being tested once again. XLF remains a pattern of lower highs and lower lows, until it moves above 25. We considered an under weight, but rates could rise a bit from here in late summer, which could help XLF. EQUAL WEIGHT
ETF Sector Charts: Financials (XLF)
The FRED Report – Monthly Review

Page 34
XLV held 65, but looks weak on this rally unless above 73: XLV outperformed the SPY and traded at all-time highs for much of 2014 and the first half of 2015. XLV has weakened and IBB, an important subgroup, weakened more than many expected. XLV has fully tested the 65-area support, and a break of this would target 50 and be a concern. This chart continues to be weaker than most market participants believe should be the case, but Biotech is very weak, although Drugs and Medical Supply are strong subgroups. This sector could easily lead a correction, and sharply, if it does not remain above 65. As long as below 73 this sector is high risk. EQUAL WEIGHT
ETF Sector Charts: Health Care (XLV)
The FRED Report – Monthly Review
Page 35
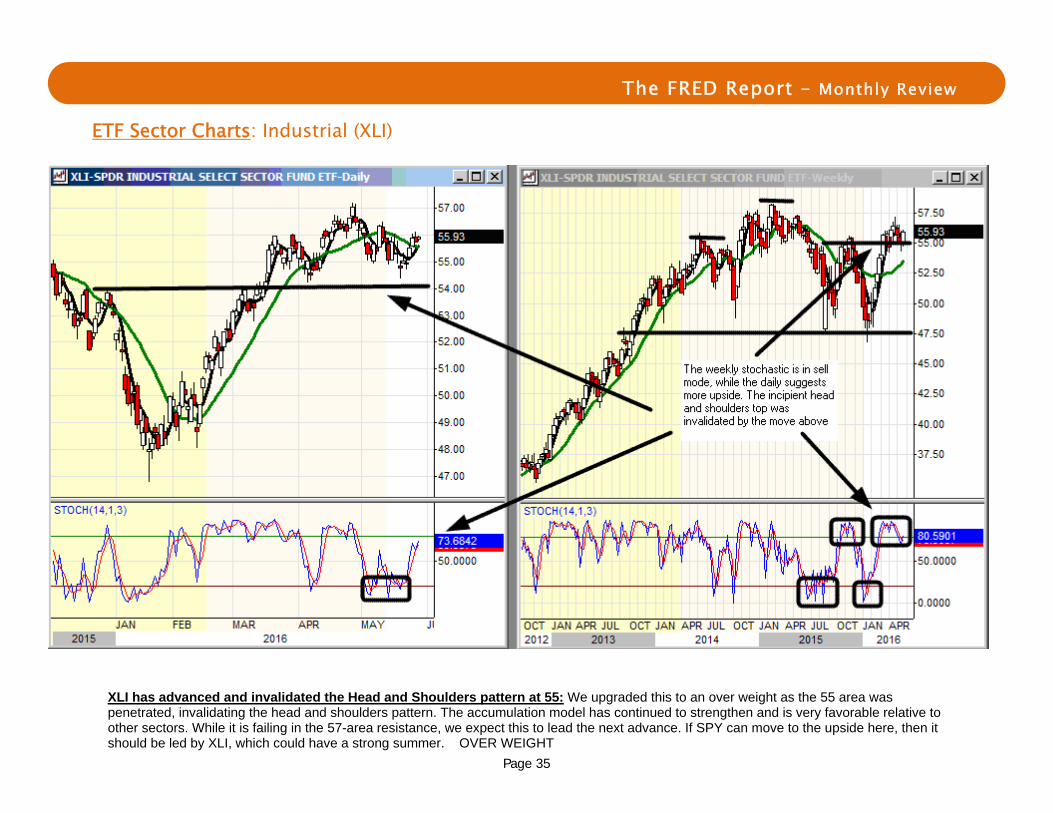
XLI has advanced and invalidated the Head and Shoulders pattern at 55: We upgraded this to an over weight as the 55 area was penetrated, invalidating the head and shoulders pattern. The accumulation model has continued to strengthen and is very favorable relative to other sectors. While it is failing in the 57-area resistance, we expect this to lead the next advance. If SPY can move to the upside here, then it should be led by XLI, which could have a strong summer. OVER WEIGHT
ETF Sector Charts: Industrial (XLI)
The FRED Report – Monthly Review

Page 36
XLB broke long-term support at 40, and has rallied into resistance: XLB is challenging the 47 to 48-area resistance. At the same time, this is still lagging the market. We remain as an equal weight, while acknowledging the risks, which are decreasing as XLB improves. There are layers of resistance throughout this area, and the daily and weekly stochastics are rolling over. There could see a retest of the 42-area, and we would buy the sector if this occurs. XLB is improving but still weaker than other sectors. There is bifurcated stock performance in the sector - a concern, as when we see this it is normally not in an improving sector. The good stocks in XLB are strong, however. EQUAL WEIGHT
ETF Sector Charts: Materials (XLB)
The FRED Report – Monthly Review

Page 37
XLU has continued to improve in the last few weeks, and is trading independent of bonds: XLU has advanced while TLT is lagging, and thus validates our strategy of selling TLT and buying dividend stocks. We think this trend can continue for the next several years. The chart is better than TLT. We had concerns that this would suffer on a stock market rally but for now, it is rallying with strong yields – even if TLT trades sideways. We expect this to outperform bonds, but not necessarily stocks, hence our equal weight. EQUAL WEIGHT
ETF Sector Charts: Utilities (XLU)
The FRED Report – Monthly Review

Page 38
IYW has improved, at least in part because of AAPL: IYW remains an equal weight although we have long-standing concerns, as everyone is overweight the sector. Broad based technology indexes have been lagging large cap Tech. Un-weighted indexes of technology are weaker (see QQQ vs. QQEW for example), and still fewer tech stocks have positive patterns. Earnings have been less robust than expected and this has started to hit the sector. AAPL may have bottomed at 93, via a 50% retracement, and this should help, but it is not the only tech stock. There are some interesting names, such as IBM and INTC, which are decent income ideas but the charts are suggesting that Tech will not be a big growth area in 2016, and possibly into 2017. We would stick to large cap names with dividend yields for now. EQUAL WEIGHT
ETF Sector Charts: Technology (IYW)
The FRED Report – Monthly Review

Page 39
IYZ has traded up to the top end of the range, and some of the stocks have great yields: Telecom has consolidated in this area. This is at resistance, but the trend remains slightly weak, as a long-term view of the sector shows no real change since mid-2013. The strong dividend plays in this sector are performing well but the rest of the sector is lagging. This, plus the long-term performance of IYZ, is why we remain underweight the sector even though it is defensive and income oriented in the larger names. Note also that it is performing better than TLT, and should do so for the next several months. We realize the comment is similar to the last two weeks but not a lot has happened in the sector or the market for that matter. UNDER WEIGHT
ETF Sector Charts: Telecom (IYZ)
The FRED Report – Monthly Review

Page 40
This piece is a mid-year update of our yearly forecast article that was originally published in The January 2016 Monthly Review. We also will update the monthly FPO charts to show progress that has been made and help to provide some perspective as well as a forecast for the end of the year. Traditionally we cover Stocks, Bonds, Gold, Swiss Franc, U.S. Dollar, Oil, and last but not least, the CRB index. We use our Monthly Fred’s Price Oscillator to forecast trends, and when indicated, junctures or expected behavior. We describe the indicator below, and then move on to the markets.
The Monthly FPO is an indicator designed to capture turning points within trends, and overbought/oversold points within long-term trends. Often these will occur between +/- 10 on the chart. When the indicator moves to or through this area we use shorter-term timeframes to refine our analysis. Moves to +/- 15 are usually quickly reversed, and it is extremely rare for the indicator to move beyond +/- 20 no matter how extreme the move without at least a partial reaction in the opposite direction. On the charts, the blue line is price, and the red line is the FPO.
The FRED Report – Monthly Review
Research Piece: Update of Our Yearly Forecast
The FRED Report – Monthly Review

Page 41
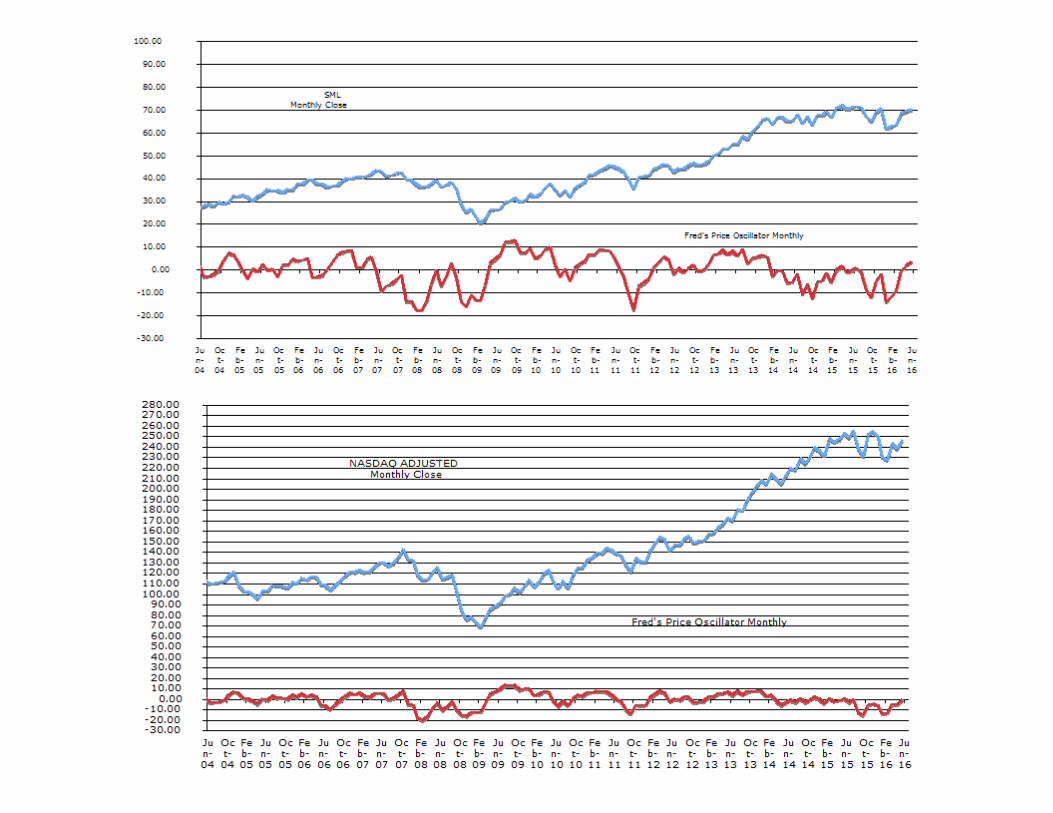
First, we cover stocks. SPX from 12/31/15 to 5/27/16 is up around 2.7% for 2016. We were looking for a couple of things in this market. In our forecast, we suggested a more volatile year with a lot of short-term moves both up and down. We also suggested that unless the market rallied “out of the gate” in January, that the first part of the year would be choppy and difficult. The choppy, up and down market we have forecast, has been correct. Our targets for 2016 were, and remain, 223 – 229, and we tried to lower these but the numbers kept coming up. In meetings, we have been saying that the second half of 2016 would be stronger than the first. The question obviously is, “Is this the rally that takes us to the 223-area on SPY” We are not sure, but we will stick with neutral timing models and a slightly defensive outlook in our “Bucket List”. We bought SPY at 205 for aggressive advisors, and raised stops to breakeven at 209. Let’s see what happens here. The Monthly FPO chart certainly suggests some more rally is possible. We also show charts of Small Cap and the NASDAQ, as the divergences in these indexes remain, and are still negative.
Page 42

Page 43
Second, we cover bonds. TLT is our primary bond vehicle and it is up around 7.70% for 2016. This is a surprise to us, as we were forecasting a decline in bonds. This year’s high was struck in January at 135.25, and the low was 120.66, struck in January. The interesting thing about TLT is this: we recommended selling this in January of 2015 at 134 and TLT has not been above this number for more than one day in 2016. The multi-decade bull market in bonds may be ending in this 2015 to 2016 timeframe. We continue to have concerns about TLT for the rest of 2016. We keep monthly FPO’s on TNX and TYX as well as bonds, but show only bonds, below. This is in a minor sell configuration, such that when the monthly stochastic on TLT turns down, we should see some corrective action. We have recommended, and continue to recommend, alternatives to mainstream bonds and bond funds such as PCY and BKLN, plus of course, preferred stocks.

Page 44
Third, we cover gold. GLD is our primary vehicle for gold and it has rallied in the first part of 2016, as we expected. The Monthly FPO moved into overbought territory last month, and has started to pull back. We also note that the monthly moving averages have become positive for the first time since February 2013. This market has huge potential now that the moving averages have gone positive, but it is overbought enough to be difficult for a while.
Page 45
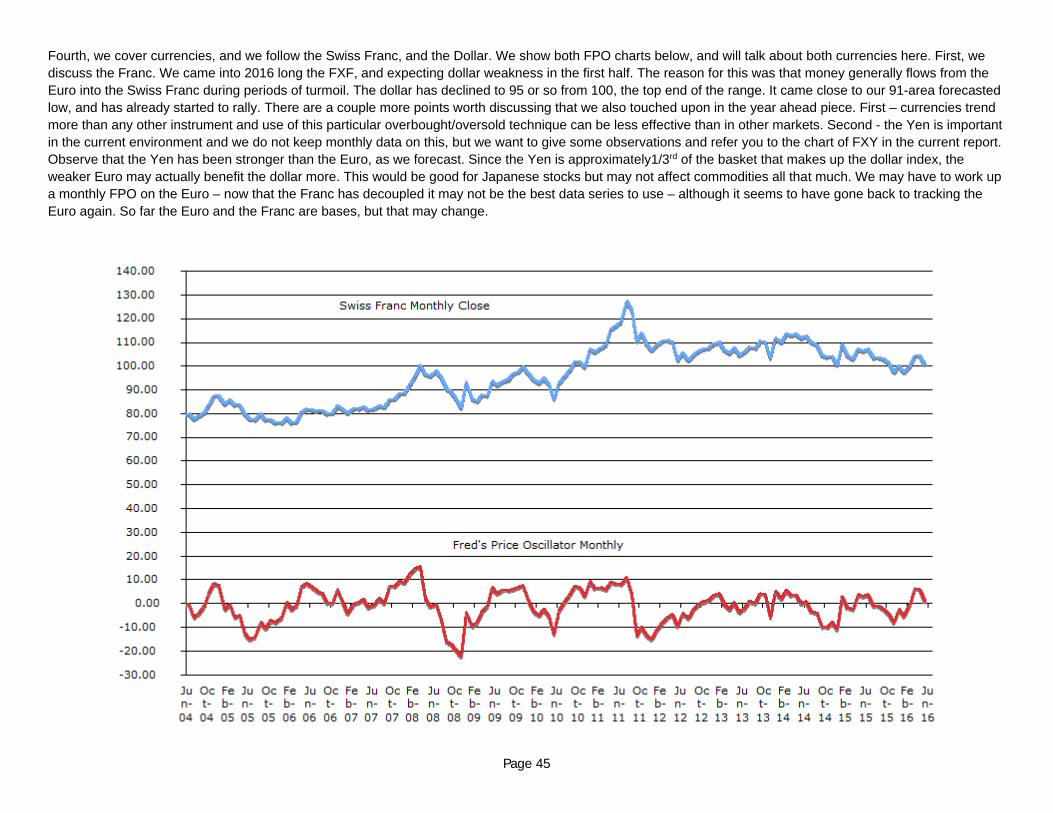
Fourth, we cover currencies, and we follow the Swiss Franc, and the Dollar. We show both FPO charts below, and will talk about both currencies here. First, we discuss the Franc. We came into 2016 long the FXF, and expecting dollar weakness in the first half. The reason for this was that money generally flows from the Euro into the Swiss Franc during periods of turmoil. The dollar has declined to 95 or so from 100, the top end of the range. It came close to our 91-area forecasted low, and has already started to rally. There are a couple more points worth discussing that we also touched upon in the year ahead piece. First – currencies trend more than any other instrument and use of this particular overbought/oversold technique can be less effective than in other markets. Second - the Yen is important in the current environment and we do not keep monthly data on this, but we want to give some observations and refer you to the chart of FXY in the current report. Observe that the Yen has been stronger than the Euro, as we forecast. Since the Yen is approximately1/3rd of the basket that makes up the dollar index, the weaker Euro may actually benefit the dollar more. This would be good for Japanese stocks but may not affect commodities all that much. We may have to work up a monthly FPO on the Euro – now that the Franc has decoupled it may not be the best data series to use – although it seems to have gone back to tracking the Euro again. So far the Euro and the Franc are bases, but that may change.

Page 46

Page 47
Fifth, we cover crude oil. Oil is up about 13.61% in 2015 as of May 29th. This has been a good year for oil forecasting so far. We were looking for a “playable bottom” no later than March, which would occur on divergence. This has occurred, and oil may have made a seasonal low in May as well. We did not give a projected target price for oil for 2016, as the state of the indicators is vitally important. We also must note that while oil has rallied and completed what could very well be a long-term bottom the fundamentals have not shown corresponding improvement. In many cases, technicals lead fundamental and we think this is happening in this case, but new lows in oil would obviate this view. It is important not to get “locked into” a view of this market if there are big changes. In the oil stocks, MLPs have improved and still look like a bottom vs. February when we recommended them, and large cap names look better than small cap names.
Page 48
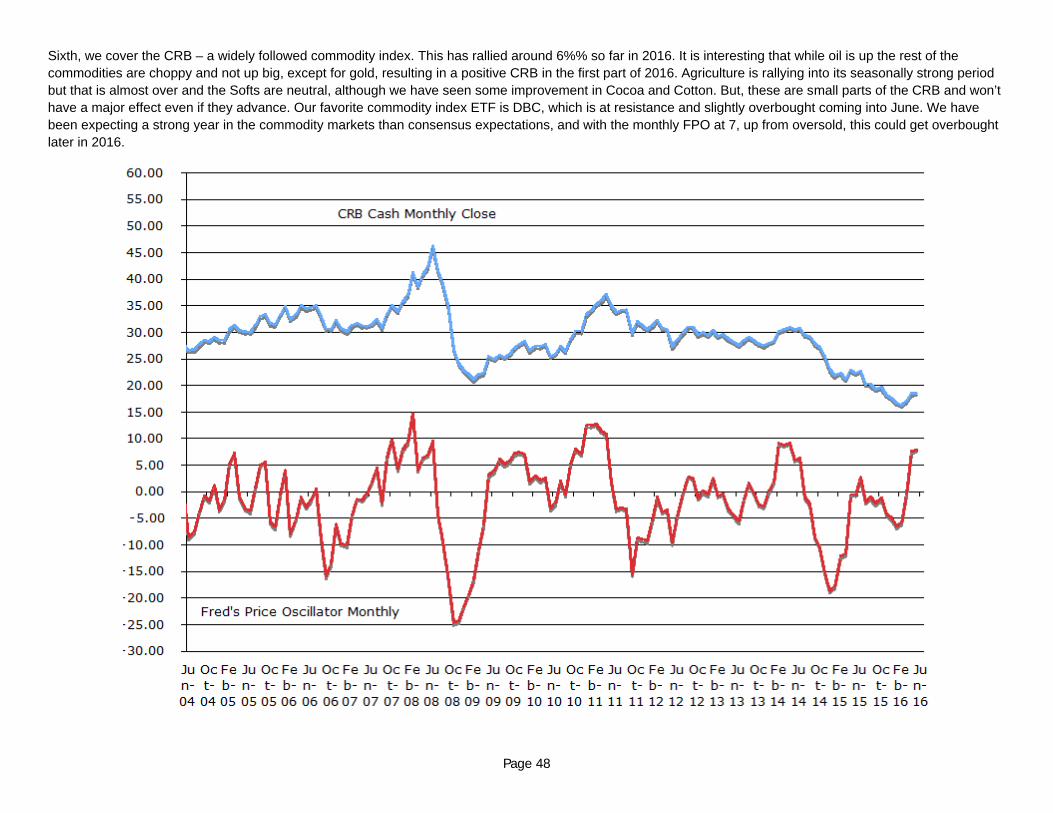
Sixth, we cover the CRB – a widely followed commodity index. This has rallied around 6%% so far in 2016. It is interesting that while oil is up the rest of the commodities are choppy and not up big, except for gold, resulting in a positive CRB in the first part of 2016. Agriculture is rallying into its seasonally strong period but that is almost over and the Softs are neutral, although we have seen some improvement in Cocoa and Cotton. But, these are small parts of the CRB and won’t have a major effect even if they advance. Our favorite commodity index ETF is DBC, which is at resistance and slightly overbought coming into June. We have been expecting a strong year in the commodity markets than consensus expectations, and with the monthly FPO at 7, up from oversold, this could get overbought later in 2016.

Page 49
Below is a listing and definition of various proprietary and non-proprietary technical indicators we rely on during our analysis of the markets: Moving Averages: Moving averages are one of the building blocks of Technical Analysis, and there are almost as many ways to use this indicator as there are technicians.
At the FRED report we teach and use a dual moving average crossover system to determine trend. Our favorites are the 5 period and 20 period moving averages. We consider the trend to be up if the 5 is above the 20, and down if below it.
Stochastics: The Stochastic Oscillator is one of the commonly used momentum oscillators and is standard on charting programs. There are two lines on the chart below, %K
and %D.
%K is the faster of the two lines, and represents a mathematical formula that measures where the current close is in relation to the trading range of the last “X” periods of time. We use a 14 period look-back, so in plain English %K says where the current close is in the trading range of the last 14 days, expressed as a %.
At the FRED report we use it somewhat differently than is commonly taught. The standard way to use the indicator is to register a buy signal when it moves below, and then above, 20 (the lowest 20% of closing prices in the last 14 days). A sell signal is when the indicator moves above, and then below 80 (the highest 80% of closes over the last 14 days).
The other line, %D, is a 3 period moving average of %K. We have found that the Stochastic is sensitive, so we advocate taking signals only in the direction of the trend. When looking at the standard FRED report chart, this would mean taking buy signals when the 5 is above the 20, and sell signals when the 5 is below the 20, but using a different technique to exit positions. The reason for this is the Stochastic is quite sensitive, and can give early indications, especially in new trends. It also can get “stuck” in the direction of trends, which connotes strength and not weakness. Another, preferred interpretation is to use the indicator to measure risk. An example: buy in an uptrend, not when the stochastic is at 90% but rather wait until it falls below 50%, This way, even if a stock, commodity, or ETF does not give one of the “classic” signals, you can still use the indicator to assess risk, and leg into positions.
Fred's Price Oscillator (FPO): This is an oscillator that I invented, using a combination of high, low and closing prices. Unlike the Stochastic, which is really sensitive, this indicator is designed to
be less sensitive. Other than that it is, of course, proprietary, so we do not disclose much about the construction of the indicator. One of the characteristics of the tool is that when the Oscillator moves below/above -15/15 the market often creates a divergence. For those of you who do not know that term it means that price will make a new low/high and the oscillator will not confirm it. That is usually the sign of a turn. On really sharp strong market moves, a couple of these divergences can occur. We use weekly data in our examples for you, as we have that data going back to the 1970’s on the SPX, and farther on the Dow Industrials, which work the same way. We would note that we keep FPO’s on the commodities, but rarely publish these, as most subscribers are interested in stocks. Like most oscillators it is most useful at bottoms, so our examples show bottoms. We can, and will, show some analysis of tops as they occur.
Fred's Breadth Oscillator (FBO): This is an Oscillator that I invented. Unlike the McClellan Oscillator, which is sensitive and gives a lot of signals, this tool is more of a trend following indicator. It is
proprietary to the FRED report, so we do not disclose much about the construction of the tool. It generally moves between 12 and 18. Moves below 12 or above 18 imply a divergence bottom or top is coming with fairly high probability. This tool works best at extremes, and patterns can be significant. It also gives clearer signals at bottoms than tops, although when tops are perceived to be occurring we will publish these charts, appropriately annotated. The FBO is only useful on the stock market, where advance/decline data is published.

Page 50
Research used in this report does not purport to be comprehensive or to contain all the information which a prospective investor may need in order to make an investment decision. The information is based on publicly available information and sources, which the publisher believes to be reliable, but does not represent to be accurate or complete, and it should not be relied on as such. The publisher may update any research report as it determines appropriate, in its sole discretion. Each reader of this report must make its own investigation and assessment of the information presented herein. No representation, warranty or undertaking, express or implied, is or will be made or given and no responsibility or liability is or will be accepted by Fredco Holdings, Inc. or by any of its directors, officers, employees, agents or advisers, in relation to the accuracy or completeness of this presentation or any written or oral information made available in connection with the information presented herein. Any responsibility or liability for any such information is expressly disclaimed. Any person or entity who does rely on this report does so at his/her own risk and by doing so assumes all liability for any such loss, harm or other detriment.
The information contained herein was prepared by Fredco Holdings, which is solely responsible for the contents of this report. Although Fred Meissner, Jr. is a registered representative of Global American Investments, Inc., neither Global American Investments, Inc. nor any of its principals, officers, affiliates, agents or employees is in any way responsible for the contents of this message.
All prices provided within this research report are a snapshot taken as soon as practicable prior to the release of the report. No representation is made as to the current prices of securities.
Disclaimer: