monthly report on economic and financial -...
TRANSCRIPT
1
MONTHLY REPORT ON ECONOMIC AND FINANCIAL
STATE AND THE IMPLEMENTATION OF THE
MEASURES OF EXTRAORDINARY ADMINISTRATION
OF AGROKOR D.D.
FOR THE PERIOD BETWEEN 11 DECEMBER 2017 AND 10 JANUARY 2018
Prepared pursuant to Article 12 paragraph 9 of the Act on the procedure of extraordinary administration in commercial companies of systemic importance for the Republic of Croatia (Official Gazette 32/2017)

2
CONTENTS 1. Executive summary........................................................................................................................ 4
2. State of companies under the Extraordinary Administration during the reporting period .... 7
2.1. Companies in the retail and wholesale sector ................................................................. 10
2.1.1. Companies in the retail and wholesale sector: Konzum d.d. ........................................ 11
2.1.2. Companies in the retail and wholesale sector: Konzum BiH .......................................... 13
2.1.3. Companies in the retail and wholesale sector: Tisak d.d. .............................................. 15
2.1.4. Companies in the retail and wholesale sector: Velpro - Centar d.o.o. .......................... 16
2.2. Companies in the food sector ............................................................................................ 18
2.2.1. Companies in the food sector: Jamnica d.d. .................................................................... 19
2.2.2. Companies in the food sector: Roto dinamic d.o.o. ........................................................ 20
2.2.3. Companies in the food sector: Sarajevski kiseljak d.d. .................................................. 21
2.2.4. Companies in the food sector: Ledo d.d. .......................................................................... 22
2.2.5. Companies in the food sector: Ledo Čitluk d.d. ............................................................... 23
2.2.6. Companies in the food sector: Frikom d.d. ...................................................................... 24
2.2.7. Companies in the food sector: Zvijezda d.d. .................................................................... 25
2.2.8. Companies in the food sector: Dijamant a.d. ................................................................... 26
2.2.9. Companies in the food sector: PIK Vrbovec d.d. ............................................................. 27
2.3. Companies in the agriculture sector ................................................................................. 28
2.3.1. Companies in the agriculture sector: Belje d.d. ............................................................... 29
2.3.2. Companies in the agriculture sector: PIK Vinkovci d.d. ................................................. 30
2.3.3. Companies in the food sector: Vupik d.d. ........................................................................ 31
2.3.4. Companies in the food sector: Agrokor trgovina d.o.o. .................................................. 32
3. Short-term cash position ............................................................................................................. 33
3.1. Cash management ................................................................................................................ 33
3.2. Supplier claims settlement .................................................................................................. 33
4. Business reviews ......................................................................................................................... 37
5. Settlement negotiations .............................................................................................................. 38
6. Cost of Extraordinary Administration and operational business of Agrokor d.d. ................ 41

3
7. Litigation ....................................................................................................................................... 44
8. Temporary Creditors Council ..................................................................................................... 46
9. Registration of claims .................................................................................................................. 47
10. Stakeholder relations and communications ............................................................................. 49
4
1. Executive summary
This monthly report provides an update on the economic and financial state of, and
implementation of activities and measures, under the Extraordinary Administration of
Agrokor d.d. and it’s affiliates (the Group) in the period between 11 December 2017
and 10 January 2018. The demanding process of financial and operational
restructuring of the Group’s companies in the reporting period is on-going.
Retail and wholesale had relatively good results in November. Konzum, the largest
retailer in Croatia, had better results than expected across all business indicators
(revenue, margin, number of customers, costs and EBITDA) as a result of intense
work in previous months. Tisak’s business results are similar, as the expansion of its
assortment resulted in better gross margin and EBITDA. Velpro and Konzum BiH,
unlike Konzum in Croatia and Tisak, are experiencing bigger challenges in
negotiations on deliveries of certain goods. This has affected their revenue and
consequently their margin and EBITDA.
The companies continued to undertake cost restructuring and all of them, except for
Velpro to a lesser extent, have made significant progress to their goals. Cost
reduction greatly affected the positive trends in EBITDA and with the increase of
revenues, expected profitability was also achieved.
November represents the turning point between the summer and winter seasons and
is historically the month with the lowest expenditure, which naturally influenced
revenue compared to other months, but Konzum’s revenue in Croatia and Tisak’s
revenue are higher than expected despite this.
The supply of goods remains a challenge for part of the Group and in the next period
the focus will be on stabilizing the assortment in order to regain the trust of
consumers, which was shaken at the beginning of 2017.
Companies from the Food division have continued to deliver solid business results
for the first eleven months of 2017. Sales revenues have increased in line with
expectations, and as the result of the continuous optimization and adjustment to the
new market situation. EBITDA is in line with expected operational profit for
November. One of the goals was the increase of inventory and supplies, as part of
the preparation for the holiday season in December. During November several new
and innovative products were launched in the segment of frozen food and oil. The
companies continued to improve operational functioning through several measures
such as: cost reduction, optimization of the product portfolio and analysis of the
profitability of customers and suppliers.

5
In the Agriculture division the November revenue was the best month of the year for
PIK Vinkovci due to the increase in sales of piglets and beef. An increase in sales of
agricultural crops delivered through the network of co-operatives, as well as through
the better yields of sugar beet than was expected. EBITDA margin in November 2017
was lower than the previous month, primarily as the result of the decrease in the
price of pig meat on the global market. In spite of this, EBITDA margin that was
realized in November of 2017 is still substantially higher compared to the previous
months in 2017. This is a consequence of the cost optimization processes adopted in
all companies, with excellent natural indicators of the livestock production, high yields
of agricultural crops and high profitability of farms.
The draft of the settlement plan which was presented by the advisors of the
Extraordinary Administration and the Extraordinary Trustee Ante Ramljak, was
published on 20 December 2017 and discussions regarding the settlement proposal
was the main topic for the entire month. The draft settlement plan presented the path
and necessary next steps in order for the Extraodrinary Administration to be
successfully completed by reaching a settlement within the legaly defined timeframe.
The details on the proposed draft settlement plan can be found in section 5 of this
report and on the Agrokor website at http://nagodba.agrokor.hr/en/agrokor-draft-
settlement-plan/.
The structure of claims being included in the settlement is complex – approximately
5,700 Croatian and foreign claimants have registered approximately 12,000 claims
relating to different payment classes, and various legal and factual circumstances.
The value of recognized claims amounts to HRK 41.5 billion, while the total value of
challenged claims amounts to HRK 16.5 billion. It is estimated that the amount of
recognized claims owed to third parties, i.e. excluding inter-company claims within
the Group, is in excess of EUR 5.5 billion, of which EUR 4.5 billion relates to claims
from the period prior to the Extraordinary Administration, while EUR 1.1 billion relate
to the financing with super seniority status (including the supplier tranche referred to
in section 3.3 below).
On 13 December 2017 changes and amendments to the Registered Claims Tables
were published on the e-Bulletin Board of the Commercial Court in Zagreb. These
Tables only contain those claims in relation to which changes or amendments were
made.
Apart from the claims contested by the Extraordinary Administration, an additional 29
submissions were received related to contestations from 15 other creditors,
contesting 45 claims which had originally been recognized / verified by the
Extraordinary Administration. Other creditors have additionally contested a total of
HRK 13.1 billion, claims.

6
The Temporary Creditors’ Council held its 13th meeting on 20 December 2017. The
only item on the agenda was the presentation of the draft settlement plan by the
Extraordinary Administration. The draft settlement plan was presented by the
advisors of the Extraordinary Administration and the Extraordinary Trustee Ante
Ramljak.
The Extraordinary Administration is using all available legal activities in order to
protect the Group’s property and its companies in Croatia and abroad. A detailed
update on the Group’s litigation status can be found in section 7 of this report.
During the reporting period regular, direct and formal communication with all key
stakeholders continued with creditors, debtors, trade unions, employees, the
management as well as government and institution representatives in the countries in
which the Group operates.
7
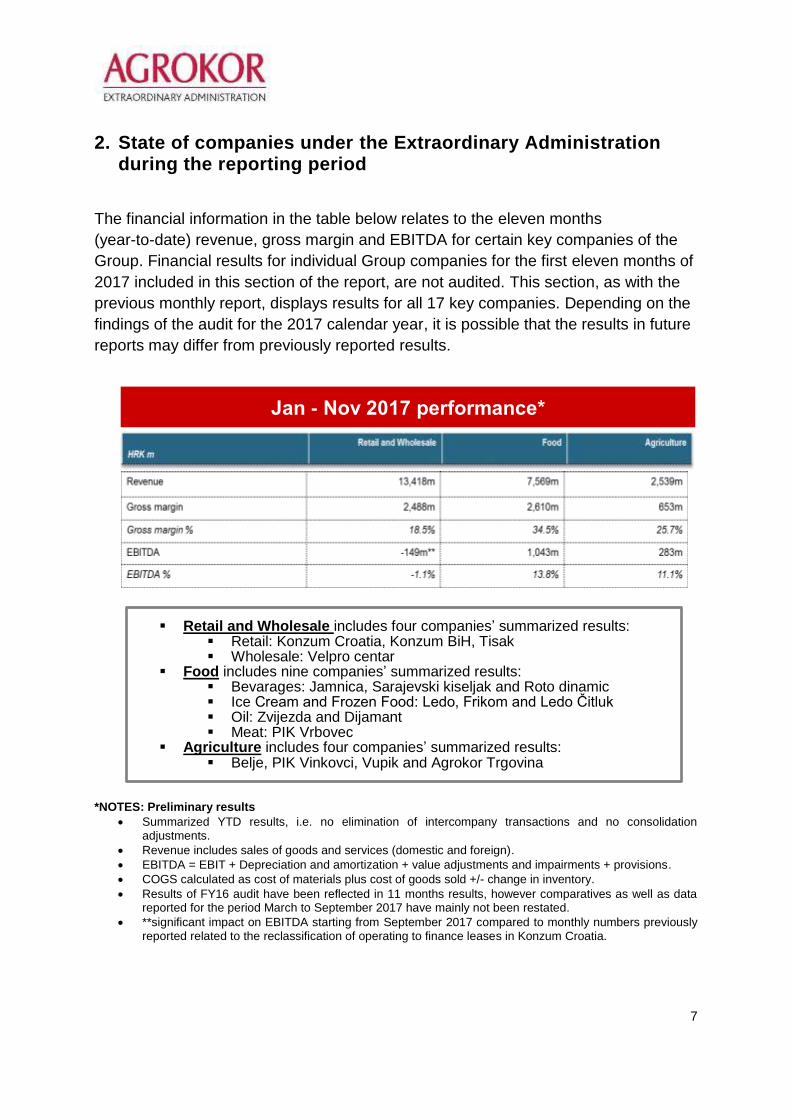
2. State of companies under the Extraordinary Administration during the reporting period
The financial information in the table below relates to the eleven months
(year-to-date) revenue, gross margin and EBITDA for certain key companies of the
Group. Financial results for individual Group companies for the first eleven months of
2017 included in this section of the report, are not audited. This section, as with the
previous monthly report, displays results for all 17 key companies. Depending on the
findings of the audit for the 2017 calendar year, it is possible that the results in future
reports may differ from previously reported results.
*NOTES: Preliminary results
Summarized YTD results, i.e. no elimination of intercompany transactions and no consolidation adjustments.
Revenue includes sales of goods and services (domestic and foreign).
EBITDA = EBIT + Depreciation and amortization + value adjustments and impairments + provisions.
COGS calculated as cost of materials plus cost of goods sold +/- change in inventory.
Results of FY16 audit have been reflected in 11 months results, however comparatives as well as data reported for the period March to September 2017 have mainly not been restated.
**significant impact on EBITDA starting from September 2017 compared to monthly numbers previously reported related to the reclassification of operating to finance leases in Konzum Croatia.
Jan - Nov 2017 performance*
Retail and Wholesale includes four companies’ summarized results: Retail: Konzum Croatia, Konzum BiH, Tisak Wholesale: Velpro centar
Food includes nine companies’ summarized results: Bevarages: Jamnica, Sarajevski kiseljak and Roto dinamic Ice Cream and Frozen Food: Ledo, Frikom and Ledo Čitluk Oil: Zvijezda and Dijamant Meat: PIK Vrbovec
Agriculture includes four companies’ summarized results: Belje, PIK Vinkovci, Vupik and Agrokor Trgovina

8
Retail and wholesale had relatively good results in November. Konzum, the largest
retailer in Croatia had better results than expected in all business indicators
(revenue, margin, number of customers, costs and EBITDA) as a result of intense
work in previous months. Tisak’s business results are similar, as the expansion of its
assortment resulted in better gross margin and EBITDA. Velpro and Konzum BIH,
unlike Konzum in Croatia and Tisak, are experiencing bigger challenges in
negotiations on deliveries of certain goods and this has affected their revenue, and
consequently their margin and EBITDA.
The companies continued to undertake cost restructuring and all of them, except for
Velpro to a lesser extent, have made significant progress to their goals. Cost
reduction greatly affected the positive trends in EBITDA and with the increase of
revenues, expected profitability was also achieved.
November represents the turning point between the summer and winter season and
is historically the month with the lowest expenditure, which naturally influenced the
revenue compared to other months, but Konzum’s revenue in Croatia and Tisak’s
revenue are higher than expected despite this.
The supply of goods remains a challenge for part of the Group and in the next period
the focus will be on stabilizing the assortment in order to regain the trust of
consumers, which was shaken at the beginning of 2017.
Companies from the Food division have continued to deliver solid business results
for the first eleven months of 2017. Sales revenues have increased in line with
expectations, and as the result of the continuous optimization and adjustment to the
new market situation. EBITDA is in line with expected operational profit for
November. One of the goals was the increase of inventory and supplies, as part of
the preparation for the holiday season in December. During November several new
and innovative products were launched in the segment of frozen food and oil. The
companies continued to improve operational functioning through several measures
such as: cost reduction, optimization of the product portfolio and analysis of the
profitability of customers and suppliers.
In the Agriculture division the November revenue was the best month of the year for
PIK Vinkovci due to the increase in sales of piglets and beef. An increase in sales of
agricultural crops delivered through the network of co-operatives, as well as through
the better yields of sugar beet than was expected. EBITDA margin in November
2017 was lower than the previous month, primarily as the result of the decrease in
the price of pig meat on the global market. In spite of this, EBITDA margin that was
realized in November of 2017. is still substantially higher compared to the other
months of 2017. This is a consequence of the cost optimization processes adopted

9
in all companies, with excellent natural indicators of the livestock production, high
yields of agricultural crops and high profitability of farms.

10
2.1. Companies in the retail and wholesale sector
Companies in the retail and wholesale sector are Konzum, Konzum BiH, Tisak and
Velpro centar. The table below shows the cumulative revenue and EBITDA by month
for the sector, with results of individual companies portrayed in detail in subsections
which follow.
*NOTE: Preliminary results.
Includes four companies’ summarized results: Retail: Konzum Croatia, Konzum BiH, Tisak Wholesale: Velpro centar
EBITDA trend

11
2.1.1. Companies in the retail and wholesale sector: Konzum d.d.
2.1.1.1. Financial results YTD and KPIs
Financial results* Jan – Nov 2017
(HRK m)
Revenue 8,086
EBITDA 113
EBITDA % 1.4%
Key performance indicators Jan – Nov 2017
Gross margin % 20.5%
DSO 16 days
DIO 42 days *NOTE: All results are estimated.
2.1.1.2. Commentary on recent trading
The efforts made over the previous months have started to have a positive effect in November, as demonstrated by several parameters which show a positive trend in business, with both revenues and EBITDA above expectations.
With revenues exceeding the expected level, the declines seen in previous periods has been significantly reduced. Activities undertaken by way of intensive marketing communication, a more aggressive approach to customers through attractive promotional sales, better inventory management and the reduction of stock-outs are the reason for the improved revenue realization. Approaching the customer through these activities has resulted in increased footfall and resulted in an enlarged consumer basket.
Other operating expenses in November were lower than expected, which is the result of strict cost monitoring, many cost saving activities as well as the closure of unprofitable stores identified earlier in 2017. The cost reduction accompanied by the increase in revenues and a higher gross margin have resulted in EBITDA exceeding expectations but following the long-standing trend for November of being negative.
DIO increased against the previous month as a result of the timely preparation for the forthcoming holiday shopping season.
DSO remained at a level broadly consistent with the rest of the year with a slight increase resulting from the larger volume of wholesale operations which grows in the second half of November due to the forthcoming Christmas season.
12
The process of the operating network restructuring has started with store refurbishments in Solin and Zagreb, with minimum capital expenditure investment. In Zagreb, within the scope of the OPG Oporovečka project, the sales area is being optimized with limited assortment reduction and providing added value for customers by means of offering new store-in-store departments (OPG – family farm products, new lessees in the mall, F&F clothing brand, new large-format self-service bakery department). As a pilot-project, also in Zagreb, four small stores are being re-modelled in order to increase productivity and optimize processes.

13
2.1.2. Companies in the retail and wholesale sector: Konzum BiH
2.1.2.1. Financial results YTD and KPIs
Financial results* Jan – Nov 2017
(HRK m)
Revenue 1,859
EBITDA -93
EBITDA % -5.0%
Key performance indicators Jan – Nov 2017
Gross margin % 15.7%
DSO 23 days
DIO 42 days
*NOTE: All results are estimated.
2.1.2.2. Commentary on recent trading
The decline in revenues in November is mainly caused by stock-outs in stores, with stocks 25% below the level required during October and November, as a consequence of suspended deliveries from some suppliers.
The total margin generated is below expectations due to the change in revenue mix (with insufficient goods with higher margin), increased pricing activities and reduced off-invoice revenues (goods deliveries are below expectations and the suppliers are disputing part of the rebates due.
The anticipated recovery of deliveries and turnover has been somewhat slower than expected and there is still limited or poor cooperation around 10 suppliers.
With the operating results below expectations, mainly due to insufficient goods delivered by suppliers, during November activities were pursued with a view to regaining customer confidence. The projects ”Price of the Day” and ”Good Price Every Day” were implemented in order to change the price perception and improve availability of products. These marketing initiatives resulted in a proportion of customers returning and the turnover recovering slightly.
November saw a greater cost reduction than expected, excluding the one-off restructuring costs (closing down of unprofitable stores, separation of the Mercator stores and liquidation of Velpro d.o.o.)
The improved cost savings could not offset the drop in revenues and gross margin, resulting in EBITDA being below expectations.
DIO increased vs. last month as a result of the timely preparations for the forthcoming holiday shopping season and replenishment of stocks, which
14
intensified as of mid-November due to the availability of funds following the capital increase.
DSO over the last three months have been following the company's restructuring steps (sale of assets and stocks to Mercator, liquidation of Velpro d.o.o.). Upon completion of the restructuring process DSO will drop to 12 days.

15
2.1.3. Companies in the retail and wholesale sector: Tisak d.d.
2.1.3.1. Financial results YTD and KPIs
Financial results* Jan – Nov 2017
(HRK m)
Revenue 1.866
EBITDA -37
EBITDA % -2.0%
Key performance indicators Jan – Nov 2017
Gross margin % 21.0%
DSO 21 days
DIO 21 days
*NOTE: All results are estimated.
2.1.3.2. Commentary on recent trading
The gross margin in November 2017 increased due to the introduction of a
new (wider) assortment, a new pricing policy and a reduction in the share of
wholesale operations which deliver a significantly lower margin.
The EBITDA development in the second half of 2017 is in line with the
planned restructuring measures as of mid-2017, despite the weaker
cumulative result for the 11 month period compared to last year.
Revenues in the retail segment in November were in line with the restructuring
plan. Revenues in the wholesale segment were stabilized after exiting several
wholesale agreements. Revenues from courier and transportation services
decreased after exiting the unprofitable flyer distribution as of late
September 2017.
By late November 2017 the majority of restructuring measures introduced in
June 2017 had been completed, such as closing down unprofitable points of
sale, introducing new assortment, reducing indirect costs and exiting
unprofitable business arrangements (flyer distribution).
In line with the restructuring measures undertaken, the planned monthly fixed
operating cost ranges from HRK 33 to 35 million. The next steps in
restructuring the company will focus on finalizing improvements in logistics
and generating higher revenues and gross margins.

16
2.1.4. Companies in the retail and wholesale sector: Velpro - Centar d.o.o.
2.1.4.1. Financial results YTD and KPIs
Financial results* Jan – Nov 2017
(HRK m)
Revenue 1,486
EBITDA -111
EBITDA % -7.5%
Key performance indicators Jan – Nov 2017
Gross margin % 9.9%
DSO 59 days
DIO 19 days
*NOTE: All results are estimated.
2.1.4.2. Commentary on recent trading
With a more aggressive market approach revenues, which were somewhat
below expectations, have been stabilized. Competitors who were able to take
certain hotels and gas stations (oil companies' points of sale) which were lost
over the course of summer and at the start of the Extraordinary Administration,
have made the return of these customers to Velpro more difficult, which has a
significant impact on revenues.
The November margin is below the expected level, which is mainly due to the
sale of slow-moving stock items, the reduced number of SKU's in the overall
assortment and cleaning up the balance of the old assortment. All of this,
along with the aforesaid aggressive market approach, resulted in a lower
margin realization.
Velpro has planned for a major part of its revenues and margin to come from
working with suppliers from the drinks category and the limited deliveries from
suppliers in this category were a great challenge in November. This situation
had an additional impact on margin realization.
The restructuring process is running in accordance with plan, although the
speed of the process is not at the expected pace due to difficult negotiations
with lessors and thus the closure of some of the centers has been slower than
planned, which has a direct impact on the company's costs. The weaker
EBITDA performance than expected is also a result of the delayed merger of

17
Velpro and Konzum, the synergies from which will significantly contribute to
cost reduction and thus directly affect the future EBITDA generation.
The closing of part of the Velpro centers and warehouses, sales of non-
rotating goods and introducing a central inventory management department
(packaged food, non-food 1 and 2) has enabled inventories to be reduced and
DIO to be optimized as a whole.
DSO are being reduced and are heading towards the planned DSO of 45
days. This is the result of permanent efforts and communication with
customers as well as the change in the way the debts are collected.

18
2.2. Companies in the food sector
Companies in the food sector are Jamnica, Sarajevski kiseljak, Roto dinamic, Ledo, Frikom, Ledo Čitluk, Zvijezda, Dijamant, and PIK Vrbovec. The table below shows cumulative revenue and EBITDA by month for the sector, with results of individual companies portrayed in detail in subsections which follow.
*NOTE: All results are estimated.
Cumulative revenue and EBITDA
by month 2017 (HRK m) *
Includes nine companies’ summarized results: Beverage: Jamnica, Sarajevski kiseljak and Roto dinamic Ice Cream and Frozen Food: Ledo, Frikom and Ledo
Čitluk Oil: Zvijezda and Dijamant Meat: PIK Vrbovec
EBITDA trend
19
2.2.1. Companies in the food sector: Jamnica d.d.
2.2.1.1. Financial results YTD and KPIs
Financial results* Jan – Nov 2017
(HRK m)
Revenue 1,217
EBITDA 297
EBITDA % 24.4%
Key performance indicators Jan – Nov 2017
Gross margin % 53.8%
DSO 56 days
DIO 57 days *NOTE: All results are estimated.
2.2.1.2. Commentary on recent trading
In November Jamnica d.d. has continued the trend of record results.
Revenues generated in November were in line with expectations with the
majority of revenues, 60% coming from mineral water sales (carbonated,
non-carbonated and flavored). The balance of the revenues is generated from
the sales of fruit juices, ice tea, carbonated soft drinks, wine and liquors. 80%
of total revenues are generated from sales on the domestic market and 20%
from sales on foreign markets.
EBITDA in November is in line with expectations, with a consistent growth in
EBITDA margin a consequence of good sales results, sales price optimization
and increased efficiency realized through the “Value Creation Programme”.
Savings were made in the costs of production, employees, marketing and
logistics processes.
DIO have had a downward trend throughout the year which is the
consequence of inventory level optimization and the discontinuation of
distribution of part of the wine assortment for Konzum and of Red Bull for
Croatia. However, the inventory level in November has increased compared to
October, which is in line with expectations and preparation for the forthcoming
holidays.
Receivables in November have decreased as against the previous month, as
in this period of the year the collection of receivables related to deliveries over
the course of the summer season continues.
20
2.2.2. Companies in the food sector: Roto dinamic d.o.o.
2.2.2.1. Financial results YTD and KPIs
Financial results* Jan – Nov 2017
(HRK m)
Revenue 924
EBITDA 46
EBITDA % 5.0%
Key performance indicators Jan – Nov 2017
Gross margin % 19.3%
DSO 41 days
DIO 32 days *NOTE: All results are estimated.
2.2.2.2. Commentary on recent trading
As a consequence of the impact of competitor activities on the market,
revenues generated in November were below expectations with weaker sales
of beer and wine, primarily to cafés, which resulted in EBITDA being lower
than expected.
Trade receivables have recorded a further decrease resulting from faster
collections, with the improvement achieved in November bringing DSO to the
expected level.
21
2.2.3. Companies in the food sector: Sarajevski kiseljak d.d.
2.2.3.1. Financial results YTD and KPIs
Financial results* Jan – Nov 2017
(HRK m)
Revenue 334
EBITDA 71
EBITDA % 21.2%
Key performance indicators Jan – Nov 2017
Gross margin % 44.3%
DSO 91 days
DIO 47 days *NOTE: All results are estimated.
2.2.3.2. Commentary on recent trading
Revenues from sales to customers outside the Group in the country, as well as revenues from sales on foreign markets, were higher than expected. Mineral water and the Sky product group have generated higher than expected sales growth.
EBITDA has seen continuous growth as against expected values due to increasing sales revenues and a drop in the price of sugar during the year.
Inventories are lower than in the previous month due to increased sales and inventory optimization.
DSO are at the previous month's level.
22
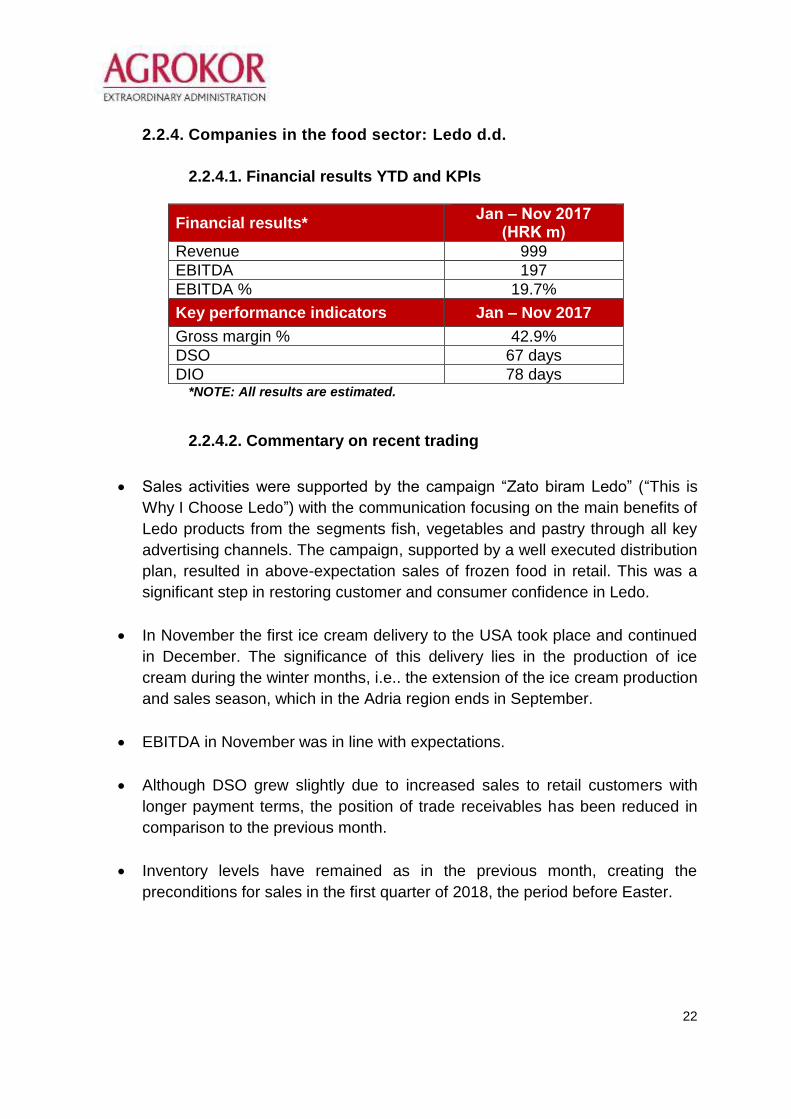
2.2.4. Companies in the food sector: Ledo d.d.
2.2.4.1. Financial results YTD and KPIs
Financial results* Jan – Nov 2017
(HRK m)
Revenue 999
EBITDA 197
EBITDA % 19.7%
Key performance indicators Jan – Nov 2017
Gross margin % 42.9%
DSO 67 days
DIO 78 days *NOTE: All results are estimated.
2.2.4.2. Commentary on recent trading
Sales activities were supported by the campaign “Zato biram Ledo” (“This is
Why I Choose Ledo”) with the communication focusing on the main benefits of
Ledo products from the segments fish, vegetables and pastry through all key
advertising channels. The campaign, supported by a well executed distribution
plan, resulted in above-expectation sales of frozen food in retail. This was a
significant step in restoring customer and consumer confidence in Ledo.
In November the first ice cream delivery to the USA took place and continued
in December. The significance of this delivery lies in the production of ice
cream during the winter months, i.e.. the extension of the ice cream production
and sales season, which in the Adria region ends in September.
EBITDA in November was in line with expectations.
Although DSO grew slightly due to increased sales to retail customers with
longer payment terms, the position of trade receivables has been reduced in
comparison to the previous month.
Inventory levels have remained as in the previous month, creating the
preconditions for sales in the first quarter of 2018, the period before Easter.

23
2.2.5. Companies in the food sector: Ledo Čitluk d.d.
2.2.5.1. Financial results YTD and KPIs
Financial results* Jan – Nov 2017
(HRK m)
Revenue 279
EBITDA 61
EBITDA % 21.8%
Key performance indicators Jan – Nov 2017
Gross margin % 37.4%
DSO 71 days
DIO 54 days *NOTE: All results are estimated.
2.2.5.2. Commentary on recent trading
Sales revenues in November grew in line with expectations. The highest
contribution to growth came from the fish and vegetable categories, where
new SKU's (vegetables) were introduced in response to competitors' activities.
The EBITDA generated was in line with expectations, with EBITDA margin
recording slight growth resulting from increased sales and reduced COGS.
DIO were increased in November compared to. October due to preparation for
sales in the first quarter of 2018, the period before Easter.
DSO were reduced in comparison to the previous month.

24
2.2.6. Companies in the food sector: Frikom d.d.
2.2.6.1. Financial results YTD and KPIs
Financial results* Jan – Nov 2017
(HRK m)
Revenue 730
EBITDA 140
EBITDA % 19.1%
Key performance indicators Jan – Nov 2017
Gross margin % 45.7%
DSO 80 days
DIO 122 days *NOTE: All results are estimated.
2.2.6.2. Commentary on recent trading
12 new products were launched on the domestic market, two in the ice cream category and 10 in the frozen food category.
Sales revenues in November were in line with expectations. The frozen fruit and vegetable and frozen pastry categories experienced a drop due to significantly lower competitor prices and an increased number of promotional sales. The drop in sales of the aforesaid product categories was however offset by increased sales of fish.
EBITDA margin has grown against expectations due to lower costs, particularly COGS.
As a result of better collection of trade receivables, the average DSO in November was reduced in comparison to the previous month. Total trade receivables have also been reduced vs. previous month.
In the current month the cauliflower and broccoli processing campaign was completed, with the carrot processing campaign expected to continue until year-end, which is why DIO increased in comparison to the previous month.
The positive trend of increased winter product consumption continued, as well as of family ice cream off-season.

25
2.2.7. Companies in the food sector: Zvijezda d.d.
2.2.7.1. Financial results YTD and KPIs
Financial results* Jan – Nov 2017
(HRK m)
Revenue 609
EBITDA 54
EBITDA % 8.8%
Key performance indicators Jan – Nov 2017
Gross margin % 27.6%
DSO 96 days
DIO 55 days *NOTE: All results are estimated.
2.2.7.2. Commentary on recent trading
November saw the launching of new products – Margo with butter and vegetable fat whipping cream, which can be found on the shelves across Croatia and the region, and recently the Zvijezda assortment has expanded to include coconut oil, generating excellent results in sales from launch.
In November Zvijezda recorded better realization than expected. The majority of sales is accounted for by the domestic market occupying 67%, while exports have recorded growth in key sales categories. The mayonnaise group has grown on all relevant markets – Croatia, Bosnia & Herzegovina and Slovenia - margarine and all its categories as well, partly also due to the high prices of butter on the global market, while ketchup has experienced double-digit growth in recent months. All were supported by strong marketing activities during the month.
EBITDA and gross margin are in line with expectations due to good realization in November on the local market and sales growth on export markets.
New markets have been developed and the first quantities of oil placed on the Italian market, where other categories are also expected to penetrate in early 2018. Initial quantities of goods were also delivered to the Canadian market. Negotiations to enter additional new markets are under way.
Trade receivables are slightly higher than in October, which is due to increased sales.
Inventories of finished products, raw materials and production materials have increased in November compared to October, which is in line with expectations and preparations for the forthcoming festive season, December being the strongest month of the year in terms of sales.

26
2.2.8. Companies in the food sector: Dijamant a.d.
2.2.8.1. Financial results YTD and KPIs
Financial results* Jan – Nov 2017
(HRK m)
Revenue 813
EBITDA 66
EBITDA % 8.1%
Key performance indicators Jan – Nov 2017
Gross margin % 22.6%
DSO 75 days
DIO 112 days *NOTE: All results are estimated.
2.2.8.2. Commentary on recent trading
Revenues from sales of margarine and mayonnaise are higher than expected due to the increased volume of promotional activities and better in-store positioning. In the forthcoming period the company will strive to keep the positive revenue trend in these categories through tailor-made promotions and a customer loyalty program.
Total sales revenues were lower than expected, as a consequence of the price pressure with extremely low competitor oil prices, which are almost at the level of COGS.
EBITDA and gross margin were not at the expected level, as COGS was higher than expected.
In response to the challenges faced by Dijamant (the oil price in the Serbian market) a number of innovations are in preparation in the categories margarine, mayonnaise and dressings.
The inventory level in November is lower than expected.

27
2.2.9. Companies in the food sector: PIK Vrbovec d.d.
2.2.9.1. Financial results YTD and KPIs
Financial results* Jan – Nov 2017
(HRK m)
Revenue 1,664
EBITDA 112
EBITDA % 6.8%
Key performance indicators Jan – Nov 2017
Gross margin % 24.8%
DSO 109 days
DIO 38 days *NOTE: All results are estimated.
2.2.9.2. Commentary on recent trading
Revenues generated in November were in line with expectations. In total,
83% of revenues come from sales on the local market, while 18% are
accounted for by foreign market sales. Sales of fresh meat on the domestic
market have recorded a positive growth trend as against the significantly
reduced sales in the previous months of the business year, with processed
meat sales remaining stable.
Revenues from exports to CEFTA countries are in line with expectations,
while EU markets have recorded increased sales.
EBITDA for November was as expected, as a consequence of revenues
from sales prices of products and services having been kept on a suitable
level and raw-material prices, ie. prices of livestock on the domestic market
and of main import categories for processed meat production, reduced.
The stable level of revenues from sales of products and services and the
restructuring process lead to improved efficiency in production and
reduced operating cost per kilogram of product sold result ing in higher
EBITDA margins.
The collection of trade receivables was improved, thus reducing total trade receivables (which are mainly intercompany receivables).
28
EBITDA trend
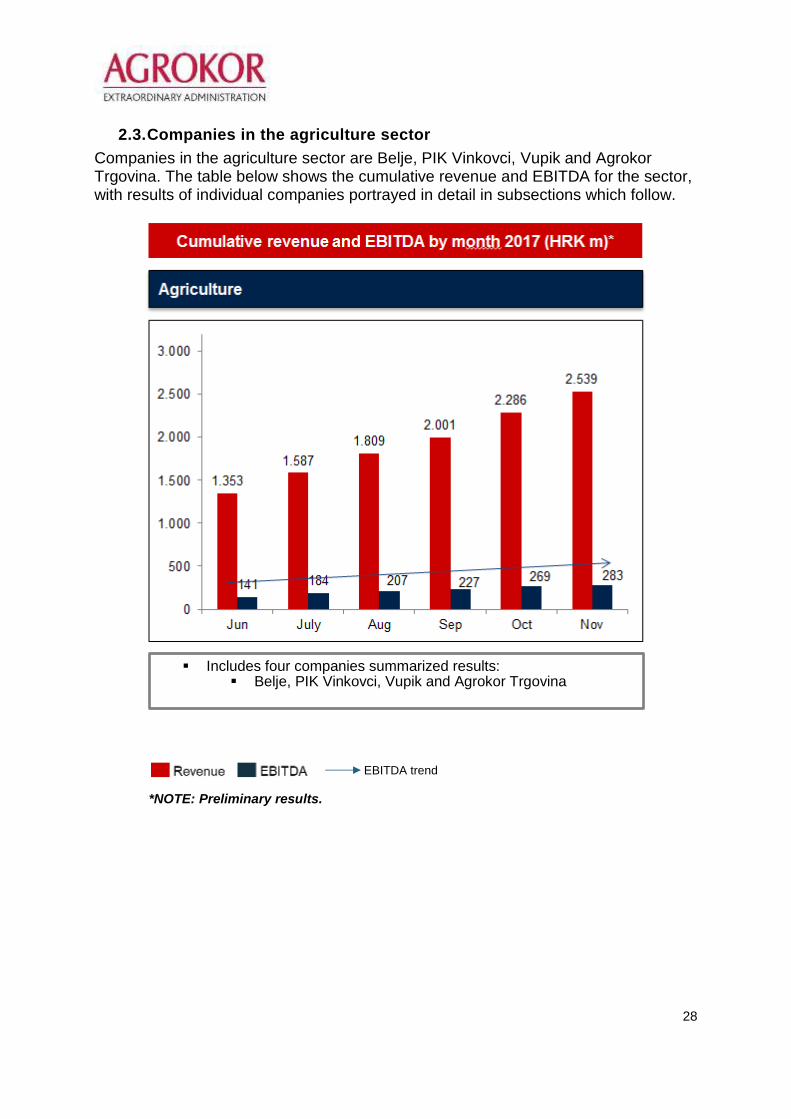
2.3. Companies in the agriculture sector
Companies in the agriculture sector are Belje, PIK Vinkovci, Vupik and Agrokor Trgovina. The table below shows the cumulative revenue and EBITDA for the sector, with results of individual companies portrayed in detail in subsections which follow.
*NOTE: Preliminary results.
Includes four companies summarized results: Belje, PIK Vinkovci, Vupik and Agrokor Trgovina
29
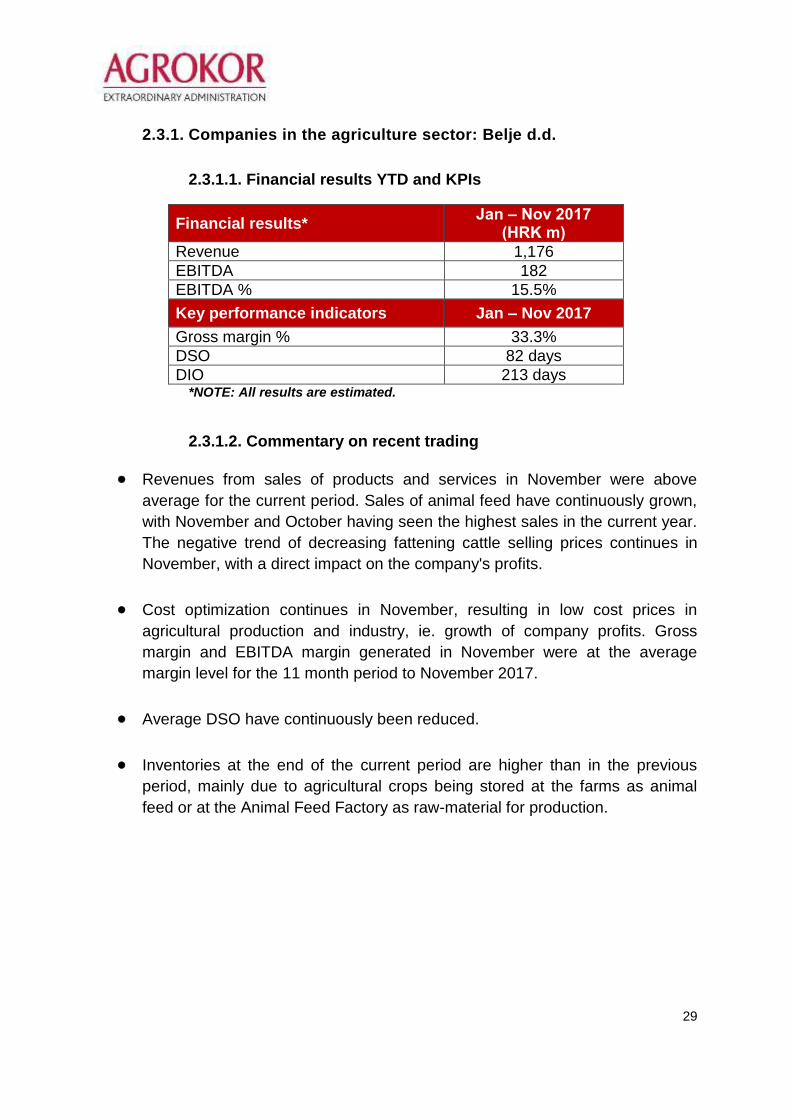
2.3.1. Companies in the agriculture sector: Belje d.d.
2.3.1.1. Financial results YTD and KPIs
Financial results* Jan – Nov 2017
(HRK m)
Revenue 1,176
EBITDA 182
EBITDA % 15.5%
Key performance indicators Jan – Nov 2017
Gross margin % 33.3%
DSO 82 days
DIO 213 days *NOTE: All results are estimated.
2.3.1.2. Commentary on recent trading
Revenues from sales of products and services in November were above
average for the current period. Sales of animal feed have continuously grown,
with November and October having seen the highest sales in the current year.
The negative trend of decreasing fattening cattle selling prices continues in
November, with a direct impact on the company's profits.
Cost optimization continues in November, resulting in low cost prices in
agricultural production and industry, ie. growth of company profits. Gross
margin and EBITDA margin generated in November were at the average
margin level for the 11 month period to November 2017.
Average DSO have continuously been reduced.
Inventories at the end of the current period are higher than in the previous
period, mainly due to agricultural crops being stored at the farms as animal
feed or at the Animal Feed Factory as raw-material for production.

30
2.3.2. Companies in the agriculture sector: PIK Vinkovci d.d.
2.3.2.1. Financial results YTD and KPIs
Financial results* Jan – Nov 2017
(HRK m)
Revenue 350
EBITDA 32
EBITDA % 9.1%
Key performance indicators Jan – Nov 2017
Gross margin % 31.9%
DSO 93 days
DIO 297 days *NOTE: All results are estimated.
2.3.2.2. Commentary on recent trading
Sales revenues have grown both in comparison to the plan and to October.
The increase in sales was mostly generated by sales of own and repurchased
agricultural produce, cereal and oil crops: mercantile corn, sugar beet and
mercantile soybeans. Sales in pig breeding continue to grow in November,
meeting the expected sales plan. Sales of cattle, with sales in November
included, are cumulatively above the sales plan.
Upon completion of the fall harvest in November and the growth of agricultural
produce sales on the domestic and foreign markets, EBITDA grew above
expectations in comparison to October 2017. The EBITDA growth was
generated to a significant extent due to sugar beet and sunflower yields, which
exceeded expectations.
DSO slightly grew against October, also as a result of increased sales of own
and repurchased agricultural produce in November, in particular sugar beet,
corn and mercantile soybeans.
The expected decrease in DIO has occurred. This is the result of selling a
significant part of products and goods after the fall harvest.

31
2.3.3. Companies in the food sector: Vupik d.d.
2.3.3.1. Financial results YTD and KPIs
Financial results* Jan – Nov 2017
(HRK m)
Revenue 297
EBITDA 51
EBITDA % 17.3%
Key performance indicators Jan – Nov 2017
Gross margin % 34.0%
DSO 80 days
DIO 191 days *NOTE: All results are estimated.
2.3.3.2. Commentary on recent trading
Sales revenues in livestock breeding (fattened pigs and fattened cattle) grew
against last month, mostly due to a greater volume of livestock deliveries, with
the selling price of fattened pigs lower than in October. The reduced cost of
raw-materials and materials in 2017 reflects the reduced quantities of
purchased animal feed and its lower price. The change in reproduction farms
business policies and purchase of piglets with lower weight resulted in
reduced cost of livestock purchases on pig breeding farms.
Due to the decrease in sales revenues as compared to the previous month,
EBITDA has dropped mostly because of negative developments of livestock
breeding results in consequence of the very low finisher selling price and milk
price and the very high price of purchasing piglets for fattening. Next month
we are again expecting a drop in the selling price of finishers and thus in the
livestock breeding results, but also a positive EBITDA growth in crop
husbandry due to sales of the entire yield quantity of mercantile corn.
Trade receivables in November were at the same level as in the previous
month. The deliveries of fattened pigs, fattened cattle and sugar beet
continue, as well as the collection of due receivables.
Inventories of raw materials, materials and finished products are at a level
close to last month's.

32
2.3.4. Companies in the food sector: Agrokor trgovina d.o.o.
2.3.4.1. Financial results YTD and KPIs
Financial results* Jan – Nov 2017
(HRK m)
Revenue 717
EBITDA 17
EBITDA % 2.4%
Key performance indicators Jan – Nov 2017
Gross margin % 6.9%
DSO 57 days
DIO 14 days *NOTE: All results are estimated.
2.3.4.2. Commentary on recent trading
In November, the major part of the total revenues structure is accounted for
by sales of cereal and oil crops. Operations are still export-oriented, with a
significant proportion of revenues coming from foreign market sales. After
the harvest the logistics pressure from September and October have been
addressed and most of the contracted wheat, corn and soybean deliveries
were made. Deliveries of smaller quantities are still outstanding and with
their completion in December the activities for the year will be completed.
On the mercantile goods market the available quantities are much lower
than last year due to the generally lower crop production in the Republic of
Croatia, resulting in a lower trading volume vs. last year. A somewhat
increased trading activity is only expected to occur by the middle of the first
quarter next year.
As a result of sales realized in November, positive operating profits and
operating margins have been generated.
The collection of receivables has improved and has continuously been improving since the introduction of the Extraordinary Administration procedure.

33
3. Short-term cash position
3.1. Cash management
The Group continues to actively manage its liquidity with cash flow forecasts being
updated on a fortnightly basis, and weekly/fortnightly payment budgets being set and
approved based on these forecasts. With effect from 24 November 2017, the
Croatian core non-retail companies moved to a fortnightly payment run with only
exceptional payments being approved on a weekly basis. In the period since the new
finance was raised in June 2017 to December 2017 net funds of HRK 975.3 million
have been deployed in the businesses to assist with liquidity.
As discussed in the previous monthly report, this cash was used primarily to unwind
trade payables in relation to the period post 10 April 2017, and to restock the
businesses.
The table below provides a summary of the current and previous cash flow forecast:
Current STCF
(CW 49) Prior week STCF
(CW 51)
Minimum cash balance (13w) 1,036 1,046
Maximum cash balance (13w) 1,507 1,421
Minimum Liquidity covenant 296 296
Undrawn facility 370 370
Available liquidity (incl. undrawn facility) 1,110 – 1,581 1,120 – 1,495
3.2. Supplier claims settlement
It was communicated publicly in the week ending 28 July 2017 that there would be a
tranche of EUR 150 million made available for settlement of trade claims prior to the
Act on Extraordinary Administration. This EUR 150 million tranche has been split into
three pools:
Pool A (up to EUR 30 million): Dedicated pool for ‘micro’ suppliers, defined as family farms (OPG), small entrepreneurs and micro-suppliers with annual revenue less than HRK 5.2 million, a maximum of HRK 2.6 million in assets and up to 10 employees;
CW51 Forecast 19 Core Subsidiaries 13 Week STCF vs prior week (HRK m)

34
Pool B (EUR 110 – EUR 120 million): This pool is open to all suppliers (except the Pool A micro-suppliers). Suppliers must confirm they will return to historic and/or industry standard terms of supply in order to be eligible; and
Pool C (up to EUR 10 million): Discretionary pool for settlement of trade supplier claims in respect of debts accrued prior to the Extraordinary Administration, in accordance with identified business needs.
3.2.1. Pool A update
To date, over 2,500 micro companies, craft trades and small farmers have received
100% settlement of their pre-petition debt with Pool A utilization now at
EUR 21.5 million.
3.2.2. Pool B update
3.2.2.1. Allocation of funds
The funds in Pool B are to be allocated to suppliers based on their claims and
ongoing support for the business, the overarching approach to allocation is split
between the following two tranches:
Pro rata tranche (Tranche 1): EUR 27.5 million distributed on a pro rata
basis to all Old Debt suppliers that have filed their claims in the Extraordinary
Administration; and
Proportional tranche (Tranche 2): allocated on a proportional basis to
suppliers holding Old Debt, that have filed their claims in the Extraordinary
Administration and have agreed to sign an agreement with the Group to return
to historic supplier terms going forward, to a maximum of 40% of supplier’s
Old Debt, taking into account any amounts paid previously for Old Debt.
35
3.2.2.2. Eligibility assessment process
In order to determine the amounts to be allocated in Pool B, a two-step process is being applied:
i. Each Group company identified its important suppliers and offered new supply contracts; and
ii. Companies with signed contracts were eligible for allocation of Tranche 2 from Pool B.
3.2.2.3. Status update
There have currently been EUR 83.8 million of funds approved to be utilized out of
Pool B. This is broken down as follows:
Tranche 1 of EUR 27.4 million (includes previously approved amount of EUR 26.5 million and an additional EUR 0.9 million approved on 6 December 2017) has been allocated on a pro rata basis to all Old Debt suppliers, that have filed their claims in the Extraordinary Administration. With this, the total amount allocated for Tranche 1 is approved for payment.
Tranche 2 of EUR 56.4 million (include previously approved EUR 54.1 million and an additional EUR 2.3 million approved on 6 December 2017) has been allocated on a proportional basis to suppliers holding Old Debt, that have filed their claims in the Extraordinary Administration and have agreed to sign an agreement with the Group to return to historic supplier terms going forward; of which
o 80% of the Old Debt is paid in the week commencing
11 December 2017 after all the necessary approvals are given; and o the balancing 20% will be paid on or before 31 March 2018.
On the basis that certain corrections to the tables of recognized claims were
delivered to Zagreb Commercial Court on 13 December 2017, and additional
requests for payment approval are expected from the creditors in question from
Groups A and B. Any residual unused funds from this EUR 150 million will become
available for operational use within the Group.

36
3.2.2.4. Border claims The Extraordinary Administration paid an initial round of border claims in order to
reach a maximum of 28% of the supplier’s border claim to those suppliers who had
signed an agreement with the Group to return to historic supplier terms, while taking
into account any amounts paid previously for border debt.
3.3. Trade finance facility
Expressions of interest for participation in the EUR 50 million trade finance facility
were completed on 25 August 2017 with 305 indicative applications received. These
applications exceeded the amount of the available facility. Allocation of the
EUR 50 million pool is currently ongoing with a focus on eligible suppliers that have a
high goods turnover.
During December, Group companies have been issuing term sheets to suppliers to
finalize negotiations and secure the additional financing. This financing is anticipated
to be provided via a combination of cash and goods. It is expected that this will be
completed in January 2018.

37
4. Business reviews
Improvement measures outlined in the viability plans are being implemented. All
initiatives described in the viability plans will form part of an Initiative Implementation
Support program.
Key measures will be monitored across 11 workstreams (one workstream per
business / division). Nomination of workstream leaders, responsible for the
implementation and delivery of the effects is underway. Detailed monitoring and
dedicated onsite implementation support has been set up at Konzum’s locations
(in Croatia and Bosnia & Herzegovina) to ensure benefits are realized and can be
tracked. A detailed tracking and regular reporting process is currently being
implemented, including defined maturity levels (degrees of implementation) and a
traffic light system for ongoing monitoring.

38
5. Settlement negotiations
After the 13th meeting of the Temporary creditors council of Agrokor was held on
20 December 2017, the draft of the settlement plan which was presented by the
advisors of the Extraordinary Administration and the Extraordinary Trustee Ante
Ramljak, was published.
These steps in respect of under Extraordinary Administration mark the initiation of the
process of reaching of a settlement to be decided on by all of the Group’s creditors
whose claims have been confirmed. As stated on previous occasions, the structure of
claims being included in the settlement is complex – approximately 5,700 Croatian
and foreign claimants have registered around 12,000 claims relating to different
payment classes, and various legal and factual circumstances. The value of
recognized claims amounts to approximately HRK 41.5 billion, while the total value of
challenged claims amounts to HRK 16.5 billion. It is estimated that the sum of
recognized claims from third parties, i.e. excluding inter-company claims within
Agrokor, is in excess of EUR 5.5 billion of which EUR 4.5 billion relates to the claims
from the pre-petition period, while EUR 1.06 billion relate to the financing with super
seniority status.
The draft settlement plan offers the creditors a transparent, quick, fair and equitable
solution designed to preserving the maximum total value. In order to achieve this, a
total separation of assets from legacy liabilities is proposed as well as a separation of
old shareholders of Agrokor d.d. from the new group planned to be formed as well as
a full restructuring of pre-petition debt through a combination of re-instated debt and
equity. After the completion of the process, the creditors would represent one
hundred percent ownership and would take full operational control over Agrokor. This
simple transaction will place ownership of the viable businesses fully in the hands of
the creditors and thus finalize the extraordinary administration procedure, which
should happen as soon as possible. The law provides for a short period of just one
year for the procedure (plus a maximum of three months extension) and is meant to
be fast and efficient as provided by the draft settlement plan.
Consistent with internationally recognized standards and practices in insolvency
cases, the proposal of the settlement will be guided by the principle that, where they
are sustainable, the business of the Agrokor companies will be preserved and the
liquidation of business/ assets at distressed prices will be avoided. In addition, there
will be fair and equitable treatment of all stakeholders.
The expected cash flows of the Group are collectively insufficient to service the
current debt in a reasonable period and although views on the value of the Group are
to be confirmed, the borrowers and guarantors are likely collectively worth
39
substantially less than the total debt they may owe, therefore many of the Group’s
business entities are insolvent. It is therefore also expected that the majority of
creditors will have to write off a portion of their claims on the basis of the expected
value of the entire group.
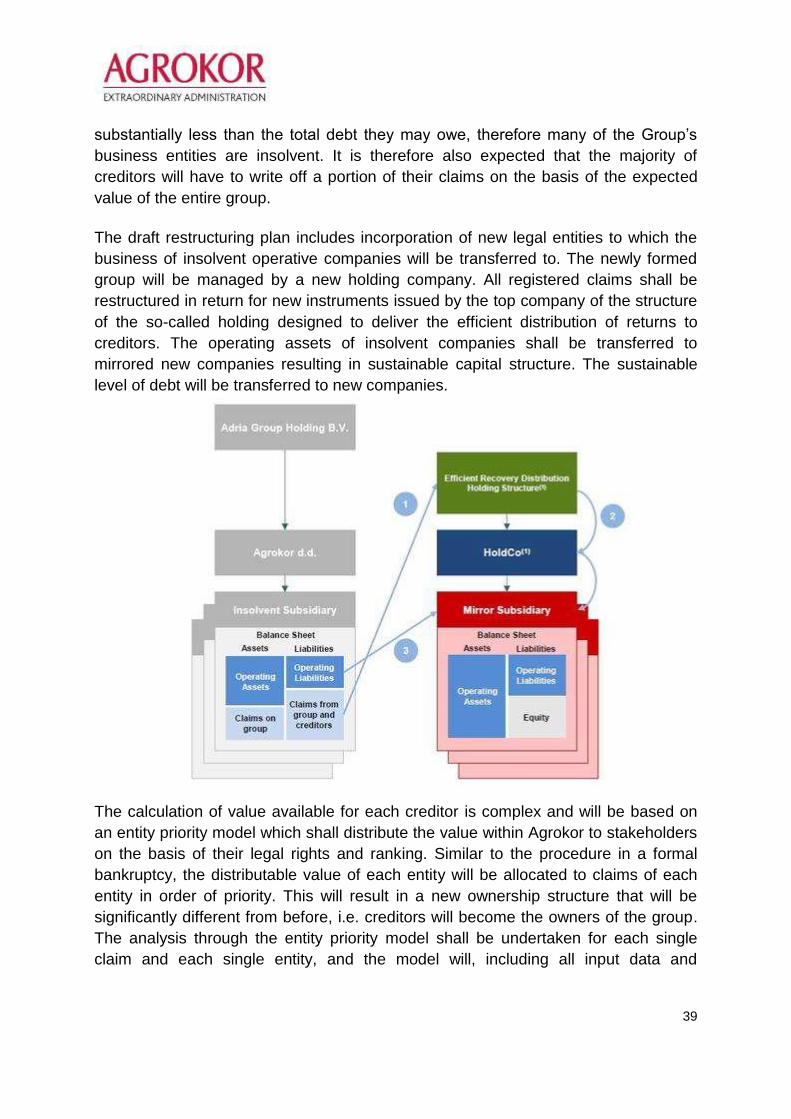
The draft restructuring plan includes incorporation of new legal entities to which the
business of insolvent operative companies will be transferred to. The newly formed
group will be managed by a new holding company. All registered claims shall be
restructured in return for new instruments issued by the top company of the structure
of the so-called holding designed to deliver the efficient distribution of returns to
creditors. The operating assets of insolvent companies shall be transferred to
mirrored new companies resulting in sustainable capital structure. The sustainable
level of debt will be transferred to new companies.
The calculation of value available for each creditor is complex and will be based on
an entity priority model which shall distribute the value within Agrokor to stakeholders
on the basis of their legal rights and ranking. Similar to the procedure in a formal
bankruptcy, the distributable value of each entity will be allocated to claims of each
entity in order of priority. This will result in a new ownership structure that will be
significantly different from before, i.e. creditors will become the owners of the group.
The analysis through the entity priority model shall be undertaken for each single
claim and each single entity, and the model will, including all input data and
40
conditions, be subject to the analysis of the advisors of the Creditors’ Council of
Agrokor.
All registered claims shall be restructured in return for new equity and, subject to debt
capacity and the terms of the Exit Facility, debt instruments issued by the top
company of the new holding structure. Debt capacity for the new structure is being
assessed and will be based on precedent issuances, trading comparables, and, for
the Exit Facility, third party market testing to determine appropriate leverage and
pricing. Terms of the Exit Facility needs to be determined before an assessment can
be made of what additional recovery debt can be feasibly supported by the Group.
For the third party market testing of the Exit Facility, parties that have an interest in
participating in the potential, and potentially partial, refinancing of the SPFA (that
pending approval of the qualified majority of lenders already includes an option to
extend the facility for two years) are encouraged to contact Agrokor at
The settlement proposal must be submitted to the Commercial Court in Zagreb at the
latest by 10 April 2018. The settlement is first voted on by the creditors at the
settlement voting hearing, while the final confirmation of the settlement is with the
Commercial Court in Zagreb. With respect to the voting of the creditors, the
settlement is approved by the majority of creditors according to the value of claims in
each category of creditors, or, exceptionally, two-thirds of creditors by overall value.
The draft of the structure of the settlement supported by the Temporary creditors
committee presents a path and the next steps necessary to be taken to successfully
finalize the extraordinary administration procedure in Agrokor with a settlement in
place within the legally defined time.
To sustain a transparent and inclusive communication with all stakeholders and the
public, Agrokor has opened a special micro website at nagodba.agrokor.hr with the
intention to provide all information regarding the settlement procedure. The same site
will be used to regularly provide answers to questions regarding the settlement
procedure that can be sent to the Extraordinary Administration by e-mail to
The presentation of the draft settlement plan can be found in the Appendix of this
report.
41
6. Cost of Extraordinary Administration and operational business of Agrokor d.d.
Agrokor d.d. is in the process of transitioning into a Group service centre. As a result,
operational business expenses continue to accrue, and these relate directly to the
various centralized services provided throughout the Group. The Extraordinary
Administration maintains control of these costs as part of the restructuring process.
An overview of the Group’s operating costs paid to the end of November 2017,
grouped by cost type, can be found in the table overleaf and are reported net of VAT
to enhance the transparency of the true costs to the Group. These cost categories
include all advisors whether instructed before or after the Extraordinary
Administration commenced.
A breakdown of advisors specifically engaged for the period of Extraordinary
Administration and their scope of work can be found in the monthly report for the
period from 11 October to 10 November 2017.

42
OPERATING COSTS of AGROKOR D.D. April May June July August September October November Total
Total cost of salaries and fees
Commissioner's fee 89,228 118,970 118,970 118,970 118,970 118,970 118,970 118,970 922,021
Employees and service contracts (Bruto II included) 8,857,131 6,887,930 7,605,343 5,749,269 5,017,986 5,116,400 4,225,917 4,494,177 47,954,154
Severance payments 4,638,224 4,079,058 7,383,890 1,619,979 1,157,488 2,753,742 1,155,418 - 22,787,798
13,584,583 11,085,959 15,108,203 7,488,218 6,294,444 7,989,112 5,500,305 4,613,148 71,663,972
Consultant fees*
Legal - 11,271,939 12,071,939 7,418,827 8,257,449 10,919,390 12,189,006 11,522,171 73,650,721
Financial - - - 22,589,795 1,746,440 3,487,950 1,534,608 1,844,448 31,203,241
Restructuring 8,496,338 8,999,894 14,907,250 13,923,906 14,995,250 12,354,949 10,853,498 14,596,921 99,128,005
Other (forensics, HR) - - - - - - 5,284,844 4,562,603 9,847,447
8,496,338 20,271,834 26,979,189 43,932,527 24,999,139 26,762,290 29,861,955 32,526,143 213,829,414
Audit and tax services 11,350 - 1,767,124 1,185,417 386,841 348,506 3,465,239 - 7,164,476
Utilities costs 294,625 420,131 202,882 174,769 117,832 360,146 90,252 342,436 2,003,073
Material costs
Transportation costs (insurance, maintenance, fuel, etc.) 937,626 517,850 376,654 892,931 390,293 475,217 566,253 809,759 4,966,582
Ongoing maintenance 368,407 277,780 264,578 289,476 250,984 287,856 297,554 472,183 2,508,817
Other (9,482) (224,557) 61,627 4,420,862 47,873 95,926 195,564 94,334 4,682,146
1,296,551 571,073 702,860 5,603,269 689,150 858,998 1,059,370 1,376,275 12,157,546
Insurance costs - management liability insurance - 1,448,384 - 2,963,608 - 10,559,427 - - 14,971,419
Cost of new financing - - 33,455,134 8,045,087 - - 5,518,052 - 47,018,273
Travel costs / education 19,702 24,583 54,014 57,928 18,633 44,956 81,033 46,684 347,533
Other costs ** 8,911,323 9,572,848 5,379,752 (860,164) 6,029,758 8,808,567 2,443,543 5,096,512 45,382,140
Amortization / Depreciation 533,203 532,870 543,566 541,295 541,365 539,824 532,885 528,121 4,293,129
Total (April adjusted for operating costs after 10/04/2017)*** 33,147,675 43,927,681 84,192,723 69,131,954 39,077,164 56,271,826 48,552,635 44,529,317 418,830,974
Unadjusted total April costs amount to (01/04/2017 to 10/04/2017): 61,012,952.10 kn
Notes:
1
2
3
4
5
6 The "Total" number above in the amount of 418.830.974,45 kn is the best representation of the operating costs of Agrokor d.d. since the start of the Extraordinary Administration (this is the total costs minus the costs in the first 10 days of April before the Extraordinary Administration commenced).
For April 2017 only adjustments were made totalling HRK 27.9 million which are operating costs incurred from 1 to 10 April 2017, prior to the Extraordinary Administration.
**Other costs includes all other SAP accounts which are not seperately listed in the cost table above. Hence, this can result in negative amounts in given periods.
All invoice bookings for November 2017 and previous months have been finalized. No additional invoices or further adjustments to the cost structure from April - November 2017 are expected.
*Cosultant fees are adjusted for the proportion of their costs related to VAT and the pro-rata system Agrokor is in - so with this report the amounts are restated for consultant fees incurred throughout the Extraordinary Administration.
The total operating costs of Agrokor d.d. (without adjustments or deduction of costs for period from 01/04/2017 to 10/04/2017) + all other months (May-November) amount to total operating costs of Agrokor d.d. (this is the number in SAP).
43
A number of legal fees invoiced and paid in October covered and costs accrued for the Group YTD, thus decrease in the sum paid in November is driven by this.
Restructuring costs invoiced and paid in November are HRK 3.8 million higher than October. An element of this increase is that, for those costs invoiced on a weekly basis, November was a five-week month for some services delivered and captured within this cost category. Secondly, as detailed above, monthly consultant fees for the duration of the Extraordinary Administration have been restated to exclude VAT in line with the pro-rate tax system in which Agrokor d.d. operates. This approach has been applied to legal, financing, restructuring and other categories within this group. All future consultant fees will be reported on this basis.
No invoices were due during November for audit and tax services, thus the above monthly cost is nil.
The overall headcount of Agrokor d.d.’s at the end of November was 94 compared to 90 at the end of October. Consequently, severance costs for November are nil.
44
7. Litigation
The present reporting period saw some developments in the various litigation and
enforcement proceedings formally issued against the Group.
In Croatia, the High Commercial Court rejected Sberbank of Russia’s appeal in the
proceedings in which Sberbank sought an injunction to prohibit the Extraordinary
Administration from entering into the super senior facility agreement (case no. R1-
221/2017).
In England and Wales, a hearing was held before HHJ Matthews in the recognition
proceedings on 18 December 2017 at the High Court in London. At that hearing,
HHJ Matthews gave the final order, rejecting Sberbank of Russia’s permission to
appeal the decision to recognise the Extraordinary Administration proceedings in
England and Wales, and ordering Sberbank to pay the Extraordinary Administration’s
costs of the proceedings caused by Sberbank’s opposition to the application.
Sberbank of Russia also filed an application for permission to lift the stay imposed by
the order of HHJ Matthews, with an application to abridge time such that it could be
heard at the hearing on 18 December 2017. Sberbank was unsuccessful in having
the new application heard at that hearing, and a timetable has been agreed for the
exchange of factual and expert evidence, with a hearing expected to be listed for late
February 2018.
In Slovenia, the Republic of Slovenia filed an appeal against the decision of the
District Court of Ljubljana to reject their opposition to the Extraordinary
Administration’s application for recognition of the Extraordinary Administration
proceedings in Slovenia. The Extraordinary Administration has filed a reply to this
appeal.
In Serbia, an appeal has been filed to the Constitutional Court of Serbia against the
decision to reject the Extraordinary Administration’s application for recognition of the
Extraordinary Administration proceedings in Serbia. Further, in connection with the
litigation proceedings commenced by Banca Intesa against Konzum d.d., Jamnica
d.d., Zvijezda d.d., Agrokor Trgovina d.o.o. and PIK Vrbovec Mesna Industrija d.d.
(case no. P 3283/2017), the Commercial Court in Belgrade has granted a temporary
injunction over the shares in Idea d.o.o. held by Konzum d.d. An appeal has been
filed against this decision, and the decision is awaited. In the other litigation
proceedings initiated following the failed enforcement proceedings brought by various
entities in the Sberbank group and Banca Intesa:
1. Sberbank banka d.d. Ljubljana has appealed the decision of the Commercial
Court in Zrenjanin in which the Court concluded it was not competent to deal with

45
those proceedings and a reply to that appeal is being prepared (case no. P
298/2017); and
2. The Commercial Court in Zrenjanin has declared that it is not competent to hear
the litigation brought by Sberbank d.d. Zagreb against Agrokor d.d. (case no.
P 297/2017);
3. A hearing has been listed by the Commercial Court in Belgrade for 20 March
2018 in the litigation proceedings brought by Sberbank d.d. Zagreb against
Konzum d.d. (case no. P 6397/2017); and
4. Banca Intesa has filed a request for a temporary injunction over Agrokor d.d.’s
shares in Dijamant a.d. Zrenjanin in connection with the litigation proceedings
with case no P 6465/2017 - a hearing was held on 28 December 2017 and the
decision is awaited.
In Bosnia, Sberbank of Russia filed an appeal against the decision of the Municipal
Court in Kiseljak to deny their application for a temporary injunction over Jamnica
d.d.’s shares in Sarajevski Kiseljak d.d. Kiseljak (case no. 51 0 V 126516 17 MO).
The Extraordinary Administration has filed a response to this appeal. The
Extraordinary Administration has also filed a reply to Sberbank of Russia’s appeal
against the decision by the Municipal Court in Sarajevo to reject the application for a
temporary injunction in respect of Agrokor d.d.’s shares in Konzum d.o.o. Sarajevo
and Ambalažni servis d.o.o. Sarajevo (case no. 65 0 Ps 656174 17 MO). Finally, the
Supreme Court has rejected the Extraordinary Administration’s appeal in the
proceedings for recognition of the Extraordinary Administration proceedings in
Bosnia. The Extraordinary Administration shall take steps within the statutory time
period to seek relief before the Constitutional Court of Bosnia and Herzegovina
against this decision.
46
8. Temporary Creditors Council
The Temporary Creditors’ Council held its 13th meeting on 20 December 2017. The
only item on the agenda was the presentation of the draft of the settlement plan
under the Extraordinary Administration. The draft settlement plan was presented by
the advisors of the Extraordinary Administration and the Extraordinary Trustee, Ante
Ramljak.
47
9. Registration of claims
On 13 December 2017 on the e-Bulletin Board of the Commercial Court in Zagreb
the changes and amendments were published to the Registered Claims Tables for
claims filed by creditors of the second, higher payment order with data stated in
Article 257 of the Bankruptcy Act, to the Tables of Secured Rights, Tables of
Exclusion Rights, Tables of Requests for Securing Creditors in compliance with
Article 143 of the Bankruptcy Act, Tables of Untimely Registration of Claims filed
after expiry of the registration deadline and Tables of Registered Claims of creditors
of lower payment orders. The stated Tables only contain those claims in relation to
which changes or amendments were made.
A total of 11,105 claims were examined, of which 10,126 claims were recognized (in
whole or in part), while 1,100 claims were contested (in whole or in part). The total
amount of verified claims is HRK 41.4 billion while the claims contested by the
Extraordinary Administration total HRK 16.4 billion The total amount of registered
guarantees / co-debtorships / recourse rights is HRK 118.5billion, while the total
amount of provisions made pursuant to requests for securing funds is
HRK 327.7 billion.
A summary of changes as against the Tables published on 9 November 2017 is
provided below:
In tables published on
9 November 2017
In changes and amendments on
13 December 2017
Verified amount HRK 41,229,047,264.66 HRK 41,449,995,317.02
Contested amount HRK 16,544,310,830.66 HRK 16,428,211,308.89
Guarantees/ co-debtorships
/recourse rights
HRK 117,304,515,736.11 HRK 118,532,426,159.06
Requests to secure funds HRK 328,831,398,762.49 HRK 327,668,454,999.15
Major changes made to verified claims are as follows:
HRK 80.1 million - Konzum d.d. – Podravka d.d. (the creditor had made an
error in totaling all registered claims and Konzum had thus not been able to
examine them initially).
HRK 75.2 million - Agrokor d.d. – Zagrebačka banka d.d. (the creditor only
subsequently submitted the contract from which the claim arises, of which
Agrokor had had no knowledge).

48
HRK 26.1 million - Agrokor d.d. – Ledo d.o.o. (related to the closing of the
dispute with Hipotekarna banka AD).
HRK 14.1 million - Agrokor d.d. – Hipotekarna banka AD (dispute outside of
Croatia closed – ex litigating creditor).
HRK 12.0 - Konzum d.d. – Invictus ulaganja d.o.o. (previously erroneously
registered transfer of bills of exchange to AWT).
HRK 11.8 million – subsequently 16 creditors came forward with 18 claims
which had not been examined, although the creditors presented evidence to
have filed the claims in time. Out of the total HRK 11.9 million, HRK 11.8
million were recognized, whereof the highest such claim was filed by
Jadransko osiguranje d.d. in the amount of HRK 7.2 million.
HRK 1.7 million - Konzum d.d. – Franck d.d. (subsequent adjustment,
contested amount reduced).
In addition to the claims contested by the Extraordinary Administration, so far 29
submissions were received relating to contestations by 15 other creditors, contesting
45 claims which had originally been recognized / verified by the Extraordinary
Administration. Other creditors have additionally contested a total of HRK 13.1 billion.
The Commercial Court in Zagreb is expected to pass a ruling in January 2018 on
established/verified and contested claims against which the creditors will have the
right to lodge a complaint within eight days upon receiving the ruling. Once the
aforesaid ruling becomes legally valid, discontented creditors will have the ability to
initiate civil proceedings within eight days in order to establish the merits of their
claims.
49
10. Stakeholder relations and communications
During the reporting period which was marked by significant events, the regular,
direct and formal communication with all key stakeholders continued through various
communication channels. By way of regular communication activities the
Extraordinary Administration maintains daily relations with creditors, debtors, trade
unions, employees, the management as well as government and institution
representatives in the countries in which Agrokor operates. Maintaining the highest
possible level of regular and transparent communication with all stakeholders
remains the Extraordinary Administration's priority.
In terms of internal communications the focus is still on the development of the retail
situation, payments to suppliers and further steps in the process of the operational
restructuring of the Group.
The Temporary Creditors' Council convened once over the course of this period
(discussed in more detail under section 8 of this report).
Direct communication with the media has also been maintained over the course of
this reporting period and the Extraordinary Administration conducted more than 60
various media activities in the countries in which the Group companies operate.
Among these activities were press releases, briefings, interviews, media statements
and a significant number of replies to different media queries. Of the activities in the
reporting period the one to be highlighted is the briefing on the draft settlement plan
held with media representatives, while a separate meeting on this topic was also held
with representatives of the wider professional and scientific community.
The key topics reported upon in the media over the course of the reporting period
were the publication of the draft settlement plan, the operating results of the
companies during the first 10 months of the year and the improvement of the overall
economic and financial position of the Group as a result of the ongoing financial and
operational restructuring of its companies. Other topics the media reported on are the
trading of shares of individual companies of the Group and the further development
of legal proceedings and significant court decisions passed in the countries where
the Group operates. For the purpose of delivering transparent and complete
communications to all interested parties, a sub-website was opened on
20 December 2017 and can be found at http://nagodba.agrokor.hr, through which all
relevant information regarding the settlement procedure is being communicated in
two languages – Croatian and English. The Extraordinary Administration receives
public queries on the settlement procedure through the email addresses
[email protected] and [email protected], and replies are published on the
abovementioned sub-website.

50
During the reporting period the Extraordinary Administration held a meeting with
Group supplier representatives on 21 December 2017 in Zagreb, while in other
jurisdictions in which the Group operates the Extraordinary Administration held a
meeting with external partners and stakeholders in Belgrade and attended the
Supervisory Board Meeting of the Mercator Group in Ljubljana.
Report prepared by:
Ante Ramljak Extraordinary Trustee
Agrokor d.d