monthly operations and maintenance report june 2013 · pdf filemonthly operations . and ....
TRANSCRIPT

Monthly Operations
and Maintenance
Report
June 2013

THIS PAGE INTENTIONALLY LEFT BLANK

P a g e | i
Table of Contents
Section Page
TABLE OF CONTENTS .............................................................................................. I
ACRONYMS AND ABBREVIATIONS ....................................................................... 1
EXECUTIVE SUMMARY ........................................................................................... 7
Summary ...................................................................................................................................................................... 7 Water Resources ........................................................................................................................................................ 7 Water Distribution, Treatment, and Production ........................................................................................................ 8 Wastewater Treatment............................................................................................................................................... 8 Wastewater Collections ............................................................................................................................................. 8 Environmental Control .............................................................................................................................................. 8 Laboratory ................................................................................................................................................................. 9 Engineering ............................................................................................................................................................... 9 Stormwater ................................................................................................................................................................ 9 Administration......................................................................................................................................................... 10
WATER RESOURCES ............................................................................................ 11
Operational Activities ................................................................................................................................................ 11 Outreach and Education ...................................................................................................................................... 12 School Programs ................................................................................................................................................. 12 Water Use Surveys ............................................................................................................................................. 12 Incentives and Rebates........................................................................................................................................ 13 Landscape Programs ........................................................................................................................................... 13
WATER TREATMENT, PRODUCTION, AND DISTRIBUTION ............................... 15
Operational Activities ................................................................................................................................................ 15 Department of Public Health .............................................................................................................................. 15
Water Treatment ...................................................................................................................................................... 15 Water Production .................................................................................................................................................... 16
Water Production Summary ................................................................................................................................ 16 Production/Consumption Summary .................................................................................................................... 16 Chemical/Utility Consumption Summary ........................................................................................................... 16
Water Distribution ................................................................................................................................................... 17 Construction ........................................................................................................................................................ 17 Hydrant ............................................................................................................................................................... 17 Customer Service ................................................................................................................................................ 17 Maintenance ........................................................................................................................................................ 17 Distribution ......................................................................................................................................................... 17 System Connections ............................................................................................................................................ 17 Water Quality Inquiries ...................................................................................................................................... 17
City of Stockton, Municipal Utilities Department – June 2013

P a g e | ii
Customer Services Operations ............................................................................................................................ 17 Cross Connection Control Program .................................................................................................................... 18
WASTEWATER TREATMENT ................................................................................ 19
Operational Activities ................................................................................................................................................ 19 Discharge Permit ..................................................................................................................................................... 19 Residuals and Chemical Management..................................................................................................................... 19 Cake Solids ............................................................................................................................................................. 19 Odor Control Practices ............................................................................................................................................ 19 Oxidation Pond Levels ............................................................................................................................................ 20 Chemical Consumption Summary ........................................................................................................................... 20 Wastewater Operations and Maintenance Facility Activity Report ........................................................................ 20
WASTEWATER COLLECTION SYSTEMS ............................................................. 23
Operational Activities ................................................................................................................................................ 23 Regional Water Quality Control Board (RWQCB) ................................................................................................. 23 Activities Summary ................................................................................................................................................. 23
Collection System ............................................................................................................................................... 23 Customer Service ................................................................................................................................................ 23 Residuals Management ....................................................................................................................................... 24 Odor Control Program ........................................................................................................................................ 24 Pumping Facilities .............................................................................................................................................. 24
ENVIRONMENTAL CONTROL ............................................................................... 25
Operational Activities ................................................................................................................................................ 25 Reports/Statistics ..................................................................................................................................................... 25
LABORATORY ........................................................................................................ 27
Operational Activities ................................................................................................................................................ 27 Wastewater Sampling and Analyses ....................................................................................................................... 27 Drinking Water Sampling and Analysis .................................................................................................................. 27 Laboratory Operations............................................................................................................................................. 28
ENGINEERING ........................................................................................................ 29 Development Review Projects ................................................................................................................................ 29 Capital Improvement Project Milestones ................................................................................................................ 30 Geographical Information Systems Projects ........................................................................................................... 31
STORMWATER ....................................................................................................... 33
Operational Activities ................................................................................................................................................ 33 Stormwater System ............................................................................................................................................. 33 Pumping Facilities .............................................................................................................................................. 34 Permit Compliance ............................................................................................................................................. 34 Stormwater Inspections....................................................................................................................................... 34 Stormwater Monitoring....................................................................................................................................... 34 Outreach and Education ...................................................................................................................................... 35
City of Stockton, Municipal Utilities Department – June 2013

P a g e | iii
ADMINISTRATION .................................................................................................. 37
Operational Activities ................................................................................................................................................ 37 Health and Safety .................................................................................................................................................... 37 Human Resources .................................................................................................................................................... 37 Regulatory Compliance ........................................................................................................................................... 38
REFERENCE ........................................................................................................... 39
Tables and Figures..................................................................................................................................................... 39
Water Resources ........................................................................................................................................................ 41 Table 1.1 – Water Waste Complaints ............................................................................................................. 41 Table 1.2 – Water Conservation Outreach ..................................................................................................... 41 Table 1.3 – Water Conservation Surveys ....................................................................................................... 41 Table 1.4 – Water Saving Devices ................................................................................................................. 41 Table 1.5 – CUWCC SMART Rebate Program ............................................................................................. 42 Table 1.6 – HET Direct Install Program ......................................................................................................... 42
Water Treatment, Production, and Distribution .................................................................................................... 43 Table 2.1 - Monthly Summary Coliform Monitoring – June 2013 ................................................................. 43 Table 2.2 – Well Operational Status ............................................................................................................... 44 Table 2.3 – Production Summary Year 2012-2013 (in Million Gallons) ....................................................... 45 Table 2.3A – DWTP Influent by Water Source Year 2012-2013 (in Million Gallons) .................................. 45 Figure 2.A – Production Summary ................................................................................................................. 46 Table 2.4 – City of Stockton Water Systems –Production Summaries .......................................................... 47 Table 2.5 – City of Stockton Water Systems –Consumption Summaries ...................................................... 48 Table 2.6 – Chemical Consumption Summary ............................................................................................... 50 Table 2.7 – Utility Consumption Summary .................................................................................................... 51 Table 2.8 – Service Connections .................................................................................................................... 52 Table 2.9 – Number of Active Service Meters in Water System - By Size .................................................... 53 Table 2.10 – Water Quality Inquiry Summary ............................................................................................... 53 Table 2.11 – Customer Services Summary ..................................................................................................... 54 Table 2.12 – Cross Connection Control Program ........................................................................................... 54 Table 2.13 – Cross Connection Control Program Surveys ............................................................................. 54
Wastewater Treatment .............................................................................................................................................. 55 Table 3.1 – Summary of Influent and Effluent Parameters ............................................................................ 55 Figure 3.A – Wastewater Plant Influent and Effluent Flow ........................................................................... 56 Figure 3.B – Wastewater Plant Influent CBOD5 Load .................................................................................. 57 Figure 3.C – Wastewater Plant Influent TSS Load ........................................................................................ 58 Table 3.2 – Residuals and Chemical Management Summary for Biosolids ................................................... 59 Figure 3.D – Cake Solids ................................................................................................................................ 60 Table 3.3 – Summary of Tertiary Pond Operating Levels .............................................................................. 60 Table 3.4 – Chemical Consumption Summary – Tertiary Facility ................................................................. 61 Table 3.5 – Utility Consumption .................................................................................................................... 62 Table 3.6 – Maintenance Work Order Summary ............................................................................................ 62
Wastewater Collection Systems ................................................................................................................................ 63 Table 4.1 – Summary of SSOs and Private Sewage Spills ............................................................................. 63 Figure 4.A – Public Sanitary Sewer Overflow Events ................................................................................... 64 Figure 4.B – Public SSOs Greater than 1,000 gallons – Events ..................................................................... 65 Figure 4.C – Public Sanitary Sewer Overflows Discharged to Receiving Water ........................................... 66 Table 4.2 – Sewer Maintenance Activity Summary ....................................................................................... 67 Table 4.3 – Customer Service and CCTV Activity Summary ........................................................................ 69
City of Stockton, Municipal Utilities Department – June 2013

P a g e | iv
Table 4.4 – Spoils Activity Summary............................................................................................................. 70 Table 4.5 – Graffiti Removal .......................................................................................................................... 71 Table 4.6 – Maintenance Work Order Summary ............................................................................................ 71
Environmental Control ............................................................................................................................................. 73 Table 5.1 – Operational Activity Summary .................................................................................................... 75
Laboratory ................................................................................................................................................................. 77 Table 6.1 – Acute Toxicity Testing Summary ................................................................................................ 77 Table 6.2 – Algae (Selenastrum capricornutum) ............................................................................................ 77 Table 6.3 – Ceriodaphnia (C. dubia) .............................................................................................................. 77 Table 6.4 – Fathead Minnow (Pimephales Promelas) .................................................................................... 78 Table 6.5 – Effluent Cyanide Summary ......................................................................................................... 78 Table 6.6 – Effluent Ammonia-N Summary .................................................................................................. 78 Figure 6.A – Laboratory Samples and Analyses ............................................................................................ 79 Figure 6.B – Contract Laboratory Samples and Analyses .............................................................................. 80 Figure 6.C – Laboratory Sample Types .......................................................................................................... 81
Engineering ................................................................................................................................................................ 83 Figure 7.A – Development Reviews Received and Completed ...................................................................... 83 Figure 7.B – Development Reviews Received and Completed Year-to-Date ................................................ 84 Table 7.1 – Nonpotable, Stormwater, Water, and Wastewater Projects ......................................................... 85
Stormwater ................................................................................................................................................................. 87 Table 8.1 – Stormwater Maintenance Activity Summary .............................................................................. 89 Table 8.2 –Inspections .................................................................................................................................... 91 Table 8.3 –Outreach ....................................................................................................................................... 92 Table 8.4 –Stormwater Pumping Facilities Work Order Summary ................................................................ 93
Administration ........................................................................................................................................................... 95 Table 9.1 – Summary of Unsafe Conditions or Acts ...................................................................................... 95 Table 9.2 – Summary of Work-Related Injuries and Illnesses ....................................................................... 95 Table 9.3 – Summary of Safety Training ....................................................................................................... 95 Table 9.4 – Staffing Summary ........................................................................................................................ 95 Table 9.5 – Overtime Summary ..................................................................................................................... 96
APPENDIX A .............................................................................................................. I
Water ............................................................................................................................................................................ I Title 22 Compliance Water Well Sampling .............................................................................................................. I Summary Well System Operations ........................................................................................................................... I
APPENDIX B ............................................................................................................ V
Environmental Compliance ....................................................................................................................................... V Monitored Industrial User Charges .......................................................................................................................... V Customer Charges Report ........................................................................................................................................ V Septic Waste Haulers’ Charges ................................................................................................................................ V
City of Stockton, Municipal Utilities Department – June 2013

P a g e | 1
Acronyms and Abbreviations
ACRONYM DEFINI TION - A -
ABS Acrylonitrile Butadiene Styrene AED Automated External Defibrillator AF Acre Feet AICPA American Institute of Certified
Public Accountants AL Action Levels ANSI American National Standards
Institute APCD Air Pollution Control District APN Assessor Parcel Number APs Action Plans APSA Aboveground Petroleum
Storage Act AQMD Air Quality Management District ARB Air Resources Board ARV Air Relief Valve ASDWA Association of State Drinking
Water Administrators ATSDR Agency for Toxic Substances
and Disease Registry AWWA American Water Works
Association - B -
BACM Best Available Control Measure BCP Business Continuity Plan BFP Belt Filter Press BMP Best Management Practice BOD Biochemical Oxygen Demand BOD5 Standard Biochemical Oxygen
Demand – 5 day BOO Build-Own-Operate BOT Build-Own-Transfer BPMS Backflow Prevention
Management System BTU British Thermal Unit
- C - CAC California Administrative Code CAFR Comprehensive Annual
Financial Report CalARP California Accidental Release
Prevention Cal-EMA California Emergency
Management Association
ACRONYM DEFINI TION Cal-EPA California Environmental
Protection Agency Cal/OSHA California Division of
Occupational Safety and Health CAMAL Net
California Mutual Aid Laboratory Network
CASA California Association of Sanitation Agencies
c/b or cb Catch Basin CBOD Carbonaceous Biochemical
Oxygen Demand CCC Criterion Continuous
Concentration CCR California Code of Regulations CCTV Closed Circuit Television CDC Centers for Disease Control
and Prevention CDPH California Department of Public
Health CEQA California Environmental
Quality Act CERS California Environmental
Reporting System CFE Combined Filter Effluent CFR Code of Federal Regulations cfs Cubic Feet per Second CH4 Methane C.I.I. Commercial, Institutional,
Industrial CIP Capital Improvement Project CIWMB California Integrated Waste
Management Board CM Construction Manager CMC Criterion Maximum
Concentration CO Carbon Monoxide CO Correction Order COD Chemical Oxygen Demand COP Certificate of Participation CoS City of Stockton CCB Chlorine Contact Basin CIP Capital Improvement Projects CMMS Computerized Maintenance
Management Systems CPFF Cost Plus Fixed Fee CPIF Cost Plus Incentive Fee
City of Stockton, Municipal Utilities Department – June 2013

P a g e | 2
ACRONYM DEFINI TION CPPC Cost Plus Percentage CPR Cardiopulmonary Resuscitation CQA Construction Quality Assurance CQC Construction Quality Control CSO Combined Sewer Overflow CSPA California Sportfishing
Protection Alliance CSR Customer Service Request CTG Control Techniques Guidelines CUWCC California Urban Water
Conservation Council CVFPB Central Valley Flood Protection
Board CWEA California Water Environment
Association - D -
DO Dissolved Oxygen DAF Dissolved Air Flotation DAFT Dissolved Air Flotation
Thickener DAT Damage Assessment Team dBA Decibels (A weighted) DBP Disinfection Byproducts DPH Department of Public Health DOT Department of Transportation DWSP Delta Water Supply Project DWTP Delta Water Treatment Plant
- E - EC Environmental Control Division EC Effective Concentration EDU Equivalent Dwelling Unit EIR Environmental Impact Report EIS Environmental Impact
Statement ELAP Environmental Laboratory
Accreditation Program EOC Emergency Operations Center EOP Emergency Operations Plan EPA Environmental Protection
Agency EPC Engineer, Procure, Construct EPT Enhanced Primary Treatment ERAP Emergency Response Action
Plan ERP Emergency Response Plan
- F - FA First Aid FBI Federal Bureau of Investigation FEMA Federal Emergency
Management Agency FFY Federal Fiscal Year
ACRONYM DEFINI TION FFP Firm Fixed Price FIP Federal Implementation Plan FOG Fats, Oils, and Grease FY Fiscal Year
- G - GAAP Generally Accepted Accounting
Principles GAAS Generally Accepted Auditing
Standards GAO General Accounting Office GAS Government Auditing
Standards GASB Governmental Accounting
Standards Board GBT Gravity Belt Thickener GIS Geographic Information System GO General Obligation (bonds) gpcd gallons per capita-day gpd gallons per day gpm gallons per minute
- H - H2S Hydrogen Sulfide HAA or HAA5
Haloacetic Acids
HAP Hazardous Air Pollutant HAZMAT Hazardous Material Response
Team HCFC Hydrogenated
Chlorofluorocarbon HET High Efficiency Toilet HHS Health and Human Services HOA Home Owners’ Association HS Homeland Security HSAS Homeland Security Advisory
System - I -
I&C Instrumentation and Control IC Inhibition Concentration IC Incident Commander ICS Incident Command System I/I Infiltration/Inflow IPP Industrial Pretreatment
Program IO Information Officer IPM Integrated Pest Management IT Information Technology
- J – K - JPA Joint (exercise of) Powers
Authority
City of Stockton, Municipal Utilities Department – June 2013

P a g e | 3
ACRONYM DEFINI TION - L -
LCR Environmental Protection Agency's Lead Copper Rule
LEPC Local Emergency Planning Commission
LGRS 80 State Controller’s Report LO Liaison Officer LPoC Laboratory Point of Contact LRAA Locational Running Annual
Average LRN Laboratory Response Network LRO Legally Responsible Official
- M - MACT Maximum Achievable Control
Technology MBAS Methylene Blue Active
Substances (foaming agents) MCE Maximum Credible Earthquake MCL Maximum Contaminant Level MFE Mixed Final Effluent MG Million Gallons mgd million gallons per day mg/L milligrams per liter MIL Million MMF Multi Media Filters MOU Memorandum of Understanding MPE Maximum Probable Earthquake MPF Maximum Probable Flood MPN Most Probable Number MRP Monitoring and Reporting
Program MSDS Material Safety Data Sheets MUD Municipal Utilities Department
- N - NaOCl Sodium Hypochlorite NaOH Sodium Hydroxide NBT Nitrifying Biotower NH3-N Ammonia Nitrogen NIMS National Incident Management
Systems NIPC National Infrastructure
Protection Center NIOSH National Institute for
Occupational Safety and Health NOD Nitrogenous Oxygen Demand NOEC No Observed Effect
Concentration NOEL No Observed Effect Level
ACRONYM DEFINI TION NOI Notice of Intent NOT Notice of Termination NOV Notice of Violation NOX Nitrogen Oxides NPDES National Pollutant Discharge
Elimination System NRC National Response Center NRR Noise Reduction Ranking NRWA National Rural Water
Association NTC Notice To Clean NTU Nephelometric Turbidity Units NWS National Weather Service
- O - O3 Ozone O&M Operations & Maintenance OMB Office of Management and
Budget OSHA Occupational Safety and Health
Administration OCT Operator Certification Training,
Inc. - P -
PACP Pipeline Assessment Certification Program
PAH Polynuclear Aromatic Hydrocarbon
PCB Polychlorinated biphenyl PERL Pacific EcoRisk Lab PFRP Processes to Further Reduce
Pathogens PG&E Pacific, Gas, and Electric PIDS Primary Influent Distribution
Structure PLC Programmable Logic
Controllers PLSD Private Lateral Sewage
Discharge PM Preventive Maintenance PM-10 Particulate Matter <10 microns PMP Probable Maximum
Precipitation PMSD Percent Minimum Statistical
Difference POC Pollutants of Concern POL Petroleum, Oil, and Lubricant POSM Pipeline Observation System
Management.
City of Stockton, Municipal Utilities Department – June 2013

P a g e | 4
ACRONYM DEFINI TION POTW Publicly Owned Treatment
Works PPE Personal Protective Equipment ppm parts per million PSMP Process Safety Management
Plan PSRP Processes to Significantly
Reduce Pathogens PVC Polyvinyl Chloride
- Q - QA Quality Assurance QC Quality Control
- R - RACM Reasonably Available Control
Measures RACT Reasonably Available Control
Technologies RE Resident Engineer REACON Recycling Energy Air
Conservation RFP Request for Proposal RFQ Request for Qualifications RMP Risk Management Plan RMP Regional Monitoring Program RO Reverse Osmosis ROW Right of Way ROWD Report of Waste Discharge RPR Resident Project
Representative RQ Reportable Quantity RSP Raw Sewage Pump RST RS Technical - The name of a
company which makes sewer TV inspection equipment. It is the brand name of the TV equipment used by MUD.
RTU Remote Terminal Units RWCF Regional Wastewater Control
Facility RWQCB Regional Water Quality Control
Board - S -
SAR Sodium Adsorption Ratio SAWS Stockton Area Water Suppliers SCADA Supervisory Control and Data
Acquisition SCBA Self-contained Breathing
Apparatus
ACRONYM DEFINI TION SEMS Security and Emergency
Management System SEWD Stockton East Water District SIP State Implementation Plan SJCEHD San Joaquin County
Environmental Health Department
SJVAPCD San Joaquin Valley Air Pollution Control District
SMARTS Storm Water Multiple Application and Report Tracking System
SO2 Sulfur Dioxide SOP Standard Operating Procedure SPCC Plan Spill Prevention, Control, and
Countermeasures Plan SS Settleable Solids SSES Sewer System Evaluation
Survey SSMP Sewer System Management
Plan SSO Sanitary Sewer Overflow SSORP Sanitary Sewer Overflow
Response Plan STEP Septic Tank Effluent Pumping STP Sewage Treatment Plant SUA Stockton Urbanized Area SWMP Stormwater Management Plan SWQCCP Stormwater Quality Control
Criteria Plan SWRCB State Water Resources Control
Board - T -
T&M Time & Materials (contract) TC Total Carbon TDH Total Dynamic Head TDS Total Dissolved Solids TTHM Total Trihalomethanes TIE Toxicity Identification
Evaluation Title V Federal Clean Air Standards TKN Total Kjeldahl Nitrogen TMDL Total Maximum Daily Load TOC Total Organic Carbon TOD Total Oxygen Demand TSS Total Suspended Solids TUc Chronic Toxicity Unit
City of Stockton, Municipal Utilities Department – June 2013

P a g e | 5
ACRONYM DEFINI TION - U – V -
UDRW Urban Discharge Receiving Water
UERM Utility Emergency Response Manager
UEOCM Utility Emergency Operations Center Manager
U.S. EPA United States Environmental Protection Agency
USA Underground Service Alert VA Vulnerability Assessment VAR Vector Attraction Reduction VCP Vitrified Clay Pipe VE Value Engineering VFD Variable Frequency Drive VOC Volatile Organic Compound
ACRONYM DEFINI TION VSS Volatile Suspended Solids VWN Verbal Warning Notice
- W – X – Y – Z - WaterISAC Water Information and Security
Analysis Center WDR Waste Discharge Requirements WERF Water Environment Research
Foundation WFO Water Field Office WLA Waste Load Allocation WTP Water Treatment Plant WWTP Wastewater Treatment Plant
City of Stockton, Municipal Utilities Department – June 2013

P a g e | 6
THIS PAGE INTENTIONALLY LEFT BLANK
City of Stockton, Municipal Utilities Department – June 2013

P a g e | 7
Executive Summary
Summary This report is a summary of the information management records of the Water Resources; Water Distribution, Treatment & Production; Wastewater Treatment; Wastewater Collections; Environmental Control; Laboratory, Engineering; Stormwater; and Administration & Business Services activities for June 2013. It includes statistical data and narrative descriptions of activities, events, and issues that the City of Stockton, Municipal Utilities Department (MUD) feel are important to record and document.
Water Resources Staff filed the Notice of Completion with the County on June 26 for the Delta Water Supply Project Intake and Pump Station Project. CDM Smith is working with staff to schedule Part 2 of the final acceptance test on the Water Treatment Plant. This effort has been delayed somewhat until the Intake and Pump Station flex joint is replaced and the station is ready to resume regular operations. Delays in getting materials and equipment have set this schedule back but will not affect DWTP production as the WID source water is still available for treatment through the end of July 2013. WID has notified us they have additional water available beyond the contract period if needed.
Working with laboratory staff, Water Resources completed and posted the Consumer Confidence Report (Water Quality Report) which is to be made available for customer viewing in June of each year. This was the first year that the State allowed internet posting in lieu of direct mail. The June 2013 issue of the Stockton Water News had information for our customers on how to access the report. Staff also completed the triennial Public Health Goals Report which is required to be completed by July 1, 2013. This report will be presented to the City Council as a public hearing on July 30, 2013 to provide information on the Utility’s water quality as it pertains to State Public Health Goals and federal Maximum Contaminant Level Goals.
CDM Constructors Inc. has mobilized its construction trailer and is finalizing the design for the Ammonia Facilities Project. This project will construct ammonia facilities on the North Stockton pipeline from the Stockton East Water District in addition to six groundwater wells to convert the current method of distribution residual disinfection from chlorine to chloramines to comply with U.S. Environmental Protection Agency Stage 2 Disinfection Byproducts Rule. Staff is preparing the lengthy public outreach effort in conjunction with the State Department of Public Health regarding the chloramine conversion. Specific target groups included kidney dialysis clinics and pet stores.
The Water Conservation Program continued to implement water saving programs and incentives in accordance with best management practices and State mandated water use reductions. Water conservation information was provided at two Stockton Ports events in June. The San Joaquin UC Master Gardener Program hosted its monthly workshop at the DWTP. A third field survey was conducted in June for a program participant in the large landscape pilot program. Findings included sprinkler leaks, overspray and excessive run times associated with the irrigation system. A report was provided with several
City of Stockton, Municipal Utilities Department – June 2013

P a g e | 8
recommendations for improvement. Interest continued in the High Efficiency Toilet Direct Install Program and In-Home Water Use Surveys.
Water Distribution, Treatment, and Production The DWTP continued treating Woodbridge Irrigation District water during the month. Production ranged from 19.28 to 22.67 and averaged 20.25 million gallons per day (mgd).
With the exception of a few minor issues ranging from a blown fuse on one of the filter skids, an increase in turbidity in the settled water due to a coagulant feed pump failure and turbidity meter output problems before the filters, the plant ran very well during the month. Plant operators worked on drying solids in two of the three sludge drying basins in preparation for the next round of basin operations. Staff is working on a disposal contract to landfill the dried solids. The plant continued to meet regulatory limits for Combined Filter Effluent (CFE), maintained at 0.1 Nephelometric Turbidity Units (NTU) at all times.
The demolition project for Wells #13, #22 and #23 is progressing quickly and will soon be complete. Contractors are in the process of removing buildings, motors, pumps, valves, and other equipment. Distribution crews monitored system pressure in the Weston Ranch area during a 30” main shutdown to relocate distribution mains as part of the French Camp/I-5 interchange project. Work continued on the repair of the 48” transmission main in the vicinity of the Stockton Auto Mall.
Wastewater Treatment The department participated in a chemical consortium for bidding chemicals with various wastewater plants in the region to offer vendors the opportunity to sell greater quantities of their products. The total cost savings to the City will be approximately $465,000. Council approved the contracts at the June 11 Council meeting.
Wastewater Collections A total of 6 Sanitary Sewer Overflows (SSOs) occurred during the month. All spills were Category 2, which means they were less than 1,000 gallons and captured before entering into a waterway. All pipes and areas affected were cleaned to ensure capture of the pollutants and returned to the sanitary sewer system.
Preventive maintenance on the sanitary stations continued. Pump impellers and pump housing de-ragging continues at various sanitary sewer stations on a daily basis to keep the stations operating efficiently. Painting of the sanitary pump stations continues in order to protect the facilities and prevent weather related damage.
We have ordered several new level transmitters to replace the obsolete bubbler systems at the sanitary stations. This will help prevent sanitary sewer overflows by increasing accuracy and reliability of the level and control sensing equipment.
Environmental Control The Fats, Oils, and Grease (FOG) Program is in its third year of restaurant inspections. AS400 data entries are made on a daily basis as officers complete their inspections.
The FOG Program Grease Disposal Mitigation Fee has been approved by council and is included in the 2013-14 Fee Schedule.
City of Stockton, Municipal Utilities Department – June 2013

P a g e | 9
FOG Program staff will begin performing restaurant Stormwater inspections in January 2014. These inspections will occur in conjunction with the regular FOG annual inspections at each facility. Preparation and training will commence mid-July to accommodate these additional responsibilities. Enforcement, follow-up inspections, billing procedures and correspondence related to the Stormwater inspections will be performed by Stormwater Division staff.
Laboratory There were no violations of the NPDES permit in June. All acute biotoxicity tests had 100% survival; there were no ammonia-nitrogen or cyanide exceedances of permit limits.
The annual T22 testing on the Delta source and Finished Water for DWTP was done in June. In addition, 5 groundwater wells had the “Cycle Test” performed as requested by CDPH. Only 3 of the wells passed the cycle tests.
The lab analyzed 850 samples for 3,895 analyses. Contract labs analyzed 144 samples for 470 analyses. There were 294 samples for NPDES Permit compliance; 267 samples for process control, and 289 samples for drinking water compliance.
In June, the Lab had all fume hoods recertified by Technical Safety Services.
Engineering Engineering staff had 27 active Capital Improvement Projects for the month of June.
There were 11 Development Reviews received and 6 completed this month.
Six proposals were received May 23, 2013 in response to the Request for Proposals for the City of Stockton Regional Wastewater Control Facility Headworks Rehabilitation Project. A Selection Committee comprised of City staff met on June 10 to shortlist the consultants and interviews were conducted on June 19.
GIS performed the monthly Pipeline Observation Management System (POSM) update and various queries against the GIS data for statistics and analysis support
Stormwater There were six storm drain catch basin covers stolen. The City continues to seek ways to prevent additional thefts of these drain grates. Police reports are filed for each occurrence of stolen grates.
The downtown business area is being inspected monthly and cleaning of the areas surrounding the catch basins completed on as-needed basin to minimize trash and debris entering the storm system.
Stormwater Program continued to work collaboratively with the Regional Water Quality Control Board (RWQCB) and San Joaquin County on the development of new permit, which is anticipated to be adopted by the RWQCB in October 2013. Program staff, Condor Earth Technologies, and Larry Walker Associates continued site planning for the launch of a Methlymercury Control Study to commence within the Charter Way Detention Basin in October 2013.
There were 16 Stormwater inspections conducted at active construction sites. Additional calls reported on the hotline or while conducting normal business, combined with the
City of Stockton, Municipal Utilities Department – June 2013

P a g e | 10
construction inspections, resulted in 11 Verbal Warnings, 1 Correction Orders, 2 Notice to Clean, 1 Notice of Violations, and 0 Administrative Citations being issued.
A successful dry weather urban discharge dry weather sampling event was conducted on June 11. Samples were collected at urban discharge and receiving water sampling locations along Smith Canal, Calaveras River, Duck Creek and Mosher Slough
Administration There were no injuries or illnesses this month, and one vehicle incident.
Training opportunities continued this month including a confined space, MSDS, backhoe safety, respirator fit testing, and hazardous communication.
Recruitment activities continue on an ongoing basis to fill vacated positions and to fill recently approved positions. MUD is currently staffed at 187 of the approved 208 positions.
City of Stockton, Municipal Utilities Department – June 2013

P a g e | 11
Water Resources
Operational Activities The Water Resources Division is responsible for overall water supply planning for the Water Utility. Those duties include contracting for purchased water, water conservation, utility planning and reporting, regional planning coordination, water utility budgeting, and support to the Community Development Department Planning Division. Since its inception in 2004, the Division has focused primarily on the delivery of a new surface water supply through the development of the Delta Water Treatment Plant (DWTP). That multi-year effort included acquisition of water rights, facility planning and permitting, rate setting and financing, and project implementation.
Water Resources staff support the DWTP and distribution operations staff by procuring materials and supplies for the new treatment plant, in addition to negotiating various maintenance and service contracts.
Staff filed the Notice of Completion with the County on June 26 for the Delta Water Supply Project Intake and Pump Station Project. It is likely that Preston will dispute the final payment as there will be withholds for monies due the City for liquidated damages and other charges. CDM Smith is working with staff to schedule Part 2 of the final acceptance test on the Water Treatment Plant. This effort has been delayed somewhat until the Intake and Pump Station flex joint is replaced and the station is ready to resume regular operations. Delays in getting materials and equipment have set this schedule back, but will not affect DWTP production as the WID source water is still available for treatment through the end of July 2013. WID has notified us they have additional water available beyond the contract period if needed.
Working with laboratory staff, Water Resources completed and posted the Consumer Confidence Report (Water Quality Report) which is to be made available for customer viewing in June of each year. This was the first year that the State allowed internet posting in lieu of direct mail. The June 2013 issue of the Stockton Water News had information for our customers on how to access the report. Staff also completed the triennial Public Health Goals Report which is required to be completed by July 1, 2013. This report will be presented to the City Council as a public hearing on July 30, 2013 to provide information on the Utility’s water quality as it pertains to State Public Health Goals and federal Maximum Contaminant Level Goals.
CDM Constructors Inc. has mobilized its construction trailer and is finalizing the design for the Ammonia Facilities Project. This project will construct ammonia facilities on the North Stockton pipeline from the Stockton East Water District in addition to six groundwater wells to convert the current method of distribution residual disinfection from chlorine to chloramines to comply with U.S. Environmental Protection Agency Stage 2 Disinfection Byproducts Rule. Staff is preparing the lengthy public outreach effort in conjunction with the State Department of Public Health regarding the chloramine conversion. Specific target groups included kidney dialysis clinics and pet stores.
The Water Conservation Program continues to develop and implement water saving programs and incentives in accordance with the following:
City of Stockton, Municipal Utilities Department – June 2013

P a g e | 12
• The 2006 Memorandum of Understanding with the California Urban Water Conservation Council (CUWCC) to implement best management practices to conserve water in urban areas
• The Urban Water Management Planning Act identifying 14 Demand Management Measures to achieve water conservation savings
• The Water Conservation Act of 2009, which requires a statewide reduction in per capita water consumption by the year 2020
In the following sections, a summary is presented for those programs and incentives.
Outreach and Education As part of the City’s efforts to educate the community, customers are encouraged to notify the City when they witness water waste. This allows members of the community and staff to identify potential water leaks, excessive watering, and/or misuse of water supplies. This is done in an effort to work cooperatively toward a solution. There were eight complaints received and staff was able to resolve each of the problems. Table 1.1 provides a summary of these activities.
Outreach and education is also achieved through monthly utility bill inserts, print and web-based publications, and participation at community events.
Staff attended two Stockton Ports events in June, including one Education Day, whereby water conservation information was distributed and outreach efforts were conducted.
Table 1.2 illustrates the number of impressions made as part of these outreach efforts.
The San Joaquin County Master Gardener Program hosted its monthly workshop at the DWTP on June 8. This group will continue to meet monthly at the DWTP the second Saturday of each month.
School Programs Through participation in the Stockton Area Water Suppliers (SAWS), local area schools are offered onsite assemblies, in-class presentations, and after-school programs. The City receives an annual report on the SAWS Water Education Program summarizing the programs and information provided, the number of students that were reached, and feedback from teaching professionals. For the 2011/2012 school year, the SAWS Water Education Program reached a total of 27,430 students and participants, a 16% increase from the 2010/2011 school year.
Water Use Surveys In May 2009, in-home water use surveys became available to Stockton residents when staffing resources are available. This offered residents the opportunity to review one-on-one with Water Conservation staff their current water use practices and methods by which residents can save both water and money. In August 2011, self-certification water use surveys became available during times when staffing resources are limited. Through both surveys, customers are able to evaluate their water use and calculate estimated savings with the use of water efficient devices. Currently, only the self-certification water use surveys are available for customers due to limited staffing resources. Three surveys were completed in June with an additional 38 requested.
City of Stockton, Municipal Utilities Department – June 2013

P a g e | 13
Table 1.3 identifies the number of surveys requested and completed. At the end of each residential survey, water efficient devices are provided to respective customers. A summary of water saving devices distributed is provided in Table 1.4.
Incentives and Rebates The Water Conservation Program finalized its participation in the CUWCC’s SMART Rebate Program, established in 2007. This program offered rebates to customers who purchased and installed water efficient toilets and clothes washers. Table 1.5 provides a summary of all rebates processed to-date. All available funding has been exhausted for this program.
The High Efficiency Toilet (HET) Direct Install Program was approved by City Council to reduce water use by commercial, industrial, and institutional customers, and ultimately assist in reducing their cost of doing business. The program covers the material and installation cost of replacing older, inefficient toilets with EPA WaterSense labeled devices through local plumbing contractors. One installation was completed in June.
Table 1.6 identifies the current number of installations for this program to-date, including estimated water savings.
Landscape Programs Program development continues to assist large landscape customers in identifying ways to reduce water use. Upon request, water conservation staff will meet with homeowners’ associations and other large landscape users to evaluate water use and provide recommendations for improvement.
Water conservation staff continued the pilot program, which calculates and distributes ongoing water use reports to large landscape sites. These reports compare actual water use to a budget benchmark based on site-specific characteristics and real-time weather for approximately 120 sites. Three field surveys have been completed to-date with the most recent survey completed in June. Survey customers were provided with a comprehensive report of findings and recommendations. The ultimate goal of the program is to improve water efficiency amongst large landscape customers.
Available free of charge is an internet resource (www.stockton.watersavingplants.com) made available through the Water Conservation Program. This website provides information on water efficient gardens, resources, and watering tips. The site also allows users to plan their own water efficient garden online. This month, there were 177 visitors to the website.
City of Stockton, Municipal Utilities Department – June 2013

P a g e | 14
THIS PAGE INTENTIONALLY LEFT BLANK
City of Stockton, Municipal Utilities Department – June 2013

P a g e | 15
Water Treatment, Production, and Distribution
Operational Activities The City’s Delta Water Treatment Plant and Water Distribution Division are responsible for the treatment, production, operation, and maintenance of the City of Stockton Water Treatment Plant and Distribution Systems. The systems use a combination of surface water treated and delivered by the City’s water treatment plant from the Mokelumne River and/or the Delta, groundwater wells, and surface water treated and delivered by Stockton East Water District (SEWD) from New Hogan and New Melones Reservoirs.
Staff is responsible for treating and distributing potable drinking water to more than 48,000 service connections. This is done through an elaborate system of wells, reservoirs (storage tanks), pipelines, valves, and meters. The system is monitored and maintained 24/7 through electronic equipment and manual operation. Adequate water pressure must be maintained throughout the system at all times for water quality, firefighting, industrial, commercial, and residential use. Leaks are a high priority and are usually investigated within an hour of the report. Water quality complaints, such as pressure, odor, taste, or color issues, are handled on a same-day basis.
Additional responsibilities include enforcement of the water conservation program, collecting water samples for regulatory compliance, implementation, and monitoring of the City’s Cross-Connection Prevention Program, reading all water meters for billing each month, investigating high bill complaints, performing fire flow tests, and the maintenance and repair of over 7,000 fire hydrants.
Department of Public Health There were no bacteriological water quality violations in this month’s samples. The monthly coliform monitoring report was submitted to the Department of Public Health. Table 2.1 presents a summary of the Coliform Monitoring results in the distribution system.
All sampling and monitoring pursuant to the Title 22 regulations was completed. A copy of the Title 22 monitoring results is included in Appendix A.
Water Treatment The DWTP continued treating Woodbridge Irrigation District water during the month. Production during the month ranged from 19.28 to 22.67 and averaged 20.25 million gallons per day (mgd).
With the exception of a few minor issues ranging from a blown fuse on one of the filter skids, an increase in turbidity in the settled water due to a coagulant feed pump failure and turbidity meter output problems before the filters, the plant ran very well during the month. Plant operators worked on drying solids in two of the three sludge drying basins in preparation for the next round of basin operations. Staff is working on a disposal contract to landfill the dried solids.
The plant continued to meet regulatory limits for Combined Filter Effluent (CFE), maintained at 0.1 Nephelometric Turbidity Units (NTU) at all times.
City of Stockton, Municipal Utilities Department – June 2013

P a g e | 16
Maintenance staff from the DWTP and Distribution are working together to remove and replace the flexible joints on the discharge pipe from the Intake and Pump Station (IPS). The existing flex joint installed as part of the IPS project has now reached the limit for its intended use and will be replaced by a new flex joint and offset pipe spool. This work was intended to be complete in June, but delays have it scheduled for completion in late July. Delays in getting materials and equipment have set this schedule back but will not affect DWTP production as the WID source water is still available for treatment through the end of July. WID has notified us they have additional water available beyond the contract period if we need the water.
Water Production The demolition project for Wells #13, #22 and #23 is progressing quickly and will soon be complete. Contractors are in the process of removing buildings, motors, pumps, valves and other equipment. Personnel assisted distribution crews by monitoring system pressure in the Weston Ranch area during a 30” main shutdown to relocate distribution mains as part of the French Camp/I-5 interchange project. Operational status for existing wells is shown on Table 2.2.
Water Production Summary Table 2.3 and Figure 2.A illustrate water production in million gallons (MG) pumped from the City’s two well production systems, the DWTP, and purchased water delivered to the North, Walnut Plant, and South Systems from SEWD. The SEWD North System total includes water purchased by San Joaquin wheeled through the City’s system. Table 2.3A shows total influent for the Delta Water Treatment Plant by water source. The detail of the production report is included in Appendix A-2. The corresponding table from fiscal year 2011-2012 is presented for comparison.
Production/Consumption Summary Table 2.4 and 2.5 present the overall summary of water production and consumption for the previous month, current month, and fiscal year-to-date. The corresponding table from fiscal year 2011-2012 is presented for comparison. The metered consumption figures are not available until after all billing is completed in the City’s HTE system and are not included in the current month column.
SEWD City/County North System total includes water purchased by San Joaquin County from SEWD and wheeled through the City’s System. This sum also includes City well water wholesaled to the County.
The unmetered water consumption quantities are based upon estimates made from observations and documentation provided by other City departments.
Chemical/Utility Consumption Summary Table 2.6 presents a summary of chemical consumption in connection with operation of the production system, including the DWTP. The corresponding table from fiscal year 2011-2012 is presented for comparison.
Table 2.7 presents a summary of utility consumption and outages in connection with operation of the production system, including the DWTP. Table 2.7 also shows power generated by the DWTP solar energy system. The corresponding table from fiscal year 2011-2012 is presented for comparison.
City of Stockton, Municipal Utilities Department – June 2013

P a g e | 17
Water Distribution Construction Crews replaced thirteen service lines. Staff continues to assist the maintenance crews with large meter replacements and other jobs requiring special equipment. Outside contractors were used on three emergency service line breaks.
Hydrant Crews repaired seven hydrants and painted one hydrant due to graffiti. Repairs consisted of cap, O-ring, valve gasket, chain, and coupler repair or replacement. One fire flow test was performed. Routine maintenance consisting of marker replacement, painting, and weed control continued throughout the month.
Customer Service There were 48,557 water meters read for monthly billing. There were 1,192 meters turned on or locked off for account openings or closings within this period. Crews responded to 8 high bill complaints. Staff continued to replace broken registers, repair damaged touch-read wires, and respond to various customer inquiries.
Maintenance Crews continue to focus on the small meter change-out backlogs by replacing 134 small meters. Recently added staff being trained within the crew replaced over 100 registers. Staff assisted construction crews with emergency service line/main line breaks when needed. Personnel continued to respond and repair numerous small meter leaks.
Distribution Personnel working with Teichert Construction completed the repair of a leaking 48” transmission main that feeds water from Stockton East Treatment Plant to north Stockton. Crews continue to work with the Public Works Department on various aspects of the 18” and 24” water relocation project at Interstate 5 and French Camp Road. Staff continued monthly backflow tests/surveys, valve exercising, air relief valve maintenance, water conservation inquiries, and weekly bacteriological sampling.
System Connections Table 2.8 presents a summary of new meter installations applied to the reading routes. There may be a delay in applying the meter to the route once it has been installed, causing a difference from the actual number of new meter installations. The total number of active meter connections by size is presented in Table 2.9.
Water Quality Inquiries Table 2.10 presents a summary of water quality inquiries and the corrective measures that were taken to resolve those inquiries. It is important to note that May was the first month in recent memory where there were two taste/odor, color, turbidity or suspended solids complaints, which were resolved satisfactorily.
Customer Services Operations Table 2.11 presents a summary of the meters read during the month, and the account openings and closings.
City of Stockton, Municipal Utilities Department – June 2013

P a g e | 18
Cross Connection Control Program Notices were sent out to all customers with backflow devices that were due for testing by July 1, 2013. There were 261 devices to be tested and 65% of those were tested before the due date. The remainder will be sent a second notice. Table 2.12 presents the number of devices scheduled to be tested during the month and the number of devices tested.
Staff continues their cross connection survey efforts to identify and follow up with water customers that are required to install backflow prevention devices on their water system. As the potential hazards are located, notices are sent, and staff is working to bring them into compliance. Table 2.13 presents the total number of cross connection surveys conducted for the fiscal year-to-date.
City of Stockton, Municipal Utilities Department – June 2013

P a g e | 19
Wastewater Treatment
Operational Activities The Wastewater Treatment Division is responsible for running and maintaining the Regional Wastewater Control Facility (RWCF). The division is managed by the Deputy Director of Wastewater and consists of 31 employees in Operations and 20 in Maintenance. Operations staff works 24-hours a day, 7-days a week, treating approximately 30 million gallons of sewage a day before it is discharged into the Delta.
Discharge Permit The RWCF met all interim and final NPDES Permit compliance requirements. Table 3.1 presents a summary of influent and effluent discharge parameters as comprised with the NPDES permit limits. The Stockton Regional Wastewater Treatment Plant treated an average flow of 30.3 MGD with a peak flow of 41 MGD. There were no NPDES violations this month.
Figures 3.A, 3.B, and 3.C are graphical representations of the year-to-date actual values for the flow and loading parameters. Prior year data are also shown for comparison.
Residuals and Chemical Management Table 3.2 presents a summary of the biosolids processed and disposed for the current month and year-to-date.
Cake Solids The Belt Filter Press is the wastewater treatment dewatering process that produces sludge cake solids. The sludge cake solids are collected, removed offsite, and land applied to agricultural land. Figure 3.D presents actual values for the total percentage of cake solids produced. The aging infrastructure at the solids handling area has made it difficult to meet production at times, but this month production was met. The Engineering Division is working on a stop-gap solution until the solids project can be built. The early start of the solids capital work would be 2017.
Odor Control Practices Bioscrubber air emissions are monitored routinely to ensure compliance with emission standards set by the San Joaquin Valley Air Pollution Control District under the Title V permit. Staff coordinates with U.S. Peroxide to determine dosage rates on a weekly basis. Depending on the weather conditions, dosage rates could be determined twice per week. The proper dosage reduces the hydrogen sulfide and corrosion production in the plant influent wastewater, reducing the odors.
City of Stockton, Municipal Utilities Department – June 2013

P a g e | 20
Oxidation Pond Levels Table 3.3 presents a summary of the Tertiary Pond operating levels. This advanced secondary treatment process provides for increased metal removal from the effluent water, along with operational flexibility and storage capacity. The minimum level of freeboard in the tertiary treatment ponds is a requirement of the plant’s NPDES permit and is monitored daily.
Chemical Consumption Summary A variety of chemicals are used in the treatment process. Chlorine and aqueous ammonia are used for disinfection. Polymer is used for coagulation to increase the removal of solids in various processes throughout the plant. Sulfur dioxide is used to neutralize the amount of chlorine used to disinfect the effluent prior to discharge to the river thus protecting water quality and wildlife. Sodium hydroxide is used to raise the pH to meet the permit requirements for discharge. Table 3.4 presents a summary of the chemical consumption for the wastewater treatment facilities.
The department participated in a chemical consortium for bidding chemicals with various wastewater plants in the region to offer vendors the opportunity to sell greater quantities of their products. The total cost savings to the City will be approximately $465,000. Council approved the contracts at the June 11 Council meeting.
Wastewater Operations and Maintenance Facility Activity Report • Gravity Belt Thickener sludge discharge line was cleaned by Fremouw Environmental. • Primary Clarifiers #7 and #4 broken flights are being repaired by maintenance. • Primary Clarifier #3 has broken flights; the tank is being drained for maintenance to
repair. • Primary Clarifiers #4 and #7 are back in service. • Belt Filter Press #1 and #2 wash box rubber scrappers were replaced. • The dewatering belts were replaced on Gravity Belt Thickener #1 and Belt Filter Press
#1. • Belt Filter Press #2, drive roll bearing was repaired. • U.S. Peroxide personnel came in to clean out tank and prepare their equipment ready
for removal. • Siemens Industry personnel came in to set up a temporary peroxide supply system until
their tank and pump arrive. • San Joaquin County Vector Control called and asked that we have the wetlands sprayed
for Mosquitos. Alpine Helicopter service sprayed the wetlands with Vectorlux Mosquito Control.
Table 3.6 summarizes the preventive and corrective work at the plant.
City of Stockton, Municipal Utilities Department – June 2013

P a g e | 21
Utilities The RWCF participates in an Emergency Energy Demand Response Program by reducing the energy demand during emergency or peak demand periods. Between May and October, when increased demands on the energy system may lead to power outages or brownouts, RWCF has agreed to reduce its energy use in order to meet those peak demands. To meet those requests, the RWCF will shut down the Tertiary Treatment Plant. This does not affect operations or water quality, due to the storage capacity available in the ponds. No requests were made this month.
City of Stockton, Municipal Utilities Department – June 2013

P a g e | 22
THIS PAGE INTENTIONALLY LEFT BLANK
City of Stockton, Municipal Utilities Department – June 2013

P a g e | 23
Wastewater Collection Systems
Operational Activities The primary responsibilities of the Wastewater Collection Systems Division are the maintenance, repair, and response to community concerns as they relate to the sanitary sewer systems within the City of Stockton.
Work orders are generated daily to address routine maintenance issues and public concerns. Each work order is categorized and addressed according to its priority.
Sanitary line maintenance work is driven by the Consent Decree1 and preventive maintenance activities. The main focus of the daily activities are systematic cleaning of the sanitary system, followed by closed circuit television (CCTV) inspections, and responding to customer issues with the lower lateral.
Sanitary pump station maintenance is focused on repair and rehabilitation of the deteriorating infrastructure and implementing preventive maintenance measures. The current emphasis is on the testing, maintenance, repair, and replacement of air relief valves (ARV).
Regional Water Quality Control Board (RWQCB) A total of 6 Sanitary Sewer Overflows (SSOs) occurred during the month. All spills were Category 2, which means they were less than 1,000 gallons and captured before entering into a waterway. All pipes and areas affected were cleaned to ensure capture of the pollutants and returned to the sanitary sewer system.
Details of all the immediately reportable SSOs are listed in Table 4.1, with annual trend comparisons in Figures 4.A through 4.C.
Activities Summary Collection System Collections work included: line cleaning, CCTV inspection, main line and lower lateral repair, and preventive maintenance. This work is in accordance with the Consent Decree. SSO records are indicating continued problems with lower lateral sections of the City’s pipes. Staff has initiated a program to proactively address maintenance issues with the lower lateral pipes. The summary of maintenance work performed is shown in Table 4.2 and a comparative table of prior year activities is also presented for comparison.
Customer Service Table 4.3 presents a summary of the customer services activities performed. A table of prior year activities is also presented for comparison.
1 The Consent Decree is a negotiated settlement with the California Sportfishing Protection Alliance (CSPA). The Consent Decree requires specific maintenance schedules for sewer pipe to reduce sanitary sewer overflows (SSOs).
City of Stockton, Municipal Utilities Department – June 2013

P a g e | 24
Residuals Management Table 4.4 presents a summary of spoils activities (material taken to a dumpsite) in the repair and maintenance of the stormwater and wastewater pumping stations, and the Regional Wastewater Control Facility (RWCF). Data is gathered on how many loads of spoils are removed from the plant site, and the tonnage of all the loads hauled.
Odor Control Program There were four odor complaints. Employees are trained to investigate all potential reasons for these complaints. Staff continues to research new and emerging technology to address odors and corrosion associated with high hydrogen sulfide levels in Systems 7 and 8.
Pumping Facilities Preventive maintenance on the sanitary stations continued. Pump impellers and pump housing de-ragging continues at various sanitary sewer stations on a daily basis to keep the stations operating efficiently. Table 4.5 and 4.6 summarizes collection systems pump station maintenance activities.
Painting of the sanitary pump stations continues in order to protect the facilities and prevent weather related damage.
The rebuild for the Brookside and I-5 sanitary station #2 pump is complete. The pump has been installed and is running properly. The #1 pump at the same station had a new impeller installed and is also back in service.
Smith Canal Station pump # 5 has been removed and was sent out to be rebuilt.
Several new level transmitters were purchased to replace the obsolete bubbler systems at the sanitary stations. This will help prevent sanitary sewer overflows by increasing accuracy and reliability of the level and control sensing equipment.
City of Stockton, Municipal Utilities Department – June 2013

P a g e | 25
Environmental Control
Operational Activities The Environmental Control Division (EC) is tasked with the responsibility of protecting the City's wastewater collection system, treatment plant, and biological treatment processes from interference, pass-through, and sludge contamination. This is accomplished through a system of permitting, monitoring, and enforcement of regulated sewer dischargers. Permitted users include significant industrial dischargers, categorical industrial users, groundwater remediation project discharges, and hauled waste discharges.
Staff conducts inspections, takes samples of wastewater, reviews self-monitoring reports, writes permits, and enforces permit requirements as specified in Stockton Municipal Code, Chapter 13.08 (Pretreatment Ordinance).
Staff is also tasked with implementing the Fats, Oils, and Grease (FOG) Control Program. This program involves inspecting all food service establishments in the City's sewer service area to ensure compliance with Stockton Municipal Code Chapter 13.40 (FOG Control Ordinance).
Staff responds to stormwater illicit discharge complaints and hazardous material spills, which potentially threaten the City's stormwater collection system and receiving waters. These responses are required to ensure public safety, environmental protection, and compliance with Stockton Municipal Code Chapter 13.16 (Stormwater Ordinance).
The Fats, Oils, and Grease (FOG) Program is in its third year of restaurant inspections. AS400 data entries are made on a daily basis as officers complete their inspections.
The FOG Program Grease Disposal Mitigation Fee has been developed and will be included in the 2013-14 fee schedule.
FOG Program staff will begin performing restaurant stormwater inspections in January 2014. These inspections will occur in conjunction with the regular FOG annual inspections at each facility. Preparation and training will commence mid-July to accommodate these additional Environmental Control Division responsibilities. Enforcement, follow-up inspections, billing procedures and correspondence related to the stormwater inspections will be performed by Stormwater Division staff.
Reports/Statistics Table 5.1 presents statistics of all pretreatment, waste hauler, stormwater, and FOG Program activities on a monthly basis. Some items reflect the previous month’s data due to the timing of when the data is received.
There were two pretreatment enforcement actions and no stormwater complaints or stormwater enforcement action.
There was a slight decrease to initial inspections and follow-up inspections in comparison to last month.
City of Stockton, Municipal Utilities Department – June 2013

P a g e | 26
THIS PAGE INTENTIONALLY LEFT BLANK
City of Stockton, Municipal Utilities Department – June 2013

P a g e | 27
Laboratory
Operational Activities The Laboratory Division collects and analyzes samples for NPDES permit compliance for the Wastewater Division, and analyzes and oversees contract lab analyses for T22 compliance for the Water Division. The Laboratory is accredited under California Department of Health Services, Environmental Laboratory Accreditation in five different fields of testing. Those fields are: microbiology of water, microbiology of wastewater, inorganic chemistry of drinking water, inorganic chemistry of wastewater, and whole effluent toxicity of wastewater. The staff consists of the laboratory supervisor, a microbiologist, two chemists, and three laboratory technicians.
Wastewater Sampling and Analyses
Effluent Weekly Acute Static-renewal Toxicity Testing with Rainbow Trout All tests had 100% survival of Rainbow Trout. Results are shown in Table 6.1. Analyses were done by in-house staff and Pacific EcoRisk.
Effluent Quarterly Chronic 3-species Toxicity Testing Routine quarterly testing done in April showed no toxicity to the three species. Next quarterly monitoring will be conducted in July 2013. Results of testing are shown in Tables 6.2, 6.3, and 6.4.
Effluent Monitoring – Cyanide The waste discharge requirements (WDR) contains a requirement to monitor the treatment plant effluent monthly for cyanide, and contains monthly average (4.1 µg/L) and daily maximum (9.2 µg/L) requirements. There was no exceedance of the time schedule order. The monthly result was DNQ 1.5 µg/L, shown in Table 6.5.
Effluent Ammonia Testing The WDR contains a monitoring requirement to monitor the treatment plant effluent twice a week from March through August; twice per week testing was done this month. The permit contains limits of monthly average (2 mg/L) and daily maximum (5 mg/L) requirements. There were no daily maximum limit exceedances as shown on Table 6.6. The monthly average was <0.5 mg/L, the monthly maximum was 0.6 mg/L.
Drinking Water Sampling and Analysis Routine domestic water quality for finished water and raw water wells was completed. The annual T22 testing on the Delta source and Finished Water for DWTP was done in June. In addition, five groundwater wells had the “Cycle Test” performed as requested by CDPH. Only three of the wells passed the cycle tests.
City of Stockton, Municipal Utilities Department – June 2013

P a g e | 28
Laboratory Operations The lab analyzed 850 samples for 3,997 analyses. Contract labs analyzed 144 samples for 470 analyses. Figures 6.A and 6.B display the results of the samples and analyses. Figure 6.C shows the number of samples processed for permit compliance, process control (plant performance), and drinking water regulatory compliance. There were 294 samples for NPDES Permit compliance; 267 samples for process control, and 289 samples for drinking water compliance.
In June the Lab had all fume hoods re-certified by Technical Safety Services.
City of Stockton, Municipal Utilities Department – June 2013

P a g e | 29
Engineering
The primary responsibilities of the Engineering Division are management and execution of the Department’s Capital Improvement Program, Development Services, and Geographical Information Systems.
Development-related submittals are received daily from Public Works, Community Development, other City Departments, and government agencies. The submittals, collectively called “development reviews,” encompass environmental documents, fiscal impact analysis reports, feasibility analyses, utility master plans, engineering reports, improvement plans, permit applications, tentative subdivision maps, and parcel maps. Development reviews are assigned daily to individual engineers within the Engineering Division with specific completion dates.
The Department’s Capital Improvement Program (CIP) consists of the master planning, budgeting, design, competitive bidding, and construction management of capital improvement projects (involving water, sanitary sewer, storm drainage, and nonpotable water). The Division offers the full array of CIP services, including computer-aided design and drafting, and construction inspections.
The Geographical Information Systems (GIS) program is responsible for the mapping and database management of utilities that are owned and operated by the Department.
Figure 7.A represents the number of development submittals received and completed on a weekly basis. The amount of Development Reviews received in a particular week may not coincide with the number completed in the same week because of differing complexities and review time required for the submittals. There were eleven Development Reviews received and six completed.
Development Review Projects Short descriptions of the development reviews received are as follows:
• Improvement Plans – Fresno Ave Street Improvement Project • Improvement Plans – New Stockton Courthouse – 180 E. Weber Ave. • Request for Utility Service – Century Mobile Home Park – 3312 E. Sunny Road • Request for Utility Service – 1506 E. Mariposa Road • Stormwater Quality Control Plan – Arco Service Station – 400 W. Dr. Martin Luther King
Jr. Blvd. • Stormwater Quality Control Plan – Kelly’s Express Car Wash • Stormwater Quality Control Plan – Starbuck’s Café 3011 W. Ben Holt • Stormwater Quality Control Plan – O’Connor Woods Memory Care Building • Tentative Map – 1505 Navy Drive • Tentative Map – 505 W. Harding – Family Dollar • Use Permit: 2527, 2511, and 2531 E. Main Street – Second Hand Thrift Store
City of Stockton, Municipal Utilities Department – June 2013

P a g e | 30
Figure 7.B represents the number of development reviews received and completed since the start of the 2012-2013 fiscal year.
Capital Improvement Project Milestones The Engineering Division has 53 budgeted Capital Improvement Program (CIP) projects in fiscal year 2012-2013. Engineering staff is currently working on 27 of those projects. Table 7.1 is a graphic summary of the most active, current CIPs.
Upcoming and completed milestones for a few, select CIP projects are as follows:
2012 Sanitary Sewer Rehabilitation Project (M11002) California Trenchless, Inc. has completed approximately 90% of the rehabilitation of sewer pipeline. The Project is coordinating with Housing Authority to gain access into a number of private backyards.
Arch Road Sanitary Sewer Trunk Line (M09106) The bidding process is anticipated to begin in July 2013.
Pershing Sewer Crossing at the Calaveras River Project (M13005) Siegfried Engineering, Inc. is currently developing the pre-design report for a sewer main crossing at the Calaveras River and is due August 12, 2013. The new sewer main will be installed under the Calaveras River by using trenchless technology, and span over 800 feet.
CAT Engine Replacement at Water Wells 25 and 26 –Phase I (M08001) The bidding process is anticipated to begin in July 2013.
Rehabilitate Thornton Road Sanitary Pump Station (M13009) A Request for Proposals to provide engineering design services for the rehabilitation of the Thornton Road Sanitary Pump Station was issued on May 20 and 3 proposals were received by the June 13, 2013 due date.
RWCF Bulk Sodium Hypochlorite and Sodium Bisulfite Project (M12007) Project is on hold pending instrumentation and control strategy. The bid process is scheduled to begin early 2014.
RWCF Headworks Rehabilitation Project (M13007) Six proposals for the preparation of design documents were received on May 23 in response to the Request for Proposals for the City of Stockton Regional Wastewater Control Facility Headworks Rehabilitation Project. A Selection Committee comprised of City staff met on June 10 to shortlist the consultants and interviews with three firms were conducted on June 19. The Selection Committee selected CDM-Smith, Inc. to design the Headworks Rehabilitation Project, and the award of the professional services contract is scheduled to go the City Council on August 27, 2013.
Smith Canal Sanitary Sewer Pump Station – Wet Well (M09093) The Smith Canal Sanitary Sewer Pump Station project advertised for bids on June 21. There will be a pre-bid meeting on July 2, 2013 and bid opening on July 25.
City of Stockton, Municipal Utilities Department – June 2013

P a g e | 31
Geographical Information Systems Projects The GIS Program is responsible for the computerized mapping of all water, sanitary sewer, storm drainage, and nonpotable water infrastructure. This technology enables diverse City databases to be displayed and analyzed using a geographically oriented interface.
GIS performed and completed the following tasks:
• Performed the monthly Pipeline Observation Management System (POSM) update • Performed various queries against the GIS data for statistics and analysis support • Updated the Department’s Organizational Chart with numerous changes • Continued corrections and updates to the MUD utility layers in GIS • Creation and revision of numerous maps
City of Stockton, Municipal Utilities Department – June 2013

P a g e | 32
THIS PAGE INTENTIONALLY LEFT BLANK
City of Stockton, Municipal Utilities Department – June 2013

P a g e | 33
Stormwater
Operational Activities The Stormwater Division is responsible for ensuring compliance with the City’s municipal Stormwater National Pollutant Discharge Elimination System (NPDES) permit. The NPDES program is mandated by the Federal Clean Water Act, and administered in California by the State Water Resources Control Board and the Regional Water Quality Control Boards (RWQCB) on behalf of the U.S. Environmental Protection Agency (USEPA).
Activities of the Stormwater Division include permit mandated programs and activities; collection system inspection, maintenance and repair; catch basin inspection and cleaning; pump station repair, maintenance and rehabilitation; and response to community concerns as they relate to the stormwater systems within the City of Stockton. With limited resources it can be difficult to meet the maintenance needs of the aging stormwater infrastructure. On average, fifty percent of stormwater pump station’s wet wells are cleaned annually. Preventive maintenance measures are used to identify the most urgent areas. Closed Circuit Television (CCTV) inspection of the discharge lines from each station has commenced and will continue at the request of San Joaquin County Flood Control.
The City’s storm drain system collects water from numerous nonpoint sources that discharge into local waterways and into the Delta. The City complies with the requirements of its NPDES permit by implementing various stormwater pollution prevention activities, including:
• Ensuring pollutants stay out of the storm drain system, creeks, and the Delta • Managing and enforcing the City’s Municipal Code to minimize stormwater impacts • Requiring new development projects mitigate impacts to stormwater • Promoting pollution prevention awareness • Education Programs and outreach to the public • Supporting local nonprofit creek groups • Inspecting businesses to ensure responsible stormwater-related practices • Investigating and responding to illicit discharges
Stormwater System There were six storm drain catch basin covers stolen. The City continues to seek ways to prevent additional thefts of these drain grates. Police reports are filed for each occurrence of stolen grates.
The downtown business area is being inspected monthly and cleaning of the areas surrounding the catch basins completed on as-needed basin to minimize trash and debris entering the storm system.
Table 8.1 presents a summary of the stormwater system maintenance and repair activities. A table of prior year activities is also presented for comparison.
City of Stockton, Municipal Utilities Department – June 2013

P a g e | 34
Pumping Facilities In addition to the regular preventive maintenance activities at the storm stations, the following repairs were made.
• The Back-flow relocation and cooling pipe upgrade at the Legion Park Storm Station has been completed.
• The Back-flow device was replaced at our West Lane South Storm Station after it was stolen. We have made changes to a protective cage to try to prevent further theft of this device.
Permit Compliance Stormwater Program continued to work collaboratively with the Regional Water Quality Control Board (RWQCB) and San Joaquin County on the development of new permit, which is anticipated to be adopted by the RWQCB in October 2013. Program staff, Condor Earth Technologies and Larry Walker Associates continued site planning for the launch of a Methlymercury Control Study to commence within the Charter Way Detention Basin in October 2013.
Storm Drainage Assessment Districts Spring quarterly maintenance was conducted on the Stockton Airport Business Center, Charter Way, Western Pacific, Airport Gateway, Riverbend, Morada, and ProLogis Park Basins. The scope of work for the maintenance contract includes vector control; weed abatement; rodent control; slope dressing; mowing, ripping, discing, and grading the basin bottom (as needed); trash and debris pick-up and removal; cleaning of basin structures; and sedimentation relocation.
Storm Water Inspection and Maintenance Services (SWIMS) conducted the spring inspections of all the underground stormwater treatment vault filtration systems in June. The underground stormwater treatment vault filtration systems remove solids from stormwater before discharging it to receiving waterways. These vaults are located throughout the City and maintained by the Stockton Consolidated Storm Drainage Maintenance Assessment District No. 2005-1. Staff is reviewing the inspection reports and photos to determine which will vault sites will be approved for maintenance cleanings this summer.
Stormwater Inspections There were 16 Stormwater inspections conducted at active construction sites. Additional calls reported on the hotline or while conducting normal business, combined with the construction inspections, resulted in 11 Verbal Warnings, 1 Correction Orders, 2 Notice to Clean, 1 Notice of Violations, and 0 Administrative Citations being issued.
Stormwater Monitoring A successful dry weather urban discharge dry weather sampling event was conducted on June 11. Samples were collected at urban discharge and receiving water sampling locations along Smith Canal, Calaveras River, Duck Creek and Mosher Slough. A dry weather pesticide plan monitoring event was also conducted in concert with the dry weather urban discharge dry weather monitoring event on June 11. Pesticide samples were collected along Mosher Slough, Calaveras River, Smith Canal, and Five Mile receiving water sampling locations. All samples were submitted for pyrethroid and diazinon/chlorpyrifos analysis.
City of Stockton, Municipal Utilities Department – June 2013

P a g e | 35
Outreach and Education Various outreach and educational programs are promoted by staff to improve stormwater awareness in the community. A stormwater hotline allows residents to report illegal discharges, street flooding, request stream clean-up information, or to contact stormwater staff. Information is distributed through various sources such as the monthly utility bill inserts, City website, various publications, presentations to schools and community groups, multi-media campaigns, and participation at community events. Brochures and promotional material are provided at all events. Messages are included regularly in the Utility Bill insert and on the City website. Table 8.3 illustrates the number of impressions made as part of these outreach efforts.
City of Stockton, Municipal Utilities Department – June 2013

P a g e | 36
THIS PAGE INTENTIONALLY LEFT BLANK
City of Stockton, Municipal Utilities Department – June 2013

P a g e | 37
Administration
Operational Activities The Administration and Business Services divisions are responsible for the overall business operations of the Municipal Utilities Department, including personnel, purchasing, public outreach, health and safety, regulatory compliance, budgeting, and accounts payable. The staff in these two divisions supports the workflow of the entire department to keep operations running smoothly.
Health and Safety The Health and Safety program monitors the training and safety activities of the department. Unsafe conditions, unsafe activities by staff or contractors, and accidents are tracked and reported according to OSHA guidelines. Table 9.1 provides a summary of unsafe conditions or acts that occur during the month, along with a running total for the year. Table 9.2 provides information on work-related injuries and illnesses. This is a continuously evolving program that responds to the needs of staff to work in a safe and accident free environment. It is important to note that OSHA requires reporting on a calendar year. All statistics and data noted for the Health and Safety program are from January through December.
To promote safe work habits and to comply with OSHA requirements, regular tailgate safety meetings are held in all divisions. Topics vary depending on the needs and work requirements of each division. Specialized training is also provided to ensure that proper work habits and techniques are used in all work situations. Table 9.3 provides a summary of the tailgate and specialized training provided.
Safety Activities There were no injuries or illnesses this month, and only one vehicle incident.
Training opportunities continued this month including confined space, MSDS, backhoe safety, respirator fit testing, and hazardous communication.
Human Resources
Staffing Activities Recruitment activities continue on an ongoing basis to fill vacated and recently approved positions. MUD is currently staffed at 187 of the approved 208 positions. Table 9.4 presents the staffing changes by division. The status of various positions attempted to be filled is shown below.
Positions in Active Recruitment / Background Check / Civil Service Commission • Assistant/Assistant Civil Engineer (active recruitment) • Collection Systems Operator (active recruitment) • Plant Maintenance Mechanic (active recruitment)
City of Stockton, Municipal Utilities Department – June 2013

P a g e | 38
• Water Systems Operator (active recruitment)
Positions Filled / Department Transfer • Plant Operator/Water
Resignations / Separations / Retirements • Senior Plant Maintenance Supervisor • Water Field Technician
Overtime Tracking Overtime hours are tracked as part of the Department’s internal monitoring. This information helps determine if the department is at appropriate staffing levels, and where and when work demand is spiking. Because of the 24-hour shift work at the RWCF, overtime is expected to spike during holidays, closed days, and vacations to maintain adequate staffing for operations.
Table 9.5 details the overtime hours for each division to-date. For comparison, the total overtime hours for Fiscal Year 2011-2012 are also shown below Table 9.5. Overtime increased slightly from the previous month.
Regulatory Compliance The Regulatory Compliance Officer is responsible for assisting all Municipal Utilities Department divisions in achieving general compliance with local, state, and federal regulations originating from the Federal Clean Water Act, the Federal Safe Drinking Water Act, the Federal Clean Air Act, the Federal Resource Conservation and Recovery Act, and associated environmental laws. The Regulatory Compliance Officer coordinates with all local, state, and federal regulators, and MUD divisions, as well as other City of Stockton departments to accomplish environmental compliance across the wastewater, drinking water, and stormwater utilities.
Inspections/Report Submissions Industrial Railways Company performed the monthly inspection at the Tertiary Facility rail spur on June 18, no deficiencies were identified.
The triennial statements of water diversion and use were submitted to the State Water Resources Control Board on June 27.
Facility Tours There were no technical tours in June.
There were no bird-watching tours.
City of Stockton, Municipal Utilities Department – June 2013

P a g e | 39
Reference
Tables and Figures
City of Stockton, Municipal Utilities Department – June 2013

P a g e | 40
THIS PAGE INTENTIONALLY LEFT BLANK
City of Stockton, Municipal Utilities Department – June 2013

P a g e | 41
Water Resources Table 1.1 – Water Waste Complaints
Water Conservation Month-to-Date Year-to-Date New Open Closed Completed
Complaints Broken Sprinklers / Irrigation Leaks/ Other Leaks 1 0 1 68 Over-irrigation / Water Run-off 6 0 6 69 Watering during Restricted Hours 1 0 1 3 Invalid/Unable to Verify 0 0 0 2
Other Conservation Calls 0 0 0 1 Totals 8 0 8 143
Table 1.2 – Water Conservation Outreach Description Type Date(s) Impressions
Utility Bill Insert Print Media June 47,759 Impressions/Literature Distribution Other June 1,575 Stockton Ports Education Day Community Event June 3, 2013 250 Stockton Ports Community Event June 22, 2013 275
Table 1.3 – Water Conservation Surveys Survey Type Requested / Pending Completed
In-Home Single Family 0 0 In-Home Multi-Family 0 0 REACON Business 0 0 Self-Certified Surveys 38 3 Other 0 0
TOTAL 38 3 FY-to-Date 406 46
Table 1.4 – Water Saving Devices Device Description Quantity Distributed FY-to-Date
Low Flow Showerhead 6 322 Low Flow Faucet Aerators 9 552 Toilet Flapper 3 251 Leak Detection Tablet Packets 6 328 Positive Shut-off Hose Nozzles 63 806 Water-efficient Plant Seed Packets 0 126
TOTAL 87 2,385
City of Stockton, Municipal Utilities Department – June 2013

P a g e | 42
Table 1.5 – CUWCC SMART Rebate Program Device Description Rebates Processed Water Savings
(in Acre Feet) High Efficiency Toilet (Residential) 0 0 High Efficiency Clothes Washer (Residential) 0 0 Ultra Low Flush Toilet (Commercial) 0 0
TOTAL 0 0 FY-to-Date 0 0
Program-to-Date (since March 2007) 1,040 479.32
Table 1.6 – HET Direct Install Program Device Description Devices Installed Water Savings
(in Acre Feet) High Efficiency Toilet (Commercial) 1 0.941
TOTAL 1 0.941 *FY-to-Date 58 54.578
Program-to-Date (since February 2010) 387 364.167
City of Stockton, Municipal Utilities Department – June 2013

P a g e | 43
Water Treatment, Production, and Distribution Table 2.1 - Monthly Summary Coliform Monitoring – June 2013
Routine Samples # Required # Taken Total Coliform
Positive E. Coli
Positive North System 121 121 0 0 Walnut Plant 1 1 0 0 South System 24 24 0 0
City of Stockton, Municipal Utilities Department – June 2013

P a g e | 44
Table 2.2 – Well Operational Status
Well # Well Station Location DPH In Service Status Well Status if Limited Use or Not Available for Operation
Fire Protection
Only Active Stand-by Inactive Exceeds
Sec MCL Arsenic Bacti Mechanical
NORTH WELL SYSTEM 1 Parkwoods x x x 4 Villa Dorado x x 7 Galloway x x 9 Don Carlos x x 10R Valverde Park x 11 Inglewood x x 15 Glasgow x x 16 Royal Oaks x x 18 Hickock x 19 Morada/West Ln x 20 West Ln/Mosher x 21 Cortez Park x 24 Saffron x 25 Panella Park x 26 Auto Center x x x 27 Horse Park x 28 Blossom Ranch x x 29 Baxter Park x 30 Grider x 31 Ivano Ln x x 32 Hwy 99 Frontage x 33 (3-R) West Ln @ WFO x NWR Northwest Reservoir x 14 Mile 14 Mile Reservoir x SOUTH WELL SYSTEM SS1 Qantas x SS2 N Arch Frontage x SS3 Frontier x SS4 Airport South x x x SS5 Airport North x x x x SS8 Shropshire Park x SS9 B St & Littlejohn x WSTN Weston Ranch Res x SSA South Sys Aqueduct x INTERCONNECTIONS Cal Wtr Airport Wy x Cal Wtr Airport/Arch Airport x Cal Wtr El Dorado x Cal Wtr Filbert/Marsh x Cal Wtr Filbert/Miner x Cal Wtr M L King/Mariposa x Cal Wtr Pardee x Cal Wtr Pershing x Cal Wtr Zephyr x Lathrop Roth/Harlan x SJ Cty Greeley Wy x SJ Cty Grigsby Pl x SJ Cty Lincoln Rd x SJ Cty Misty Ln x SJ Cty Pershing Av x SJ Cty Plymouth Rd x SJ Cty Portola Av x SJ Cty Thornton Rd x
City of Stockton, Municipal Utilities Department – June 2013

P a g e | 45
Table 2.3 – Production Summary Year 2012-2013 (in Million Gallons)
Production Summary Comparison Year 2011-2012 (in Million Gallons) System July Aug Sept Oct Nov Dec Jan Feb Mar Apr May June Year to Date
No. Sys 340.26 288.87 226.10 21.05 10.30 21.53 15.83 57.18 74.02 121.74 168.71 188.49 1,534.08So. Sys 1.41 0.14 3.88 1.01 0.64 0.09 0.06 10.18 7.76 11.86 1.13 3.51 41.67DWTP 0.00 0.00 0.00 0.00 0.00 0.00 0.00 0.00 0.00 0.00 59.25 268.07 327.32SEWD WP 8.59 7.54 9.30 7.14 5.71 4.97 5.50 5.19 5.54 5.34 7.17 8.49 80.47SEWD/North 840.54 884.98 848.48 759.31 571.52 491.67 501.22 455.63 480.90 476.99 830.85 712.46 7,854.55SEWD/South 319.29 327.26 298.17 225.01 153.07 141.81 169.74 142.35 118.46 138.97 222.77 220.96 2,477.86
Total 1,510.09 1,508.79 1,385.93 1,013.52 741.24 660.07 692.35 670.53 686.68 754.90 1,289.88 1,401.98 12,315.95
City North System Wells City South System Wells Delta Water Treatment Plant (DWTP) MLK Diamond & Filbert Interconnect (SEWD) City Walnut System Stockton East Water District (SEWD) City / County North System Stockton East Water District (SEWD) City South System
Table 2.3A – DWTP Influent by Water Source Year 2012-2013 (in Million Gallons) JUL AUG SEP OCT NOV DEC JAN FEB MAR APR MAY JUN YTD
DWTP Influent by Source San Joaquin River/Delta 355.26 288.99 77.38 402.40 320.82 257.18 248.05 256.39 63.58 0 0 0 2,270.05 Mokelumne River/WID 281.71 326.76 430.66 41.31 0 0 0 0 270.96 315.78 544.39 575.23 2,786.80 Reclaimed 37.94 33.52 35.56 31.30 27.33 21.77 21.00 21.3 26.33 25.08 36.38 35.18 352.69
Total Influent (DWTP), MG 674.91 649.27 543.60 475.01 348.15 278.95 269.05 277.69 360.87 340.86 580.77 610.41 5,409.54
System July Aug Sept Oct Nov Dec Jan Feb Mar Apr May June Year to DateNo. Sys 104.84 35.06 88.07 73.64 44.49 76.92 62.01 91.30 104.90 139.42 139.77 135.24 1,095.66So. Sys 12.10 1.65 0.05 0.07 1.97 6.36 3.24 25.77 19.06 0.61 1.14 0.05 72.07DWTP 635.20 609.53 511.26 455.85 320.15 255.84 250.59 260.56 332.72 309.56 548.72 604.98 5,094.96SEWD WP 9.35 8.54 6.86 6.90 4.07 5.30 4.69 4.26 5.70 17.56 7.73 8.32 89.28SEWD/North 594.59 620.46 522.32 323.88 127.67 70.30 83.68 89.39 216.97 314.85 371.20 415.46 3,750.77SEWD/South 227.41 229.70 221.41 213.64 118.18 48.40 59.80 70.28 151.06 197.35 230.90 233.02 2,001.15
Total 1,583.49 1,504.94 1,349.97 1,073.98 616.53 463.12 464.01 541.56 830.41 979.35 1,299.46 1,397.07 12,103.89
City of Stockton, Municipal Utilities Department – June 2013

P a g e | 46
Figure 2.A – Production Summary
Production Summary Comparison Year 2011-2012
City of Stockton, Municipal Utilities Department – June 2013

P a g e | 47
Table 2.4 – City of Stockton Water Systems –Production Summaries JUL AUG SEP OCT NOV DEC JAN FEB MAR APR MAY JUN YTD
Production City System Potable Water Production
City North System Wells 104.84 35.06 88.07 73.64 44.49 76.92 62.01 91.27 104.90 139.42 139.77 135.24 1,095.63 City South System Wells 12.10 1.65 0.05 0.07 1.97 6.36 3.24 25.77 19.06 .61 1.14 0.05 72.07 Delta Water Treatment Plant 635.20 609.53 511.26 455.85 320.15 255.84 250.59 260.56 332.72 309.56 548.72 604.98 5,094.96 MLK Diamond & Filbert Interconnect (SEWD) City
Walnut System 9.35 8.54 6.86 6.90 4.07 5.30 4.69 4.26 5.70 17.56 7.73 8.32 89.28
Stockton East Water District (SEWD) City / County North System 594.59 620.46 522.32 323.88 127.67 70.30 83.68 89.39 216.97 314.85 371.20 415.46 3,750.77
Stockton East Water District (SEWD) City South System 227.41 229.70 221.41 213.64 118.18 48.40 59.80 70.28 151.08 197.35 230.90 233.02 2,001.17
Total City System, MG 1,583.49 1,504.94 1,349.97 1,073.98 616.53 463.12 464.01 541.53 830.43 979.35 1,299.46 1,397.07 12,103.88 System – Nonpotable Water Production
Recycle Water (Reclaimed WW) Million Gallons 0 0 0 0 0 0 0 0 0 0 0 0 0 Total Production 1,583.49 1,504.94 1,349.97 1,073.98 616.53 463.12 464.01 541.53 830.43 979.35 1,299.46 1,397.07 10,706.81
2011-2012 –Production Summaries
JUL AUG SEP OCT NOV DEC JAN FEB MAR APR MAY JUN YTD Production
City System Potable Water Production City North System Wells 340.26 288.87 226.10 21.05 10.30 21.53 15.83 57.18 74.02 121.74 168.71 188.49 1,534.08 City South System Wells 1.41 0.14 3.88 1.01 0.64 0.09 0.06 10.18 7.76 11.86 1.13 3.51 41.67 Delta Water Treatment Plant 0 0 0 0 0 0 0 0 0 0 59.25 268.07 327.32 MLK Diamond & Filbert Interconnect (SEWD) City
Walnut System 8.59 7.54 9.30 7.14 5.71 4.97 5.50 5.19 5.54 5.34 7.17 8.49 80.47
Stockton East Water District (SEWD) City / County North System 840.54 884.98 848.48 759.31 571.52 491.67 501.22 455.83 480.90 476.99 830.85 712.46 7,854.75
Stockton East Water District (SEWD) City South System 319.29 327.26 298.17 225.01 153.07 141.81 169.74 142.35 118.46 138.97 222.77 220.96 2,477.86
Total City System, MG 1,510.09 1,508.79 1,385.93 1,013.52 741.24 660.07 692.35 670.73 686.68 754.90 1,289.88 1401.98 12,316.15 System – Nonpotable Water Production
Recycle Water (Reclaimed WW) Million Gallons 0 0 0 0 0 0 0 0 0 0 0 0 0 Total Production 1,510.09 1,508.79 1,385.93 1,013.52 741.24 660.07 692.35 670.73 686.68 754.90 1,289.88 1401.98 12,316.15
City of Stockton, Municipal Utilities Department – June 2013

P a g e | 48
Table 2.5 – City of Stockton Water Systems –Consumption Summaries JUL AUG SEP OCT NOV DEC JAN FEB MAR APR MAY JUN YTD
City System - Metered Consumption Through previous month
Single-Family Residential 787.34 776.55 752.21 660.81 503.61 304.10 294.56 265.91 338.81 423.95 551.61 5,659.46 Multi-Family Residential 104.37 104.77 105.01 91.93 85.45 60.47 63.50 58.85 63.08 68.36 80.06 885.85 Commercial / Institutional 194.15 166.46 186.33 170.94 116.79 72.77 67.73 69.05 87.42 112.37 142.06 1,386.07 Irrigation 185.93 189.82 180.22 223.05 79.11 33.27 17.07 13.20 35.79 70.75 111.49 1,139.70 Non-Potable Water 0 0 0 0 0 0 0 0 0 0 0 0 Construction/Hydrant/Jumpers/Load Counts 1.60 1.32 1.60 1.27 0.21 .04 .14 0.14 .39 .25 .34 7.30 Other (Industrial) 18.29 19.73 16.89 16.16 18.90 12.46 11.70 11.20 16.45 18.59 17.90 178.27
Subtotal Metered Consumption, MG 1,291.68 1,258.65 1,242.26 1,164.16 804.07 483.11 454.70 418.35 541.94 694.27 903.46 9,256.65
City System - Unmetered Consumption Main Line / Service Repair Losses 0.21 0.22 0.16 0.20 0.38 0.12 0.15 0.06 0.07 0.03 0.04 0.08 1.72 Commercial/Residential Construction Usage 0.01 0.01 0.01 0.01 0.01 0.01 0.01 0.01 0.01 0.01 0.01 0.01 0.12 City Trucks / Parks Trucks / St. Sweepers 0.01 0.01 0.01 0.01 0.01 0.01 0.01 0.01 0.08 0.31 0.30 0.46 1.23 Hydrant / Blow Off Flushing 0.01 0.01 0.01 0.02 0.01 0.11 0.01 0.03 0.01 0.01 0.01 0.30 0.54 System Flushing 0 0 0 0 0 0 0 9.20 3.20 0.75 0.01 0.01 13.17 City Fire Dept. Fire Flow 0.01 0.01 0.01 0.01 0.01 0.01 0.01 0.01 0.01 0.01 0.01 0.01 0.12 City Fire Dept. Training / Equip. Testing 0.01 0.01 0.01 0.01 0.01 0.01 0.01 0.01 0.01 0.01 0.01 0.01 0.12
Subtotal Unmetered Consumption, MG 0.26 0.27 0.21 0.26 0.43 0.27 0.20 9.33 3.39 1.13 0.15 0.88 17.02
Total City System Consumption, Mg 1,291.94 1,258.92 1,242.47 1,164.42 804.50 483.38 454.90 427.68 545.33 695.40 903.61 N/A 9,272.79
Water Wheeled and Wholesaled (SJ County Interconnects)
Metered to San Joaquin County 97.94 88.48 82.53 58.49 33.65 26.49 27.17 27.88 41.77 54.24 55.33 103.75 697.72
Total Wheeled and Wholesaled 97.94 88.48 82.53 58.49 33.65 26.49 27.17 27.88 41.77 54.24 55.33 103.75 697.72
City of Stockton, Municipal Utilities Department – June 2013

P a g e | 49
2011-2012 – Monthly Consumption Summaries
JUL AUG SEP OCT NOV DEC JAN FEB MAR APR MAY JUN YTD
City System - Metered Consumption Through previous month
Single-Family Residential 718.43 699.70 744.35 608.68 471.96 352.86 338.64 298.30 347.53 333.77 441.55 678.59 6,034.36
Multi-Family Residential 93.47 97.85 102.31 88.91 79.20 70.28 66.74 60.72 67.39 65.96 69.05 94.07 955.95
Commercial / Institutional 162.57 181.11 183.62 154.35 103.40 78.02 69.89 78.40 82.63 88.82 107.72 181.32 1,471.85 Irrigation 159.48 153.37 166.82 135.03 79.20 36.92 18.82 30.01 36.69 42.36 72.88 148.88 1,080.46 Non-Potable Water 0 0 0 0 0 0 0 0 0 0 0 0 0 Construction/Hydrant/Jumpers/Load Counts 7.57 9.21 3.37 1.78 0.34 0.38 .47 .35 .18 .42 2.40 1.60 28.07 Other (Industrial) 19.48 18.59 18.56 18.24 14.05 13.06 9.57 19.90 18.80 21.57 17.27 20.33 209.42
Subtotal Metered Consumption, MG 1,161.00 1,159.83 1,219.03 1,006.99 748.15 551.52 504.13 487.68 553.22 552.90 710.87 1,124.79 9,780.11
City System - Unmetered Consumption Main Line / Service Repair Losses 0.01 0.34 0.20 0.43 1.18 0.25 0.14 0.05 0.33 0.12 0.18 0.09 3.32 Commercial/Residential Construction Usage 0.01 0.01 0.01 0.01 0.01 0.01 0.01 0.01 0.01 0.01 0.01 0.01 0.12 City Trucks / Parks Trucks / Street Sweepers 0.01 0.01 0.01 0.01 0.01 0.01 0.01 0.01 0.01 0.01 0.01 0.01 0.12 Hydrant / Blow Off Flushing 0.01 0.01 0.01 0.01 0.01 0.01 0.01 0.01 0.01 0.01 0 0.01 0.11 System Flushing 0 0 0 0 0 0 0 11.8 4.2 0 0 0 16.0 City Fire Dept. Fire Flow 0.01 0.01 0.01 0.01 0.01 0.01 0.01 0.01 0.01 0.01 0.01 0.01 0.12 City Fire Dept. Training / Equip. Testing 0.01 0.01 0.01 0.01 0.01 0.01 0.01 0.01 0.01 0.01 0.01 0.01 0.12
Subtotal Unmetered Consumption, MG 0.06 0.39 0.25 0.48 1.23 0.30 0.19 11.90 4.58 0.17 0.22 0.14 19.91
Total City System Consumption, Mg 1,161.06 1,160.22 1,219.28 1,007.47 749.38 551.82 504.32 499.58 557.80 553.07 711.09 1,124.93 9,800.02
Water Wheeled and Wholesaled (SJ County Interconnects)
Metered to San Joaquin County 79.48 83.14 73.78 56.40 37.70 34.75 35.26 32.14 36.13 39.30 72.18 78.97 659.23
Total Wheeled and Wholesaled 79.48 83.14 73.78 56.40 37.70 34.75 35.26 32.14 36.13 39.30 72.18 78.97 659.23
City of Stockton, Municipal Utilities Department – June 2013

P a g e | 50
Table 2.6 – Chemical Consumption Summary Water Production System Chemical Consumption JUL AUG SEP OCT NOV DEC JAN FEB MAR APR MAY JUN YTD
North Wells Chlorine Gas, Lbs. 776 549 597 513 340 976 904 727 577 956 1,133 1,180 9,228
South Wells Chlorine Gas, Lbs. 199 213 161 147 99 232 271 366 260 45 120 116 2,229
Delta Water Treatment Plant
Liquid Oxygen, Gal. 10,393 9,342 6,476 6,858 6,790 14,558 36,720 11,009 9,652 4,555 6,998 8,633 131,984 Sodium Hypochlorite, Gal. 21,814 29,519 15,987 15,172 16,637 12,132 10,472 8,771 9,672 7,487 10,830 15,771 174,264 Sodium Hydroxide (Caustic Soda), Gal. 9,533 17,078 10,445 10,309 13,370 24,619 22,233 18,653 9,152 2,958 10,687 20,093 169,130 Aluminum Chlorohydrate (ACH), Gal. 7,163 5,804 2,876 2,335 1,768 6,853 9,983 7,239 3,951 2,834 2,521 3,765 57,092 Corrosion Inhibitor, Gal. 956 950 705 649 327 222 307 388 482 423 833 890 7,132 Citric Acid, Gal. 80 59 99 62 121 71 62 67 81 77 87 86 952 Sulfuric Acid, Gal. 145 37 102 82 80 66 58 55 75 66 107 106 979 Sodium Bisulfite, Gal. 60 15 18 88 58 26 15 44 42 17 30 38 451
2011-2012 – Chemical Consumption Summary
Water Production System Chemical Consumption JUL AUG SEP OCT NOV DEC JAN FEB MAR APR MAY JUN YTD North Wells
Chlorine Gas, Lbs. 1,535 1,374 1,164 255 95 165 68 293 316 528 907 935 7,635 South Wells
Chlorine Gas, Lbs. 153 128 126 69 59 32 38 82 67 136 170 162 1,222
City of Stockton, Municipal Utilities Department – June 2013

P a g e | 51
Table 2.7 – Utility Consumption Summary
Water Production System Utility Consumption
JUL AUG SEPT OCT NOV DEC JAN FEB MAR APR MAY JUN YTD
North Wells Electricity, KWH 343,748 139,334 268,956 175,035 117,368 165,992 179,012 191,099 208,442 252,374 288,662 275,223 2,605,245 Natural Gas, 1000 ft3 8 18 3 1 0 0 1 4 53 2.4 2.4 104 196.8
South Wells Electricity, KWH 32,952 26,230 20,960 19,756 14,649 26,005 30,383 54,196 40,882 13,941 19,257 193 299,344 Natural Gas, 1000 ft3 1 25 0 0 3 0 0 4 46 0 1 0 80
Delta Water Treatment Project* Electricity Used, KWH (Intake) 109,440 99,200 12,320 76,000 71,040 76,000 80,640 56,960 320 1,600 4,000 53,280 640,800 Electricity Used, KWH (Treatment Plant) 724,000 744,000 714,000 526,000 398,000 326,000 302,000 380,000 390,000 434,000 890,000 * 5,828,000 Electricity Generated, KWH (Solar) (11,980) (15,695) (13,204) (9,620) (8,362) (5,604) (8,770) (11,451) (15,431) (20,136) (21,767) (21,000) (163,020)
DWTP Net Electricity Used, KWH 821,460 827,505 713,116 592,380 460,678 396,396 373,870 425,509 374,889 415,464 872,233 32,280 6,305,780 Water Production System Utility Outages North Wells
Electricity 0 0 0 0 0 0 0 0 0 0 0 0 0 Natural Gas 0 0 0 0 0 0 0 0 0 0 0 0 0
South Wells Electricity 0 0 0 0 0 0 0 0 0 0 0 0 0 Natural Gas 0 0 0 0 0 0 0 0 0 0 0 0 0
Description of Outages None None None None None None None None None None None None None * June 2013 power consumption data for DWTP not received in time for report.
City of Stockton, Municipal Utilities Department – June 2013

P a g e | 52
2011-2012 – Utility Consumption Summary
Water Production System Utility Consumption JUL AUG SEPT OCT NOV DEC JAN FEB MAR APR MAY JUN YTD North Wells
Electricity, KWH 491,854 446,652 358,594 77,230 52,469 84,237 75,874 123,661 143,495 199,665 296,733 321,321 2,671,785 Natural Gas, 1000ft3 60 139 8 2 1 0 0 12 0 1.3 0.4 2 225.70
South Wells Electricity, KWH 16,029 18,792 20,196 9,472 11,449 14,001 15,863 25,182 22,935 24,377 17,070 21,772 217,138 Natural Gas, 1000ft3 0 34 6 1 0 3 0 0 0 0 0 0 44
Water Production System Utility Outages North Wells
Electricity 0 0 0 0 0 0 0 0 0 0 0 0 0 Natural Gas 0 0 0 0 0 0 0 0 0 0 0 0 0
South Wells Electricity 0 0 0 0 0 0 0 0 0 0 0 0 0 Natural Gas 0 0 0 0 0 0 0 0 0 0 0 0 0
Description of Outages None None None None None None None None None None None None ---
Table 2.8 – Service Connections Meters Applied to Routes- Current Month 5 Meters Applied to Routes - Fiscal Year-to-Date 87 Total Number of Service Meters in Water System (Active + Inactive) 48,557
City of Stockton, Municipal Utilities Department – June 2013

R e f e r e n c e | P a g e 53
Table 2.9 – Number of Active Service Meters in Water System - By Size
Meter Size Residential Industrial Commercial/ Institutional Irrigation
5/8-inch 1,792 0 14 16 3/4-inch 25,001 14 214 84 1-inch 18,087 0 244 141
1-1/2-inch 254 0 227 164 2-inch 256 1 599 433 3-inch 13 0 66 24 4-inch 6 3 46 20 6-inch 5 1 18 2 8-inch 0 0 5 0
10-inch 0 0 2 0 12-inch 0 0 2 0
TOTALS 45,414 19 1,442 884
Table 2.10 – Water Quality Inquiry Summary Inquiry Quantity Follow-up Action
Taste / Odor 1
-1- Complaint of “smelly” water in kitchen sinks only. Operator didn’t notice any taste or odor problem. Operator advised customer to use bleach to clean sinks and disposal.
Color 1 -1- Complaint of purple water. Hydrant use in the area. Operator flushed lines and water cleared.
Turbidity 0 None
Suspended Solids 0 None
OTHER Pressure
4
-1- Complaint of low pressure. House valve partially closed. Operator spoke with customer and pressure is back to normal. -1- Complaint of low pressure in sprinkler system. Operator found meter valve partially closed. Opened valve and pressure normal. -1- Complaint of low pressure. Outside pressure/volume normal. Possible inside problem due to water softener. Operator spoke to customer. -1- Complaint of low pressure in sinks. Operator spoke to customer. Customer to clean aerators.
Sediment 0 None
Air 0 None
Sand 0 None
Miscellaneous 0 None
Inquiry 0 None
City of Stockton, Municipal Utilities Department – June 2013

P a g e | 54
Table 2.11 – Customer Services Summary Customer Service Operations Current Month
Residential Meter Routes 90 Commercial Meter Routes 13
Estimated Meter Reads by Utility Billing 0 Total Meters Read 48,557
Number of Check Reads (All Routes) 279 Number of Service Turn-on/Turn-offs 1,192
Table 2.12 – Cross Connection Control Program Scheduled to be
Tested Tested Remaining to be
Tested % Tested
Backflow Devices Tested 261 170 91 65%
Table 2.13 – Cross Connection Control Program Surveys Surveyed Surveyed Fiscal Year-to-Date
Customer Connections Surveyed 2 137
City of Stockton, Municipal Utilities Department – June 2013

R e f e r e n c e | P a g e 55
Wastewater Treatment Table 3.1 – Summary of Influent and Effluent Parameters Influent Parameters Actual Month Average Flow, MGD 31.6 cBOD, mg/L 320 TSS, mg/L 340 Effluent Parameters Actual Month Average NPDES Permit Limit Monthly Average
Flow, MGD 19.6 55 Average Dry Weather Flow
cBOD, mg/L <2.0 10 cBOD Removal, % >99.6 85 TSS, mg/L <2.7 10 TSS Removal, % > 99.5 85 Ammonia, mg/L <0.5 2
Daily max is 5
Turbidity (NTU) 1.2 0.6 –2.4
2 (daily average) Daily max limit
> 5 NTU no more than 3 mins/hr or 72 mins/24 hr run time
pH, standard units (Min/Max) 6.6-8.4 6.5 – 8.5 DO, mg/L (Min. Daily Average) 7.5 5.0
December 01 thru Aug 31 Ponds, Free Board, feet (Daily Ave) 2.44-3.70 >= Two (2) feet (Daily Avg)
No less than 1.0 ft (Daily Max)
City of Stockton, Municipal Utilities Department – June 2013

P a g e | 56
Figure 3.A – Wastewater Plant Influent and Effluent Flow
Wastewater Plant Influent and Effluent Flow Comparison Year 2011-2012
825.1 904.4 981.6 1011.2 940.1 1008.7 980.1 877
970.9 949.7 940.6 948.4
654.9 840.7 708.4 734.2 693.3
877.3 761.38 708.86 762.44 739.84 691.63 588.45
0
200
400
600
800
1000
1200
Jul Aug Sep Oct Nov Dec Jan Feb Mar Apr May Jun
Mill
ion
Gal
lons
WASTEWATER PLANT INFLUENT and EFFLUENT FLOW
Fiscal Year 2012-2013
Influent Effluent
935.7 946.7 898.2 883.2 823.7 794 810.8 764.1 826 810.6 806.4 778.1
734.12 843.77 797.9 930.96 703.73 639.23 763.39 687.2 745.15 753.88 734.5
567.7
0
200
400
600
800
1000
1200
Jul Aug Sep Oct Nov Dec Jan Feb Mar Apr May Jun
Mill
ion
Gal
lons
WASTEWATER PLANT INFLUENT and EFFLUENT FLOW Fiscal Year 2011-2012
Influent Effluent
City of Stockton, Municipal Utilities Department – June 2013

R e f e r e n c e | P a g e 57
Figure 3.B – Wastewater Plant Influent CBOD5 Load
Wastewater Plant Influent CBOD5 Load Comparison Year 2011-2012
2.24 2.7 2.6 2.4 2.4 2.4
2.66 2.1
2.4 2.17 2.03
2.43
00.5
11.5
22.5
33.5
Jul Aug Sep Oct Nov Dec Jan Feb Mar Apr May Jun
Mill
ion
Lbs
. WASTEWATER PLANT INFLUENT CBOD5 LOAD
Fiscal Year 2012-2013
Actual
1.99 2.3 2.1 2 2
2.24 2.31 2.12 2.18 2.14 1.96 1.86
00.5
11.5
22.5
33.5
Jul Aug Sep Oct Nov Dec Jan Feb Mar Apr May Jun
Mill
ion
Lbs
.
WASTEWATER PLANT INFLUENT CBOD5 LOAD Fiscal Year 2011-2012
Actual
City of Stockton, Municipal Utilities Department – June 2013
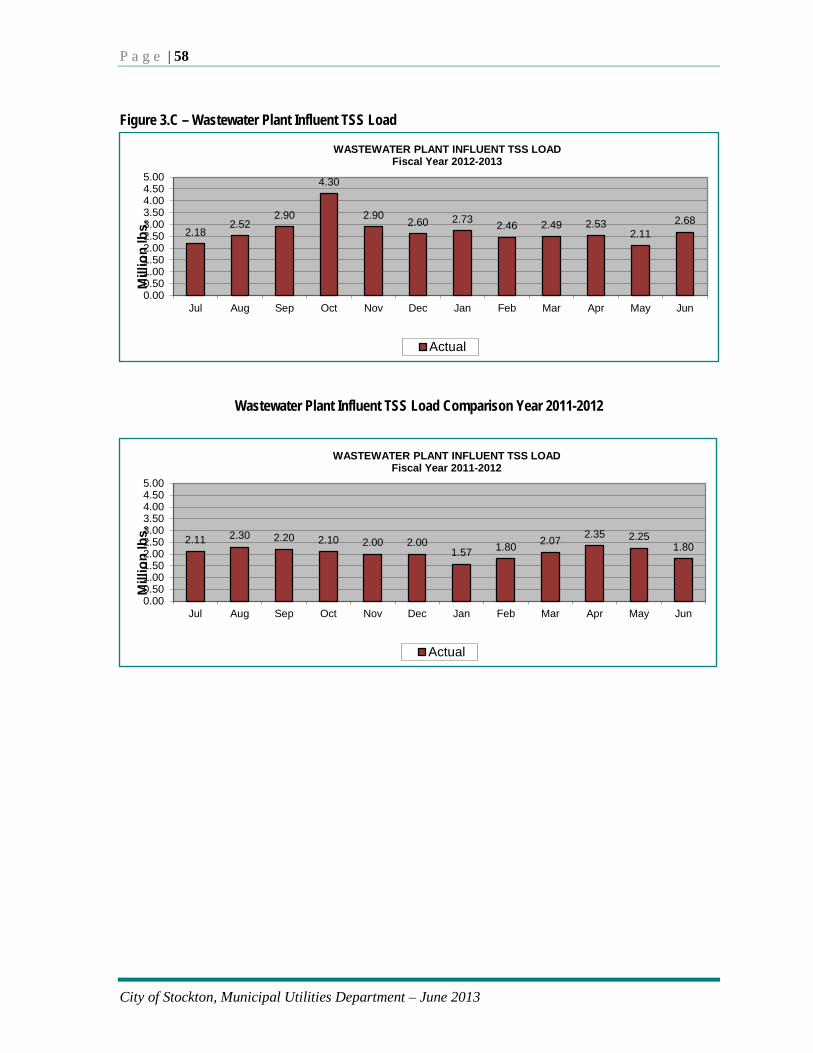
P a g e | 58
Figure 3.C – Wastewater Plant Influent TSS Load
Wastewater Plant Influent TSS Load Comparison Year 2011-2012
2.18 2.52
2.90
4.30
2.90 2.60 2.73 2.46 2.49 2.53 2.11
2.68
0.000.501.001.502.002.503.003.504.004.505.00
Jul Aug Sep Oct Nov Dec Jan Feb Mar Apr May Jun
Mill
ion
lbs.
WASTEWATER PLANT INFLUENT TSS LOAD
Fiscal Year 2012-2013
Actual
2.11 2.30 2.20 2.10 2.00 2.00 1.57 1.80 2.07 2.35 2.25
1.80
0.000.501.001.502.002.503.003.504.004.505.00
Jul Aug Sep Oct Nov Dec Jan Feb Mar Apr May Jun
Mill
ion
lbs.
WASTEWATER PLANT INFLUENT TSS LOAD Fiscal Year 2011-2012
Actual
City of Stockton, Municipal Utilities Department – June 2013

R e f e r e n c e | P a g e 59
Table 3.2 – Residuals and Chemical Management Summary for Biosolids Residuals and Chemical Management Summary Current Month Fiscal Year-to-Date Digester Biosolids
Total Feed, gals. 4,435,600 58,534,112 Total Gas Production, CuFt. 16,211,600 225,245,416 Sludge Lagoon, gals. 0 35,473,547 Ferric Chloride, gal. 3,221 64,246 Ferric Chloride (EPT), lbs. 14,646 135,438
Dewatered Biosolids Total Feed, gals. 3,521,276 30,468,632 Polymer, lbs. 88,784 771,691 Cake, Wet Tons 1,852 16,452 Biosolids Truck Loads Hauled 76 680
City of Stockton, Municipal Utilities Department – June 2013

P a g e | 60
Figure 3.D – Cake Solids
Cake Solids Comparison Year 2011-2012
Table 3.3 – Summary of Tertiary Pond Operating Levels
Tertiary Pond Start Freeboard End Freeboard Average Freeboard Reserve Capacity (Million Gallons)
Pond #1 (190 ac.) 2.41 2.15 2.44 133.11
Pond #2 (135 ac.) 3.7 3.36 3.7 136.86
Pond #3 (125 ac.) 3.45 3.05 3.44 134.17
Total 404.14
Total Reserve Days 21.74
18.9 21.3 20.7 20.5 20 19.8 19.4 20.3 21
19.3 18.5 19
0
5
10
15
20
25
Jul Aug Sep Oct Nov Dec Jan Feb Mar Apr May Jun
% T
otal
Sol
ids
CAKE SOLIDS, %TS Fiscal Year 2012-2013
Actual
CAKE SOLIDS, %TSFiscal Year 2011-2012
19.1 20 20.621.9 21.3
20 19.817.5 17.5 17.9 18.1 18.7
0
5
10
15
20
25
Jul Aug Sep Oct Nov Dec Jan Feb Mar Apr May Jun
% T
otal
Sol
ids
Actual
City of Stockton, Municipal Utilities Department – June 2013

R e f e r e n c e | P a g e 61
Table 3.4 – Chemical Consumption Summary – Tertiary Facility
Chemical Used JUL AUG SEP OCT NOV DEC JAN FEB MAR APR MAY JUN Fiscal YTD
Chlorine Gas, lbs. 36,231 45,225 36,072 36,288 33,066 34,680 37,046 32,728 39,054 37,744 39,351 37,295 444,780 Sulfur Dioxide, lbs. 31,400 37,400 29,800 30,544 29,936 30,962 25,891 31,515 36,828 34,100 33,200 28,700 380,276 Aluminum Sulfate, gals. 0 0 0 0 0 0 0 0 0 0 0 0 0 Caustic Soda, lbs. 147 0 0 1,524 6,657 5,531 2,605 9,090 7,540 3,412 12,998 6,751 56,255 Aqueous Ammonia, gals. 6,999 13,602 6,920 9,420 5,873 4,787 565 344 6,483 9,283 10,170 9,627 84,073 Polymer, lbs 308,879 406,236 329,733 299,228 296,580 342,592 518,562 501,526 486,627 451,098 353,923 134,201 4,429,185
Comparison Year 2011-2012 - Chemical Consumption Summary – Tertiary Facility
Chemical Used JUL AUG SEP OCT NOV DEC JAN FEB MAR APR MAY JUN Fiscal YTD
Chlorine Gas, lbs. 43,725 42,809 38,034 41,761 30,489 37,385 41,828 31,871 32,878 38,577 36,789 32,589 410,701 Sulfur Dioxide, lbs. 35,933 38,301 34,400 37,500 26,300 19,711 25,200 28,320 32,100 40,600 37,400 28,350 349,715 Aluminum Sulfate, gals. 6,107 0 0 0 0 0 0 21,318 22,788 0 0 0 50,213 Caustic Soda, lbs. 0 0 0 0 27,328 6,114 12,861 14,461 6,771 6,279 53 377 74,244 Aqueous Ammonia, gals. 9,861 11,849 8,868 12,895 5,918 88 5,838 1,547 7,728 10,607 69,480 51,103 186,915 Polymer, lbs 268,560 385,316 299,221 92,607 200,038 276,842 353,145 339,695 332,989 594,311 557,016 341,666 3,742,185
City of Stockton, Municipal Utilities Department – June 2013

P a g e | 62
Table 3.5 – Utility Consumption Current Month Fiscal YTD Electricity Main Facility Total Usage, KW 1,560,846 44,905,911 Tertiary Facility Total Usage, KW 420,600 6,757,223
Total Facility Usage, KW 1,981,446 51,663,134 PG&E, Purchased, KW 1,448,150 39,435,348 Co-Generation Production, KW 533,296 12,227,786
Total Facility Prod/Purch, KW 1,981,446 51,663,134 Natural Gas Co-Generation Fuel, Therms 62,750 974,960 Building HVAC Fuel, Therms 1.12 130.04 Methane Gas, Digester Production, CuFt 16,211,600 223,826,699 Methane Gas, Digester Production, Therms 96,751 1,417,642 Water Wastewater Facilities, total usage, gallons 1,209,300 28,939,288
Table 3.6 – Maintenance Work Order Summary
Maintenance Work Orders Corrective Maintenance
Corrective Maintenance % Completed
Corrective Maintenance % Backlog
Preventive Maintenance % Backlog
Main Treatment Facility Main Plant Mechanical 75 40 60 45.7 Main Plant Electrical 17 47.1 52.9 2.7 Main Plant Engines N/A N/A N/A N/A
Tertiary Treatment Facility Tertiary Plant Mechanical 17 58.8 41.2 43.9 Tertiary Plant Electrical 21 90.5 9.5 42.4
City of Stockton, Municipal Utilities Department – June 2013

R e f e r e n c e | P a g e 63
Wastewater Collection Systems Table 4.1 – Summary of SSOs and Private Sewage Spills
Total Public SSO Events 6 Total Gallons 280 Total Private Spills 3 Total Gallons 91 Total Public & Private Spill Events 9 Total Gallons 371
NONE
NONE
4-Jun 8483 Lorraine Ave 22 22 0 Debris Gutter Lateral 4"
5-Jun 201 Glacier Ct. 78 78 0 Roots Gutter Lateral 4"
10-Jun 2316 Chapelhill Cr. 60 60 0 Debris Gutter Lateral 4"
11-Jun 3749 Estate Dr. 101 101 0 Debris Gutter Lateral 4"
18-Jun 26 South B St. 13 13 0 Debris Gutter Lateral 4"
28-Jun 124 Glacier Ct. 6 6 0 Roots Gutter Lateral 4"
13-Jun 411 Burkett Ave 1 1 0 Debris Gutter Lateral 4"
17-Jun 627 Sutterland Dr 80 80 0 Debris Gutter Lateral 4"
17-Jun 1025 Robinhood Dr 10 10 0 Grease Maintenance hole Lateral 4"
SSO Summary (Category 2, otherwise contained)
Private Spills
Spill Gallons
SSO Summary (Category 1, greater than 1,000 gallons or discharge to waters of the State)
Gal to Surf
WaterCause
Receiving Water or
Containment
Pipe Size
Gallons Recovered Line Type
SSO Summary (Category 2, reached a storm drain, storm manhole, storm catch basin or storm pump station wet well)
Date Address
City of Stockton, Municipal Utilities Department – June 2013

P a g e | 64
Figure 4.A – Public Sanitary Sewer Overflow Events
Public Sanitary Sewer Overflow Events - Comparison Year 2011-2012
9 8 10 9
6
10 13 13 14
12
5 6
0
5
10
15
20
25
30
July Aug Sep Oct Nov Dec Jan Feb Mar Apr May Jun
2012 2013
SSO Events per Month
15 12
19 18
14
25 27
19 18
12 9 8
0
5
10
15
20
25
30
July Aug Sep Oct Nov Dec Jan Feb Mar Apr May Jun
2011 2012
SSO Events per Month
City of Stockton, Municipal Utilities Department – June 2013

R e f e r e n c e | P a g e 65
Figure 4.B – Public SSOs Greater than 1,000 gallons – Events
Public SSOs Greater than 1,000 gallons Events – Comparison Year 2011-2012
1
0
1
0 0 0 0 0 0 0 0 0
0
1
2
3
4
5
6
July Aug Sep Oct Nov Dec Jan Feb Mar Apr May Jun
2012 2013
SSOs Greater than 1,000 Gallons per Month
City of Stockton, Municipal Utilities Department – June 2013

P a g e | 66
Figure 4.C – Public Sanitary Sewer Overflows Discharged to Receiving Water
Public Sanitary Sewer Overflows Discharged to Receiving Water – Comparison Year 2011-2012
0 0
1
0 0 0 0 0 0 0 0 0
0
1
2
3
4
5
6
July Aug Sep Oct Nov Dec Jan Feb Mar Apr May Jun
2012 2013
SSOs Discharged to Receiving Waters
2
0 0 0 0 0 0 0 0 0 0
1
0
1
2
3
4
5
6
July Aug Sep Oct Nov Dec Jan Feb Mar Apr May Jun
2011 2012
SSOs Discharged to Receiving Waters
City of Stockton, Municipal Utilities Department – June 2013

R e f e r e n c e | P a g e 67
Table 4.2 – Sewer Maintenance Activity Summary
(Chart totals do not include work done by contractors.)
JUL AUG SEP OCT NOV DEC JAN FEB MAR APR MAY JUN FISCAL YTD
Repairs – Sewer # of Lateral Repairs 10 24 23 7 14 21 24 11 15 20 17 22 208 Lateral Repairs, Linear Feet 55 93 171 46 71 149 105 36 101 150 98 75 1,150 # of Main Line Repairs 5 4 2 2 2 2 2 2 1 5 4 6 37 Main Line Repairs, Linear Feet 17 17 0 11 6 25 8 30 6 19 23 26 188 Maintenance Hole Repair/New 4 13 5 4 3 7 10 23 16 4 11 12 112 Sewer Taps 1 0 1 0 0 0 0 0 0 0 0 0 2
Maintenance – Sewer # of Main Line Segments Jetted 628 707 516 625 445 231 824 1,090 725 1,116 1,219 952 9,078 Main Line Linear Feet Jetted 173,690 209,485 147,668 179,658 135,726 45,662 257,991 322,954 211,162 318,338 319,976 243208 2,565,518 # of Main Line Segments Rodded 41 67 46 47 16 16 51 28 25 35 20 11 373 Main Line Linear Feet Rodded 13,466 20,838 15,692 13,797 4,888 5,242 11,707 9,288 8,093 11,870 22,074 3,118 140,073
Laterals Foamed 148 132 95 93 47 52 45 142 123 143 78 118 1,216 Laterals Foamed, Linear Feet 7,400 6,600 4,750 4,650 2,350 2,600 2,250 7,100 6,150 7,150 2,900 5,900 59,800
City of Stockton, Municipal Utilities Department – June 2013

P a g e | 68
Comparison Year 2011-2012 – Sewer Maintenance Activity Summary
(Chart totals do not include work done by contractors.)
JUL AUG SEP OCT NOV DEC JAN FEB MAR APR MAY JUN FISCAL YTD
Repairs – Sewer
# of Lateral Repairs 15 15 21 10 11 21 19 26 25 19 30 38 250
Lateral Repairs, Linear Feet 141 94 181 71 102 159 178 182 375 160 186 56 1,885
# of Main Line Repairs 2 1 3 3 3 5 7 6 25 4 7 9 75
Main Line Repairs, Linear Feet 8 0 11 2 31 21 30 40 199 26 50 52 469
Maintenance Hole Repair/New 3 5 3 2 5 1 1 4 33 12 18 7 94
Sewer Taps 1 1 0 0 0 0 1 0 0 1 0 2 5
Maintenance – Sewer
# of Main Line Segments Jetted 603 610 719 609 544 479 690 605 646 952 724 582 7,763
Main Line Linear Feet Jetted 185,217 185,165 170,116 187,455 156,596 137,476 189,133 173,132 171,748 165,854 200,225 160,966 2,083,083
# of Main Line Segments Rodded 93 138 92 49 69 106 33 22 67 50 42 79 840
Main Line Linear Feet Rodded 22,719 39,444 29,784 13,381 21,644 31,371 10,173 5,884 24,906 13,003 13,411 24,083 254,803 Laterals Foamed 113 139 68 64 51 46 25 50 76 172 39 156 999
Laterals Foamed, Linear Feet 5,650 6,800 3,300 3,150 2,300 2,300 750 5,000 3,800 8,600 1950 7800 51,400
City of Stockton, Municipal Utilities Department – June 2013

R e f e r e n c e | P a g e 69
Table 4.3 – Customer Service and CCTV Activity Summary
CUSTOMER SERVICE JUL AUG SEP OCT NOV DEC JAN FEB MAR APR MAY JUN FISCAL YTD
Service Calls 357 389 334 466 500 438 575 471 418 469 451 421 5,289 USA Requests 1,488 1,132 1087 1057 671 805 925 867 876 1,105 1,106 1,051 12,170 TV Sanitary Line Segment Inspections 88 92 85 142 111 69 149 455 420 124 177 193 2,105
TV Sanitary Line Segment Inspections, Linear Feet 21,839 20,773 22,533 37,902 31,137 20,299 37,369 126,471 115,937 33,093 43,738 49,075 560,166 TV Sanitary Lateral Inspections 41 12 8 19 24 33 43 37 100 36 24 52 429
TV Sanitary Lateral Inspections, Linear Feet 1,629 341 228 579 559 1,122 1,072 1,201 2,396 1,097 595 1,319 12,138 (Chart totals do not include work done by contractors.)
Comparison Year 2011-2012 – Customer Service and CCTV Activity Summary
CUSTOMER SERVICE JUL AUG SEP OCT NOV DEC JAN FEB MAR APR MAY JUN FISCAL YTD
Service Calls 845 859 866 992 901 865 554 498 473 434 302 225 7,814 USA Requests 955 1,221 945 916 1,029 736 1183 887 972 847 1083 1056 11,830 TV Sanitary Line Segment Inspections 15 99 82 127 149 132 230 318 122 202 192 144 1,812
TV Sanitary Line Segment Inspections, Linear Feet 3,695 26,024 19,200 30,585 34,719.1 31,697 61,826 83,202 37,032 47,025 46453 29,932 451,390 TV Sanitary Lateral Inspections 23 32 36 29 14 38 30 23 27 38 15 6 311
TV Sanitary Lateral Inspections, Linear Feet 1,055 1,327 810 1,212 407 1,331 1,204 617 787 1,194 535 168 10,647 (Chart totals do not include work done by contractors.)
City of Stockton, Municipal Utilities Department – June 2013

P a g e | 70
Table 4.4 – Spoils Activity Summary
SPOILS ACTIVITY SUMMARY JUL AUG SEP OCT NOV DEC JAN FEB MAR APR MAY JUN FISCAL YTD
Operations / Grit Hauling - # of Loads 0 0 4 0 0 0 0 0 0 0 0 0 4 Operations / Grit Hauling - Tonnage 0 0 59.54 0 0 0 0 0 0 0 0 0 59.54
Sanitary Lines / Pump Stations - # of Loads 0 0 9 0 0 0 0 0 0 8 0 0 17 Sanitary Lines / Pump Stations - Tonnage 0 0 116 0 0 0 0 0 0 112.76 0 0 228.76
Construction Hauling – # of Loads 4 6 15 5 3 14 11 4 0 13 8 0 83 Construction Hauling – Tonnage 103.36 84.38 195 69.11 35 215.50 132.57 58.82 0 165.53 116.57 0 1,175.84
Total Loads 4 6 31 5 3 14 11 4 0 21 8 0 107 Total Tonnage 103.36 84.38 392.54 69.11 35 215.50 132.57 58.82 0 278.29 116.57 0 1,486.14
Comparison Year 2011-2012 – Spoils Activity Summary
SPOILS ACTIVITY SUMMARY JUL AUG SEP OCT NOV DEC JAN FEB MAR APR MAY JUN FISCAL YTD
Operations / Grit Hauling - # of Loads 1 0 3 0 7 0 0 0 4 0 0 0 15.00 Operations / Grit Hauling - Tonnage 10.80 0 9.52 0 75.01 0 0 0 49.64 0 0 0 144.97
Construction Hauling – # of Loads 8 6 16 3 9 11 3 10 9 7 5 11 98.00 Construction Hauling – Tonnage 114.67 73.64 201.95 40.4 113.53 146.88 40.8 97.81 99.99 81.65 54.42 152.14 1,217.88
Total Loads 19 9 9 3 20 11 3 10 15 7 0 11 117 Total Tonnage 250.08 106.52 211.47 40.4 232.86 146.88 40.8 97.81 174.58 81.65 54.42 152.14 1,589.61
City of Stockton, Municipal Utilities Department – June 2013

R e f e r e n c e | P a g e 71
Table 4.5 – Graffiti Removal Name / Location of Pump Stations Painted
Smith Canal Sanitary Cumberland Sanitary Plymouth Storm
Table 4.6 – Maintenance Work Order Summary
Maintenance Work Orders Corrective Maintenance
Corrective Maintenance % Completed
Corrective Maintenance
%Backlog
Preventive Maintenance % Backlog
Sanitary Pumping Facilities Pump Station Mechanical 125 75.0 25.0 29.3 Pump Station Electrical 7 85.7 14.3 87.5
City of Stockton, Municipal Utilities Department – June 2013

R e f e r e n c e | P a g e 72
THIS PAGE INTENTIONALLY LEFT BLANK
City of Stockton, Municipal Utilities Department – June 2013

R e f e r e n c e | P a g e 73
Environmental Control
City of Stockton, Municipal Utilities Department – June 2013

R e f e r e n c e | P a g e 74
THIS PAGE INTENTIONALLY LEFT BLANK
City of Stockton, Municipal Utilities Department – June 2013

R e f e r e n c e | P a g e 75
Table 5.1 – Operational Activity Summary
* Discharge Permits (New) – NONE ** Discharge Permits (Renewal) – 1 Wastewater Discharge Permits **** Hazardous Materials Spills - NONE *****Stormwater Enforcement Actions - NONE
*** Pretreatment Enforcement Actions 3/2013 – NOV/CO, Second missed monthly oil and grease sample in a 6 month period. 5/22/13 – NOV/CO, Exceeded daily TDS limit by 300 mg/L. Second TDS violation in a 6 month period.
Activity/Indicator Jul Aug Sep Oct Nov Dec Jan Feb Mar Apr May JunPretreatment Program
Industrial Inspections 38 42 48 43 36 16 32 23 43 35 39 41Industrial Sampling 34 37 42 37 36 14 29 20 34 29 34 37Discharge Permits (new) * 1 1 0 1 2 0 2 0 1 0 2 0Discharge Permits (renewal) ** 1 0 0 1 0 1 2 2 0 2 3 1Industrial Flow, MG 146.53 179.71 168.16 132.75 82.96 92.86 86.27 82.71 86.82 81.21 78.20Industrial BOD, lbs. 970,900 1,392,400 883,410 609,270 495,410 488,520 549,560 401,310 559,620 449,750 443,220 Industrial TSS, lbs. 536,550 872,600 389,840 290,800 90,280 95,280 105,950 88,920 128,220 93,340 83,010 Industrial Revenue 527,979$ 569,882$ 517,850$ 486,222$ 450,330$ 477,066$ 447,370$ 431,782$ 442,071$ 434,769$ 429,394$ Pretreatment Enforcement Actions*** 2 3 7 3 5 3 2 5 8 7 5 2
Waste Hauler ProgramTrucked-in Waste Loads 233 225 168 204 182 247 216 204 222 296 242Trucked-in Waste Gallons 707,131 690,871 514,576 610,475 542,490 718,320 641,503 624,875 654,445 874,378 701,064 Trucked-in Waste Revenue 25,068$ 24,285$ 18,121$ 21,864$ 19,485$ 26,269$ 23,102$ 22,004$ 23,696$ 31,613$ 25,711$
Stormwater ProgramHazardous Materials Spills **** 1 1 0 0 0 2 3 0 1 1 0 0Stormwater Complaints 1 1 2 1 2 3 4 1 2 3 3 0Stormwater Enforcement Actions***** 1 0 0 1 1 2 4 0 0 1 1 0
FOG ProgramFOG Initial Inspections 114 76 73 100 80 86 111 142 25 16 21 10FOG Enforcement Actions 15 29 34 44 48 41 52 28 44 54 39 25FOG Follow-up Inspections 11 22 21 40 31 32 45 17 86 80 56 50
City of Stockton, Municipal Utilities Department – June 2013

R e f e r e n c e | P a g e 76
Comparison Year 2010-2011 –Operational Activities Summary
City of Stockton, Municipal Utilities Department – June 2013
Activity/Indicator Jul Aug Sep Oct Nov Dec Jan Feb Mar Apr May JunPretreatment Program
Industrial Inspections 38 57 54 47 36 26 45 37 41 35 41 38Industrial Sampling 34 49 44 41 35 25 39 31 36 31 36 34Discharge Permits (new) 1 0 1 0 0 0 0 1 1 0 0 0Discharge Permits (renewal) 1 1 0 7 0 0 3 4 0 0 2 3Industrial Flow, MG 115.11 188.61 181.70 145.16 92.69 86.99 88.30 92.85 99.92 85.02 90.62 92.70Industrial BOD, lbs. 835,690 136,610 1,177,650 764,710 662,070 728,620 674,770 586,530 696,920 514,450 455,170 447,960 Industrial TSS, lbs. 246,150 557,430 582,730 351,640 147,180 140,400 109,900 103,250 148,770 118,230 87,540 99,510 Industrial Revenue 439,908$ 497,417$ 489,160$ 453,218$ 419,739$ 419,798$ 403,063$ 410,128$ 417,913$ 402,287$ 406,448$ 433,722$ Pretreatment Enforcement Actions* 2 9 11 8 5 6 6 4 2 10 3 2
Waste Hauler ProgramTrucked-in Waste Loads 173 225 183 169 168 184 214 182 206 209 322 284Trucked-in Waste Gallons 522,106 671,625 560,559 520,333 507,269 579,579 652,330 544,347 612,897 629,740 934,671 846,222 Trucked-in Waste Revenue 18,584$ 24,098$ 19,739$ 18,255$ 18,049$ 20,002$ 23,052$ 19,503$ 22,043$ 22,441$ 34,229$ 30,402$
Stormwater ProgramHazardous Materials Spills 1 1 1 1 1 0 1 1 2 3 2 0Stormwater Complaints 1 3 1 2 4 2 3 5 1 3 4 0Stormwater Enforcement Actions** 1 1 0 1 2 1 2 5 0 0 0 0
FOG ProgramFOG Initial Inspections 127 65 54 50 61 28 48 63 21 55 113 126FOG Enforcement Actions 15 32 26 27 27 21 29 32 36 24 35 21FOG Follow-up Inspections 13 21 41 25 16 19 17 19 64 39 40 22

R e f e r e n c e | P a g e 77
Laboratory Table 6.1 – Acute Toxicity Testing Summary
Date of EFF-001 Sample (composite) Percent survival Lab
06/02/13 100 COS
06/09/13 100 COS
06/17/13 100 PERL
06/23/13 100 COS
Chronic Toxicity
Table 6.2 – Algae (Selenastrum capricornutum) Sample Date NOEC TUC
(100/NOEC) IC50 TUC
(100/IC50) Comments
7/16/121 50% 2.0 >100% <1 Lab water control
7/29/12# 100% 1.0 >100% <1 Lab water control
8/12/12## 100% 1.0 >100% <1 Lab water control
8/26/12### 100% 1.0 >100% <1 Lab water control
9/9/12 #### 100% 1.0 >100% <1 Lab water control
10-15-12 100% 1.0 >100% <1 Lab water control
1-15-13 100% 1.0 >100% <1 Lab water control
4-22-13 100% 1.0 >100% <1 Lab water control 1 Toxicity initiates accelerated monitoring # Accelerated Test #1 of 4 ## Accelerated Test #2 of 4 ### Accelerated Test #3 of 4 #### Accelerated Test #4 of 4 The next quarterly monitoring is due in July 2013.
Table 6.3 – Ceriodaphnia (C. dubia)
Sample Date
Survival Reproduction
NOEC TUC (100/
NOEC) EC50 TUC (100/
IC50) NOEC TUC (100/
NOEL) IC50 TUC (100/
IC50)
7/16/12 100% 1.0 >100% <1 100% 1 >100% <1 10/15/12 100% 1.0 >100% <1 100% 1 >100% <1 1/15/13 100% 1.0 >100% <1 100% 1 >100% <1 4/22/12 100% 1.0 >100% <1 100% 1 >100% <1
Since no chronic toxicity was found, routine quarterly monitoring continues in July 2013.
City of Stockton, Municipal Utilities Department – June 2013

R e f e r e n c e | P a g e 78
Table 6.4 – Fathead Minnow (Pimephales Promelas)
Sample Date
Survival Growth
NOEC TUC (100/
NOEC) EC50
TUC (100/ IC50)
NOEC TUC (100/
NOEL) IC50
TUC (100/ IC50)
7/16/12 100% 1.0 >100% <1 100% 1.0 >100% <1 10/15/12 100% 1.0 >100% <1 100% 1.0 >100% <1 1/15/13 100% 1.0 >100% <1 100% 1.0 >100% <1 4/22/12 100% 1.0 >100% <1 100% 1.0 >100% <1
No chronic toxicity was observed in the most recent test with fathead minnows. Testing continues quarterly and is next scheduled for July 2013.
Table 6.5 – Effluent Cyanide Summary Date Cyanide, µg/L
06/05/2013 DNQ 1.5 ND = Not detected at the MDL, DNQ = detected not quantified, result between MDL and RL, the MDL is 0.90 and the RL is 3 µg/L
Table 6.6 – Effluent Ammonia-N Summary EFF-001
(Final Effluent) Regulatory
NH3-N, mg/L Process Control
NH3-N, mg/L Monthly Minimum <0.5 0.40
Monthly Maximum 0.6 0.85
Monthly Average <0.5 0.64
Number of samples 9 30
City of Stockton, Municipal Utilities Department – June 2013

R e f e r e n c e | P a g e 79
Figure 6.A – Laboratory Samples and Analyses
Laboratory Samples and Analyses – Comparison Year 2011-2012
824 876 742 884 772 678 739 680 754 728 800 850
3,227 3,734
3351
4592
3688 3478 3680 3566 3750 4026 3997 3895
0500
1,0001,5002,0002,5003,0003,5004,0004,5005,000
Jul Aug Sep Oct Nov Dec Jan Feb Mar Apr May Jun
2012 2013
Num
ber o
f sam
ples
or a
naly
ses Laboratory Samples and Analyses
total samples total analyses
645 692 670 676 758 599 646 888 747 618 900 822
3718 3906 3448
3954 3346
2946 3332
3638 3708 3298
3744 3089
0500
1,0001,5002,0002,5003,0003,5004,0004,5005,000
Jul Aug Sep Oct Nov Dec Jan Feb Mar Apr May Jun
2011 2012
Num
ber o
f sam
ples
or a
naly
ses
Laboratory Samples and Analyses
total samples total analyses
City of Stockton, Municipal Utilities Department – June 2013

R e f e r e n c e | P a g e 80
Figure 6.B – Contract Laboratory Samples and Analyses
Contract Laboratory Samples and Analyses – Comparison Year 2011-2012
175 243 141
259 157 111
205 152 100 223 170 144
685 821
244
985
301 254 365 310
465
915
385 470
0
500
1000
1500
Jul Aug Sep Oct Nov Dec Jan Feb Mar Apr May Jun
2012 2013
Num
ber o
f sam
ples
or a
naly
ses Contract Lab Samples and Analyses
samples analyses
303 362 280 274 257 169 271
119 107 176 203 181
845
1149
749 764 915
557 528
206
604
969 731
307
0
500
1000
1500
Jul Aug Sep Oct Nov Dec Jan Feb Mar Apr May Jun
2011 2012Num
ber o
f sam
ples
or a
naly
ses
Contract Lab Samples and Analyses
samples analyses
City of Stockton, Municipal Utilities Department – June 2013

R e f e r e n c e | P a g e 81
Figure 6.C – Laboratory Sample Types
Laboratory Sample Types Comparison Year 2011-2012
327
309 283 340 300
224 203 207 226 227
307 294
194 262
163 202 197
163 210 204
243 226 227 267 303
302
290
333
275 291 326
268 284 275 266 289
050
100150200250300350400
Jul Aug Sep Oct Nov Dec Jan Feb Mar Apr May Jun
2012 2013
Num
ber o
f sam
ples
Laboratory Samples - Types
NPDES regulatory samples Process Control Samples
Drinking Water regulatory samples
308 303 290313 329
211 233 218195
233
330287
198 214 215 202 218188 199
296 260
203 218180
127175 165 161
211172
214
373
198181
221
188
050
100150200250300350400
Jul Aug Sep Oct Nov Dec Jan Feb Mar Apr May Jun
2011 2012
Num
ber o
f sam
ples
Laboratory Samples - Types
NPDES regulatory samples Process Control Samples
Drinking Water regulatory samples
City of Stockton, Municipal Utilities Department – June 2013

R e f e r e n c e | P a g e 82
THIS PAGE INTENTIONALLY LEFT BLANK
City of Stockton, Municipal Utilities Department – June 2013

R e f e r e n c e | P a g e 83
Engineering Figure 7.A – Development Reviews Received and Completed
City of Stockton, Municipal Utilities Department – June 2013

R e f e r e n c e | P a g e 84
Figure 7.B – Development Reviews Received and Completed Year-to-Date
Development Reviews Received and Completed – Comparison Year 2011-2012
Development Reviews Received and Completed Fiscal Year-to-Date 2011 - 2012
9
16 16 1512
810 9 9
17
12
20
9
1713
21
16
710
8 810
17 18
0
5
10
15
20
25
Jul'11
Aug'11
Sep'11Oct'1
1Nov'1
1
Dec'11
Jan'12
Feb'12
Mar'12
Apr'12
May'12
Jun'12
Num
ber o
f Sub
mitt
als
Submittals Received Submittals Completed
City of Stockton, Municipal Utilities Department – June 2013

R e f e r e n c e | P a g e 85
Table 7.1 – Nonpotable, Stormwater, Water, and Wastewater Projects
LEGEND
Project Type Phase Of Project
Non-potable Purple Beginning Planning
Stormwater Magenta Planning Completed
Water Blue Beginning Design
Wastewater Green Ending Design
Beginning Construction
Construction Continuing
Project Completed
Projects Project Type Cost Project Phase
2011 Sanitary Sewer Rehabilitation Project (M11002)
$75,000
Arch Road Sanitary Sewer Trunk Line (M09106)
$2,500,000
Automated Meter Reading (M11008)
$120,000
Capital Improvement and Energy Management Plan EIR (M12019)
$400,000
CAT Engine Replacement – Phase I & II (M08001)
$430,000
Feather River Water Main Crossing at 14-Mile Slough Project (M07056)
$322,000
Rehabilitate Thornton Road Sanitary Pump Station (M13009)
$209,000
RWCF Bulk Sodium Hypochlorite and Sodium Bisulfite Project (M12007)
$150,000
RWCF Headworks Rehabilitation Project (M13007)
TBD
Smith Canal Sanitary Sewer Pump Station – Wet Well (M09093)
$2,600,000
City of Stockton, Municipal Utilities Department – June 2013

R e f e r e n c e | P a g e 86
THIS PAGE INTENTIONALLY LEFT BLANK
City of Stockton, Municipal Utilities Department – June 2013

R e f e r e n c e | P a g e 87
Stormwater
City of Stockton, Municipal Utilities Department – June 2013

R e f e r e n c e | P a g e 88
THIS PAGE INTENTIONALLY LEFT BLANK
City of Stockton, Municipal Utilities Department – June 2013

R e f e r e n c e | P a g e 89
Table 8.1 – Stormwater Maintenance Activity Summary
JUL AUG SEP OCT NOV DEC JAN FEB MAR APR MAY JUN FISCAL YTD
Repairs – Storm # of Catch Basin Lateral Repairs/New 1 0 0 0 0 0 0 0 1 1 0 0 3
Catch Basin Lateral Repairs/New, Linear Feet 6 0 0 0 0 0 0 0 2 2 0 0 10 # of Storm Main Line Repairs 0 0 0 0 0 0 0 0 0 0 0 0 0
Storm Main Line Repairs, Linear Feet 0 0 0 0 0 0 0 0 0 0 0 0 0 # of Catch Basin Storm Repairs/New 0 2 0 0 0 0 0 2 0 1 0 0 5 # of Storm Maintenance-hole Repairs/New 0 0 0 2 0 0 0 0 0 0 0 0 2 Storm – Maintenance # of Catch Basin Laterals Jetted 3 0 5 2 13 16 0 2 2 13 5 4 65
Catch Basin Laterals Jetted, Linear Feet 125 0 200 25 525 480 0 100 118 915 250 230 2,968 # of Catch Basin Laterals Rodded 0 0 0 0 0 0 0 0 1 0 0 0 1
Catch Basin Laterals Rodded, Linear Feet 0 0 0 0 0 0 0 0 50 0 0 0 50 # of Storm Main Lines Jetted 0 0 8 1 2 1 2 0 0 4 1 0 19
Storm Main Lines Jetted, Linear Feet 0 0 915 241 470 306 555 0 0 520 350 0 3,357 # of Storm Main Lines Rodded 0 0 0 0 0 0 0 0 0 0 0 1 1
Storm Main Lines Rodded, Linear Feet 0 0 0 0 0 0 0 0 0 0 0 350 350 # of Storm Catch Basins Cleaned 5 20 2 5 131 444 2 4 6 23 117 52 811 # of Storm Maintenance-holes Cleaned 0 1 1 1 3 1 0 3 0 3 2 0 15 # of Storm Pump Stations Cleaned 1 6 9 11 1 0 0 0 2 0 0 0 30 # of tons of Debris Removed from Storm Stations 92.10 32.80 10.7 16.85 4.30 0 0 0 0 0 0 157 # of Storm Catch Basins Inspected 0 2 1 0 0 0 0 0 0 0 0 0 3 # of Storm Catch Basins Stenciled 0 9 0 0 0 0 0 0 0 0 0 0 9 # of Storm Event Calls 0 0 0 0 240 597 15 15 11 16 0 0 894
Storm Event Line Clean-up, Linear Feet 0 0 0 0 12 177 27 39 8 48 0 0 354 TV Storm Line Segment Inspections 0 0 3 0 0 0 0 0 0 0 0 0 3
TV Storm Line Segment Inspections, Linear Feet 0 0 704 0 0 0 0 0 0 0 0 0 704 Spoils Storm Pump Stations / CBs - # of Loads 0 0 3 0 0 0 0 0 0 0 0 0 3.00
Spoils Storm Pump Stations / CBs - Tonnage 0 0 22 0 0 0 0 0 0 0 0 0 22.00 (Chart totals do not include work done by contractors.)
City of Stockton, Municipal Utilities Department – June 2013

R e f e r e n c e | P a g e 90
Comparison Year 2011-2012 – Stormwater Maintenance Activity Summary
JUL AUG SEP OCT NOV DEC JAN FEB MAR APR MAY JUN FISCAL YTD
Repairs – Storm # of Catch Basin Lateral Repairs/New 0 0 0 0 0 0 0 0 0 0 0 0 0
Catch Basin Lateral Repairs/New, Linear Feet 0 0 0 0 0 0 0 0 0 0 0 0 0 # of Storm Main Line Repairs 0 0 0 1 0 0 0 2 1 0 0 0 4
Storm Main Line Repairs, Linear Feet 0 0 0 3 0 0 0 4 0 0 0 0 7 # of Catch Basin Storm Repairs/New 1 1 1 1 1 0 0 0 0 1 0 0 6 # of Storm Maintenance-hole Repairs/New 1 1 0 0 0 0 0 0 1 0 0 0 3 Storm – Maintenance # of Catch Basin Laterals Jetted 1 17 3 17 0 2 8 2 17 14 0 15 96
Catch Basin Laterals Jetted, Linear Feet 26 0 0 1,890 0 75 620 100 845 350 0 625 4,531 # of Catch Basin Laterals Rodded 0 4 0 0 2 0 1 0 1 4 0 0 12
Catch Basin Laterals Rodded, Linear Feet 0 140 0 0 40 0 38 0 50 102 0 0 370 # of Storm Main Lines Jetted 0 0 0 6 1 0 2 0 9 3 0 1 22
Storm Main Lines Jetted, Linear Feet 0 0 0 1,349 386 0 350 0 2,678 735 0 478 5,976 # of Storm Main Lines Rodded 2 0 0 0 2 0 1 1 2 1 0 0 9
Storm Main Lines Rodded, Linear Feet 261 0 0 0 425 0 35 35 730 380 0 0 1,866 # of Storm Catch Basins Cleaned 41 0 61 68 5 0 246 0 14 22 81 17 555 # of Storm Maintenance-holes Cleaned 0 0 0 0 0 0 0 0 4 0 0 3 7 # of Storm Pump Stations Cleaned 6 10 9 6 4 0 1 0 0 0 1 2 39 # of tons of Debris Removed from Storm Stations 44.80 102.75 29.2 30.5 9.65 0 2.45 0 0 0 2.45 0.3 222 # of Storm Catch Basins Inspected 2,562 598 7 14 0 0 0 0 0 232 2,835 393 6,641 # of Storm Catch Basins Stenciled 884 125 0 0 0 0 0 0 0 120 312 126 1,567 # of Storm Event Calls 0 0 0 32 0 0 186 54 27 228 0 0 527
Storm Event Line Clean-up, Linear Feet 0 0 0 100 0 0 72 79 136 383 0 0 770 TV Storm Line Segment Inspections 4 0 0 0 0 0 0 1 0 0 2 0 7
TV Storm Line Segment Inspections, Linear Feet 104 0 0 0 0 0 0 114 0 0 133 0 351 Storm Pump Stations / CBs - # of Loads 10 3 0 0 4 0 0 0 2 0 0 0 19
Storm Pump Stations / CBs - Tonnage 124.61 32.88 0 0 44.32 0 0 0 24.95 0 0 0 226.76 (Chart totals do not include work done by contractors.)
City of Stockton, Municipal Utilities Department – June 2013

R e f e r e n c e | P a g e 91
Table 8.2 –Inspections
Inspections – Comparison Year 2011-2012
Total Sites Jul Aug Sep Oct Nov Dec Jan Feb Mar Apr May Jun Total Sites 20 18 17 13 17 16 16 18 19 20 19 16 Inspections 20 18 17 13 17 16 16 18 19 20 19 16 Verbal Warnings 5 3 2 2 7 4 5 4 3 8 5 11 Correction Orders 4 1 2 1 2 2 12 4 3 2 4 1 Notice to Clean 2 1 1 1 1 2 6 3 4 2 1 2 Notice of Violation 0 0 1 0 3 2 12 0 3 3 0 1 Admin. Citations 0 0 1 0 3 2 12 0 3 3 0 0 Referred to RWQCB 0 0 0 0 0 0 12 0 0 0 0 0
Total Sites Jul Aug Sep Oct Nov Dec Jan Feb Mar Apr May Jun Total Sites 20 22 23 21 20 19 17 17 16 14 16 18 Inspections 20 22 23 21 20 19 17 17 16 14 16 18 Verbal Warnings 5 4 3 0 0 0 0 1 2 4 3 2 Correction Orders 0 4 5 0 1 0 0 0 2 0 1 0 Notice to Clean 0 0 3 1 1 0 0 0 2 0 1 0 Notice of Violation 0 0 0 0 0 0 0 0 2 0 0 0 Admin. Citations 0 0 0 0 0 0 0 0 2 0 1 0 Referred to RWQCB 0 0 0 0 0 0 1 0 2 0 0 0
City of Stockton, Municipal Utilities Department – June 2013

R e f e r e n c e | P a g e 92
Table 8.3 –Outreach
Description Jul Aug Sep Oct Nov Dec Jan Feb Mar Apr May Jun FYTD
Utility Bill Insert 47,594 47,613 47,669 47,621 47,589 47,501 52,109 52,049 52,576 52,875 52,741 52,808 600,745 Literature Distribution 60 20 80 Presentations / Study Guides 0 August Knodt Science Fair 200 200 Primary Years Academy 30 30 Multi-Media – Radio, TV 0 Radio & TV 331,400 331,400 156,000 156,000 974,800 Ports Monster Wall 34,612 50,484 39,789 124,885 Theater Ads 44,744 74,124 118,868 Newspaper/Magazines 11,000 16,500 111,000 138,500 Website/Hotline 5,633 5,000 1,504 1,484 3,468 37,703 52,741 36,865 144,398 Events 0 Stockton Ports 365 135 500 Earth Day 300 300 State of the City 500 500 Senior Awareness Day 3,000 3,000
City of Stockton, Municipal Utilities Department – June 2013

R e f e r e n c e | P a g e 93
Table 8.4 –Stormwater Pumping Facilities Work Order Summary JUL AUG SEP OCT NOV DEC JAN FEB MAR APR MAY JUN
Pump Station Mechanical Corrective Maintenance 10 16 11 27 11 23 12 12 20 29 17 5
% Completed 60 87.5 45.5 77.8 63.6 60.9 75.0 50.0 35.0 17.2 58.8 60.0 % Backlog 40 12.5 54.5 22.2 26.4 43.5 25.0 50.0 65.0 82.8 41.2 40.0
Preventive Maintenance % Backlog 50.7 78.5 43.4 1.9 79.2 61.7 39.0 23.3 64.3 44.3 19.0 32.2
Pump Station Electrical Corrective Maintenance 3 22 10 25 15 26 11 2 10 5 5 3
% Completed 100 100 80 80 60 61.5 81.8 100 40.0 80.0 60.0 33.3 % Backlog 0 0 20 20 40 42.3 18.2 0 60.0 20.0 40.0 66.7
Preventive Maintenance % Backlog NA NA 88.1 NA NA 100 NA NA 98.6 N/A 0.0 97.2
Work Order Summary - Comparison Year 2011-2012
JUL AUG SEP OCT NOV DEC JAN FEB MAR APR MAY JUN Pump Station Mechanical Corrective Maintenance 7 5 10 18 9 22 17 16 15 10 10 14
% Completed 100 60 100 55.6 66.7 9.1 82.4 50 93.3 90 80 14.3 % Backlog 0 40 0 44.4 33.3 90.9 17.6 50 6.7 10 20 85.7
Preventive Maintenance % Backlog 32.4 62.6 89.9 23 61.9 62.1 17.7 66.3 77.8 23.7 47.2 21
Pump Station Electrical Corrective Maintenance 6 6 5 13 4 23 16 5 9 12 11 13
% Completed 50 83.3 100 53.8 100 8.7 100 40 77.8 8.3 54.5 84.6 % Backlog 50 16.7 0 46.2 0 91.3 0 60 22.2 16.7 45.5 15.4
Preventive Maintenance % Backlog NA NA 94.4 63.2 NA 100 100 100 77.8 NA NA 97.2
City of Stockton, Municipal Utilities Department – June 2013

R e f e r e n c e | P a g e 94
THIS PAGE INTENTIONALLY LEFT BLANK
City of Stockton, Municipal Utilities Department – June 2013

R e f e r e n c e | P a g e 95
Administration Table 9.1 – Summary of Unsafe Conditions or Acts
Current Month Calendar Year Number of Unsafe Conditions or Acts Reported * 0 7 Number of Vehicle Incidents: No Fault of Employee 0 0 Number of Vehicle Incidents: Fault of Employee 1 2 * City vactor truck backed into a parked City sweeper at the Main Plant.
Table 9.2 – Summary of Work-Related Injuries and Illnesses Current Month Calendar Year
Number of Cases 0 11 Number of Cases with Lost Time 0 0 Number of Cases with Work Restrictions 0 5
Table 9.3 – Summary of Safety Training Training Hours
Delivered # of Attendees Total Attendee Hours
Tailgate Sessions Illicit Discharge Training 1 33 33 Confined Space 1 37 37 UV Safety 1 9 9 MSDS Sheets Training 1 6 6 Preventable Accidents 1 30 30 Backhoe Safety 1 33 33 Eye Injuries 1 6 6
Special Training Confined Space 5 20 100 HazCom (Right to Know) 1 68 68 Fit Testing 2 116 232 TOTAL 15 358 554
Human Resources Operational Activities
Table 9.4 – Staffing Summary Divisions # of Positions # of Employees Vacancies Change (+/-) Administration 17 13 4 Financial Services 5 5 0 Collections 62 57 5 Engineering 14 13 1 -1 Environmental Control 7 7 0 Laboratory 7 7 0 Wastewater Treatment 48 41 7 Water Treatment/Distribution 30 28 2 -2 Water Resources/Treatment 18 16 2 +1
Total Staff Count 208 187 21 -3 / +1
City of Stockton, Municipal Utilities Department – June 2013

R e f e r e n c e | P a g e 96
Table 9.5 – Overtime Summary
Division Jul Aug Sep Oct Nov Dec Jan Feb Mar Apr May Jun
Administration 31.75 22.25 42.00 21.50 48.25 14.25 51.75 48.75 50.75 43.50 20.50 42.50
Business Services 0 0 0 0 0 0 0 0 0 0 7.25 5.00
Collections 209 454 288 364.25 612.75 570 396.75 506.75 372.50 737.25 730.75 613.50
Engineering 0 9.50 0 6.50 0 21.25 4 8 0 0 11 13
Env. Control 0 3.75 10 0 2 8.25 46.75 36 35.50 10.25 3.50 0
Laboratory 4.50 0.50 0 3.75 28 8 17.50 12.50 22.75 10.25 8 6.75
Maintenance 155.25 464.25 188.50 99.50 275.25 287 269.50 305.75 148.75 170.50 194.75 182.75
WW Treatment 453.25 421 423.75 267 658 549.50 669 504 577.50 392.75 574.75 701.25
Stormwater 0 0 8 0 0.50 8 0 0.50 16.25 0 0 50.50
Water Distribution 160 187 201.25 121.50 239 93.75 107 77.75 170 115.50 187 192.25
Water Resources 0 0 3 0 0 0 0 0 0 1.5 2.50 0
Water Treatment 308.25 253.25 392.75 262.75 343.50 310.75 249.75 248 377.50 278 262.75 362
TOTALS 1,322.00 1,815.50 1,557.25 1,146.75 2,207.25 1,870.75 1,812.00 1,748.00 1,771.50 1,759.50 2,002.75 2,169.50
City of Stockton, Municipal Utilities Department – June 2013

R e f e r e n c e | P a g e 97
Overtime Summary – Comparison Year 2011-2012
Division Jul Aug Sep Oct Nov Dec Jan Feb Mar Apr May Jun
Administration 26.25 12 29.75 11.25 39.75 16.25 22.75 28.50 57 72.50 48.75 32.25
Business Services 2.75 4 0 2 3 2.75 13.25 0 0 0 0 0
Collections 351 279.75 416.50 412 436.25 493 513 497.25 495.25 305.50 326.75 322.50
Engineering 3.50 0 13.50 2.75 0 3 8 14.50 18.50 0 0 0
Env. Control 26.25 21 31.50 10.50 5.25 10.25 5.25 53.75 9.25 18.75 22.50 28.75
Laboratory 28 9 16 5.75 44 35 35.75 2 6 0 0 0
Maintenance 348.25 306.75 281.50 114 98.75 79.50 123 163.25 209.25 328.25 166.25 139.25
WW Treatment 593.25 324.50 470 363 711 557.25 394.50 242.50 391.50 313 493.25 383.25
Stormwater 0 0 5 8 1.50 0 0 0 0 0 6.50 5.50
Water Distribution 90.50 127 159.75 54.75 183.50 199.75 107 91.75 45.25 57 136.25 130.75
Water Resources 0 0 0 0 0 0 0 2 22 1 2 0
Water Treatment 24.50 463 565.50
TOTALS 1,469.75 1,084.00 1,423.50 984.00 1,523.00 1,396.75 1,222.50 1,095.50 1,254.00 1,120.50 1,665.25 1,607.75
City of Stockton, Municipal Utilities Department – June 2013

R e f e r e n c e | P a g e 98
THIS PAGE INTENTIONALLY LEFT BLANK
City of Stockton, Municipal Utilities Department – June 2013

A p p e n d i x | I
Appendix A
Water Title 22 Compliance Water Well Sampling
Summary Well System Operations
City of Stockton, Municipal Utilities Department – June 2013

A p p e n d i x | II
THIS PAGE INTENTIONALLY LEFT BLANK
City of Stockton, Municipal Utilities Department – June 2013

A p p e n d i x | III
Title 22 Compliance - Drinking Water Monitoring Compliance Sampling
Source, Well # or
DS: Distribution System Sample
Date Parameter
DWSP - Finished Water 06-20-13 Annual T22 on Finished water for DWTP DWSP - Delta Source 06-20-13 Annual T22 on Delta Source water for DWTP
DWSP - Delta Source - VOC 06-21-13 Annual T22 on Delta Source water for DWTP Well #10-R 06-25-13 Quarterly TDS/EC Well #19 06-25-13 Quarterly TDS/EC Well #21 06-25-13 Quarterly TDS/EC Well #29 06-25-13 Quarterly TDS/EC Well #30 06-25-13 Quarterly TDS/EC Well #9 06-18-13 Cycle test
Well #SS8 06-18-13 Cycle test Well #7 06-20-13 Cycle test
Well #25 06-25-13 Cycle test Well #1 06-25-13 Cycle test
Exceptions No exceptions this month.
Well Status Changes (none)
Other

CITY OF STOCKTON MONTHLY SYSTEM OPERATION
JUN 2013
30
WELL HRS PROD. RATE RATE WELL 1000FT3 CL2 AQUA-MAG
STA. No. WELL STATION LOCATION OPERATED MG MGD GPM SOUNDING KWH KWH/MG 1000FT3 per MG TOTAL LBS. TOTAL LBS.
NORTH WELL SYSTEM
1 PARKWOODS 2.20 0.00 0.00 0 160 0 0 0
4 VILLA DORADO 0.00 0.00 0.00 0 840 0 0 0
7 GALLOWAY 0.90 0.00 0.00 0 32 0 0
9 DON CARLOS 1.00 0.00 0.00 0 115 0 0
10R VALVERDE PARK 183.40 29.97 1.00 2724 39360 1313 83
11 INGLEWOOD 0.00 0.00 0.00 0 80 0 0 0
15 GLASGOW 0.00 0.00 0.00 0 80 0 0 0
16 ROYAL OAKS 0.00 0.00 0.00 0 2672 0 0.0 0 0 0
18 HICKOCK 0.00 0.00 0.00 0 51 0 0
19 MORADA/WEST LANE 41.30 4.25 0.14 1715 6280 1478 10
20 WEST LANE/MOSHER 0.00 0.00 0.00 0 1664 0 0.0 0 0
21 CORTEZ PARK 59.70 6.28 0.21 1754 9360 1490 15
24 SAFFRON 0.10 0.00 0.00 0 240 0 0
25 PANELLA PARK 0.90 0.00 0.00 0 960 0 13.0 0 0
26 AUTO CENTER 0.00 0.00 0.00 0 649 0 0.0 0 0
27 HORSE PARK 25.70 3.27 0.11 2123 45 4080 1246 6
28 BLOSSOM RANCH 0.00 0.00 0.00 0 62 0 0 0
28 alternate electric meter monitor well #17 56 280 0
29 BAXTER PARK 102.40 16.29 0.54 2651 39 18480 1135 56
30 GRIDER 92.50 11.98 0.40 2158 46 15680 1309 44
31 IVANO LANE* 0.00 0.00 0.00 0 78 480 0 0
32 HWY 99 FRONTAGE* 344.70 41.26 1.38 1995 54240 1315 127
3R 7400 N. WEST LANE 173.80 21.85 0.73 2095 27120 1241 79
NWR NORTHWEST RESERVOIR 57600 91.0 491
14 Mile 14 MILE RESERVOIR 34720 269
I TOTAL SYSTEM PRODUCTION 1,028.60 135.15 275223 104.0 1180 0
TOTAL STOCKTON EAST PURCHASED WATER 415.46
DWTP 604.98
TOTAL NORTH SYSTEM 1155.59DAILY AVERAGE 34.3 38.52 9174 3.5 39 0
SOUTH WELL SYSTEM
SS1 QUANTAS 0.00 0.00 0.00 0 1187 0 0.0 0 0 0
SS2 N. ARCH FRONTAGE 0.50 0.04 0.64 1400 153 3643 1
SS3 FRONTIER* 1.10 0.00 0.00 61 68 440 110000 0
SS4 AIRPORT SOUTH 0.00 0.00 0.00 0 0 0 0 0
SS5 AIRPORT NORTH 0.00 0.00 0.00 0 0 0 0 0
SS8 SHROPSHIRE PARK 1.30 0.00 0.00 0 320 0 0
SS9 B ST. & LITTLEJOHN 0.90 0.00 0.00 56 560 186667 0
Weston WESTON RANCH RESERVOIR 16640 0
K TOTAL SOUTH WELL PRODUCTION 3.8 0.05
SSA SO SYS AQUEDUCT 233.02 19 115
TOTAL SOUTH SYSTEM 233.07 19319 0.0 116 0
DAILY AVERAGE 0.1 7.77 644 0.0 4 0
FILBERT/MLK INTERTERCONNECT
FILBERT INTERCONNECT 8.32
DAILY AVERAGE 0.28
CITY & COUNTY INTERCONNECTIONS Meter Reading
F PLYMOUTH ROAD 407614 44.22
E PERSHING 861525 19.54
G GREELEY 163721 18.35
M PORTOLA AVENUE 91039 2.98
N THORNTON 642049 18.67
103.75
3.46
MONTHLY OPERATIONS GAS POWER MONTHLY CHEMICALSMONTHLY POWER

A p p e n d i x | V
Appendix B
Environmental Compliance Monitored Industrial User Charges
Customer Charges Report
Septic Waste Haulers’ Charges
City of Stockton, Municipal Utilities Department – June 2013

A p p e n d i x | VI
THIS PAGE INTENTIONALLY LEFT BLANK
City of Stockton, Municipal Utilities Department – June 2013


