monthly market update (india) - december 2010
DESCRIPTION
Monthly review of key market segments within India including Equity (Domestic and International), Fixed Income, Currency, Economic Indicators, Mutual Funds & Recommended Portfolios (India).TRANSCRIPT
`
Monthly Markets Update - India
December 2010
Prepared by: iFAST Research Team
Monthly Markets Update - India
December 2010
Key Points
• Most of the Global markets were either flat or delivered negative return during the month of
November in-spite of Quantitative Easing Part II announce by US on 4 November which was in
line or slightly above expectation. The Japanese index, Nikkei 225 was the best performing index
whereas Brazilian index, Bovespa was the worst performing index for the month of November.
• Indian Market represented by Sensex, ended the month with negative return of 2.55% on
account of lower than expected IIP numbers, domestic housing scam as well as external factor
like Korean conflict and Euro debt crisis. BSE Midcap and Small Cap Index underperformed
Sensex by huge margin and gave negative return of 6.49% and 8.05% respectively during the
same tenure
• BSE Health care, Auto and IT were the only sectors that ended the month. BSE Realty index was
the worst performing sector with index falling over 19% during the month.
• Foreign Institutional Investors (FIIs) continued to pump in money into Indian stocks making a net
investment of about US$ 4.12 billion (INR 18,293 Crore) into Indian equities. Mutual funds
continued to be net sellers to the tune of INR 100 Crore however the quantum of redemption
has come down dramatically.
• The dollar has appreciated against most currencies during the month of November and the
dollar index was up by about 5.21% during the month after registering the fall for last four
consecutive months. The rupee closed the month with biggest monthly decline since May and it
depreciated against dollar by 3.27% during the month.
• In Fixed Income Market, Yields remain flat across the board. Reverse repo volumes continued to
be negative throughout the month of November.
• The y-o-y Industrial growth for September has fallen to 4.40% from the 6.90% last month. The y-
o-y WPI Inflation for September rose by 8.58%, slightly higher than Bloomberg estimate of
8.50%.
• India’s GDP for the second quarter of 2010 stands at 8.90%, while the Bloomberg estimate was
at 8.20%, mainly due to robust growth in the agriculture sector at 4.40%, which has not been
observed since 2008.
• The actively managed diversified equity funds have underperformed the benchmark Sensex
index on m-o-m basis, delivering on an average negative return of 4.17% in the November.
• In the debt segment, all the categories except the MIP funds have given positive returns and in
excess of 0.4% in November.
Monthly Markets Update - India
December 2010
Equity Markets Update
International Markets (As at November 2010 end):
2010 2010 2009 P/E P/E P/E Earnings Growth
Earnings Growth
MTD YTD Return (%) Yr 2010 Yr 2011 Yr 2012 2010 (%) 2011 (%)
Asia ex Japan (MSCI Asia ex Japan) -1.53% 10.94% 68.30% 14.0 12.4 10.9 44.1 12.9
Emerging Markets (MSCI EM) -2.70% 8.73% 74.50% 12.8 11.0 9.7 40.9 16.3
Europe (DJ Stoxx 600) -1.55% 3.13% 28.00% 11.6 10.1 9.1 39.9 14.2
Japan (Nikkei 225) 7.98% -5.78% 19.00% 17.4 15.3 12.7 63.2 13.6
USA (S&P 500) -0.23% 5.87% 23.50% 13.9 12.2 10.8 39.0 13.4
Australia (S&P/ASX 200) -1.66% -5.88% 30.80% 13.3 11.6 10.7 35.8 14.6
Brazil (IBOV) -4.20% -1.29% 82.70% 12.2 9.8 8.6 30.3 23.9
China (HS Mainland 100) -2.15% 2.65% 61.30% 13.6 11.8 10.1 23.2 15.7
Hong Kong (HSI) -0.38% 5.19% 52.00% 14.5 12.5 10.9 20.5 15.6
India (SENSEX) -2.55% 11.77% 81.00% 19.8 16.4 13.8 15.5 20.8
Indonesia (JCI) -2.86% 39.33% 87.00% 18.1 14.7 12.7 21.2 23.3
Malaysia (KLCI) 1.48% 16.69% 45.20% 15.9 14.2 13.1 20.7 11.9
Russia (RTSI$) 0.69% 10.62% 128.60% 8.1 6.9 6.3 50.6 17.7
Singapore (STI) 0.07% 8.53% 64.50% 15.4 14.0 12.8 20.3 9.6
South Korea (KOSPI) 1.15% 13.18% 49.70% 10.8 9.6 8.6 51.7 12.2
Taiwan (Taiwan Weighted) 1.03% 2.25% 78.30% 14.1 12.5 11.4 97.6 12.7
NASDAQ 100 (Technology Heavy) -0.34% 13.82% 53.50% 16.2 14.2 12.8 68.5 13.7
Thailand (SET Index) 2.10% 36.84% 63.20% 14.1 11.8 10.6 23.8 19.5
Source: Bloomberg, iFAST Compilations All returns are in respective local currency terms and MSCI Index returns are in USD
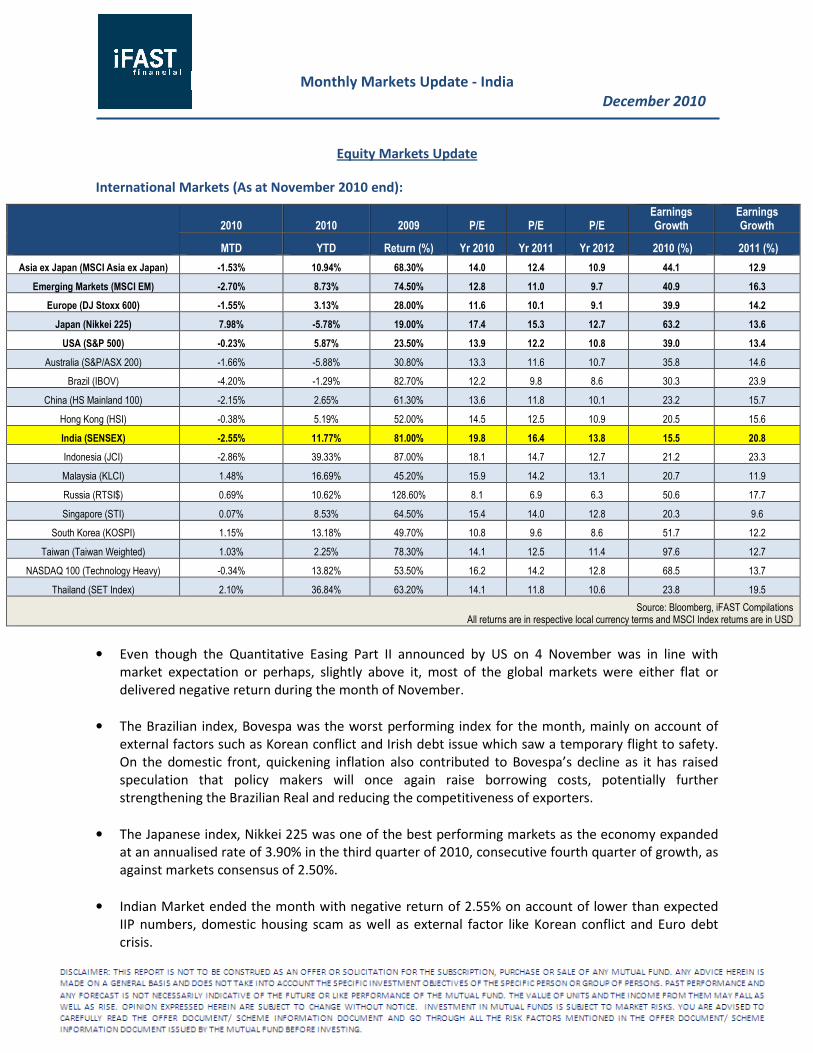
• Even though the Quantitative Easing Part II announced by US on 4 November was in line with
market expectation or perhaps, slightly above it, most of the global markets were either flat or
delivered negative return during the month of November.
• The Brazilian index, Bovespa was the worst performing index for the month, mainly on account of
external factors such as Korean conflict and Irish debt issue which saw a temporary flight to safety.
On the domestic front, quickening inflation also contributed to Bovespa’s decline as it has raised
speculation that policy makers will once again raise borrowing costs, potentially further
strengthening the Brazilian Real and reducing the competitiveness of exporters.
• The Japanese index, Nikkei 225 was one of the best performing markets as the economy expanded
at an annualised rate of 3.90% in the third quarter of 2010, consecutive fourth quarter of growth, as
against markets consensus of 2.50%.
• Indian Market ended the month with negative return of 2.55% on account of lower than expected
IIP numbers, domestic housing scam as well as external factor like Korean conflict and Euro debt
crisis.
Monthly Markets Update - India
December 2010
Domestic Markets (As of November 2010 end):
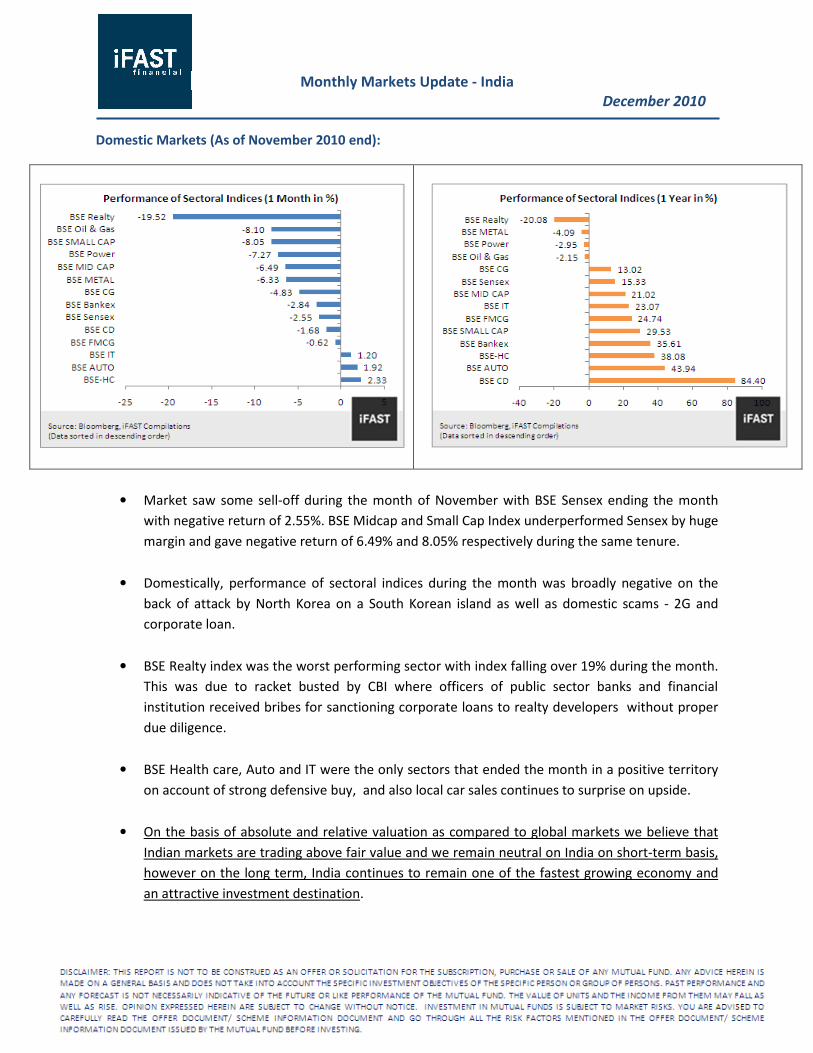
• Market saw some sell-off during the month of November with BSE Sensex ending the month
with negative return of 2.55%. BSE Midcap and Small Cap Index underperformed Sensex by huge
margin and gave negative return of 6.49% and 8.05% respectively during the same tenure.
• Domestically, performance of sectoral indices during the month was broadly negative on the
back of attack by North Korea on a South Korean island as well as domestic scams - 2G and
corporate loan.
• BSE Realty index was the worst performing sector with index falling over 19% during the month.
This was due to racket busted by CBI where officers of public sector banks and financial
institution received bribes for sanctioning corporate loans to realty developers without proper
due diligence.
• BSE Health care, Auto and IT were the only sectors that ended the month in a positive territory
on account of strong defensive buy, and also local car sales continues to surprise on upside.
• On the basis of absolute and relative valuation as compared to global markets we believe that
Indian markets are trading above fair value and we remain neutral on India on short-term basis,
however on the long term, India continues to remain one of the fastest growing economy and
an attractive investment destination.
Monthly Markets Update - India
December 2010
Institutional Flows Into Indian Equity Markets
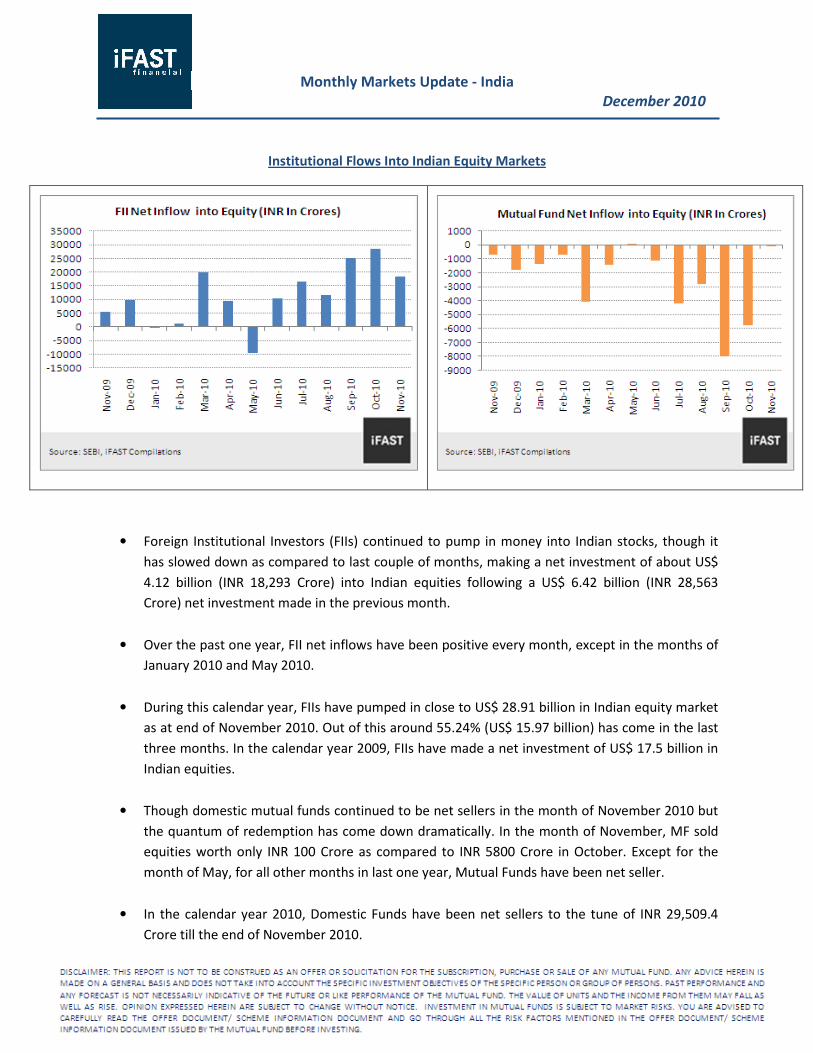
• Foreign Institutional Investors (FIIs) continued to pump in money into Indian stocks, though it
has slowed down as compared to last couple of months, making a net investment of about US$
4.12 billion (INR 18,293 Crore) into Indian equities following a US$ 6.42 billion (INR 28,563
Crore) net investment made in the previous month.
• Over the past one year, FII net inflows have been positive every month, except in the months of
January 2010 and May 2010.
• During this calendar year, FIIs have pumped in close to US$ 28.91 billion in Indian equity market
as at end of November 2010. Out of this around 55.24% (US$ 15.97 billion) has come in the last
three months. In the calendar year 2009, FIIs have made a net investment of US$ 17.5 billion in
Indian equities.
• Though domestic mutual funds continued to be net sellers in the month of November 2010 but
the quantum of redemption has come down dramatically. In the month of November, MF sold
equities worth only INR 100 Crore as compared to INR 5800 Crore in October. Except for the
month of May, for all other months in last one year, Mutual Funds have been net seller.
• In the calendar year 2010, Domestic Funds have been net sellers to the tune of INR 29,509.4
Crore till the end of November 2010.
Monthly Markets Update - India
December 2010
Currency Update
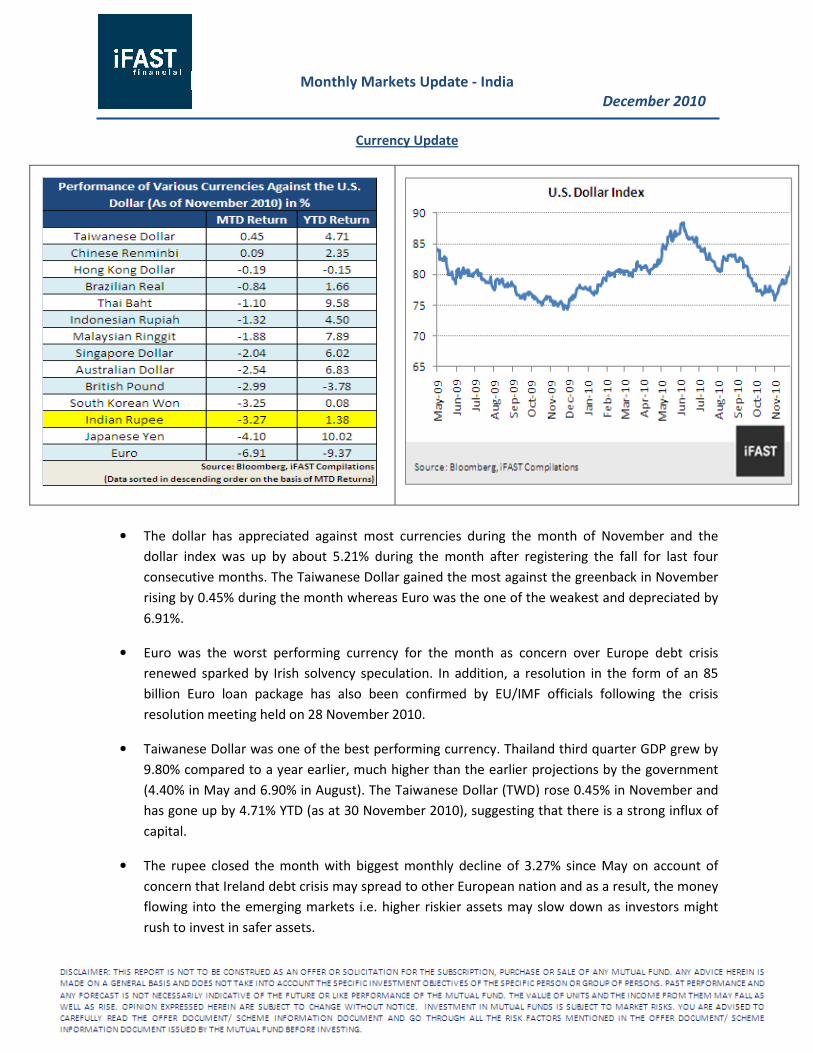
• The dollar has appreciated against most currencies during the month of November and the
dollar index was up by about 5.21% during the month after registering the fall for last four
consecutive months. The Taiwanese Dollar gained the most against the greenback in November
rising by 0.45% during the month whereas Euro was the one of the weakest and depreciated by
6.91%.
• Euro was the worst performing currency for the month as concern over Europe debt crisis
renewed sparked by Irish solvency speculation. In addition, a resolution in the form of an 85
billion Euro loan package has also been confirmed by EU/IMF officials following the crisis
resolution meeting held on 28 November 2010.
• Taiwanese Dollar was one of the best performing currency. Thailand third quarter GDP grew by
9.80% compared to a year earlier, much higher than the earlier projections by the government
(4.40% in May and 6.90% in August). The Taiwanese Dollar (TWD) rose 0.45% in November and
has gone up by 4.71% YTD (as at 30 November 2010), suggesting that there is a strong influx of
capital.
• The rupee closed the month with biggest monthly decline of 3.27% since May on account of
concern that Ireland debt crisis may spread to other European nation and as a result, the money
flowing into the emerging markets i.e. higher riskier assets may slow down as investors might
rush to invest in safer assets.
Monthly Markets Update - India
December 2010
Fixed Income Markets Update
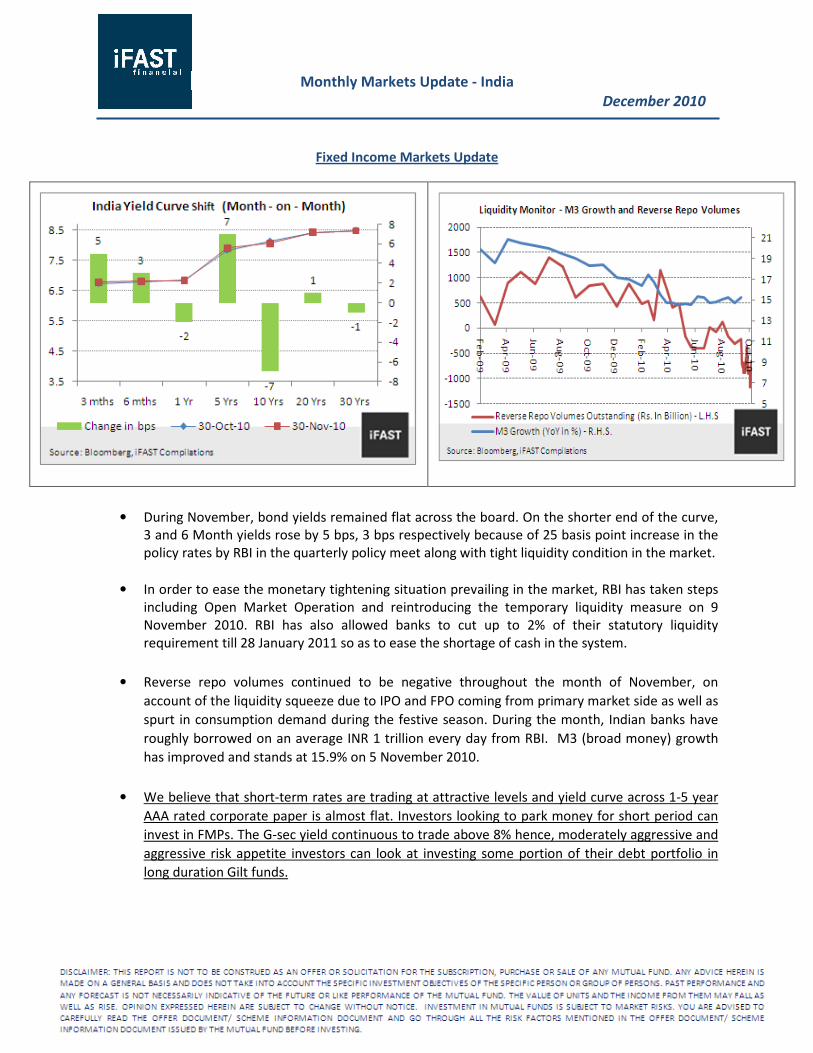
• During November, bond yields remained flat across the board. On the shorter end of the curve,
3 and 6 Month yields rose by 5 bps, 3 bps respectively because of 25 basis point increase in the
policy rates by RBI in the quarterly policy meet along with tight liquidity condition in the market.
• In order to ease the monetary tightening situation prevailing in the market, RBI has taken steps
including Open Market Operation and reintroducing the temporary liquidity measure on 9
November 2010. RBI has also allowed banks to cut up to 2% of their statutory liquidity
requirement till 28 January 2011 so as to ease the shortage of cash in the system.
• Reverse repo volumes continued to be negative throughout the month of November, on
account of the liquidity squeeze due to IPO and FPO coming from primary market side as well as
spurt in consumption demand during the festive season. During the month, Indian banks have
roughly borrowed on an average INR 1 trillion every day from RBI. M3 (broad money) growth
has improved and stands at 15.9% on 5 November 2010.
• We believe that short-term rates are trading at attractive levels and yield curve across 1-5 year
AAA rated corporate paper is almost flat. Investors looking to park money for short period can
invest in FMPs. The G-sec yield continuous to trade above 8% hence, moderately aggressive and
aggressive risk appetite investors can look at investing some portion of their debt portfolio in
long duration Gilt funds.
Monthly Markets Update - India
December 2010
Economic Indicators
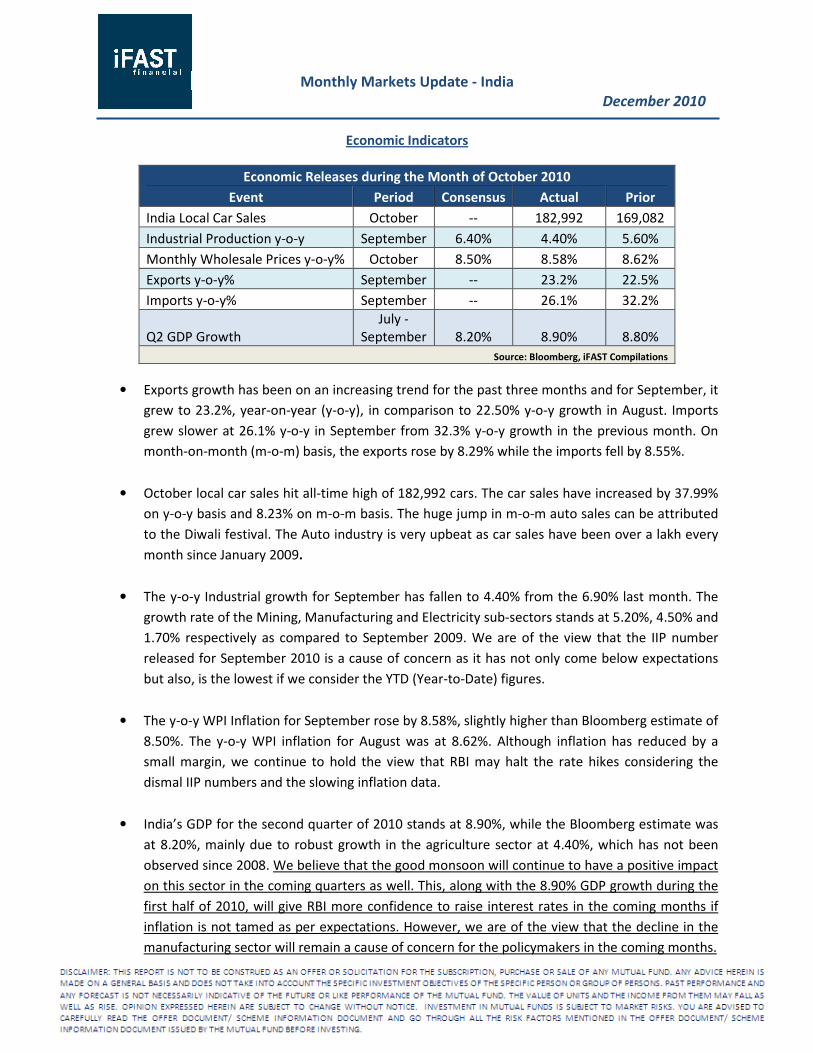
Economic Releases during the Month of October 2010
Event Period Consensus Actual Prior
India Local Car Sales October -- 182,992 169,082
Industrial Production y-o-y September 6.40% 4.40% 5.60%
Monthly Wholesale Prices y-o-y% October 8.50% 8.58% 8.62%
Exports y-o-y% September -- 23.2% 22.5%
Imports y-o-y% September -- 26.1% 32.2%
Q2 GDP Growth
July -
September 8.20% 8.90% 8.80%
Source: Bloomberg, iFAST Compilations
• Exports growth has been on an increasing trend for the past three months and for September, it
grew to 23.2%, year-on-year (y-o-y), in comparison to 22.50% y-o-y growth in August. Imports
grew slower at 26.1% y-o-y in September from 32.3% y-o-y growth in the previous month. On
month-on-month (m-o-m) basis, the exports rose by 8.29% while the imports fell by 8.55%.
• October local car sales hit all-time high of 182,992 cars. The car sales have increased by 37.99%
on y-o-y basis and 8.23% on m-o-m basis. The huge jump in m-o-m auto sales can be attributed
to the Diwali festival. The Auto industry is very upbeat as car sales have been over a lakh every
month since January 2009.
• The y-o-y Industrial growth for September has fallen to 4.40% from the 6.90% last month. The
growth rate of the Mining, Manufacturing and Electricity sub-sectors stands at 5.20%, 4.50% and
1.70% respectively as compared to September 2009. We are of the view that the IIP number
released for September 2010 is a cause of concern as it has not only come below expectations
but also, is the lowest if we consider the YTD (Year-to-Date) figures.
• The y-o-y WPI Inflation for September rose by 8.58%, slightly higher than Bloomberg estimate of
8.50%. The y-o-y WPI inflation for August was at 8.62%. Although inflation has reduced by a
small margin, we continue to hold the view that RBI may halt the rate hikes considering the
dismal IIP numbers and the slowing inflation data.
• India’s GDP for the second quarter of 2010 stands at 8.90%, while the Bloomberg estimate was
at 8.20%, mainly due to robust growth in the agriculture sector at 4.40%, which has not been
observed since 2008. We believe that the good monsoon will continue to have a positive impact
on this sector in the coming quarters as well. This, along with the 8.90% GDP growth during the
first half of 2010, will give RBI more confidence to raise interest rates in the coming months if
inflation is not tamed as per expectations. However, we are of the view that the decline in the
manufacturing sector will remain a cause of concern for the policymakers in the coming months.
Monthly Markets Update - India
December 2010
European Sovereign Debt Crisis
Since early 2010, the governments of Portugal, Italy, Ireland, Greece and Spain (PIIGS) have been facing
sovereign debt crisis. These countries are impaired with huge government deficit and are trying to
refinance their existing debts. Moreover, the European Union and the International Monetary Fund
(IMF) had to bail out Greece and Ireland by lending billions of Euros.
Let’s us understand the series of events and their subsequent impact.
Bailouts
• May 2010: The European Union and the IMF bailed out Greece by lending 110 billion EUR. The
lending rate is 5.20%. At the time of the bailout, the rate was half of the market rate to buy
Greek sovereign debt
• November 2010: Ireland had to be rescued. A resolution in the form of 85 billion EUR loan
package has been passed by EU/IMF officials following their crisis resolution meeting held on 28
November 2010. The aid package included loans for the period ranging from three to seven and
half years and Ireland would have to pay on an average 5.80% interest on these loans. Out of
the 85 billion EUR, 10 billion EUR will be used immediately to boost the capital reserves of the
Irish banks. The rest will be used by the government and banks, if additional capital reserves are
required
Effect on Markets
• January 2010: All equity markets under our coverage except for Indonesian equity market were
negative owing to the European debt crisis. India and Thailand equity markets fell by over 6%.
• November 2010: Similarly, many equity markets under our coverage had negative performance
due to the Ireland debt crisis.
• Gold shines in 2010: The European debt crisis and the Quantitative Easing – Round II by the US
Federal Reserve boosted the price of gold from US$ 1096.95 / Oz as at 31 December 2009 to
US$ 1386.02 /Oz as at 30 November 2010. On Year-To-Date basis, Gold with 26.35% returns in
USD terms, has given better returns than SENSEX which returned only 11.77%.
Monthly Markets Update - India
December 2010
Fund Category Returns
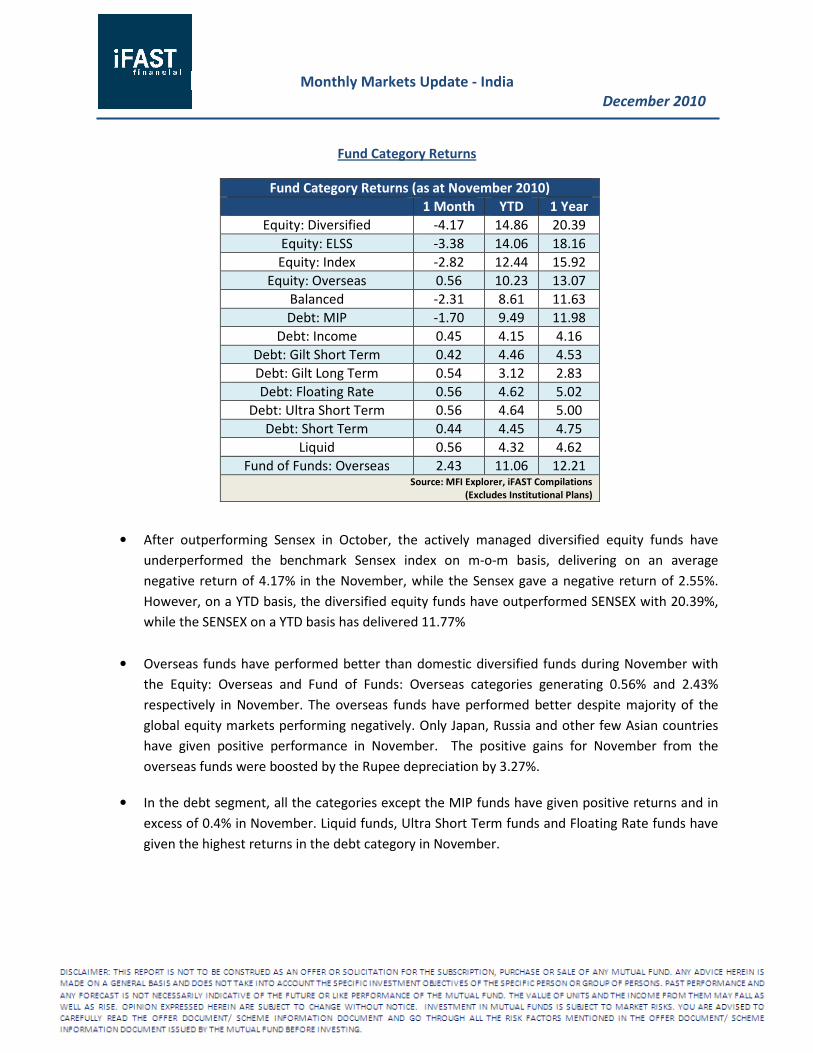
Fund Category Returns (as at November 2010)
1 Month YTD 1 Year
Equity: Diversified -4.17 14.86 20.39
Equity: ELSS -3.38 14.06 18.16
Equity: Index -2.82 12.44 15.92
Equity: Overseas 0.56 10.23 13.07
Balanced -2.31 8.61 11.63
Debt: MIP -1.70 9.49 11.98
Debt: Income 0.45 4.15 4.16
Debt: Gilt Short Term 0.42 4.46 4.53
Debt: Gilt Long Term 0.54 3.12 2.83
Debt: Floating Rate 0.56 4.62 5.02
Debt: Ultra Short Term 0.56 4.64 5.00
Debt: Short Term 0.44 4.45 4.75
Liquid 0.56 4.32 4.62
Fund of Funds: Overseas 2.43 11.06 12.21 Source: MFI Explorer, iFAST Compilations
(Excludes Institutional Plans)
• After outperforming Sensex in October, the actively managed diversified equity funds have
underperformed the benchmark Sensex index on m-o-m basis, delivering on an average
negative return of 4.17% in the November, while the Sensex gave a negative return of 2.55%.
However, on a YTD basis, the diversified equity funds have outperformed SENSEX with 20.39%,
while the SENSEX on a YTD basis has delivered 11.77%
• Overseas funds have performed better than domestic diversified funds during November with
the Equity: Overseas and Fund of Funds: Overseas categories generating 0.56% and 2.43%
respectively in November. The overseas funds have performed better despite majority of the
global equity markets performing negatively. Only Japan, Russia and other few Asian countries
have given positive performance in November. The positive gains for November from the
overseas funds were boosted by the Rupee depreciation by 3.27%.
• In the debt segment, all the categories except the MIP funds have given positive returns and in
excess of 0.4% in November. Liquid funds, Ultra Short Term funds and Floating Rate funds have
given the highest returns in the debt category in November.
Monthly Markets Update - India
December 2010
Top and Bottom Five Performing Equity Funds in November
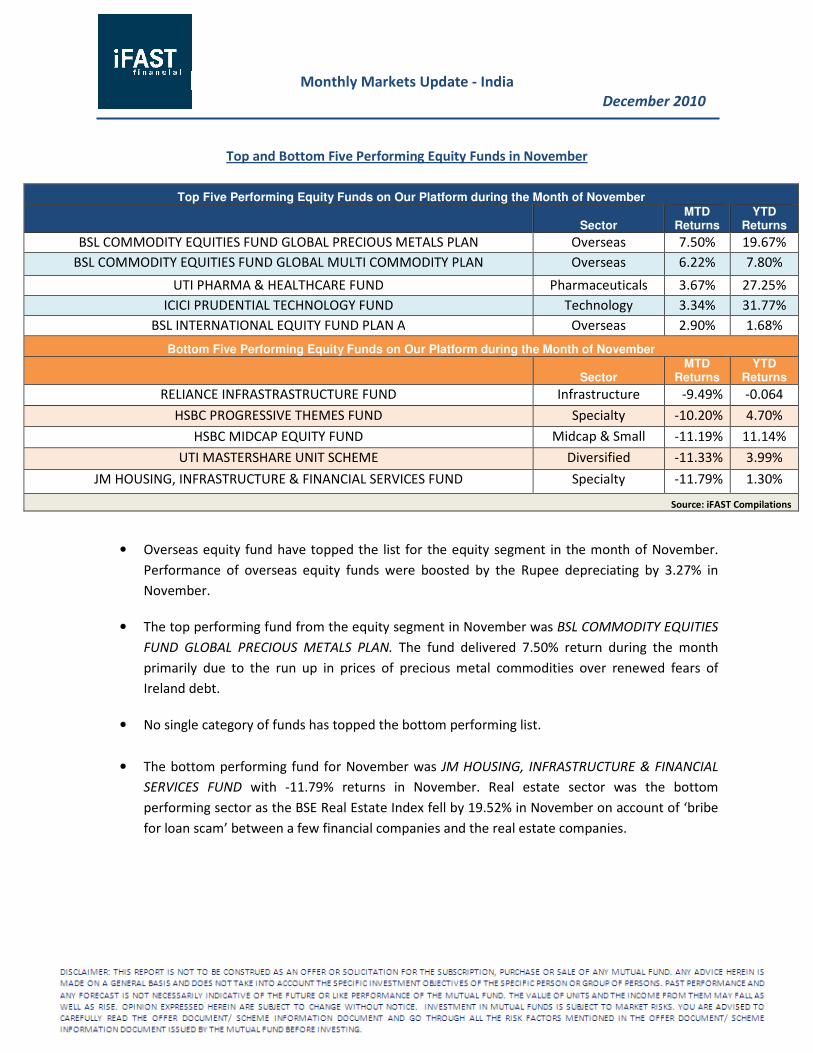
Top Five Performing Equity Funds on Our Platform during the Month of November
Sector MTD
Returns YTD
Returns
BSL COMMODITY EQUITIES FUND GLOBAL PRECIOUS METALS PLAN Overseas 7.50% 19.67%
BSL COMMODITY EQUITIES FUND GLOBAL MULTI COMMODITY PLAN Overseas 6.22% 7.80%
UTI PHARMA & HEALTHCARE FUND Pharmaceuticals 3.67% 27.25%
ICICI PRUDENTIAL TECHNOLOGY FUND Technology 3.34% 31.77%
BSL INTERNATIONAL EQUITY FUND PLAN A Overseas 2.90% 1.68%
Bottom Five Performing Equity Funds on Our Platform during the Month of November
Sector MTD
Returns YTD
Returns
RELIANCE INFRASTRASTRUCTURE FUND Infrastructure -9.49% -0.064
HSBC PROGRESSIVE THEMES FUND Specialty -10.20% 4.70%
HSBC MIDCAP EQUITY FUND Midcap & Small
Cap
-11.19% 11.14%
UTI MASTERSHARE UNIT SCHEME Diversified -11.33% 3.99%
JM HOUSING, INFRASTRUCTURE & FINANCIAL SERVICES FUND Specialty -11.79% 1.30%
Source: iFAST Compilations
• Overseas equity fund have topped the list for the equity segment in the month of November.
Performance of overseas equity funds were boosted by the Rupee depreciating by 3.27% in
November.
• The top performing fund from the equity segment in November was BSL COMMODITY EQUITIES
FUND GLOBAL PRECIOUS METALS PLAN. The fund delivered 7.50% return during the month
primarily due to the run up in prices of precious metal commodities over renewed fears of
Ireland debt.
• No single category of funds has topped the bottom performing list.
• The bottom performing fund for November was JM HOUSING, INFRASTRUCTURE & FINANCIAL
SERVICES FUND with -11.79% returns in November. Real estate sector was the bottom
performing sector as the BSE Real Estate Index fell by 19.52% in November on account of ‘bribe
for loan scam’ between a few financial companies and the real estate companies.
Monthly Markets Update - India
December 2010
Top and Bottom Five Performing Debt Funds in November
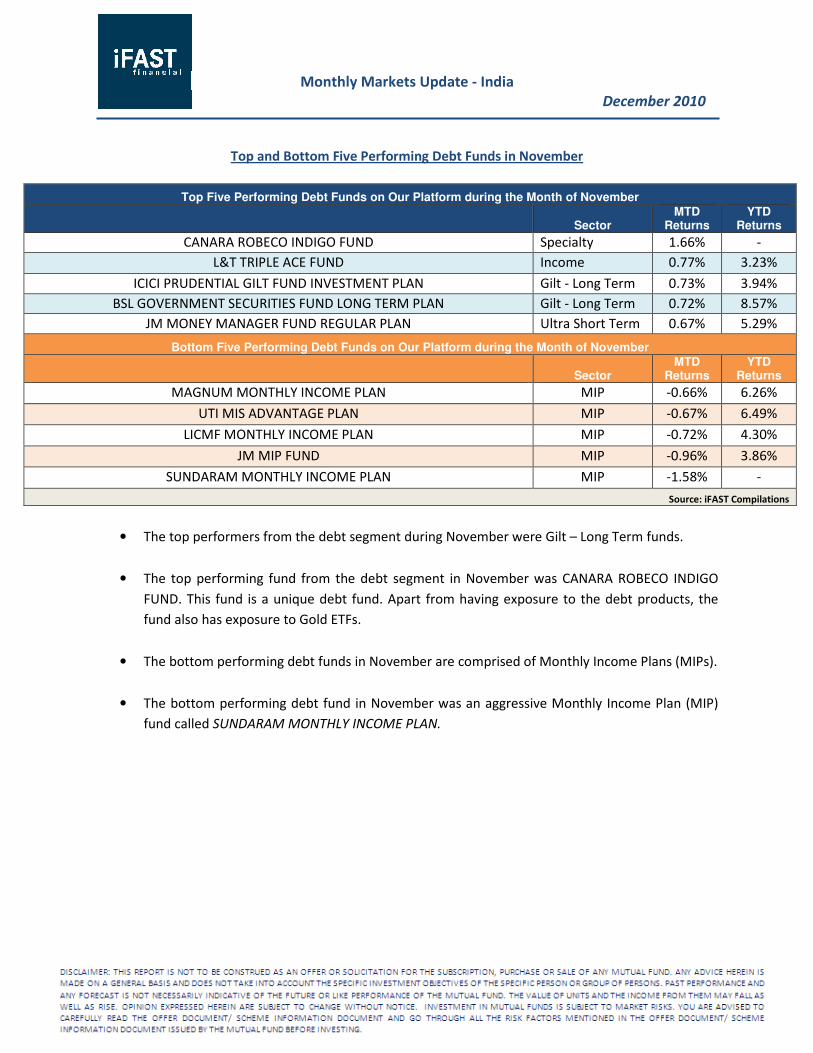
Top Five Performing Debt Funds on Our Platform during the Month of November
Sector MTD
Returns YTD
Returns
CANARA ROBECO INDIGO FUND Specialty 1.66% -
L&T TRIPLE ACE FUND Income 0.77% 3.23%
ICICI PRUDENTIAL GILT FUND INVESTMENT PLAN Gilt - Long Term 0.73% 3.94%
BSL GOVERNMENT SECURITIES FUND LONG TERM PLAN Gilt - Long Term 0.72% 8.57%
JM MONEY MANAGER FUND REGULAR PLAN Ultra Short Term 0.67% 5.29%
Bottom Five Performing Debt Funds on Our Platform during the Month of November
Sector MTD
Returns YTD
Returns
MAGNUM MONTHLY INCOME PLAN MIP -0.66% 6.26%
UTI MIS ADVANTAGE PLAN MIP -0.67% 6.49%
LICMF MONTHLY INCOME PLAN MIP -0.72% 4.30%
JM MIP FUND MIP -0.96% 3.86%
SUNDARAM MONTHLY INCOME PLAN MIP -1.58% -
Source: iFAST Compilations
• The top performers from the debt segment during November were Gilt – Long Term funds.
• The top performing fund from the debt segment in November was CANARA ROBECO INDIGO
FUND. This fund is a unique debt fund. Apart from having exposure to the debt products, the
fund also has exposure to Gold ETFs.
• The bottom performing debt funds in November are comprised of Monthly Income Plans (MIPs).
• The bottom performing debt fund in November was an aggressive Monthly Income Plan (MIP)
fund called SUNDARAM MONTHLY INCOME PLAN.
Monthly Markets Update - India
December 2010
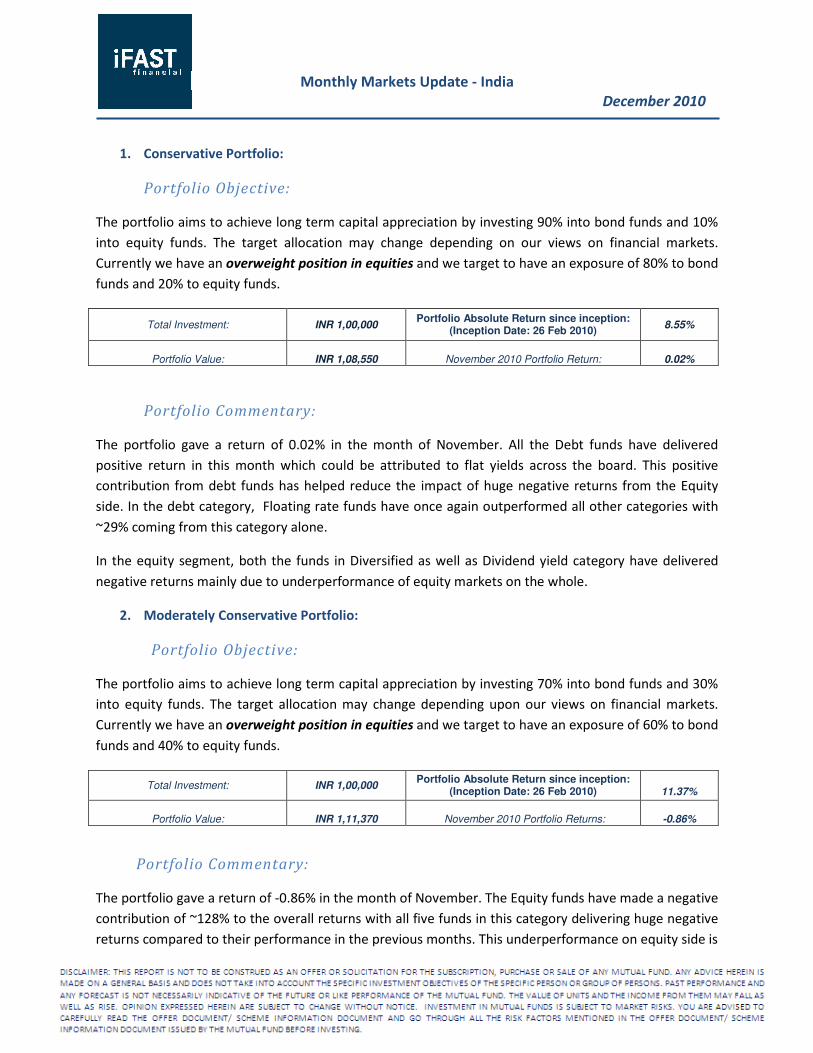
1. Conservative Portfolio:
Portfolio Objective:
The portfolio aims to achieve long term capital appreciation by investing 90% into bond funds and 10%
into equity funds. The target allocation may change depending on our views on financial markets.
Currently we have an overweight position in equities and we target to have an exposure of 80% to bond
funds and 20% to equity funds.
Total Investment: INR 1,00,000 Portfolio Absolute Return since inception:
(Inception Date: 26 Feb 2010) 8.55%
Portfolio Value:
INR 1,08,550
November 2010 Portfolio Return:
0.02%
Portfolio Commentary:
The portfolio gave a return of 0.02% in the month of November. All the Debt funds have delivered
positive return in this month which could be attributed to flat yields across the board. This positive
contribution from debt funds has helped reduce the impact of huge negative returns from the Equity
side. In the debt category, Floating rate funds have once again outperformed all other categories with
~29% coming from this category alone.
In the equity segment, both the funds in Diversified as well as Dividend yield category have delivered
negative returns mainly due to underperformance of equity markets on the whole.
2. Moderately Conservative Portfolio:
Portfolio Objective:
The portfolio aims to achieve long term capital appreciation by investing 70% into bond funds and 30%
into equity funds. The target allocation may change depending upon our views on financial markets.
Currently we have an overweight position in equities and we target to have an exposure of 60% to bond
funds and 40% to equity funds.
Total Investment: INR 1,00,000 Portfolio Absolute Return since inception:
(Inception Date: 26 Feb 2010)
11.37%
Portfolio Value:
INR 1,11,370
November 2010 Portfolio Returns:
-0.86%
Portfolio Commentary:
The portfolio gave a return of -0.86% in the month of November. The Equity funds have made a negative
contribution of ~128% to the overall returns with all five funds in this category delivering huge negative
returns compared to their performance in the previous months. This underperformance on equity side is
Monthly Markets Update - India
December 2010
partly due to negative returns delivered by the Equity markets on the whole where Sensex gave a
negative return of 2.55% in this month.
In the Debt segment, all the funds have given decent returns with Floating rate funds at the top. It has
contributed ~37% of the debt portfolio returns. Overall the returns from Debt category stand at ~28%.
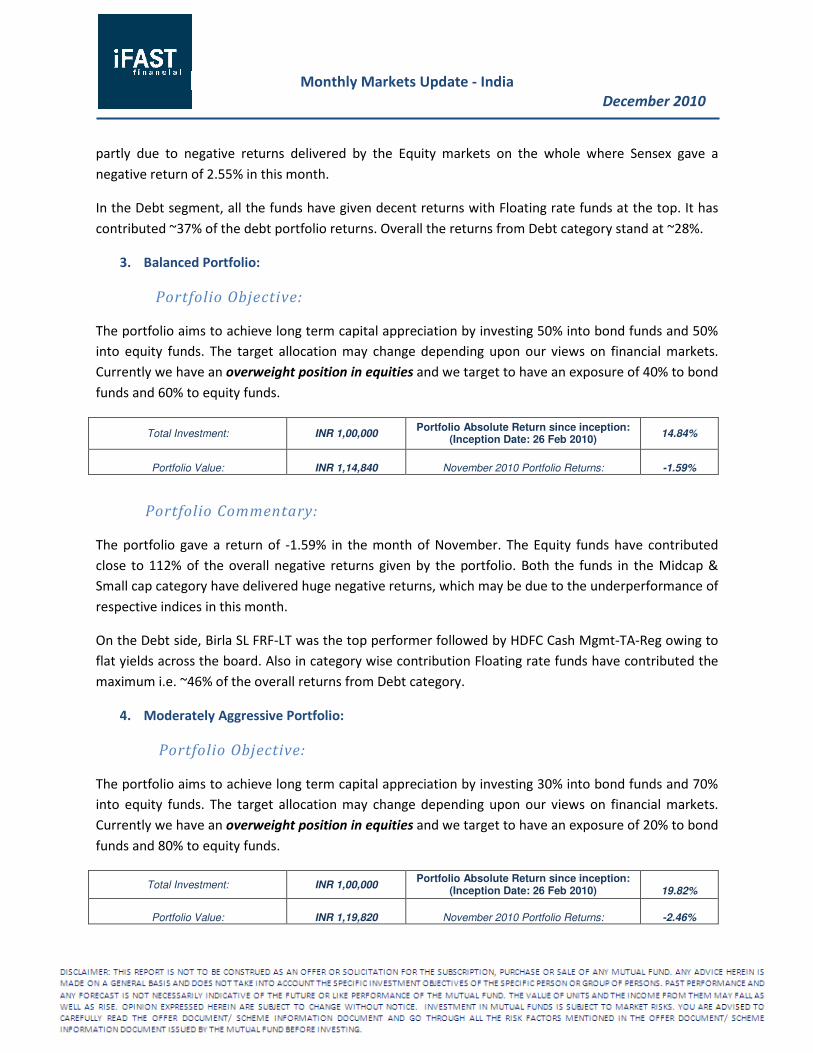
3. Balanced Portfolio:
Portfolio Objective:
The portfolio aims to achieve long term capital appreciation by investing 50% into bond funds and 50%
into equity funds. The target allocation may change depending upon our views on financial markets.
Currently we have an overweight position in equities and we target to have an exposure of 40% to bond
funds and 60% to equity funds.
Total Investment: INR 1,00,000 Portfolio Absolute Return since inception:
(Inception Date: 26 Feb 2010) 14.84%
Portfolio Value:
INR 1,14,840
November 2010 Portfolio Returns:
-1.59%
Portfolio Commentary:
The portfolio gave a return of -1.59% in the month of November. The Equity funds have contributed
close to 112% of the overall negative returns given by the portfolio. Both the funds in the Midcap &
Small cap category have delivered huge negative returns, which may be due to the underperformance of
respective indices in this month.
On the Debt side, Birla SL FRF-LT was the top performer followed by HDFC Cash Mgmt-TA-Reg owing to
flat yields across the board. Also in category wise contribution Floating rate funds have contributed the
maximum i.e. ~46% of the overall returns from Debt category.
4. Moderately Aggressive Portfolio:
Portfolio Objective:
The portfolio aims to achieve long term capital appreciation by investing 30% into bond funds and 70%
into equity funds. The target allocation may change depending upon our views on financial markets.
Currently we have an overweight position in equities and we target to have an exposure of 20% to bond
funds and 80% to equity funds.
Total Investment: INR 1,00,000 Portfolio Absolute Return since inception:
(Inception Date: 26 Feb 2010)
19.82%
Portfolio Value:
INR 1,19,820
November 2010 Portfolio Returns:
-2.46%
Monthly Markets Update - India
December 2010
Portfolio Commentary:
The portfolio gave a return of -2.46% in the month of November. The Midcap & Small cap category
followed by the Sector funds have contributed the maximum to the negative returns arising from the
equity side. Reliance Banking, for the first time in past few months has delivered a negative return. In all
Equity funds have contributed ~106% to overall portfolio’s negative returns.
All the debt funds have given positive returns in the range of 0.37 to 0.59. The return from HDFC Cash
Mgmt-TA-Reg(G) fund alone accounted for ~ 37% of the total debt portfolio returns despite having a
low weightage of 5% in the portfolio basket. Also the Floating rate funds and liquid plus funds have
given slightly higher returns compared to their respective category returns.
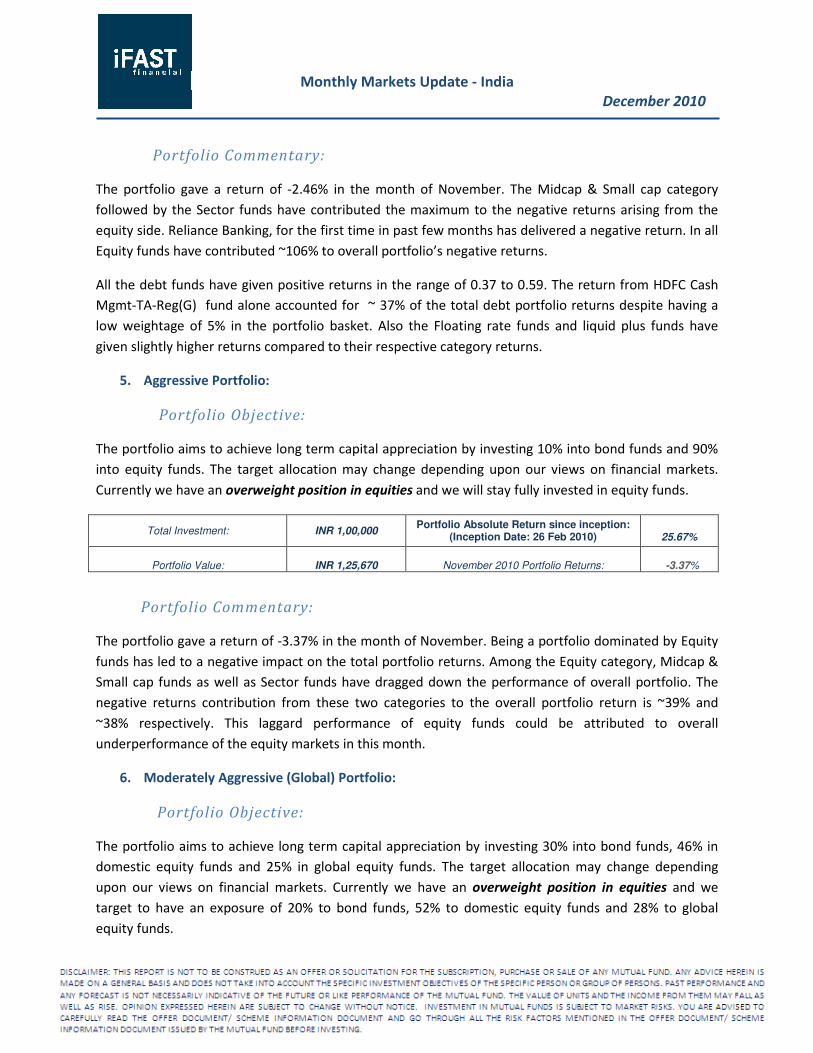
5. Aggressive Portfolio:
Portfolio Objective:
The portfolio aims to achieve long term capital appreciation by investing 10% into bond funds and 90%
into equity funds. The target allocation may change depending upon our views on financial markets.
Currently we have an overweight position in equities and we will stay fully invested in equity funds.
Total Investment: INR 1,00,000 Portfolio Absolute Return since inception:
(Inception Date: 26 Feb 2010)
25.67%
Portfolio Value:
INR 1,25,670
November 2010 Portfolio Returns:
-3.37%
Portfolio Commentary:
The portfolio gave a return of -3.37% in the month of November. Being a portfolio dominated by Equity
funds has led to a negative impact on the total portfolio returns. Among the Equity category, Midcap &
Small cap funds as well as Sector funds have dragged down the performance of overall portfolio. The
negative returns contribution from these two categories to the overall portfolio return is ~39% and
~38% respectively. This laggard performance of equity funds could be attributed to overall
underperformance of the equity markets in this month.
6. Moderately Aggressive (Global) Portfolio:
Portfolio Objective:
The portfolio aims to achieve long term capital appreciation by investing 30% into bond funds, 46% in
domestic equity funds and 25% in global equity funds. The target allocation may change depending
upon our views on financial markets. Currently we have an overweight position in equities and we
target to have an exposure of 20% to bond funds, 52% to domestic equity funds and 28% to global
equity funds.
Monthly Markets Update - India
December 2010
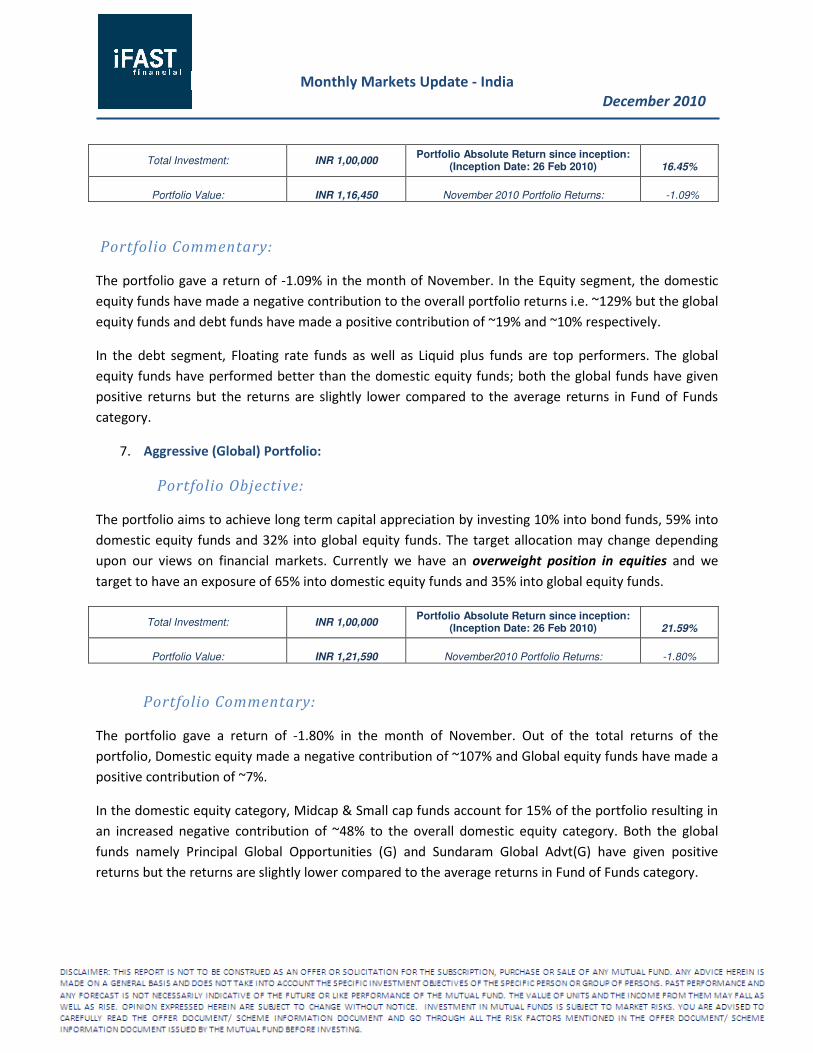
Total Investment: INR 1,00,000 Portfolio Absolute Return since inception:
(Inception Date: 26 Feb 2010)
16.45%
Portfolio Value:
INR 1,16,450
November 2010 Portfolio Returns:
-1.09%
Portfolio Commentary:
The portfolio gave a return of -1.09% in the month of November. In the Equity segment, the domestic
equity funds have made a negative contribution to the overall portfolio returns i.e. ~129% but the global
equity funds and debt funds have made a positive contribution of ~19% and ~10% respectively.
In the debt segment, Floating rate funds as well as Liquid plus funds are top performers. The global
equity funds have performed better than the domestic equity funds; both the global funds have given
positive returns but the returns are slightly lower compared to the average returns in Fund of Funds
category.
7. Aggressive (Global) Portfolio:
Portfolio Objective:
The portfolio aims to achieve long term capital appreciation by investing 10% into bond funds, 59% into
domestic equity funds and 32% into global equity funds. The target allocation may change depending
upon our views on financial markets. Currently we have an overweight position in equities and we
target to have an exposure of 65% into domestic equity funds and 35% into global equity funds.
Total Investment: INR 1,00,000 Portfolio Absolute Return since inception:
(Inception Date: 26 Feb 2010)
21.59%
Portfolio Value:
INR 1,21,590
November2010 Portfolio Returns:
-1.80%
Portfolio Commentary:
The portfolio gave a return of -1.80% in the month of November. Out of the total returns of the
portfolio, Domestic equity made a negative contribution of ~107% and Global equity funds have made a
positive contribution of ~7%.
In the domestic equity category, Midcap & Small cap funds account for 15% of the portfolio resulting in
an increased negative contribution of ~48% to the overall domestic equity category. Both the global
funds namely Principal Global Opportunities (G) and Sundaram Global Advt(G) have given positive
returns but the returns are slightly lower compared to the average returns in Fund of Funds category.