monthly harvard-harris poll: april...
TRANSCRIPT

Page 1
TOP LINE MEMO Favorability
Monthly Harvard-Harris Poll: April 2017 This survey was conducted online within the United States between April 14-17, 2017 among 2,027 registered voters by The Harris Poll. The results reflect a nationally representative sample. Results were weighted for age within gender, region, race/ethnicity, marital status, household size, income, employment, and education where necessary to align them with their actual proportions in the population. Propensity score weighting was also used to adjust for respondents’ propensity to be online.

Base n=2027
AGE* 18-34 26% 35-49 25% 50-64 27% 65+ 22% SEX* Male 48% Female 52% EDUCATION* Less than high school degree 7% High school degree to less than 4 year college degree 57% 4 year college degree or more 36% RACE/ETHNICITY* White 70% Black/African American 11% Hispanic 12% Asian or Pacific Islander 3% Mixed race 2% Other 1% Decline to Answer 1% POLITICAL PARTY Democrat 36% Republican 31% Independent 30% Other 3% LOCALE Urban 28% Suburban 52% Rural 20% *Denotes weighting variable

QuickQuery Fielding Period: April 14-17, 2017 HCAPS (Filtered on Registered Voters) Weighted To The U.S. General Adult Population - Propensity 18 Apr 2017 Table 1 D1 What is your age? Base: All Respondents Total Unweighted Base 2027 Weighted Base 2013 Effective Base 1013 18-34 519 26% 35-49 500 25% 50-64 548 27% 65+ 446 22% Mean 48.7 Std. Dev. 16.91 Std. Err. 0.38 Sigma 2013 100%

Page 2 QuickQuery Fielding Period: April 14-17, 2017 HCAPS (Filtered on Registered Voters) Weighted To The U.S. General Adult Population - Propensity 18 Apr 2017 Table 2 D2 What is your gender? Base: All Respondents Total Unweighted Base 2027 Weighted Base 2013 Effective Base 1013 Male 963 48% Female 1050 52% Sigma 2013 100%

Page 3 QuickQuery Fielding Period: April 14-17, 2017 HCAPS (Filtered on Registered Voters) Weighted To The U.S. General Adult Population - Propensity 18 Apr 2017 Table 3 Q474 Are you of Spanish or Hispanic origin, such as Latin American, Mexican, Puerto Rican, or Cuban? Base: All Respondents Total Unweighted Base 2027 Weighted Base 2013 Effective Base 1013 Yes, of Hispanic origin 244 12% No, not of Hispanic origin 1745 87% Decline to answer 25 1% Sigma 2013 100%

Page 4 QuickQuery Fielding Period: April 14-17, 2017 HCAPS (Filtered on Registered Voters) Weighted To The U.S. General Adult Population - Propensity 18 Apr 2017 Table 4 Q480 Do you consider yourself...? Base: Ethnicity Is To Be Asked And Have Ethnic Codes Total Unweighted Base 2027 Weighted Base 2013 Effective Base 1013 White 1531 76% Black 177 9% Asian or Pacific Islander - - Native American or Alaskan 37 Native 2% Hispanic - - African American 37 2% First Nation/Native Canadian - - South Asian 7 * Chinese 31 2% Korean 2 * Japanese 11 1% Other Southeast Asian 4 *

Filipino 8 * Arab/West Asian - - Mixed Race 84 4% Some other race 59 3% Decline to Answer 23 1%

Page 5 QuickQuery Fielding Period: April 14-17, 2017 HCAPS (Filtered on Registered Voters) Weighted To The U.S. General Adult Population - Propensity 18 Apr 2017 Table 4 Q480 Do you consider yourself...? Base: Ethnicity Is To Be Asked And Have Ethnic Codes Total Weighted Base 2013 Sigma 2013 100%
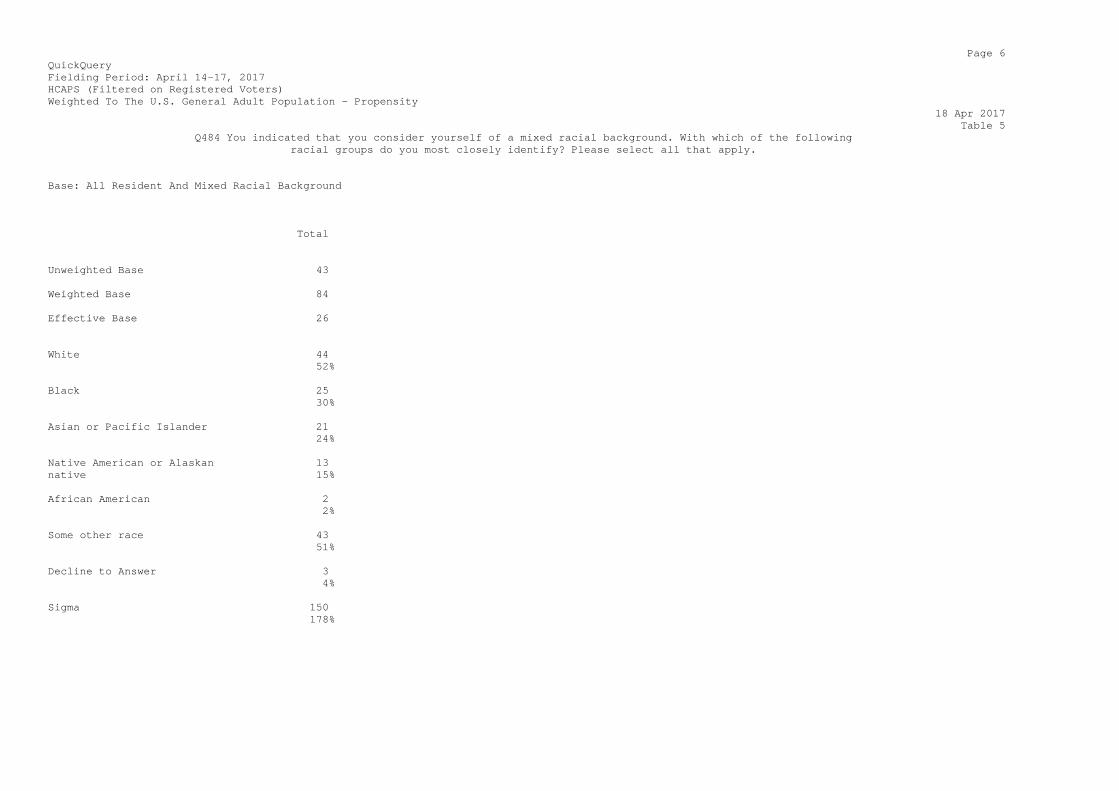
Page 6 QuickQuery Fielding Period: April 14-17, 2017 HCAPS (Filtered on Registered Voters) Weighted To The U.S. General Adult Population - Propensity 18 Apr 2017 Table 5 Q484 You indicated that you consider yourself of a mixed racial background. With which of the following racial groups do you most closely identify? Please select all that apply. Base: All Resident And Mixed Racial Background Total Unweighted Base 43 Weighted Base 84 Effective Base 26 White 44 52% Black 25 30% Asian or Pacific Islander 21 24% Native American or Alaskan 13 native 15% African American 2 2% Some other race 43 51% Decline to Answer 3 4% Sigma 150 178%

Filipino 8 * Arab/West Asian - - Mixed Race 42 2% Some other race 6 * Decline to Answer 16 1%

Page 8 QuickQuery Fielding Period: April 14-17, 2017 HCAPS (Filtered on Registered Voters) Weighted To The U.S. General Adult Population - Propensity 18 Apr 2017 Table 6 Q485 HIDDEN COMPUTE for RACE/ETHNICITY Base: Ethnicity Is To Be Asked And Have Ethnic Codes Total Weighted Base 2013 Sigma 2013 100%

Page 12 QuickQuery Fielding Period: April 14-17, 2017 HCAPS (Filtered on Registered Voters) Weighted To The U.S. General Adult Population - Propensity 18 Apr 2017 Table 8 S1 Are you over 18 years of age and registered to vote? Base: All Respondents Total Unweighted Base 2027 Weighted Base 2013 Effective Base 1013 Yes 2013 100% No - - Sigma 2013 100%

Page 13 QuickQuery Fielding Period: April 14-17, 2017 HCAPS (Filtered on Registered Voters) Weighted To The U.S. General Adult Population - Propensity 18 Apr 2017 Table 9 M1 In general, do you think the country is on the right track or is it off on the wrong track? Base: All Respondents Total Unweighted Base 2027 Weighted Base 2013 Effective Base 1013 Right track 717 36% Wrong track 1009 50% Don't know / Unsure 287 14% Sigma 2013 100%

Page 14 QuickQuery Fielding Period: April 14-17, 2017 HCAPS (Filtered on Registered Voters) Weighted To The U.S. General Adult Population - Propensity 18 Apr 2017 Table 10 M2 In general, do you think the American economy is on right track or is it off on the wrong track? Base: All Respondents Total Unweighted Base 2027 Weighted Base 2013 Effective Base 1013 Right track 835 41% Wrong track 767 38% Don't know / Unsure 412 20% Sigma 2013 100%

Page 15 QuickQuery Fielding Period: April 14-17, 2017 HCAPS (Filtered on Registered Voters) Weighted To The U.S. General Adult Population - Propensity 18 Apr 2017 Table 11 M3 Do you approve or disapprove of the job Donald Trump is doing as President of the United States? Base: All Respondents Total Unweighted Base 2027 Weighted Base 2013 Effective Base 1013 Strongly/Somewhat Approve 966 (Net) 48% Strongly approve 452 22% Somewhat approve 514 26% Strongly/Somewhat Disapprove 1047 (Net) 52% Somewhat disapprove 293 15% Strongly disapprove 754 37% Sigma 2013 100%

Page 16 QuickQuery Fielding Period: April 14-17, 2017 HCAPS (Filtered on Registered Voters) Weighted To The U.S. General Adult Population - Propensity 18 Apr 2017 Table 12 M4 Do you approve or disapprove of the way the Republican Party is handling its job? Base: All Respondents Total Unweighted Base 2027 Weighted Base 2013 Effective Base 1013 Strongly/Somewhat Approve 795 (Net) 39% Strongly approve 171 8% Somewhat approve 624 31% Strongly/Somewhat Disapprove 1218 (Net) 61% Somewhat disapprove 497 25% Strongly disapprove 722 36% Sigma 2013 100%

Page 17 QuickQuery Fielding Period: April 14-17, 2017 HCAPS (Filtered on Registered Voters) Weighted To The U.S. General Adult Population - Propensity 18 Apr 2017 Table 13 M5 Do you approve or disapprove of the way the Democratic Party is handling its job? Base: All Respondents Total Unweighted Base 2027 Weighted Base 2013 Effective Base 1013 Strongly/Somewhat Approve 848 (Net) 42% Strongly approve 206 10% Somewhat approve 642 32% Strongly/Somewhat Disapprove 1166 (Net) 58% Somewhat disapprove 555 28% Strongly disapprove 610 30% Sigma 2013 100%

Page 19 QuickQuery Fielding Period: April 14-17, 2017 HCAPS (Filtered on Registered Voters) Weighted To The U.S. General Adult Population - Propensity 18 Apr 2017 Table 15 Q1903 Regardless of how you may vote, what do you usually consider yourself? Base: All Respondents Total Unweighted Base 2027 Weighted Base 2013 Effective Base 1013 Democrat 731 36% Republican 616 31% Independent 599 30% Other 68 3% Sigma 2013 100%

Page 20 QuickQuery Fielding Period: April 14-17, 2017 HCAPS (Filtered on Registered Voters) Weighted To The U.S. General Adult Population - Propensity 18 Apr 2017 Table 16 Q1905 Would you call yourself a strong Republican or a not-so-strong Republican? Base: Republican Total Unweighted Base 628 Weighted Base 616 Effective Base 326 Strong Republican 346 56% Not-so-strong Republican 270 44% Sigma 616 100%
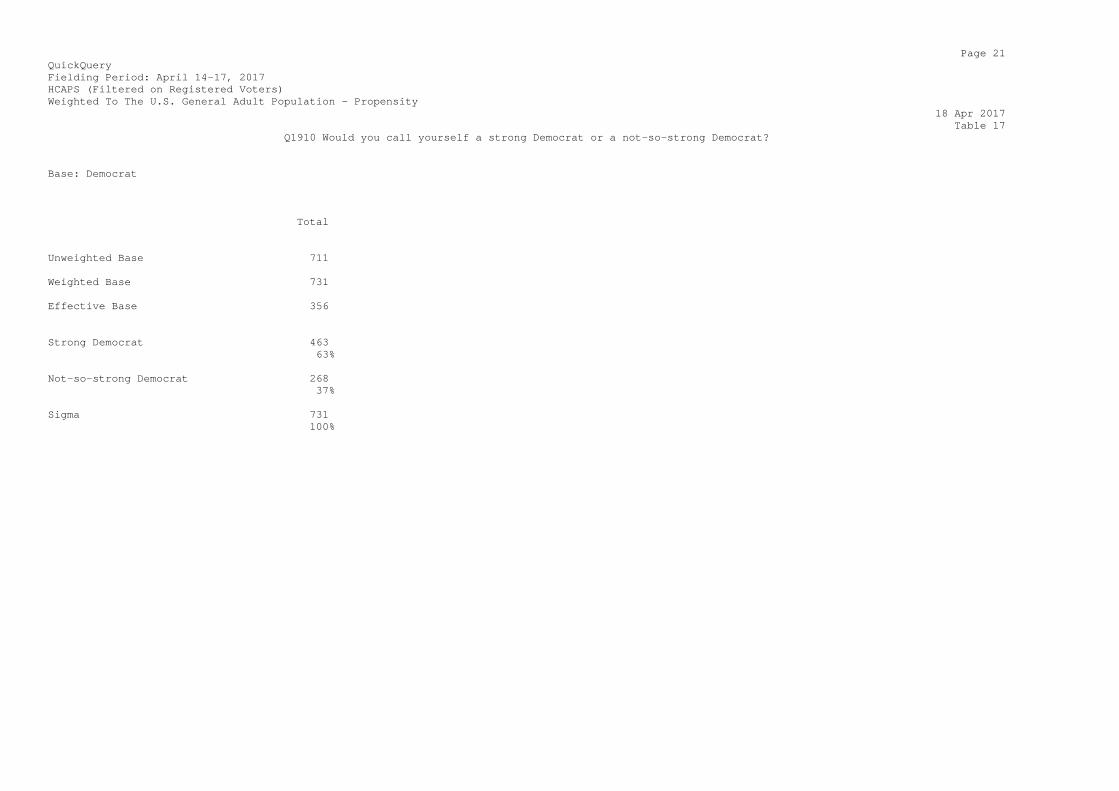
Page 21 QuickQuery Fielding Period: April 14-17, 2017 HCAPS (Filtered on Registered Voters) Weighted To The U.S. General Adult Population - Propensity 18 Apr 2017 Table 17 Q1910 Would you call yourself a strong Democrat or a not-so-strong Democrat? Base: Democrat Total Unweighted Base 711 Weighted Base 731 Effective Base 356 Strong Democrat 463 63% Not-so-strong Democrat 268 37% Sigma 731 100%

Page 22 QuickQuery Fielding Period: April 14-17, 2017 HCAPS (Filtered on Registered Voters) Weighted To The U.S. General Adult Population - Propensity 18 Apr 2017 Table 18 Q1912 Insert text assignment Base: Independent/Other Total Unweighted Base 688 Weighted Base 666 Effective Base 333 Republican/Democratic 339 51% Democratic/Republican 327 49% Sigma 666 100%
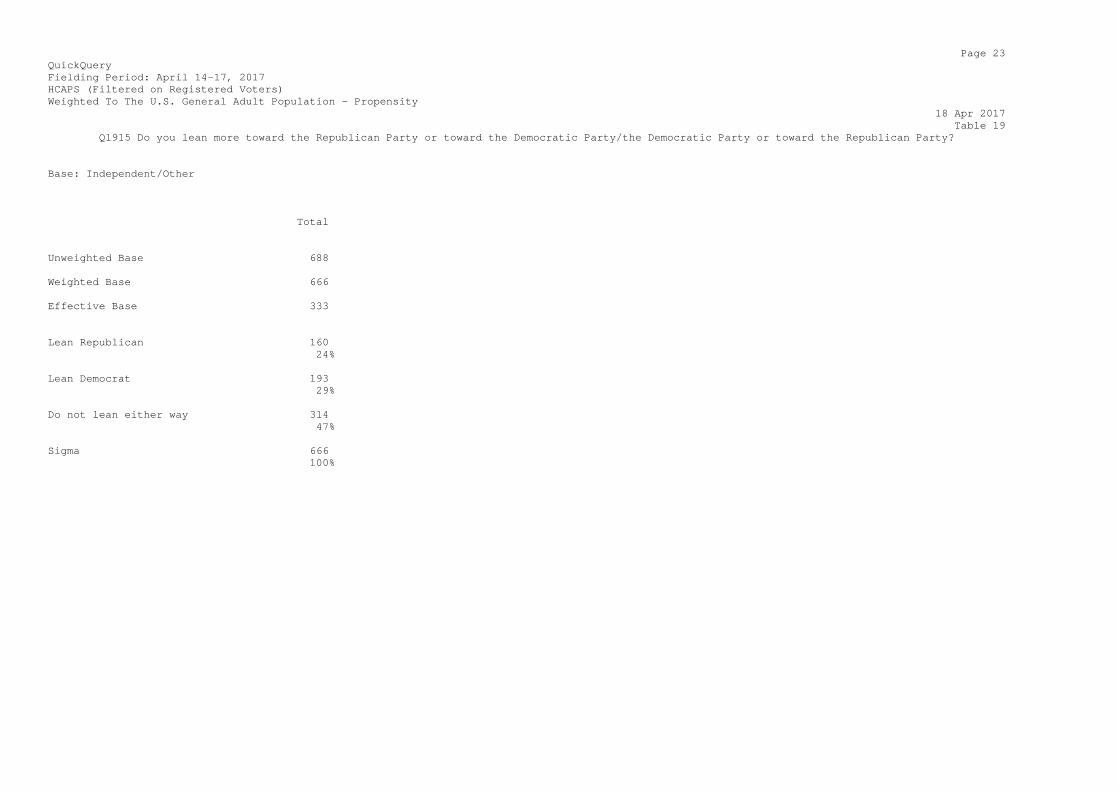
Page 23 QuickQuery Fielding Period: April 14-17, 2017 HCAPS (Filtered on Registered Voters) Weighted To The U.S. General Adult Population - Propensity 18 Apr 2017 Table 19 Q1915 Do you lean more toward the Republican Party or toward the Democratic Party/the Democratic Party or toward the Republican Party? Base: Independent/Other Total Unweighted Base 688 Weighted Base 666 Effective Base 333 Lean Republican 160 24% Lean Democrat 193 29% Do not lean either way 314 47% Sigma 666 100%

Page 24 QuickQuery Fielding Period: April 14-17, 2017 HCAPS (Filtered on Registered Voters) Weighted To The U.S. General Adult Population - Propensity 18 Apr 2017 Table 20 M12 Which best describes your political ideology? Base: All Respondents Total Unweighted Base 2027 Weighted Base 2013 Effective Base 1013 Strong/Lean Liberal (Net) 546 27% Strong liberal 282 14% Lean liberal 264 13% Moderate 890 44% Strong/Lean Conservative 577 (Net) 29% Lean conservative 331 16% Strong conservative 246 12% Sigma 2013 100%

Page 25 QuickQuery Fielding Period: April 14-17, 2017 HCAPS (Filtered on Registered Voters) Weighted To The U.S. General Adult Population - Propensity 18 Apr 2017 Table 21 M13 Do you think of yourself as fiscally liberal or conservative? Base: All Respondents Total Unweighted Base 2027 Weighted Base 2013 Effective Base 1013 Fiscally conservative 944 47% Fiscally liberal 370 18% Do not lean one way or the 699 other 35% Sigma 2013 100%

Page 26 QuickQuery Fielding Period: April 14-17, 2017 HCAPS (Filtered on Registered Voters) Weighted To The U.S. General Adult Population - Propensity 18 Apr 2017 Table 22 M14 Do you think of yourself as socially liberal or conservative? Base: All Respondents Total Unweighted Base 2027 Weighted Base 2013 Effective Base 1013 Socially liberal 755 37% Socially conservative 681 34% Do not lean one way or the 577 other 29% Sigma 2013 100%

Page 27 QuickQuery Fielding Period: April 14-17, 2017 HCAPS (Filtered on Registered Voters) Weighted To The U.S. General Adult Population - Propensity 18 Apr 2017 Table 23 F1 Now we will show you some names. Please indicate if you have a favorable or unfavorable view of that person - or if you've never heard of them. Summary Of Ever Heard Of Base: All Respondents Total Unweighted Base 2027 Weighted Base 2013 Effective Base 1013 Donald Trump 1911 95% Hillary Clinton 1903 95% Bernie Sanders 1788 89% Mike Pence 1712 85% Paul Ryan 1641 82% Nancy Pelosi 1583 79% Elizabeth Warren 1416 70% Kellyanne Conway 1415 70% Mitch McConnell 1300 65% Chuck Schumer 1263 63% Neil Gorsuch 1258 63%

Stephen Bannon 1235 61% Rex Tillerson 1181 59% Jared Kushner 1140 57% Jim Comey 1084 54% H. R. Macmaster 656 33%

Page 28 QuickQuery Fielding Period: April 14-17, 2017 HCAPS (Filtered on Registered Voters) Weighted To The U.S. General Adult Population - Propensity 18 Apr 2017 Table 24 F1 Now we will show you some names. Please indicate if you have a favorable or unfavorable view of that person - or if you've never heard of them. Summary Of Very Favorable/Favorable Base: All Respondents Total Unweighted Base 2027 Weighted Base 2013 Effective Base 1013 Bernie Sanders 1140 57% Mike Pence 888 44% Donald Trump 886 44% Hillary Clinton 839 42% Elizabeth Warren 772 38% Paul Ryan 688 34% Neil Gorsuch 684 34% Nancy Pelosi 619 31% Chuck Schumer 552 27% Rex Tillerson 549 27% Kellyanne Conway 487 24%

Jared Kushner 465 23% Mitch McConnell 462 23% H. R. Macmaster 399 20% Jim Comey 365 18% Stephen Bannon 332 16%

Page 29 QuickQuery Fielding Period: April 14-17, 2017 HCAPS (Filtered on Registered Voters) Weighted To The U.S. General Adult Population - Propensity 18 Apr 2017 Table 25 F1 Now we will show you some names. Please indicate if you have a favorable or unfavorable view of that person - or if you've never heard of them. Summary Of Very Unfavorable/Unfavorable Base: All Respondents Total Unweighted Base 2027 Weighted Base 2013 Effective Base 1013 Hillary Clinton 1064 53% Donald Trump 1025 51% Nancy Pelosi 963 48% Paul Ryan 953 47% Kellyanne Conway 928 46% Stephen Bannon 903 45% Mitch McConnell 838 42% Mike Pence 825 41% Jim Comey 719 36% Chuck Schumer 711 35% Jared Kushner 675 34%

Bernie Sanders 648 32% Elizabeth Warren 644 32% Rex Tillerson 632 31% Neil Gorsuch 574 29% H. R. Macmaster 257 13%
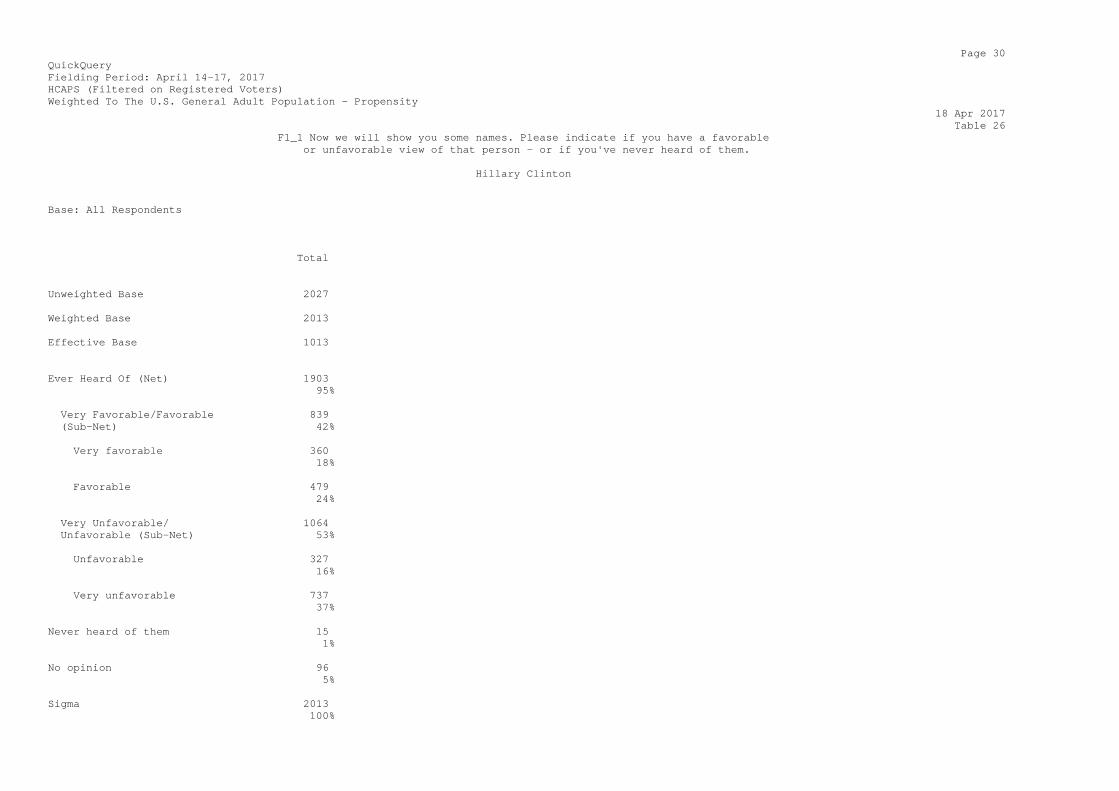
Page 30 QuickQuery Fielding Period: April 14-17, 2017 HCAPS (Filtered on Registered Voters) Weighted To The U.S. General Adult Population - Propensity 18 Apr 2017 Table 26 F1_1 Now we will show you some names. Please indicate if you have a favorable or unfavorable view of that person - or if you've never heard of them. Hillary Clinton Base: All Respondents Total Unweighted Base 2027 Weighted Base 2013 Effective Base 1013 Ever Heard Of (Net) 1903 95% Very Favorable/Favorable 839 (Sub-Net) 42% Very favorable 360 18% Favorable 479 24% Very Unfavorable/ 1064 Unfavorable (Sub-Net) 53% Unfavorable 327 16% Very unfavorable 737 37% Never heard of them 15 1% No opinion 96 5% Sigma 2013 100%

Page 31 QuickQuery Fielding Period: April 14-17, 2017 HCAPS (Filtered on Registered Voters) Weighted To The U.S. General Adult Population - Propensity 18 Apr 2017 Table 27 F1_2 Now we will show you some names. Please indicate if you have a favorable or unfavorable view of that person - or if you've never heard of them. Donald Trump Base: All Respondents Total Unweighted Base 2027 Weighted Base 2013 Effective Base 1013 Ever Heard Of (Net) 1911 95% Very Favorable/Favorable 886 (Sub-Net) 44% Very favorable 433 22% Favorable 453 23% Very Unfavorable/ 1025 Unfavorable (Sub-Net) 51% Unfavorable 216 11% Very unfavorable 809 40% Never heard of them 7 * No opinion 96 5% Sigma 2013 100%

Page 32 QuickQuery Fielding Period: April 14-17, 2017 HCAPS (Filtered on Registered Voters) Weighted To The U.S. General Adult Population - Propensity 18 Apr 2017 Table 28 F1_4 Now we will show you some names. Please indicate if you have a favorable or unfavorable view of that person - or if you've never heard of them. Mike Pence Base: All Respondents Total Unweighted Base 2027 Weighted Base 2013 Effective Base 1013 Ever Heard Of (Net) 1712 85% Very Favorable/Favorable 888 (Sub-Net) 44% Very favorable 426 21% Favorable 462 23% Very Unfavorable/ 825 Unfavorable (Sub-Net) 41% Unfavorable 309 15% Very unfavorable 516 26% Never heard of them 80 4% No opinion 221 11% Sigma 2013 100%

Page 33 QuickQuery Fielding Period: April 14-17, 2017 HCAPS (Filtered on Registered Voters) Weighted To The U.S. General Adult Population - Propensity 18 Apr 2017 Table 29 F1_8 Now we will show you some names. Please indicate if you have a favorable or unfavorable view of that person - or if you've never heard of them. Paul Ryan Base: All Respondents Total Unweighted Base 2027 Weighted Base 2013 Effective Base 1013 Ever Heard Of (Net) 1641 82% Very Favorable/Favorable 688 (Sub-Net) 34% Very favorable 181 9% Favorable 507 25% Very Unfavorable/ 953 Unfavorable (Sub-Net) 47% Unfavorable 444 22% Very unfavorable 509 25% Never heard of them 100 5% No opinion 272 14% Sigma 2013 100%

Page 34 QuickQuery Fielding Period: April 14-17, 2017 HCAPS (Filtered on Registered Voters) Weighted To The U.S. General Adult Population - Propensity 18 Apr 2017 Table 30 F1_9 Now we will show you some names. Please indicate if you have a favorable or unfavorable view of that person - or if you've never heard of them. Nancy Pelosi Base: All Respondents Total Unweighted Base 2027 Weighted Base 2013 Effective Base 1013 Ever Heard Of (Net) 1583 79% Very Favorable/Favorable 619 (Sub-Net) 31% Very favorable 183 9% Favorable 437 22% Very Unfavorable/ 963 Unfavorable (Sub-Net) 48% Unfavorable 340 17% Very unfavorable 623 31% Never heard of them 122 6% No opinion 309 15% Sigma 2013 100%

Page 35 QuickQuery Fielding Period: April 14-17, 2017 HCAPS (Filtered on Registered Voters) Weighted To The U.S. General Adult Population - Propensity 18 Apr 2017 Table 31 F1_10 Now we will show you some names. Please indicate if you have a favorable or unfavorable view of that person - or if you've never heard of them. Mitch McConnell Base: All Respondents Total Unweighted Base 2027 Weighted Base 2013 Effective Base 1013 Ever Heard Of (Net) 1300 65% Very Favorable/Favorable 462 (Sub-Net) 23% Very favorable 75 4% Favorable 387 19% Very Unfavorable/ 838 Unfavorable (Sub-Net) 42% Unfavorable 313 16% Very unfavorable 524 26% Never heard of them 304 15% No opinion 410 20% Sigma 2013 100%

Page 36 QuickQuery Fielding Period: April 14-17, 2017 HCAPS (Filtered on Registered Voters) Weighted To The U.S. General Adult Population - Propensity 18 Apr 2017 Table 32 F1_11 Now we will show you some names. Please indicate if you have a favorable or unfavorable view of that person - or if you've never heard of them. Chuck Schumer Base: All Respondents Total Unweighted Base 2027 Weighted Base 2013 Effective Base 1013 Ever Heard Of (Net) 1263 63% Very Favorable/Favorable 552 (Sub-Net) 27% Very favorable 174 9% Favorable 378 19% Very Unfavorable/ 711 Unfavorable (Sub-Net) 35% Unfavorable 321 16% Very unfavorable 389 19% Never heard of them 317 16% No opinion 433 22% Sigma 2013 100%

Page 37 QuickQuery Fielding Period: April 14-17, 2017 HCAPS (Filtered on Registered Voters) Weighted To The U.S. General Adult Population - Propensity 18 Apr 2017 Table 33 F1_12 Now we will show you some names. Please indicate if you have a favorable or unfavorable view of that person - or if you've never heard of them. Bernie Sanders Base: All Respondents Total Unweighted Base 2027 Weighted Base 2013 Effective Base 1013 Ever Heard Of (Net) 1788 89% Very Favorable/Favorable 1140 (Sub-Net) 57% Very favorable 487 24% Favorable 653 32% Very Unfavorable/ 648 Unfavorable (Sub-Net) 32% Unfavorable 306 15% Very unfavorable 342 17% Never heard of them 23 1% No opinion 202 10% Sigma 2013 100%

Page 38 QuickQuery Fielding Period: April 14-17, 2017 HCAPS (Filtered on Registered Voters) Weighted To The U.S. General Adult Population - Propensity 18 Apr 2017 Table 34 F1_13 Now we will show you some names. Please indicate if you have a favorable or unfavorable view of that person - or if you've never heard of them. Elizabeth Warren Base: All Respondents Total Unweighted Base 2027 Weighted Base 2013 Effective Base 1013 Ever Heard Of (Net) 1416 70% Very Favorable/Favorable 772 (Sub-Net) 38% Very favorable 342 17% Favorable 430 21% Very Unfavorable/ 644 Unfavorable (Sub-Net) 32% Unfavorable 223 11% Very unfavorable 421 21% Never heard of them 220 11% No opinion 377 19% Sigma 2013 100%
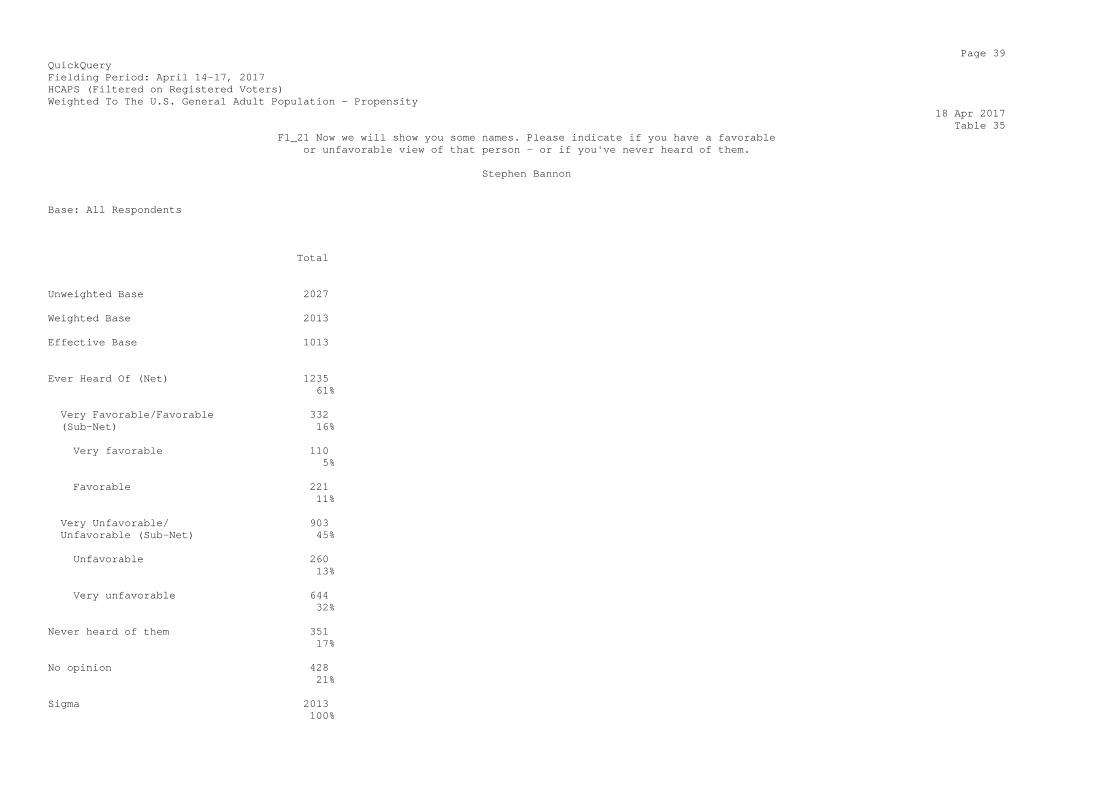
Page 39 QuickQuery Fielding Period: April 14-17, 2017 HCAPS (Filtered on Registered Voters) Weighted To The U.S. General Adult Population - Propensity 18 Apr 2017 Table 35 F1_21 Now we will show you some names. Please indicate if you have a favorable or unfavorable view of that person - or if you've never heard of them. Stephen Bannon Base: All Respondents Total Unweighted Base 2027 Weighted Base 2013 Effective Base 1013 Ever Heard Of (Net) 1235 61% Very Favorable/Favorable 332 (Sub-Net) 16% Very favorable 110 5% Favorable 221 11% Very Unfavorable/ 903 Unfavorable (Sub-Net) 45% Unfavorable 260 13% Very unfavorable 644 32% Never heard of them 351 17% No opinion 428 21% Sigma 2013 100%

Page 40 QuickQuery Fielding Period: April 14-17, 2017 HCAPS (Filtered on Registered Voters) Weighted To The U.S. General Adult Population - Propensity 18 Apr 2017 Table 36 F1_22 Now we will show you some names. Please indicate if you have a favorable or unfavorable view of that person - or if you've never heard of them. Kellyanne Conway Base: All Respondents Total Unweighted Base 2027 Weighted Base 2013 Effective Base 1013 Ever Heard Of (Net) 1415 70% Very Favorable/Favorable 487 (Sub-Net) 24% Very favorable 166 8% Favorable 321 16% Very Unfavorable/ 928 Unfavorable (Sub-Net) 46% Unfavorable 269 13% Very unfavorable 659 33% Never heard of them 276 14% No opinion 323 16% Sigma 2013 100%
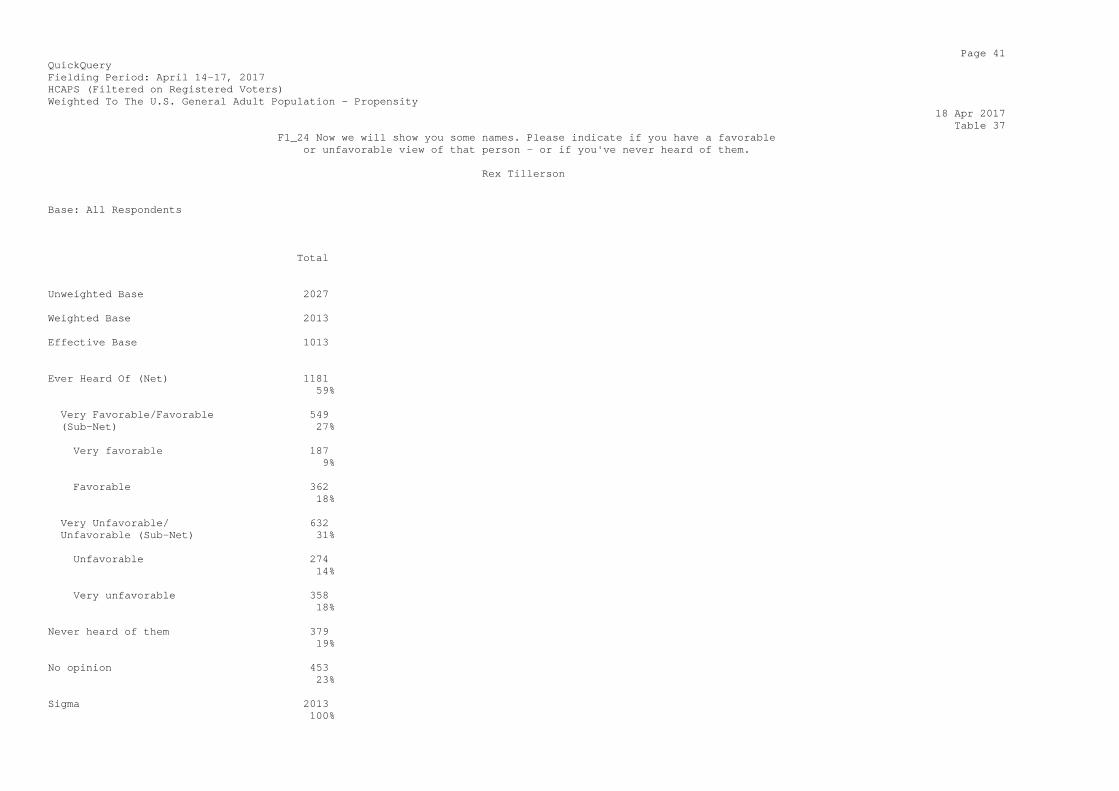
Page 41 QuickQuery Fielding Period: April 14-17, 2017 HCAPS (Filtered on Registered Voters) Weighted To The U.S. General Adult Population - Propensity 18 Apr 2017 Table 37 F1_24 Now we will show you some names. Please indicate if you have a favorable or unfavorable view of that person - or if you've never heard of them. Rex Tillerson Base: All Respondents Total Unweighted Base 2027 Weighted Base 2013 Effective Base 1013 Ever Heard Of (Net) 1181 59% Very Favorable/Favorable 549 (Sub-Net) 27% Very favorable 187 9% Favorable 362 18% Very Unfavorable/ 632 Unfavorable (Sub-Net) 31% Unfavorable 274 14% Very unfavorable 358 18% Never heard of them 379 19% No opinion 453 23% Sigma 2013 100%

Page 42 QuickQuery Fielding Period: April 14-17, 2017 HCAPS (Filtered on Registered Voters) Weighted To The U.S. General Adult Population - Propensity 18 Apr 2017 Table 38 F1_25 Now we will show you some names. Please indicate if you have a favorable or unfavorable view of that person - or if you've never heard of them. Jim Comey Base: All Respondents Total Unweighted Base 2027 Weighted Base 2013 Effective Base 1013 Ever Heard Of (Net) 1084 54% Very Favorable/Favorable 365 (Sub-Net) 18% Very favorable 74 4% Favorable 292 14% Very Unfavorable/ 719 Unfavorable (Sub-Net) 36% Unfavorable 448 22% Very unfavorable 271 13% Never heard of them 421 21% No opinion 508 25% Sigma 2013 100%

Page 43 QuickQuery Fielding Period: April 14-17, 2017 HCAPS (Filtered on Registered Voters) Weighted To The U.S. General Adult Population - Propensity 18 Apr 2017 Table 39 F1_26 Now we will show you some names. Please indicate if you have a favorable or unfavorable view of that person - or if you've never heard of them. Jared Kushner Base: All Respondents Total Unweighted Base 2027 Weighted Base 2013 Effective Base 1013 Ever Heard Of (Net) 1140 57% Very Favorable/Favorable 465 (Sub-Net) 23% Very favorable 104 5% Favorable 361 18% Very Unfavorable/ 675 Unfavorable (Sub-Net) 34% Unfavorable 329 16% Very unfavorable 347 17% Never heard of them 392 19% No opinion 481 24% Sigma 2013 100%

Page 44 QuickQuery Fielding Period: April 14-17, 2017 HCAPS (Filtered on Registered Voters) Weighted To The U.S. General Adult Population - Propensity 18 Apr 2017 Table 40 F1_27 Now we will show you some names. Please indicate if you have a favorable or unfavorable view of that person - or if you've never heard of them. H. R. Macmaster Base: All Respondents Total Unweighted Base 2027 Weighted Base 2013 Effective Base 1013 Ever Heard Of (Net) 656 33% Very Favorable/Favorable 399 (Sub-Net) 20% Very favorable 128 6% Favorable 271 13% Very Unfavorable/ 257 Unfavorable (Sub-Net) 13% Unfavorable 138 7% Very unfavorable 119 6% Never heard of them 790 39% No opinion 567 28% Sigma 2013 100%

Page 45 QuickQuery Fielding Period: April 14-17, 2017 HCAPS (Filtered on Registered Voters) Weighted To The U.S. General Adult Population - Propensity 18 Apr 2017 Table 41 F1_28 Now we will show you some names. Please indicate if you have a favorable or unfavorable view of that person - or if you've never heard of them. Neil Gorsuch Base: All Respondents Total Unweighted Base 2027 Weighted Base 2013 Effective Base 1013 Ever Heard Of (Net) 1258 63% Very Favorable/Favorable 684 (Sub-Net) 34% Very favorable 339 17% Favorable 345 17% Very Unfavorable/ 574 Unfavorable (Sub-Net) 29% Unfavorable 273 14% Very unfavorable 301 15% Never heard of them 319 16% No opinion 436 22% Sigma 2013 100%

Page 316 QuickQuery Fielding Period: April 14-17, 2017 HCAPS (Filtered on Registered Voters) Weighted To The U.S. General Adult Population - Propensity 18 Apr 2017 Table 311 Q398_1 Next, we have a few employment and economic questions. Are you employed full time for pay with an organization or company? Base: Ask Sequential Employment Total Unweighted Base 2027 Weighted Base 2013 Effective Base 1013 Yes 870 43% No 1143 57% Sigma 2013 100%

Page 317 QuickQuery Fielding Period: April 14-17, 2017 HCAPS (Filtered on Registered Voters) Weighted To The U.S. General Adult Population - Propensity 18 Apr 2017 Table 312 Q398_2 Next, we have a few employment and economic questions. Are you employed part time for pay with an organization or company? Base: Ask Sequential Employment Total Unweighted Base 2027 Weighted Base 2013 Effective Base 1013 Yes 330 16% No 1683 84% Sigma 2013 100%

Page 318 QuickQuery Fielding Period: April 14-17, 2017 HCAPS (Filtered on Registered Voters) Weighted To The U.S. General Adult Population - Propensity 18 Apr 2017 Table 313 Q398_3 Next, we have a few employment and economic questions. Are you self-employed full time? Base: Ask Sequential Employment Total Unweighted Base 2027 Weighted Base 2013 Effective Base 1013 Yes 165 8% No 1848 92% Sigma 2013 100%

Page 319 QuickQuery Fielding Period: April 14-17, 2017 HCAPS (Filtered on Registered Voters) Weighted To The U.S. General Adult Population - Propensity 18 Apr 2017 Table 314 Q398_4 Next, we have a few employment and economic questions. Are you self-employed part time? Base: Ask Sequential Employment Total Unweighted Base 2027 Weighted Base 2013 Effective Base 1013 Yes 199 10% No 1815 90% Sigma 2013 100%
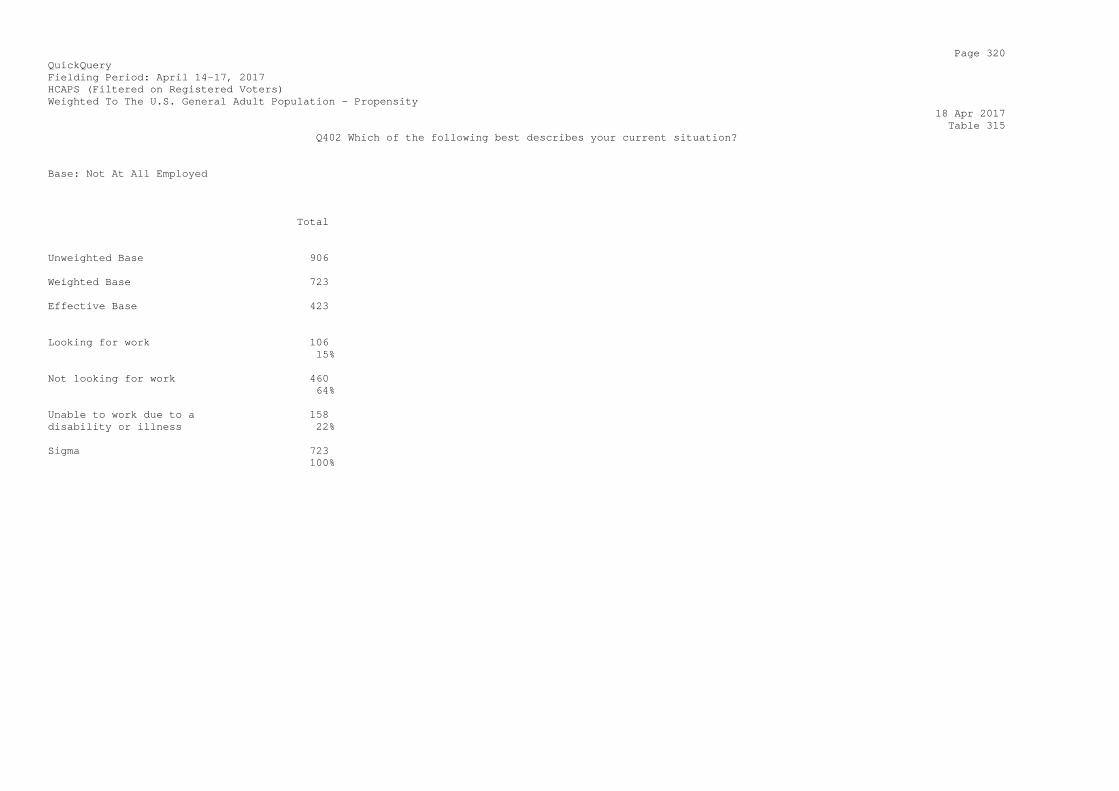
Page 320 QuickQuery Fielding Period: April 14-17, 2017 HCAPS (Filtered on Registered Voters) Weighted To The U.S. General Adult Population - Propensity 18 Apr 2017 Table 315 Q402 Which of the following best describes your current situation? Base: Not At All Employed Total Unweighted Base 906 Weighted Base 723 Effective Base 423 Looking for work 106 15% Not looking for work 460 64% Unable to work due to a 158 disability or illness 22% Sigma 723 100%

Page 321 QuickQuery Fielding Period: April 14-17, 2017 HCAPS (Filtered on Registered Voters) Weighted To The U.S. General Adult Population - Propensity 18 Apr 2017 Table 316 Q404 Do any of the following describe you? Base: Ask Sequential Employment Total Unweighted Base 2027 Weighted Base 2013 Effective Base 1013 Retired and collecting 482 retirement benefits/pension 24% A stay-at-home spouse or 215 partner 11% A student 155 8% None of these 1193 59% Sigma 2045 102%

Page 322 QuickQuery Fielding Period: April 14-17, 2017 HCAPS (Filtered on Registered Voters) Weighted To The U.S. General Adult Population - Propensity 18 Apr 2017 Table 317 Q406 What is your employment status? Base: All Respondents Total Unweighted Base 2027 Weighted Base 2013 Effective Base 1013 Employed full time 974 48% Employed part time 458 23% Self-employed full time 165 8% Not employed, but looking 106 for work 5% Not employed and not looking 460 for work 23% Not employed, unable to work 158 due to a disability or 8% illness Retired 482 24% Student 155 8% Stay-at-home spouse or 215 partner 11% Self-employed part time 199 10% Sigma 3370 167%

Page 323 QuickQuery Fielding Period: April 14-17, 2017 HCAPS (Filtered on Registered Voters) Weighted To The U.S. General Adult Population - Propensity 18 Apr 2017 Table 318 Q410 Which one of the following best describes your employment status? Base: 18 Years Old Or Older And (Single Employment Item Selected And More Than 1 Valid Code From Q406) Total Unweighted Base 2027 Weighted Base 2013 Effective Base 1013 Employed full time 860 43% Employed part time 207 10% Self-employed full time 80 4% Not employed, but looking 81 for work 4% Not employed and not looking 37 for work 2% Not employed, unable to work 110 due to a disability or 5% illness Retired 393 20% Student 65 3% Stay-at-home spouse or 99 partner 5% Self-employed part time 81 4% Sigma 2013 100%

Page 324 QuickQuery Fielding Period: April 14-17, 2017 HCAPS (Filtered on Registered Voters) Weighted To The U.S. General Adult Population - Propensity 18 Apr 2017 Table 319 D5 The organization you work for is in which of the following: Base: Employed FT/PT Total Unweighted Base 930 Weighted Base 1067 Effective Base 508 Public sector 367 34% Private sector 535 50% Not-for-profit 82 8% Other 15 1% Don't know 68 6% Sigma 1067 100%
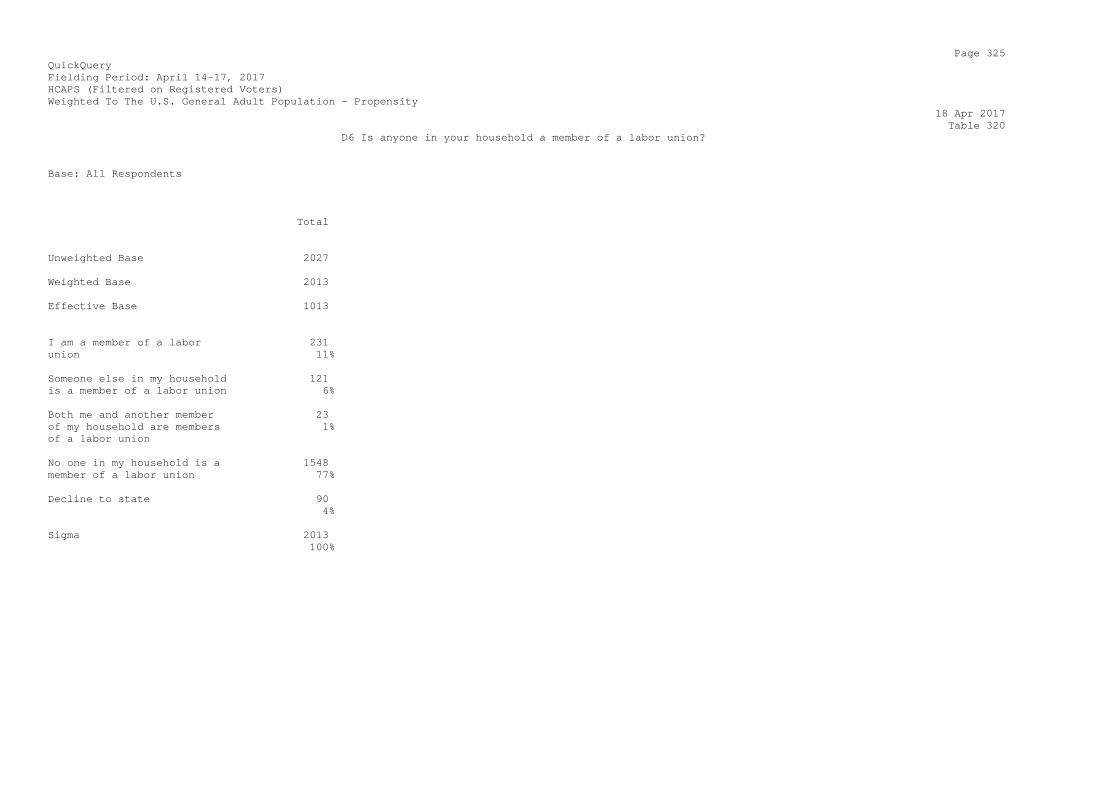
Page 325 QuickQuery Fielding Period: April 14-17, 2017 HCAPS (Filtered on Registered Voters) Weighted To The U.S. General Adult Population - Propensity 18 Apr 2017 Table 320 D6 Is anyone in your household a member of a labor union? Base: All Respondents Total Unweighted Base 2027 Weighted Base 2013 Effective Base 1013 I am a member of a labor 231 union 11% Someone else in my household 121 is a member of a labor union 6% Both me and another member 23 of my household are members 1% of a labor union No one in my household is a 1548 member of a labor union 77% Decline to state 90 4% Sigma 2013 100%
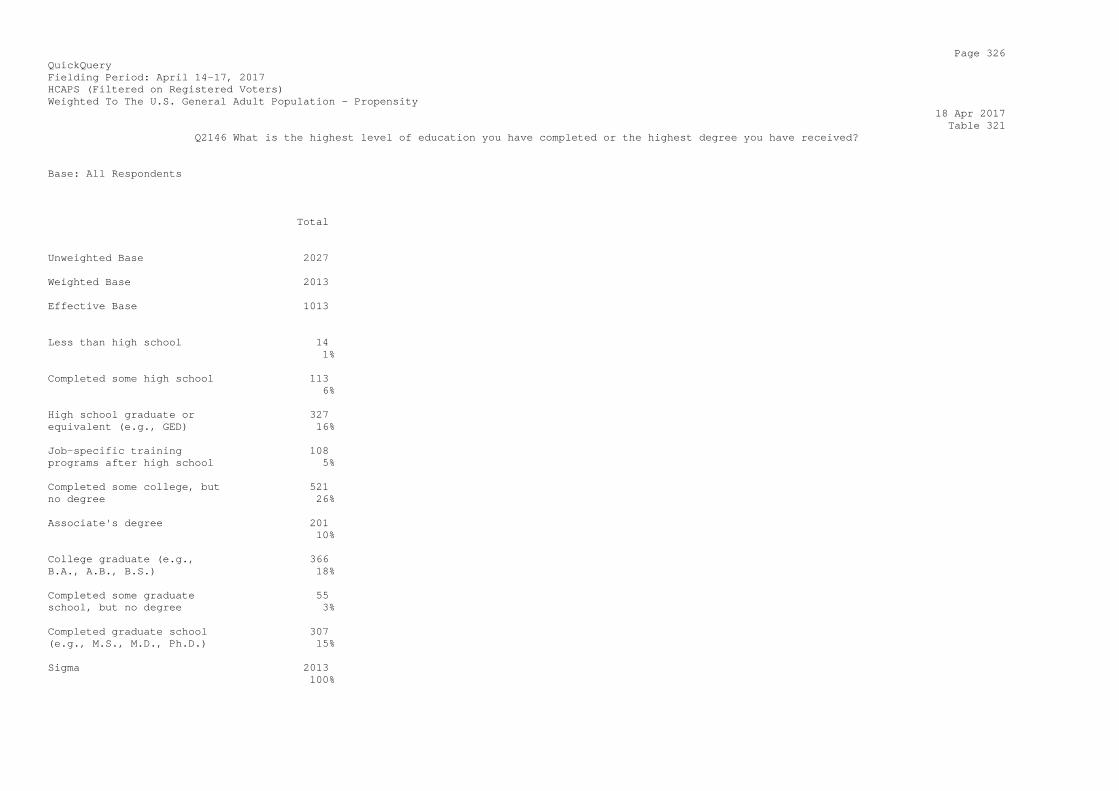
Page 326 QuickQuery Fielding Period: April 14-17, 2017 HCAPS (Filtered on Registered Voters) Weighted To The U.S. General Adult Population - Propensity 18 Apr 2017 Table 321 Q2146 What is the highest level of education you have completed or the highest degree you have received? Base: All Respondents Total Unweighted Base 2027 Weighted Base 2013 Effective Base 1013 Less than high school 14 1% Completed some high school 113 6% High school graduate or 327 equivalent (e.g., GED) 16% Job-specific training 108 programs after high school 5% Completed some college, but 521 no degree 26% Associate's degree 201 10% College graduate (e.g., 366 B.A., A.B., B.S.) 18% Completed some graduate 55 school, but no degree 3% Completed graduate school 307 (e.g., M.S., M.D., Ph.D.) 15% Sigma 2013 100%

Page 327 QuickQuery Fielding Period: April 14-17, 2017 HCAPS (Filtered on Registered Voters) Weighted To The U.S. General Adult Population - Propensity 18 Apr 2017 Table 322 Q2135 What is your marital status? Base: All Respondents Total Unweighted Base 2027 Weighted Base 2013 Effective Base 1013 Married or civil union 1039 52% Single, never married 523 26% Divorced 255 13% Separated 32 2% Widowed/Widower 101 5% Living with partner 63 3% Sigma 2013 100%

Page 328 QuickQuery Fielding Period: April 14-17, 2017 HCAPS (Filtered on Registered Voters) Weighted To The U.S. General Adult Population - Propensity 18 Apr 2017 Table 323 D9 How many children live in your household? Base: All Respondents Total Unweighted Base 2027 Weighted Base 2013 Effective Base 1013 None 1227 61% One 323 16% Two 291 14% Three 122 6% Four or more 50 2% Sigma 2013 100%
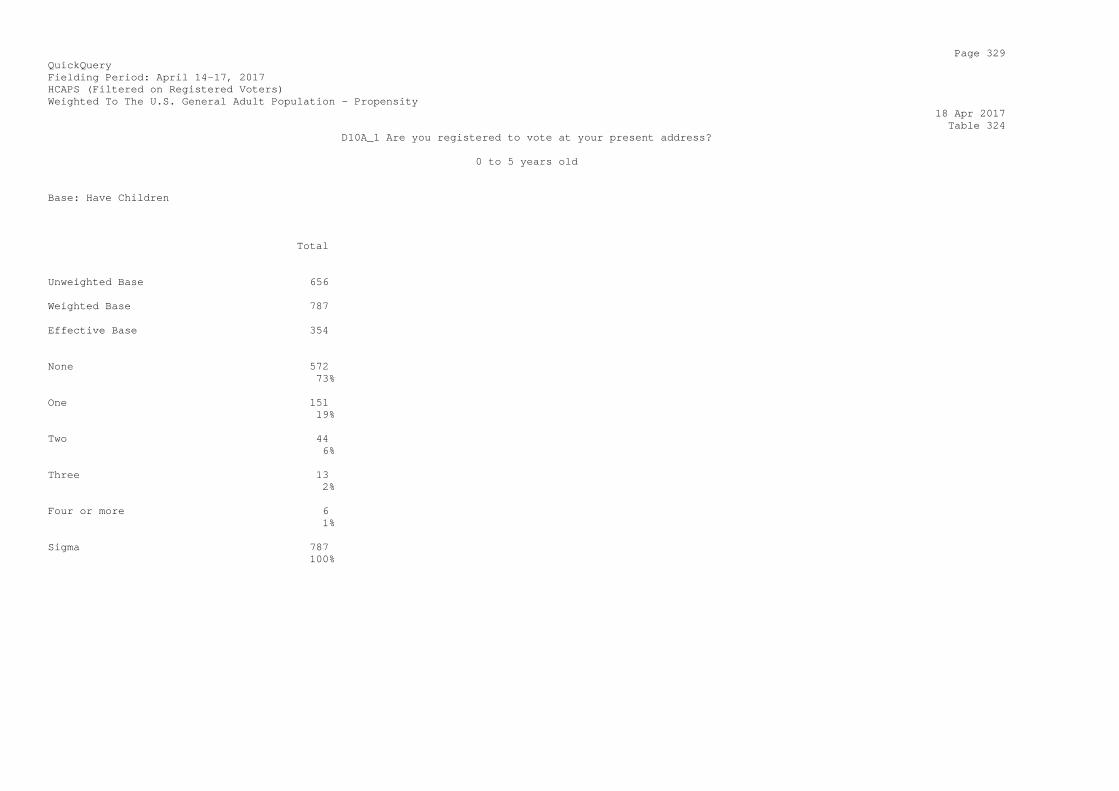
Page 329 QuickQuery Fielding Period: April 14-17, 2017 HCAPS (Filtered on Registered Voters) Weighted To The U.S. General Adult Population - Propensity 18 Apr 2017 Table 324 D10A_1 Are you registered to vote at your present address? 0 to 5 years old Base: Have Children Total Unweighted Base 656 Weighted Base 787 Effective Base 354 None 572 73% One 151 19% Two 44 6% Three 13 2% Four or more 6 1% Sigma 787 100%

Page 330 QuickQuery Fielding Period: April 14-17, 2017 HCAPS (Filtered on Registered Voters) Weighted To The U.S. General Adult Population - Propensity 18 Apr 2017 Table 325 D10A_2 Are you registered to vote at your present address? 6 to 9 years old Base: Have Children Total Unweighted Base 656 Weighted Base 787 Effective Base 354 None 554 70% One 183 23% Two 46 6% Three 3 * Four or more - - Sigma 787 100%

Page 331 QuickQuery Fielding Period: April 14-17, 2017 HCAPS (Filtered on Registered Voters) Weighted To The U.S. General Adult Population - Propensity 18 Apr 2017 Table 326 D10A_3 Are you registered to vote at your present address? 10 to 13 years old Base: Have Children Total Unweighted Base 656 Weighted Base 787 Effective Base 354 None 517 66% One 203 26% Two 52 7% Three 12 2% Four or more 3 * Sigma 787 100%

Page 332 QuickQuery Fielding Period: April 14-17, 2017 HCAPS (Filtered on Registered Voters) Weighted To The U.S. General Adult Population - Propensity 18 Apr 2017 Table 327 D10A_4 Are you registered to vote at your present address? 14 to 17 years old Base: Have Children Total Unweighted Base 656 Weighted Base 787 Effective Base 354 None 483 61% One 200 25% Two 74 9% Three 17 2% Four or more 12 1% Sigma 787 100%

Page 333 QuickQuery Fielding Period: April 14-17, 2017 HCAPS (Filtered on Registered Voters) Weighted To The U.S. General Adult Population - Propensity 18 Apr 2017 Table 328 S3 Some people had the chance to vote in this year's presidential election on November 8, 2016. Others did not. Did you vote in November's presidential election? Base: All Respondents Total Unweighted Base 2027 Weighted Base 2013 Effective Base 1013 Yes 1739 86% No 275 14% Sigma 2013 100%

Page 334 QuickQuery Fielding Period: April 14-17, 2017 HCAPS (Filtered on Registered Voters) Weighted To The U.S. General Adult Population - Propensity 18 Apr 2017 Table 329 S4 Confidentially and for statistical purposes only which candidate did you vote for in the presidential election on Nov. 8, 2016? Base: Voted In Presidential Election Total Unweighted Base 1782 Weighted Base 1739 Effective Base 902 Hillary Clinton 770 44% Donald Trump 724 42% Gary Johnson 86 5% Jill Stein 30 2% Other 54 3% Prefer not to answer 74 4% Sigma 1739 100%

Page 335 QuickQuery Fielding Period: April 14-17, 2017 HCAPS (Filtered on Registered Voters) Weighted To The U.S. General Adult Population - Propensity 18 Apr 2017 Table 330 D10 Are you registered to vote at your present address? Base: All Respondents Total Unweighted Base 2027 Weighted Base 2013 Effective Base 1013 Yes 1843 92% No 127 6% Not Sure 43 2% Sigma 2013 100%

Page 336 QuickQuery Fielding Period: April 14-17, 2017 HCAPS (Filtered on Registered Voters) Weighted To The U.S. General Adult Population - Propensity 18 Apr 2017 Table 331 D11 What is your religion? Base: All Respondents Total Unweighted Base 2027 Weighted Base 2013 Effective Base 1013 Evangelical Protestant 196 10% Non-Evangelical Protestant 210 10% Roman Catholic 491 24% Mormon 23 1% Other Christian 425 21% Jewish 81 4% Muslim 14 1% Hindu 6 * Buddhist 23 1% Atheist/Agnostic 291 14% Other 253 13% Sigma 2013 100%


Page 337 QuickQuery Fielding Period: April 14-17, 2017 HCAPS (Filtered on Registered Voters) Weighted To The U.S. General Adult Population - Propensity 18 Apr 2017 Table 332 D12 How often do you attend religion services, events, or gatherings? Base: All Respondents Total Unweighted Base 2027 Weighted Base 2013 Effective Base 1013 Daily 67 3% Weekly 477 24% A few times per month 191 10% Once a month 166 8% Almost never 1112 55% Sigma 2013 100%

Page 338 QuickQuery Fielding Period: April 14-17, 2017 HCAPS (Filtered on Registered Voters) Weighted To The U.S. General Adult Population - Propensity 18 Apr 2017 Table 333 D13 How important or unimportant is religion in your life? Base: All Respondents Total Unweighted Base 2027 Weighted Base 2013 Effective Base 1013 Very/Somewhat Important 1338 (Net) 66% Very important 717 36% Somewhat important 622 31% Very/Somewhat Unimportant 675 (Net) 34% Somewhat unimportant 245 12% Very unimportant 429 21% Sigma 2013 100%

Page 339 QuickQuery Fielding Period: April 14-17, 2017 HCAPS (Filtered on Registered Voters) Weighted To The U.S. General Adult Population - Propensity 18 Apr 2017 Table 334 D14 Does anyone in your household own a gun? Base: All Respondents Total Unweighted Base 2027 Weighted Base 2013 Effective Base 1013 Yes 697 35% No 1316 65% Sigma 2013 100%

Page 340 QuickQuery Fielding Period: April 14-17, 2017 HCAPS (Filtered on Registered Voters) Weighted To The U.S. General Adult Population - Propensity 18 Apr 2017 Table 335 Q2145 Which of the following best describes your current primary residence? I/We live in... Base: All Respondents Total Unweighted Base 2027 Weighted Base 2013 Effective Base 1013 A house that I/we own 1247 62% An apartment or condominium 88 that I/we own 4% Another type of home that I/ 41 we own 2% A house that I/we rent or 290 lease 14% An apartment or condominium 267 that I/we rent or lease 13% Another type of home that I/ 39 we rent or lease 2% None of these 42 2% Sigma 2013 100%

Page 341 QuickQuery Fielding Period: April 14-17, 2017 HCAPS (Filtered on Registered Voters) Weighted To The U.S. General Adult Population - Propensity 18 Apr 2017 Table 336 D18 Are you a Citizen of the United States? Base: All Respondents Total Unweighted Base 2027 Weighted Base 2013 Effective Base 1013 Yes 1989 99% No 24 1% Sigma 2013 100%

Page 342 QuickQuery Fielding Period: April 14-17, 2017 HCAPS (Filtered on Registered Voters) Weighted To The U.S. General Adult Population - Propensity 18 Apr 2017 Table 337 D19 Have any members of your household signed up for health insurance through Healthcare.gov and the Affordable Care Act? Base: All Respondents Total Unweighted Base 2027 Weighted Base 2013 Effective Base 1013 Yes, I have 278 14% Another member of my 118 household has 6% Multiple people in my 54 household have 3% No one in my household has 1483 74% Decline to state 80 4% Sigma 2013 100%

Page 343 QuickQuery Fielding Period: April 14-17, 2017 HCAPS (Filtered on Registered Voters) Weighted To The U.S. General Adult Population - Propensity 18 Apr 2017 Table 338 Q2157 Which of the following income categories best describes your total 2016 household income before taxes? Base: All Respondents Total Unweighted Base 2027 Weighted Base 2013 Effective Base 1013 Less than $15,000 153 8% $15,000 to $24,999 155 8% $25,000 to $34,999 172 9% $35,000 to $49,999 226 11% $50,000 to $74,999 349 17% $75,000 to $99,999 258 13% $100,000 to $124,999 249 12% $125,000 to $149,999 134 7% $150,000 to $199,999 126 6% $200,000 to $249,999 31 2% $250,000 or more 48 2% Decline to answer 113 6%

Sigma 2013 100%