monthly fiscal highlights november 2014 - arizona … · sales tax collections. year-to-date, ......
TRANSCRIPT

JLBC - Monthly Fiscal Highlights November 2014
Summary
Table of Contents
1716 W. Adams Phoenix, AZ 85007 Phone: (602) 926-5491 Fax: (602) 926-5416
www.azleg.gov/jlbc.htm
This report has been prepared for the Arizona Legislature by the Joint Legislative Budget Committee Staff on November 20, 2014.
October marked the 7th consecutive month of revenue collections falling below the enacted budget forecast. October collections were $(7.4) million below the forecast. October General Fund revenues totaled $711.7 million, which represents an increase of 4.8% above October 2013. The growth in October revenues was due almost entirely to Sales Tax collections. Year-to-date, General Fund revenues are 3.6% above the prior year and are $(71.9) million below the enacted budget forecast. In comparison to revenue of $711.7 million, October 2014 spending was $779.4 million which is an increase of $147.4 million from the prior year. Fiscal year-to-date, General Fund revenues of $2.88 billion have been offset by $4.72 billion of expenditures. The state’s fiscal health can also be measured by the operating fund balance. The state pays its bill out of the operating fund balance, which consists of the General Fund and certain dedicated funds. The operating balance as of mid-November 2014 is $1.5 billion. In addition, the state’s Budget Stabilization Fund has a balance of $456.4 million.
“Year-to-date,
General Fund
revenues are
3.6% above
the prior year
and are
$(71.9) million
below the
enacted
budget
forecast.”
Summary History of FY 2008 – FY 2015 Spending ............. 1 Taxation of Electronic Cigarettes ..................... 1 Child Safety Staff Report .................................... 1
October Revenues .................................................. 2
Monthly Indicators .................................................. 4
Summary of Recent Agency Reports ADOA – Motor Vehicle Fleet ............................. 7 Auditor General – DCS Placements ................. 7 DCS – Foster Care Medicaid Report ................ 8 DCS – Semi-Annual Financial Report ............... 8
ACA – Arizona Competes Fund ...................... 8 County Attorneys – Deferred Prosecution ..... 9 ADE – Aggregate Expenditure Limit ................ 9 JLBC Staff – County Flexibility Report .............. 9 JLBC Staff – Employee Relocation Costs ...... 10 Nursing Board – Nursing Assistant Report ..... 10 DPS – Quarterly GIITEM Report ....................... 10 ABOR – Report on Private Leases .................. 10 Veterans’ Services – Capital Projects ........... 11
October Spending ............................................... 12
Tracking Arizona’s Recovery ............. Appendix A
History of FY 2008 – FY 2015 Spending With the potential of new agency budget reductions in the next legislative session, the JLBC Staff has updated the status of agency spending changes between FY 2008 and FY 2015. The original FY 2008 budget is still the high point of appropriated General Fund spending. Overall FY 2015 spending is $(1.1) billion, or (11)%, less than FY 2008. Of the 85 budget units, 64 currently expend less than in FY 2008 while the other 21 have higher budgets. Taxation of Electronic Cigarettes The growth in the use of electronic cigarettes has generated questions to the JLBC Staff about the potential for new revenue collections. In response, we have developed a fiscal impact of e-cigarette taxation. E-cigarettes are currently subject to the sales tax, but not the traditional tobacco tax. An e-cigarette tax could raise as little as $284,000 or as much as $13.5 million in additional revenues. Child Safety Staff Report As of October, DCS had filled 1,408 direct line child safety staff, meeting its funded staff level of 1,406. Since January, the number of case-carrying caseworkers has grown by 30 to 1,013 filled positions. Non-direct line child safety staff have increased from 1,061 in January to 1,270 in October, an increase of 209 filled staff. For a summary of current child safety staff levels, see Table 5 on page 5.
2 JLBC – MONTHLY FISCAL HIGHLIGHTS – NOVEMBER 2014
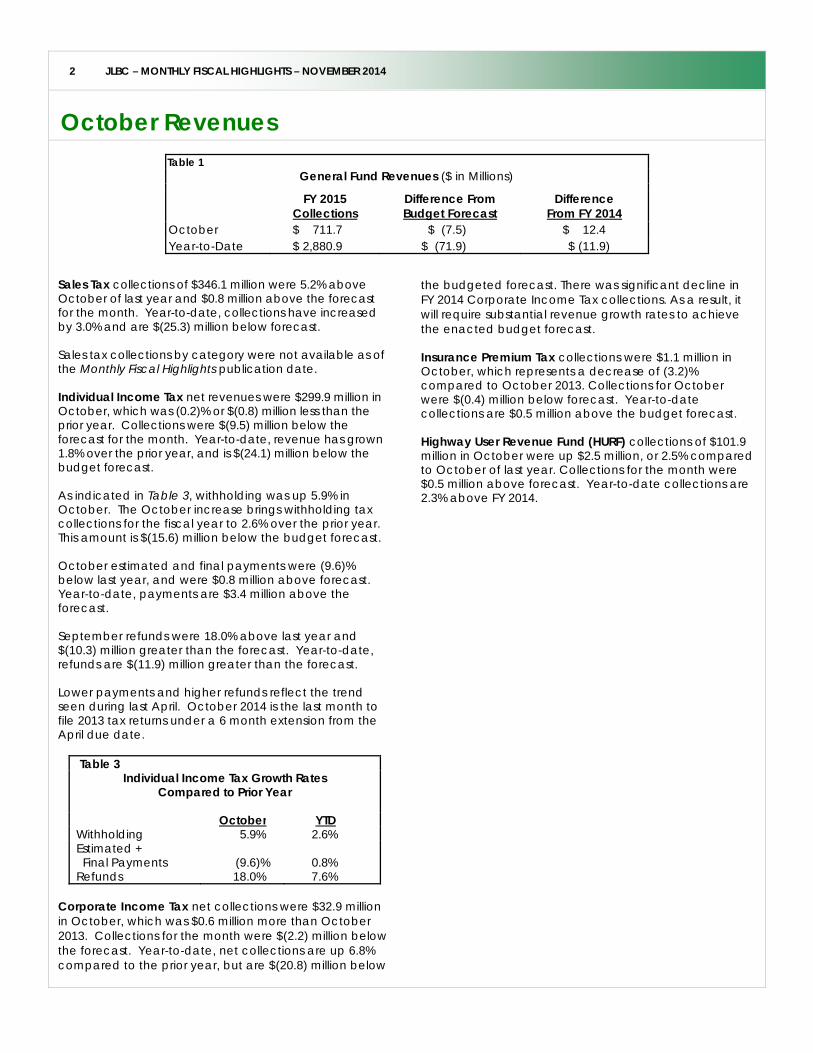
October Revenues Table 1
General Fund Revenues ($ in Millions)
FY 2015 Collections
Difference From Budget Forecast
Difference From FY 2014
October $ 711.7 $ (7.5) $ 12.4 Year-to-Date $ 2,880.9 $ (71.9) $ (11.9)
the budgeted forecast. There was significant decline in FY 2014 Corporate Income Tax collections. As a result, it will require substantial revenue growth rates to achieve the enacted budget forecast. Insurance Premium Tax collections were $1.1 million in October, which represents a decrease of (3.2)% compared to October 2013. Collections for October were $(0.4) million below forecast. Year-to-date collections are $0.5 million above the budget forecast. Highway User Revenue Fund (HURF) collections of $101.9 million in October were up $2.5 million, or 2.5% compared to October of last year. Collections for the month were $0.5 million above forecast. Year-to-date collections are 2.3% above FY 2014.
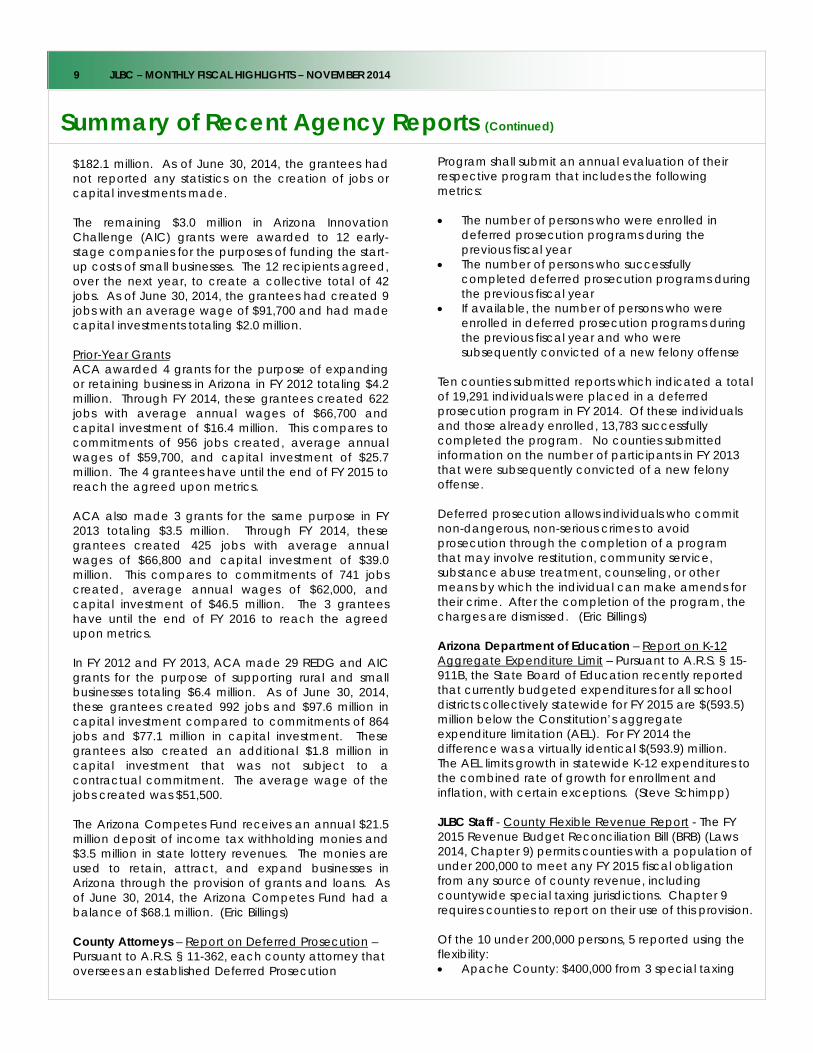
Sales Tax collections of $346.1 million were 5.2% above October of last year and $0.8 million above the forecast for the month. Year-to-date, collections have increased by 3.0% and are $(25.3) million below forecast. Sales tax collections by category were not available as of the Monthly Fiscal Highlights publication date. Individual Income Tax net revenues were $299.9 million in October, which was (0.2)% or $(0.8) million less than the prior year. Collections were $(9.5) million below the forecast for the month. Year-to-date, revenue has grown 1.8% over the prior year, and is $(24.1) million below the budget forecast. As indicated in Table 3, withholding was up 5.9% in October. The October increase brings withholding tax collections for the fiscal year to 2.6% over the prior year. This amount is $(15.6) million below the budget forecast. October estimated and final payments were (9.6)% below last year, and were $0.8 million above forecast. Year-to-date, payments are $3.4 million above the forecast. September refunds were 18.0% above last year and $(10.3) million greater than the forecast. Year-to-date, refunds are $(11.9) million greater than the forecast. Lower payments and higher refunds reflect the trend seen during last April. October 2014 is the last month to file 2013 tax returns under a 6 month extension from the April due date.
Table 3 Individual Income Tax Growth Rates
Compared to Prior Year October YTD Withholding 5.9% 2.6% Estimated + Final Payments (9.6)% 0.8% Refunds 18.0% 7.6%
Corporate Income Tax net collections were $32.9 million in October, which was $0.6 million more than October 2013. Collections for the month were $(2.2) million below the forecast. Year-to-date, net collections are up 6.8% compared to the prior year, but are $(20.8) million below

3
Table 4
General Fund Revenue: Change from Previous Year and Budget Forecast
October 2014
Actual Actual
October 2014 Amount Amount October 2014 Amount Amount
Taxes
Sales and Use $346,093,136 $17,217,436 5.2 % $773,651 0.2 % $1,374,821,945 $40,441,803 3.0 % ($25,347,197) (1.8) %
Income - Individual 299,910,716 (751,487) (0.2) (9,530,340) (3.1) 1,276,118,132 22,515,405 1.8 (24,092,469) (1.9)
- Corporate 32,859,668 593,615 1.8 (2,229,885) (6.4) 177,036,524 11,235,951 6.8 (20,793,813) (10.5)
Property 3,248,273 1,039,935 47.1 1,248,273 62.4 3,543,331 1,084,290 44.1 1,363,331 62.5
Luxury - Tobacco 1,879,128 (213,850) (10.2) (72,667) (3.7) 7,886,211 (1,554,767) (16.5) (334,175) (4.1)
- Liquor 2,825,774 265,044 10.4 46,246 1.7 9,949,297 (14,902) (0.1) (134,735) (1.3)
Insurance Premium 1,058,877 (35,013) (3.2) (375,021) (26.2) 130,121,037 17,059,852 15.1 508,450 0.4
Other Taxes 471,239 60,290 14.7 336,239 249.1 2,033,944 1,501,402 281.9 1,493,944 276.7
Sub-Total Taxes $688,346,810 $18,175,969 2.7 % ($9,803,505) (1.4) % $2,981,510,420 $90,655,858 3.1 % ($67,336,665) (2.2) %
Other Revenue
Lottery 3,639,300 179,775 5.2 (360,700) (9.0) 10,664,600 37,125 0.3 (1,335,400) (11.1)
License, Fees and Permits 3,512,919 1,227,202 53.7 1,012,919 40.5 10,011,121 455,145 4.8 (488,879) (4.7)
Interest 3,211 9,201 -- 3,211 -- 11,659 13,439 -- 11,659 --
Sales and Services 1,527,515 197,831 14.9 27,515 1.8 5,880,519 403,953 7.4 (619,481) (9.5)
Other Miscellaneous (272,845) 869,742 -- (2,272,845) -- 5,966,003 4,026,722 207.6 (2,033,997) (25.4)
Disproport ionate Share 0 0 -- 0 -- 0 0 -- 0 --
Transfers and Reimbursements 11,774,898 11,710,064 -- 3,924,898 50.0 15,960,303 9,882,190 162.6 (139,697) (0.9)
Sub-Total Other Revenue $20,184,998 $14,193,815 236.9 % $2,334,998 13.1 % $48,494,205 $14,818,574 44.0 % ($4,605,795) (8.7) %
TOTAL BASE REVENUE $708,531,808 $32,369,784 4.8 % ($7,468,507) (1.0) % $3,030,004,625 $105,474,432 3.6 % ($71,942,460) (2.3) %
Other Adjustments
Urban Revenue Sharing (50,744,642) (4,035,312) 8.6 0 0.0 (202,978,570) (15,652,017) 8.4 0 0.0
One-Time Transfers 53,900,000 (15,250,414) (22.1) 0 0.0 53,900,000 (96,791,562) (64.2) 0 0.0
Sales Tax - 1¢ Increase 0 (732,474) (100.0) 0 -- 0 (4,893,449) (100.0) 0 --
Sub-Total Other Adjustments 3,155,358 (20,018,200) (86.4) % 0 0.0 % (149,078,570) (117,337,028) 369.7 % 0 (0.0) %
TOTAL GENERAL FUND REVENUE $711,687,166 $12,351,584 1.8 % ($7,468,507) (1.0) % $2,880,926,055 ($11,862,596) (0.4) % ($71,942,460) (2.4) %
Non-General Funds
Highway User Revenue Fund $101,930,644 $2,455,874 2.5 % $466,378 0.5 % $415,759,766 $9,384,837 2.3 % $1,257,339 0.3 %
Current Month FY 2015 YTD (Four Months)
Change From Change from
October 2013 Budget Forecast October 2013 Budget Forecast
Percent Percent Percent Percent

4 JLBC – MONTHLY FISCAL HIGHLIGHTS – NOVEMBER 2014
Monthly Indicators
NATIONAL According to the U.S. Department of Commerce Bureau of Economic Analysis, the U.S. Real Gross Domestic Product (GDP) increased at an annual rate of 3.5% in the third quarter of 2014. This represents a deceleration from growth of 4.6% seen in the second quarter. The slowdown relative to second quarter growth was primarily due to a decrease in inventory investment and a deceleration in consumption, fixed investment, exports and state and local government spending. The prior quarter’s high growth was primarily due to a temporary economic rebound following a harsh winter, The Conference Board’s U.S. Consumer Confidence Index increased by 6.2% in October to a reading that is 30.5% above a year earlier. This was the 5th increase in the last 6 months and undid the sharp losses in confidence recorded in September. The monthly increase may have been the result of falling gas prices and improved job prospects. The Conference Board’s U.S. Leading Economic Index increased by 0.8% in September and 6.3% since September 2013. This month marked the eighth consecutive period in which the index grew or remained unchanged. Of the index’s 10 components, 9 improved while 1 decreased. Movement in interest rates was the largest positive contributor to the index while consumer expectations were the only drag. According to the U.S. Department of Commerce Bureau of Economic Analysis, the U.S. Personal Consumption Expenditure Price Index (PCEPI) increased by 0.1% in September from the prior month while growing 1.4% above September 2013 levels. While the year-over-year growth rate has dipped since reaching 1.7% in May, it is still well above the 1.0% rate in February. The PCEPI is the Federal Reserve Bank’s preferred inflation measure for determining the pace at which monetary stimulus to the economy is reduced. The Bank generally aims to maintain annual inflation of 2% over the medium term. The Federal Reserve ended its purchase of bonds to stimulate the economy in October, but continues to issue short-term loans at nearly 0% interest rates.
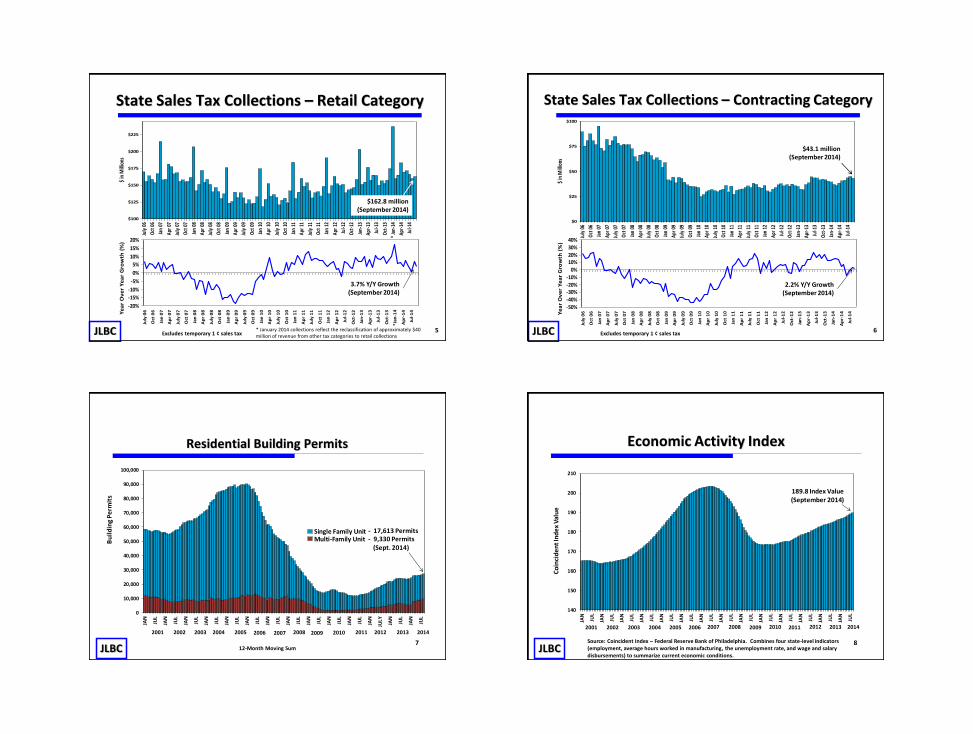
ARIZONA The Federal Reserve Bank of Philadelphia’s coincident index gauges current economic activity in each state. The index combines 4 indicators: employment, average hours worked in manufacturing, unemployment rate, and inflation-adjusted wages. Arizona’s coincident index increased by 2.6% compared to September 2013. Over the same time period, the U.S. coincident index increased by 3.2%.
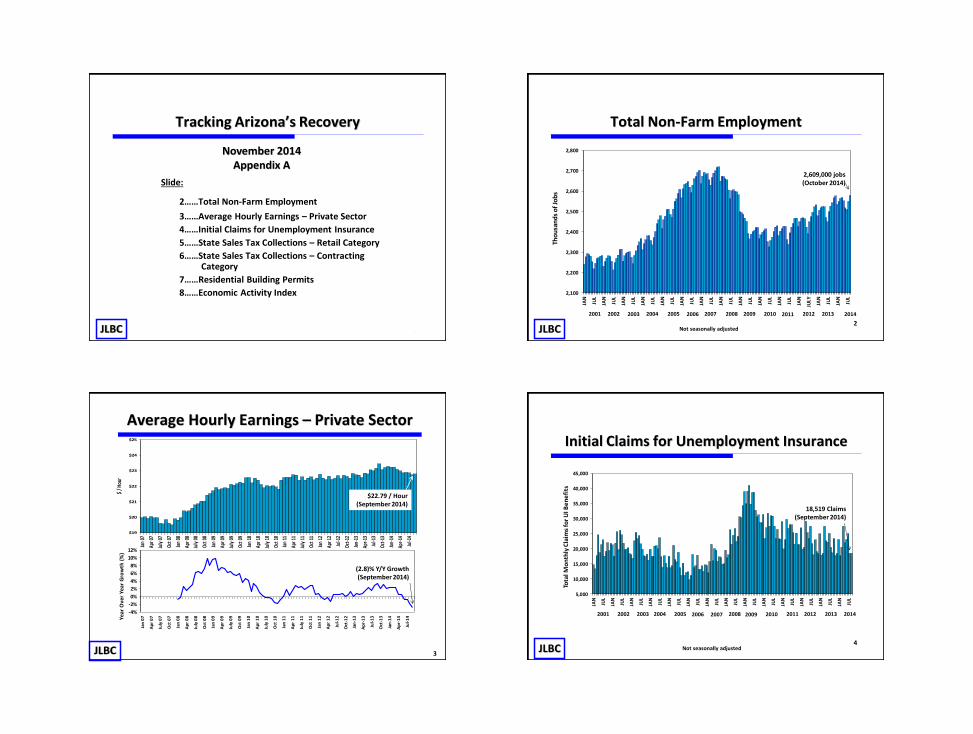
Currently, Arizona’s rate of growth in the coincident index is 35th in the nation. Last year at this time, Arizona’s rate was in a similar position at 36th highest amongst states. See Appendix A – Tracking Arizona’s Recovery for additional historical information. Housing The total housing inventory in the Greater Phoenix area is 5.4% larger than October of last year, suggesting a somewhat slower market. This is evidenced by homes being listed longer before selling. In October 2013, homes were on the market an average of 65 days. In October 2014, homes were on the market an average of 88 days. The median price of a single family home was $205,000 in October, a 2.5% increase over September. The price is 10.8% higher than October of last year. Single family housing construction continues to weaken, while multi-family construction continues to expand. Arizona’s 12-month total of single-family building permits is 17,613, or (0.4)% less than a year ago. The comparable single-family permit growth rate for the entire U.S. is 1.8% above last year. See Appendix A – Tracking Arizona’s Recovery for historical information. In contrast, the 12-month total of multi-family building permits has increased significantly since last year. Arizona’s total of 9,330 multi-family building permits is 58.4% above 2013. Arizona’s rate of increase is greater than the comparable multi-family permit growth for the U.S. as a whole which is 13.2% above 2013. Employment The state’s regular unemployment rate declined from 6.9% in September to 6.8% in October. The state’s jobless rate is now back at the level recorded in May this year. The U.S. unemployment rate decreased in October as well, going from 5.9% to 5.8%. According to the latest employment report released by the Department of Administration, the state added 28,500 Nonfarm jobs in October compared to the prior month. This was 12,700 jobs above the average increase of 15,800 jobs for October in the prior 10 years. All of the major industry sectors added jobs in October except for the manufacturing and information sectors. Compared to the same month in the prior year, Arizona added 66,400 net new jobs in October. This translates into a year-over-year job growth rate of 2.6%, which is the largest gain since January 2007. Almost 95% of net gain in employment comes from the private sector. Some of the largest year-over-year job gains have occurred in the following service-providing

5 JLBC – MONTHLY FISCAL HIGHLIGHTS – NOVEMBER 2014
Monthly Indicators (Continued)
industries: health care (+12,700), employment services, which include temporary staffing services (+10,900), and accommodation and food services (+9,900). In September, the Average Weekly Hours worked by individuals in Arizona’s private sector was 34 hours. This workload is (2.6)% below the September 2013 level. The Average Hourly Earnings received by these private sector workers was $22.79, which is (2.8)% below the average in September 2013. An average of 43,017 individuals received Regular Unemployment Benefits in August in Arizona. This amount was a (3.8)% decrease from the prior month and (4.1)% from August 2013. A qualifying individual may receive up to $240 in regular unemployment benefits a week for up to 26 weeks. The average monthly amount of recipients was 38,470 from 2000 through 2006, prior to the Great Recession. State Agency Data At the beginning of November, the total AHCCCS caseload was 1.6 million members. Since the federal health care expansion in January, the overall AHCCCS population has grown by 330,000 members. The enacted budget assumed the AHCCCS population would grow by 323,000 members through November 2014. Total monthly enrollment decreased (0.8)% in November, the first monthly decrease since the onset of federal health care expansion. The large decrease was likely the result of enrollment re-determinations made during the month. The decline was largely due to the traditional acute care AHCCCS population of lower income children and their parents. This enrollment category decreased by (15,000) in November to a level of 972,000 (versus a budgeted caseload of 1,009,000). The November level represents a decrease of (1.5)% since last month and a 9.6% increase since last year. The Traditional population decline was somewhat offset by growth in Proposition 204 childless adults. In January, the state started accepting new enrollment in this program. In November, the Childless Adult population increased by 4,600, or 1.7%. The November monthly gain is the lowest of the calendar year. Since January, the childless adult population has increased by 203,000 to reach a level of 271,000. This is compared to a budgeted level of 216,000 for November. The state share of the Proposition 204 cost is paid through a hospital assessment and not the General Fund. The state also opted to expand adult Medicaid coverage to 133% of FPL. The 100% - 133% enrollment increased by 1,000 in November and now totals 31,000 individuals enrolled since January 2014 (versus a budgeted caseload
of 50,000). The federal government is currently paying 100% of this cost. In the last 12 months, there were 46,000 reports of child maltreatment, which is an increase of 5.8% from the prior year, according to data from the Department of Child Safety. There were 17,000 children in out-of-home care in August 2014, an increase of 1.5% from July. Year-over-year, the number of out-home-children has grown by 13.8%. The Arizona Department of Corrections (ADC) reports that the inmate population reached 42,200 inmates at the end of October 2014. This is a 0.3% increase from September 2014, and marks a 3.0% increase in the number of prisoners since last October. The Department of Economic Security (DES) reported that there were 30,200 TANF recipients in the state in September, representing a monthly caseload decrease of (0.5)% from August. The year-over-year number of TANF recipients has declined by (19.4)%. The statutory lifetime limit on cash assistance is 24 months. The Supplemental Nutrition Assistance Program (SNAP), formerly known as Food Stamps, provides assistance to low-income households to purchase food. In September, there were a total of 1.1 million food stamp recipients in the state, a (0.2)% decrease over the prior month. Compared to September caseloads last year, the level of food stamp participation has declined by (5.2)%.
T able 5
Change Direct Line Staff January October since January Caseworkers 983 1,013 30 Hotline Staff 1/ 70 75 5 Staff in Training 137 320 183
Subtotal - Direct Line 1,190 1,408 218 Non-Direct Line Staff Asst. Program Managers 36 35 (1) Unit Superv isors 168 216 48 Case Aides 211 285 74 OCWI 33 50 17 Other Non-Direct Line Staff 613 684 2/ 71
Subtotal - Non-Direct Line 1,061 1,270 209Grand Total 2,251 2,678 427
1/ Excludes 20 temporary staff.
2/ There are an estimated 180 unit secretaries included in this figure.
Change in the Department of Child Safety Staff since January 2014

6 JLBC – MONTHLY FISCAL HIGHLIGHTS – NOVEMBER 2014
Table 6 MONTHLY INDICATORS
Indicator Time Period Current Value
Change From
Prior Period Change From
Prior Year Arizona
Employment - Regular Unemployment Rate October 6.8% (0.1)% (1.0)% - Total Unemployment Rate (discouraged/underemployed) 3rd Q 2014 15.1% (0.8)% (0.9)% - Initial Unemployment Insurance Claims September 18,519 0.1% (0.7)% - Unemployment Insurance Recipients August 43,017 (4.1)% (3.8)% - Non-Farm Employment - Total Manufacturing Construction
October October October
2.61 million 155,100 121,500
1.1% (0.3)% 2.6%
2.6% 0.3%
(1.9)% - Average Weekly Hours, Private Sector September 34.0 (0.6)% (2.6)% - Average Hourly Earnings, Private Sector September $22.79 0.2% (2.8)% Sales - Retail Taxable Sales Motor Vehicles/Misc. Auto Furniture/Home Furnishings
September September
$932.9 million $274.3 million
11.6%
(13.4)%
3.1% 12.2%
Building Material/Lawn & Garden September $270.7 million (11.9)% 3.9% Building - Residential Building Permits (12-month avg) Single-family Multi-family
September September
17,613 9,330
1.4% 2.2%
(0.4)% 58.4%
- Maricopa County/Other, Home Sales (ARMLS) Single-Family (Pending Sales)
October
4,521
(5.4)%
(13.7)%
- Maricopa County/Other, Median Home Price (ARMLS) Single-Family (Pending Sales)
October
$205,000
2.5%
10.8%
- Phoenix S&P/C Home Price Index (2000 = 100) August 147.58 0.2% 4.3% - Maricopa Pending Foreclosures October 6,097 (1.5)% (31.1)% - Greater Phoenix Total Housing Inventory, (ARMLS) October 27,591 4.6% 5.4% Tourism - Phoenix Sky Harbor Air Passengers September 2.99 million (13.4)% 2.7% - National Park Visitors August 1,717,374 45.8% 15.1% - State Park Visitors July 199,996 16.4% (17.8)% - Revenue Per Available Hotel Room September $56.00 6.5% 7..7% General Measures - Arizona Consumer Confidence Index (1985 = 100) 3rd Q 2014 71.6 (4.7)% (1.2)% - Arizona Coincident Index (July 1992 = 100) September 189.82 0.3% 2.6% - Arizona Leading Index -- 6 month projected growth September 4.2% 0.6% 1.6% - Arizona Personal Income 2nd Q 2014 $254.9 billion 5.7% 4.2% - Arizona Population July 2013 6.63 million N/A 1.2% - State Debt Rating Standards & Poor’s/Moody’s Outlook
Dec 09/July 10
Nov 13
AA- / Aa3
Positive
N/A N/A
N/A N/A
Agency Measures - AHCCCS Recipients November 1,588,358 (0.8%) 24.6% Acute Care Traditional 972,125 (1.5%) 9.6% Prop 204 Childless Adults 271,140 1.7% 289.7% Other Prop 204 166,873 (1.1%) 13.1% Adult Expansion 31,019 3.3% - Kids Care I 1,912 (1.7%) (70.4)% Kids Care II 0 0.0% (100.0)% Long-Term Care – Elderly & DD 56,238 0.3% 3.4% Emergency Services 89,051 (1.0%) 32.8% - Department of Child Safety (DCS) Annual Reports of Child Maltreatment (12-month total)
DCS Out-of-Home Children
August 2014
August
46,383 16,879
1.4% 1.5%
5.8%
13.8% Filled Caseworkers (1,406 Budgeted) September 1,309 0.2% 8.1% - ADC Inmate Growth September 42,217 0.3% 3.0% - Department of Economic Security - TANF Recipients September 30,223 (0.5)% (19.4)% - SNAP (Food Stamps) Recipients September 1,055,838 (0.2)% (5.2)% - Judiciary Probation Caseload Non-Maricopa
Maricopa County
August August
17,541 25,820
(72)
245
315
712 United States - Gross Domestic Product (Chained 2009 dollars, SAAR)
3rd Q, 2014 $16.2 trillion 2.3% 3.5%
- Consumer Confidence Index (1985 = 100) October 94.5 6.2% 30.5% - Leading Indicators Index (2004 = 100) September 104.4 0.8% 6.3% - Consumer Price Index, SA (1982-84 = 100) September 237.6 0.1% 1.7% - Personal Consumption Price Index (2009 = 100) September 109.2 0.1% 1.4%

7 JLBC – MONTHLY FISCAL HIGHLIGHTS – NOVEMBER 2014
Summary of Recent Agency Reports
Arizona Department of Administration – Report on Motor Vehicle Fleet – Pursuant to A.R.S. § 41-803R, the Arizona Department of Administration reported on the FY 2014 year-end inventory of state-owned alternative fuel vehicles. Of the 12,531 state vehicles, 4,934 or 39.4% are subject to the alternative fuel vehicle requirements. (Law enforcement and certain other vehicles are exempt.) Of the 4,934 state vehicles subject to the alternative fuel vehicle requirements, 3,692, or 74.8% are alternative fuel vehicles. This is a decrease of (0.3)% from the prior year but exceeds the 40% target established by statute. Statute also requires 90% of the state vehicles in Maricopa County to be capable of using alternative fuels. The state reports that 88.6% of its Maricopa County vehicles are alternative fuel vehicles. This is an increase of 1.7% from the prior year. A.R.S. § 41-803G additionally requires that 75% of new vehicle purchases in Maricopa and Pima Counties be capable of using alternative fuels for models year 2001 or later. Of the 450 eligible vehicles purchased in these counties in 2014, 98.9% were capable of using alternative fuels. Notwithstanding the number of vehicles capable of using alternative fuel, only 2.7% of the fuel budget for the 6 largest state fleets was spent on alternative fuels. (Rebecca Perrera) Auditor General - Report on Emergency and Residential Placement - Pursuant to the FY 2014 Health and Welfare Budget Reconciliation Bill, the Auditor General has produced a report addressing expenditures for the Emergency and Residential Placement line item. Specifically, the legislation asked the Auditor General to (a) describe the reasons for the high usage of emergency and residential placements as opposed to foster homes and (b) propose possible methods to reduce the use of emergency and residential placement in the future. In FY 2013, the Department of Child Safety (DCS) spent $79.2 million on emergency and residential placements, or 100% more than in FY 2009. Emergency and residential placements (also known as congregate care) are the least desirable setting for the well-being of out-of-home children as well as the most expensive placement setting for the state. In the past few years, emergency and residential placements have grown at a faster rate than foster care placements. The number of children in out-of-home care grew by about 56% from September 2009 to March 2014, while the number of children in emergency and residential placements grew by
approximately 73% during this same time period. Increased utilization of emergency and residential placements in Arizona runs counter to the national trend. The Auditor General found that the dramatic growth in emergency and residential placements is based on a number of factors: Inadequate supply of licensed foster homes - The
department has been unsuccessful in recruiting foster homes for older children, special needs children, and sibling groups, so these children are more frequently placed in emergency and residential placements. DCS’ contracts for foster home recruitment-related services lack adequate performance measures, appropriate ties between contractor performance and department monitoring, and workable financial incentives.
Various department practices, including allowing some children who wish to stay in group homes to do so.
Inadequate access to behavioral health services for children in family foster homes.
To reduce emergency and residential placements, the Auditor General recommends that DCS model its approach after successful child welfare reforms in other states. The Auditor General provided Tennessee as an example of successful reform, where vendors are required to provide both foster homes and emergency and residential placements. Tennessee vendors are paid the same rate regardless of where they place a child, so vendors have an incentive to place children in foster homes, which are better for the well-being of the child and less expensive. The Auditor General also recommends that DCS establish a time frame for reestablishing the use of foster care receiving homes. Foster care receiving homes are available 24/7 to receive children on a temporary basis until other placement options become available. Starting in FY 2014, the Legislature appropriated funding for 200 placements in foster care receiving homes, but DCS has not yet reinstituted the use of this type of foster care placement. This is the last of 3 audits on Children Support Services authorized by the FY 2014 Health and Welfare Budget Reconciliation Bill. The FY 2015 Health and Welfare Budget Reconciliation Bill instructs the Auditor General to evaluate certain aspects of Arizona’s child welfare system and the Office of Child Welfare investigations relative to national child welfare data. The report is due on March 15, 2015. (Ben Beutler)

8 JLBC – MONTHLY FISCAL HIGHLIGHTS – NOVEMBER 2014
Summary of Recent Agency Reports (Continued)
Department of Child Safety (DCS) - Quarterly Report on Foster Care Medicaid - Pursuant to Laws 2013, Chapter 220, DCS is required to report on foster care and Medicaid eligibility. These reports are required quarterly until December 31, 2015. During the 1st quarter of FY 2015, DCS reports the following trends on foster care and Medicaid eligibility: 1. There were 15,555 children eligible for Medicaid in
foster care at the end of the 1st quarter, up from 15,141 at the end of the 4th quarter of FY 2014.
2. The percentage of foster care children eligible for Medicaid remained steady at 97% from the end of 4th quarter of FY 2014 to the end of the 1st quarter of FY 2015.
3. The amount of non-Medicaid behavioral health group home expenditures used by DCS to supplement Medicaid behavioral health placement services was $1.6 million in the 1st quarter of FY 2015 compared to $2.5 million in the 4th quarter of FY 2014.
4. The amount of non-Medicaid behavioral health evaluation/counseling expenditures used by DCS to supplement Medicaid behavioral health services declined from $163,100 in the 4th quarter of FY 2014 to $102,700 in the 1st quarter of FY 2015. (Ben Beutler)
Department of Child Safety (DCS) - Semi-Annual Report on Finances and Program Accountability - Pursuant to A.R.S. § 8-818, DCS has submitted its semi-annual financial and program accountability report covering the period of January 2014 through June 2014. According to the report, out-of-home placements increased from 15,016 in December to 16,747 in June. Caseloads are above the department’s goals and turnover for case managers was approximately 22.8%. Employee satisfaction has remained the same at a 3.4 rating on a 5 point scale. The highlights of this report, covering the last 6 months of FY 2014, are summarized below. The Training Academy had 225 new case
managers in training as of June 2014. During the time period from January 2014 to June 2014, 197 case managers graduated from the Training Academy, or (90) fewer graduates than in the previous 6-month period.
As of June 2014, the number of filled positions was 1,282, including those in training and hotline staff. Caseloads per worker remain considerably higher than caseload goals, with investigations at 19 (goal: 13), in-home at 54 (goal: 33), and out-of-home at 28 (goal: 20).
DCS reports that annualized case manager turnover during January - June 2014 was 22.8%, up from a 21.9% annualized rate in the last report.
The percent of Office of Administrative Hearing’s decisions affirming DCS case findings increased from 72.8% to 80.1%. The percent of complaints validated by the Ombudsman decreased from 25.6% to 20.3%.
The number of congregate care placements increased from 2,027 to 2,246, a 10.8% increase. DCS also reports that from December to June the number of children aged 0-3 in shelter care grew from 38 to 44, the number of children aged 0-6 in group homes increased from 58 to 62, and the number of children in shelter care for more than 21 days decreased from 868 to 865. (Ben Beutler)
Arizona Commerce Authority – Annual Report on Arizona Competes Fund – Pursuant to A.R.S. § 41-1545.04, the Arizona Commerce Authority (ACA) is required to report annually on grants from the previous fiscal year and other projects currently funded from the Arizona Competes Fund and performance measures for the recipients including job creation, capital investment and median wages. New FY 2014 Grants In total, ACA awarded 22 grants from the Arizona Competes Fund totaling $10.0 million in FY 2014. ACA reports awarding 4 grants for the purpose of expanding or retaining business in Arizona, totaling $4.3 million. The largest grant of $1.3 million was awarded to General Motors, LLC., with Hotchalk, Inc. receiving $1.25 million, Silicon Valley Bank receiving $1.0 million, and ZocDoc, Inc. receiving $750,000. Each recipient agreed, as part of the granting process, to meet certain metrics regarding job creation. The 4 recipients agreed, over the next 3 years, to create a collective total of 2,217 jobs, provide average annual wages of $66,200, make a collective capital investment of $30.5 million, and pay for at least 65% of health insurance costs. As of June 30, 2014, the grantees had created 257 jobs, average annual wages of $52,000, and $622,000 in capital investment. Additionally, ACA reports awarding 18 grants to support rural and small businesses, totaling $5.7 million, from the Arizona Competes Fund in FY 2014. Of this amount, $2.7 million was granted to 6 local government and economic development entities for the purpose of helping rural communities enhance economic development programs. The 6 Rural Economic Development Grant (REDG) recipients agreed, over the next 3 years, to create a collective total of 941 jobs, provide average annual wages of $34,800, and make a collective capital investment of
9 JLBC – MONTHLY FISCAL HIGHLIGHTS – NOVEMBER 2014
Summary of Recent Agency Reports (Continued)
$182.1 million. As of June 30, 2014, the grantees had
not reported any statistics on the creation of jobs or capital investments made. The remaining $3.0 million in Arizona Innovation Challenge (AIC) grants were awarded to 12 early-stage companies for the purposes of funding the start-up costs of small businesses. The 12 recipients agreed, over the next year, to create a collective total of 42 jobs. As of June 30, 2014, the grantees had created 9 jobs with an average wage of $91,700 and had made capital investments totaling $2.0 million. Prior-Year Grants ACA awarded 4 grants for the purpose of expanding or retaining business in Arizona in FY 2012 totaling $4.2 million. Through FY 2014, these grantees created 622 jobs with average annual wages of $66,700 and capital investment of $16.4 million. This compares to commitments of 956 jobs created, average annual wages of $59,700, and capital investment of $25.7 million. The 4 grantees have until the end of FY 2015 to reach the agreed upon metrics. ACA also made 3 grants for the same purpose in FY 2013 totaling $3.5 million. Through FY 2014, these grantees created 425 jobs with average annual wages of $66,800 and capital investment of $39.0 million. This compares to commitments of 741 jobs created, average annual wages of $62,000, and capital investment of $46.5 million. The 3 grantees have until the end of FY 2016 to reach the agreed upon metrics. In FY 2012 and FY 2013, ACA made 29 REDG and AIC grants for the purpose of supporting rural and small businesses totaling $6.4 million. As of June 30, 2014, these grantees created 992 jobs and $97.6 million in capital investment compared to commitments of 864 jobs and $77.1 million in capital investment. These grantees also created an additional $1.8 million in capital investment that was not subject to a contractual commitment. The average wage of the jobs created was $51,500. The Arizona Competes Fund receives an annual $21.5 million deposit of income tax withholding monies and $3.5 million in state lottery revenues. The monies are used to retain, attract, and expand businesses in Arizona through the provision of grants and loans. As of June 30, 2014, the Arizona Competes Fund had a balance of $68.1 million. (Eric Billings) County Attorneys – Report on Deferred Prosecution – Pursuant to A.R.S. § 11-362, each county attorney that oversees an established Deferred Prosecution
Program shall submit an annual evaluation of their respective program that includes the following metrics: The number of persons who were enrolled in
deferred prosecution programs during the previous fiscal year
The number of persons who successfully completed deferred prosecution programs during the previous fiscal year
If available, the number of persons who were enrolled in deferred prosecution programs during the previous fiscal year and who were subsequently convicted of a new felony offense
Ten counties submitted reports which indicated a total of 19,291 individuals were placed in a deferred prosecution program in FY 2014. Of these individuals and those already enrolled, 13,783 successfully completed the program. No counties submitted information on the number of participants in FY 2013 that were subsequently convicted of a new felony offense. Deferred prosecution allows individuals who commit non-dangerous, non-serious crimes to avoid prosecution through the completion of a program that may involve restitution, community service, substance abuse treatment, counseling, or other means by which the individual can make amends for their crime. After the completion of the program, the charges are dismissed. (Eric Billings) Arizona Department of Education – Report on K-12 Aggregate Expenditure Limit – Pursuant to A.R.S. § 15-911B, the State Board of Education recently reported that currently budgeted expenditures for all school districts collectively statewide for FY 2015 are $(593.5) million below the Constitution’s aggregate expenditure limitation (AEL). For FY 2014 the difference was a virtually identical $(593.9) million. The AEL limits growth in statewide K-12 expenditures to the combined rate of growth for enrollment and inflation, with certain exceptions. (Steve Schimpp) JLBC Staff - County Flexible Revenue Report - The FY 2015 Revenue Budget Reconciliation Bill (BRB) (Laws 2014, Chapter 9) permits counties with a population of under 200,000 to meet any FY 2015 fiscal obligation from any source of county revenue, including countywide special taxing jurisdictions. Chapter 9 requires counties to report on their use of this provision. Of the 10 under 200,000 persons, 5 reported using the flexibility: Apache County: $400,000 from 3 special taxing
10 JLBC – MONTHLY FISCAL HIGHLIGHTS – NOVEMBER 2014
Summary of Recent Agency Reports (Continued)
districts to the Sheriff’s Office to maintain deputies and $100,000 from the Juvenile Jail Fund to the County Attorney’s Office to maintain an attorney.
Cochise County: $36,700 from the Library District to the Heavy Fleet Management Fund.
La Paz County: $5,012,500 from various funds to the General Fund.
Navajo County: $1,430,300 from 3 special taxing districts to the General Fund.
Yuma County: $19,500 from County Attorney Immigration Enforcement program to the County Attorney and Public Defender Offices and $10,200 from the Library District for the cleaning and maintenance of the South County facility.
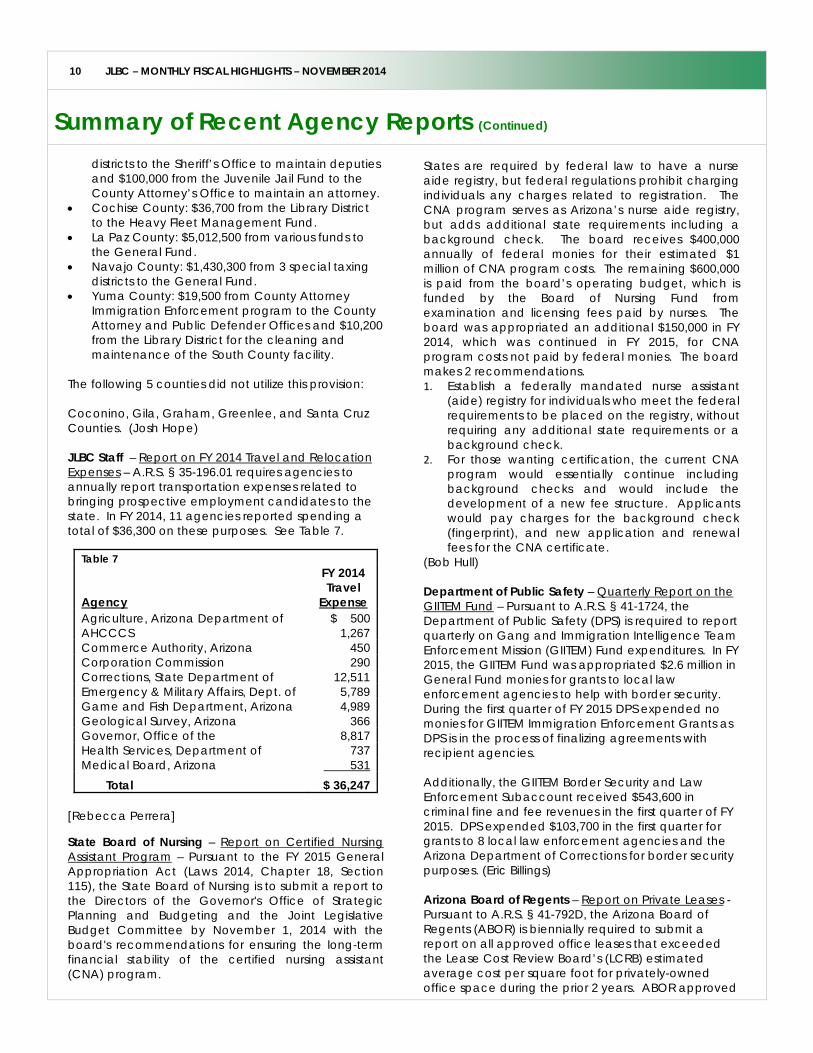
The following 5 counties did not utilize this provision: Coconino, Gila, Graham, Greenlee, and Santa Cruz Counties. (Josh Hope) JLBC Staff – Report on FY 2014 Travel and Relocation Expenses – A.R.S. § 35-196.01 requires agencies to annually report transportation expenses related to bringing prospective employment candidates to the state. In FY 2014, 11 agencies reported spending a total of $36,300 on these purposes. See Table 7.
Table 7
Agency
FY 2014 Travel
Expense Agriculture, Arizona Department of $ 500 AHCCCS 1,267 Commerce Authority, Arizona 450 Corporation Commission 290 Corrections, State Department of 12,511 Emergency & Military Affairs, Dept. of 5,789 Game and Fish Department, Arizona 4,989 Geological Survey, Arizona 366 Governor, Office of the 8,817 Health Services, Department of 737 Medical Board, Arizona 531 Total $ 36,247
[Rebecca Perrera] State Board of Nursing – Report on Certified Nursing Assistant Program – Pursuant to the FY 2015 General Appropriation Act (Laws 2014, Chapter 18, Section 115), the State Board of Nursing is to submit a report to the Directors of the Governor's Office of Strategic Planning and Budgeting and the Joint Legislative Budget Committee by November 1, 2014 with the board's recommendations for ensuring the long-term financial stability of the certified nursing assistant (CNA) program.
States are required by federal law to have a nurse aide registry, but federal regulations prohibit charging individuals any charges related to registration. The CNA program serves as Arizona’s nurse aide registry, but adds additional state requirements including a background check. The board receives $400,000 annually of federal monies for their estimated $1 million of CNA program costs. The remaining $600,000 is paid from the board’s operating budget, which is funded by the Board of Nursing Fund from examination and licensing fees paid by nurses. The board was appropriated an additional $150,000 in FY 2014, which was continued in FY 2015, for CNA program costs not paid by federal monies. The board makes 2 recommendations. 1. Establish a federally mandated nurse assistant
(aide) registry for individuals who meet the federal requirements to be placed on the registry, without requiring any additional state requirements or a background check.
2. For those wanting certification, the current CNA program would essentially continue including background checks and would include the development of a new fee structure. Applicants would pay charges for the background check (fingerprint), and new application and renewal fees for the CNA certificate.
(Bob Hull) Department of Public Safety – Quarterly Report on the GIITEM Fund – Pursuant to A.R.S. § 41-1724, the Department of Public Safety (DPS) is required to report quarterly on Gang and Immigration Intelligence Team Enforcement Mission (GIITEM) Fund expenditures. In FY 2015, the GIITEM Fund was appropriated $2.6 million in General Fund monies for grants to local law enforcement agencies to help with border security. During the first quarter of FY 2015 DPS expended no monies for GIITEM Immigration Enforcement Grants as DPS is in the process of finalizing agreements with recipient agencies. Additionally, the GIITEM Border Security and Law Enforcement Subaccount received $543,600 in criminal fine and fee revenues in the first quarter of FY 2015. DPS expended $103,700 in the first quarter for grants to 8 local law enforcement agencies and the Arizona Department of Corrections for border security purposes. (Eric Billings) Arizona Board of Regents – Report on Private Leases - Pursuant to A.R.S. § 41-792D, the Arizona Board of Regents (ABOR) is biennially required to submit a report on all approved office leases that exceeded the Lease Cost Review Board’s (LCRB) estimated average cost per square foot for privately-owned office space during the prior 2 years. ABOR approved

11 JLBC – MONTHLY FISCAL HIGHLIGHTS – NOVEMBER 2014
Summary of Recent Agency Reports (Continued)
56 leases in FY 2013 and 48 leases in FY 2014. Seven of the leases approved in FY 2014 exceeded the LCRB’s $19.40 average cost per square foot for privately-leased space. (Art Smith) Department of Veterans’ Services – Report on Capital Projects – Pursuant to A.R.S. § 41-610, the Department of Veterans’ Services is required to submit an annual report on capital projects for which they have requested federal monies in the past 12 months. The department reports it has been awarded monies for 2 projects. The department has been awarded $6.3 million
in Federal Funds for the construction of a new state veterans’ cemetery in Flagstaff. Last year, the department reported this project was conditionally approved by the federal government contingent on the department completing a specific list of items by an agreed deadline. The department began construction in March 2014 and expects to conclude by December 2015. The department estimates that they will need an annual appropriation of $472,700 from the General Fund to pay for ongoing operational costs beginning in FY 2016.
The department has been awarded $8.9 million in Federal Funds for the construction of a new state veterans’ cemetery in Marana. The department began construction in August 2014 and expects to conclude by December 2015. The department estimates that they will need an annual appropriation of $472,700 from the General Fund to pay for ongoing operational costs beginning in FY 2016.
In addition to these projects, the department applied for, but has not received, monies for a veterans’ home in Yuma. The state is responsible for paying the ongoing operational costs of cemeteries and 35% of the construction costs of veterans’ homes. The FY 2015 budget appropriated $9.2 million from the General Fund for the state’s share of construction costs for the Yuma home. Although not included in the report, the department has requested General Fund monies for 2 additional veterans’ homes in their FY 2016 budget request. (Rebecca Perrera)

12 JLBC – MONTHLY FISCAL HIGHLIGHTS – NOVEMBER 2014
October Spending
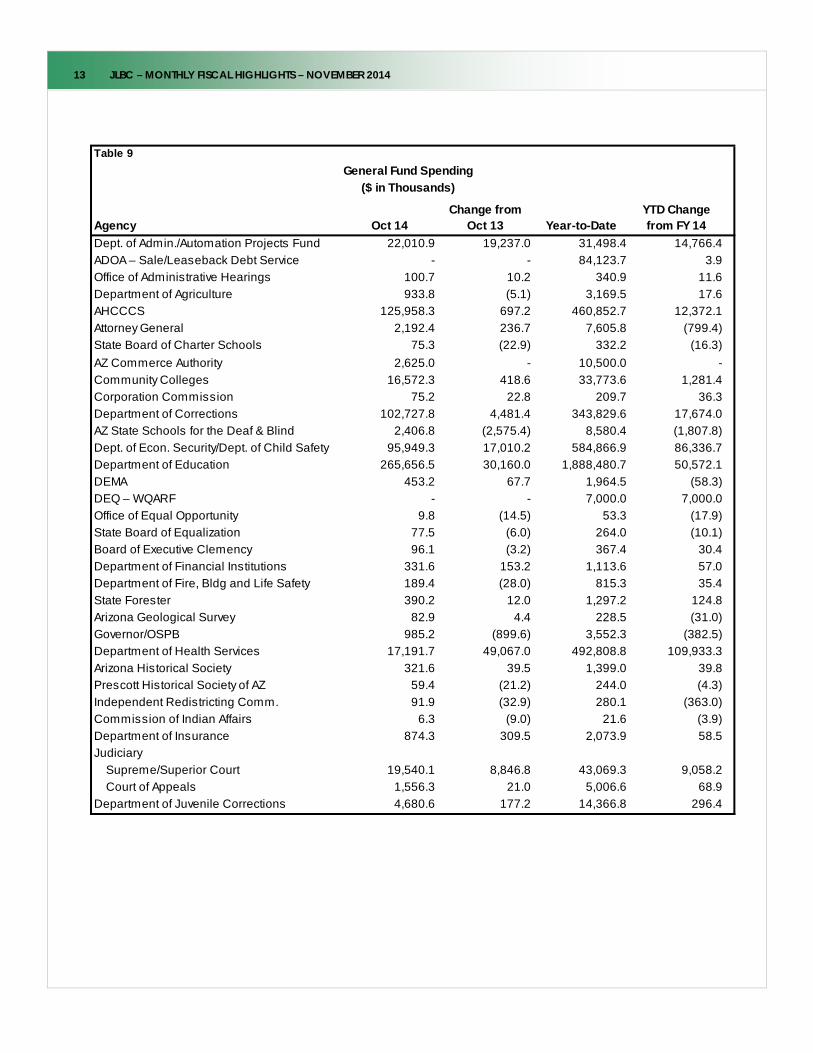
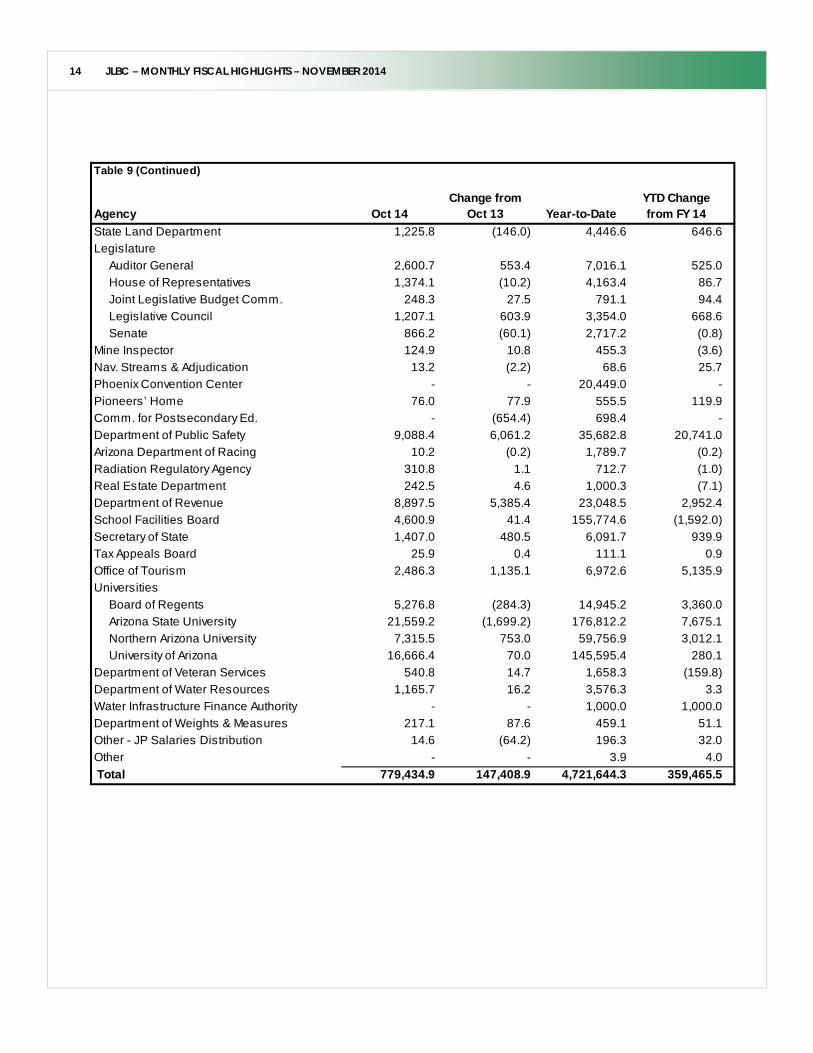
October 2014 General Fund spending of $779.4 million was $147.4 million more than October 2013. Year-to-date, spending is $4.72 billion, or $359.5 million above last year. (See Tables 8 & 9). Due to the state accounting system, at this time
Department of Economic Security and Department of Child Safety expenditures cannot be displayed separately.
Year-to-date, the Department of Education has spent $50.6 million more than the prior year.
Year-to-date, Department of Health Services spending has increased by $109.9 million compared to the prior year. This increase is in part due to the restoration of childless adult Medicaid coverage, which is entirely paid for with General Fund monies in the Department of Health Services.
Oct 14Change From
Oct 13 Year-to-DateYTD Change from FY 14
AgencyAHCCCS 126.0 0.7 460.9 12.4
Corrections 102.7 4.5 343.8 17.7
Economic Security/Child Safety 95.9 17.0 584.9 86.3
Education 265.7 30.2 1,888.5 50.6
Health Serv ices 17.2 49.1 492.8 109.9
Public Safety 9.1 6.1 35.7 20.7
School Facilities Board 4.6 0.0 155.8 (1.6)
Univ ersities 50.8 (1.2) 397.1 14.3
Leaseback Debt Serv ice 0.0 0.0 84.1 0.0
Other 107.4 41.0 278.0 49.2
Total 779.4 147.4 4,721.6 359.5
Table 8General Fund Spending ($ in Millions)
13 JLBC – MONTHLY FISCAL HIGHLIGHTS – NOVEMBER 2014
Agency Oct 14Change from
Oct 13 Year-to-DateYTD Change from FY 14
Dept. of Admin./Automation Projects Fund 22,010.9 19,237.0 31,498.4 14,766.4
ADOA – Sale/Leaseback Debt Service - - 84,123.7 3.9
Office of Administrative Hearings 100.7 10.2 340.9 11.6
Department of Agriculture 933.8 (5.1) 3,169.5 17.6
AHCCCS 125,958.3 697.2 460,852.7 12,372.1
Attorney General 2,192.4 236.7 7,605.8 (799.4)
State Board of Charter Schools 75.3 (22.9) 332.2 (16.3)
AZ Commerce Authority 2,625.0 - 10,500.0 -
Community Colleges 16,572.3 418.6 33,773.6 1,281.4
Corporation Commission 75.2 22.8 209.7 36.3
Department of Corrections 102,727.8 4,481.4 343,829.6 17,674.0
AZ State Schools for the Deaf & Blind 2,406.8 (2,575.4) 8,580.4 (1,807.8)
Dept. of Econ. Security/Dept. of Child Safety 95,949.3 17,010.2 584,866.9 86,336.7
Department of Education 265,656.5 30,160.0 1,888,480.7 50,572.1
DEMA 453.2 67.7 1,964.5 (58.3)
DEQ – WQARF - - 7,000.0 7,000.0
Office of Equal Opportunity 9.8 (14.5) 53.3 (17.9)
State Board of Equalization 77.5 (6.0) 264.0 (10.1)
Board of Executive Clemency 96.1 (3.2) 367.4 30.4
Department of Financial Institutions 331.6 153.2 1,113.6 57.0
Department of Fire, Bldg and Life Safety 189.4 (28.0) 815.3 35.4
State Forester 390.2 12.0 1,297.2 124.8
Arizona Geological Survey 82.9 4.4 228.5 (31.0)
Governor/OSPB 985.2 (899.6) 3,552.3 (382.5)
Department of Health Services 17,191.7 49,067.0 492,808.8 109,933.3
Arizona Historical Society 321.6 39.5 1,399.0 39.8
Prescott Historical Society of AZ 59.4 (21.2) 244.0 (4.3)
Independent Redistricting Comm. 91.9 (32.9) 280.1 (363.0)
Commission of Indian Affairs 6.3 (9.0) 21.6 (3.9)
Department of Insurance 874.3 309.5 2,073.9 58.5
Judiciary
Supreme/Superior Court 19,540.1 8,846.8 43,069.3 9,058.2
Court of Appeals 1,556.3 21.0 5,006.6 68.9
Department of Juvenile Corrections 4,680.6 177.2 14,366.8 296.4
Table 9
General Fund Spending
($ in Thousands)
14 JLBC – MONTHLY FISCAL HIGHLIGHTS – NOVEMBER 2014
Agency Oct 14Change from
Oct 13 Year-to-DateYTD Change from FY 14
State Land Department 1,225.8 (146.0) 4,446.6 646.6
Legislature
Auditor General 2,600.7 553.4 7,016.1 525.0
House of Representatives 1,374.1 (10.2) 4,163.4 86.7
Joint Legislative Budget Comm. 248.3 27.5 791.1 94.4
Legislative Council 1,207.1 603.9 3,354.0 668.6
Senate 866.2 (60.1) 2,717.2 (0.8)
Mine Inspector 124.9 10.8 455.3 (3.6)
Nav. Streams & Adjudication 13.2 (2.2) 68.6 25.7
Phoenix Convention Center - - 20,449.0 -
Pioneers’ Home 76.0 77.9 555.5 119.9
Comm. for Postsecondary Ed. - (654.4) 698.4 -
Department of Public Safety 9,088.4 6,061.2 35,682.8 20,741.0
Arizona Department of Racing 10.2 (0.2) 1,789.7 (0.2)
Radiation Regulatory Agency 310.8 1.1 712.7 (1.0)
Real Estate Department 242.5 4.6 1,000.3 (7.1)
Department of Revenue 8,897.5 5,385.4 23,048.5 2,952.4
School Facilities Board 4,600.9 41.4 155,774.6 (1,592.0)
Secretary of State 1,407.0 480.5 6,091.7 939.9
Tax Appeals Board 25.9 0.4 111.1 0.9
Office of Tourism 2,486.3 1,135.1 6,972.6 5,135.9
Universities
Board of Regents 5,276.8 (284.3) 14,945.2 3,360.0
Arizona State University 21,559.2 (1,699.2) 176,812.2 7,675.1
Northern Arizona University 7,315.5 753.0 59,756.9 3,012.1
University of Arizona 16,666.4 70.0 145,595.4 280.1
Department of Veteran Services 540.8 14.7 1,658.3 (159.8)
Department of Water Resources 1,165.7 16.2 3,576.3 3.3
Water Infrastructure Finance Authority - - 1,000.0 1,000.0
Department of Weights & Measures 217.1 87.6 459.1 51.1
Other - JP Salaries Distribution 14.6 (64.2) 196.3 32.0
Other - - 3.9 4.0
Total 779,434.9 147,408.9 4,721,644.3 359,465.5
Table 9 (Continued)
JLBC 1
Tracking Arizona’s Recovery
Slide:
2……Total Non-Farm Employment
3……Average Hourly Earnings – Private Sector
4……Initial Claims for Unemployment Insurance
5……State Sales Tax Collections – Retail Category
6……State Sales Tax Collections – Contracting Category
7……Residential Building Permits
8……Economic Activity Index
November 2014 Appendix A
JLBC
Total Non-Farm Employment
2 Not seasonally adjusted
2001 2002 2003 2004 2005 2006 2007 2008 2009 2010 2011 2012 2013 2014
2,100
2,200
2,300
2,400
2,500
2,600
2,700
2,800
JAN
JUL
JAN
JUL
JAN
JUL
JAN
JUL
JAN
JUL
JAN
JUL
JAN
JUL
JAN
JUL
JAN
JUL
JAN
JUL
JAN
JUL
JAN
JULY
JAN
JUL
JAN
JUL
Tho
usa
nd
s o
f Jo
bs
2,609,000 jobs (October 2014)
JLBC
Average Hourly Earnings – Private Sector
-4%
-2%
0%
2%
4%
6%
8%
10%
12%
Jan
07
Ap
r 0
7
July
07
Oct
07
Jan
08
Ap
r 0
8
July
08
Oct
08
Jan
09
Ap
r 0
9
July
09
Oct
09
Jan
10
Ap
r 1
0
July
10
Oct
10
Jan
11
Ap
r 1
1
July
11
Oct
11
Jan
12
Ap
r 1
2
Jul-
12
Oct
-12
Jan
-13
Ap
r-1
3
Jul-
13
Oct
-13
Jan
-14
Ap
r-1
4
Jul-
14Ye
ar O
ver
Year
Gro
wth
(%
)
(2.8)% Y/Y Growth (September 2014)
$19
$20
$21
$22
$23
$24
$25
Jan
07
Apr 0
7
July
07
Oct 0
7
Jan
08
Apr 0
8
July
08
Oct 0
8
Jan
09
Apr 0
9
July
09
Oct 0
9
Jan
10
Apr 1
0
July
10
Oct 1
0
Jan
11
Apr 1
1
July
11
Oct 1
1
Jan
12
Apr 1
2
Jul-1
2
Oct-1
2
Jan-
13
Apr-1
3
Jul-1
3
Oct-1
3
Jan-
14
Apr-1
4
Jul-1
4
$ / H
our
$22.79 / Hour (September 2014)
3 JLBC
Initial Claims for Unemployment Insurance
4 Not seasonally adjusted
2001 2002 2003 2004 2005 2006 2007 2008 2009 2010 2011 2012 2013 2014
5,000
10,000
15,000
20,000
25,000
30,000
35,000
40,000
45,000
JAN
JUL
JAN
JUL
JAN
JUL
JAN
JUL
JAN
JUL
JAN
JUL
JAN
JUL
JAN
JUL
JAN
JUL
JAN
JUL
JAN
JUL
JAN
JUL
JAN
JUL
JAN
JUL
Tota
l Mo
nth
ly C
laim
s fo
r U
I Be
ne
fits
18,519 Claims (September 2014)
JLBC
State Sales Tax Collections – Retail Category
$100
$125
$150
$175
$200
$225
July
06
Oct
06
Jan
07
Apr 0
7
July
07
Oct
07
Jan
08
Apr 0
8
July
08
Oct
08
Jan
09
Apr 0
9
July
09
Oct
09
Jan
10
Apr 1
0
July
10
Oct
10
Jan
11
Apr 1
1
July
11
Oct
11
Jan
12
Apr 1
2
Jul-1
2
Oct
-12
Jan-
13
Apr-
13
Jul-1
3
Oct
-13
* Ja
n-14
Apr-
14
Jul-1
4
$ in
Mill
ions
Excludes temporary 1 ¢ sales tax * January 2014 collections reflect the reclassification of approximately $40 million of revenue from other tax categories to retail collections
$162.8 million (September 2014)
-20%
-15%
-10%
-5%
0%
5%
10%
15%
20%
July
06
Oct
06
Jan
07
Ap
r 0
7
July
07
Oct
07
Jan
08
Ap
r 0
8
July
08
Oct
08
Jan
09
Ap
r 0
9
July
09
Oct
09
Jan
10
Ap
r 1
0
July
10
Oct
10
Jan
11
Ap
r 1
1
July
11
Oct
11
Jan
12
Ap
r 1
2
Jul-
12
Oct
-12
Jan
-13
Ap
r-1
3
Jul-
13
Oct
-13
*Ja
n-1
4
Ap
r-1
4
Jul-
14Ye
ar
Ov
er
Ye
ar
Gro
wth
(%
)
3.7% Y/Y Growth (September 2014)
5 JLBC
State Sales Tax Collections – Contracting Category
$0
$25
$50
$75
$100
July
06
Oct
06
Jan
07
Apr 0
7
July
07
Oct
07
Jan
08
Apr 0
8
July
08
Oct
08
Jan
09
Apr 0
9
July
09
Oct
09
Jan
10
Apr 1
0
July
10
Oct
10
Jan
11
Apr 1
1
July
11
Oct
11
Jan
12
Apr 1
2
Jul-1
2
Oct
-12
Jan-
13
Apr-
13
Jul-1
3
Oct
-13
Jan-
14
Apr-
14
Jul-1
4
$ in
Mill
ions
Excludes temporary 1 ¢ sales tax
$43.1 million (September 2014)
-50%
-40%
-30%-20%
-10%
0%
10%20%
30%
40%
July
06
Oct
06
Jan
07
Ap
r 0
7
July
07
Oct
07
Jan
08
Ap
r 0
8
July
08
Oct
08
Jan
09
Ap
r 0
9
July
09
Oct
09
Jan
10
Ap
r 1
0
July
10
Oct
10
Jan
11
Ap
r 1
1
July
11
Oct
11
Jan
12
Ap
r 1
2
Jul-
12
Oct
-12
Jan
-13
Ap
r-1
3
Jul-
13
Oct
-13
Jan
-14
Ap
r-1
4
Jul-
14Ye
ar
Ov
er
Ye
ar
Gro
wth
(%
)
2.2% Y/Y Growth (September 2014)
6
JLBC
Residential Building Permits
0
10,000
20,000
30,000
40,000
50,000
60,000
70,000
80,000
90,000
100,000
JAN
JUL
JAN
JUL
JAN
JUL
JAN
JUL
JAN
JUL
JAN
JUL
JAN
JUL
JAN
JUL
JAN
JUL
JAN
JUL
JAN
JUL
JAN
JULY
JAN
JUL
JAN
JUL
Bu
ild
ing
Pe
rmit
s
Single Family UnitMulti-Family Unit
- 17,613 Permits- 9,330 Permits
(Sept. 2014)
7 12-Month Moving Sum
2001 2002 2003 2004 2005 2006 2007 2008 2009 2010 2011 2012 2013 2014
JLBC
Economic Activity Index
140
150
160
170
180
190
200
210
JAN
JUL
JAN
JUL
JAN
JUL
JAN
JUL
JAN
JUL
JAN
JUL
JAN
JUL
JAN
JUL
JAN
JUL
JAN
JUL
JAN
JUL
JAN
JUL
JAN
JUL
JAN
JUL
Co
inci
de
nt
Ind
ex
Val
ue
189.8 Index Value(September 2014)
8 Source: Coincident Index – Federal Reserve Bank of Philadelphia. Combines four state-level indicators (employment, average hours worked in manufacturing, the unemployment rate, and wage and salary disbursements) to summarize current economic conditions.
2001 2002 2003 2004 2005 2006 2007 2008 2009 2010 2011 2012 2013 2014