monthly energy review - safety4sea.com...monthly energy review the monthly energy review (mer) is...
TRANSCRIPT

DOE/EIA‐0035(2019/3)
March 2019
Monthly Energy Review
www.eia.gov/mer

Monthly Energy Review The Monthly Energy Review (MER) is the U.S. Energy Information Administration’s (EIA) primary report of recent and historical energy statistics. Included are statistics on total energy production, consumption, stocks, trade, and energy prices; overviews of petroleum, natural gas, coal, electricity, nuclear energy, renewable energy, and international petroleum; carbon dioxide emissions; and data unit conversions. Release of the MER is in keeping with responsibilities given to EIA in Public Law 95–91 (Department of Energy Organization Act), which states, in part, in Section 205(a)(2):
“The Administrator shall be responsible for carrying out a central, comprehensive, and unified energy data and information program which will collect, evaluate, assemble, analyze, and disseminate data and information…”
The MER is intended for use by members of Congress, federal and state agencies, energy analysts, and the general public. EIA welcomes suggestions from readers regarding MER content and other EIA publications. Related monthly publications: Other monthly EIA reports are Petroleum Supply Monthly, Petroleum Marketing Monthly, Natural Gas Monthly, and Electric Power Monthly. For more information, contact EIA’s Office of Communications via email at [email protected].
Important notes about the data Data displayed: For tables beginning in 1949, annual data are usually displayed only in 5‐year increments between 1950 and 2000 in the tables in Portable Document Format (PDF) files; however, all annual data are shown in the Excel files, comma‐separated values (CSV) files, application programming interface (API) files, and in the data browser. Also, only two to three years of monthly data are displayed in the PDF files; however, for many series, monthly data beginning with January 1973 are available in the Excel files, CSV files, API files, and in the data browser. Comprehensive changes: Each month, most MER tables and figures present data for a new month. These data are usually preliminary (and sometimes estimated or forecasted) and likely to be revised the following month. The first dissemination of most annual data is also preliminary. It is often based on monthly estimates and is likely to be revised later that year after final data are published from sources, according to source data revision policies and publication schedules. In addition, EIA may revise historical data when a major revision in a source publication is needed, when new data sources become available, or when estimation methodologies are improved. A record of current and historical changes to MER data is available at https://www.eia.gov/totalenergy/data/monthly/whatsnew.php. Annual data from 1949: In 2013, EIA expanded the MER to incorporate annual data as far back as 1949 in those data tables that were previously published in both the Annual Energy Review and MER.
Electronic access The MER is available on EIA’s website in various formats at http://www.eia.gov/totalenergy/data/monthly.
Full report and report tables: PDF files
Table data (unrounded): Excel files, CSV files, API files, and data browser
Graphs: PDF files and data browser
Note: PDF files display selected annual and monthly data; Excel files, CSV files, API files, and data browser display all available annual and monthly data, often with greater precision than the PDF files. Timing of release: The MER is posted at http://www.eia.gov/totalenergy/data/monthly no later than the last work day of the month.
Released: March 26, 2019

DOE/EIA-0035(2019/3)
Monthly Energy Review
March 2019
U.S. Energy Information Administration Office of Energy Statistics U.S. Department of Energy
Washington, DC 20585
This report was prepared by the U.S. Energy Information Administration (EIA), the statistical and analytical agency within the U.S. Department of Energy. By law, EIA’s data, analyses, and forecasts are independent of approval by any other officer or employee of the United States Government. The views in this report therefore should not be construed as representing those of the Department of Energy or other federal agencies.

ii
U. S. Energy Information Administration / Monthly Energy Review March 2019
Contacts
The Monthly Energy Review is prepared by the U.S. Energy Information Administration, Office of Energy Statistics, Office of Survey Development and Statistical Integration, Integrated Energy Statistics Team, under the direction of Ryan Repice, 202-586-5828 ([email protected]). Questions and comments specifically related to the Monthly Energy Review may be addressed to Alexander Sun, 202-287-5948 ([email protected]).
For assistance in acquiring data, please contact EIA’s Office of Communications at 202-586-8800 ([email protected]). Questions about the collection, processing, or interpretation of the information may be directed to the following subject specialists:
Section 1. Energy Overview. . . . . . . . . . . . . . . . . . . . . . . . . . . . . . . . Dianne R. Dunn 202-586-2792 [email protected]
Section 2. Energy Consumption by Sector . . . . . . . . . . . . . . . . . . . . Dianne R. Dunn 202-586-2792 [email protected]
Section 3. Petroleum . . . . . . . . . . . . . . . . . . . . . . . . . . . . . . . . . . . . . . Javed Zaidi 202-586-1155 [email protected]
Section 4. Natural Gas . . . . . . . . . . . . . . . . . . . . . . . . . . . . . . . . . . . . Michael Kopalek 202-586-4001 [email protected]
Section 5. Crude Oil and Natural Gas Resource Development . . . Gary Long 202-586-3467 [email protected]
Section 6. Coal . . . . . . . . . . . . . . . . . . . . . . . . . . . . . . . . . . . . . . . . . . .Rosalyn Berry 202-586-6393 [email protected]
Section 7. Electricity . . . . . . . . . . . . . . . . . . . . . . . . . . . . . . . . . . . . . . Lisa Cabral 202-287-6533 [email protected]
Section 8. Nuclear Energy . . . . . . . . . . . . . . . . . . . . . . . . . . . . . . . . . Tim Shear 202-586-0403 [email protected]
Section 9. Energy Prices
Petroleum . . . . . . . . . . . . . . . . . . . . . . . . . . . . . . . . . . . . . . Maureen Klein 202-586-8013 [email protected]
Natural Gas . . . . . . . . . . . . . . . . . . . . . . . . . . . . . . . . . . . . . Michael Kopalek 202-586-4001 [email protected]
Average Retail Prices of Electricity . . . . . . . . . . . . . . . . . . Peter Wong 202-586-7574 [email protected]
Cost of Fuel at Electric Generating Plants . . . . . . . . . . . . . .Joy Liu 202-586-5542 [email protected]
Section 10. Renewable Energy . . . . . . . . . . . . . . . . . . . . . . . . . . . . . . . Lolita Jamison 202-586-9567 [email protected]
Section 11. International Petroleum . . . . . . . . . . . . . . . . . . . . . . . . . . Patricia Smith 202-586-6925 [email protected]
Section 12. Environment . . . . . . . . . . . . . . . . . . . . . . . . . . . . . . . . . . . .Perry Lindstrom 202-586-0934 [email protected]

iii
U. S. Energy Information Administration / Monthly Energy Review March 2019
Contents
Page
Section 1. Energy Overview ........................................................................................... 1
Section 2. Energy Consumption by Sector ................................................................... 33
Section 3. Petroleum ..................................................................................................... 55
Section 4. Natural Gas .................................................................................................. 95
Section 5. Crude Oil and Natural Gas Resource Development .................................. 105
Section 6. Coal ........................................................................................................... 111
Section 7. Electricity .................................................................................................. 121
Section 8. Nuclear Energy .......................................................................................... 145
Section 9. Energy Prices ............................................................................................. 151
Section 10. Renewable Energy ..................................................................................... 171
Section 11. International Petroleum ............................................................................. 191
Section 12. Environment .............................................................................................. 201
Appendix A. British Thermal Unit Conversion Factors .................................................. 215
Appendix B. Metric Conversion Factors, Metric Prefixes, and Other
Physical Conversion Factors...................................................................... 231
Appendix C. Population, U.S. Gross Domestic Product, and U.S. Gross Output ........... 235
Appendix D. Estimated Primary Energy Consumption in the United States,
Selected Years, 1635–1945 ....................................................................... 237
Appendix E. Alternative Approaches for Deriving Energy Contents of
Noncombustible Renewables ..................................................................... 239
Glossary ......................................................................................................................................... 243

iv
U. S. Energy Information Administration / Monthly Energy Review March 2019
Tables
Page Section 1. Energy Overview
1.1 Primary Energy Overview ........................................................................................................................ 3 1.2 Primary Energy Production by Source ..................................................................................................... 5 1.3 Primary Energy Consumption by Source ................................................................................................. 7 1.4 a Primary Energy Imports by Source ........................................................................................................ 10 1.4 b Primary Energy Exports by Source and Total Net Imports .................................................................... 11 1.5 Merchandise Trade Value ...................................................................................................................... 13 1.6 Cost of Fuels to End Users in Real (1982–1984) Dollars ...................................................................... 15 1.7 Primary Energy Consumption, Energy Expenditures, and Carbon Dioxide Emissions Indicators ........ 17 1.8 Motor Vehicle Mileage, Fuel Consumption, and Fuel Economy ........................................................... 19 1.9 Heating Degree Days by Census Division ............................................................................................. 20 1.10 Cooling Degree Days by Census Division ............................................................................................. 21 1.11 a Non-Combustion Use of Fossil Fuels in Physical Units ........................................................................ 22 1.11b Heat Content of Non-Combustion Use of Fossil Fuels .......................................................................... 23
Section 2. Energy Consumption by Sector
2.1 Energy Consumption by Sector.............................................................................................................. 35 2.2 Residential Sector Energy Consumption ................................................................................................ 37 2.3 Commercial Sector Energy Consumption .............................................................................................. 39 2.4 Industrial Sector Energy Consumption .................................................................................................. 41 2.5 Transportation Sector Energy Consumption .......................................................................................... 43 2.6 Electric Power Sector Energy Consumption .......................................................................................... 45 2.7 U.S. Government Energy Consumption by Agency, Fiscal Years ......................................................... 46 2.8 U.S. Government Energy Consumption by Source, Fiscal Years .......................................................... 47
Section 3. Petroleum
3.1 Petroleum Overview............................................................................................................................... 57 3.2 Refinery and Blender Net Inputs and Net Production ............................................................................ 59 3.3 Petroleum Trade
3.3a Overview .................................................................................................................................. 61 3.3b Imports by Type ....................................................................................................................... 63 3.3c Imports From OPEC Countries ................................................................................................ 64 3.3d Imports From Non-OPEC Countries ........................................................................................ 65 3.3e Exports by Type ....................................................................................................................... 66 3.3f Exports by Country of Destination .......................................................................................... 67
3.4 Petroleum Stocks .................................................................................................................................... 69 3.5 Petroleum Products Supplied by Type ................................................................................................... 71 3.6 Heat Content of Petroleum Products Supplied by Type ......................................................................... 73 3.7 Petroleum Consumption
3.7a Residential and Commercial Sectors ....................................................................................... 75 3.7b Industrial Sector ....................................................................................................................... 76 3.7 c Transportation and Electric Power Sectors .............................................................................. 77
3.8 Heat Content of Petroleum Consumption 3.8a Residential and Commercial Sectors ....................................................................................... 80 3.8b Industrial Sector ....................................................................................................................... 81 3.8c Transportation and Electric Power Sectors .............................................................................. 82
Section 4. Natural Gas
4.1 Natural Gas Overview ............................................................................................................................ 97 4.2 Natural Gas Trade by Country ............................................................................................................... 98 4.3 Natural Gas Consumption by Sector ...................................................................................................... 99 4.4 Natural Gas in Underground Storage .................................................................................................. 100

v
U. S. Energy Information Administration / Monthly Energy Review March 2019
Tables
Page Section 5. Crude Oil and Natural Gas Resource Development
5.1 Crude Oil and Natural Gas Drilling Activity Measurements ............................................................... 107 5.2 Crude Oil and Natural Gas Exploratory and Development Wells ........................................................ 108
Section 6. Coal 6.1 Coal Overview ..................................................................................................................................... 113 6.2 Coal Consumption by Sector ................................................................................................................ 114 6.3 Coal Stocks by Sector .......................................................................................................................... 115
Section 7. Electricity 7.1 Electricity Overview ............................................................................................................................ 123 7.2 Electricity Net Generation
7.2a Total (All Sectors) ................................................................................................................. 125 7.2b Electric Power Sector ............................................................................................................. 126 7.2 c Commercial and Industrial Sectors ........................................................................................ 127
7.3 Consumption of Combustible Fuels for Electricity Generation 7.3a Total (All Sectors) ................................................................................................................. 129 7.3b Electric Power Sector ............................................................................................................. 130 7.3 c Commercial and Industrial Sectors (Selected Fuels) ............................................................. 131
7.4 Consumption of Combustible Fuels for Electricity Generation and Useful Thermal Output 7.4a Total (All Sectors) ................................................................................................................. 133 7.4b Electric Power Sector ............................................................................................................. 134 7.4 c Commercial and Industrial Sectors (Selected Fuels) ............................................................. 135
7.5 Stocks of Coal and Petroleum: Electric Power Sector ........................................................................ 137 7.6 Electricity End Use .............................................................................................................................. 139
Section 8. Nuclear Energy 8.1 Nuclear Energy Overview .................................................................................................................... 147 8.2 Uranium Overview ............................................................................................................................... 149
Section 9. Energy Prices 9.1 Crude Oil Price Summary .................................................................................................................... 153 9.2 F.O.B. Costs of Crude Oil Imports From Selected Countries .............................................................. 154 9.3 Landed Costs of Crude Oil Imports From Selected Countries ............................................................. 155 9.4 Retail Motor Gasoline and On-Highway Diesel Fuel Prices ............................................................... 156 9.5 Refiner Prices of Residual Fuel Oil ...................................................................................................... 157 9.6 Refiner Prices of Petroleum Products for Resale ................................................................................. 158 9.7 Refiner Prices of Petroleum Products to End Users ............................................................................. 159 9.8 Average Retail Prices of Electricity ..................................................................................................... 161 9.9 Cost of Fossil-Fuel Receipts at Electric Generating Plants .................................................................. 163 9.10 Natural Gas Prices ................................................................................................................................ 165
Section 10. Renewable Energy 10.1 Renewable Energy Production and Consumption by Source ............................................................... 173 10.2 Renewable Energy Consumption
10.2a Residential and Commercial Sectors ..................................................................................... 174 10.2b Industrial and Transportation Sectors .................................................................................... 175 10.2 c Electric Power Sector ............................................................................................................ 176
10.3 Fuel Ethanol Overview ........................................................................................................................ 177 10.4 Biodiesel and Other Renewable Fuels Overview ................................................................................. 178 10.5 Solar Energy Consumption .................................................................................................................. 179 10.6 Solar Electricity Net Generation .......................................................................................................... 180

vi
U. S. Energy Information Administration / Monthly Energy Review March 2019
Tables
Page
Section 11. International Petroleum
11.1 World Crude Oil Production 11.1a OPEC Members ..................................................................................................................... 194 11.1b Persian Gulf Nations, Non-OPEC, and World ...................................................................... 195
11.2 Petroleum Consumption in OECD Countries ...................................................................................... 197 11.3 Petroleum Stocks in OECD Countries ................................................................................................. 199
Section 12. Environment
12.1 Carbon Dioxide Emissions From Energy Consumption by Source ..................................................... 203 12.2 Carbon Dioxide Emissions From Energy Consumption: Residential Sector ...................................... 205 12.3 Carbon Dioxide Emissions From Energy Consumption: Commercial Sector .................................... 206 12.4 Carbon Dioxide Emissions From Energy Consumption: Industrial Sector ......................................... 207 12.5 Carbon Dioxide Emissions From Energy Consumption: Transportation Sector ................................. 208 12.6 Carbon Dioxide Emissions From Energy Consumption: Electric Power Sector ................................ 209 12.7 Carbon Dioxide Emissions From Biomass Energy Consumption ........................................................ 210
Appendix A. British Thermal Unit Conversion Factors
A1 Approximate Heat Content of Petroleum and Other Liquids ............................................................... 216 A2 Approximate Heat Content of Petroleum Production, Imports, and Exports ....................................... 217 A3 Approximate Heat Content of Petroleum Consumption and Fuel Ethanol .......................................... 218 A4 Approximate Heat Content of Natural Gas .......................................................................................... 219 A5 Approximate Heat Content of Coal and Coal Coke ............................................................................. 220 A6 Approximate Heat Rates for Electricity, and Heat Content of Electricity ........................................... 221
Appendix B. Metric Conversion Factors, Metric Prefixes, and Other Physical Conversion Factors
B1 Metric Conversion Factors ................................................................................................................... 232 B2 Metric Prefixes ..................................................................................................................................... 233 B3 Other Physical Conversion Factors ...................................................................................................... 233
Appendix C. Population, U.S. Gross Domestic Product, and U.S. Gross Output
C1 Population, U.S. Gross Domestic Product, and U.S. Gross Output ..................................................... 235
Appendix D. Estimated Primary Energy Consumption in the United States, Selected Years, 1635–1945
D1 Estimated Primary Energy Consumption in the United States, Selected Years, 1635 –1945 .............. 237
Appendix E. Alternative Approaches for Deriving Energy Contents of Noncombustible Renewables
E1 Noncombustible Renewable Primary Energy Consumption: E.1a Conventional Hydroelectric Power, Geothermal, and Wind .................................................. 241 E.1b Solar and Total ....................................................................................................................... 242
vii
U. S. Energy Information Administration / Monthly Energy Review March 2019
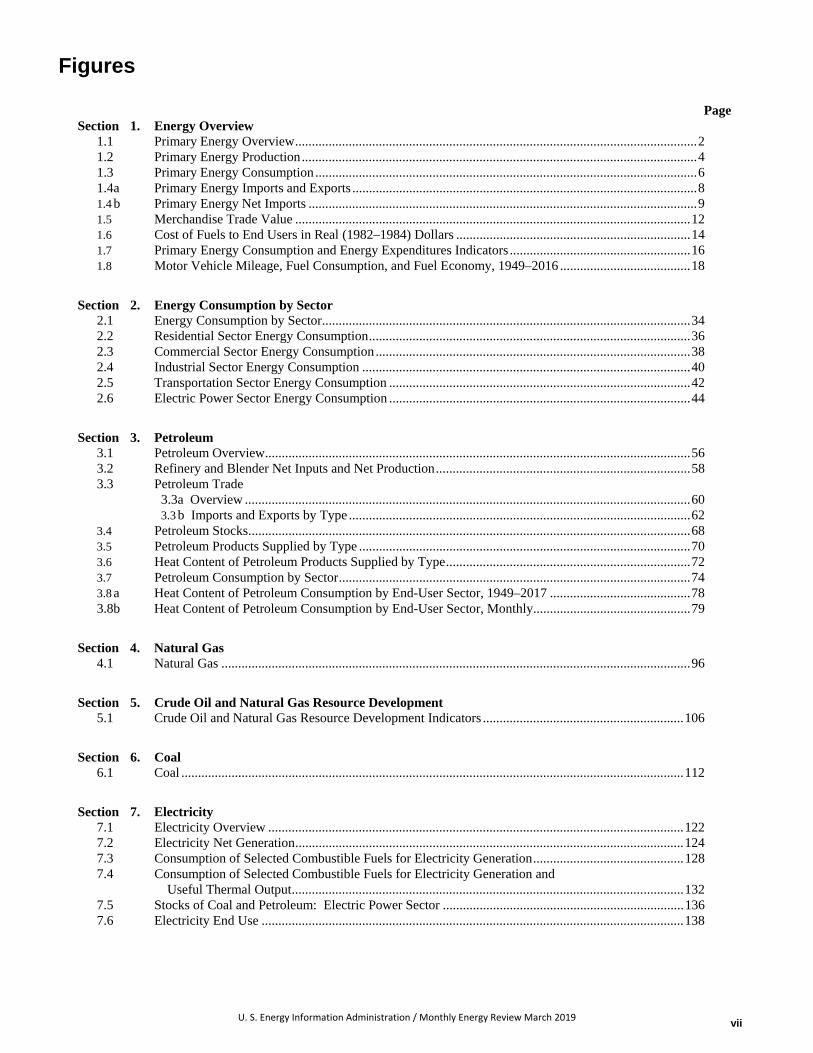
Figures
Page Section 1. Energy Overview
1.1 Primary Energy Overview ........................................................................................................................ 2 1.2 Primary Energy Production ...................................................................................................................... 4 1.3 Primary Energy Consumption .................................................................................................................. 6 1.4 a Primary Energy Imports and Exports ....................................................................................................... 8 1.4 b Primary Energy Net Imports .................................................................................................................... 9 1.5 Merchandise Trade Value ...................................................................................................................... 12 1.6 Cost of Fuels to End Users in Real (1982–1984) Dollars ...................................................................... 14 1.7 Primary Energy Consumption and Energy Expenditures Indicators ...................................................... 16 1.8 Motor Vehicle Mileage, Fuel Consumption, and Fuel Economy, 1949–2016 ....................................... 18
Section 2. Energy Consumption by Sector 2.1 Energy Consumption by Sector .............................................................................................................. 34 2.2 Residential Sector Energy Consumption ................................................................................................ 36 2.3 Commercial Sector Energy Consumption .............................................................................................. 38 2.4 Industrial Sector Energy Consumption .................................................................................................. 40 2.5 Transportation Sector Energy Consumption .......................................................................................... 42 2.6 Electric Power Sector Energy Consumption .......................................................................................... 44
Section 3. Petroleum 3.1 Petroleum Overview ............................................................................................................................... 56 3.2 Refinery and Blender Net Inputs and Net Production ............................................................................ 58 3.3 Petroleum Trade
3.3a Overview ..................................................................................................................................... 60 3.3 b Imports and Exports by Type ...................................................................................................... 62
3.4 Petroleum Stocks .................................................................................................................................... 68 3.5 Petroleum Products Supplied by Type ................................................................................................... 70 3.6 Heat Content of Petroleum Products Supplied by Type ......................................................................... 72 3.7 Petroleum Consumption by Sector ......................................................................................................... 74 3.8 a Heat Content of Petroleum Consumption by End-User Sector, 1949–2017 .......................................... 78 3.8b Heat Content of Petroleum Consumption by End-User Sector, Monthly ............................................... 79
Section 4. Natural Gas 4.1 Natural Gas ............................................................................................................................................ 96
Section 5. Crude Oil and Natural Gas Resource Development 5.1 Crude Oil and Natural Gas Resource Development Indicators ............................................................ 106
Section 6. Coal 6.1 Coal ...................................................................................................................................................... 112
Section 7. Electricity 7.1 Electricity Overview ............................................................................................................................ 122 7.2 Electricity Net Generation .................................................................................................................... 124 7.3 Consumption of Selected Combustible Fuels for Electricity Generation ............................................. 128 7.4 Consumption of Selected Combustible Fuels for Electricity Generation and
Useful Thermal Output ..................................................................................................................... 132 7.5 Stocks of Coal and Petroleum: Electric Power Sector ........................................................................ 136 7.6 Electricity End Use .............................................................................................................................. 138

viii
U. S. Energy Information Administration / Monthly Energy Review March 2019
Figures
Page
Section 8. Nuclear Energy 8.1 Nuclear Energy Overview .................................................................................................................... 146 8.2 Uranium Overview ............................................................................................................................... 148
Section 9. Energy Prices 9.1 Petroleum Prices .................................................................................................................................. 152 9.2 Average Retail Prices of Electricity ..................................................................................................... 160 9.3 Cost of Fossil-Fuel Receipts at Electric Generating Plants .................................................................. 162 9.4 Natural Gas Prices ................................................................................................................................ 164
Section 10. Renewable Energy 10.1 Renewable Energy Consumption ......................................................................................................... 172
Section 11. International Petroleum 11.1 World Crude Oil Production
11.1a Overview ................................................................................................................................ 192 11.1b By Selected Countries ............................................................................................................ 193
11.2 Petroleum Consumption in OECD Countries....................................................................................... 196 11.3 Petroleum Stocks in OECD Countries ................................................................................................. 198
Section 12. Environment 12.1 Carbon Dioxide Emissions From Energy Consumption by Source ..................................................... 202 12.2 Carbon Dioxide Emissions From Energy Consumption by Sector ...................................................... 204

1. Energy
Overview

2 U. S. Energy Information Administration / Monthly Energy Review March 2019
Figure 1.1 Primary Energy Overview (Quadrillion Btu)
Imports
Production
Consumption
Exports
0
20
40
60
80
100
120
1950 1955 1960 1965 1970 1975 1980 1985 1990 1995 2000 2005 2010 2015
Overview, 1949–2018
Imports
Production
Consumption
Exports 0
2
4
6
8
10
12
J F M A M J J A S O N D J F M A M J J A S O N D J F M A M J J A S O N D
2016 2017 2018
By Source, Monthly
8.440
1.957 1.952
9.058
0
2
4
6
8
10
Production Imports Exports Consumption
Overview, December 2018
11.259
7.507
3.611
0
3
6
9
12
2016 2017 2018
Net Imports, January–December
Web Page: http://www.eia.gov/totalenergy/data/monthly/#summary.
Source: Table 1.1.

U. S. Energy Information Administration / Monthly Energy Review March 2019 3
Table 1.1 Primary Energy Overview (Quadrillion Btu)
Production TradeStock
Changeand
Otherd
Consumption
FossilFuelsa
NuclearElectricPower
Renew-able
Energyb Total Imports ExportsNet
ImportscFossilFuelse
NuclearElectricPower
Renew-able
Energyb Totalf
1950 Total .................... 32.563 0.000 2.978 35.540 1.913 1.465 0.448 -1.372 31.632 0.000 2.978 34.6161955 Total .................... 37.364 .000 2.784 40.148 2.790 2.286 .504 -.444 37.410 .000 2.784 40.2081960 Total .................... 39.869 .006 2.928 42.803 4.188 1.477 2.710 -.427 42.137 .006 2.928 45.0861965 Total .................... 47.235 .043 3.396 50.674 5.892 1.829 4.063 -.722 50.577 .043 3.396 54.0151970 Total .................... 59.186 .239 4.070 63.495 8.342 2.632 5.709 -1.367 63.522 .239 4.070 67.8381975 Total .................... 54.733 1.900 4.687 61.320 14.032 2.323 11.709 -1.065 65.357 1.900 4.687 71.9651980 Total .................... 59.008 2.739 5.428 67.175 15.796 3.695 12.101 -1.210 69.828 2.739 5.428 78.0671985 Total .................... 57.539 4.076 6.084 67.698 11.781 4.196 7.584 1.110 66.093 4.076 6.084 76.3921990 Total .................... 58.560 6.104 6.040 70.704 18.817 4.752 14.065 -.284 72.332 6.104 6.040 84.4851995 Total .................... 57.540 7.075 6.557 71.173 22.180 4.496 17.684 2.134 77.222 7.075 6.559 90.9912000 Total .................... 57.366 7.862 6.102 71.330 28.865 3.962 24.904 2.543 84.694 7.862 6.104 98.7762001 Total .................... 58.541 8.029 5.162 71.732 30.052 3.731 26.321 -1.924 82.865 8.029 5.160 96.1292002 Total .................... 56.834 8.145 5.731 70.710 29.331 3.608 25.722 1.172 83.662 8.145 5.726 97.6052003 Total .................... 56.033 7.960 5.942 69.935 31.007 4.013 26.994 .969 83.972 7.960 5.944 97.8982004 Total .................... 55.942 8.223 6.063 70.228 33.492 4.351 29.141 .704 85.737 8.223 6.075 100.0732005 Total .................... 55.049 8.161 6.221 69.431 34.659 4.462 30.197 .540 85.689 8.161 6.233 100.1682006 Total .................... 55.934 8.215 6.586 70.735 34.649 4.727 29.921 -1.192 84.550 8.215 6.637 99.4642007 Total .................... 56.429 8.459 6.510 71.398 34.679 5.338 29.341 .232 85.883 8.459 6.523 100.9712008 Total .................... 57.587 8.426 7.191 73.205 32.970 6.949 26.021 -.401 83.112 8.426 7.174 98.8252009 Total .................... 56.661 8.355 7.624 72.641 29.690 6.920 22.770 -1.388 77.944 8.355 7.608 94.0232010 Total .................... 58.222 8.434 8.313 74.969 29.866 8.176 21.690 .949 80.818 8.434 8.266 97.6082011 Total .................... 60.567 8.269 9.298 78.134 28.748 10.373 18.375 .439 79.350 8.269 9.203 96.9492012 Total .................... 62.334 8.062 8.884 79.280 27.068 11.267 15.801 -.603 77.409 8.062 8.845 94.4772013 Total .................... 64.200 8.244 9.418 81.862 24.623 11.788 12.835 2.521 79.326 8.244 9.451 97.2182014 Total .................... 69.642 8.338 9.766 87.746 23.241 12.270 10.971 -.336 80.122 8.338 9.740 98.3812015 Total .................... 70.259 8.337 9.728 88.324 23.794 12.902 10.892 -1.732 79.200 8.337 9.719 97.484
2016 January ................ 5.604 .759 .875 7.238 2.103 1.099 1.004 .821 7.424 .759 .859 9.063 February .............. 5.265 .687 .865 6.816 2.027 1.038 .989 .426 6.673 .687 .855 8.231 March ................... 5.506 .692 .942 7.140 2.135 1.167 .968 -.122 6.344 .692 .932 7.986 April ..................... 5.183 .656 .891 6.731 2.026 1.123 .904 -.183 5.894 .656 .887 7.452 May ...................... 5.400 .696 .902 6.998 2.165 1.243 .923 -.339 5.968 .696 .899 7.582 June ..................... 5.340 .703 .859 6.901 2.071 1.190 .881 .153 6.358 .703 .853 7.935 July ...................... 5.532 .736 .870 7.138 2.254 1.131 1.123 .208 6.837 .736 .872 8.469 August ................. 5.627 .748 .822 7.197 2.211 1.186 1.025 .315 6.943 .748 .823 8.537 September ........... 5.384 .685 .788 6.857 2.098 1.184 .914 -.025 6.258 .685 .787 7.745 October ................ 5.642 .635 .835 7.113 2.058 1.124 .934 -.395 6.167 .635 .831 7.651 November ............ 5.517 .682 .835 7.034 2.105 1.263 .842 -.163 6.178 .682 .833 7.713 December ............ 5.509 .750 .941 7.199 2.124 1.372 .752 1.128 7.379 .750 .935 9.080 Total .................... 65.507 8.427 10.427 84.360 25.378 14.119 11.259 1.824 78.424 8.427 10.366 97.444
2017 January ................ 5.620 .765 .926 7.311 2.315 1.382 .933 .738 7.292 .765 .904 8.982 February .............. 5.209 .665 .867 6.741 1.959 1.387 .572 .309 6.089 .665 .852 7.623 March ................... 5.698 .681 1.022 7.401 2.195 1.467 .728 .301 6.723 .681 1.009 8.430 April ..................... 5.433 .593 .997 7.023 2.112 1.429 .683 -.254 5.851 .593 .993 7.452 May ...................... 5.663 .641 1.035 7.339 2.264 1.459 .805 -.344 6.110 .641 1.034 7.800 June ..................... 5.610 .701 .990 7.302 2.117 1.430 .688 -.025 6.254 .701 .991 7.964 July ...................... 5.747 .746 .932 7.425 2.129 1.459 .670 .337 6.742 .746 .926 8.432 August ................. 5.895 .757 .874 7.526 2.153 1.392 .760 .011 6.652 .757 .869 8.297 September ........... 5.670 .712 .852 7.234 1.993 1.481 .512 -.116 6.060 .712 .842 7.630 October ................ 5.988 .690 .924 7.603 2.067 1.686 .382 -.146 6.223 .690 .913 7.838 November ............ 5.941 .697 .921 7.559 2.027 1.671 .356 .214 6.517 .697 .905 8.129 December ............ 6.066 .771 .959 7.795 2.136 1.718 .417 1.016 7.504 .771 .940 9.229 Total .................... 68.541 8.419 11.298 88.258 25.467 17.960 7.507 2.042 78.017 8.419 11.179 97.807
2018 January ................ R 5.958 .781 1.002 R 7.741 R 2.232 R 1.605 R .627 R 1.287 R 7.872 .781 R .988 9.655 February .............. R 5.569 .678 R .950 R 7.197 R 1.864 R 1.521 R .344 R .536 R 6.464 .678 .924 8.077 March ................... R 6.222 .701 1.032 R 7.955 R 2.119 R 1.694 R .425 R .303 6.950 .701 1.018 R 8.683 April ..................... R 5.934 .618 R 1.034 R 7.586 R 2.126 R 1.786 R .340 R -.043 R 6.239 .618 R 1.016 R 7.883 May ...................... R 6.190 .704 1.060 R 7.954 R 2.146 R 1.751 R .394 R -.328 R 6.249 .704 1.053 R 8.020 June ..................... R 6.088 .729 1.051 R 7.868 R 2.177 R 1.763 R .414 R -.138 6.365 .729 1.036 8.144 July ...................... R 6.387 .758 .946 R 8.090 R 2.162 R 1.834 R .328 R .189 R 6.905 .758 R .929 R 8.608 August ................. R 6.658 .756 .958 R 8.372 R 2.195 R 1.722 R .473 R -.151 R 6.978 .756 R .943 R 8.694 September ........... R 6.418 .677 .874 R 7.969 R 2.001 R 1.755 R .245 R -.355 6.317 .677 .854 7.859 October ................ R 6.686 .621 R .912 R 8.219 R 1.976 R 1.899 R .077 R -.194 R 6.577 .621 .894 R 8.102 November ............ R 6.545 .669 R .928 R 8.141 R 1.887 R 1.949 R -.062 R .406 R 6.899 .669 R .908 R 8.485 December ............ 6.722 .749 .969 8.440 1.957 1.952 .005 .612 7.346 .749 .952 9.058 Total .................... 75.376 8.441 11.716 95.533 24.841 21.230 3.611 2.124 81.161 8.441 11.515 101.268
a Coal, natural gas (dry), crude oil, and natural gas plant liquids.b See Tables 10.1–10.2c for notes on series components and estimation; and
see Note, "Renewable Energy Production and Consumption," at end of Section 10.c Net imports equal imports minus exports.d Includes petroleum stock change and adjustments; natural gas net storage
withdrawals and balancing item; coal stock change, losses, and unaccounted for;fuel ethanol stock change; and biodiesel stock change and balancing item.
e Coal, coal coke net imports, natural gas, and petroleum.f Also includes electricity net imports.
R=Revised.
Notes: • See "Primary Energy," "Primary Energy Production," and "PrimaryEnergy Consumption," in Glossary. • Totals may not equal sum of componentsdue to independent rounding. • Geographic coverage is the 50 states and theDistrict of Columbia.
Web Page: See http://www.eia.gov/totalenergy/data/monthly/#summary (Exceland CSV files) for all available annual data beginning in 1949 and monthly databeginning in 1973.
Sources: • Production: Table 1.2. • Trade: Tables 1.4a and 1.4b. • StockChange and Other: Calculated as consumption minus production and net imports. • Consumption: Table 1.3.

4 U. S. Energy Information Administration / Monthly Energy Review March 2019
Figure 1.2 Primary Energy Production (Quadrillion Btu)
Coal
Natural Gas
Nuclear Electric Power
Crude Oil and NGPL [a]
Renewable Energy
0
5
10
15
20
25
30
35
1950 1955 1960 1965 1970 1975 1980 1985 1990 1995 2000 2005 2010 2015
By Source, 1949–2018
Coal
Natural Gas
Crude Oil and NGPL [a]
Nuclear Electric Power
Renewable Energy
0.0
0.5
1.0
1.5
2.0
2.5
3.0
J F M A M J J A S O N D J F M A M J J A S O N D J F M A M J J A S O N D
2016 2017 2018
By Source, Monthly
84.36088.258
95.533
0
30
60
90
120
2016 2017 2018
Total, January–December
0.749
0.969
1.271
2.607
2.845
0.0 0.5 1.0 1.5 2.0 2.5 3.0
Nuclear Electric Power
Renewable Energy
Coal
Crude Oil and NGPL [a]
Natural Gas
By Source, December 2018
[a] National gas plant liquids.
Web Page: http://www.eia.gov/totalenergy/data/monthly/#summary.
Source: Table 1.2.

U. S. Energy Information Administration / Monthly Energy Review March 2019 5
Table 1.2 Primary Energy Production by Source (Quadrillion Btu)
Fossil Fuels
NuclearElectricPower
Renewable Energya
TotalCoalb
NaturalGas(Dry)
Crude Oilc NGPLd Total
Hydro-electricPowere
Geo-thermal Solar Wind
Bio-mass Total
1950 Total .................. 14.060 6.233 11.447 0.823 32.563 0.000 1.415 NA NA NA 1.562 2.978 35.5401955 Total .................. 12.370 9.345 14.410 1.240 37.364 .000 1.360 NA NA NA 1.424 2.784 40.1481960 Total .................. 10.817 12.656 14.935 1.461 39.869 .006 1.608 (s) NA NA 1.320 2.928 42.8031965 Total .................. 13.055 15.775 16.521 1.883 47.235 .043 2.059 .002 NA NA 1.335 3.396 50.6741970 Total .................. 14.607 21.666 20.401 2.512 59.186 .239 2.634 .006 NA NA 1.431 4.070 63.4951975 Total .................. 14.989 19.640 17.729 2.374 54.733 1.900 3.155 .034 NA NA 1.499 4.687 61.3201980 Total .................. 18.598 19.908 18.249 2.254 59.008 2.739 2.900 .053 NA NA 2.475 5.428 67.1751985 Total .................. 19.325 16.980 18.992 2.241 57.539 4.076 2.970 .097 (s) (s) 3.016 6.084 67.6981990 Total .................. 22.488 18.326 15.571 2.175 58.560 6.104 3.046 .171 .059 .029 2.735 6.040 70.7041995 Total .................. 22.130 19.082 13.887 2.442 57.540 7.075 3.205 .152 .068 .033 3.099 6.557 71.1732000 Total .................. 22.735 19.662 12.358 2.611 57.366 7.862 2.811 .164 .063 .057 3.006 6.102 71.3302001 Total .................. 23.547 20.166 12.282 2.547 58.541 8.029 2.242 .164 .062 .070 2.624 5.162 71.7322002 Total .................. 22.732 19.382 12.160 2.559 56.834 8.145 2.689 .171 .060 .105 2.705 5.731 70.7102003 Total .................. 22.094 19.633 11.960 2.346 56.033 7.960 2.793 .173 .058 .113 2.805 5.942 69.9352004 Total .................. 22.852 19.074 11.550 2.466 55.942 8.223 2.688 .178 .058 .142 2.996 6.063 70.2282005 Total .................. 23.185 18.556 10.974 2.334 55.049 8.161 2.703 .181 .058 .178 3.101 6.221 69.4312006 Total .................. 23.790 19.022 10.767 2.356 55.934 8.215 2.869 .181 .061 .264 3.212 6.586 70.7352007 Total .................. 23.493 19.786 10.741 2.409 56.429 8.459 2.446 .186 .065 .341 3.472 6.510 71.3982008 Total .................. 23.851 20.703 10.613 2.419 57.587 8.426 2.511 .192 .074 .546 3.868 7.191 73.2052009 Total .................. 21.624 21.139 11.324 2.574 56.661 8.355 2.669 .200 .078 .721 3.957 7.624 72.6412010 Total .................. 22.038 21.806 11.596 2.781 58.222 8.434 2.539 .208 .090 .923 4.553 8.313 74.9692011 Total .................. 22.221 23.406 11.970 2.970 60.567 8.269 3.103 .212 .111 1.168 4.704 9.298 78.1342012 Total .................. 20.677 24.610 13.801 3.246 62.334 8.062 2.629 .212 .157 1.340 4.547 8.884 79.2802013 Total .................. 20.001 24.859 15.807 3.532 64.200 8.244 2.562 .214 .225 1.601 4.816 9.418 81.8622014 Total .................. 20.286 26.718 18.542 4.096 69.642 8.338 2.467 .214 .337 1.728 5.020 9.766 87.7462015 Total .................. 17.946 28.067 19.679 4.567 70.259 8.337 2.321 .212 .426 1.777 4.992 9.728 88.324
2016 January .............. 1.222 2.365 1.631 .385 5.604 .759 .236 .018 .026 .170 .425 .875 7.238 February ............ 1.156 2.243 1.503 .363 5.265 .687 .223 .017 .035 .186 .404 .865 6.816 March ................. 1.115 2.371 1.611 .409 5.506 .692 .253 .018 .043 .203 .425 .942 7.140 April ................... .971 2.293 1.522 .398 5.183 .656 .239 .016 .048 .192 .396 .891 6.731 May .................... 1.069 2.342 1.565 .423 5.400 .696 .235 .018 .055 .174 .420 .902 6.998 June ................... 1.198 2.245 1.488 .408 5.340 .703 .215 .017 .056 .151 .421 .859 6.901 July .................... 1.246 2.339 1.532 .415 5.532 .736 .198 .017 .061 .163 .431 .870 7.138 August ............... 1.376 2.320 1.538 .393 5.627 .748 .181 .018 .061 .125 .437 .822 7.197 September ......... 1.309 2.231 1.462 .382 5.384 .685 .151 .017 .055 .151 .413 .788 6.857 October .............. 1.379 2.296 1.559 .408 5.642 .635 .160 .018 .049 .188 .421 .835 7.113 November .......... 1.350 2.241 1.526 .401 5.517 .682 .174 .018 .041 .179 .423 .835 7.034 December .......... 1.276 2.289 1.557 .386 5.509 .750 .208 .019 .037 .214 .464 .941 7.199 Total .................. 14.667 27.576 18.494 4.770 65.507 8.427 2.472 .210 .569 2.096 5.081 10.427 84.360
2017 January .............. 1.382 2.281 1.568 .389 5.620 .765 .247 .018 .033 .183 .445 .926 7.311 February ............ 1.300 2.078 1.456 .376 5.209 .665 .218 .016 .040 .195 .398 .867 6.741 March ................. 1.299 2.354 1.622 .423 5.698 .681 .270 .018 .062 .230 .442 1.022 7.401 April ................... 1.184 2.281 1.560 .409 5.433 .593 .271 .018 .069 .227 .412 .997 7.023 May .................... 1.252 2.353 1.626 .432 5.663 .641 .298 .017 .081 .207 .432 1.035 7.339 June ................... 1.335 2.295 1.558 .422 5.610 .701 .278 .016 .086 .183 .427 .990 7.302 July .................... 1.271 2.400 1.638 .438 5.747 .746 .244 .018 .083 .147 .439 .932 7.425 August ............... 1.424 2.400 1.640 .432 5.895 .757 .201 .018 .079 .125 .450 .874 7.526 September ......... 1.269 2.357 1.630 .414 5.670 .712 .176 .017 .073 .164 .421 .852 7.234 October .............. 1.336 2.470 1.721 .461 5.988 .690 .168 .017 .068 .233 .438 .924 7.603 November .......... 1.296 2.455 1.735 .456 5.941 .697 .189 .017 .050 .222 .443 .921 7.559 December .......... 1.277 2.552 1.781 .455 6.066 .771 .206 .020 .049 .226 .458 .959 7.795 Total .................. 15.625 28.274 19.535 5.107 68.541 8.419 2.767 .210 .774 2.343 5.204 11.298 88.258
2018 January .............. 1.252 E 2.502 RE 1.768 R .437 R 5.958 .781 .236 .018 .050 R .247 .451 1.002 R 7.741 February ............ 1.216 E 2.302 RE 1.637 R .415 R 5.569 .678 .235 .017 .058 .222 R .418 R .950 R 7.197 March ................. 1.321 E 2.574 RE 1.850 R .476 R 6.222 .701 .239 .018 R .075 .251 .448 1.032 R 7.955 April ................... 1.170 E 2.500 RE 1.793 R .471 R 5.934 .618 .253 .017 .089 .247 .429 R 1.034 R 7.586 May .................... 1.234 E 2.611 RE 1.851 R .493 R 6.190 .704 .280 .019 .099 .217 R .444 1.060 R 7.954 June ................... 1.242 E 2.541 RE 1.827 R .478 R 6.088 .729 .258 .018 .107 R .225 .445 1.051 R 7.868 July .................... 1.271 E 2.678 RE 1.934 R .504 R 6.387 .758 .221 .019 .100 .148 .459 .946 R 8.090 August ............... 1.398 E 2.735 RE 2.003 R .522 R 6.658 .756 .197 .019 .099 .180 .464 .958 R 8.372 September ......... 1.259 E 2.684 RE 1.963 R .512 R 6.418 .677 .172 .018 .090 .166 .428 .874 R 7.969 October .............. 1.318 RE 2.800 RE 2.044 R .523 R 6.686 .621 .173 .018 .075 .195 R .451 R .912 R 8.219 November .......... 1.256 RE 2.746 RE 2.038 R .505 R 6.545 .669 .204 .018 .058 .207 R .440 R .928 R 8.141 December .......... 1.271 E 2.845 E 2.096 .511 6.722 .749 .219 .019 .050 .229 .453 .969 8.440 Total .................. 15.208 E 31.519 E 22.802 5.846 75.376 8.441 2.688 .217 .949 2.533 5.329 11.716 95.533
a Most data are estimates. See Tables 10.1–10.2c for notes on seriescomponents and estimation; and see Note, "Renewable Energy Production andConsumption," at end of Section 10.
b Beginning in 1989, includes waste coal supplied. Beginning in 2001, alsoincludes a small amount of refuse recovery. See Table 6.1.
c Includes lease condensate.d Natural gas plant liquids.e Conventional hydroelectric power.
R=Revised. E=Estimate. NA=Not available. (s)=Less than 0.5 trillion Btu. Notes: • See "Primary Energy Production" in Glossary. • Totals may not equal
sum of components due to independent rounding. • Geographic coverage is the50 states and the District of Columbia.
Web Page: See http://www.eia.gov/totalenergy/data/monthly/#summary (Exceland CSV files) for all available annual data beginning in 1949 and monthly databeginning in 1973.
Sources: See end of section.

6 U. S. Energy Information Administration / Monthly Energy Review March 2019
Figure 1.3 Primary Energy Consumption (Quadrillion Btu)
Coal
Natural Gas
Nuclear Electric Power
Petroleum
Renewable Energy
0
15
30
45
1950 1955 1960 1965 1970 1975 1980 1985 1990 1995 2000 2005 2010 2015
By Source, [a] 1949–2018
Coal
Renewable Energy
Natural Gas
Nuclear Electric Power
Petroleum
0
1
2
3
4
J F M A M J J A S O N D J F M A M J J A S O N D J F M A M J J A S O N D
2016 2017 2018
By Source, [a] Monthly
97.444 97.807101.268
0
30
60
90
120
2016 2017 2018
Total, January–December
0.749
0.952
1.160
3.072
3.116
0.0 0.5 1.0 1.5 2.0 2.5 3.0 3.5
Nuclear Electric Power
Renewable Energy
Coal
Natural Gas
Petroleum
By Source, [a] December 2018
[a] Small quantities of net imports of coal coke and electricity are not shown.
Web Page: http://www.eia.gov/totalenergy/data/monthly/#summary.
Source: Table 1.3.

U. S. Energy Information Administration / Monthly Energy Review March 2019 7
Table 1.3 Primary Energy Consumption by Source (Quadrillion Btu)
Fossil Fuelsa
NuclearElectricPower
Renewable Energyb
TotalgCoalNatural
GascPetro-leumd Totale
Hydro-electricPowerf
Geo-thermal Solar Wind
Bio-mass Total
1950 Total .................... 12.347 5.968 13.315 31.632 0.000 1.415 NA NA NA 1.562 2.978 34.6161955 Total .................... 11.167 8.998 17.255 37.410 .000 1.360 NA NA NA 1.424 2.784 40.2081960 Total .................... 9.838 12.385 19.919 42.137 .006 1.608 (s) NA NA 1.320 2.928 45.0861965 Total .................... 11.581 15.769 23.246 50.577 .043 2.059 .002 NA NA 1.335 3.396 54.0151970 Total .................... 12.265 21.795 29.521 63.522 .239 2.634 .006 NA NA 1.431 4.070 67.8381975 Total .................... 12.663 19.948 32.732 65.357 1.900 3.155 .034 NA NA 1.499 4.687 71.9651980 Total .................... 15.423 20.235 34.205 69.828 2.739 2.900 .053 NA NA 2.475 5.428 78.0671985 Total .................... 17.478 17.703 30.925 66.093 4.076 2.970 .097 (s) (s) 3.016 6.084 76.3921990 Total .................... 19.173 19.603 33.552 72.332 6.104 3.046 .171 .059 .029 2.735 6.040 84.4851995 Total .................... 20.089 22.671 34.401 77.222 7.075 3.205 .152 .068 .033 3.101 6.559 90.9912000 Total .................... 22.580 23.824 38.226 84.694 7.862 2.811 .164 .063 .057 3.008 6.104 98.7762001 Total .................... 21.914 22.773 38.149 82.865 8.029 2.242 .164 .062 .070 2.622 5.160 96.1292002 Total .................... 21.904 23.510 38.187 83.662 8.145 2.689 .171 .060 .105 2.701 5.726 97.6052003 Total .................... 22.321 22.831 38.770 83.972 7.960 2.793 .173 .058 .113 2.806 5.944 97.8982004 Total .................... 22.466 22.923 40.210 85.737 8.223 2.688 .178 .058 .142 3.008 6.075 100.0732005 Total .................... 22.797 22.565 40.283 85.689 8.161 2.703 .181 .058 .178 3.114 6.233 100.1682006 Total .................... 22.447 22.239 39.803 84.550 8.215 2.869 .181 .061 .264 3.262 6.637 99.4642007 Total .................... 22.749 23.663 39.445 85.883 8.459 2.446 .186 .065 .341 3.485 6.523 100.9712008 Total .................... 22.387 23.843 36.841 83.112 8.426 2.511 .192 .074 .546 3.851 7.174 98.8252009 Total .................... 19.691 23.416 34.860 77.944 8.355 2.669 .200 .078 .721 3.940 7.608 94.0232010 Total .................... 20.834 24.575 35.416 80.818 8.434 2.539 .208 .090 .923 4.506 8.266 97.6082011 Total .................... 19.658 24.955 34.727 79.350 8.269 3.103 .212 .111 1.168 4.609 9.203 96.9492012 Total .................... 17.378 26.089 33.939 77.409 8.062 2.629 .212 .157 1.340 4.508 8.845 94.4772013 Total .................... 18.039 26.805 34.500 79.326 8.244 2.562 .214 .225 1.601 4.848 9.451 97.2182014 Total .................... 17.998 27.383 34.763 80.122 8.338 2.467 .214 .337 1.728 4.994 9.740 98.3812015 Total .................... 15.549 28.191 35.478 79.200 8.337 2.321 .212 .426 1.777 4.983 9.719 97.484
2016 January ................ 1.297 3.201 2.927 7.424 .759 .236 .018 .026 .170 .408 .859 9.063 February .............. 1.074 2.746 2.853 6.673 .687 .223 .017 .035 .186 .395 .855 8.231 March ................... .867 2.438 3.039 6.344 .692 .253 .018 .043 .203 .416 .932 7.986 April ..................... .844 2.156 2.895 5.894 .656 .239 .016 .048 .192 .392 .887 7.452 May ...................... .960 2.033 2.975 5.968 .696 .235 .018 .055 .174 .417 .899 7.582 June ..................... 1.314 2.070 2.974 6.358 .703 .215 .017 .056 .151 .415 .853 7.935 July ...................... 1.529 2.262 3.047 6.837 .736 .198 .017 .061 .163 .432 .872 8.469 August ................. 1.521 2.285 3.139 6.943 .748 .181 .018 .061 .125 .438 .823 8.537 September ........... 1.296 2.015 2.948 6.258 .685 .151 .017 .055 .151 .412 .787 7.745 October ................ 1.147 1.991 3.031 6.167 .635 .160 .018 .049 .188 .417 .831 7.651 November ............ 1.022 2.235 2.926 6.178 .682 .174 .018 .041 .179 .421 .833 7.713 December ............ 1.352 2.967 3.062 7.379 .750 .208 .019 .037 .214 .457 .935 9.080 Total .................... 14.226 28.400 35.817 78.424 8.427 2.472 .210 .569 2.096 5.020 10.366 97.444
2017 January ................ 1.313 3.012 2.970 7.292 .765 .247 .018 .033 .183 .422 .904 8.982 February .............. 1.011 2.418 2.661 6.089 .665 .218 .016 .040 .195 .383 .852 7.623 March ................... 1.029 2.608 3.087 6.723 .681 .270 .018 .062 .230 .429 1.009 8.430 April ..................... .937 1.995 2.920 5.851 .593 .271 .018 .069 .227 .408 .993 7.452 May ...................... 1.066 1.953 3.093 6.110 .641 .298 .017 .081 .207 .431 1.034 7.800 June ..................... 1.218 1.972 3.067 6.254 .701 .278 .016 .086 .183 .428 .991 7.964 July ...................... 1.433 2.212 3.099 6.742 .746 .244 .018 .083 .147 .434 .926 8.432 August ................. 1.356 2.163 3.137 6.652 .757 .201 .018 .079 .125 .445 .869 8.297 September ........... 1.140 1.983 2.939 6.060 .712 .176 .017 .073 .164 .411 .842 7.630 October ................ 1.051 2.097 3.080 6.223 .690 .168 .017 .068 .233 .427 .913 7.838 November ............ 1.069 2.433 3.018 6.517 .697 .189 .017 .050 .222 .426 .905 8.129 December ............ 1.216 3.187 3.104 7.504 .771 .206 .020 .049 .226 .439 .940 9.229 Total .................... 13.837 28.034 36.174 78.017 8.419 2.767 .210 .774 2.343 5.084 11.179 97.807
2018 January ................ 1.330 R 3.421 3.125 R 7.872 .781 .236 .018 .050 R .247 .437 R .988 9.655 February .............. .963 2.790 2.711 R 6.464 .678 .235 .017 .058 .222 R .391 .924 8.077 March ................... .941 2.865 3.146 6.950 .701 .239 .018 R .075 .251 R .433 1.018 R 8.683 April ..................... .864 2.414 2.963 R 6.239 .618 .253 .017 .089 .247 .411 R 1.016 R 7.883 May ...................... .998 2.115 3.137 R 6.249 .704 .280 .019 .099 .217 R .437 1.053 R 8.020 June ..................... 1.162 R 2.116 R 3.089 6.365 .729 .258 .018 .107 R .225 .429 1.036 8.144 July ...................... 1.313 R 2.423 3.171 R 6.905 .758 .221 .019 .100 .148 .442 R .929 R 8.608 August ................. 1.311 R 2.386 3.284 R 6.978 .756 .197 .019 .099 .180 .448 R .943 R 8.694 September ........... 1.122 2.228 2.968 6.317 .677 .172 .018 .090 .166 R .408 .854 7.859 October ................ 1.026 R 2.352 3.201 R 6.577 .621 .173 .018 .075 .195 .433 .894 R 8.102 November ............ R 1.090 R 2.780 R 3.033 R 6.899 .669 .204 .018 .058 .207 R .421 R .908 R 8.485 December ............ 1.160 3.072 3.116 7.346 .749 .219 .019 .050 .229 .436 .952 9.058 Total .................... 13.280 30.961 36.945 81.161 8.441 2.688 .217 .949 2.533 5.128 11.515 101.268
a Includes non-combustion use of fossil fuels. b Most data are estimates. See Tables 10.1–10.2c for notes on series
components and estimation; and see Note, "Renewable Energy Production andConsumption," at end of Section 10.
c Natural gas only; excludes supplemental gaseous fuels. See Note 3,"Supplemental Gaseous Fuels," at end of Section 4.
d Petroleum products supplied; excludes biofuels that have been blended withpetroleum—biofuels are included in "Biomass."
e Includes coal coke net imports. See Tables 1.4a and 1.4b.f Conventional hydroelectric power.
g Includes coal coke net imports and electricity net imports, which are not
separately displayed. See Tables 1.4a and 1.4b.R=Revised. NA=Not available. (s)=Less than 0.5 trillion Btu. Notes: • See "Primary Energy Consumption" in Glossary.
• See Table D1 for estimated energy consumption for 1635–1945. • Totals maynot equal sum of components due to independent rounding.• Geographic coverage is the 50 states and the District of Columbia.
Web Page: See http://www.eia.gov/totalenergy/data/monthly/#summary (Exceland CSV files) for all available annual data beginning in 1949 and monthly databeginning in 1973.
Sources: See end of section.

8 U. S. Energy Information Administration / Monthly Energy Review March 2019
Figure 1.4a Primary Energy Imports and Exports (Quadrillion Btu)
Natural Gas
Petroleum
Other [a]
0
5
10
15
20
25
30
35
1950 1955 1960 1965 1970 1975 1980 1985 1990 1995 2000 2005 2010 2015
Imports by Source, 1949–2018
Coal [b]
Natural Gas
Petroleum
Electricity
0
2
4
6
8
10
12
14
16
1950 1955 1960 1965 1970 1975 1980 1985 1990 1995 2000 2005 2010 2015
Exports by Source, 1949–2018
Natural Gas
Petroleum
Other [a] 0.0
0.5
1.0
1.5
2.0
2.5
J F M A M J J A S O N D J F M A M J J A S O N D J F M A M J J A S O N D
2016 2017 2018
Imports by Source, Monthly
Coal[b]
Natural Gas
Petroleum
Electricity
0.0
0.2
0.4
0.6
0.8
1.0
1.2
1.4
1.6
J F M A M J J A S O N D J F M A M J J A S O N D J F M A M J J A S O N D
2016 2017 2018
Exports by Major Source, Monthly
[a] Coal, coal coke, biomass, and electricity.
[b] Includes coal coke.
Web Page: http://www.eia.gov/totalenergy/data/monthly/#summary.
Sources: Tables 1.4a and 1.4b.

U. S. Energy Information Administration / Monthly Energy Review March 2019 9
Figure 1.4b Primary Energy Net Imports (Quadrillion Btu)
-5
0
5
10
15
20
25
30
35
1950 1955 1960 1965 1970 1975 1980 1985 1990 1995 2000 2005 2010 2015
Total, 1949–2018
Crude Oil [a]
Petroleum Products [b] Natural Gas
Coal
-6
0
6
12
18
24
1950 1955 1960 1965 1970 1975 1980 1985 1990 1995 2000 2005 2010 2015
By Major Source, 1949–2018
-0.2
0.0
0.2
0.4
0.6
0.8
1.0
1.2
J F M A M J J A S O N D J F M A M J J A S O N D J F M A M J J A S O N D
2016 2017 2018
Total, Monthly
Crude Oil [a]
Petroleum Products [b]
Natural Gas
Coal
-1.0
0.0
1.0
2.0
J F M A M J J A S O N D J F M A M J J A S O N D J F M A M J J A S O N D
2016 2017 2018
By Major Source, Monthly
[a] Crude oil and lease condensate. Includes imports into the Strategic
Petroleum Reserve, which began in 1977.
[b] Petroleum products, unfinished oils natural gasoline, and gasoline
blending components. Does not include biofuels.
Web Page: http://www.eia.gov/totalenergy/data/monthly/#summary.
Sources: Tables 1.4a and 1.4b.

10 U. S. Energy Information Administration / Monthly Energy Review March 2019
Table 1.4a Primary Energy Imports by Source (Quadrillion Btu)
Imports
CoalCoalCoke
NaturalGas
Petroleum
Biomassc Electricity TotalCrudeOila
PetroleumProductsb Total
1950 Total ...................... 0.009 0.011 0.000 1.056 0.830 1.886 NA 0.007 1.9131955 Total ...................... .008 .003 .011 1.691 1.061 2.752 NA .016 2.7901960 Total ...................... .007 .003 .161 2.196 1.802 3.999 NA .018 4.1881965 Total ...................... .005 .002 .471 2.654 2.748 5.402 NA .012 5.8921970 Total ...................... .001 .004 .846 2.814 4.656 7.470 NA .021 8.3421975 Total ...................... .024 .045 .978 8.721 4.227 12.948 NA .038 14.0321980 Total ...................... .030 .016 1.006 11.195 3.463 14.658 NA .085 15.7961985 Total ...................... .049 .014 .952 6.814 3.796 10.609 NA .157 11.7811990 Total ...................... .067 .019 1.551 12.766 4.351 17.117 NA .063 18.8171995 Total ...................... .237 .095 2.901 15.669 3.131 18.800 .001 .146 22.1802000 Total ...................... .313 .094 3.869 19.783 4.641 24.424 (s) .166 28.8652001 Total ...................... .495 .063 4.068 20.348 4.946 25.294 .002 .131 30.0522002 Total ...................... .422 .080 4.104 19.920 4.677 24.597 .002 .125 29.3312003 Total ...................... .626 .068 4.042 21.060 5.105 26.165 .002 .104 31.0072004 Total ...................... .682 .170 4.365 22.082 6.063 28.145 .013 .117 33.4922005 Total ...................... .762 .088 4.450 22.091 7.108 29.198 .012 .150 34.6592006 Total ...................... .906 .101 4.291 22.085 7.054 29.139 .066 .146 34.6492007 Total ...................... .909 .061 4.723 21.914 6.842 28.756 .055 .175 34.6792008 Total ...................... .855 .089 4.084 21.448 6.214 27.662 .085 .195 32.9702009 Total ...................... .566 .009 3.845 19.699 5.367 25.066 .027 .178 29.6902010 Total ...................... .484 .030 3.834 20.140 5.219 25.359 .004 .154 29.8662011 Total ...................... .327 .035 3.555 19.595 5.038 24.633 .019 .178 28.7482012 Total ...................... .212 .028 3.216 19.239 4.122 23.361 .049 .202 27.0682013 Total ...................... .199 .003 2.955 16.957 4.169 21.126 .102 .236 24.6232014 Total ...................... .252 .002 2.763 16.178 3.773 19.951 .046 .227 23.2412015 Total ...................... .256 .003 2.786 16.299 4.111 20.410 .079 .259 23.794
2016 January .................. .015 (s) .280 1.429 .353 1.782 .003 .022 2.103 February ................ .018 (s) .258 1.389 .339 1.728 .003 .019 2.027 March ..................... .026 (s) .247 1.503 .333 1.837 .005 .020 2.135 April ....................... .017 (s) .247 1.382 .357 1.739 .008 .016 2.026 May ........................ .020 .001 .255 1.488 .376 1.864 .008 .019 2.165 June ....................... .014 .002 .248 1.373 .398 1.771 .013 .023 2.071 July ........................ .022 (s) .272 1.519 .402 1.921 .012 .026 2.254 August ................... .021 (s) .269 1.504 .379 1.883 .014 .025 2.211 September ............. .018 .002 .244 1.460 .343 1.804 .012 .018 2.098 October .................. .017 .001 .237 1.420 .350 1.770 .013 .020 2.058 November .............. .016 (s) .237 1.457 .359 1.816 .015 .022 2.105 December .............. .015 (s) .288 1.467 .319 1.786 .017 .019 2.124 Total ...................... .220 .006 3.082 17.392 4.309 21.700 .123 .248 25.378
2017 January .................. .016 (s) .299 1.590 .383 1.973 .003 .024 2.315 February ................ .013 (s) .261 1.334 .327 1.661 .004 .019 1.959 March ..................... .012 (s) .288 1.531 .337 1.869 .006 .021 2.195 April ....................... .011 (s) .244 1.489 .342 1.831 .006 .019 2.112 May ........................ .023 (s) .250 1.592 .374 1.965 .008 .017 2.264 June ....................... .014 .001 .246 1.468 .355 1.824 .013 .020 2.117 July ........................ .021 (s) .257 1.484 .335 1.819 .012 .020 2.129 August ................... .018 (s) .254 1.486 .361 1.847 .011 .022 2.153 September ............. .011 (s) .235 1.329 .396 1.725 .004 .018 1.993 October .................. .012 (s) .250 1.441 .346 1.787 .004 .013 2.067 November .............. .008 (s) .250 1.393 .358 1.751 .005 .013 2.027 December .............. .009 (s) .285 1.460 .362 1.822 .004 .016 2.136 Total ...................... .167 .001 3.118 17.597 4.277 21.874 .081 .224 25.467
2018 January .................. .011 (s) .311 R 1.507 .381 R 1.888 .004 .018 R 2.232 February ................ .008 (s) .247 R 1.273 .318 R 1.591 .003 .016 R 1.864 March ..................... .011 (s) .281 R 1.432 .371 R 1.804 .004 .019 R 2.119 April ....................... .011 .001 .250 R 1.501 .345 R 1.846 .004 .015 R 2.126 May ........................ .012 .001 .235 R 1.472 .405 R 1.877 .004 .018 R 2.146 June ....................... .011 (s) .236 R 1.543 .363 R 1.906 .004 .019 R 2.177 July ........................ .015 (s) .255 R 1.490 .381 R 1.871 .002 .018 R 2.162 August ................... .010 (s) .245 R 1.505 .409 R 1.914 .005 .021 R 2.195 September ............. .006 (s) .221 R 1.381 .375 R 1.756 .003 .015 R 2.001 October .................. .007 .001 .223 R 1.375 .352 R 1.727 .006 .013 R 1.976 November .............. .009 (s) .218 R 1.363 .279 R 1.642 .005 R .013 R 1.887 December .............. .019 (s) .261 1.335 .323 1.658 .004 .014 1.957 Total ...................... .128 .003 2.983 17.177 4.303 21.480 .048 .199 24.841
a Crude oil and lease condensate. Includes imports into the Strategic PetroleumReserve, which began in 1977.
b Petroleum products, unfinished oils, natural gasoline, and gasoline blendingcomponents. Does not include biofuels.
c Fuel ethanol (minus denaturant) and biodiesel.R=Revised. NA=Not available. (s)=Less than 0.5 trillion Btu. Notes: • See "Primary Energy" in Glossary. • Totals may not equal sum of
components due to independent rounding. • Geographic coverage is the 50 statesand the District of Columbia.
Web Page: See http://www.eia.gov/totalenergy/data/monthly/#summary (Exceland CSV files) for all available annual data beginning in 1949 and monthly databeginning in 1973.
Sources: See end of section.

U. S. Energy Information Administration / Monthly Energy Review March 2019 11
Table 1.4b Primary Energy Exports by Source and Total Net Imports (Quadrillion Btu)
Exports NetImportsa
CoalCoalCoke
NaturalGas
Petroleum
Biomassd Electricity Total TotalCrudeOilb
PetroleumProductsc Total
1950 Total ...................... 0.786 0.010 0.027 0.202 0.440 0.642 NA 0.001 1.465 0.4481955 Total ...................... 1.465 .013 .032 .067 .707 .774 NA .002 2.286 .5041960 Total ...................... 1.023 .009 .012 .018 .413 .431 NA .003 1.477 2.7101965 Total ...................... 1.376 .021 .027 .006 .386 .392 NA .013 1.829 4.0631970 Total ...................... 1.936 .061 .072 .029 .520 .549 NA .014 2.632 5.7091975 Total ...................... 1.761 .032 .074 .012 .427 .439 NA .017 2.323 11.7091980 Total ...................... 2.421 .051 .049 .609 .551 1.160 NA .014 3.695 12.1011985 Total ...................... 2.438 .028 .056 .432 1.225 1.657 NA .017 4.196 7.5841990 Total ...................... 2.772 .014 .087 .230 1.594 1.824 NA .055 4.752 14.0651995 Total ...................... 2.318 .034 .156 .200 1.776 1.976 NA .012 4.496 17.6842000 Total ...................... 1.528 .028 .245 .106 2.003 2.110 NA .051 3.962 24.9042001 Total ...................... 1.265 .033 .377 .043 1.956 1.999 (s) .056 3.731 26.3212002 Total ...................... 1.032 .020 .520 .019 1.963 1.982 (s) .054 3.608 25.7222003 Total ...................... 1.117 .018 .686 .026 2.083 2.110 .001 .082 4.013 26.9942004 Total ...................... 1.253 .033 .862 .057 2.068 2.125 .001 .078 4.351 29.1412005 Total ...................... 1.273 .043 .735 .067 2.276 2.344 .001 .065 4.462 30.1972006 Total ...................... 1.264 .040 .730 .052 2.554 2.606 .005 .083 4.727 29.9212007 Total ...................... 1.507 .036 .830 .058 2.803 2.861 .036 .069 5.338 29.3412008 Total ...................... 2.071 .049 .972 .061 3.626 3.686 .089 .083 6.949 26.0212009 Total ...................... 1.515 .032 1.082 .093 4.101 4.194 .035 .062 6.920 22.7702010 Total ...................... 2.101 .036 1.147 .088 4.691 4.780 .047 .065 8.176 21.6902011 Total ...................... 2.751 .024 1.519 .100 5.820 5.919 .108 .051 10.373 18.3752012 Total ...................... 3.087 .024 1.633 .143 6.261 6.404 .078 .041 11.267 15.8012013 Total ...................... 2.895 .021 1.587 .284 6.886 7.170 .076 .039 11.788 12.8352014 Total ...................... 2.435 .023 1.528 .744 7.414 8.158 .081 .045 12.270 10.9712015 Total ...................... 1.852 .021 1.800 .964 8.153 9.118 .080 .031 12.902 10.892
2016 January .................. .114 .001 .170 .087 .713 .800 .013 .001 1.099 1.004 February ................ .116 (s) .164 .075 .666 .742 .014 .002 1.038 .989 March ..................... .134 .001 .197 .106 .712 .818 .016 .002 1.167 .968 April ....................... .118 .001 .179 .107 .699 .807 .016 .002 1.123 .904 May ........................ .108 .001 .190 .140 .788 .928 .014 .001 1.243 .923 June ....................... .139 .002 .185 .091 .757 .848 .014 .002 1.190 .881 July ........................ .084 .001 .190 .095 .746 .841 .012 .002 1.131 1.123 August ................... .128 .003 .216 .128 .694 .822 .015 .002 1.186 1.025 September ............. .110 .003 .204 .133 .716 .850 .016 .002 1.184 .914 October .................. .125 .004 .178 .089 .710 .799 .017 .001 1.124 .934 November .............. .168 .005 .230 .104 .738 .842 .016 .001 1.263 .842 December .............. .203 .002 .253 .083 .811 .894 .017 .002 1.372 .752 Total ...................... 1.546 .025 2.356 1.238 8.752 9.990 .181 .021 14.119 11.259
2017 January .................. .182 .003 .274 .126 .778 .904 .017 .002 1.382 .933 February ................ .170 .001 .257 .184 .754 .938 .018 .002 1.387 .572 March ..................... .197 .002 .274 .165 .807 .972 .018 .003 1.467 .728 April ....................... .178 .001 .249 .194 .787 .981 .015 .004 1.429 .683 May ........................ .178 .001 .256 .195 .808 1.004 .017 .003 1.459 .805 June ....................... .180 .003 .256 .149 .823 .972 .016 .003 1.430 .688 July ........................ .177 .001 .251 .170 .840 1.010 .018 .002 1.459 .670 August ................... .211 .004 .249 .145 .764 .910 .017 .003 1.392 .760 September ............. .219 .002 .253 .252 .738 .990 .015 .002 1.481 .512 October .................. .226 .005 .284 .306 .847 1.153 .016 .002 1.686 .382 November .............. .235 .003 .291 .266 .856 1.122 .016 .003 1.671 .356 December .............. .234 .003 .302 .271 .882 1.152 .024 .003 1.718 .417 Total ...................... 2.388 .030 3.196 2.424 9.684 12.108 .206 .032 17.960 7.507
2018 January .................. .216 .004 .304 R .238 R .826 R 1.064 .013 .004 R 1.605 R .627 February ................ .222 .001 .279 R .257 R .729 R .986 .028 .004 R 1.521 R .344 March ..................... .232 .002 .295 R .296 R .840 R 1.136 .025 .004 R 1.694 R .425 April ....................... .273 .003 .282 R .301 R .899 R 1.201 .022 .006 R 1.786 R .340 May ........................ .238 .002 .276 R .356 R .861 R 1.217 .015 .004 R 1.751 R .394 June ....................... .250 .002 .264 R .378 R .843 R 1.220 .023 .004 R 1.763 R .414 July ........................ .235 .002 .308 R .379 R .889 R 1.268 .017 .003 R 1.834 R .328 August ................... .248 .001 .314 R .310 R .825 R 1.135 .020 .004 R 1.722 R .473 September ............. .234 .001 .305 R .363 R .832 R 1.195 .017 .004 R 1.755 R .245 October .................. .263 .002 .308 R .412 R .884 R 1.297 .025 .003 R 1.899 R .077 November .............. .218 .003 R .340 R .448 R .913 R 1.361 R .022 R .004 R 1.949 R -.062 December .............. .220 .003 .366 .445 .895 1.341 .020 .003 1.952 .005 Total ...................... 2.848 .029 3.639 4.184 10.237 14.421 .247 .047 21.230 3.611
a Net imports equal imports minus exports.b Crude oil and lease condensate.c Petroleum products, unfinished oils, natural gasoline, and gasoline blending
components. Does not include biofuels.d Beginning in 2001, includes biodiesel. Beginning in 2010, also includes fuel
ethanol (minus denaturant). Beginning in 2016, also includes wood andwood-derived fuels.
R=Revised. NA=Not available. (s)=Less than 0.5 trillion Btu.
Notes: • See "Primary Energy" in Glossary. • Totals may not equal sum ofcomponents due to independent rounding. • Geographic coverage is the 50 statesand the District of Columbia.
Web Page: See http://www.eia.gov/totalenergy/data/monthly/#summary (Exceland CSV files) for all available annual data beginning in 1949 and monthly databeginning in 1973.
Sources: See end of section.
12 U. S. Energy Information Administration / Monthly Energy Review March 2019
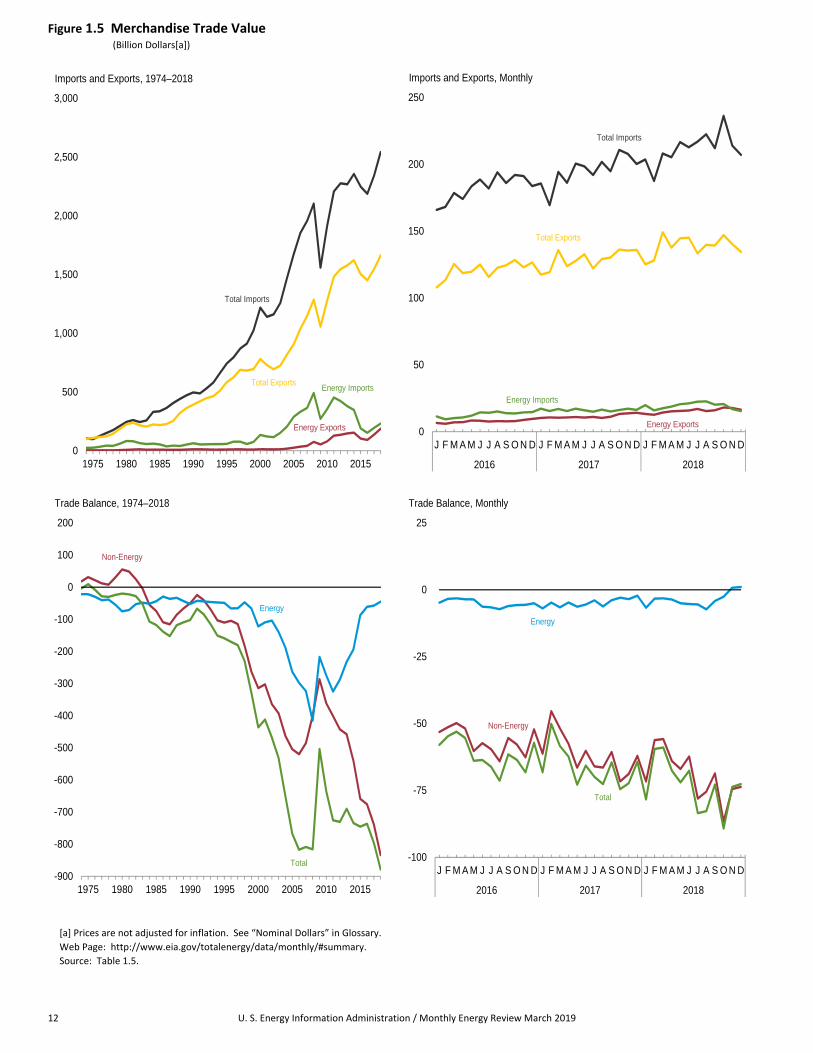
Figure 1.5 Merchandise Trade Value (Billion Dollars[a])
Total Imports
Total Exports Energy Imports
Energy Exports
0
500
1,000
1,500
2,000
2,500
3,000
1975 1980 1985 1990 1995 2000 2005 2010 2015
Imports and Exports, 1974–2018
Energy Exports
Energy Imports
Total Exports
Total Imports
0
50
100
150
200
250
J F M A M J J A S O N D J F M A M J J A S O N D J F M A M J J A S O N D
2016 2017 2018
Imports and Exports, Monthly
Non-Energy
Energy
Total
-900
-800
-700
-600
-500
-400
-300
-200
-100
0
100
200
1975 1980 1985 1990 1995 2000 2005 2010 2015
Trade Balance, 1974–2018
Non-Energy
Energy
Total
-100
-75
-50
-25
0
25
J F M A M J J A S O N D J F M A M J J A S O N D J F M A M J J A S O N D
2016 2017 2018
Trade Balance, Monthly
[a] Prices are not adjusted for inflation. See “Nominal Dollars” in Glossary.
Web Page: http://www.eia.gov/totalenergy/data/monthly/#summary.
Source: Table 1.5.

U. S. Energy Information Administration / Monthly Energy Review March 2019 13
Table 1.5 Merchandise Trade Value (Million Dollarsa)
Petroleumb Energyc Non-EnergyBalance
Total Merchandise
Exports Imports Balance Exports Imports Balance Exports Imports Balance
1974 Total ................ 792 24,668 -23,876 3,444 25,454 -22,010 18,126 99,437 103,321 -3,8841975 Total ................ 907 25,197 -24,289 4,470 26,476 -22,006 31,557 108,856 99,305 9,5511980 Total ................ 2,833 78,637 -75,803 7,982 82,924 -74,942 55,246 225,566 245,262 -19,6961985 Total ................ 4,707 50,475 -45,768 9,971 53,917 -43,946 -73,765 218,815 336,526 -117,7121990 Total ................ 6,901 61,583 -54,682 12,233 64,661 -52,428 -50,068 393,592 496,088 -102,4961995 Total ................ 6,321 54,368 -48,047 10,358 59,109 -48,751 -110,050 584,742 743,543 -158,8012000 Total ................ 10,192 119,251 -109,059 13,179 135,367 -122,188 -313,916 781,918 1,218,022 -436,1042001 Total ................ 8,868 102,747 -93,879 12,494 121,923 -109,429 -302,470 729,100 1,140,999 -411,8992002 Total ................ 8,569 102,663 -94,094 11,541 115,748 -104,207 -364,056 693,103 1,161,366 -468,2632003 Total ................ 10,209 132,433 -122,224 13,768 153,298 -139,530 -392,820 724,771 1,257,121 -532,3502004 Total ................ 13,130 179,266 -166,136 18,642 206,660 -188,018 -462,912 818,775 1,469,704 -650,9302005 Total ................ 19,155 250,068 -230,913 26,488 289,723 -263,235 -504,242 905,978 1,673,455 -767,4772006 Total ................ 28,171 299,714 -271,543 34,711 332,500 -297,789 -519,515 1,036,635 1,853,938 -817,3042007 Total ................ 33,293 327,620 -294,327 41,725 364,987 -323,262 -485,501 1,148,199 1,956,962 -808,7632008 Total ................ 61,695 449,847 -388,152 76,075 491,885 -415,810 -400,389 1,287,442 2,103,641 -816,1992009 Total ................ 44,509 251,833 -207,324 54,536 271,739 -217,203 -286,379 1,056,043 1,559,625 -503,5822010 Total ................ 64,753 333,472 -268,719 80,625 354,982 -274,357 -361,005 1,278,495 1,913,857 -635,3622011 Total ................ b102,180 b431,866 b-329,686 128,989 453,839 -324,850 -400,597 1,482,508 2,207,954 -725,4472012 Total ................ 111,951 408,509 -296,558 136,054 423,862 -287,808 -442,638 1,545,821 2,276,267 -730,4462013 Total ................ 123,218 363,141 -239,923 147,539 379,758 -232,219 -457,712 1,578,439 2,268,370 -689,9312014 Total ................ 127,818 326,709 -198,891 154,498 347,474 -192,976 -541,506 1,621,874 2,356,356 -734,4822015 Total ................ 85,890 177,455 -91,565 103,612 190,501 -86,889 -658,594 1,503,328 2,248,811 -745,483
2016 January ............ 5,354 10,256 -4,902 6,561 11,380 -4,819 -53,163 107,932 165,914 -57,982 February .......... 4,811 8,416 -3,605 5,957 9,326 -3,369 -51,378 113,402 168,149 -54,747 March ............... 5,723 9,395 -3,672 6,980 10,164 -3,184 -49,852 125,480 178,516 -53,036 April ................. 5,878 10,041 -4,163 7,129 10,668 -3,539 -51,824 118,700 174,062 -55,363 May .................. 6,960 11,349 -4,389 8,415 12,013 -3,598 -60,297 119,607 183,503 -63,895 June ................. 6,712 13,734 -7,022 8,192 14,475 -6,283 -57,327 125,080 188,690 -63,610 July .................. 6,259 13,174 -6,915 7,605 14,152 -6,547 -59,558 115,782 181,887 -66,105 August ............. 6,446 14,154 -7,708 7,886 15,129 -7,243 -64,104 122,626 193,973 -71,347 September ....... 6,453 12,937 -6,484 7,782 13,848 -6,066 -55,455 124,474 185,995 -61,521 October ............ 6,205 12,707 -6,502 7,898 13,621 -5,723 -57,827 128,445 191,996 -63,550 November ........ 6,810 13,468 -6,658 8,786 14,408 -5,622 -62,623 122,936 191,181 -68,245 December ........ 7,092 13,269 -6,177 9,566 14,597 -5,031 -52,144 126,558 183,733 -57,175 Total ................ R 74,703 142,900 R -68,197 R 92,757 R 153,781 R -61,024 R -675,553 1,451,024 2,187,600 -736,577
2017 January ............ 7,458 15,772 -8,314 10,329 17,258 -6,929 -61,285 117,458 185,672 -68,214 February .......... 7,799 14,238 -6,439 10,634 15,420 -4,786 -45,354 119,252 169,392 -50,140 March ............... 7,710 15,889 -8,179 10,460 17,030 -6,570 -51,783 135,905 194,258 -58,353 April ................. 8,077 14,440 -6,363 10,714 15,449 -4,735 -57,573 123,842 186,150 -62,308 May .................. 8,374 16,226 -7,852 10,950 17,257 -6,307 -66,508 127,782 200,597 -72,815 June ................. 8,244 15,081 -6,837 10,555 16,062 -5,507 -60,199 132,741 198,447 -65,706 July .................. 8,820 13,991 -5,171 11,083 14,985 -3,902 -66,001 122,140 192,044 -69,903 August ............. 7,799 15,479 -7,680 10,302 16,500 -6,198 -66,437 129,186 201,821 -72,635 September ....... 8,446 14,155 -5,709 11,213 15,105 -3,892 -60,626 130,278 194,796 -64,518 October ............ 10,237 15,247 -5,010 13,294 16,207 -2,913 -71,620 136,199 210,732 -74,533 November ........ 10,676 16,158 -5,482 13,728 17,212 -3,484 -68,809 135,477 207,770 -72,293 December ........ 10,884 14,987 -4,103 14,112 16,298 -2,186 -62,084 136,014 200,285 -64,270 Total ................ 104,525 181,662 -77,137 137,374 194,784 -57,410 -738,280 1,546,273 2,341,963 -795,690
2018 January ............ 10,139 18,086 -7,947 13,231 19,944 -6,713 -71,661 125,219 203,593 -78,374 February .......... 9,504 14,996 -5,492 12,643 15,947 -3,304 -56,179 128,057 187,540 -59,483 March ............... 11,130 16,622 -5,492 14,373 17,567 -3,194 -55,775 149,164 208,133 -58,969 April ................. 11,972 18,002 -6,030 15,200 18,813 -3,613 -64,010 137,648 205,271 -67,623 May .................. 12,098 19,781 -7,683 15,557 20,585 -5,028 -66,981 144,593 216,602 -72,009 June ................. 12,764 20,315 -7,551 15,865 21,188 -5,323 -62,319 145,134 212,775 -67,642 July .................. 13,338 21,549 -8,211 16,988 22,448 -5,460 -78,051 133,429 216,940 -83,511 August ............. 11,836 21,667 -9,831 15,424 22,699 -7,275 -75,450 139,760 222,485 -82,725 September ....... 12,651 19,277 -6,626 16,022 20,207 -4,185 -68,600 139,262 212,047 -72,785 October ............ 14,465 19,713 -5,248 18,130 20,737 -2,607 R -86,640 146,983 R 236,230 R -89,247 November ........ 14,107 15,797 -1,690 17,719 16,930 789 R -74,464 R 140,373 R 214,048 R -73,675 December ........ 12,551 14,040 -1,489 16,467 15,456 1,011 -73,670 134,464 207,123 -72,659 Total ................ 146,555 219,845 -73,290 187,619 232,520 -44,901 -833,801 1,664,085 2,542,788 -878,702
a Prices are not adjusted for inflation. See "Nominal Dollars" in Glossary.b Through 2010, data are for crude oil, petroleum preparations, liquefied
propane and butane, and other mineral fuels. Beginning in 2011, data are forpetroleum products and preparations.
c Petroleum, coal, natural gas, and electricity.R=Revised. Notes: • Monthly data are not adjusted for seasonal variations. • See Note
1, "Merchandise Trade Value," at end of section. • Totals may not equal sum of
components due to independent rounding. • The U.S. import statistics reflectboth government and nongovernment imports of merchandise from foreigncountries into the U.S. customs territory, which comprises the 50 states, theDistrict of Columbia, Puerto Rico, and the Virgin Islands.
Web Page: See http://www.eia.gov/totalenergy/data/monthly/#summary(Excel and CSV files) for all available annual and monthly data beginning in1974.
Sources: See end of section.

14 U. S. Energy Information Administration / Monthly Energy Review March 2019
Figure 1.6 Cost of Fuels to End Users In Real (1982‐1984) Dollars
Motor Gasoline [a]
Residential Natural Gas [a]
Residential Electricity [a]
Residential Heating Oil [b]
0
5
10
15
20
25
30
1960 1965 1970 1975 1980 1985 1990 1995 2000 2005 2010 2015
Dolla
rs p
er
Mill
ion B
tu
Costs, 1960–2018
14.55
8.20
3.70
0
3
6
9
12
15
18
ResidentialElectricity [a]
MotorGasoline [a]
Residential NaturalGas [a]
Dolla
rs p
er
Mill
ion B
tu
Costs, December 2018
0
2
4
6
J F M A M J J A S O N D
Cents
per
Kilo
watthour
Residential Electricity, [a] Monthly
2016 2017 2018
0.00
0.25
0.50
0.75
1.00
1.25
J F M A M J J A S O N D
Dolla
rs p
er
Gallo
n
Motor Gasoline, [a] Monthly
2017 2018 2019
0
2
4
6
8
J F M A M J J A S O N D
Dolla
rs p
er
Thousand C
ubic
Feet
Residential Natural Gas, [a] Monthly
2016 2017 2018
[a] Includes Taxes.
[b] Excludes Taxes.
Note: See “Real Dollars” in Glossary.
Web Page: http://www.eia.gov/totalenergy/data/monthly/#summary.
Sources: Tables 1.6.

U. S. Energy Information Administration / Monthly Energy Review March 2019 15
Table 1.6 Cost of Fuels to End Users in Real (1982–1984) Dollars
Consumer Price Index,All Urban Consumersa Motor Gasolineb
ResidentialHeating Oilc
ResidentialNatural Gasb
ResidentialElectricityb
Index1982–1984=100
Dollars perGallon
Dollars perMillion Btu
Dollars perGallon
Dollars perMillion Btu
Dollars perThousandCubic Feet
Dollars perMillion Btu
Cents perKilowatthour
Dollars perMillion Btu
1960 Average .................. 29.6 NA NA NA NA NA NA 8.8 25.741965 Average .................. 31.5 NA NA NA NA NA NA 7.6 22.331970 Average .................. 38.8 NA NA NA NA 2.81 2.72 5.7 16.621975 Average .................. 53.8 NA NA NA NA 3.18 3.12 6.5 19.071980 Average .................. 82.4 1.482 11.85 1.182 8.52 4.47 4.36 6.6 19.211985 Average .................. 107.6 1.112 8.89 0.979 7.06 5.69 5.52 6.87 20.131990 Average .................. 130.7 0.931 7.44 0.813 5.86 4.44 4.31 5.99 17.561995 Average .................. 152.4 0.791 6.38 0.569 4.10 3.98 3.87 5.51 16.152000 Average .................. 172.2 0.908 7.33 0.761 5.49 4.51 4.39 4.79 14.022001 Average .................. 177.1 0.864 6.98 0.706 5.09 5.44 5.28 4.84 14.202002 Average .................. 179.9 0.801 6.47 0.628 4.52 4.39 4.28 4.69 13.752003 Average .................. 184.0 0.890 7.19 0.736 5.31 5.23 5.09 4.74 13.892004 Average .................. 188.9 1.018 8.23 0.819 5.91 5.69 5.55 4.74 13.892005 Average .................. 195.3 1.197 9.68 1.051 7.58 6.50 6.33 4.84 14.182006 Average .................. 201.6 1.307 10.59 1.173 8.46 6.81 6.63 5.16 15.122007 Average .................. 207.342 1.374 11.22 1.250 9.01 6.31 6.14 5.14 15.052008 Average .................. 215.303 1.541 12.67 1.495 10.78 6.45 6.28 5.23 15.332009 Average .................. 214.537 1.119 9.24 1.112 8.02 5.66 5.52 5.37 15.722010 Average .................. 218.056 1.301 10.78 1.283 9.25 5.22 5.11 5.29 15.512011 Average .................. 224.939 1.590 13.19 NA NA 4.90 4.80 5.21 15.272012 Average .................. 229.594 1.609 13.35 NA NA 4.64 4.53 5.17 15.172013 Average .................. 232.957 1.538 12.77 NA NA 4.43 4.31 5.21 15.262014 Average .................. 236.736 1.447 12.01 NA NA 4.63 4.49 5.29 15.502015 Average .................. 237.017 1.059 8.80 NA NA 4.38 4.22 5.34 15.64
2016 January .................... 236.916 0.859 7.13 NA NA 3.50 3.36 5.06 14.83 February .................. 237.111 0.773 6.42 NA NA 3.53 3.39 5.12 15.01 March ....................... 238.132 0.849 7.05 NA NA 3.86 3.71 5.27 15.46 April ......................... 239.261 0.918 7.63 NA NA 4.03 3.88 5.20 15.23 May .......................... 240.229 0.967 8.04 NA NA 4.84 4.66 5.32 15.60 June ......................... 241.018 1.005 8.35 NA NA 5.99 5.76 5.28 15.48 July .......................... 240.628 0.950 7.90 NA NA 6.88 6.62 5.27 15.44 August ..................... 240.849 0.921 7.65 NA NA 7.31 7.03 5.35 15.67 September ............... 241.428 0.940 7.81 NA NA 6.95 6.69 5.33 15.62 October .................... 241.729 0.953 7.92 NA NA 5.68 5.47 5.15 15.11 November ................ 241.353 0.931 7.73 NA NA 4.46 4.29 5.28 15.48 December ................ 241.432 0.948 7.88 NA NA 3.75 3.61 5.07 14.85 Average .................. 240.007 0.918 7.63 NA NA 4.19 4.03 5.23 15.33
2017 January .................... 242.839 0.992 8.25 NA NA 3.84 3.70 5.03 14.74 February .................. 243.603 0.969 8.05 NA NA 4.11 3.96 5.25 15.39 March ....................... 243.801 0.979 8.13 NA NA 4.04 3.90 5.29 15.50 April ......................... 244.524 1.014 8.43 NA NA 4.64 4.47 5.20 15.25 May .......................... 244.733 1.000 8.31 NA NA 5.42 5.22 5.34 15.65 June ......................... 244.955 0.980 8.14 NA NA 6.56 6.32 5.39 15.79 July .......................... 244.786 0.958 7.96 NA NA 7.30 7.04 5.34 15.66 August ..................... 245.519 0.992 8.25 NA NA 7.42 7.16 5.36 15.70 September ............... 246.819 1.089 9.05 NA NA 6.86 6.61 5.38 15.77 October .................... 246.663 1.032 8.58 NA NA 5.42 5.22 5.19 15.21 November ................ 246.669 1.057 8.79 NA NA 4.12 3.97 5.25 15.37 December ................ 246.524 1.023 8.50 NA NA 3.77 3.63 5.05 14.80 Average .................. 245.120 1.007 8.37 NA NA 4.45 4.29 5.26 15.41
2018 January .................... 247.867 1.047 R 8.70 NA NA 3.60 3.47 4.94 14.48 February .................. 248.991 1.057 R 8.78 NA NA 3.87 3.73 5.08 14.90 March ....................... 249.554 1.054 8.76 NA NA 3.92 3.78 5.21 15.26 April ......................... 250.546 1.116 9.27 NA NA 4.01 3.86 5.14 15.07 May .......................... 251.588 1.178 9.79 NA NA R 5.42 5.23 5.23 15.32 June ......................... 251.989 1.179 R 9.79 NA NA 6.55 6.32 R 5.17 R 15.17 July .......................... 252.006 1.163 9.66 NA NA 7.11 6.86 5.21 15.27 August ..................... 252.146 1.158 9.62 NA NA 7.39 7.12 5.27 R 15.44 September ............... 252.439 1.161 9.65 NA NA 6.86 6.62 5.15 15.10 October .................... 252.885 1.165 9.68 NA NA 4.85 4.68 5.09 14.92 November ................ 252.038 1.084 9.01 NA NA 3.74 3.61 5.14 15.06 December ................ 251.233 0.987 8.20 NA NA R 3.83 R 3.70 R 4.96 R 14.55 Average .................. 251.107 1.113 9.25 NA NA 4.19 4.04 5.13 15.04
2019 January .................... 251.712 0.934 7.77 NA NA NA NA NA NA February .................. 252.776 0.954 7.93 NA NA NA NA NA NA
a Data are U.S. city averages for all items, and are not seasonally adjusted.b Includes taxes.c Excludes taxes.R=Revised. NA=Not available. Notes: • See "Real Dollars" in Glossary. • Fuel costs are calculated by using
the Urban Consumer Price Index (CPI) developed by the Bureau of LaborStatistics. • Annual averages may not equal average of months due toindependent rounding. • Geographic coverage is the 50 states and the District ofColumbia.
Web Page: See http://www.eia.gov/totalenergy/data/monthly/#summary (Exceland CSV files) for all available annual data beginning in 1960 and monthly databeginning in 1995.
Sources: • Fuel Prices: Tables 9.4 (All Grades), 9.8, and 9.10, adjusted by theCPI; and Monthy Energy Review, September 2012, Table 9.8c. • Consumer PriceIndex, All Urban Consumers: U.S. Department of Labor, Bureau of LaborStatistics, series ID CUUR0000SA0. • Conversion Factors: Tables A1, A3, A4,and A6.

16 U. S. Energy Information Administration / Monthly Energy Review March 2019
Figure 1.7 Primary Energy Consumption and Energy Expenditures Indicators
0
100
200
300
400
1950 1955 1960 1965 1970 1975 1980 1985 1990 1995 2000 2005 2010 2015
Mill
ion B
tu
Energy Consumption per Capita, 1949–2018
0
5
10
15
20
1950 1955 1960 1965 1970 1975 1980 1985 1990 1995 2000 2005 2010 2015
Thousand B
tu p
er
Chaned (
2012)
Dolla
r[a]
Primary Energy Consumption per Real Dollar [a] of Gross Domestic Product, 1949–2017
Share of GDP
Share of Gross Output
0
2
4
6
8
10
12
14
16
1970 1975 1980 1985 1990 1995 2000 2005 2010 2015
Perc
ent
Energy Expenditures as Share of Gross Domestic Product and Gross Output,[b] 1970–2016
[a] See “Chained Dollars” and “Real Dollars” in Glossary.
[b] Gross output is the value of gross domestic product (GDP) plus the value
of intermediate inputs used to produce GDP. Through 1996, data have been
adjusted by EIA based on BEA’s 2012 comprehensive revision.
Web Page: http://www.eia.gov/totalenergy/data/monthly/#summary.
Source: Table 1.7.

U. S. Energy Information Administration / Monthly Energy Review March 2019 17
Table 1.7 Primary Energy Consumption, Energy Expenditures, and Carbon Dioxide Emissions Indicators
Primary Energy Consumptiona Energy Expendituresb Carbon Dioxide Emissionsc
Consump-tion
Consump-tion
per Capita
Consumptionper
Real Dollard
of GDPeExpendi-
tures
Expendi-tures
per Capita
Expendituresas Shareof GDPe
Expendituresas Shareof GrossOutputf Emissions
Emissionsper Capita
Emissionsper
Real Dollard
of GDPe
QuadrillionBtu
MillionBtu
ThousandBtu per
Chained (2012)Dollard
Million NominalDollarsg
NominalDollarsg Percent Percent
MillionMetric Tons
CarbonDioxide
MetricTons
CarbonDioxide
Metric TonsCarbon Dioxide
per MillionChained (2012)
Dollarsd
1950 .............. 34.616 227 15.12 NA NA NA NA 2,382 15.6 1,0401955 .............. 40.208 242 14.00 NA NA NA NA 2,685 16.2 9351960 .............. 45.086 250 13.83 NA NA NA NA 2,914 16.1 8941965 .............. 54.015 278 12.95 NA NA NA NA 3,462 17.8 8301970 .............. 67.838 331 13.70 82,875 404 7.7 4.3 4,261 20.8 8611975 .............. 71.965 333 12.75 171,851 796 10.2 5.6 4,421 20.5 7831980 .............. 78.067 344 11.55 374,347 1,647 13.1 6.8 4,750 20.9 7031981 .............. 76.106 332 10.98 427,898 1,865 13.3 7.1 4,625 20.2 6671982 .............. 73.099 316 10.74 426,479 1,841 12.8 6.9 4,393 19.0 6451983 .............. 72.971 312 10.25 417,617 1,786 11.5 6.3 4,371 18.7 6141984 .............. 76.632 325 10.04 435,309 1,846 10.8 5.9 4,600 19.5 6031985 .............. 76.392 321 9.61 438,339 1,842 10.1 5.6 4,593 19.3 5781986 .............. 76.647 319 9.32 384,088 1,599 8.4 4.8 4,598 19.1 5591987 .............. 79.054 326 9.29 397,623 1,641 8.2 4.6 4,757 19.6 5591988 .............. 82.709 338 9.33 411,565 1,683 7.9 4.4 4,982 20.4 5621989 .............. 84.785 344 9.22 439,046 1,779 7.8 4.4 5,066 20.5 5511990 .............. 84.485 338 9.02 474,647 1,901 8.0 4.5 5,038 20.2 5381991 .............. 84.437 334 9.03 472,434 1,867 7.7 4.4 4,993 19.7 5341992 .............. 85.782 334 8.86 476,840 1,859 7.3 4.2 5,090 19.8 5261993 .............. 87.325 336 8.78 492,267 1,894 7.2 4.1 5,181 19.9 5211994 .............. 89.040 338 8.60 504,854 1,919 6.9 3.9 5,258 20.0 5081995 .............. 90.991 342 8.56 514,622 1,933 6.7 3.8 5,321 20.0 5011996 .............. 94.000 349 8.52 560,292 2,080 6.9 3.9 5,510 20.5 4991997 .............. 94.571 347 8.21 567,960 2,083 6.6 3.7 5,582 20.5 4841998 .............. 94.982 344 7.89 526,280 1,908 5.8 3.2 5,635 20.4 4681999 .............. 96.615 346 7.66 558,624 2,002 5.8 3.2 5,687 20.4 4512000 .............. 98.776 350 7.52 687,708 2,437 6.7 3.7 5,864 20.8 4472001 .............. 96.129 337 7.25 696,240 2,443 6.6 3.7 5,759 20.2 4342002 .............. 97.605 339 7.23 663,962 2,308 6.1 3.5 5,803 20.2 4302003 .............. 97.898 337 7.05 755,068 2,603 6.6 3.7 5,854 20.2 4222004 .............. 100.073 342 6.95 871,209 2,975 7.1 4.0 5,969 20.4 4142005 .............. 100.168 339 6.72 1,045,729 3,539 8.0 4.4 5,990 20.3 4022006 .............. 99.464 333 6.48 1,158,819 3,884 8.4 4.6 5,911 19.8 3852007 .............. 100.971 335 6.46 1,233,864 4,096 8.5 4.7 6,002 19.9 3842008 .............. 98.825 325 6.33 1,408,750 4,633 9.6 5.2 5,811 19.1 3722009 .............. 94.023 306 6.18 1,066,275 3,476 7.4 4.3 5,388 17.6 3542010 .............. 97.608 316 6.26 1,213,609 3,923 8.1 4.6 5,586 18.1 3582011 .............. 96.949 311 6.12 1,391,358 4,465 9.0 5.0 5,446 17.5 3442012 .............. 94.477 301 5.83 1,354,948 4,317 8.4 4.6 5,237 16.7 3232013 .............. 97.218 308 5.89 1,376,201 4,354 8.2 4.5 5,363 17.0 3252014 .............. 98.381 309 5.82 1,394,971 4,381 8.0 4.4 5,411 17.0 3202015 .............. 97.484 304 5.61 1,127,726 3,516 6.2 3.5 5,265 16.4 3032016 .............. 97.444 302 5.52 1,038,504 3,214 5.6 3.2 5,172 16.0 2932017 .............. 97.807 301 5.42 NA NA NA NA 5,131 15.8 2842018 .............. 101.268 310 NA NA NA NA NA 5,274 16.1 NA
a See "Primary Energy Consumption" in Glossary.b Expenditures include taxes where data are available.c Carbon dioxide emissions from energy consumption. See Table 12.1.d See "Chained Dollars" and "Real Dollars" in Glossary.e See "Gross Domestic Product (GDP)" in Glossary.f Gross output is the value of GDP plus the value of intermediate inputs used to
produce GDP. Through 1996, data have been adjusted by EIA based onDOC/BEA’s 2012 comprehensive revision.
g See "Nominal Dollars" in Glossary.NA=Not available. Notes: • Data are estimates. • Geographic coverage is the 50 states and the
District of Columbia.Web Page: See http://www.eia.gov/totalenergy/data/monthly/#summary (Excel
and CSV files) for all available annual data beginning in 1949.Sources: • Consumption: Table 1.3. • Consumption per Capita:
Calculated as energy consumption divided by U.S. population (see Table C1).• Consumption per Real Dollar of GDP: Calculated as energy consumptiondivided by U.S. gross domestic product in chained (2009) dollars (see Table C1).• Expenditures: U.S. Energy Information Administration, "State Energy Price andExpenditure Estimates, 1970 Through 2015" (June 2017), U.S. Table ET1.• Expenditures per Capita: Calculated as energy expenditures divided by U.S.population (see Table C1). • Expenditures as Share of GDP: Calculated asenergy expenditures divided by U.S. gross domestic product in nominal dollars (seeTable C1). • Expenditures as Share of Gross Output: Calculated as energyexpenditures divided by U.S. gross output (see Table C1). • Emissions:1949–1972—U.S. Energy Information Administration, Annual Energy Review 2011,Table 11.1. 1973 forward—Table 12.1. • Emissions per Capita: Calculated ascarbon dioxide emissions divided by U.S. population (see Table C1). • Emissionsper Real Dollar of GDP: Calculated as carbon dioxide emissions divided by U.S.gross domestic product in chained (2009) dollars (see Table C1).

18 U. S. Energy Information Administration / Monthly Energy Review March 2019
Figure 1.8 Motor Vehicle Mileage, Fuel Consumption, and Fuel Economy, 1949‐2016
Light Duty Vehicles, Long Wheelbase [b]
Light Duty Vehicles, Short Wheelbase [a]
Heavy Duty Trucks [c]
0
10
20
30
40
1950 1955 1960 1965 1970 1975 1980 1985 1990 1995 2000 2005 2010 2015
Thou
sand
Mile
s p
er
Ve
hic
le
Mileage
Heavy Duty Trucks [c]
Light Duty Vehicles - Short Wheelbase [a]
Light Duty Vehicles - Long Wheelbase [b]
0
1
2
3
4
5
1950 1955 1960 1965 1970 1975 1980 1985 1990 1995 2000 2005 2010 2015
Tho
usa
nd G
allo
ns p
er
Veh
icle
Fuel Consumption
Light Duty Vehicles, Short Wheelbase [a]
Heavy Duty Trucks [c]
Light Duty Vehicles, Long Wheelbase [b]
0
5
10
15
20
25
30
1950 1955 1960 1965 1970 1975 1980 1985 1990 1995 2000 2005 2010 2015
Mile
s p
er
Ga
llon
Fuel Economy
[a] Through 1989, data are for passenger cars and motorcycles. For 1990–2006,
data are for passenger cars only. Beginning in 2007, data are for light‐duty
vehicles (passenger cars, light trucks, vans, and sport utility vehicles) with a
wheelbase less than or equal to 121 inches.
[b] For 1966–2000, data are for vans, pickup trucks, and sport utility vehicles.
Beginning in 2007, data are for light‐duty vehicles (passenger cars, light trucks,
vans, and sport utility vehicles) with a wheelbase greater than 121 inches.
[c] For 1949–1965, data are for single‐unit trucks with 2 axles and 6 or more
tires, combination trucks, and other vehicles with 2 axles and 4 tires that are not passenger cars. For 1966–2006 data are for single‐unit truck with 2 axles and 6 or more tires, and combination trucks. Beginning in 2007, data are for single‐unit trucks with 2 axles and 6 or more tires (or a gross vehicle weight rating exceeding 10,000 pounds), and combination trucks. Note: Through 1965, “Light‐Duty Vehicles, Long Wheelbase” data are included in “Heavy‐Duty Trucks.” Web Page: http://www.eia.gov/totalenergy/data/monthly/#summary.
Source: Table 1.8.

U. S. Energy Information Administration / Monthly Energy Review March 2019 19
Table 1.8 Motor Vehicle Mileage, Fuel Consumption, and Fuel Economy
Light-Duty Vehicles,Short Wheelbasea
Light-Duty Vehicles,Long Wheelbaseb Heavy-Duty Trucksc All Motor Vehiclesd
MileageFuel
ConsumptionFuel
Economy MileageFuel
ConsumptionFuel
Economy MileageFuel
ConsumptionFuel
Economy MileageFuel
ConsumptionFuel
Economy
Miles perVehicle
Gallonsper Vehicle
Miles perGallon
Miles perVehicle
Gallonsper Vehicle
Miles perGallon
Miles perVehicle
Gallonsper Vehicle
Miles perGallon
Miles perVehicle
Gallonsper Vehicle
Miles perGallon
1950 .......... 9,060 603 15.0 e( ) e( ) e( ) 10,316 1,229 8.4 9,321 725 12.81955 .......... 9,447 645 14.6 e( ) e( ) e( ) 10,576 1,293 8.2 9,661 761 12.71960 .......... 9,518 668 14.3 e( ) e( ) e( ) 10,693 1,333 8.0 9,732 784 12.41965 .......... 9,603 661 14.5 e( ) e( ) e( ) 10,851 1,387 7.8 9,826 787 12.51970 .......... 9,989 737 13.5 8,676 866 10.0 13,565 2,467 5.5 9,976 830 12.01975 .......... 9,309 665 14.0 9,829 934 10.5 15,167 2,722 5.6 9,627 790 12.21980 .......... 8,813 551 16.0 10,437 854 12.2 18,736 3,447 5.4 9,458 712 13.31981 .......... 8,873 538 16.5 10,244 819 12.5 19,016 3,565 5.3 9,477 697 13.61982 .......... 9,050 535 16.9 10,276 762 13.5 19,931 3,647 5.5 9,644 686 14.11983 .......... 9,118 534 17.1 10,497 767 13.7 21,083 3,769 5.6 9,760 686 14.21984 .......... 9,248 530 17.4 11,151 797 14.0 22,550 3,967 5.7 10,017 691 14.51985 .......... 9,419 538 17.5 10,506 735 14.3 20,597 3,570 5.8 10,020 685 14.61986 .......... 9,464 543 17.4 10,764 738 14.6 22,143 3,821 5.8 10,143 692 14.71987 .......... 9,720 539 18.0 11,114 744 14.9 23,349 3,937 5.9 10,453 694 15.11988 .......... 9,972 531 18.8 11,465 745 15.4 22,485 3,736 6.0 10,721 688 15.61989 .......... 10,157 533 19.0 11,676 724 16.1 22,926 3,776 6.1 10,932 688 15.91990 .......... 10,504 520 20.2 11,902 738 16.1 23,603 3,953 6.0 11,107 677 16.41991 .......... 10,571 501 21.1 12,245 721 17.0 24,229 4,047 6.0 11,294 669 16.91992 .......... 10,857 517 21.0 12,381 717 17.3 25,373 4,210 6.0 11,558 683 16.91993 .......... 10,804 527 20.5 12,430 714 17.4 26,262 4,309 6.1 11,595 693 16.71994 .......... 10,992 531 20.7 12,156 701 17.3 25,838 4,202 6.1 11,683 698 16.71995 .......... 11,203 530 21.1 12,018 694 17.3 26,514 4,315 6.1 11,793 700 16.81996 .......... 11,330 534 21.2 11,811 685 17.2 26,092 4,221 6.2 11,813 700 16.91997 .......... 11,581 539 21.5 12,115 703 17.2 27,032 4,218 6.4 12,107 711 17.01998 .......... 11,754 544 21.6 12,173 707 17.2 25,397 4,135 6.1 12,211 721 16.91999 .......... 11,848 553 21.4 11,957 701 17.0 26,014 4,352 6.0 12,206 732 16.72000 .......... 11,976 547 21.9 11,672 669 17.4 25,617 4,391 5.8 12,164 720 16.92001 .......... 11,831 534 22.1 11,204 636 17.6 26,602 4,477 5.9 11,887 695 17.12002 .......... 12,202 555 22.0 11,364 650 17.5 27,071 4,642 5.8 12,171 719 16.92003 .......... 12,325 556 22.2 11,287 697 16.2 28,093 4,215 6.7 12,208 718 17.02004 .......... 12,460 553 22.5 11,184 690 16.2 27,023 4,057 6.7 12,200 714 17.12005 .......... 12,510 567 22.1 10,920 617 17.7 26,235 4,385 6.0 12,082 706 17.12006 .......... 12,485 554 22.5 10,920 612 17.8 25,231 4,304 5.9 12,017 698 17.22007 .......... a 10,710 a 468 a 22.9 b 14,970 b 877 b 17.1 c 28,290 c 4,398 6.4 11,915 693 17.22008 .......... 10,290 435 23.7 15,256 880 17.3 28,573 4,387 6.5 11,631 667 17.42009 .......... 10,391 442 23.5 15,252 882 17.3 26,274 4,037 6.5 11,631 661 17.62010 .......... 10,650 456 23.3 15,474 901 17.2 26,604 4,180 6.4 11,866 681 17.42011 .......... 11,150 481 23.2 12,007 702 17.1 26,054 4,128 6.3 11,652 665 17.52012 .......... 11,262 484 23.3 11,885 694 17.1 25,255 3,973 6.4 11,707 665 17.62013 .......... 11,244 480 23.4 11,712 683 17.2 25,951 4,086 6.4 11,679 663 17.62014 .......... 11,048 476 23.2 12,138 710 17.1 25,594 4,036 6.3 11,621 666 17.52015 .......... 11,327 475 23.9 11,855 684 17.3 24,979 3,904 6.4 11,742 656 17.92016 .......... 11,370 475 24.0 11,991 689 17.4 25,037 3,904 6.4 11,810 658 17.9
a Through 1989, data are for passenger cars and motorcycles. For 1990–2006,data are for passenger cars only. Beginning in 2007, data are for light-dutyvehicles (passenger cars, light trucks, vans, and sport utility vehicles) with awheelbase less than or equal to 121 inches.
b For 1966–2006, data are for vans, pickup trucks, and sport utility vehicles.Beginning in 2007, data are for light-duty vehicles (passenger cars, light trucks,vans, and sport utility vehicles) with a wheelbase greater than 121 inches.
c For 1949–1965, data are for single-unit trucks with 2 axles and 6 or more tires,combination trucks, and other vehicles with 2 axles and 4 tires that are notpassenger cars. For 1966–2006, data are for single-unit trucks with 2 axles and 6or more tires, and combination trucks. Beginning in 2007, data are for single-unittrucks with 2 axles and 6 or more tires (or a gross vehicle weight rating exceeding
10,000 pounds), and combination trucks.d Includes buses and motorcycles, which are not separately displayed.e Included in "Heavy-Duty Trucks."Note: Geographic coverage is the 50 states and the District of Columbia. Web Page: See http://www.eia.gov/totalenergy/data/monthly/#summary (Excel
and CSV files) for all available annual data beginning in 1949.Sources: • Light-Duty Vehicles, Short Wheelbase: 1990–1994—U.S.
Department of Transportation, Bureau of Transportation Statistics, NationalTransportation Statistics 1998, Table 4-13. • All Other Data:1949–1994—Federal Highway Administration (FHWA), Highway StatisticsSummary to 1995, Table VM-201A. 1995 forward—FHWA, Highway Statistics,annual reports, Table VM-1.

20 U. S. Energy Information Administration / Monthly Energy Review March 2019
Table 1.9 Heating Degree Days by Census DivisionNew
EnglandaMiddle
AtlanticbEast North
CentralcWest North
CentraldSouth
AtlanticeEast South
CentralfWest South
Centralg Mountainh PacificiUnitedStates
1950 Total .................... 6,794 6,324 7,027 7,455 3,521 3,547 2,277 6,341 3,906 5,3671955 Total .................... 6,872 6,231 6,486 6,912 3,508 3,513 2,294 6,704 4,320 5,2461960 Total .................... 6,828 6,391 6,908 7,184 3,780 4,134 2,767 6,281 3,799 5,4041965 Total .................... 7,029 6,393 6,587 6,932 3,372 3,501 2,237 6,086 3,819 5,1461970 Total .................... 7,022 6,388 6,721 7,090 3,452 3,823 2,558 6,119 3,726 5,2181975 Total .................... 6,547 5,892 6,406 6,880 2,970 3,437 2,312 6,260 4,117 4,9051980 Total .................... 7,071 6,477 6,975 6,836 3,378 3,964 2,494 5,554 3,539 5,0801985 Total .................... 6,749 5,971 6,668 7,262 2,899 3,660 2,535 6,059 3,935 4,8891990 Total .................... 5,987 5,252 5,780 6,137 2,307 2,942 1,968 5,391 3,603 4,1801995 Total .................... 6,684 6,093 6,740 6,911 2,988 3,648 2,147 5,101 3,269 4,6402000 Total .................... 6,625 5,999 6,315 6,500 2,905 3,551 2,153 4,971 3,460 4,4942001 Total .................... 6,202 5,541 5,844 6,221 2,604 3,327 2,162 5,004 3,545 4,2572002 Total .................... 6,234 5,550 6,128 6,485 2,664 3,443 2,292 5,197 3,510 4,3562003 Total .................... 6,975 6,258 6,536 6,593 2,884 3,559 2,205 4,817 3,355 4,5442004 Total .................... 6,709 5,892 6,178 6,329 2,715 3,291 2,041 5,010 3,346 4,3442005 Total .................... 6,644 5,950 6,222 6,213 2,775 3,380 1,985 4,896 3,377 4,3482006 Total .................... 5,885 5,211 5,703 5,821 2,475 3,211 1,802 4,915 3,557 4,0402007 Total .................... 6,537 5,756 6,074 6,384 2,525 3,187 2,105 4,939 3,506 4,2682008 Total .................... 6,434 5,782 6,677 7,118 2,712 3,600 2,125 5,233 3,566 4,4942009 Total .................... 6,644 5,922 6,512 6,841 2,812 3,536 2,152 5,139 3,538 4,4812010 Total .................... 5,934 5,553 6,185 6,565 3,167 3,948 2,449 5,082 3,624 4,4632011 Total .................... 6,114 5,483 6,172 6,565 2,565 3,343 2,114 5,322 3,818 4,3122012 Total .................... 5,561 4,970 5,356 5,515 2,306 2,876 1,650 4,574 3,411 3,7692013 Total .................... 6,426 5,838 6,621 7,135 2,736 3,648 2,326 5,273 3,362 4,4652014 Total .................... 6,675 6,203 7,194 7,304 2,951 3,932 2,422 4,744 2,774 4,5502015 Total .................... 6,521 5,777 6,165 6,088 2,487 3,222 2,087 4,602 2,898 4,087
2016 January ................ 1,127 1,119 1,241 1,303 659 857 565 918 569 871 February .............. 957 901 957 937 483 R 573 310 R 618 R 342 628 March ................... 754 644 670 653 240 324 179 R 542 R 396 450 April ..................... 605 515 506 424 152 162 61 381 242 R 309 May ...................... 251 213 221 207 58 71 17 254 181 150 June ..................... 45 22 25 27 1 0 0 42 44 21 July ...................... 4 1 2 11 0 0 0 15 20 6 August ................. 5 1 5 17 0 0 0 31 12 6 September ........... 67 38 40 75 2 5 1 115 66 39 October ................ R 389 316 285 304 91 89 22 265 R 201 198 November ............ 672 609 582 569 290 339 154 R 512 R 332 418 December ............ R 1,054 975 1,166 1,257 479 672 444 R 926 627 783 Total .................... R 5,929 5,353 5,701 5,786 2,456 3,094 1,752 R 4,619 R 3,031 R 3,878
2017 January ................ R 1,038 971 1,082 1,212 R 476 579 R 417 962 666 766 February .............. R 906 R 780 776 818 323 409 208 627 496 547 March ................... R 1,037 908 834 R 783 346 387 147 R 467 392 543 April ..................... R 451 R 341 349 R 401 76 94 R 52 R 404 R 309 248 May ...................... 303 233 R 249 224 47 57 14 235 R 171 154 June ..................... R 45 25 27 37 2 3 0 R 59 50 25 July ...................... 9 3 6 10 0 0 0 6 14 5 August ................. R 26 18 34 R 50 1 1 0 R 27 R 8 15 September ........... 57 R 53 64 78 14 24 3 120 45 45 October ................ 237 215 291 363 89 146 59 358 178 193 November ............ 743 699 R 773 805 322 R 407 180 489 351 490 December ............ 1,186 1,087 1,197 R 1,218 535 729 501 R 815 R 507 798 Total .................... 6,038 R 5,332 R 5,684 5,997 2,231 R 2,835 R 1,582 R 4,568 3,187 R 3,828
2018 January ................ R 1,257 R 1,213 R 1,309 R 1,373 R 701 930 660 R 771 R 461 R 897 February .............. R 870 R 809 R 981 1,178 R 307 R 411 R 347 747 R 497 625 March ................... R 930 912 R 923 869 436 475 R 185 603 R 487 609 April ..................... R 680 617 R 704 R 716 R 206 R 312 R 142 R 379 R 299 R 411 May ...................... R 168 108 99 89 12 13 0 162 R 178 R 86 June ..................... 63 28 24 23 1 0 0 56 65 26 July ...................... 2 1 4 11 0 0 0 9 8 3 August ................. 3 R 2 8 19 0 0 0 25 14 7 September ........... 65 R 33 48 R 90 2 R 3 3 90 62 38 October ................ R 458 R 354 R 420 495 99 R 137 69 383 R 186 253 November ............ R 819 R 765 R 914 R 1,003 R 380 R 565 R 372 R 677 R 352 R 593 December ............ 1,029 931 1,003 1,102 491 637 471 894 561 732 Total .................... 6,343 5,774 6,436 6,968 2,634 3,484 2,249 4,796 3,170 4,279
a Connecticut, Maine, Massachusetts, New Hampshire, Rhode Island, andVermont.
b New Jersey, New York, and Pennsylvania.c Illinois, Indiana, Michigan, Ohio, and Wisconsin.d Iowa, Kansas, Minnesota, Missouri, Nebraska, North Dakota, and South
Dakota.e Delaware, Florida, Georgia, Maryland (and the District of Columbia), North
Carolina, South Carolina, Virginia, and West Virginia.f Alabama, Kentucky, Mississippi, and Tennessee.
g Arkansas, Louisiana, Oklahoma, and Texas.h Arizona, Colorado, Idaho, Montana, Nevada, New Mexico, Utah, and
Wyoming.i Alaska, California, Hawaii, Oregon, and Washington.
R=Revised. Notes: • Degree days are relative measurements of outdoor air temperature
used as an index for heating and cooling energy requirements. Heating degreedays are the number of degrees that the daily average temperature falls below 65degrees Fahrenheit (°F). Cooling degree days are the number of degrees that the
daily average temperature rises above 65°F. The daily average temperature is themean of the maximum and minimum temperatures in a 24-hour period. Forexample, a weather station recording an average daily temperature of 40°F wouldreport 25 heating degree days for that day (and 0 cooling degree days).If a weather station recorded an average daily temperature of 78°F, cooling degreedays for that station would be 13 (and 0 heating degree days). • Totals may notequal sum of components due to independent rounding. • Geographic coverage isthe 50 states and the District of Columbia.
Web Page: See http://www.eia.gov/totalenergy/data/monthly/#summary (Exceland CSV files) for all available annual data beginning in 1949 and monthly databeginning in 1973.
Source: State-level degree day data are from U.S. Department ofCommerce, National Oceanic and Atmospheric Administration, NationalCenters for Environmental Information. Using these state-level data, theU.S. Energy Information Administration calculates population-weightedcensus-division and U.S. degree day averages using state populations fromthe same year the degree days are measured. See methodology athttp://www.eia.gov/forecasts/steo/special/pdf/2012_sp_04.pdf.

U. S. Energy Information Administration / Monthly Energy Review March 2019 21
Table 1.10 Cooling Degree Days by Census DivisionNew
EnglandaMiddle
AtlanticbEast North
CentralcWest North
CentraldSouth
AtlanticeEast South
CentralfWest South
Centralg Mountainh PacificiUnitedStates
1950 Total .................... 295 401 505 647 1,414 1,420 2,282 682 629 8711955 Total .................... 532 761 922 1,139 1,636 1,674 2,508 780 558 1,1441960 Total .................... 318 487 626 871 1,583 1,532 2,367 974 796 1,0001965 Total .................... 310 498 618 832 1,613 1,552 2,461 780 577 9791970 Total .................... 423 615 747 980 1,744 1,571 2,282 971 734 1,0791975 Total .................... 422 584 721 937 1,791 1,440 2,162 903 597 1,0491980 Total .................... 438 680 769 1,158 1,911 1,754 2,651 1,071 653 1,2141985 Total .................... 324 509 602 780 1,878 1,522 2,519 1,095 761 1,1211990 Total .................... 429 562 602 913 2,054 1,563 2,526 1,212 838 1,2001995 Total .................... 471 704 877 928 2,028 1,613 2,398 1,213 794 1,2612000 Total .................... 279 458 632 983 1,925 1,674 2,775 1,480 772 1,2322001 Total .................... 464 623 722 994 1,897 1,478 2,543 1,508 861 1,2552002 Total .................... 508 772 899 1,045 2,182 1,757 2,515 1,467 783 1,3632003 Total .................... 475 615 619 907 1,980 1,452 2,496 1,553 978 1,2682004 Total .................... 368 591 585 722 2,038 1,517 2,482 1,290 828 1,2172005 Total .................... 598 892 944 1,063 2,098 1,676 2,647 1,372 777 1,3882006 Total .................... 485 693 734 1,034 2,053 1,648 2,786 1,466 922 1,3602007 Total .................... 447 694 881 1,102 2,219 1,892 2,475 1,564 828 1,3922008 Total .................... 462 667 683 818 1,993 1,537 2,501 1,385 918 1,2822009 Total .................... 350 524 534 698 2,029 1,479 2,590 1,393 894 1,2412010 Total .................... 635 908 964 1,096 2,269 1,977 2,757 1,358 674 1,4562011 Total .................... 554 836 859 1,074 2,259 1,727 3,112 1,450 736 1,4702012 Total .................... 565 815 974 1,221 2,162 1,762 2,915 1,573 917 1,4952013 Total .................... 540 683 690 892 2,000 1,441 2,536 1,462 892 1,3062014 Total .................... 420 596 610 814 2,009 1,493 2,474 1,431 1,068 1,2992015 Total .................... 555 804 729 942 2,405 1,718 2,741 1,478 1,068 1,488
2016 January ................ 0 0 0 0 25 2 9 0 8 7 February .............. 0 0 0 0 24 3 25 10 15 11 March ................... 0 0 3 10 89 36 86 24 13 35 April ..................... 0 0 1 8 87 37 123 42 27 R 43 May ...................... 7 17 42 49 185 124 238 90 37 98 June ..................... 75 129 188 263 379 371 475 331 166 271 July ...................... R 241 310 277 306 509 473 620 408 236 384 August ................. 241 312 297 R 269 484 460 547 305 234 362 September ........... 61 114 131 138 352 321 429 173 122 219 October ................ 0 6 19 28 157 113 233 99 47 86 November ............ 0 0 0 2 56 12 80 14 17 26 December ............ 0 0 0 0 65 4 17 0 8 17 Total .................... 626 888 958 1,073 2,412 1,957 2,882 R 1,497 R 928 R 1,559
2017 January ................ 0 0 0 0 50 20 36 0 7 17 February .............. 0 0 0 3 R 55 18 67 5 7 22 March ................... 0 0 1 6 56 28 111 R 32 17 32 April ..................... 0 2 7 9 124 R 74 141 51 25 56 May ...................... 3 14 37 51 213 135 240 R 109 46 106 June ..................... R 72 123 167 206 R 337 272 445 308 150 241 July ...................... R 170 251 242 331 469 430 582 414 R 283 363 August ................. R 128 R 162 R 148 166 R 406 341 R 508 329 R 281 292 September ........... R 66 R 87 92 127 282 194 368 R 178 139 184 October ................ 11 22 16 14 159 66 145 92 R 68 78 November ............ 0 0 0 0 66 6 67 29 21 27 December ............ 0 0 0 0 R 38 1 R 6 1 10 10 Total .................... R 450 R 661 R 709 R 911 R 2,254 1,585 R 2,718 R 1,548 R 1,053 R 1,428
2018 January ................ 0 0 0 0 21 1 4 5 15 8 February .............. 0 0 0 0 81 R 22 R 33 3 8 23 March ................... 0 0 0 2 34 14 R 88 14 9 21 April ..................... 0 0 0 0 79 7 R 57 R 71 25 33 May ...................... R 24 65 140 168 263 R 267 R 396 R 138 39 174 June ..................... 55 111 192 272 R 384 375 R 550 R 300 R 117 270 July ...................... R 252 R 286 258 304 439 430 R 607 417 R 322 376 August ................. R 263 R 299 257 R 258 437 392 R 564 R 345 R 256 351 September ........... 63 R 123 R 122 124 390 339 R 391 R 240 R 143 231 October ................ 0 4 4 6 176 R 79 R 143 R 46 47 70 November ............ 0 0 0 0 R 65 1 R 13 5 R 17 R 18 December ............ 0 0 0 0 38 2 10 0 9 11 Total .................... 657 888 973 1,134 2,408 1,930 2,856 1,583 1,006 1,584
a Connecticut, Maine, Massachusetts, New Hampshire, Rhode Island, andVermont.
b New Jersey, New York, and Pennsylvania.c Illinois, Indiana, Michigan, Ohio, and Wisconsin.d Iowa, Kansas, Minnesota, Missouri, Nebraska, North Dakota, and South
Dakota.e Delaware, Florida, Georgia, Maryland (and the District of Columbia), North
Carolina, South Carolina, Virginia, and West Virginia.f Alabama, Kentucky, Mississippi, and Tennessee.
g Arkansas, Louisiana, Oklahoma, and Texas.h Arizona, Colorado, Idaho, Montana, Nevada, New Mexico, Utah, and
Wyoming.i Alaska, California, Hawaii, Oregon, and Washington.
R=Revised. Notes: • Degree days are relative measurements of outdoor air temperature
used as an index for heating and cooling energy requirements. Cooling degreedays are the number of degrees that the daily average temperature rises above 65degrees Fahrenheit (°F). Heating degree days are the number of degrees that the
daily average temperature falls below 65°F. The daily average temperature is themean of the maximum and minimum temperatures in a 24-hour period. Forexample, if a weather station recorded an average daily temperature of 78°F,cooling degree days for that station would be 13 (and 0 heating degree days). Aweather station recording an average daily temperature of 40°F would report 25heating degree days for that day (and 0 cooling degree days).• Totals may not equal sum of components due to independent rounding.• Geographic coverage is the 50 states and the District of Columbia.
Web Page: See http://www.eia.gov/totalenergy/data/monthly/#summary (Exceland CSV files) for all available annual data beginning in 1949 and monthly databeginning in 1973.
Source: State-level degree day data are from U.S. Department ofCommerce, National Oceanic and Atmospheric Administration, NationalCenters for Environmental Information. Using these state-level data, theU.S. Energy Information Administration calculates population-weightedcensus-division and U.S. degree day averages using state populations fromthe same year the degree days are measured. See methodology athttp://www.eia.gov/forecasts/steo/special/pdf/2012_sp_04.pdf.

22 U. S. Energy Information Administration / Monthly Energy Review March 2019
Table 1.11a Non-Combustion Use of Fossil Fuels in Physical Units
CoalNatural
Gas
Petroleum
Asphaltand
Road Oil
HydrocarbonGas
Liquidsa Lubricants
Petro-chemical
FeedstocksbPetroleum
CokeSpecial
Naphthas Otherc Total
ThousandShort Tons
BillionCubic Feet Thousand Barrels per Day
1973 Total .................... 3,345 792 522 736 162 375 42 88 134 2,0591975 Total .................... 2,972 674 419 702 137 330 41 75 159 1,8631980 Total .................... 2,370 674 396 871 159 709 39 100 176 2,4511985 Total .................... 1,050 572 425 980 145 364 43 83 114 2,1541990 Total .................... 641 712 483 1,067 164 553 56 56 94 2,4731995 Total .................... 921 868 486 1,347 156 593 55 37 87 2,7621996 Total .................... 884 896 484 1,420 151 593 54 39 87 2,8281997 Total .................... 842 909 505 1,452 160 691 40 38 86 2,9721998 Total .................... 786 938 521 1,375 168 693 69 56 107 2,9881999 Total .................... 784 906 547 1,605 169 654 98 76 99 3,2482000 Total .................... 807 918 525 1,586 166 666 45 51 103 3,1422001 Total .................... 727 839 519 1,422 153 592 79 41 104 2,9112002 Total .................... 660 836 512 1,504 151 630 66 53 103 3,0202003 Total .................... 676 808 503 1,436 140 676 56 42 101 2,9542004 Total .................... 660 818 537 1,481 141 784 99 27 98 3,1672005 Total .................... 654 761 546 1,399 141 729 85 33 102 3,0342006 Total .................... 640 584 521 1,454 137 726 97 37 112 3,0842007 Total .................... 634 598 494 1,461 142 664 91 41 104 2,9972008 Total .................... 616 608 417 1,340 131 574 102 44 107 2,7142009 Total .................... 427 524 360 1,456 118 507 82 24 99 2,6482010 Total .................... 588 654 362 1,587 131 539 28 14 100 2,7602011 Total .................... 598 680 355 1,624 125 520 28 12 103 2,7672012 Total .................... 579 706 340 1,642 114 444 31 8 94 2,6732013 Total .................... 599 721 323 1,782 121 448 28 52 97 2,8532014 Total .................... 594 725 327 1,780 126 410 28 55 101 2,8292015 Total .................... 550 703 343 1,865 138 378 28 52 102 2,906
2016 January ................ 37 69 195 2,075 136 377 31 47 107 2,968 February .............. 38 63 230 1,970 148 373 29 53 95 2,899 March ................... 40 63 254 1,932 143 368 29 58 108 2,892 April ..................... 37 59 301 1,840 131 370 22 46 109 2,820 May ...................... 38 58 394 1,828 132 359 21 59 101 2,894 June ..................... 39 55 482 1,751 146 363 18 40 107 2,907 July ...................... 40 57 472 1,853 115 384 25 47 112 3,007 August ................. 39 58 524 1,760 124 371 36 43 110 2,968 September ........... 37 56 439 1,817 125 364 21 56 107 2,928 October ................ 37 58 417 1,920 131 365 26 41 90 2,991 November ............ 37 62 310 1,865 121 373 42 49 108 2,868 December ............ 40 70 195 1,969 115 390 32 45 107 2,853 Total .................... 460 729 351 1,882 130 371 28 49 105 2,917
2017 January ................ 40 70 183 2,124 136 372 35 55 108 3,013 February .............. 38 62 242 1,921 128 409 17 55 106 2,878 March ................... 40 66 260 2,014 143 435 13 53 110 3,028 April ..................... 40 60 316 1,895 128 429 26 41 104 2,939 May ...................... 41 59 367 1,906 131 439 28 48 111 3,030 June ..................... 39 57 475 1,982 120 439 21 56 111 3,204 July ...................... 42 57 443 2,018 116 403 38 49 109 3,177 August ................. 43 59 543 1,724 92 383 24 55 107 2,928 September ........... 41 57 444 1,718 114 356 29 45 97 2,804 October ................ 41 62 411 1,989 123 373 13 58 100 3,067 November ............ 41 66 308 2,163 122 373 33 59 117 3,175 December ............ 43 72 209 2,309 94 381 32 55 107 3,188 Total .................... 489 748 351 1,981 121 399 26 52 107 3,037
2018 January ................ 41 73 204 2,479 105 345 29 58 R 105 3,326 February .............. 36 66 219 2,296 105 350 15 53 R 103 3,141 March ................... 41 69 233 2,312 134 370 24 55 103 R 3,230 April ..................... 43 65 242 2,188 99 384 25 58 R 110 3,107 May ...................... 45 62 370 2,043 111 370 28 56 R 110 3,087 June ..................... 41 59 475 2,117 133 384 29 46 R 109 3,294 July ...................... 44 60 471 2,222 127 399 27 49 R 110 3,406 August ................. 44 61 508 2,269 120 429 38 39 110 3,513 September ........... 44 60 388 2,199 73 409 35 45 109 3,259 October ................ 56 63 396 2,244 110 429 38 48 R 97 3,362 November ............ 52 68 R 255 R 2,495 R 136 378 R 23 37 R 111 R 3,435 December ............ 50 71 179 2,513 92 391 21 41 111 3,350 Total .................... 537 778 329 2,282 112 387 28 49 107 3,294
a Ethane, propane, normal butane, isobutane, natural gasoline, and refineryolefins (ethylene, propylene, butylene, and isobutylene).
b Includes still gas not burned as refinery fuel.c Distillate fuel oil, residual fuel oil, waxes, and miscellaneous products.R=Revised. Notes: • Data are estimates. • Non-combustion use estimates are included in
total energy consumption. See Table 1.3. • Non-combustion estimates are all forindustrial sector consumption, except for some lubricants consumed by the
transportation sector. • Totals may not equal sum of components due toindependent rounding. • Geographic coverage is the 50 states and the District ofColumbia. • See Note 2, "Non-Combustion Use of Fossil Fuels," at end of section.
Web Page: See http://www.eia.gov/totalenergy/data/monthly/#summary for allavailable annual and monthly data beginning in 1973.
Sources: • See Note 2, "Non-Combustion Use of Fossil Fuels," at end ofsection.

U. S. Energy Information Administration / Monthly Energy Review March 2019 23
Table 1.11b Heat Content of Non-Combustion Use of Fossil Fuels (Quadrillion Btu)
CoalNatural
Gas
Petroleum
Total
Percent ofTotal
EnergyConsump-
tion
Asphaltand
Road Oil
Hydro-carbon
GasLiquidsa
Lubri-cants
Petro-chemical
Feed-stocksb
Petro-leumCoke
SpecialNaphthas Otherc Total
1973 Total .................... 0.107 0.808 1.264 0.977 0.359 0.767 0.088 0.169 0.290 3.914 4.829 6.41975 Total .................... .095 .688 1.014 .921 .304 .675 .085 .144 .341 3.485 4.268 5.91980 Total .................... .076 .690 .962 1.147 .354 1.464 .081 .193 .379 4.580 5.345 6.81985 Total .................... .034 .590 1.029 1.251 .322 .747 .090 .159 .242 3.841 4.465 5.81990 Total .................... .021 .732 1.170 1.393 .362 1.138 .117 .107 .198 4.486 5.239 6.21995 Total .................... .029 .892 1.178 1.764 .346 1.222 .115 .071 .185 4.879 5.800 6.41996 Total .................... .028 .921 1.176 1.856 .335 1.211 .113 .075 .185 4.951 5.900 6.31997 Total .................... .027 .933 1.224 1.894 .354 1.410 .083 .072 .183 5.220 6.181 6.51998 Total .................... .025 .969 1.263 1.789 .371 1.409 .143 .107 .229 5.310 6.304 6.61999 Total .................... .025 .932 1.324 2.098 .375 1.336 .205 .145 .211 5.695 6.652 6.92000 Total .................... .026 .942 1.276 2.065 .369 1.353 .094 .097 .222 5.476 6.443 6.52001 Total .................... .023 .863 1.257 1.844 .338 1.205 .165 .078 .223 5.112 5.998 6.22002 Total .................... .021 .856 1.240 1.945 .334 1.276 .138 .102 .220 5.257 6.134 6.32003 Total .................... .022 .832 1.220 1.869 .309 1.371 .117 .080 .217 5.183 6.037 6.22004 Total .................... .021 .840 1.304 1.924 .313 1.592 .207 .051 .211 5.602 6.463 6.52005 Total .................... .021 .782 1.323 1.812 .312 1.474 .177 .063 .218 5.380 6.183 6.22006 Total .................... .020 .600 1.261 1.871 .303 1.477 .203 .070 .242 5.427 6.048 6.12007 Total .................... .020 .614 1.197 1.872 .313 1.351 .191 .078 .223 5.224 5.859 5.82008 Total .................... .020 .625 1.012 1.722 .291 1.172 .214 .085 .230 4.725 5.370 5.42009 Total .................... .014 .537 .873 1.839 .262 1.031 .172 .046 .212 4.434 4.985 5.32010 Total .................... .019 .669 .878 2.010 .291 1.096 .058 .026 .213 4.571 5.258 5.42011 Total .................... .019 .695 .859 2.028 .276 1.057 .059 .023 .221 4.522 5.236 5.42012 Total .................... .019 .724 .827 2.062 .254 .901 .064 .015 .201 4.324 5.066 5.42013 Total .................... .019 .741 .783 2.248 .268 .901 .059 .100 .206 4.567 5.327 5.52014 Total .................... .019 .749 .793 2.234 .280 .827 .058 .106 .214 4.512 5.280 5.42015 Total .................... .018 .730 .832 2.351 .305 .760 .059 .099 .215 4.622 5.370 5.5
2016 January ................ .001 .072 .040 .223 .026 .065 .006 .008 .019 .386 .459 5.1 February .............. .001 .066 .044 .196 .026 .060 .005 .008 .016 .355 .422 5.1 March ................... .001 .065 .052 .204 .027 .063 .005 .010 .019 .380 .447 5.6 April ..................... .001 .061 .060 .189 .024 .061 .004 .007 .019 .364 .426 5.7 May ...................... .001 .060 .081 .193 .025 .062 .004 .010 .018 .392 .453 6.0 June ..................... .001 .057 .096 .180 .027 .060 .003 .006 .019 .391 .449 5.7 July ...................... .001 .059 .097 .195 .022 .066 .004 .008 .020 .412 .473 5.6 August ................. .001 .060 .108 .185 .023 .064 .006 .007 .020 .413 .475 5.6 September ........... .001 .058 .087 .188 .023 .061 .004 .009 .019 .390 .450 5.8 October ................ .001 .061 .086 .205 .025 .063 .005 .007 .016 .406 .468 6.1 November ............ .001 .065 .062 .190 .022 .062 .007 .008 .019 .370 .435 5.6 December ............ .001 .073 .040 .210 .022 .067 .006 .007 .019 .371 .445 4.9 Total .................... .015 .757 .853 2.358 .289 .754 .058 .094 .223 4.629 5.401 5.5
2017 January ................ .001 .073 .038 .227 .026 .064 .006 .009 .020 .388 .462 5.1 February .............. .001 .064 .045 .182 .022 .063 .003 .008 .017 .339 .405 5.3 March ................... .001 .069 .053 .214 .027 .075 .002 .009 .020 .400 .470 5.6 April ..................... .001 .062 .063 .194 .023 .072 .004 .006 .018 .381 .444 6.0 May ...................... .001 .061 .075 .200 .025 .076 .005 .008 .020 .409 .471 6.0 June ..................... .001 .059 .095 .200 .022 .073 .004 .009 .019 .422 .482 6.1 July ...................... .001 .059 .091 .214 .022 .070 .007 .008 .020 .430 .491 5.8 August ................. .001 .061 .112 .180 .017 .066 .004 .009 .019 .408 .471 5.7 September ........... .001 .060 .088 .176 .021 .060 .005 .007 .017 .374 .435 5.7 October ................ .001 .064 .085 .211 .023 .064 .002 .009 .018 .412 .478 6.1 November ............ .001 .069 .061 .219 .022 .062 .006 .009 .020 .400 .470 5.8 December ............ .001 .075 .043 .243 .018 .065 .006 .009 .019 .403 .479 5.2 Total .................... .016 .776 .849 2.459 .267 .809 .054 .100 .228 4.767 5.558 5.7
2018 January ................ .001 .076 .042 .264 .020 .059 .005 .009 .019 R .418 .496 5.1 February .............. .001 .068 .041 .221 .018 .054 .002 .008 .017 .361 .430 5.3 March ................... .001 .072 .048 .241 .025 .064 .004 .009 R .018 R .409 .483 5.6 April ..................... .001 .067 .048 .221 .018 .064 .004 .009 .019 .384 .453 5.7 May ...................... .001 .064 .076 .212 .021 .064 .005 .009 .020 .407 .472 5.9 June ..................... .001 .061 .095 .213 .024 .064 .005 .007 .019 .427 .490 6.0 July ...................... .001 .063 .097 .232 .024 .069 .005 .008 .020 .454 .518 6.0 August ................. .001 .063 .104 .238 .022 .074 .007 .006 .020 .472 .536 6.2 September ........... .001 .062 .077 .222 .013 .068 .006 .007 .019 .413 R .476 6.1 October ................ .002 .065 .081 .237 .021 .073 .007 .008 R .017 .445 .512 6.3 November ............ .002 .071 R .051 .255 R .025 .063 R .004 .006 .019 .423 R .495 5.8 December ............ .002 .074 .037 .267 .017 .067 .004 .007 .020 .419 .495 5.5 Total .................... .017 .806 .797 2.824 .248 .783 .058 .093 .228 5.031 5.855 5.8
a Ethane, propane, normal butane, isobutane, natural gasoline, and refineryolefins (ethylene, propylene, butylene, and isobutylene).
b Includes still gas not burned as refinery fuel.c Distillate fuel oil, residual fuel oil, waxes, and miscellaneous products.R=Revised. Notes: • Data are estimates. • Non-combustion use estimates are included in
total energy consumption. See Table 1.3. • Non-combustion estimates are all forindustrial sector consumption, except for some lubricants consumed by thetransportation sector. • Totals may not equal sum of components due to
independent rounding. • Geographic coverage is the 50 states and the District ofColumbia.• See Note 2, "Non-Combustion Use of Fossil Fuels," at end of section.
Web Page: See http://www.eia.gov/totalenergy/data/monthly/#summary for allavailable annual and monthly data beginning in 1973.
Sources: • See Note 2, "Non-Combustion Use of Fossil Fuels," at end ofsection. • Percent of Total Energy Consumption: Calculated as totalnon-combustion use of fossil fuels divided by total primary energy consumption(see Table 1.3).

24 U. S. Energy Information Administration / Monthly Energy Review March 2019
Energy Overview Note 1. Merchandise Trade Value. Imports data presented are based on the customs values. Those values do not
include insurance and freight and are consequently lower than the cost, insurance, and freight (CIF) values, which are
also reported by the Bureau of the Census. All exports data, and imports data through 1980, are on a free alongside ship
(f.a.s.) basis.
“Balance” is exports minus imports; a positive balance indicates a surplus trade value and a negative balance indicates a
deficit trade value. “Energy” includes mineral fuels, lubricants, and related material. “Non‐Energy Balance” and “Total
Merchandise” include foreign exports (i.e., re‐exports) and nonmonetary gold and U.S. Department of Defense Grant‐
Aid shipments. The “Non‐Energy Balance” is calculated by subtracting the “Energy” from the “Total Merchandise
Balance.”
“Imports” consist of government and nongovernment shipments of merchandise into the 50 states, the District of
Columbia, Puerto Rico, the U.S. Virgin Islands, and the U.S. Foreign Trade Zones. They reflect the total arrival from
foreign countries of merchandise that immediately entered consumption channels, warehouses, the Foreign Trade
Zones, or the Strategic Petroleum Reserve. They exclude shipments between the United States, Puerto Rico, and U.S.
possessions, shipments to U.S. Armed Forces and diplomatic missions abroad for their own use, U.S. goods returned to
the United States by its Armed Forces, and in‐transit shipments.
Note 2. Non‐Combustion Use of Fossil Fuels. Most fossil fuels consumed in the United States and elsewhere are
combusted to produce heat and power. However, some are used directly for non‐combustion use as construction
materials, chemical feedstocks, lubricants, solvents, and waxes. For example, coal tars from coal coke manufacturing are
used as feedstock in the chemical industry, for metallurgical work, and in anti‐dandruff shampoos; natural gas is used to
make nitrogenous fertilizers and as chemical feedstocks; asphalt and road oil are used for roofing and paving;
hydrocarbon gas liquids are used to create intermediate products that are used in making plastics; lubricants, including
motor oil and greases, are used in vehicles and various industrial processes; petrochemical feedstocks are used to make
plastics, synthetic fabrics, and related products.
Coal The U.S. Energy Information Administration (EIA) assumes all non‐combustion use of coal comes from the process of
manufacturing coal coke. Among the byproducts of the process are "coal tars" or "coal liquids," which typically are rich
in aromatic hydrocarbons, such as benzene, and are used as chemical feedstock. EIA's Office of Energy Analysis (OEA)
estimates non‐combustion use ratios of coal tar. Prior to 1995, estimate ratios are based on coal tar production data
from the United States International Trade Commission's Synthetic Organic Chemicals. From 1995 forward, coal tar
production is estimated using the ratio of EIA’s estimate of 1994 coke production, reported in EIA's Quarterly Coal
Report. Coal tar ratios prior to 1980 are assumed to be equal to the 1980 ratio. For Table 1.11b, coal tar values in Table
1.11a are multiplied by 32.0067 million Btu/short ton, which is the product of 4.95 barrels/short ton (the density of coal
tar) and 6.466 million Btu/barrel (the approximate heat content of coal tar).
Natural Gas EIA assumes that all non‐combustion use of natural gas takes place in the industrial sector. OEA estimates non‐
combustion ratios of natural gas using Form EIA‐864A "Manufacturers Energy Consumption Survey" (MECS) and natural
gas used as feedstock for hydrogen production using Form EIA‐820 "Annual Refinery Report" data. For years when MECS
data are unavailable, estimates are interpolated or extrapolated using chemical indices as scaling factors. Non‐
combustion ratios prior to 1980 are assumed to be equal to the 1980 ratio. For Table 1.11b, natural gas values in Table
1.11a are multiplied by the heat content factor for natural gas total consumption shown in Table A4.
Asphalt & Road Oil EIA assumes all asphalt and road oil consumption is for non‐combustion use. For Table 1.11b, asphalt and road oil values
in Table 1.11a are multiplied by 6.636 million Btu/ barrel (the approximate heat content of asphalt and road oil) and the
number of days in the period.

U. S. Energy Information Administration / Monthly Energy Review March 2019 25
Distillate & Residual Fuels OEA estimates non‐combustion ratios of distillate and residual fuels using chemical industry fuel product data reported
in MECS. Values for years after the most recent MECS are assumed to be equal to the most recent MECS values. Non‐
combustion ratios prior to 1980 are assumed to be equal to the 1980 ratio. Distillate and residual fuel oils are included in
"other" petroleum products. For Table 1.11b, distillate fuel values in Table 1.11a are multiplied by the appropriate
values in Table A3 and the number of days in the period. Residual fuel values in Table 1.11a are multiplied by 6.287
million Btu/barrel (the approximate heat content of residual fuel oil) and the number of days in the period.
Hydrocarbon Gas Liquids (HGL) OEA estimates non‐combustion ratios of liquefied petroleum gas (LPG) components, including ethane, propane, and
butane, using chemical industry fuel product data reported in MECS. Values for years after the most recent MECS are
assumed to be equal to the most recent MECS values. OEA estimates non‐combustion ratios of natural gasoline
(pentanes plus) with annual surveys of natural gas liquids and refinery gases sold to the chemical industry published in
EIA's Petroleum Supply Annual (PSA). All non‐combustion ratios prior to 1980 are assumed to be equal to the 1980 ratio.
For Table 1.11b, HGL values in Table 1.11a are multiplied by the appropriate heat content factors in Table A1 and the
number of days in the period.
Lubricants EIA assumes all lubricants consumption are for non‐combustion use in the industrial and transportation sectors. For
Table 1.11b, lubricants values in Table 1.11a are multiplied by 6.065 million Btu/barrel (the approximate heat rate for
lubricants) and the number of days in the period.
Petrochemical Feedstocks EIA assumes all naphthas and other oils for petrochemical feedstock use are for non‐combustion use. OEA estimates
non‐combustion ratios of still gas by deducting all known fuel uses (refinery fuel use from PSA and pipeline gas supplies
from EIA's Natural Gas Annual) from the products supplied value from the PSA. The remainder is assumed to be
dispatched to chemical plants as a feedstock. Non‐combustion ratios prior to 1980 are assumed to be equal to the 1980
ratio. For Table 1.11b, petrochemical feedstock values in 1.11a are multiplied by the appropriate values in Table A1 and
the number of days in the period.
Petroleum Coke EIA assumes all non‐combustion use of petroleum coke occurs in the industrial sector. Examples include petroleum coke
used in the production of chemicals and metals. EIA estimates non‐combustion ratios of petroleum coke using PSA and
MECS data. Values for years after the most recent MECS are assumed to be equal to the most recent MECS values.
Non‐combustion ratios prior to 1980 are assumed to be equal to the 1980 ratio. For Table 1.11b, petroleum coke values
in 1.11a are multiplied by 5.719 million Btu/barrel (the approximate heat content of marketable petroleum coke) and
the number of days in the period.
Special Naphthas EIA assumes all special naphthas consumption is for non‐ combustion use. For Table 1.11b, special naphthas values in
Table 1.11a are multiplied by 5.248 million Btu/barrel (the approximate heat content of special naphthas) and the
number of days in the period.
Waxes EIA assumes all waxes consumption is for non‐combustion use. Waxes are included in "other" petroleum products. For
Table 1.11b, waxes values in Table 1.11a are multiplied by 5.537 million Btu/barrel (the approximate heat content of
waxes) and the number of days in the period.
Miscellaneous Petroleum Products Miscellaneous products include all finished petroleum products not classified elsewhere. EIA assumes all miscellaneous
petroleum products consumption are for non‐combustion use and are included in "other" petroleum products. For Table

26 U. S. Energy Information Administration / Monthly Energy Review March 2019
1.11b, miscellaneous petroleum values in Table 1.11a are multiplied by 5.796 million Btu/barrel (the approximate heat
content of miscellaneous petroleum products) and the number of days in the period.
Table 1.2 Sources
Coal 1949–1988: Coal production data from Table 6.1 are converted to Btu by multiplying by the coal production heat
content factors in Table A5.
1989 forward: Coal production data from Table 6.1 are converted to Btu by multiplying by the coal production heat
content factors in Table A5. Waste coal supplied data from Table 6.1 are converted to Btu by multiplying by the waste
coal supplied heat content factors in Table A5. Coal production (including waste coal supplied) is equal to coal
production plus waste coal supplied.
Natural Gas (Dry) 1949 forward: Natural gas (dry) production data from Table 4.1 are converted to Btu by multiplying by the natural gas
(dry) production heat content factors in Table A4.
Crude Oil 1949 forward: Crude oil (including lease condensate) production data from Table 3.1 are converted to Btu by multiplying
by the crude oil (including lease condensate) production heat content factors in Table A2.
NGPL 1949 forward: Natural gas plant liquids (NGPL) production data from Table 3.1 are converted to Btu by multiplying by
the NGPL production heat content factors in Table A2.
Fossil Fuels Total 1949 forward: Total fossil fuels production is the sum of the production values for coal, natural gas (dry), crude oil, and
NGPL.
Nuclear Electric Power 1949 forward: Nuclear electricity net generation data from Table 7.2a are converted to Btu by multiplying by the nuclear
heat rate factors in Table A6.
Renewable Energy 1949 forward: Table 10.1.
Total Primary Energy Production 1949 forward: Total primary energy production is the sum of the production values for fossil fuels, nuclear electric
power, and renewable energy.
Table 1.3 Sources
Coal 1949 forward: Coal consumption data from Table 6.1 are converted to Btu by multiplying by the total coal consumption
heat content factors in Table A5.
Natural Gas 1949–1979: Natural gas (including supplemental gaseous fuels) consumption data from Table 4.1 are converted to Btu
by multiplying by the total natural gas consumption heat content factors in Table A4.
1980 forward: Natural gas (including supplemental gaseous fuels) consumption data from Table 4.1 are converted to Btu
by multiplying by the total natural gas consumption heat content factors in Table A4. Supplemental gaseous fuels data in
Btu are estimated using the method described in Note 3, “Supplemental Gaseous Fuels,” at the end of Section 4. Natural

U. S. Energy Information Administration / Monthly Energy Review March 2019 27
gas (excluding supplemental gaseous fuels) consumption is equal to natural gas (including supplemental gaseous fuels)
consumption minus supplemental gaseous fuels.
Petroleum 1949–1992: Petroleum (excluding biofuels) consumption is equal to total petroleum products supplied from Table 3.6. 1993–2008: Petroleum (excluding biofuels) consumption is equal to total petroleum products supplied from Table 3.6 minus fuel ethanol consumption from Table 10.3. 2009–2011: Petroleum (excluding biofuels) consumption is equal to: total petroleum products supplied from Table 3.6; minus fuel ethanol (minus denaturant) consumption from Table 10.3; minus biodiesel consumption (calculated using biodiesel data from U.S. Energy Information Administration (EIA), EIA‐22M, "Monthly Biodiesel Production Survey"; and biomass‐based diesel fuel data from EIA‐810, "Monthly Refinery Report," EIA‐812, "Monthly Product Pipeline Report," and EIA‐815, "Monthly Bulk Terminal and Blender Report” (the data are converted to Btu by multiplying by the biodiesel heat content factor in Table A1); minus other renewable diesel fuel and other renewables fuels consumption from Table 10.4. 2012 forward: Petroleum (excluding biofuels) consumption is equal to: total petroleum products supplied from Table 3.6; minus fuel ethanol (minus denaturant) consumption from Table 10.3; minus biodiesel consumption from Table 10.4; minus other renewable diesel fuel and other renewables fuels consumption from Table 10.4.
Coal Coke Net Imports 1949 forward: Coal coke net imports are equal to coal coke imports from Table 1.4a minus coal coke exports from Table
1.4b.
Fossil Fuels Total 1949 forward: Total fossil fuels consumption is the sum of the consumption values for coal, natural gas, and petroleum,
plus coal coke net imports.
Nuclear Electric Power 1949 forward: Nuclear electricity net generation data from Table 7.2a are converted to Btu by multiplying by the nuclear
heat rate factors in Table A6.
Renewable Energy 1949 forward: Table 10.1.
Electricity Net Imports 1949 forward: Electricity net imports are equal to electricity imports from Table 1.4a minus electricity exports from
Table 1.4b.
Total Primary Energy Consumption 1949 forward: Total primary energy consumption is the sum of the consumption values for fossil fuels, nuclear electric
power, and renewable energy, plus electricity net imports.
Table 1.4a Sources
Coal 1949 forward: Coal imports data from Table 6.1 are converted to Btu by multiplying by the coal imports heat content
factors in Table A5.
Coal Coke 1949 forward: Coal coke imports data from U.S. Department of Commerce, Bureau of the Census, Monthly Report IM
145, are converted to Btu by multiplying by the coal coke imports heat content factor in Table A5.

28 U. S. Energy Information Administration / Monthly Energy Review March 2019
Natural Gas 1949 forward: Natural gas imports data from Table 4.1 are converted to Btu by multiplying by the natural gas imports
heat content factors in Table A4.
Crude Oil 1949 forward: Crude oil imports data from Table 3.3b are converted to Btu by multiplying by the crude oil imports heat
content factors in Table A2.
Petroleum Products 1949–1992: Petroleum products (excluding biofuels) imports are equal to total petroleum imports from Table 3.3b
minus crude oil imports from Table 3.3b; petroleum products (excluding biofuels) imports data are converted to Btu by
multiplying by the total petroleum products imports heat content factors in Table A2.
1993–2008: Petroleum products (excluding biofuels) imports are equal to petroleum products (including biofuels)
imports (see 1949–1992 sources above) minus fuel ethanol (minus denaturant) imports (see “Biomass—Fuel Ethanol
(Minus Denaturant)” sources below).
2009 forward: Renewable fuels (excluding fuel ethanol) imports data are from U.S. Energy Information Administration,
Petroleum Supply Annual (PSA), Tables 1 and 25, and Petroleum Supply Monthly (PSM), Tables 1 and 37 (for biomass‐
based diesel fuel and other renewable fuels, the data are converted to Btu by multiplying by the biodiesel heat content
factor in Table A1; for other renewable diesel fuel, the data are converted to Btu by multiplying by the other renewable
diesel fuel heat content factor in Table A1). Petroleum products (excluding biofuels) imports are equal to petroleum
products (including biofuels) imports (see 1949–1992 sources above) minus fuel ethanol (minus denaturant) imports
(see “Biomass—Fuel Ethanol (Minus Denaturant)” sources below) minus renewable fuels (excluding fuel ethanol)
imports.
Total Petroleum 1949 forward: Total petroleum imports are equal to crude oil imports plus petroleum products imports.
Biomass—Fuel Ethanol (Minus Denaturant) 1993 forward: Fuel ethanol (including denaturant) imports data are from PSA/PSM Table 1. Fuel ethanol (minus
denaturant) production is equal to fuel ethanol (including denaturant) production from Table 10.3 minus denaturant
from Table 10.3. Fuel ethanol (minus denaturant) imports are equal to fuel ethanol (including denaturant) imports
multiplied by the ratio of fuel ethanol (minus denaturant) production to fuel ethanol (including denaturant) production.
Fuel ethanol (minus denaturant) imports data are converted to Btu by multiplying by 3.539 million Btu per barrel, the
undenatured ethanol heat content factor in Table A3.
Biomass—Biodiesel 2001 forward: Biodiesel imports data are from Table 10.4, and are converted to Btu by multiplying by the biodiesel heat
content factor in Table A1.
Biomass—Other Renewable Fuels 2009 forward: Other renewable fuels imports data are from PSA Table 25 and PSM Table 37. For other renewable diesel
fuel, the data are converted to Btu by multiplying by the other renewable diesel fuel heat content factor in Table A1; for
other renewable fuels, the data are converted to Btu by multiplying by the biodiesel heat content factor in Table A1.
Total Biomass 1993–2000: Total biomass imports are equal to fuel ethanol (minus denaturant) imports.
2001–2008: Total biomass imports are equal to fuel ethanol (minus denaturant) imports plus biodiesel imports.
2009 forward: Total biomass imports are the sum of imports values for fuel ethanol (minus denaturant), biodiesel, and
other renewable fuels.
U. S. Energy Information Administration / Monthly Energy Review March 2019 29
Electricity 1949 forward: Electricity imports data from Table 7.1 are converted to Btu by multiplying by the electricity heat content
factor in Table A6.
Total Primary Energy Imports 1949 forward: Total primary energy imports are the sum of the imports values for coal, coal coke, natural gas, total
petroleum, total biomass, and electricity.
Table 1.4b Sources
Coal 1949 forward: Coal exports data from Table 6.1 are converted to Btu by multiplying by the coal exports heat content
factors in Table A5.
Coal Coke 1949 forward: Coal coke exports data from U.S. Department of Commerce, Bureau of the Census, Monthly Report EM
545, are converted to Btu by multiplying by the coal coke exports heat content factor in Table A5.
Natural Gas 1949 forward: Natural gas exports data from Table 4.1 are converted to Btu by multiplying by the natural gas exports
heat content factors in Table A4.
Crude Oil 1949 forward: Crude oil exports data from Table 3.3b are converted to Btu by multiplying by the crude oil exports heat
content factor in Table A2.
Petroleum Products 1949–2009: Petroleum products (excluding biofuels) exports are equal to total petroleum exports from Table 3.3b minus
crude oil exports from Table 3.3b; petroleum products (excluding biofuels) exports data are converted to Btu by
multiplying by the total petroleum products exports heat content factors in Table A2.
2010: Petroleum products (including biofuels) exports are equal to total petroleum exports from Table 3.3b minus crude
oil exports from Table 3.3b; petroleum products (including biofuels) exports data are converted to Btu by multiplying by
the total petroleum products exports heat content factors in Table A2. Petroleum products (excluding biofuels) exports
are equal to petroleum products (including biofuels) exports minus fuel ethanol (minus denaturant) exports (see
“Biomass—Fuel Ethanol (Minus Denaturant)” sources below).
2011 forward: Biomass‐based diesel fuel exports data are from U.S. Energy Information Administration (EIA), Petroleum
Supply Annual (PSA), Table 31, and Petroleum Supply Monthly (PSM), Table 49, and are converted to Btu by multiplying
by the biodiesel heat content factor in Table A1. Petroleum products (excluding biofuels) exports are equal to
petroleum products (including biofuels) exports (see 2010 sources above) minus fuel ethanol (minus denaturant)
exports (see “Biomass—Fuel Ethanol (Minus Denaturant)” sources below) minus biomass‐based diesel fuel exports.
Total Petroleum 1949 forward: Total petroleum exports are equal to crude oil exports plus petroleum products exports.
Biomass—Fuel Ethanol (Minus Denaturant) 2010 forward: Fuel ethanol (including denaturant) exports data are from PSA/PSM Table 1. Fuel ethanol (minus
denaturant) production is equal to fuel ethanol (including denaturant) production from Table 10.3 minus denaturant
from Table 10.3. Fuel ethanol (minus denaturant) exports are equal to fuel ethanol (including denaturant) exports
multiplied by the ratio of fuel ethanol (minus denaturant) production to fuel ethanol (including denaturant) production.
Fuel ethanol (minus denaturant) exports are converted to Btu by multiplying by 3.539 million Btu per barrel, the
undenatured ethanol heat content factor in Table A3.

30 U. S. Energy Information Administration / Monthly Energy Review March 2019
Biomass—Biodiesel 2001 forward: Biodiesel exports data are from Table 10.4, and are converted to Btu by multiplying by the biodiesel heat
content factor in Table A1.
Biomass—Densified Biomass 2016 forward: Densified biomass exports data are from EIA, Form EIA‐63C, “Densified Biomass Fuel Report.”
Total Biomass 2001–2009: Total biomass exports are equal to biodiesel exports.
2010 forward: Total biomass exports are equal to fuel ethanol (minus denaturant) exports plus biodiesel exports.
2016 forward: Total biomass exports are the sum of the exports values for fuel ethanol (minus denaturant), biodiesel,
and densified biomass.
Electricity 1949 forward: Electricity exports data from Table 7.1 are converted to Btu by multiplying by the electricity heat content
factor in Table A6.
Total Primary Energy Exports 1949 forward: Total primary energy exports are the sum of the exports values for coal, coal coke, natural gas, total
petroleum, total biomass, and electricity.
Total Primary Energy Net Imports 1949 forward: Total primary energy net imports are equal to total primary energy imports from Table 1.4a minus total
primary energy exports.
Table 1.5 Sources
U.S. Department of Commerce, U.S. Census Bureau, Foreign Trade Division:
Petroleum Exports 1974–1987: “U.S. Exports,” FT‐410, December issues.
1988 and 1989: “Report on U.S. Merchandise Trade,” Final Revisions.
1990–1992: “U.S. Merchandise Trade,” Final Report.
1993–2009: “U.S. International Trade in Goods and Services,” Annual Revisions.
2010–2011: “U.S. International Trade in Goods and Services,” 2012 Annual Revisions.
2012–2014: “U.S. International Trade in Goods and Services,” 2014 Annual Revisions.
2015 forward: “U.S. International Trade in Goods and Services,” FT‐900, monthly.
Petroleum Imports 1974–1987: “U.S. Merchandise Trade,” FT‐900, December issues, 1975–1988.
1988 and 1989: “Report on U.S. Merchandise Trade,” Final Revisions.
1990–1993: “U.S. Merchandise Trade,” Final Report.
1994–2009: “U.S. International Trade in Goods and Services,” Annual Revisions.
2010–2011: “U.S. International Trade in Goods and Services,” 2012 Annual Revisions.

U. S. Energy Information Administration / Monthly Energy Review March 2019 31
2012–2014: “U.S. International Trade in Goods and Services,” 2014 Annual Revisions.
2015 forward: “U.S. International Trade in Goods and Services,” FT‐900, monthly.
Energy Exports and Imports 1974–1987: U.S. merchandise trade press releases and database printouts for adjustments.
1988: January–July, monthly FT‐900 supplement, 1989 issues. August–December, monthly FT‐900, 1989 issues.
1989: Monthly FT‐900, 1990 issues.
1990–1992: “U.S. Merchandise Trade,” Final Report. 1993–2009: “U.S. International Trade in Goods and Services,”
Annual Revisions.
1993–2009: “U.S. International Trade in Goods and Services,” Annual Revisions.
2010–2011: “U.S. International Trade in Goods and Services,” 2012 Annual Revisions.
2012–2014: “U.S. International Trade in Goods and Services,” 2014 Annual Revisions.
2015 forward: “U.S. International Trade in Goods and Services,” FT‐900, monthly.
Petroleum Balance 1974 forward: The petroleum balance is calculated by the U.S. Energy Information Administration (EIA) as petroleum
imports minus petroleum exports.
Energy Balance 1974 forward: The energy balance is calculated by EIA as energy imports minus energy exports.
Non-Energy Balance 1974 forward: The non‐energy balance is calculated by EIA as the total merchandise balance minus the energy balance.
Total Merchandise 1974–1987: U.S. merchandise trade press releases and database printouts for adjustments.
1988: “Report on U.S. Merchandise Trade, 1988 Final Revisions,” August 18, 1989.
1989: “Report on U.S. Merchandise Trade, 1989 Revisions,” July 10, 1990.
1990: “U.S. Merchandise Trade, 1990 Final Report,” May 10, 1991, and “U.S. Merchandise Trade, December 1992,”
February 18, 1993, page 3.
1991: “U.S. Merchandise Trade, 1992 Final Report,” May 12, 1993.
1992–2009: “U.S. International Trade in Goods and Services,” Annual Revisions.
2010–2011: “U.S. International Trade in Goods and Services,” 2012 Annual Revisions.
2012–2014: “U.S. International Trade in Goods and Services,” 2014 Annual Revisions.
2015 forward: “U.S. International Trade in Goods and Services,” FT‐900, monthly.

THIS PAGE INTENTIONALLY LEFT BLANK

2. Energy Consumption
By Sector

34 U. S. Energy Information Administration / Monthly Energy Review March 2019
Figure 2.1 Energy Consumption by Sector (Quadrillion Btu)
Commercial
Residential Transportation
Industrial
0
10
20
30
40
1950 1955 1960 1965 1970 1975 1980 1985 1990 1995 2000 2005 2010 2015
Total Consumption by End-Use Sector, 1949–2018
Industrial
Commercial
Residential
Transportation
0
1
2
3
J F M A M J J A S O N D J F M A M J J A S O N D J F M A M J J A S O N D
2016 2017 2018
Total Consumption by End-Use Sector, Monthly
0.976
0.602
1.989
2.364
3.130
2.226
1.699
2.765
2.371
0
1
2
3
4
Residential Commercial Industrial Transportation Electric Power
By Sector, December 2018
Primary Consumption Total Consumption
Web Page: http://www.eia.gov/totalenergy/data/monthly/#consumption.
Source: Table 2.1.

U. S. Energy Information Administration / Monthly Energy Review March 2019 35
Table 2.1 Energy Consumption by Sector (Trillion Btu)
End-Use Sectors ElectricPower
Sectorc,d
BalancingItemg
Primary Totalh
Residential Commerciala Industrialb Transportation
Primarye Totalf Primarye Totalf Primarye Totalf Primarye Totalf Primarye
1950 Total ...................... 4,829 5,989 2,834 3,893 13,890 16,241 8,383 8,492 4,679 (s) 34,6161955 Total ...................... 5,608 7,278 2,561 3,895 16,103 19,485 9,474 9,550 6,461 (s) 40,2081960 Total ...................... 6,651 9,039 2,723 4,609 16,996 20,842 10,560 10,596 8,158 (s) 45,0861965 Total ...................... 7,279 10,639 3,177 5,845 20,148 25,098 12,399 12,432 11,012 (s) 54,0151970 Total ...................... 8,322 13,766 4,237 8,346 22,964 29,628 16,062 16,098 16,253 (s) 67,8381975 Total ...................... 7,990 14,813 4,059 9,492 21,434 29,413 18,210 18,245 20,270 1 71,9651980 Total ...................... 7,439 15,753 4,105 10,578 22,595 32,039 19,659 19,697 24,269 -1 78,0671985 Total ...................... 7,148 16,041 3,732 11,451 19,443 28,816 20,041 20,088 26,032 -4 76,3921990 Total ...................... 6,552 16,940 3,893 13,317 21,172 31,802 22,366 22,419 d 30,495 7 84,4851995 Total ...................... 6,934 18,517 4,100 14,690 22,718 33,969 23,757 23,812 33,479 3 90,9912000 Total ...................... 7,156 20,421 4,278 17,175 22,823 34,662 26,456 26,516 38,062 2 98,7762001 Total ...................... 6,864 20,038 4,084 17,137 21,792 32,718 26,179 26,242 37,215 -6 96,1292002 Total ...................... 6,907 20,786 4,132 17,346 21,797 32,660 26,747 26,808 38,016 5 97,6052003 Total ...................... 7,232 21,119 4,298 17,346 21,533 32,553 26,807 26,881 38,028 -1 97,8982004 Total ...................... 6,987 21,081 4,232 17,655 22,411 33,515 27,748 27,827 38,701 -6 100,0732005 Total ...................... 6,901 21,613 4,052 17,853 21,410 32,441 28,180 28,261 39,626 (s) 100,1682006 Total ...................... 6,154 20,670 3,747 17,707 21,529 32,390 28,618 28,697 39,417 (s) 99,4642007 Total ...................... 6,589 21,519 3,922 18,253 21,362 32,384 28,728 28,815 40,371 -1 100,9712008 Total ...................... 6,889 21,668 4,100 18,402 20,527 31,333 27,340 27,422 39,969 1 98,8252009 Total ...................... 6,637 21,081 4,055 17,887 18,755 28,465 26,507 26,589 38,069 (s) 94,0232010 Total ...................... 6,640 21,894 4,023 18,058 20,421 30,669 26,899 26,980 39,619 7 97,6082011 Total ...................... 6,472 21,381 4,064 17,980 20,591 30,979 26,521 26,601 39,293 8 96,9492012 Total ...................... 5,684 19,870 3,723 17,420 20,884 31,057 26,054 26,129 38,131 2 94,4772013 Total ...................... 6,688 21,051 4,161 17,929 21,478 31,625 26,536 26,614 38,357 -1 97,2182014 Total ...................... 7,005 21,444 4,390 18,264 21,560 31,796 26,791 26,871 38,629 6 98,3812015 Total ...................... 6,463 20,616 4,441 18,157 21,525 31,469 27,164 27,241 37,890 1 97,484
2016 January .................. 1,059 2,392 627 1,751 1,928 2,731 2,182 2,189 3,267 (s) 9,063 February ................ 856 1,985 532 1,539 1,837 2,584 2,121 2,127 2,889 -4 8,231 March ..................... 602 1,582 405 1,438 1,847 2,621 2,345 2,351 2,794 -7 7,986 April ....................... 461 1,341 329 1,346 1,720 2,504 2,260 2,266 2,687 -5 7,452 May ........................ 324 1,289 265 1,376 1,727 2,562 2,351 2,357 2,918 -3 7,582 June ....................... 236 1,529 222 1,464 1,710 2,573 2,359 2,366 3,404 3 7,935 July ........................ 227 1,817 222 1,561 1,751 2,648 2,430 2,437 3,833 6 8,469 August ................... 213 1,771 224 1,569 1,841 2,729 2,456 2,462 3,797 7 8,537 September ............. 230 1,477 230 1,421 1,737 2,540 2,298 2,304 3,247 3 7,745 October .................. 324 1,319 290 1,397 1,808 2,608 2,321 2,327 2,909 (s) 7,651 November .............. 519 1,446 382 1,427 1,806 2,586 2,251 2,257 2,757 -3 7,713 December .............. 981 2,240 594 1,738 1,942 2,758 2,338 2,345 3,225 (s) 9,080 Total ...................... 6,031 20,180 4,321 18,030 21,657 31,450 27,713 27,788 37,727 -4 97,444
2017 January .................. 1,016 2,316 R 605 R 1,706 1,939 2,732 R 2,220 R 2,226 3,201 2 8,982 February ................ 726 1,708 R 463 R 1,432 R 1,712 2,437 R 2,041 R 2,047 2,684 -2 7,623 March ..................... 736 1,773 R 482 R 1,560 1,910 2,720 R 2,373 R 2,380 2,932 -2 8,430 April ....................... 413 1,311 R 307 R 1,322 1,776 2,557 R 2,260 2,265 2,700 -3 7,452 May ........................ 324 1,325 R 268 R 1,386 1,821 R 2,668 R 2,417 R 2,423 2,971 -1 7,800 June ....................... 251 1,483 R 229 R 1,436 1,784 2,643 R 2,395 R 2,401 3,303 2 7,964 July ........................ 227 1,745 R 219 R 1,528 1,834 2,723 R 2,425 2,431 3,722 5 8,432 August ................... 223 1,615 R 225 R 1,484 R 1,831 2,704 2,484 R 2,491 3,531 4 8,297 September ............. 232 1,379 R 229 R 1,376 1,765 2,572 R 2,296 R 2,302 3,108 (s) 7,630 October .................. 333 1,349 R 294 R 1,413 R 1,855 2,673 2,397 R 2,404 2,960 -2 7,838 November .............. 620 1,617 R 430 R 1,495 1,926 2,732 R 2,281 R 2,287 2,874 -2 8,129 December .............. 1,009 2,281 R 617 R 1,757 1,995 R 2,832 R 2,354 R 2,361 3,255 -1 9,229 Total ...................... 6,108 19,897 R 4,366 R 17,898 R 22,149 R 31,994 R 27,942 R 28,017 37,241 (s) 97,807
2018 January .................. R 1,197 R 2,713 R 691 R 1,857 R 2,055 R 2,829 R 2,248 R 2,255 3,462 2 9,655 February ................ R 854 R 1,974 R 531 R 1,538 R 1,803 R 2,514 R 2,047 R 2,053 2,844 -2 8,077 March ..................... R 827 R 1,905 R 527 R 1,615 R 1,981 R 2,756 R 2,405 R 2,412 R 2,946 -4 R 8,683 April ....................... R 596 R 1,551 R 402 R 1,435 R 1,830 R 2,585 R 2,312 R 2,318 R 2,749 -6 R 7,883 May ........................ R 303 R 1,389 R 252 R 1,434 R 1,882 R 2,737 R 2,456 R 2,463 3,129 -3 R 8,020 June ....................... R 245 1,573 R 225 R 1,472 R 1,833 R 2,668 R 2,423 R 2,429 3,416 1 8,144 July ........................ 236 1,794 R 222 R 1,555 R 1,888 R 2,754 R 2,494 R 2,501 R 3,765 3 R 8,608 August ................... 227 R 1,737 R 226 R 1,554 R 1,972 R 2,857 R 2,537 R 2,544 R 3,729 3 R 8,694 September ............. 239 R 1,498 R 228 R 1,420 R 1,833 R 2,629 R 2,305 R 2,312 R 3,253 (s) 7,859 October .................. 412 R 1,448 R 341 R 1,467 R 1,995 R 2,782 R 2,405 R 2,411 R 2,956 -7 R 8,102 November .............. R 775 R 1,844 501 1,583 R 1,942 R 2,738 R 2,318 R 2,324 R 2,954 -5 R 8,485 December .............. 976 2,226 602 1,699 1,989 2,765 2,364 2,371 3,130 -4 9,058 Total ...................... 6,886 21,652 4,749 18,631 23,003 32,613 28,315 28,393 38,335 -21 101,268
a Commercial sector, including commercial combined-heat-and-power (CHP)and commercial electricity-only plants.
b Industrial sector, including industrial combined-heat-and-power (CHP) andindustrial electricity-only plants.
c Electricity-only and combined-heat-and-power (CHP) plants within the NAICS22 category whose primary business is to sell electricity, or electricity and heat, tothe public.
d Through 1988, data are for electric utilities only. Beginning in 1989, data arefor electric utilities and independent power producers.
e See "Primary Energy Consumption" in Glossary.f Total energy consumption in the end-use sectors consists of primary energy
consumption, electricity retail sales, and electrical system energy losses. See Note1, "Electrical System Energy Losses," at end of section.
g A balancing item. The sum of primary consumption in the five energy-usesectors equals the sum of total consumption in the four end-use sectors. However,total energy consumption does not equal the sum of the sectoral components due
to the use of sector-specific conversion factors for coal and natural gas.h Primary energy consumption total. See Table 1.3.R=Revised. (s)=Less than 0.5 trillion Btu and greater than -0.5 trillion Btu. Notes: • Data are estimates, except for the electric power sector. • See Note 2,
"Classification of Power Plants Into Energy-Use Sectors," at end of Section 7.• See Note 2, "Energy Consumption Data and Surveys," at end of section.• Totals may not equal sum of components due to independent rounding.• Geographic coverage is the 50 states and the District of Columbia.
Web Page: See http://www.eia.gov/totalenergy/data/monthly/#consumption(Excel and CSV files) for all available annual data beginning in 1949 and monthlydata beginning in 1973.
Sources: • End-Use Sectors: Tables 2.2–2.5. • Electric Power Sector: Table 2.6. • Balancing Item: Calculated as primary energy total consumptionminus the sum of total energy consumption in the four end-use sectors. • Primary Total: Table 1.3.

36 U. S. Energy Information Administration / Monthly Energy Review March 2019
Figure 2.2 Residential Sector Energy Consumption (Quadrillion Btu)
Electricity[a]
Natural Gas
Petroleum
Renewable Energy
Coal
0
1
2
3
4
5
6
1950 1955 1960 1965 1970 1975 1980 1985 1990 1995 2000 2005 2010 2015
By Major Source, 1949–2018
Electricity[a]
Natural Gas
Petroleum Renewable Energy
0.0
0.3
0.6
0.9
1.2
J F M A M J J A S O N D J F M A M J J A S O N D J F M A M J J A S O N D
2016 2017 2018
By Major Source, Monthly
20.180 19.897
21.652
0
5
10
15
20
25
2016 2017 2018
Total, January–December
0.061
0.120
0.418
0.796
0.0 0.2 0.4 0.6 0.8 1.0
Renewable Energy
Petroleum
Electricity[a]
Natural Gas
By Major Source, December 2018
[a] Electricity retail sales.
Web Page: http://www.eia.gov/totalenergy/data/monthly/#consumption.
Source: Table 2.2.

U. S. Energy Information Administration / Monthly Energy Review March 2019 37
Table 2.2 Residential Sector Energy Consumption (Trillion Btu)
Primary Consumptiona
ElectricityRetailSalese
ElectricalSystemEnergyLossesf Total
Fossil Fuels Renewable Energyb
TotalPrimaryCoal
NaturalGasc
Petro-leum Total
Geo-thermal Solard
Bio-mass Total
1950 Total .................... 1,261 1,240 1,322 3,824 NA NA 1,006 1,006 4,829 246 913 5,9891955 Total .................... 867 2,198 1,767 4,833 NA NA 775 775 5,608 438 1,232 7,2781960 Total .................... 585 3,212 2,227 6,024 NA NA 627 627 6,651 687 1,701 9,0391965 Total .................... 352 4,028 2,432 6,811 NA NA 468 468 7,279 993 2,367 10,6391970 Total .................... 209 4,987 2,725 7,922 NA NA 401 401 8,322 1,591 3,852 13,7661975 Total .................... 63 5,023 2,479 7,564 NA NA 425 425 7,990 2,007 4,817 14,8131980 Total .................... 31 4,825 1,734 6,589 NA NA 850 850 7,439 2,448 5,866 15,7531985 Total .................... 39 4,534 1,565 6,138 NA NA 1,010 1,010 7,148 2,709 6,184 16,0411990 Total .................... 31 4,487 1,394 5,912 6 55 580 640 6,552 3,153 7,235 16,9401995 Total .................... 17 4,954 1,373 6,345 7 63 520 589 6,934 3,557 8,026 18,5172000 Total .................... 11 5,105 1,553 6,669 9 58 420 486 7,156 4,069 9,197 20,4212001 Total .................... 12 4,889 1,528 6,429 9 55 370 435 6,864 4,100 9,074 20,0382002 Total .................... 12 4,995 1,456 6,463 10 53 380 443 6,907 4,317 9,562 20,7862003 Total .................... 12 5,209 1,546 6,768 13 52 400 465 7,232 4,353 9,534 21,1192004 Total .................... 11 4,981 1,519 6,511 14 51 410 475 6,987 4,408 9,687 21,0812005 Total .................... 8 4,946 1,450 6,405 16 50 430 496 6,901 4,638 10,074 21,6132006 Total .................... 6 4,476 1,221 5,704 18 53 380 451 6,154 4,611 9,905 20,6702007 Total .................... 8 4,835 1,249 6,092 22 55 420 497 6,589 4,750 10,180 21,5192008 Total .................... NA 5,010 1,324 6,334 26 58 470 555 6,889 4,711 10,068 21,6682009 Total .................... NA 4,883 1,157 6,040 33 60 504 597 6,637 4,657 9,788 21,0812010 Total .................... NA 4,878 1,120 5,998 37 65 541 642 6,640 4,933 10,321 21,8942011 Total .................... NA 4,805 1,033 5,838 40 71 524 635 6,472 4,855 10,054 21,3812012 Total .................... NA 4,242 885 5,127 40 79 438 557 5,684 4,690 9,496 19,8702013 Total .................... NA 5,023 963 5,986 40 91 572 703 6,688 4,759 9,604 21,0512014 Total .................... NA 5,242 1,036 6,278 40 109 579 727 7,005 4,801 9,638 21,4442015 Total .................... NA 4,777 1,007 5,783 40 127 513 680 6,463 4,791 9,362 20,616
2016 January ................ NA 912 98 1,009 3 8 38 49 1,059 447 886 2,392 February .............. NA 716 92 808 3 10 35 48 856 396 733 1,985 March ................... NA 472 77 548 3 13 38 54 602 342 638 1,582 April ..................... NA 340 67 407 3 14 37 54 461 301 579 1,341 May ...................... NA 201 66 267 3 16 38 57 324 321 644 1,289 June ..................... NA 127 53 180 3 17 37 56 236 427 865 1,529 July ...................... NA 110 58 168 3 17 38 58 227 527 1,063 1,817 August ................. NA 104 50 155 3 17 38 58 213 534 1,024 1,771 September ........... NA 114 61 175 3 15 37 55 230 441 806 1,477 October ................ NA 194 75 269 3 13 38 55 324 346 649 1,319 November ............ NA 394 75 468 3 11 37 51 519 318 609 1,446 December ............ NA 824 106 930 3 10 38 51 981 414 845 2,240 Total .................... NA 4,506 878 5,384 40 160 448 647 6,031 4,815 9,334 20,180
2017 January ................ NA 860 106 966 3 10 37 50 1,016 441 859 2,316 February .............. NA 599 79 679 3 11 33 47 726 345 638 1,708 March ................... NA 600 80 680 3 16 37 56 736 352 685 1,773 April ..................... NA 288 68 356 3 18 36 56 413 310 588 1,311 May ...................... NA 206 59 265 3 19 37 59 324 335 665 1,325 June ..................... NA 128 64 192 3 20 36 59 251 418 814 1,483 July ...................... NA 111 55 166 3 20 37 61 227 511 1,006 1,745 August ................. NA 107 56 163 3 20 37 60 223 485 907 1,615 September ........... NA 118 57 175 3 18 36 57 232 405 742 1,379 October ................ NA 212 65 277 3 16 37 56 333 351 665 1,349 November ............ NA 484 85 569 3 12 36 51 620 335 662 1,617 December ............ NA 850 107 957 3 12 37 52 1,009 416 856 2,281 Total .................... NA 4,563 881 5,444 40 191 433 664 6,108 4,704 9,085 19,897
2018 January ................ NA 1,009 R 129 R 1,138 3 12 44 59 R 1,197 508 1,007 R 2,713 February .............. NA 710 R 88 R 799 3 13 40 56 R 854 387 733 R 1,974 March ................... NA 678 R 84 R 762 3 18 44 65 R 827 365 713 R 1,905 April ..................... NA R 453 R 76 R 530 3 20 43 66 R 596 325 630 R 1,551 May ...................... NA 174 R 59 R 233 3 23 44 70 R 303 353 733 R 1,389 June ..................... NA 123 54 R 176 3 23 43 69 R 245 442 886 1,573 July ...................... NA 109 56 165 3 24 44 71 236 522 R 1,037 1,794 August ................. NA 103 54 157 3 23 44 70 227 R 522 R 988 R 1,737 September ........... NA 116 R 57 R 173 3 20 43 66 239 438 821 R 1,498 October ................ NA R 264 R 82 R 346 3 18 44 65 412 364 R 672 R 1,448 November ............ NA R 617 R 97 R 715 3 14 43 60 R 775 353 R 717 R 1,844 December ............ NA 796 120 916 3 13 44 61 976 418 831 2,226 Total .................... NA 5,152 957 6,108 40 221 517 778 6,886 4,996 9,769 21,652
a See "Primary Energy Consumption" in Glossary.b See Table 10.2a for notes on series components.c Natural gas only; excludes the estimated portion of supplemental gaseous
fuels. See Note 3, "Supplemental Gaseous Fuels," at end of Section 4.d Distributed (small-scale) solar photovoltaic (PV) electricity generation in the
residential sector and distributed solar thermal energy in the residential,commercial, and industrial sectors. See Tables 10.2a and 10.5.
e Electricity retail sales to ultimate customers reported by electric utilities and,beginning in 1996, other energy service providers.
f Total losses are calculated as the primary energy consumed by the electricpower sector minus the energy content of electricity retail sales. Total losses areallocated to the end-use sectors in proportion to each sector’s share of total
electricity retail sales. See Note 1, "Electrical System Energy Losses," at end ofsection.
R=Revised. NA=Not available. Notes: • Data are estimates, except for electricity retail sales. • See Note 2,
"Energy Consumption Data and Surveys," at end of section. • Totals may notequal sum of components due to independent rounding. • Geographic coverage isthe 50 states and the District of Columbia.
Web Page: See http://www.eia.gov/totalenergy/data/monthly/#consumption(Excel and CSV files) for all available annual data beginning in 1949 and monthlydata beginning in 1973.
Sources: See end of section.
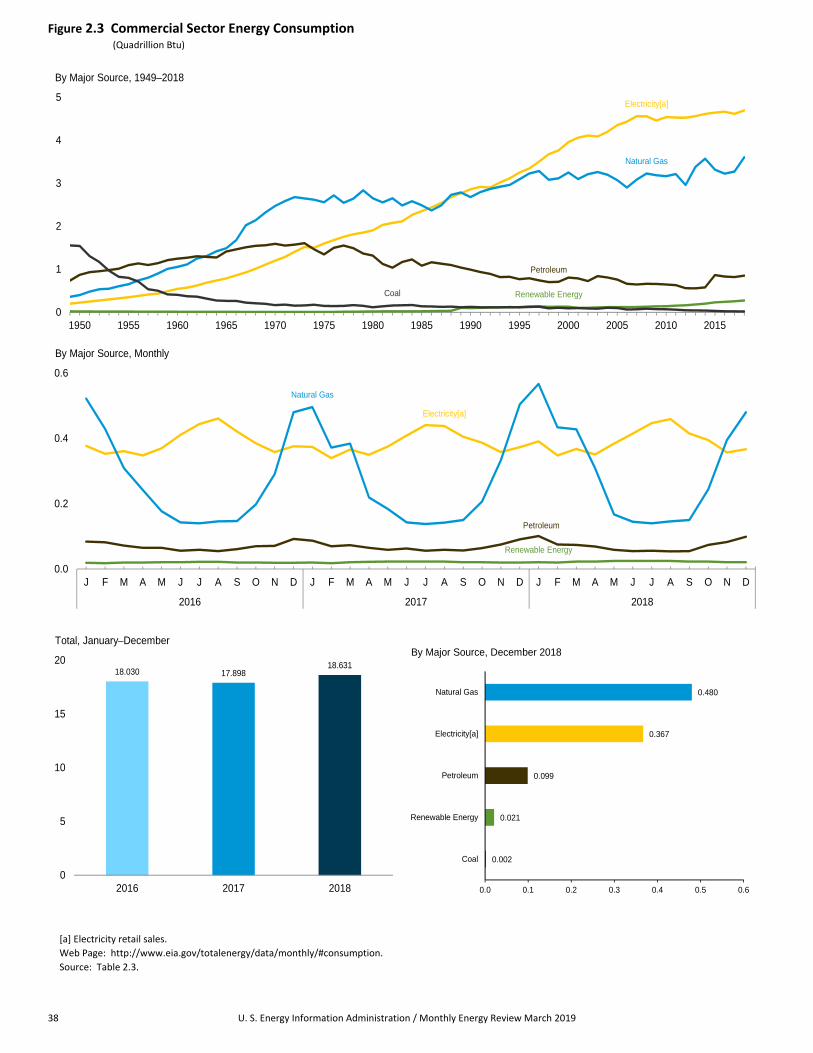
38 U. S. Energy Information Administration / Monthly Energy Review March 2019
Figure 2.3 Commercial Sector Energy Consumption (Quadrillion Btu)
Electricity[a]
Natural Gas
Petroleum
Renewable Energy Coal
0
1
2
3
4
5
1950 1955 1960 1965 1970 1975 1980 1985 1990 1995 2000 2005 2010 2015
By Major Source, 1949–2018
Electricity[a]
Natural Gas
Petroleum
Renewable Energy
0.0
0.2
0.4
0.6
J F M A M J J A S O N D J F M A M J J A S O N D J F M A M J J A S O N D
2016 2017 2018
By Major Source, Monthly
18.030 17.89818.631
0
5
10
15
20
2016 2017 2018
Total, January–December
0.002
0.021
0.099
0.367
0.480
0.0 0.1 0.2 0.3 0.4 0.5 0.6
Coal
Renewable Energy
Petroleum
Electricity[a]
Natural Gas
By Major Source, December 2018
[a] Electricity retail sales.
Web Page: http://www.eia.gov/totalenergy/data/monthly/#consumption.
Source: Table 2.3.

U. S. Energy Information Administration / Monthly Energy Review March 2019 39
Table 2.3 Commercial Sector Energy Consumption (Trillion Btu)
Primary Consumptiona
Elec-tricityRetailSalesg
ElectricalSystemEnergyLossesh Total
Fossil Fuels Renewable Energyb
TotalPrimaryCoal
NaturalGasc
Petro-leumd Total
Hydro-electricPowere
Geo-thermal Solarf Wind
Bio-mass Total
1950 Total .................... 1,542 401 872 2,815 NA NA NA NA 19 19 2,834 225 834 3,8931955 Total .................... 801 651 1,095 2,547 NA NA NA NA 15 15 2,561 350 984 3,8951960 Total .................... 407 1,056 1,248 2,711 NA NA NA NA 12 12 2,723 543 1,344 4,6091965 Total .................... 265 1,490 1,413 3,168 NA NA NA NA 9 9 3,177 789 1,880 5,8451970 Total .................... 165 2,473 1,592 4,229 NA NA NA NA 8 8 4,237 1,201 2,908 8,3461975 Total .................... 147 2,558 1,346 4,051 NA NA NA NA 8 8 4,059 1,598 3,835 9,4921980 Total .................... 115 2,651 1,318 4,084 NA NA NA NA 21 21 4,105 1,906 4,567 10,5781985 Total .................... 137 2,488 1,083 3,708 NA NA NA NA 24 24 3,732 2,351 5,368 11,4511990 Total .................... 124 2,680 991 3,795 1 3 (s) – 94 98 3,893 2,860 6,564 13,3171995 Total .................... 117 3,096 769 3,982 1 5 (s) – 113 119 4,100 3,252 7,337 14,6902000 Total .................... 92 3,252 806 4,150 1 8 1 – 119 128 4,278 3,956 8,942 17,1752001 Total .................... 97 3,097 789 3,983 1 8 1 – 92 101 4,084 4,062 8,990 17,1372002 Total .................... 90 3,212 725 4,027 (s) 9 1 – 95 105 4,132 4,110 9,104 17,3462003 Total .................... 82 3,261 841 4,184 1 11 1 – 101 114 4,298 4,090 8,958 17,3462004 Total .................... 103 3,201 809 4,113 1 12 1 – 105 120 4,232 4,198 9,225 17,6552005 Total .................... 97 3,073 761 3,931 1 14 2 – 105 121 4,052 4,351 9,451 17,8532006 Total .................... 65 2,902 661 3,627 1 14 2 – 103 120 3,747 4,435 9,525 17,7072007 Total .................... 70 3,085 646 3,801 1 14 4 – 103 121 3,922 4,560 9,771 18,2532008 Total .................... 81 3,228 660 3,969 1 15 6 – 109 130 4,100 4,559 9,743 18,4022009 Total .................... 73 3,187 659 3,919 1 17 7 (s) 112 137 4,055 4,459 9,373 17,8872010 Total .................... 70 3,165 646 3,881 1 19 11 (s) 111 142 4,023 4,539 9,497 18,0582011 Total .................... 62 3,216 632 3,910 (s) 20 19 (s) 115 154 4,064 4,531 9,385 17,9802012 Total .................... 44 2,960 560 3,563 (s) 20 32 1 108 161 3,723 4,528 9,168 17,4202013 Total .................... 41 3,380 558 3,979 (s) 20 41 1 120 182 4,161 4,562 9,206 17,9292014 Total .................... 40 3,572 577 4,190 (s) 20 52 1 127 200 4,390 4,614 9,261 18,2642015 Total .................... 31 3,316 864 4,211 (s) 20 57 1 152 230 4,441 4,643 9,073 18,157
2016 January ................ 3 522 84 609 (s) 2 3 (s) 13 19 627 377 747 1,751 February .............. 3 429 82 513 (s) 2 4 (s) 12 18 532 353 654 1,539 March ................... 3 309 72 384 (s) 2 5 (s) 13 20 405 361 673 1,438 April ..................... 1 242 65 308 (s) 2 6 (s) 13 20 329 348 669 1,346 May ...................... 1 177 65 244 (s) 2 6 (s) 13 21 265 370 741 1,376 June ..................... 2 143 56 201 (s) 2 6 (s) 13 21 222 411 831 1,464 July ...................... 1 140 59 200 (s) 2 6 (s) 14 22 222 444 896 1,561 August ................. 1 146 55 202 (s) 2 6 (s) 14 22 224 461 884 1,569 September ........... 1 147 61 209 (s) 2 6 (s) 13 20 230 421 770 1,421 October ................ 2 198 70 270 (s) 2 5 (s) 13 20 290 385 722 1,397 November ............ 2 291 71 364 (s) 2 4 (s) 13 19 382 358 686 1,427 December ............ 3 480 92 575 (s) 2 4 (s) 13 19 594 376 768 1,738 Total .................... 24 3,224 832 4,079 2 20 62 1 158 242 4,321 4,665 9,044 18,030
2017 January ................ 3 496 87 R 585 (s) 2 4 (s) 14 20 R 605 374 728 R 1,706 February .............. 2 372 R 70 R 444 (s) 2 4 (s) 12 18 R 463 340 630 R 1,432 March ................... 2 384 R 73 R 460 (s) 2 6 (s) 13 21 R 482 366 712 R 1,560 April ..................... 1 219 R 65 R 285 (s) 2 7 (s) 13 22 R 307 350 665 R 1,322 May ...................... 1 184 R 59 R 245 (s) 2 8 (s) 13 23 R 268 375 743 R 1,386 June ..................... 1 143 R 63 R 207 (s) 2 8 (s) 13 23 R 229 409 797 R 1,436 July ...................... 1 138 R 56 R 196 (s) 2 8 (s) 13 23 R 219 441 868 R 1,528 August ................. 1 142 R 59 R 202 (s) 2 8 (s) 13 23 R 225 438 821 R 1,484 September ........... 1 150 R 57 R 207 (s) 2 7 (s) R 12 21 R 229 405 742 R 1,376 October ................ 1 207 R 64 R 272 (s) 2 6 (s) 13 21 R 294 387 733 R 1,413 November ............ 2 333 R 75 R 410 (s) 2 5 (s) 13 20 R 430 358 707 R 1,495 December ............ 2 504 R 91 R 597 (s) 2 5 (s) R 13 20 R 617 373 767 R 1,757 Total .................... 21 3,272 R 818 R 4,111 2 20 76 1 R 156 R 255 R 4,366 4,616 8,916 R 17,898
2018 January ................ 3 567 R 101 R 670 (s) 2 5 (s) 13 21 R 691 391 775 R 1,857 February .............. 2 434 R 75 R 511 (s) 2 6 (s) 12 20 R 531 348 659 R 1,538 March ................... 2 428 R 74 R 504 NM 2 8 (s) 13 23 R 527 368 720 R 1,615 April ..................... 1 309 R 69 R 379 (s) 2 9 (s) 12 23 R 402 351 682 R 1,435 May ...................... 1 167 R 59 R 227 NM 2 10 (s) 13 25 R 252 384 798 R 1,434 June ..................... 1 R 145 R 55 R 201 NM 2 10 (s) 13 25 R 225 415 832 R 1,472 July ...................... 1 140 R 56 R 197 NM 2 10 (s) 13 25 R 222 447 R 887 R 1,555 August ................. 1 146 R 54 R 201 NM 2 10 (s) 13 25 R 226 R 459 R 869 R 1,554 September ........... 1 150 R 55 R 206 (s) 2 9 (s) 12 23 R 228 415 777 R 1,420 October ................ 2 R 244 R 74 R 319 NM 2 8 (s) 13 23 R 341 395 R 731 R 1,467 November ............ 2 R 396 R 83 480 NM 2 6 (s) 13 21 501 357 725 1,583 December ............ 2 480 99 581 (s) 2 6 (s) 13 21 602 367 730 1,699 Total .................... 19 3,605 852 4,476 2 20 96 2 153 273 4,749 4,697 9,184 18,631
a See "Primary Energy Consumption" in Glossary.b See Table 10.2a for notes on series components and estimation.c Natural gas only; excludes the estimated portion of supplemental gaseous
fuels. See Note 3, "Supplemental Gaseous Fuels," at end of Section 4.d Does not include biofuels that have been blended with petroleum—biofuels
are included in "Biomass."e Conventional hydroelectric power.f Solar photovoltaic (PV) electricity net generation in the commercial sector,
both utility-scale and distributed (small-scale). See Tables 10.2a and 10.5.g Electricity retail sales to ultimate customers reported by electric utilities and,
beginning in 1996, other energy service providers.h Total losses are calculated as the primary energy consumed by the electric
power sector minus the energy content of electricity retail sales. Total losses areallocated to the end-use sectors in proportion to each sector’s share of totalelectricity retail sales. See Note 1, "Electrical System Energy Losses," at end of
section.R=Revised. NA=Not available. NM=Not meaningful. – =No data reported. (s)=Less than 0.5 trillion Btu. Notes: • Data are estimates, except for coal totals beginning in 2008;
hydroelectric power; solar; wind; and electricity retail sales beginning in 1979.• The commercial sector includes commercial combined-heat-and-power (CHP)and commercial electricity-only plants. See Note 2, "Classification of Power PlantsInto Energy-Use Sectors," at end of Section 7. • See Note 2, "EnergyConsumption Data and Surveys," at end of section. • Totals may not equal sum ofcomponents due to independent rounding. • Geographic coverage is the 50 statesand the District of Columbia.
Web Page: See http://www.eia.gov/totalenergy/data/monthly/#consumption(Excel and CSV files) for all available annual data beginning in 1949 and monthlydata beginning in 1973.
Sources: See end of section.

40 U. S. Energy Information Administration / Monthly Energy Review March 2019
Figure 2.4 Industrial Sector Energy Consumption (Quadrillion Btu)
Coal Electricity[a]
Natural Gas
Petroleum
Renewable Energy
0
3
6
9
12
1950 1955 1960 1965 1970 1975 1980 1985 1990 1995 2000 2005 2010 2015
By Major Source, 1949–2018
Coal
Electricity[a]
Natural Gas
Petroleum
Renewable Energy
0.0
0.2
0.4
0.6
0.8
1.0
J F M A M J J A S O N D J F M A M J J A S O N D J F M A M J J A S O N D
2016 2017 2018
By Major Source, Monthly
31.450 31.994 32.613
0
5
10
15
20
25
30
35
2016 2017 2018
Total, January–December
0.106
0.221
0.260
0.721
0.943
0.0 0.3 0.6 0.9 1.2
Coal
Renewable Energy
Electricity[a]
Petroleum
Natural Gas
By Major Source, December 2018
[a] Electricity retail sales.
Web Page: http://www.eia.gov/totalenergy/data/monthly/#consumption.
Source: Table 2.4.

U. S. Energy Information Administration / Monthly Energy Review March 2019 41
Table 2.4 Industrial Sector Energy Consumption (Trillion Btu)
Primary Consumptiona
Elec-tricityRetailSalesi
ElectricalSystemEnergyLossesj Totalf
Fossil Fuelsb Renewable Energyc
TotalPrimaryCoal
NaturalGasd
Petro-leume Totalf
Hydro-electricPowerg
Geo-thermal Solarh Wind
Bio-mass Total
1950 Total .................... 5,781 3,546 3,960 13,288 69 NA NA NA 532 602 13,890 500 1,852 16,2411955 Total .................... 5,620 4,701 5,123 15,434 38 NA NA NA 631 669 16,103 887 2,495 19,4851960 Total .................... 4,543 5,973 5,766 16,277 39 NA NA NA 680 719 16,996 1,107 2,739 20,8421965 Total .................... 5,127 7,339 6,813 19,260 33 NA NA NA 855 888 20,148 1,463 3,487 25,0981970 Total .................... 4,656 9,536 7,776 21,911 34 NA NA NA 1,019 1,053 22,964 1,948 4,716 29,6281975 Total .................... 3,667 8,532 8,127 20,339 32 NA NA NA 1,063 1,096 21,434 2,346 5,632 29,4131980 Total .................... 3,155 8,333 9,509 20,962 33 NA NA NA 1,600 1,633 22,595 2,781 6,664 32,0391985 Total .................... 2,760 7,032 7,714 17,492 33 NA NA NA 1,918 1,951 19,443 2,855 6,518 28,8161990 Total .................... 2,756 8,443 8,251 19,455 31 2 (s) – 1,684 1,717 21,172 3,226 7,404 31,8021995 Total .................... 2,488 9,592 8,585 20,726 55 3 (s) – 1,934 1,992 22,718 3,455 7,796 33,9692000 Total .................... 2,256 9,500 9,073 20,895 42 4 (s) – 1,881 1,928 22,823 3,631 8,208 34,6622001 Total .................... 2,192 8,676 9,176 20,073 33 5 (s) – 1,681 1,719 21,792 3,400 7,526 32,7182002 Total .................... 2,019 8,832 9,166 20,078 39 5 (s) – 1,676 1,720 21,797 3,379 7,484 32,6602003 Total .................... 2,041 8,488 9,228 19,809 43 3 (s) – 1,678 1,725 21,533 3,454 7,565 32,5532004 Total .................... 2,047 8,550 9,825 20,560 33 4 (s) – 1,815 1,852 22,411 3,473 7,631 33,5152005 Total .................... 1,954 7,907 9,634 19,539 32 4 (s) – 1,834 1,871 21,410 3,477 7,554 32,4412006 Total .................... 1,914 7,861 9,767 19,603 29 4 1 – 1,892 1,926 21,529 3,451 7,411 32,3902007 Total .................... 1,865 8,074 9,441 19,404 16 5 1 – 1,937 1,958 21,362 3,507 7,515 32,3842008 Total .................... 1,793 8,083 8,575 18,492 17 5 1 – 2,012 2,035 20,527 3,444 7,362 31,3332009 Total .................... 1,392 7,609 7,805 16,783 18 4 2 – 1,948 1,972 18,755 3,130 6,580 28,4652010 Total .................... 1,631 8,278 8,174 18,078 16 4 3 – 2,320 2,343 20,421 3,314 6,934 30,6692011 Total .................... 1,561 8,481 8,138 18,190 17 4 4 (s) 2,375 2,401 20,591 3,382 7,005 30,9792012 Total .................... 1,513 8,819 8,166 18,501 22 4 7 (s) 2,349 2,382 20,884 3,363 6,810 31,0572013 Total .................... 1,546 9,140 8,360 19,029 33 4 9 (s) 2,403 2,449 21,478 3,362 6,785 31,6252014 Total .................... 1,530 9,441 8,126 19,076 12 4 11 1 2,456 2,484 21,560 3,404 6,832 31,7962015 Total .................... 1,380 9,426 8,246 19,034 13 4 14 (s) 2,460 2,491 21,525 3,366 6,578 31,469
2016 January ................ 102 886 729 1,716 1 (s) 1 (s) 209 212 1,928 269 534 2,731 February .............. 103 818 717 1,638 1 (s) 1 (s) 197 200 1,837 262 485 2,584 March ................... 105 825 707 1,637 1 (s) 2 (s) 206 210 1,847 270 504 2,621 April ..................... 97 776 651 1,524 1 (s) 2 (s) 193 196 1,720 268 516 2,504 May ...................... 99 771 651 1,520 1 (s) 2 (s) 204 207 1,727 278 557 2,562 June ..................... 100 743 663 1,505 1 (s) 2 (s) 202 205 1,710 285 578 2,573 July ...................... 101 775 665 1,539 1 (s) 2 (s) 208 211 1,751 297 600 2,648 August ................. 99 786 747 1,629 1 (s) 2 (s) 209 213 1,841 304 583 2,729 September ........... 98 756 686 1,538 1 (s) 2 (s) 197 200 1,737 284 519 2,540 October ................ 99 779 726 1,602 1 (s) 2 (s) 204 207 1,808 278 522 2,608 November ............ 99 808 695 1,598 1 (s) 1 (s) 206 208 1,806 268 512 2,586 December ............ 103 895 713 1,708 1 (s) 1 (s) 231 234 1,942 268 548 2,758 Total .................... 1,205 9,617 8,350 19,154 12 4 19 1 2,467 2,503 21,657 3,333 6,461 31,450
2017 January ................ 100 891 728 1,717 1 (s) 1 (s) 220 222 1,939 269 524 2,732 February .............. 99 792 623 1,513 1 (s) 1 (s) 196 199 R 1,712 254 471 2,437 March ................... 100 856 R 736 1,690 1 (s) 2 (s) 216 220 1,910 275 535 2,720 April ..................... 97 784 689 1,569 1 (s) 2 (s) 203 207 1,776 269 512 2,557 May ...................... 99 785 724 1,606 1 (s) 2 (s) 211 215 1,821 284 562 R 2,668 June ..................... 97 767 711 1,572 1 (s) 2 (s) 208 212 1,784 291 567 2,643 July ...................... 100 783 732 R 1,615 1 (s) 2 (s) 216 219 1,834 300 590 2,723 August ................. 101 797 713 1,607 1 (s) 2 (s) 220 223 R 1,831 304 569 2,704 September ........... 99 772 690 R 1,559 1 (s) 2 (s) R 204 207 1,765 285 522 2,572 October ................ 100 821 R 721 1,637 1 (s) 2 (s) 214 217 R 1,855 283 536 2,673 November ............ 100 861 R 750 1,707 1 (s) 1 (s) 216 219 1,926 271 535 2,732 December ............ 103 934 736 1,769 1 (s) 1 (s) 223 226 1,995 274 563 R 2,832 Total .................... 1,195 9,844 R 8,552 R 19,562 13 4 22 1 2,547 2,587 R 22,149 3,358 6,487 R 31,994
2018 January ................ 98 941 R 799 R 1,834 1 (s) 1 (s) 218 221 R 2,055 260 514 R 2,829 February .............. 94 845 R 663 R 1,600 1 (s) 1 (s) 200 203 R 1,803 245 465 R 2,514 March ................... 99 900 R 767 R 1,763 1 (s) 2 (s) 214 218 R 1,981 262 512 R 2,756 April ..................... 98 R 854 R 670 R 1,619 1 (s) 2 (s) 208 211 R 1,830 257 R 498 R 2,585 May ...................... 99 833 R 734 R 1,665 1 (s) 3 (s) 213 217 R 1,882 278 577 R 2,737 June ..................... 95 805 R 719 R 1,619 1 (s) 3 (s) 210 214 R 1,833 278 558 R 2,668 July ...................... 98 830 R 739 R 1,665 1 (s) 3 (s) 219 223 R 1,888 290 576 R 2,754 August ................. 97 836 R 815 R 1,747 1 (s) 3 (s) 221 225 R 1,972 R 306 R 579 R 2,857 September ........... 97 821 R 709 R 1,626 1 (s) 2 (s) R 204 207 R 1,833 277 519 R 2,629 October ................ 111 854 R 814 R 1,777 1 (s) 2 (s) 214 218 R 1,995 276 R 511 R 2,782 November ............ 110 909 R 713 R 1,728 1 (s) 2 (s) 211 214 R 1,942 262 533 R 2,738 December ............ 106 943 721 1,767 1 (s) 2 (s) 218 221 1,989 260 517 2,765 Total .................... 1,202 10,370 8,863 20,410 13 4 25 1 2,549 2,593 23,003 3,252 6,358 32,613
a See "Primary Energy Consumption" in Glossary. b Includes non-combustion use of fossil fuels. c See Table 10.2b for notes on series components and estimation.d Natural gas only; excludes the estimated portion of supplemental gaseous
fuels. See Note 3, "Supplemental Gaseous Fuels," at end of Section 4.e Does not include biofuels that have been blended with petroleum—biofuels
are included in "Biomass."f Includes coal coke net imports, which are not separately displayed. See
Tables 1.4a and 1.4b.g Conventional hydroelectric power.h Solar photovoltaic (PV) electricity net generation in the industrial sector, both
utility-scale and distributed (small-scale). See Tables 10.2b and 10.5.i Electricity retail sales to ultimate customers reported by electric utilities and,
beginning in 1996, other energy service providers.j Total losses are calculated as the primary energy consumed by the electric
power sector minus the energy content of electricity retail sales. Total losses areallocated to the end-use sectors in proportion to each sector’s share of total
electricity retail sales. See Note 1, "Electrical System Energy Losses," at end ofsection.
R=Revised. NA=Not available. – =No data reported. (s)=Less than 0.5 trillionBtu.
Notes: • Data are estimates, except for coal totals; hydroelectric power in1949–1978 and 1989 forward; solar; wind; and electricity retail sales. • Theindustrial sector includes industrial combined-heat-and-power (CHP) and industrialelectricity-only plants. See Note 2, "Classification of Power Plants Into Energy-UseSectors," at end of Section 7. • See Note 2, "Energy Consumption Data andSurveys," at end of section. • Totals may not equal sum of components due toindependent rounding. • Geographic coverage is the 50 states and the District ofColumbia.
Web Page: See http://www.eia.gov/totalenergy/data/monthly/#consumption(Excel and CSV files) for all available annual data beginning in 1949 and monthlydata beginning in 1973.
Sources: See end of section.

42 U. S. Energy Information Administration / Monthly Energy Review March 2019
Figure 2.5 Transportation Sector Energy Consumption (Quadrillion Btu)
Natural Gas
Petroleum
Renewable Energy
0
5
10
15
20
25
30
1950 1955 1960 1965 1970 1975 1980 1985 1990 1995 2000 2005 2010 2015
By Major Source, 1949–2018
Natural Gas
Petroleum
Renewable Energy
0.0
0.5
1.0
1.5
2.0
2.5
J F M A M J J A S O N D J F M A M J J A S O N D J F M A M J J A S O N D
2016 2017 2018
By Major Source, Monthly
27.788 28.017 28.393
0
5
10
15
20
25
30
2016 2017 2018
Total, January–December
0.0
0.5
1.0
1.5
2.0
2.5
3.0
J F M A M J J A S O N D
Total, Monthly
2016 2017 2018
Web Page: http://www.eia.gov/totalenergy/data/monthly/#consumption.
Source: Table 2.5.

U. S. Energy Information Administration / Monthly Energy Review March 2019 43
Table 2.5 Transportation Sector Energy Consumption (Trillion Btu)
Primary Consumptiona
ElectricityRetailSalese
ElectricalSystemEnergyLossesf Total
Fossil FuelsRenewable
Energyb
TotalPrimaryCoal Natural Gasc Petroleumd Total Biomass
1950 Total .................... 1,564 130 6,690 8,383 NA 8,383 23 86 8,4921955 Total .................... 421 254 8,799 9,474 NA 9,474 20 56 9,5501960 Total .................... 75 359 10,125 10,560 NA 10,560 10 26 10,5961965 Total .................... 16 517 11,866 12,399 NA 12,399 10 24 12,4321970 Total .................... 7 745 15,310 16,062 NA 16,062 11 26 16,0981975 Total .................... 1 595 17,615 18,210 NA 18,210 10 24 18,2451980 Total .................... g( ) 650 19,009 19,659 NA 19,659 11 27 19,6971985 Total .................... g( ) 519 19,472 19,992 50 20,041 14 32 20,0881990 Total .................... g( ) 679 21,626 22,305 60 22,366 16 37 22,4191995 Total .................... g( ) 724 22,920 23,644 112 23,757 17 38 23,8122000 Total .................... g( ) 672 25,649 26,321 135 26,456 18 42 26,5162001 Total .................... g( ) 658 25,379 26,037 142 26,179 20 43 26,2422002 Total .................... g( ) 699 25,879 26,578 170 26,747 19 42 26,8082003 Total .................... g( ) 627 25,950 26,577 230 26,807 23 51 26,8812004 Total .................... g( ) 602 26,856 27,458 290 27,748 25 54 27,8272005 Total .................... g( ) 624 27,217 27,840 339 28,180 26 56 28,2612006 Total .................... g( ) 625 27,518 28,143 475 28,618 25 54 28,6972007 Total .................... g( ) 663 27,462 28,126 602 28,728 28 60 28,8152008 Total .................... g( ) 692 25,823 26,515 825 27,340 26 56 27,4222009 Total .................... g( ) 715 24,857 25,572 935 26,507 27 56 26,5892010 Total .................... g( ) 719 25,105 25,824 1,075 26,899 26 55 26,9802011 Total .................... g( ) 734 24,629 25,362 1,159 26,521 26 54 26,6012012 Total .................... g( ) 780 24,114 24,894 1,160 26,054 25 51 26,1292013 Total .................... g( ) 887 24,364 25,252 1,284 26,536 26 53 26,6142014 Total .................... g( ) 760 24,729 25,489 1,302 26,791 26 53 26,8712015 Total .................... g( ) 745 25,085 25,830 1,334 27,164 26 51 27,241
2016 January ................ g( ) 85 1,993 2,078 104 2,182 2 4 2,189 February .............. g( ) 73 1,941 2,014 107 2,121 2 4 2,127 March ................... g( ) 65 2,164 2,229 116 2,345 2 4 2,351 April ..................... g( ) 57 2,093 2,150 110 2,260 2 4 2,266 May ...................... g( ) 54 2,174 2,229 123 2,351 2 4 2,357 June ..................... g( ) 55 2,182 2,237 122 2,359 2 4 2,366 July ...................... g( ) 60 2,241 2,301 129 2,430 2 4 2,437 August ................. g( ) 61 2,263 2,324 132 2,456 2 4 2,462 September ........... g( ) 54 2,120 2,174 123 2,298 2 4 2,304 October ................ g( ) 53 2,144 2,197 124 2,321 2 4 2,327 November ............ g( ) 60 2,068 2,128 124 2,251 2 4 2,257 December ............ g( ) 79 2,130 2,209 129 2,338 2 5 2,345 Total .................... g( ) 757 25,513 26,270 1,443 27,713 26 50 27,788
2017 January ................ g( ) 86 2,027 R 2,113 107 R 2,220 2 4 R 2,226 February .............. g( ) 69 R 1,871 R 1,940 101 R 2,041 2 4 R 2,047 March ................... g( ) 75 R 2,181 R 2,256 118 R 2,373 2 4 R 2,380 April ..................... g( ) 57 2,085 R 2,142 117 R 2,260 2 4 2,265 May ...................... g( ) 56 R 2,232 R 2,288 129 R 2,417 2 4 R 2,423 June ..................... g( ) 56 R 2,210 R 2,266 129 R 2,395 2 4 R 2,401 July ...................... g( ) 63 2,237 R 2,300 125 R 2,425 2 4 2,431 August ................. g( ) 62 R 2,292 R 2,354 131 2,484 2 4 R 2,491 September ........... g( ) 57 R 2,119 R 2,176 120 R 2,296 2 4 R 2,302 October ................ g( ) 60 R 2,215 R 2,275 123 2,397 2 4 R 2,404 November ............ g( ) 69 R 2,092 R 2,161 120 R 2,281 2 4 R 2,287 December ............ g( ) 90 R 2,144 2,233 120 R 2,354 2 5 R 2,361 Total .................... g( ) 799 R 25,705 R 26,504 R 1,439 R 27,942 26 50 R 28,017
2018 January ................ g( ) 95 R 2,036 R 2,131 117 R 2,248 3 5 R 2,255 February .............. g( ) 78 R 1,871 R 1,949 98 R 2,047 2 4 R 2,053 March ................... g( ) 80 R 2,206 R 2,287 R 119 R 2,405 2 4 R 2,412 April ..................... g( ) 68 R 2,133 R 2,201 110 R 2,312 2 4 R 2,318 May ...................... g( ) 60 R 2,270 R 2,331 126 R 2,456 2 4 R 2,463 June ..................... g( ) 60 R 2,242 R 2,302 121 R 2,423 2 4 R 2,429 July ...................... g( ) R 69 R 2,302 R 2,370 124 R 2,494 2 4 R 2,501 August ................. g( ) 68 R 2,341 R 2,409 128 R 2,537 2 4 R 2,544 September ........... g( ) 63 R 2,129 R 2,192 113 R 2,305 2 4 R 2,312 October ................ g( ) 67 R 2,217 R 2,283 122 R 2,405 2 4 R 2,411 November ............ g( ) 78 R 2,124 R 2,202 R 116 R 2,318 2 4 R 2,324 December ............ g( ) 86 2,159 2,245 119 2,364 2 4 2,371 Total .................... g( ) 872 26,031 26,902 1,413 28,315 26 52 28,393
a See "Primary Energy Consumption" in Glossary. b See Table 10.2b for notes on series components.c Natural gas only; does not include supplemental gaseous fuels—see Note 3,
"Supplemental Gaseous Fuels," at end of Section 4. Data are for natural gasconsumed in the operation of pipelines (primarily in compressors) and smallamounts consumed as vehicle fuel—see Table 4.3.
d Does not include biofuels that have been blended with petroleum—biofuelsare included in "Biomass." Includes non-combustion use of lubricants.
e Electricity retail sales to ultimate customers reported by electric utilities and,beginning in 1996, other energy service providers.
f Total losses are calculated as the primary energy consumed by the electricpower sector minus the energy content of electricity retail sales. Total losses areallocated to the end-use sectors in proportion to each sector’s share of totalelectricity retail sales. See Note 1, "Electrical System Energy Losses," at end of
section.g Beginning in 1978, the small amounts of coal consumed for transportation are
reported as industrial sector consumption.R=Revised. NA=Not available. Notes: • Data are estimates, except for coal totals through 1977; and electricity
retail sales beginning in 1979. • See Note 2, "Energy Consumption Data andSurveys," at end of section. • Totals may not equal sum of components due toindependent rounding. • Geographic coverage is the 50 states and the District ofColumbia.
Web Page: See http://www.eia.gov/totalenergy/data/monthly/#consumption(Excel and CSV files) for all available annual data beginning in 1949 and monthlydata beginning in 1973.
Sources: See end of section.
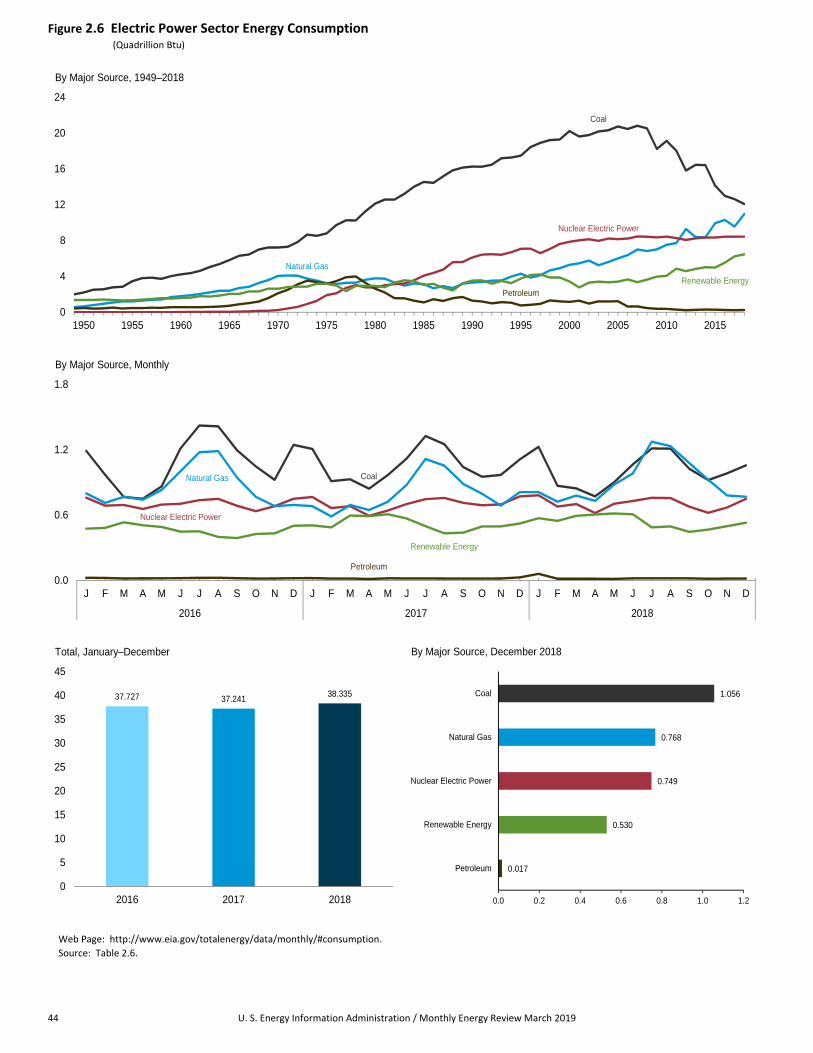
44 U. S. Energy Information Administration / Monthly Energy Review March 2019
Figure 2.6 Electric Power Sector Energy Consumption (Quadrillion Btu)
Coal
Natural Gas
Nuclear Electric Power
Petroleum Renewable Energy
0
4
8
12
16
20
24
1950 1955 1960 1965 1970 1975 1980 1985 1990 1995 2000 2005 2010 2015
By Major Source, 1949–2018
Coal
Nuclear Electric Power
Natural Gas
Petroleum
Renewable Energy
0.0
0.6
1.2
1.8
J F M A M J J A S O N D J F M A M J J A S O N D J F M A M J J A S O N D
2016 2017 2018
By Major Source, Monthly
37.727 37.24138.335
0
5
10
15
20
25
30
35
40
45
2016 2017 2018
Total, January–December
0.017
0.530
0.749
0.768
1.056
0.0 0.2 0.4 0.6 0.8 1.0 1.2
Petroleum
Renewable Energy
Nuclear Electric Power
Natural Gas
Coal
By Major Source, December 2018
Web Page: http://www.eia.gov/totalenergy/data/monthly/#consumption.
Source: Table 2.6.

U. S. Energy Information Administration / Monthly Energy Review March 2019 45
Table 2.6 Electric Power Sector Energy Consumption (Trillion Btu)
Primary Consumptiona
Fossil Fuels
NuclearElectricPower
Renewable Energyb
Elec-tricityNet
ImportsfTotal
PrimaryCoalNatural
GascPetro-leum Total
Hydro-electricPowerd
Geo-thermal Solare Wind
Bio-mass Total
1950 Total ...................... 2,199 651 472 3,322 0 1,346 NA NA NA 5 1,351 6 4,6791955 Total ...................... 3,458 1,194 471 5,123 0 1,322 NA NA NA 3 1,325 14 6,4611960 Total ...................... 4,228 1,785 553 6,565 6 1,569 (s) NA NA 2 1,571 15 8,1581965 Total ...................... 5,821 2,395 722 8,938 43 2,026 2 NA NA 3 2,031 (s) 11,0121970 Total ...................... 7,227 4,054 2,117 13,399 239 2,600 6 NA NA 4 2,609 7 16,2531975 Total ...................... 8,786 3,240 3,166 15,191 1,900 3,122 34 NA NA 2 3,158 21 20,2701980 Total ...................... 12,123 3,778 2,634 18,534 2,739 2,867 53 NA NA 4 2,925 71 24,2691985 Total ...................... 14,542 3,135 1,090 18,767 4,076 2,937 97 (s) (s) 14 3,049 140 26,0321990 Total ...................... 16,261 3,309 1,289 20,859 6,104 3,014 161 4 29 317 3,524 8 g30,4951995 Total ...................... 17,466 4,302 755 22,523 7,075 3,149 138 5 33 422 3,747 134 33,4792000 Total ...................... 20,220 5,293 1,144 26,658 7,862 2,768 144 5 57 453 3,427 115 38,0622001 Total ...................... 19,614 5,458 1,276 26,348 8,029 2,209 142 6 70 337 2,763 75 37,2152002 Total ...................... 19,783 5,767 961 26,511 8,145 2,650 147 6 105 380 3,288 72 38,0162003 Total ...................... 20,185 5,246 1,205 26,636 7,960 2,749 146 5 113 397 3,411 22 38,0282004 Total ...................... 20,305 5,595 1,201 27,101 8,223 2,655 148 6 142 388 3,339 39 38,7012005 Total ...................... 20,737 6,015 1,222 27,974 8,161 2,670 147 6 178 406 3,406 85 39,6262006 Total ...................... 20,462 6,375 637 27,474 8,215 2,839 145 5 264 412 3,665 63 39,4172007 Total ...................... 20,808 7,005 648 28,461 8,459 2,430 145 6 341 423 3,345 107 40,3712008 Total ...................... 20,513 6,829 459 27,801 8,426 2,494 146 9 546 435 3,630 112 39,9692009 Total ...................... 18,225 7,022 382 25,630 8,355 2,650 146 9 721 441 3,967 116 38,0692010 Total ...................... 19,133 7,528 370 27,031 8,434 2,521 148 12 923 459 4,064 89 39,6192011 Total ...................... 18,035 7,712 295 26,042 8,269 3,085 149 17 1,167 437 4,855 127 39,2932012 Total ...................... 15,821 9,287 214 25,322 8,062 2,606 148 40 1,339 453 4,586 161 38,1312013 Total ...................... 16,451 8,376 255 25,082 8,244 2,529 151 83 1,600 470 4,833 197 38,3572014 Total ...................... 16,427 8,362 295 25,085 8,338 2,454 151 165 1,726 530 5,026 182 38,6292015 Total ...................... 14,138 9,926 276 24,341 8,337 2,308 148 228 1,776 525 4,985 227 37,890
2016 January .................. 1,190 799 23 2,012 759 235 12 13 170 44 475 21 3,267 February ................ 970 712 22 1,704 687 222 11 20 186 43 482 17 2,889 March ..................... 765 768 18 1,552 692 251 12 24 202 43 533 18 2,794 April ....................... 750 741 19 1,510 656 238 11 26 192 39 506 15 2,687 May ........................ 863 830 19 1,712 696 234 12 31 174 40 491 18 2,918 June ....................... 1,211 1,001 20 2,232 703 213 12 32 150 41 448 21 3,404 July ........................ 1,422 1,176 24 2,622 736 197 12 36 163 44 451 24 3,833 August ................... 1,415 1,188 24 2,627 748 180 12 36 125 45 399 23 3,797 September ............. 1,195 944 20 2,158 685 150 12 33 151 41 388 16 3,247 October .................. 1,046 767 16 1,830 635 159 12 29 188 37 426 18 2,909 November .............. 923 683 18 1,623 682 173 13 25 179 42 432 20 2,757 December .............. 1,245 692 20 1,958 750 207 13 22 213 46 501 17 3,225 Total ...................... 12,996 10,301 244 23,542 8,427 2,459 146 328 2,094 505 5,531 227 37,727
2017 January .................. 1,207 681 21 1,909 765 245 13 19 183 46 505 22 3,201 February ................ 912 587 16 1,515 665 217 11 23 195 41 487 17 2,684 March ..................... 929 693 17 1,639 681 268 13 39 230 45 595 17 2,932 April ....................... 842 646 13 1,501 593 269 12 43 227 39 590 15 2,700 May ........................ 967 722 19 1,708 641 297 12 52 207 40 607 15 2,971 June ....................... 1,118 877 19 2,015 701 277 11 56 182 42 569 18 3,303 July ........................ 1,326 1,115 18 2,460 746 243 12 52 147 44 498 18 3,722 August ................... 1,251 1,054 18 2,322 757 200 12 50 125 45 432 20 3,531 September ............. 1,040 886 17 1,942 712 175 12 47 164 40 438 15 3,108 October .................. 951 796 16 1,763 690 167 11 44 233 40 496 11 2,960 November .............. 968 687 17 1,672 697 188 12 31 222 42 495 11 2,874 December .............. 1,111 810 27 1,948 771 205 14 31 226 45 522 14 3,255 Total ...................... 12,622 9,555 218 22,395 8,419 2,752 147 486 2,341 510 6,235 192 37,241
2018 January .................. 1,226 810 60 R 2,097 781 235 13 31 247 45 571 14 3,462 February ................ 869 723 15 1,607 678 234 12 38 222 R 41 547 12 2,844 March ..................... R 844 R 779 15 R 1,637 701 238 13 R 47 251 44 593 15 R 2,946 April ....................... 771 730 15 1,516 618 252 R 11 57 R 246 38 605 10 R 2,749 May ........................ 901 880 14 R 1,796 704 279 13 R 64 217 42 615 14 3,129 June ....................... 1,065 982 19 2,065 729 256 13 71 224 43 607 15 3,416 July ........................ 1,212 R 1,274 19 R 2,505 758 220 13 63 147 43 487 15 R 3,765 August ................... 1,210 R 1,232 19 R 2,462 756 196 13 64 180 42 495 17 R 3,729 September ............. 1,025 1,077 19 2,120 677 171 13 59 R 165 R 37 R 445 11 R 3,253 October .................. 921 R 923 15 R 1,859 621 172 12 48 195 40 R 466 10 R 2,956 November .............. R 983 R 780 16 R 1,779 669 203 13 36 207 39 498 R 9 R 2,954 December .............. 1,056 768 17 1,840 749 217 14 29 228 41 530 11 3,130 Total ...................... 12,081 10,960 243 23,284 8,441 2,673 154 607 2,530 495 6,459 152 38,335
a See "Primary Energy Consumption" in Glossary.b See Table 10.2c for notes on series components.c Natural gas only; excludes the estimated portion of supplemental gaseous
fuels. See Note 3, "Supplemental Gaseous Fuels," at end of Section 4.d Conventional hydroelectric power.e Solar photovoltaic (PV) and solar thermal electricity net generation in the
electric power sector. See Tables 10.2c and 10.5.f Net imports equal imports minus exports.
g Through 1988, data are for electric utilities only. Beginning in 1989, data arefor electric utilities and independent power producers.
R=Revised. NA=Not available. (s)=Less than 0.5 trillion Btu.
Notes: • Data are for fuels consumed to produce electricity and useful thermaloutput. • The electric power sector comprises electricity-only andcombined-heat-and-power (CHP) plants within the NAICS 22 category whoseprimary business is to sell electricity, or electricity and heat, to the public. • SeeNote 2, "Energy Consumption Data and Surveys," at end of section. • Totals maynot equal sum of components due to independent rounding. • Geographiccoverage is the 50 states and the District of Columbia.
Web Page: See http://www.eia.gov/totalenergy/data/monthly/#consumption(Excel and CSV files) for all available annual data beginning in 1949 and monthlydata beginning in 1973.
Sources: See end of section.

46 U. S. Energy Information Administration / Monthly Energy Review March 2019
Table 2.7 U.S. Government Energy Consumption by Agency, Fiscal Years (Trillion Btu)
FiscalYeara
Agri-culture Defense DHSb Energy GSAc HHSd Interior Justice NASAe
PostalService
Trans-portation
VeteransAffairs Otherf Total
1975 .......... 9.5 1,360.2 – – 50.4 22.3 6.5 9.4 5.9 13.4 30.5 19.3 27.1 10.5 1,565.01976 .......... 9.3 1,183.3 – – 50.3 20.6 6.7 9.4 5.7 12.4 30.0 19.5 25.0 11.2 1,383.41977 .......... 8.9 1,192.3 – – 51.6 20.4 6.9 9.5 5.9 12.0 32.7 20.4 25.9 11.9 1,398.51978 .......... 9.1 1,157.8 – – 50.1 20.4 6.5 9.2 5.9 11.2 30.9 20.6 26.8 12.4 1,360.91979 .......... 9.2 1,175.8 – – 49.6 19.6 6.4 10.4 6.4 11.1 29.3 19.6 25.7 12.3 1,375.41980 .......... 8.6 1,183.1 – – 47.4 18.1 6.0 8.5 5.7 10.4 27.2 19.2 24.8 12.3 1,371.21981 .......... 7.9 1,239.5 – – 47.3 18.0 6.7 7.6 5.4 10.0 27.9 18.8 24.0 11.1 1,424.21982 .......... 7.6 1,264.5 – – 49.0 18.1 6.4 7.4 5.8 10.1 27.5 19.1 24.2 11.6 1,451.41983 .......... 7.4 1,248.3 – – 49.5 16.1 6.2 7.7 5.5 10.3 26.5 19.4 24.1 10.8 1,431.81984 .......... 7.9 1,292.1 – – 51.6 16.2 6.4 8.4 6.4 10.6 27.7 19.8 24.6 10.7 1,482.51985 .......... 8.4 1,250.6 – – 52.2 20.7 6.0 7.8 8.2 10.9 27.8 19.6 25.1 13.1 1,450.31986 .......... 6.8 1,222.8 – – 46.9 14.0 6.2 6.9 8.6 11.2 28.0 19.4 25.0 10.8 1,406.71987 .......... 7.3 1,280.5 – – 48.5 13.1 6.6 6.6 8.1 11.3 28.5 19.0 24.9 11.9 1,466.31988 .......... 7.8 1,165.8 – – 49.9 12.4 6.4 7.0 9.4 11.3 29.6 18.7 26.3 15.8 1,360.31989 .......... 8.7 1,274.4 – – 44.2 12.7 6.7 7.1 7.7 12.4 30.3 18.5 26.2 15.6 1,464.71990 .......... 9.6 1,241.7 – – 43.5 17.5 7.1 7.4 7.0 12.4 30.6 19.0 24.9 17.5 1,438.01991 .......... 9.6 1,269.3 – – 42.1 14.0 6.2 7.1 8.0 12.5 30.8 19.0 25.1 18.1 1,461.71992 .......... 9.1 1,104.0 – – 44.3 13.8 6.8 7.0 7.5 12.6 31.7 17.0 25.3 15.7 1,294.81993 .......... 9.3 1,048.8 – – 43.4 14.1 7.2 7.5 9.1 12.4 33.7 19.4 25.7 16.2 1,246.81994 .......... 9.4 977.0 – – 42.1 14.0 7.5 7.9 10.3 12.6 35.0 19.8 25.6 17.1 1,178.21995 .......... 9.0 926.0 – – 47.3 13.7 6.1 6.4 10.2 12.4 36.2 18.7 25.4 17.1 1,128.51996 .......... 9.1 904.5 – – 44.6 14.5 6.6 4.3 12.1 11.5 36.4 19.6 26.8 17.7 1,107.71997 .......... 7.4 880.0 – – 43.1 14.4 7.9 6.6 12.0 12.0 40.8 19.1 27.3 20.8 1,091.21998 .......... 7.9 837.1 – – 31.5 14.1 7.4 6.4 15.8 11.7 39.5 18.5 27.6 19.5 1,037.11999 .......... 7.8 810.7 – – 27.0 14.4 7.1 7.5 15.4 11.4 39.8 22.6 27.5 19.8 1,010.92000 .......... 7.4 779.1 – – 30.5 17.6 8.0 7.8 19.7 11.1 43.3 21.2 27.0 20.3 993.12001 .......... 7.4 787.2 – – 31.1 18.4 8.5 9.5 19.7 10.9 43.4 17.8 27.7 20.7 1,002.32002 .......... 7.2 837.5 – – 30.7 17.5 8.0 8.2 17.7 10.7 41.6 18.3 27.7 18.4 1,043.42003 .......... 7.7 895.1 18.3 31.9 18.5 10.1 7.3 22.7 10.8 50.9 5.5 30.6 22.7 1,132.32004 .......... 7.0 960.7 23.5 31.4 18.3 8.8 8.7 17.5 9.9 50.5 5.2 29.9 20.4 1,191.72005 .......... 7.5 933.2 18.9 29.6 18.4 9.6 8.6 18.8 10.3 53.5 5.0 30.0 23.2 1,166.42006 .......... 6.8 843.7 17.1 32.9 18.2 9.3 8.1 23.5 10.2 51.8 4.6 29.3 20.9 1,076.42007 .......... 6.8 864.6 17.1 31.5 19.1 9.9 7.5 20.7 10.6 45.8 5.6 30.0 21.0 1,090.22008 .......... 6.5 910.8 21.7 32.1 18.8 10.3 7.1 19.0 10.8 47.1 7.7 29.0 22.4 1,143.22009 .......... 6.6 874.3 18.6 31.1 18.6 10.8 7.9 16.5 10.2 44.2 4.3 29.9 21.8 1,094.82010 .......... 6.8 889.9 21.2 31.7 18.8 10.4 7.3 15.7 10.1 43.3 5.7 30.2 21.8 1,112.72011 .......... 8.3 890.3 20.3 33.1 18.5 10.5 7.3 13.9 10.1 43.0 6.7 30.6 21.4 1,114.12012 .......... 6.7 828.5 20.1 30.3 16.3 10.0 6.7 15.1 8.9 40.8 5.6 29.7 20.5 1,039.32013 .......... 7.3 749.5 18.9 28.9 16.4 10.5 6.2 15.3 8.7 41.9 5.3 29.9 20.4 959.32014 .......... 6.3 730.6 18.5 29.4 17.0 9.5 6.2 15.6 8.3 43.0 5.2 31.4 20.6 941.52015 .......... 6.2 734.5 17.9 30.1 16.3 9.0 6.8 16.2 8.4 44.0 6.0 30.7 19.8 945.82016 .......... 6.2 709.2 18.1 28.9 15.8 8.7 6.4 15.6 8.5 43.9 6.0 30.3 19.5 917.22017 .......... 6.3 707.9 19.2 28.8 14.9 8.8 5.9 15.5 8.6 43.7 6.7 29.1 19.7 915.1
a For 1975 and 1976, the U.S. Government’s fiscal year was July 1 throughJune 30. Beginning in 1977, the U.S. Government’s fiscal year is October 1through September 30 (for example, fiscal year 2014 is October 2013 throughSeptember 2014).
b U.S. Department of Homeland Security.c General Services Administration.d U.S. Department of Health and Human Services.e National Aeronautics and Space Administration.f Includes all U.S. government agencies not separately displayed. See
http://ctsedwweb.ee.doe.gov/Annual/Report/AgencyReference.aspx for agency list.– – =Not applicable. Notes: • Data in this table are developed using conversion factors that often
differ from those in Tables A1–A6. • Data include energy consumed at foreigninstallations and in foreign operations, including aviation and ocean bunkering,primarily by the U.S. Department of Defense. U.S. Government energy use forelectricity generation and uranium enrichment is excluded. • Totals may not equalsum of components due to independent rounding.
Web Page: See http://www.eia.gov/totalenergy/data/monthly/#consumption(Excel and CSV files) for all annual data beginning in 1975.
Source: U.S. Department of Energy, Office of Energy Efficiencyand Renewable Energy, Federal Energy Management Program. Seehttp://ctsedwweb.ee.doe.gov/Annual/Report/Report.aspx, "A-1 Total Site-DeliveredEnergy Use in All End-Use Sectors, by Federal Agency (Billion Btu)".

U. S. Energy Information Administration / Monthly Energy Review March 2019 47
Table 2.8 U.S. Government Energy Consumption by Source, Fiscal Years (Trillion Btu)
FiscalYeara Coal
NaturalGasb
PetroleumOther
MobilityFuelsf
Elec-tricity
PurchasedSteam
and Otherg TotalAviationGasoline Fuel Oilc Jet Fuel LPGd
MotorGasolinee Total
1975 .............. 77.9 166.2 22.0 376.0 707.4 5.6 63.2 1,174.2 0.0 141.5 5.1 1,565.01976 .............. 71.3 151.8 11.6 329.7 610.0 4.7 60.4 1,016.4 .0 139.3 4.6 1,383.41977 .............. 68.4 141.2 8.8 348.5 619.2 4.1 61.4 1,042.1 .0 141.1 5.7 1,398.51978 .............. 66.0 144.7 6.2 332.3 601.1 3.0 60.1 1,002.9 .0 141.0 6.4 1,360.91979 .............. 65.1 148.9 4.7 327.1 618.6 3.7 59.1 1,013.1 .0 141.2 7.1 1,375.41980 .............. 63.5 147.3 4.9 307.7 638.7 3.8 56.5 1,011.6 .2 141.9 6.8 1,371.21981 .............. 65.1 142.2 4.6 351.3 653.3 3.5 53.2 1,066.0 .2 144.5 6.2 1,424.21982 .............. 68.6 146.2 3.6 349.4 672.7 3.7 53.1 1,082.5 .2 147.5 6.2 1,451.41983 .............. 62.4 147.8 2.6 329.5 673.4 3.8 51.6 1,060.8 .2 151.5 9.0 1,431.81984 .............. 65.3 157.4 1.9 342.9 693.7 3.9 51.2 1,093.6 .2 155.9 10.1 1,482.51985 .............. 64.8 149.9 1.9 292.6 705.7 3.8 50.4 1,054.3 .2 167.2 13.9 1,450.31986 .............. 63.8 140.9 1.4 271.6 710.2 3.6 45.3 1,032.1 .3 155.8 13.7 1,406.71987 .............. 67.0 145.6 1.0 319.5 702.3 3.6 43.1 1,069.5 .4 169.9 13.9 1,466.31988 .............. 60.2 144.6 6.0 284.8 617.2 2.7 41.2 951.9 .4 171.2 32.0 1,360.31989 .............. 48.7 152.4 .8 245.3 761.7 3.5 41.1 1,052.4 2.2 188.6 20.6 1,464.71990 .............. 44.3 159.4 .5 245.2 732.4 3.8 37.2 1,019.1 2.6 193.6 19.1 1,438.01991 .............. 45.9 154.1 .4 232.6 774.5 3.0 34.1 1,044.7 6.0 192.7 18.3 1,461.71992 .............. 51.7 151.2 1.0 200.6 628.2 3.0 35.6 868.4 8.4 192.5 22.5 1,294.81993 .............. 38.3 152.9 .7 187.0 612.4 3.5 34.5 838.1 5.8 193.1 18.6 1,246.81994 .............. 35.0 143.9 .6 198.5 550.7 3.2 29.5 782.6 7.7 190.9 18.2 1,178.21995 .............. 31.7 149.4 .3 178.4 522.3 3.0 31.9 735.9 8.4 184.8 18.2 1,128.51996 .............. 23.3 147.3 .2 170.5 513.0 3.1 27.6 714.4 18.7 184.0 20.1 1,107.71997 .............. 22.5 153.8 .3 180.0 475.7 2.6 39.0 697.6 14.5 183.6 19.2 1,091.21998 .............. 23.9 140.4 .2 174.5 445.5 3.5 43.0 666.8 5.9 181.4 18.8 1,037.11999 .............. 21.2 137.4 .1 162.1 444.7 2.4 41.1 650.4 .4 180.0 21.5 1,010.92000 .............. 22.7 133.8 .2 171.3 403.1 2.5 43.9 621.0 1.8 193.6 20.2 993.12001 .............. 18.8 133.7 .2 176.9 415.2 3.1 42.5 638.0 4.8 188.4 18.6 1,002.32002 .............. 16.9 133.7 .2 165.6 472.9 2.8 41.3 682.8 3.2 188.3 18.5 1,043.42003 .............. 18.1 135.5 .3 190.8 517.9 3.2 46.3 758.4 3.3 193.8 23.2 1,132.32004 .............. 17.4 135.3 .2 261.4 508.2 2.9 44.1 816.9 3.1 197.1 22.0 1,191.72005 .............. 17.1 135.7 .4 241.4 492.2 3.4 48.8 786.1 5.6 197.6 24.3 1,166.42006 .............. 23.5 132.6 .6 209.3 442.6 2.7 48.3 703.6 2.1 196.7 18.2 1,076.42007 .............. 20.4 131.5 .4 212.9 461.1 2.7 46.5 723.7 2.9 194.9 16.7 1,090.22008 .............. 20.8 129.6 .4 198.4 525.4 2.3 49.0 775.4 3.6 196.1 17.7 1,143.22009 .............. 20.3 131.7 .3 166.4 505.7 3.2 48.3 723.9 10.1 191.3 17.7 1,094.82010 .............. 20.0 130.1 .4 157.8 535.8 2.5 51.3 747.7 3.0 193.7 18.2 1,112.72011 .............. 18.5 124.7 .9 166.5 533.6 2.0 52.7 755.8 2.7 193.2 19.1 1,114.12012 .............. 15.9 116.2 .4 148.6 493.5 1.7 50.1 694.4 3.1 187.2 22.5 1,039.32013 .............. 14.3 122.5 .7 140.0 424.0 1.9 46.6 613.2 2.8 184.7 21.8 959.32014 .............. 13.5 125.6 .3 133.5 414.3 1.8 44.9 594.8 3.6 182.1 21.9 941.52015 .............. 12.6 122.2 .3 134.4 418.9 1.8 46.8 602.2 3.7 184.3 20.9 945.82016 .............. 10.2 115.4 .3 129.7 403.9 1.7 46.5 582.2 3.6 184.5 21.4 917.22017 .............. 9.1 115.1 .3 133.9 400.1 1.5 46.4 582.3 3.9 181.7 23.0 915.1
a For 1975 and 1976, the U.S. Government’s fiscal year was July 1 throughJune 30. Beginning in 1977, the U.S. Government’s fiscal year is October 1through September 30 (for example, fiscal year 2014 is October 2013 throughSeptember 2014).
b Natural gas, plus a small amount of supplemental gaseous fuels.c Distillate fuel oil, including diesel fuel; and residual fuel oil, including Navy
Special.d Liquefied petroleum gases, primarily propane.e Includes E10 (a mixture of 10% ethanol and 90% motor gasoline) and E15 (a
mixture of 15% ethanol and 85% motor gasoline).f Other types of fuel used in vehicles and equipment. Primarily includes
alternative fuels such as compressed natural gas (CNG); liquefied natural gas(LNG); E85 (a mixture of 85% ethanol and 15% motor gasoline); B20 (a mixture of20% biodiesel and 80% diesel fuel); B100 (100% biodiesel); hydrogen; andmethanol.
g Other types of energy used in facilities. Primarily includes chilled water, butalso includes small amounts of renewable energy such as wood and solar thermal.
Notes: • Data in this table are developed using conversion factors that oftendiffer from those in Tables A1–A6. • Data include energy consumed at foreigninstallations and in foreign operations, including aviation and ocean bunkering,primarily by the U.S. Department of Defense. U.S. Government energy use forelectricity generation and uranium enrichment is excluded. • Totals may not equalsum of components due to independent rounding.
Web Page: See http://www.eia.gov/totalenergy/data/monthly/#consumption(Excel and CSV files) for all annual data beginning in 1975.
Source: U.S. Department of Energy, Office of Energy Efficiencyand Renewable Energy, Federal Energy Management Program. Seehttp://ctsedwweb.ee.doe.gov/Annual/Report/Report.aspx, "A-5 Historical FederalEnergy Consumption and Cost Data by Agency and Energy Type (FY 1975 toPresent)".

48 U. S. Energy Information Administration / Monthly Energy Review March 2019
Energy Consumption by Sector Note 1. Electrical System Energy Losses. Electrical system energy losses are calculated as the difference between total
primary consumption by the electric power sector (see Table 2.6) and the total energy content of electricity retail sales
(see Tables 7.6 and A6). Most of these losses occur at steam‐electric power plants (conventional and nuclear) in the
conversion of heat energy into mechanical energy to turn electric generators. The loss is a thermodynamically necessary
feature of the steam‐electric cycle. Part of the energy input‐to‐output losses is a result of imputing fossil energy
equivalent inputs for hydroelectric, geothermal, solar thermal, photovoltaic, and wind energy sources. In addition to
conversion losses, other losses include power plant use of electricity, transmission and distribution of electricity from
power plants to end‐use consumers (also called "line losses"), and unaccounted‐for electricity. Total losses are allocated
to the end‐use sectors in proportion to each sector's share of total electricity sales. Overall, about two thirds of total
energy input is lost in conversion. Currently, of electricity generated, approximately 5% is lost in plant use and 7% is lost
in transmission and distribution.
Note 2. Energy Consumption Data and Surveys. Most of the data in this section of the Monthly Energy Review (MER)
are developed from a group of energy‐related surveys, typically called "supply surveys," conducted by the U.S. Energy
Information Administration (EIA). Supply surveys are directed to suppliers and marketers of specific energy sources.
They measure the quantities of specific energy sources produced, or the quantities supplied to the market, or both. The
data obtained from EIA's supply surveys are integrated to yield the summary consumption statistics published in this
section (and in Section 1) of the MER.
Users of EIA's energy consumption statistics should be aware of a second group of energy‐related surveys, typically
called "consumption surveys." Consumption surveys gather information on the types of energy consumed by end users
of energy, along with the characteristics of those end users that can be associated with energy use. For example, the
“Manufacturing Energy Consumption Survey” belongs to the consumption survey group because it collects information
directly from end users (the manufacturing establishments). There are important differences between the supply and
consumption surveys that need to be taken into account in any analysis that uses both data sources. For information on
those differences, see “Energy Consumption by End‐Use Sector, A Comparison of Measures by Consumption and Supply
Surveys,” DOE/EIA‐0533, U.S. Energy Information Administration, Washington, DC, April 6, 1990.
Table 2.2 Sources
Coal 1949–2007: Residential sector coal consumption data from Table 6.2 are converted to Btu by multiplying by the
residential and commercial sectors coal consumption heat content factors in Table A5.
Natural Gas 1949–1979: Residential sector natural gas (including supplemental gaseous fuels) consumption data from Table 4.3 are
converted to Btu by multiplying by the natural gas end‐use sectors consumption heat content factors in Table A4.
1980 forward: Residential sector natural gas (including supplemental gaseous fuels) consumption data from Table 4.3
are converted to Btu by multiplying by the natural gas end‐use sectors consumption heat content factors in Table A4.
The residential sector portion of supplemental gaseous fuels data in Btu is estimated using the method described in
Note 3, “Supplemental Gaseous Fuels,” at the end of Section 4. Residential sector natural gas (excluding supplemental
gaseous fuels) consumption is equal to residential sector natural gas (including supplemental gaseous fuels)
consumption minus the residential sector portion of supplemental gaseous fuels.
Petroleum 1949 forward: Table 3.8a.
Fossil Fuels Total 1949–2007: Residential sector total fossil fuels consumption is the sum of the residential sector consumption values for
coal, natural gas, and petroleum.

U. S. Energy Information Administration / Monthly Energy Review March 2019 49
2008 forward: Residential sector total fossil fuels consumption is the sum of the residential sector consumption values
for natural gas and petroleum.
Renewable Energy 1949 forward: Table 10.2a.
Total Primary Energy Consumption 1949 forward: Residential sector total primary energy consumption is the sum of the residential sector consumption
values for fossil fuels and renewable energy.
Electricity Retail Sales 1949 forward: Residential sector electricity retail sales from Table 7.6 are converted to Btu by multiplying by the
electricity heat content factor in Table A6.
Electrical System Energy Losses 1949 forward: Total electrical system energy losses are equal to electric power sector total primary energy consumption
from Table 2.6 minus total electricity retail sales from Table 7.6 (converted to Btu by multiplying by the electricity heat
content factor in Table A6). Total electrical system energy losses are allocated to the residential sector in proportion to
the residential sector’s share of total electricity retail sales from Table 7.6. See Note 1, "Electrical System Energy
Losses."
Total Energy Consumption 1949 forward: Residential sector total energy consumption is the sum of the residential sector consumption values for
total primary energy, electricity retail sales, and electrical system energy losses.
Table 2.3 Sources
Coal 1949 forward: Commercial sector coal consumption data from Table 6.2 are converted to Btu by multiplying by the
residential and commercial sectors coal consumption heat content factors in Table A5.
Natural Gas 1949–1979: Commercial sector natural gas (including supplemental gaseous fuels) consumption data from Table 4.3 are
converted to Btu by multiplying by the natural gas end‐use sectors consumption heat content factors in Table A4.
1980 forward: Commercial sector natural gas (including supplemental gaseous fuels) consumption data from Table 4.3
are converted to Btu by multiplying by the natural gas end‐use sectors consumption heat content factors in Table A4.
The commercial sector portion of supplemental gaseous fuels data in Btu is estimated using the method described in
Note 3, “Supplemental Gaseous Fuels,” at the end of Section 4. Commercial sector natural gas (excluding supplemental
gaseous fuels) consumption is equal to commercial sector natural gas (including supplemental gaseous fuels)
consumption minus the commercial sector portion of supplemental gaseous fuels.
Petroleum 1949–1992: Table 3.8a.
1993–2008: The commercial sector share of motor gasoline consumption is equal to commercial sector motor gasoline
consumption from Table 3.7a divided by motor gasoline product supplied from Table 3.5. Commercial sector fuel
ethanol (including denaturant) consumption is equal to total fuel ethanol (including denaturant) consumption from
Table 10.3 multiplied by the commercial sector share of motor gasoline consumption. Commercial sector petroleum
(excluding biofuels) consumption is equal to commercial sector petroleum (including biofuels) consumption from Table
3.8a minus commercial sector fuel ethanol (including denaturant) consumption.

50 U. S. Energy Information Administration / Monthly Energy Review March 2019
2009 forward: Commercial sector fuel ethanol (minus denaturant) consumption is equal to total fuel ethanol (minus
denaturant) consumption from Table 10.3 multiplied by the commercial sector share of motor gasoline consumption
(see 1993–2008 sources above). Commercial sector petroleum (excluding biofuels) consumption is equal to commercial
sector petroleum (including biofuels) consumption from Table 3.8a minus commercial sector fuel ethanol (minus
denaturant) consumption.
Fossil Fuels Total 1949 forward: Commercial sector total fossil fuels consumption is the sum of the commercial sector consumption
values for coal, natural gas, and petroleum.
Renewable Energy 1949 forward: Table 10.2a.
Total Primary Energy Consumption 1949 forward: Commercial sector total primary energy consumption is the sum of the commercial sector consumption
values for fossil fuels and renewable energy.
Electricity Retail Sales 1949 forward: Commercial sector electricity retail sales from Table 7.6 are converted to Btu by multiplying by the
electricity heat content factor in Table A6.
Electrical System Energy Losses 1949 forward: Total electrical system energy losses are equal to electric power sector total primary energy consumption
from Table 2.6 minus total electricity retail sales from Table 7.6 (converted to Btu by multiplying by the electricity heat
content factor in Table A6). Total electrical system energy losses are allocated to the commercial sector in proportion to
the commercial sector’s share of total electricity retail sales from Table 7.6. See Note 1, "Electrical System Energy
Losses."
Total Energy Consumption 1949 forward: Commercial sector total energy consumption is the sum of the commercial sector consumption values for
total primary energy, electricity retail sales, and electrical system energy losses.
Table 2.4 Sources
Coal 1949 forward: Coke plants coal consumption from Table 6.2 is converted to Btu by multiplying by the coke plants coal
consumption heat content factors in Table A5. Other industrial coal consumption from Table 6.2 is converted to Btu by
multiplying by the other industrial coal consumption heat content factors in Table A5. Industrial sector coal
consumption is equal to coke plants coal consumption and other industrial coal consumption.
Natural Gas 1949–1979: Industrial sector natural gas (including supplemental gaseous fuels) consumption data from Table 4.3 are
converted to Btu by multiplying by the natural gas end‐use sectors consumption heat content factors in Table A4.
1980 forward: Industrial sector natural gas (including supplemental gaseous fuels) consumption data from Table 4.3 are
converted to Btu by multiplying by the natural gas end‐use sectors consumption heat content factors in Table A4. The
industrial sector portion of supplemental gaseous fuels data in Btu is estimated using the method described in Note 3,
“Supplemental Gaseous Fuels,” at the end of Section 4. Industrial sector natural gas (excluding supplemental gaseous
fuels) consumption is equal to industrial sector natural gas (including supplemental gaseous fuels) consumption minus
the industrial sector portion of supplemental gaseous fuels.

U. S. Energy Information Administration / Monthly Energy Review March 2019 51
Petroleum 1949–1992: Table 3.8b.
1993–2008: The industrial sector share of motor gasoline consumption is equal to industrial sector motor gasoline
consumption from Table 3.7b divided by motor gasoline product supplied from Table 3.5. Industrial sector fuel ethanol
(including denaturant) consumption is equal to total fuel ethanol (including denaturant) consumption from Table 10.3
multiplied by the industrial sector share of motor gasoline consumption. Industrial sector petroleum (excluding biofuels)
consumption is equal to industrial sector petroleum (including biofuels) consumption from Table 3.8b minus industrial
sector fuel ethanol (including denaturant) consumption.
2009 forward: Industrial sector fuel ethanol (minus denaturant) consumption is equal to total fuel ethanol (minus
denaturant) consumption from Table 10.3 multiplied by the industrial sector share of motor gasoline consumption (see
1993–2008 sources above). Industrial sector petroleum (excluding biofuels) consumption is equal to industrial sector
petroleum (including biofuels) consumption from Table 3.8b minus industrial sector fuel ethanol (minus denaturant)
consumption.
Coal Coke Net Imports 1949 forward: Coal coke net imports are equal to coal coke imports from Table 1.4a minus coal coke exports from Table
1.4b.
Fossil Fuels Total 1949 forward: Industrial sector total fossil fuels consumption is the sum of the industrial sector consumption values for
coal, natural gas, and petroleum, plus coal coke net imports.
Renewable Energy 1949 forward: Table 10.2b.
Total Primary Energy Consumption 1949 forward: Industrial sector total primary energy consumption is the sum of the industrial sector consumption
values for fossil fuels and renewable energy.
Electricity Retail Sales 1949 forward: Industrial sector electricity retail sales from Table 7.6 are converted to Btu by multiplying by the
electricity heat content factor in Table A6.
Electrical System Energy Losses 1949 forward: Total electrical system energy losses are equal to electric power sector total primary energy consumption
from Table 2.6 minus total electricity retail sales from Table 7.6 (converted to Btu by multiplying by the electricity heat
content factor in Table A6). Total electrical system energy losses are allocated to the industrial sector in proportion to
the industrial sector’s share of total electricity retail sales from Table 7.6. See Note 1, "Electrical System Energy Losses."
Total Energy Consumption 1949 forward: Industrial sector total energy consumption is the sum of the industrial sector consumption values for
total primary energy, electricity retail sales, and electrical system energy losses.
Table 2.5 Sources
Coal 1949–1977: Transportation sector coal consumption data from Table 6.2 are converted to Btu by multiplying by the
other industrial sector coal consumption heat content factors in Table A5.

52 U. S. Energy Information Administration / Monthly Energy Review March 2019
Natural Gas 1949 forward: Transportation sector natural gas consumption data from Table 4.3 are converted to Btu by multiplying
by the natural gas end‐use sectors consumption heat content factors in Table A4.
Petroleum 1949–1992: Table 3.8c. 1993–2008: The transportation sector share of motor gasoline consumption is equal to transportation sector motor gasoline consumption from Table 3.7c divided by motor gasoline product supplied from Table 3.5. Transportation sector fuel ethanol (including denaturant) consumption is equal to total fuel ethanol (including denaturant) consumption from Table 10.3 multiplied by the transportation sector share of motor gasoline consumption. Transportation sector petroleum (excluding biofuels) consumption is equal to transportation sector petroleum (including biofuels) consumption from Table 3.8c minus transportation sector fuel ethanol (including denaturant) consumption. 2009–2011: Transportation sector fuel ethanol (minus denaturant) consumption is equal to total fuel ethanol (minus denaturant) consumption from Table 10.3 multiplied by the transportation sector share of motor gasoline consumption (see 1993–2008 sources above). Transportation sector petroleum (excluding biofuels) consumption is equal to: transportation sector petroleum (including biofuels) consumption from Table 3.8c; minus transportation sector fuel ethanol (minus denaturant) consumption; minus biodiesel consumption (calculated using biodiesel data from U.S. Energy Information Administration (EIA), EIA‐22M, "Monthly Biodiesel Production Survey"; and biomass‐based diesel fuel data from EIA‐810, "Monthly Refinery Report," EIA‐812, "Monthly Product Pipeline Report," and EIA‐815, "Monthly Bulk Terminal and Blender Report” (the data are converted to Btu by multiplying by the biodiesel heat content factor in Table A1); minus other renewable diesel fuel and other renewables fuels consumption from Table 10.4. 2012 forward: Transportation sector fuel ethanol (minus denaturant) consumption is equal to total fuel ethanol (minus denaturant) consumption from Table 10.3 multiplied by the transportation sector share of motor gasoline consumption (see 1993–2008 sources above). Transportation sector petroleum (excluding biofuels) consumption is equal to: transportation sector petroleum (including biofuels) consumption from Table 3.8c; minus transportation sector fuel ethanol (minus denaturant) consumption; minus biodiesel consumption from Table 10.4; minus other renewable diesel fuel and other renewables fuels consumption from Table 10.4.
Fossil Fuels Total 1949–1977: Transportation sector total fossil fuels consumption is the sum of the transportation sector consumption
values for coal, natural gas, and petroleum.
1978 forward: Transportation sector total fossil fuels consumption is the sum of the transportation sector consumption
values for natural gas and petroleum.
Renewable Energy 1981 forward: Table 10.2b.
Total Primary Energy Consumption
1949–1980: Transportation sector total primary energy consumption is equal to transportation sector fossil fuels
consumption.
1981 forward: Transportation sector total primary energy consumption is the sum of the transportation sector
consumption values for fossil fuels and renewable energy.
Electricity Retail Sales 1949 forward: Transportation sector electricity retail sales from Table 7.6 are converted to Btu by multiplying by the
electricity heat content factor in Table A6.

U. S. Energy Information Administration / Monthly Energy Review March 2019 53
Electrical System Energy Losses 1949 forward: Total electrical system energy losses are equal to electric power sector total primary energy consumption
from Table 2.6 minus total electricity retail sales from Table 7.6 (converted to Btu by multiplying by the electricity heat
content factor in Table A6). Total electrical system energy losses are allocated to the transportation sector in proportion
to the transportation sector’s share of total electricity retail sales from Table 7.6. See Note 1, "Electrical System Energy
Losses."
Total Energy Consumption 1949 forward: Transportation sector total energy consumption is the sum of the transportation sector consumption
values for total primary energy, electricity retail sales, and electrical system energy losses.
Table 2.6 Sources
Coal 1949 forward: Electric power sector coal consumption data from Table 6.2 are converted to Btu by multiplying by the
electric power sector coal consumption heat content factors in Table A5.
Natural Gas 1949–1979: Electric power sector natural gas (including supplemental gaseous fuels) consumption data from Table 4.3
are converted to Btu by multiplying by the natural gas electric power sector consumption heat content factors in Table
A4.
1980 forward: Electric power sector natural gas (including supplemental gaseous fuels) consumption data from Table
4.3 are converted to Btu by multiplying by the natural gas electric power sector consumption heat content factors in
Table A4. The electric power sector portion of supplemental gaseous fuels data in Btu is estimated using the method
described in Note 3, “Supplemental Gaseous Fuels,” at the end of Section 4. Electric power sector natural gas (excluding
supplemental gaseous fuels) consumption is equal to electric power sector natural gas (including supplemental gaseous
fuels) consumption minus the electric power sector portion of supplemental gaseous fuels.
Petroleum 1949 forward: Table 3.8c.
Fossil Fuels Total 1949 forward: Electric power sector total fossil fuels consumption is the sum of the electric power sector consumption
values for coal, natural gas, and petroleum.
Nuclear Electric Power 1949 forward: Nuclear electricity net generation data from Table 7.2a are converted to Btu by multiplying by the
nuclear heat rate factors in Table A6.
Renewable Energy 1949 forward: Table 10.2c.
Electricity Net Imports 1949 forward: Electricity net imports are equal to electricity imports from Table 1.4a minus electricity exports from
Table 1.4b.
Total Primary Energy Consumption 1949 forward: Electric power sector total primary energy consumption is the sum of the electric power sector
consumption values for fossil fuels, nuclear electric power, and renewable energy, plus electricity net imports.

THIS PAGE INTENTIONALLY LEFT BLANK

3. Petroleum

56 U. S. Energy Information Administration / Monthly Energy Review March 2019
Figure 3.1 Petroleum Overview (Million Barrels Per Day)
Net Imports
Products Supplied
Total Field Production [a]
0
5
10
15
20
25
1950 1955 1960 1965 1970 1975 1980 1985 1990 1995 2000 2005 2010 2015
Overview, 1949–2018
Natural Gas Liquids
Crude Oil [b]
0
2
4
6
8
10
12
1950 1955 1960 1965 1970 1975 1980 1985 1990 1995 2000 2005 2010 2015
Crude Oil and Natural Gas Liquids Field Production, 1949–2018
12.2
5.1
19.3
13.8
3.7
20.5
16.5
2.4
21.1
0
5
10
15
20
25
Total FieldProduction [a]
Net Imports Products Supplied
Overview, January
2017 2018 2019
0
4
8
12
16
20
J F M A M J J A S O N D
Total Field Production [a], Monthly
2017 2018 2019
[a] Crude oil, including lease condensate, and natural gas liquids field
production.
[b] Includes lease condensate.
Web Page: http://www.eia.gov/totalenergy/data/monthly/#petroleum.
Source: Table 3.1.

U. S. Energy Information Administration / Monthly Energy Review March 2019 57
Table 3.1 Petroleum Overview (Thousand Barrels per Day)
Field Productiona
Renew-able
Fuelsand Oxy-genatese
Process-ing
Gainf
Trade
StockChangei
Adjust-mentsc,j
PetroleumProductsSupplied
Crude Oilb,c
NaturalGas
Liquids TotalcIm-
portsgEx-
portsNet
Importsh48
Statesd Alaska Total
1950 Average .................. 5,407 0 5,407 499 5,906 NA 2 850 305 545 -56 -51 6,4581955 Average .................. 6,807 0 6,807 771 7,578 NA 34 1,248 368 880 (s) -37 8,4551960 Average .................. 7,034 2 7,035 929 7,965 NA 146 1,815 202 1,613 -83 -8 9,7971965 Average .................. 7,774 30 7,804 1,210 9,014 NA 220 2,468 187 2,281 -8 -10 11,5121970 Average .................. 9,408 229 9,637 1,660 11,297 NA 359 3,419 259 3,161 103 -16 14,6971975 Average .................. 8,183 191 8,375 1,633 10,007 NA 460 6,056 209 5,846 32 41 16,3221980 Average .................. 6,980 1,617 8,597 1,573 10,170 NA 597 6,909 544 6,365 140 64 17,0561985 Average .................. 7,146 1,825 8,971 1,609 10,581 NA 557 5,067 781 4,286 -103 200 15,7261990 Average .................. 5,582 1,773 7,355 1,559 8,914 NA 683 8,018 857 7,161 107 338 16,9881995 Average .................. 5,076 1,484 6,560 1,762 8,322 NA 774 8,835 949 7,886 -246 496 17,7252000 Average .................. 4,851 970 5,822 1,911 7,733 NA 948 11,459 1,040 10,419 -69 532 19,7012001 Average .................. 4,839 963 5,801 1,868 7,670 NA 903 11,871 971 10,900 325 501 19,6492002 Average .................. 4,759 985 5,744 1,880 7,624 NA 957 11,530 984 10,546 -105 529 19,7612003 Average .................. 4,675 974 5,649 1,719 7,369 NA 974 12,264 1,027 11,238 56 509 20,0342004 Average .................. 4,533 908 5,441 1,809 7,250 NA 1,051 13,145 1,048 12,097 209 542 20,7312005 Average .................. 4,320 864 5,184 1,717 6,901 NA 989 13,714 1,165 12,549 k 146 509 20,8022006 Average .................. 4,345 741 5,086 1,739 6,825 NA 994 13,707 1,317 12,390 59 537 20,6872007 Average .................. 4,352 722 5,074 1,783 6,857 NA 996 13,468 1,433 12,036 -152 640 20,6802008 Average .................. 4,317 683 5,000 1,784 6,783 NA 993 12,915 1,802 11,114 195 803 19,4982009 Average .................. 4,704 645 5,349 1,910 7,259 746 979 11,691 2,024 9,667 107 228 18,7712010 Average .................. 4,878 600 5,478 2,074 7,552 907 1,068 11,793 2,353 9,441 39 253 19,1802011 Average .................. 5,093 561 5,654 2,216 7,870 1,016 1,076 11,436 2,986 8,450 -129 345 18,8872012 Average .................. 5,976 526 6,502 2,408 8,909 964 1,059 10,598 3,205 7,393 147 308 18,4872013 Average .................. 6,952 515 7,467 2,606 10,073 1,002 1,087 9,859 3,621 6,237 -139 429 18,9672014 Average .................. 8,262 496 8,759 3,015 11,773 1,055 1,081 9,241 4,176 5,065 267 394 19,1002015 Average .................. 8,948 483 9,431 3,342 12,773 1,095 1,062 9,449 4,738 4,711 429 322 19,5342016 Average .................. 8,341 490 8,831 3,509 12,340 1,158 1,118 10,055 5,261 4,795 130 406 19,687
2017 January .................... 8,324 516 8,840 3,395 12,235 1,187 1,139 10,745 5,645 5,101 746 407 19,323 February .................. 8,570 513 9,083 3,633 12,716 1,173 1,063 10,033 6,461 3,573 -128 538 19,190 March ....................... 8,614 526 9,140 3,685 12,826 1,179 1,112 10,184 6,054 4,130 -602 211 20,060 April ......................... 8,559 525 9,085 3,682 12,767 1,142 1,146 10,322 6,277 4,045 -70 426 19,595 May .......................... 8,660 508 9,168 3,771 12,939 1,179 1,135 10,729 6,232 4,498 181 496 20,066 June ......................... 8,611 463 9,074 3,807 12,881 1,191 1,159 10,325 6,252 4,073 -802 454 20,561 July .......................... 8,807 423 9,230 3,822 13,052 1,193 1,101 9,954 6,291 3,663 -369 741 20,119 August ..................... 8,793 451 9,244 3,764 13,007 1,222 1,113 10,112 5,665 4,447 -363 100 20,251 September ............... 9,013 482 9,495 3,731 13,226 1,180 1,010 9,752 6,289 3,464 -315 446 19,641 October .................... 9,196 507 9,703 4,020 13,723 1,214 1,081 9,741 7,086 2,655 -1,180 137 19,990 November ................ 9,593 510 10,103 4,106 14,209 1,268 1,146 9,876 7,144 2,732 -596 356 20,307 December ................ 9,528 512 10,040 3,969 14,009 1,240 1,126 9,935 7,136 2,799 -927 222 20,323 Average .................. 8,857 494 9,352 3,783 13,134 1,198 1,111 10,144 6,376 3,768 -370 376 19,958
2018 January .................... E 9,487 E 508 E 9,995 3,825 E 13,819 1,204 1,123 10,274 6,615 3,659 -500 155 20,461 February .................. E 9,735 E 513 E 10,248 4,023 E 14,271 1,221 1,117 9,580 6,844 2,736 -140 134 19,619 March ....................... E 9,949 E 512 E 10,461 4,173 E 14,635 1,206 1,096 9,821 7,105 2,716 -444 477 20,573 April ......................... E 9,978 E 497 E 10,475 4,260 E 14,735 1,199 1,114 10,364 7,730 2,634 78 337 19,941 May .......................... E 9,968 E 496 E 10,464 4,321 E 14,785 1,223 1,119 10,228 7,517 2,712 206 723 20,357 June ......................... E 10,222 E 451 E 10,672 4,326 E 14,998 1,257 1,129 10,706 7,801 2,905 -108 308 20,705 July .......................... E 10,541 E 395 E 10,936 4,411 E 15,347 1,273 1,170 10,176 7,827 2,349 163 646 20,621 August ..................... E 10,897 E 428 E 11,325 4,570 E 15,895 1,287 1,191 10,432 7,043 3,389 620 161 21,302 September ............... E 10,999 E 471 E 11,470 4,631 E 16,102 1,211 1,140 9,885 7,611 2,273 1,336 561 19,951 October .................... RE 11,072 E 487 RE 11,559 4,580 RE 16,139 1,219 1,110 9,417 8,018 1,399 -500 R 406 20,774 November ................ RE 11,408 E 497 RE 11,905 4,571 RE 16,476 1,239 1,158 R 9,213 R 8,669 R 545 -192 R 938 R 20,548 December ................ RE 11,353 RE 496 RE 11,849 R 4,479 RE 16,327 R 1,222 R 1,210 R 9,022 R 8,250 R 772 R 39 R 987 R 20,479 Average .................. RE 10,471 E 479 RE 10,950 R 4,349 RE 15,299 R 1,230 R 1,140 R 9,928 R 7,588 R 2,340 R 45 R 488 R 20,453
2019 January .................... E 11,384 E 497 E 11,881 E 4,585 E 16,466 E 1,087 E 1,131 E 9,733 E 7,369 E 2,364 E 298 E 351 E 21,101 February .................. NA NA NA NA NA NA NA NA NA NA NA NA NA 2-Month Average ... NA NA NA NA NA NA NA NA NA NA NA NA NA
2018 2-Month Average ... E 9,605 E 510 E 10,115 3,919 E 14,034 1,212 1,120 9,945 6,723 3,221 -330 145 20,0622017 2-Month Average ... 8,441 515 8,956 3,508 12,463 1,180 1,103 10,407 6,032 4,375 331 469 19,260
a Crude oil production on leases, and natural gas liquids (hydrocarbon gasliquids and a small amount of finished petroleum products) production at naturalgas processing plants. Excludes what was previously classified as "FieldProduction" of finished motor gasoline, motor gasoline blending components, andother hydrocarbons and oxygenates; these are now included in "Adjustments."
b Includes lease condensate.c Once a month, data for crude oil production, total field production, and
adjustments are revised going back as far as the data year of the U.S. EnergyInformation Administration’s (EIA) last published Petroleum Supply Annual(PSA)—these revisions are released at the same time as EIA’s Petroleum SupplyMonthly. Once a year, data for these series are revised going back as far as 10years—these revisions are released at the same time as the PSA.
d United States excluding Alaska and Hawaii.e Renewable fuels and oxygenate plant net production.f Refinery and blender net production minus refinery and blender net inputs.
See Table 3.2.g Includes Strategic Petroleum Reserve imports. See Table 3.3b.h Net imports equal imports minus exports.i A negative value indicates a decrease in stocks and a positive value indicates
an increase. The current month stock change estimate is based on the changefrom the previous month’s estimate, rather than the stocks values shown in Table3.4. Includes crude oil stocks in the Strategic Petroleum Reserve, but excludesdistillate fuel oil stocks in the Northeast Home Heating Oil Reserve. See Table 3.4.
j An adjustment for crude oil, hydrogen, oxygenates, renewable fuels, otherhydrocarbons, motor gasoline blending components, finished motor gasoline, anddistillate fuel oil. See EIA’s Petroleum Supply Monthly, Appendix B, "PSMExplanatory Notes," for further information.
k Derived from the 2004 petroleum stocks value that excludes crude oil stockson leases (1,628 million barrels), not the 2004 petroleum stocks value that includescrude oil stocks on leases (1,645 million barrels).
R=Revised. E=Estimate. NA=Not available. (s)=Less than 500 barrels per dayand greater than -500 barrels per day.
Notes: • Totals may not equal sum of components due to independentrounding. • Geographic coverage is the 50 states and the District of Columbia.
Web Page: See http://www.eia.gov/totalenergy/data/monthly/#petroleum (Exceland CSV files) for all available annual data beginning in 1949 and monthly databeginning in 1973.
Sources: See end of section.
February 2019 monthly data from the Weekly Petroleum Status Report
were not available in time for this publication.

58 U. S. Energy Information Administration / Monthly Energy Review March 2019
Figure 3.2 Refinery and Blender Net Inputs and Net Production (Million Barrels per Day)
Total Net Production
Total Net Inputs
Crude Oil Net Inputs [a]
Other Net Inputs [b]
0
6
12
18
24
1950 1955 1960 1965 1970 1975 1980 1985 1990 1995 2000 2005 2010 2015
Net Inputs and Net Production, 1949–2018
Motor Gasoline [c]
Distillate Fuel Oil [d]
Jet Fuel [e] Residual Fuel Oil
0
2
4
6
8
10
12
1950 1955 1960 1965 1970 1975 1980 1985 1990 1995 2000 2005 2010 2015
Net Production, Selected Products, 1949–2018
Total Net Production
Total Net Inputs
Crude Oil Net Inputs [a]
Other Net Inputs [b]
0
5
10
15
20
25
J F M A M J J A S O N D J F M A M J J A S O N D J F M A M J J A S O N D
2017 2018 2019
Net Inputs and Net Production, Monthly
Motor Gasoline [c]
Distillate Fuel Oil [d]
Jet Fuel [e]
Residual Fuel Oil
0
3
6
9
12
J F M A M J J A S O N D J F M A M J J A S O N D J F M A M J J A S O N D
2017 2018 2019
Net Production, Selected Products, Monthly
[a] Includes lease condensate.
[b] Natural gas liquids and other liquids.
[c] Beginning in 1993, includes fuel ethanol blended into motor gasoline.
[d] Beginning in 2009, includes renewable diesel fuel (including biodiesel)
blended into distillate fuel oil.
[e] Beginning in 2005, includes kerosene‐type jet fuel only.
Web Page: http://www.eia.gov/totalenergy/data/monthly/#petroleum.
Source: Table 3.2.

U. S. Energy Information Administration / Monthly Energy Review March 2019 59
Table 3.2 Refinery and Blender Net Inputs and Net Production (Thousand Barrels per Day)
Refinery and Blender Net Inputsa Refinery and Blender Net Productionb
CrudeOilc
NaturalGas
LiquidsdOther
Liquidse Total
Distil-lateFuelOilf
Hydrocarbon Gas Liquids
JetFueli
MotorGaso-linej
Resid-ual
FuelOil
OtherPro-
ductsk Total
Propane/Propylene
TotalhPro-pane
Propy-lene Totalg
1950 Average .................... 5,739 259 19 6,018 1,093 NA NA NA 80 i( ) 2,735 1,165 947 6,0191955 Average .................... 7,480 345 32 7,857 1,651 NA NA NA 119 155 3,648 1,152 1,166 7,8911960 Average .................... 8,067 455 61 8,583 1,823 NA NA NA 212 241 4,126 908 1,420 8,7291965 Average .................... 9,043 618 88 9,750 2,096 NA NA NA 293 523 4,507 736 1,814 9,9701970 Average .................... 10,870 763 121 11,754 2,454 E 184 E 55 239 345 827 5,699 706 2,082 12,1131975 Average .................... 12,442 710 72 13,225 2,653 E 179 E 60 238 311 871 6,518 1,235 2,097 13,6851980 Average .................... 13,481 462 81 14,025 2,661 E 202 E 72 273 330 999 6,492 1,580 2,559 14,6221985 Average .................... 12,002 509 681 13,192 2,686 E 223 E 72 295 391 1,189 6,419 882 2,183 13,7501990 Average .................... 13,409 467 713 14,589 2,925 299 105 404 499 1,488 6,959 950 2,452 15,2721995 Average .................... 13,973 471 775 15,220 3,155 352 151 503 654 1,416 7,459 788 2,522 15,9942000 Average .................... 15,067 380 849 16,295 3,580 366 217 583 705 1,606 7,951 696 2,705 17,2432001 Average .................... 15,128 429 825 16,382 3,695 352 204 556 667 1,530 8,022 721 2,651 17,2852002 Average .................... 14,947 429 941 16,316 3,592 347 225 572 671 1,514 8,183 601 2,712 17,2732003 Average .................... 15,304 419 791 16,513 3,707 341 229 570 658 1,488 8,194 660 2,780 17,4872004 Average .................... 15,475 422 866 16,762 3,814 341 243 584 645 1,547 8,265 655 2,887 17,8142005 Average .................... 15,220 441 1,149 16,811 3,954 311 229 540 573 1,546 8,318 628 2,782 17,8002006 Average .................... 15,242 501 1,238 16,981 4,040 302 241 543 627 1,481 8,364 635 2,827 17,9752007 Average .................... 15,156 505 1,337 16,999 4,133 330 232 562 655 1,448 8,358 673 2,728 17,9942008 Average .................... 14,648 485 2,019 17,153 4,294 312 207 519 630 1,493 8,548 620 2,561 18,1462009 Average .................... 14,336 485 2,082 16,904 4,048 291 246 537 623 1,396 8,786 598 2,431 17,8822010 Average .................... 14,724 442 2,219 17,385 4,223 282 278 560 659 1,418 9,059 585 2,509 18,4522011 Average .................... 14,806 490 2,300 17,596 4,492 270 282 552 619 1,449 9,058 537 2,518 18,6732012 Average .................... 14,999 509 1,997 17,505 4,550 276 277 553 630 1,471 8,926 501 2,487 18,5642013 Average .................... 15,312 496 2,211 18,019 4,733 284 281 564 623 1,499 9,234 467 2,550 19,1062014 Average .................... 15,848 511 2,214 18,574 4,916 306 281 587 653 1,541 9,570 435 2,537 19,6542015 Average .................... 16,188 517 2,119 18,824 4,983 283 276 559 615 1,590 9,754 417 2,527 19,8862016 Average .................... 16,187 536 2,238 18,961 4,834 307 280 587 632 1,650 9,995 418 2,550 20,079
2017 January ...................... 16,118 649 1,102 17,870 4,785 298 266 564 355 1,614 9,281 485 2,488 19,009 February .................... 15,493 587 2,011 18,091 4,657 282 262 544 413 1,603 9,507 482 2,492 19,154 March ......................... 16,048 519 2,213 18,780 4,793 295 291 586 678 1,674 9,802 406 2,539 19,892 April ........................... 16,954 478 1,918 19,351 5,019 298 303 601 857 1,735 9,855 417 2,614 20,497 May ............................ 17,222 484 2,173 19,879 5,216 324 298 622 908 1,713 10,126 408 2,644 21,014 June ........................... 17,204 473 2,491 20,168 5,284 333 282 615 915 1,764 10,270 406 2,689 21,328 July ............................ 17,317 446 2,241 20,005 5,162 312 295 607 877 1,817 10,164 390 2,695 21,106 August ....................... 16,981 480 2,340 19,801 5,044 309 280 589 834 1,764 10,176 453 2,644 20,914 September ................. 15,460 606 2,201 18,267 4,560 278 235 513 477 1,665 9,778 459 2,338 19,277 October ...................... 16,061 593 2,391 19,045 4,972 303 291 594 520 1,611 10,129 442 2,454 20,126 November .................. 16,840 731 1,848 19,418 5,362 315 301 616 348 1,671 10,220 408 2,556 20,564 December .................. 17,274 750 1,450 19,475 5,408 332 311 642 341 1,784 10,104 373 2,590 20,600 Average .................... 16,590 566 2,031 19,187 5,024 307 285 592 628 1,702 9,954 427 2,563 20,298
2018 January ...................... 16,599 629 1,206 18,435 5,010 296 304 600 394 1,690 9,519 467 2,478 19,558 February .................... 15,932 634 1,715 18,281 4,584 295 274 568 409 1,690 9,800 462 2,453 19,397 March ......................... 16,665 556 1,915 19,136 4,825 295 276 571 631 1,784 10,052 403 2,538 20,232 April ........................... 16,766 497 2,302 19,564 5,119 307 286 593 800 1,798 9,964 450 2,546 20,678 May ............................ 16,989 454 2,442 19,885 5,213 300 292 591 853 1,808 10,130 415 2,585 21,004 June ........................... 17,666 457 2,307 20,430 5,406 323 286 609 875 1,893 10,326 348 2,712 21,559 July ............................ 17,355 442 2,396 20,194 5,256 320 286 607 870 1,894 10,166 444 2,732 21,363 August ....................... 17,612 504 2,320 20,436 5,369 310 293 604 880 1,955 10,243 391 2,790 21,627 September ................. 16,986 565 2,045 19,596 5,230 296 294 590 650 1,856 9,926 429 2,644 20,736 October ...................... 16,409 686 2,205 19,300 5,036 279 294 574 460 1,691 10,299 397 2,527 20,410 November .................. 17,152 746 1,709 19,607 5,350 294 314 608 395 1,769 10,240 450 2,563 20,766 December .................. R 17,409 R 732 R 1,474 R 19,615 R 5,576 R 303 R 313 R 615 R 372 R 1,856 R 10,020 R 440 R 2,561 R 20,825 Average .................... R 16,968 R 575 R 2,005 R 19,547 R 5,168 R 301 R 293 R 594 R 634 1,808 R 10,059 R 424 R 2,595 20,687
2019 January ...................... E 16,912 RF 606 RE 1,340 RF 18,858 E 5,225 NA NA RE 593 F 370 E 1,779 E 9,743 E 386 RE 2,486 RE 19,989 February .................... NA F 594 NA F 18,584 NA NA NA NA F 434 NA NA NA NA NA 2-Month Average ..... NA F 600 NA F 18,728 NA NA NA NA F 400 NA NA NA NA NA
2018 2-Month Average ..... 16,282 631 1,448 18,362 4,808 295 290 585 401 1,690 9,652 464 2,466 19,4822017 2-Month Average ..... 15,822 620 1,534 17,975 4,724 290 264 555 382 1,609 9,388 484 2,490 19,078
a See "Refinery and Blender Net Inputs" in Glossary.b See "Refinery and Blender Net Production" in Glossary.c Includes lease condensate.d Ethane, propane, normal butane, isobutane, and natural gasoline (pentanes
plus).e Unfinished oils (net), other hydrocarbons, and hydrogen. Beginning in 1981,
also includes aviation and motor gasoline blending components (net). Beginning in1993, also includes oxygenates (net), including fuel ethanol. Beginning in 2009,also includes renewable diesel fuel (including biodiesel).
f Beginning in 2009, includes renewable diesel fuel (including biodiesel)blended into distillate fuel oil.
g Propane and propylene. Through 1983, also includes 40% of "Butane-Propane Mixtures."
h Ethane, propane, normal butane, isobutane, and refinery olefins (ethylene,propylene, butylene, and isobutylene).
i Beginning in 1965, includes kerosene-type jet fuel. (Through 1964,kerosene-type jet fuel is included with kerosene in "Other Products.") For1952–2004, also includes naphtha-type jet fuel. (Through 1951, naphtha-type jet
fuel is included in the products from which it was blended—gasoline, kerosene, anddistillate fuel oil. Beginning in 2005, naphtha-type jet fuel is included in "OtherProducts.")
j Finished motor gasoline. Through 1963, also includes aviation gasoline andspecial naphthas. Beginning in 1993, also includes fuel ethanol blended into motorgasoline.
k Asphalt and road oil, kerosene, lubricants, petrochemical feedstocks,petroleum coke, still gas (refinery gas), waxes, and miscellaneous products.Through 1964, also includes kerosene-type jet fuel. Beginning in 1964, alsoincludes finished aviation gasoline and special naphthas. Beginning in 2005, alsoincludes naphtha-type jet fuel.
R=Revised. E=Estimate. F=Forecast. NA=Not available. Notes: • Totals may not equal sum of components due to independent
rounding. • Geographic coverage is the 50 states and the District of Columbia.Web Page: See http://www.eia.gov/totalenergy/data/monthly/#petroleum (Excel
and CSV files) for all available annual data beginning in 1949 and monthly databeginning in 1973.
Sources: See end of section.
February 2019 monthly data from the Weekly Petroleum Status Report
were not available in time for this publication.

60 U. S. Energy Information Administration / Monthly Energy Review March 2019
Figure 3.3a Petroleum Trade: Overview
1.22.5
9.08.2
0.8
20.5
0
5
10
15
20
25
Imports from PersianGulf
Imports from OPEC Total Imports Exports Net Imports Products Supplied
Mill
ion B
arr
els
per
Day
Overview, December 2018
Persian Gulf
OPEC
0
20
40
60
80
1960 1965 1970 1975 1980 1985 1990 1995 2000 2005 2010 2015
Perc
ent
Imports From OPEC and Persian Gulf as Share of Total Imports, 1960–2018
0
25
50
75
1950 1955 1960 1965 1970 1975 1980 1985 1990 1995 2000 2005 2010 2015
Perc
ent
Net Imports as Share of Products Supplied, 1949–2018
Note: OPEC=Organization of the Petroleum Exporting Countries.
Web Page: http://www.eia.gov/totalenergy/data/monthly/#petroleum.
Source: Table 3.3a.

U. S. Energy Information Administration / Monthly Energy Review March 2019 61
Table 3.3a Petroleum Trade: Overview
ImportsFrom
PersianGulfa
ImportsFrom
OPECb Imports ExportsNet
ImportsProductsSupplied
As Share ofProducts Supplied
As Share ofTotal Imports
ImportsFrom
PersianGulfa
ImportsFrom
OPECb ImportsNet
Imports
ImportsFrom
PersianGulfa
ImportsFrom
OPECb
Thousand Barrels per Day Percent
1950 Average .................... NA NA 850 305 545 6,458 NA NA 13.2 8.4 NA NA1955 Average .................... NA NA 1,248 368 880 8,455 NA NA 14.8 10.4 NA NA1960 Average .................... 326 1,233 1,815 202 1,613 9,797 3.3 12.6 18.5 16.5 17.9 68.01965 Average .................... 359 1,439 2,468 187 2,281 11,512 3.1 12.5 21.4 19.8 14.5 58.31970 Average .................... 184 1,294 3,419 259 3,161 14,697 1.3 8.8 23.3 21.5 5.4 37.81975 Average .................... 1,165 3,601 6,056 209 5,846 16,322 7.1 22.1 37.1 35.8 19.2 59.51980 Average .................... 1,519 4,300 6,909 544 6,365 17,056 8.9 25.2 40.5 37.3 22.0 62.21985 Average .................... 311 1,830 5,067 781 4,286 15,726 2.0 11.6 32.2 27.3 6.1 36.11990 Average .................... 1,966 4,296 8,018 857 7,161 16,988 11.6 25.3 47.2 42.2 24.5 53.61995 Average .................... 1,573 4,002 8,835 949 7,886 17,725 8.9 22.6 49.8 44.5 17.8 45.32000 Average .................... 2,488 5,203 11,459 1,040 10,419 19,701 12.6 26.4 58.2 52.9 21.7 45.42001 Average .................... 2,761 5,528 11,871 971 10,900 19,649 14.1 28.1 60.4 55.5 23.3 46.62002 Average .................... 2,269 4,605 11,530 984 10,546 19,761 11.5 23.3 58.3 53.4 19.7 39.92003 Average .................... 2,501 5,162 12,264 1,027 11,238 20,034 12.5 25.8 61.2 56.1 20.4 42.12004 Average .................... 2,493 5,701 13,145 1,048 12,097 20,731 12.0 27.5 63.4 58.4 19.0 43.42005 Average .................... 2,334 5,587 13,714 1,165 12,549 20,802 11.2 26.9 65.9 60.3 17.0 40.72006 Average .................... 2,211 5,517 13,707 1,317 12,390 20,687 10.7 26.7 66.3 59.9 16.1 40.22007 Average .................... 2,163 5,980 13,468 1,433 12,036 20,680 10.5 28.9 65.1 58.2 16.1 44.42008 Average .................... 2,370 5,954 12,915 1,802 11,114 19,498 12.2 30.5 66.2 57.0 18.4 46.12009 Average .................... 1,689 4,776 11,691 2,024 9,667 18,771 9.0 25.4 62.3 51.5 14.4 40.92010 Average .................... 1,711 4,906 11,793 2,353 9,441 19,180 8.9 25.6 61.5 49.2 14.5 41.62011 Average .................... 1,861 4,555 11,436 2,986 8,450 18,887 9.9 24.1 60.6 44.7 16.3 39.82012 Average .................... 2,156 4,271 10,598 3,205 7,393 18,487 11.7 23.1 57.3 40.0 20.3 40.32013 Average .................... 2,009 3,720 9,859 3,621 6,237 18,967 10.6 19.6 52.0 32.9 20.4 37.72014 Average .................... 1,875 3,237 9,241 4,176 5,065 19,100 9.8 16.9 48.4 26.5 20.3 35.02015 Average .................... 1,507 2,894 9,449 4,738 4,711 19,534 7.7 14.8 48.4 24.1 15.9 30.62016 Average .................... 1,766 3,446 10,055 5,261 4,795 19,687 9.0 17.5 51.1 24.4 17.6 34.3
2017 January ...................... 2,085 3,793 10,745 5,645 5,101 19,323 10.8 19.6 55.6 26.4 19.4 35.3 February .................... 2,013 3,445 10,033 6,461 3,573 19,190 10.5 18.0 52.3 18.6 20.1 34.3 March ......................... 1,956 3,593 10,184 6,054 4,130 20,060 9.8 17.9 50.8 20.6 19.2 35.3 April ........................... 2,100 3,743 10,322 6,277 4,045 19,595 10.7 19.1 52.7 20.6 20.3 36.3 May ............................ 1,968 3,669 10,729 6,232 4,498 20,066 9.8 18.3 53.5 22.4 18.3 34.2 June ........................... 1,836 3,567 10,325 6,252 4,073 20,561 8.9 17.3 50.2 19.8 17.8 34.5 July ............................ 1,796 3,399 9,954 6,291 3,663 20,119 8.9 16.9 49.5 18.2 18.0 34.1 August ....................... 1,345 3,163 10,112 5,665 4,447 20,251 6.6 15.6 49.9 22.0 13.3 31.3 September ................. 1,370 2,880 9,752 6,289 3,464 19,641 7.0 14.7 49.7 17.6 14.1 29.5 October ...................... 1,491 3,154 9,741 7,086 2,655 19,990 7.5 15.8 48.7 13.3 15.3 32.4 November .................. 1,555 3,044 9,876 7,144 2,732 20,307 7.7 15.0 48.6 13.5 15.7 30.8 December .................. 1,460 2,939 9,935 7,136 2,799 20,323 7.2 14.5 48.9 13.8 14.7 29.6 Average .................... 1,746 3,366 10,144 6,376 3,768 19,958 8.7 16.9 50.8 18.9 17.2 33.2
2018 January ...................... 1,591 3,009 10,274 6,615 3,659 20,461 7.8 14.7 50.2 17.9 15.5 29.3 February .................... 1,554 2,740 9,580 6,844 2,736 19,619 7.9 14.0 48.8 13.9 16.2 28.6 March ......................... 1,738 2,843 9,821 7,105 2,716 20,573 8.4 13.8 47.7 13.2 17.7 29.0 April ........................... 1,899 3,523 10,364 7,730 2,634 19,941 9.5 17.7 52.0 13.2 18.3 34.0 May ............................ 1,573 2,737 10,228 7,517 2,712 20,357 7.7 13.4 50.2 13.3 15.4 26.8 June ........................... 1,487 3,041 10,706 7,801 2,905 20,705 7.2 14.7 51.7 14.0 13.9 28.4 July ............................ 1,489 2,971 10,176 7,827 2,349 20,621 7.2 14.4 49.3 11.4 14.6 29.2 August ....................... 1,599 2,857 10,432 7,043 3,389 21,302 7.5 13.4 49.0 15.9 15.3 27.4 September ................. 1,645 2,996 9,885 7,611 2,273 19,951 8.2 15.0 49.5 11.4 16.6 30.3 October ...................... 1,563 2,729 9,417 8,018 1,399 20,774 7.5 13.1 45.3 6.7 16.6 29.0 November .................. 1,567 2,703 R 9,213 R 8,669 R 545 R 20,548 R 7.6 R 13.2 R 44.8 R 2.6 R 17.0 R 29.3 December .................. R 1,237 R 2,516 R 9,022 R 8,250 R 772 R 20,479 R 6.0 R 12.3 R 44.1 R 3.8 R 13.7 R 27.9 Average .................... R 1,578 R 2,888 R 9,928 R 7,588 R 2,340 R 20,453 R 7.7 R 14.1 R 48.5 R 11.4 R 15.9 R 29.1
2019 January ...................... NA NA E 9,733 E 7,369 E 2,364 E 21,101 NA NA E 46.1 E 11.2 NA NA February .................... NA NA NA NA NA NA NA NA NA NA NA NA 2-Month Average ..... NA NA NA NA NA NA NA NA NA NA NA NA
2018 2-Month Average ..... 1,574 2,881 9,945 6,723 3,221 20,062 7.8 14.4 49.6 16.1 15.8 29.02017 2-Month Average ..... 2,051 3,628 10,407 6,032 4,375 19,260 10.6 18.8 54.0 22.7 19.7 34.9
a Bahrain, Iran, Iraq, Kuwait, Qatar, Saudi Arabia, United Arab Emirates, andthe Neutral Zone (between Kuwait and Saudi Arabia).
b See "Organization of the Petroleum Exporting Countries (OPEC)" in Glossary.See Table 3.3c for notes on which countries are included in the data.
R=Revised. E=Estimate. NA=Not available. Notes: • For the feature article "Measuring Dependence on
Imported Oil," published in the August 1995 Monthly Energy Review,see http://www.eia.gov/totalenergy/data/monthly/pdf/historical/imported_oil.pdf.• Beginning in October 1977, data include Strategic Petroleum Reserve imports.See Table 3.3b. • Annual averages may not equal average of months due toindependent rounding. • U.S. geographic coverage is the 50 states and the Districtof Columbia. U.S. exports include shipments to U.S. territories, and imports include
receipts from U.S. territories.Web Page: See http://www.eia.gov/totalenergy/data/monthly/#petroleum (Excel
and CSV files) for all available annual data beginning in 1949 and monthly databeginning in 1973.
Sources: • 1949–1975: Bureau of Mines, Mineral Industry Surveys, PetroleumStatement, Annual, annual reports. • 1976–1980: U.S. Energy InformationAdministration (EIA), Energy Data Reports, Petroleum Statement, Annual, annualreports. • 1981–2017: EIA, Petroleum Supply Annual, annual reports, andunpublished revisions. • 2018 and 2019: EIA, Petroleum Supply Monthly, monthlyreports; and, for the current two months, Weekly Petroleum Status Report datasystem and Monthly Energy Review data system calculations.
February 2019 monthly data from the Weekly Petroleum Status Report
were not available in time for this publication.

62 U. S. Energy Information Administration / Monthly Energy Review March 2019
Figure 3.3b Petroleum Trade: Imports and Exports by Type (Million Barrels per Day)
Petroleum Products
Crude Oil
0
5
10
15
1950 1955 1960 1965 1970 1975 1980 1985 1990 1995 2000 2005 2010 2015
Imports Overview, 1949–2018
Crude Oil
Petroleum Products
0
2
4
6
1950 1955 1960 1965 1970 1975 1980 1985 1990 1995 2000 2005 2010 2015
Exports Overview, 1949–2018
Motor Gasoline [a]
Distillate Fuel Oil [b]
Jet Fuel [c]
Propane
Residual Fuel Oil
0.00
0.05
0.10
0.15
0.20
0.25
0.30
0.35
J F M A M J J A S O N D J F M A M J J A S O N D J F M A M J J A S O N D
2016 2017 2018
Imports, Selected Products, Monthly
Motor Gasoline [a]
Distillate Fuel Oil [b]
Jet Fuel [c]
Propane
Residual Fuel Oil
0.0
0.5
1.0
1.5
2.0
J F M A M J J A S O N D J F M A M J J A S O N D J F M A M J J A S O N D
2016 2017 2018
Exports, Selected Products, Monthly
[a] Includes fuel ethanol blended into motor gasoline.
[b] Includes renewable diesel fuel (including biodiesel) blended into
distillate fuel oil.
[c] Includes kerosene‐type jet fuel only.
Web Page: http://www.eia.gov/totalenergy/data/monthly/#petroleum.
Sources: Tables 3.3b and 3.3e.

U. S. Energy Information Administration / Monthly Energy Review March 2019 63
Table 3.3b Petroleum Trade: Imports by Type (Thousand Barrels per Day)
Crude OilaDistillateFuel Oil
Hydrocarbon Gas Liquids
JetFuele
MotorGasolinef
ResidualFuel Oil Otherg Total
Propane/Propylene
TotaldSPRb Total Propane Propylene Totalc
1950 Average .................... – – 487 7 NA NA – – e( ) (s) 329 27 8501955 Average .................... – – 782 12 NA NA – – e( ) 13 417 24 1,2481960 Average .................... – – 1,015 35 NA NA NA 4 34 27 637 62 1,8151965 Average .................... – – 1,238 36 NA NA NA 21 81 28 946 119 2,4681970 Average .................... – – 1,324 147 NA NA 26 58 144 67 1,528 150 3,4191975 Average .................... – – 4,105 155 NA NA 60 185 133 184 1,223 70 6,0561980 Average .................... 44 5,263 142 NA NA 84 226 80 140 939 120 6,9091985 Average .................... 118 3,201 200 NA NA 67 235 39 381 510 501 5,0671990 Average .................... 27 5,894 278 NA NA 115 197 108 342 504 695 8,0181995 Average .................... – 7,230 193 95 6 102 192 106 265 187 662 8,8352000 Average .................... 8 9,071 295 154 7 161 256 162 427 352 897 11,4592001 Average .................... 11 9,328 344 140 6 145 250 148 454 295 1,051 11,8712002 Average .................... 16 9,140 267 137 8 145 199 107 498 249 1,069 11,5302003 Average .................... – 9,665 333 159 9 168 271 109 518 327 1,041 12,2642004 Average .................... 77 10,088 325 198 11 209 305 127 496 426 1,377 13,1452005 Average .................... 52 10,126 329 219 14 233 374 190 603 530 1,562 13,7142006 Average .................... 8 10,118 365 201 26 228 360 186 475 350 1,854 13,7072007 Average .................... 7 10,031 304 162 20 182 276 217 413 372 1,856 13,4682008 Average .................... 19 9,783 213 162 23 185 275 103 302 349 1,891 12,9152009 Average .................... 56 9,013 225 126 21 147 194 81 223 331 1,623 11,6912010 Average .................... – 9,213 228 93 29 121 179 98 134 366 1,574 11,7932011 Average .................... – 8,935 179 82 28 110 183 69 105 328 1,637 11,4362012 Average .................... – 8,527 126 85 31 116 170 55 44 256 1,421 10,5982013 Average .................... – 7,730 155 103 24 127 182 84 45 225 1,438 9,8592014 Average .................... – 7,344 195 89 19 108 143 94 49 173 1,242 9,2412015 Average .................... – 7,363 200 104 19 124 156 132 71 192 1,335 9,4492016 Average .................... – 7,850 147 120 22 142 180 147 59 205 1,468 10,055
2017 January ...................... – 8,478 204 217 28 245 287 132 35 176 1,433 10,745 February .................... – 7,877 202 194 24 218 257 147 36 225 1,289 10,033 March ......................... – 8,165 111 140 29 169 198 123 51 221 1,314 10,184 April ........................... – 8,204 118 89 24 113 154 183 42 146 1,475 10,322 May ............................ – 8,487 125 102 21 123 169 126 37 241 1,545 10,729 June ........................... – 8,089 105 95 23 119 155 119 23 177 1,657 10,325 July ............................ – 7,915 114 87 26 113 152 140 23 174 1,436 9,954 August ....................... – 7,923 115 97 25 122 161 173 24 159 1,558 10,112 September ................. – 7,324 120 117 19 136 170 199 41 204 1,694 9,752 October ...................... – 7,681 134 125 15 139 186 230 33 151 1,327 9,741 November .................. – 7,674 180 163 20 183 223 194 10 209 1,385 9,876 December .................. – 7,782 282 176 23 198 240 151 32 187 1,261 9,935 Average .................... – 7,969 151 133 23 156 196 160 32 189 1,448 10,144
2018 January ...................... – 8,012 290 212 15 227 260 131 19 234 1,327 10,274 February .................... – 7,493 284 175 23 198 231 93 33 167 1,280 9,580 March ......................... – 7,616 157 150 23 173 217 95 38 234 1,463 9,821 April ........................... – 8,244 91 131 10 141 168 88 33 190 1,550 10,364 May ............................ – 7,825 122 114 20 135 158 150 62 259 1,654 10,228 June ........................... – 8,480 90 85 20 105 135 154 42 214 1,591 10,706 July ............................ – 7,923 144 100 20 120 156 151 35 213 1,553 10,176 August ....................... – 8,000 175 99 22 121 159 152 82 237 1,626 10,432 September ................. – 7,589 172 110 14 124 172 181 94 227 1,451 9,885 October ...................... – 7,312 161 127 15 141 192 116 42 223 1,370 9,417 November .................. – R 7,490 227 151 13 164 222 103 29 142 1,001 R 9,213 December .................. – R 7,099 R 190 R 190 R 15 R 206 R 268 R 105 R 29 R 180 R 1,152 R 9,022 Average .................... – R 7,757 R 175 R 137 R 17 R 154 R 195 R 127 R 45 R 211 R 1,420 R 9,928
2019 January ...................... – E 7,522 E 325 NA NA E 219 NA E 129 E 33 E 184 NA E 9,733 February .................... NA NA NA NA NA NA NA NA NA NA NA NA 2-Month Average ..... NA NA NA NA NA NA NA NA NA NA NA NA
2018 2-Month Average ..... – 7,766 287 194 19 213 246 113 25 202 1,305 9,9452017 2-Month Average ..... – 8,193 203 206 26 232 273 139 36 199 1,365 10,407
a Includes lease condensate.b "SPR" is the Strategic Petroleum Reserve, which began in October 1977.
Through 2003, includes crude oil imports by SPR only; beginning in 2004, includescrude oil imports by SPR, and crude oil imports into SPR by others.
c Propane and propylene. Through 1983, also includes 40% of "Butane-Propane Mixtures" and 30% of "Ethane-Propane Mixtures."
d Ethane, propane, normal butane, isobutane, natural gasoline (pentanes plus),and refinery olefins (ethylene, propylene, butylene, and isobutylene). Through1983, also includes plant condensate and unfractionated stream.
e Beginning in 1965, includes kerosene-type jet fuel. (Through 1964,kerosene-type jet fuel is included with kerosene in "Other.") For 1956–2004, alsoincludes naphtha-type jet fuel. (Through 1955, naphtha-type jet fuel is included in"Motor Gasoline." Beginning in 2005, naphtha-type jet fuel is included in "Other.")
f Finished motor gasoline. Through 1955, also includes naphtha-type jet fuel.Through 1963, also includes aviation gasoline and special naphthas. Through1980, also includes motor gasoline blending components.
g Asphalt and road oil, aviation gasoline blending components, kerosene,lubricants, petrochemical feedstocks, petroleum coke, unfinished oils, waxes, other
hydrocarbons and oxygenates, and miscellaneous products. Through 1964, alsoincludes kerosene-type jet fuel. Beginning in 1964, also includes finished aviationgasoline and special naphthas. Beginning in 1981, also includes motor gasolineblending components. Beginning in 2005, also includes naphtha-type jet fuel.
R=Revised. E=Estimate. NA=Not available. – – =Not applicable. – =No datareported. (s)=Less than 500 barrels per day.
Notes: • Totals may not equal sum of components due to independentrounding. • Geographic coverage is the 50 states and the District of Columbia.
Web Page: See http://www.eia.gov/totalenergy/data/monthly/#petroleum (Exceland CSV files) for all available annual data beginning in 1949 and monthly databeginning in 1973.
Sources: • 1949–1975: Bureau of Mines, Mineral Industry Surveys, PetroleumStatement, Annual, annual reports. • 1976–1980: U.S. Energy InformationAdministration (EIA), Energy Data Reports, Petroleum Statement, Annual, annualreports. • 1981–2017: EIA, Petroleum Supply Annual, annual reports, andunpublished revisions. • 2018 and 2019: EIA, Petroleum Supply Monthly, monthlyreports; and, for the current two months, Weekly Petroleum Status Report datasystem and Monthly Energy Review data system calculations.
February 2019 monthly data from the Weekly Petroleum Status Report
were not available in time for this publication.
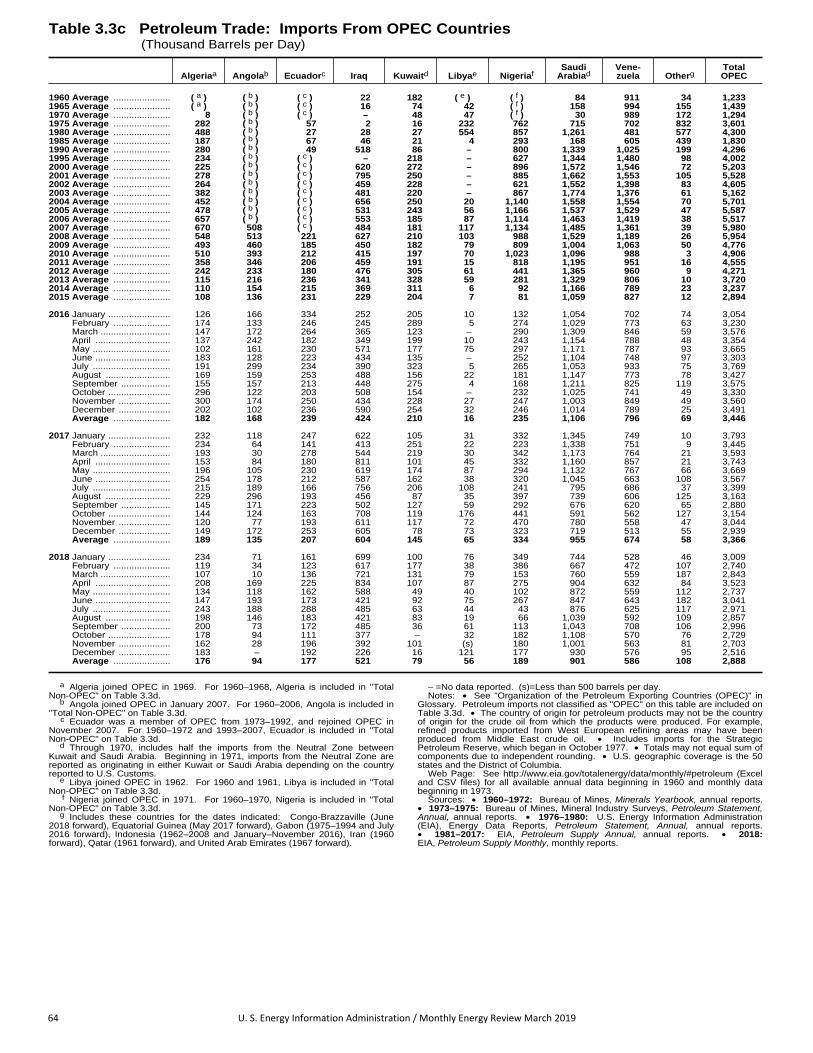
64 U. S. Energy Information Administration / Monthly Energy Review March 2019
Table 3.3c Petroleum Trade: Imports From OPEC Countries (Thousand Barrels per Day)
Algeriaa Angolab Ecuadorc Iraq Kuwaitd Libyae NigeriafSaudi
ArabiadVene-zuela Otherg
TotalOPEC
1960 Average ...................... a( ) b( ) c( ) 22 182 e( ) f( ) 84 911 34 1,2331965 Average ...................... a( ) b( ) c( ) 16 74 42 f( ) 158 994 155 1,4391970 Average ...................... 8 b( ) c( ) – 48 47 f( ) 30 989 172 1,2941975 Average ...................... 282 b( ) 57 2 16 232 762 715 702 832 3,6011980 Average ...................... 488 b( ) 27 28 27 554 857 1,261 481 577 4,3001985 Average ...................... 187 b( ) 67 46 21 4 293 168 605 439 1,8301990 Average ...................... 280 b( ) 49 518 86 – 800 1,339 1,025 199 4,2961995 Average ...................... 234 b( ) c( ) – 218 – 627 1,344 1,480 98 4,0022000 Average ...................... 225 b( ) c( ) 620 272 – 896 1,572 1,546 72 5,2032001 Average ...................... 278 b( ) c( ) 795 250 – 885 1,662 1,553 105 5,5282002 Average ...................... 264 b( ) c( ) 459 228 – 621 1,552 1,398 83 4,6052003 Average ...................... 382 b( ) c( ) 481 220 – 867 1,774 1,376 61 5,1622004 Average ...................... 452 b( ) c( ) 656 250 20 1,140 1,558 1,554 70 5,7012005 Average ...................... 478 b( ) c( ) 531 243 56 1,166 1,537 1,529 47 5,5872006 Average ...................... 657 b( ) c( ) 553 185 87 1,114 1,463 1,419 38 5,5172007 Average ...................... 670 508 c( ) 484 181 117 1,134 1,485 1,361 39 5,9802008 Average ...................... 548 513 221 627 210 103 988 1,529 1,189 26 5,9542009 Average ...................... 493 460 185 450 182 79 809 1,004 1,063 50 4,7762010 Average ...................... 510 393 212 415 197 70 1,023 1,096 988 3 4,9062011 Average ...................... 358 346 206 459 191 15 818 1,195 951 16 4,5552012 Average ...................... 242 233 180 476 305 61 441 1,365 960 9 4,2712013 Average ...................... 115 216 236 341 328 59 281 1,329 806 10 3,7202014 Average ...................... 110 154 215 369 311 6 92 1,166 789 23 3,2372015 Average ...................... 108 136 231 229 204 7 81 1,059 827 12 2,894
2016 January ........................ 126 166 334 252 205 10 132 1,054 702 74 3,054 February ...................... 174 133 246 245 289 5 274 1,029 773 63 3,230 March ........................... 147 172 264 365 123 – 290 1,309 846 59 3,576 April ............................. 137 242 182 349 199 10 243 1,154 788 48 3,354 May .............................. 102 161 230 571 177 75 297 1,171 787 93 3,665 June ............................. 183 128 223 434 135 – 252 1,104 748 97 3,303 July .............................. 191 299 234 390 323 5 265 1,053 933 75 3,769 August ......................... 169 159 253 488 156 22 181 1,147 773 78 3,427 September ................... 155 157 213 448 275 4 168 1,211 825 119 3,575 October ........................ 296 122 203 508 154 – 232 1,025 741 49 3,330 November .................... 300 174 250 434 228 27 247 1,003 849 49 3,560 December .................... 202 102 236 590 254 32 246 1,014 789 25 3,491 Average ...................... 182 168 239 424 210 16 235 1,106 796 69 3,446
2017 January ........................ 232 118 247 622 105 31 332 1,345 749 10 3,793 February ...................... 234 64 141 413 251 22 223 1,338 751 9 3,445 March ........................... 193 30 278 544 219 30 342 1,173 764 21 3,593 April ............................. 153 84 180 811 101 45 332 1,160 857 21 3,743 May .............................. 196 105 230 619 174 87 294 1,132 767 66 3,669 June ............................. 254 178 212 587 162 38 320 1,045 663 108 3,567 July .............................. 215 189 166 756 206 108 241 795 686 37 3,399 August ......................... 229 296 193 456 87 35 397 739 606 125 3,163 September ................... 145 171 223 502 127 59 292 676 620 65 2,880 October ........................ 144 124 163 708 119 176 441 591 562 127 3,154 November .................... 120 77 193 611 117 72 470 780 558 47 3,044 December .................... 149 172 253 605 78 73 323 719 513 55 2,939 Average ...................... 189 135 207 604 145 65 334 955 674 58 3,366
2018 January ........................ 234 71 161 699 100 76 349 744 528 46 3,009 February ...................... 119 34 123 617 177 38 386 667 472 107 2,740 March ........................... 107 10 136 721 131 79 153 760 559 187 2,843 April ............................. 208 169 225 834 107 87 275 904 632 84 3,523 May .............................. 134 118 162 588 49 40 102 872 559 112 2,737 June ............................. 147 193 173 421 92 75 267 847 643 182 3,041 July .............................. 243 188 288 485 63 44 43 876 625 117 2,971 August ......................... 198 146 183 421 83 19 66 1,039 592 109 2,857 September ................... 200 73 172 485 36 61 113 1,043 708 106 2,996 October ........................ 178 94 111 377 – 32 182 1,108 570 76 2,729 November .................... 162 28 196 392 101 (s) 180 1,001 563 81 2,703 December .................... 183 – 192 226 16 121 177 930 576 95 2,516 Average ...................... 176 94 177 521 79 56 189 901 586 108 2,888
a Algeria joined OPEC in 1969. For 1960–1968, Algeria is included in "TotalNon-OPEC" on Table 3.3d.
b Angola joined OPEC in January 2007. For 1960–2006, Angola is included in"Total Non-OPEC" on Table 3.3d.
c Ecuador was a member of OPEC from 1973–1992, and rejoined OPEC inNovember 2007. For 1960–1972 and 1993–2007, Ecuador is included in "TotalNon-OPEC" on Table 3.3d.
d Through 1970, includes half the imports from the Neutral Zone betweenKuwait and Saudi Arabia. Beginning in 1971, imports from the Neutral Zone arereported as originating in either Kuwait or Saudi Arabia depending on the countryreported to U.S. Customs.
e Libya joined OPEC in 1962. For 1960 and 1961, Libya is included in "TotalNon-OPEC" on Table 3.3d.
f Nigeria joined OPEC in 1971. For 1960–1970, Nigeria is included in "TotalNon-OPEC" on Table 3.3d.
g Includes these countries for the dates indicated: Congo-Brazzaville (June2018 forward), Equatorial Guinea (May 2017 forward), Gabon (1975–1994 and July2016 forward), Indonesia (1962–2008 and January–November 2016), Iran (1960forward), Qatar (1961 forward), and United Arab Emirates (1967 forward).
– =No data reported. (s)=Less than 500 barrels per day. Notes: • See "Organization of the Petroleum Exporting Countries (OPEC)" in
Glossary. Petroleum imports not classified as "OPEC" on this table are included onTable 3.3d. • The country of origin for petroleum products may not be the countryof origin for the crude oil from which the products were produced. For example,refined products imported from West European refining areas may have beenproduced from Middle East crude oil. • Includes imports for the StrategicPetroleum Reserve, which began in October 1977. • Totals may not equal sum ofcomponents due to independent rounding. • U.S. geographic coverage is the 50states and the District of Columbia.
Web Page: See http://www.eia.gov/totalenergy/data/monthly/#petroleum (Exceland CSV files) for all available annual data beginning in 1960 and monthly databeginning in 1973.
Sources: • 1960–1972: Bureau of Mines, Minerals Yearbook, annual reports.• 1973–1975: Bureau of Mines, Mineral Industry Surveys, Petroleum Statement,Annual, annual reports. • 1976–1980: U.S. Energy Information Administration(EIA), Energy Data Reports, Petroleum Statement, Annual, annual reports.• 1981–2017: EIA, Petroleum Supply Annual, annual reports. • 2018:EIA, Petroleum Supply Monthly, monthly reports.

U. S. Energy Information Administration / Monthly Energy Review March 2019 65
Table 3.3d Petroleum Trade: Imports From Non-OPEC Countries (Thousand Barrels per Day)
Brazil Canada Colombia MexicoNether-lands Norway Russiaa
UnitedKingdom
U.S. VirginIslands Other
TotalNon-OPEC
1960 Average ...................... 1 120 42 16 NA NA – (s) NA NA 5811965 Average ...................... – 323 51 48 1 – – (s) – 606 1,0291970 Average ...................... 2 766 46 42 39 – 3 11 189 1,027 2,1261975 Average ...................... 5 846 9 71 19 17 14 14 406 1,052 2,4541980 Average ...................... 3 455 4 533 2 144 1 176 388 903 2,6091985 Average ...................... 61 770 23 816 58 32 8 310 247 913 3,2371990 Average ...................... 49 934 182 755 55 102 45 189 282 1,128 3,7211995 Average ...................... 8 1,332 219 1,068 15 273 25 383 278 1,233 4,8332000 Average ...................... 51 1,807 342 1,373 30 343 72 366 291 1,581 6,2572001 Average ...................... 82 1,828 296 1,440 43 341 90 324 268 1,631 6,3432002 Average ...................... 116 1,971 260 1,547 66 393 210 478 236 1,649 6,9252003 Average ...................... 108 2,072 195 1,623 87 270 254 440 288 1,766 7,1032004 Average ...................... 104 2,138 176 1,665 101 244 298 380 330 2,008 7,4442005 Average ...................... 156 2,181 196 1,662 151 233 410 396 328 2,413 8,1272006 Average ...................... 193 2,353 155 1,705 174 196 369 272 328 2,446 8,1902007 Average ...................... 200 2,455 155 1,532 128 142 414 277 346 1,839 7,4892008 Average ...................... 258 2,493 200 1,302 168 102 465 236 320 1,416 6,9612009 Average ...................... 309 2,479 276 1,210 140 108 563 245 277 1,307 6,9152010 Average ...................... 272 2,535 365 1,284 108 89 612 256 253 1,112 6,8872011 Average ...................... 253 2,729 433 1,206 100 113 624 159 186 1,077 6,8812012 Average ...................... 226 2,946 433 1,035 99 75 477 149 12 874 6,3272013 Average ...................... 151 3,142 389 919 89 54 460 147 – 786 6,1382014 Average ...................... 160 3,388 318 842 85 45 330 117 – 720 6,0042015 Average ...................... 215 3,765 395 758 57 61 371 123 – 811 6,554
2016 January ........................ 168 4,084 499 710 57 58 395 115 – 566 6,653 February ...................... 148 4,211 507 539 73 61 436 71 – 790 6,836 March ........................... 112 3,870 569 657 30 143 329 141 – 574 6,425 April ............................. 160 3,549 386 788 54 89 509 149 – 784 6,468 May .............................. 110 3,548 570 676 63 44 435 106 – 964 6,516 June ............................. 200 3,437 583 739 59 113 485 168 1 966 6,751 July .............................. 158 3,451 536 733 43 109 539 92 – 1,102 6,763 August ......................... 274 3,809 534 672 31 49 499 141 – 886 6,895 September ................... 154 3,784 500 595 67 124 421 132 – 850 6,624 October ........................ 199 3,587 346 614 107 75 491 89 – 861 6,369 November .................... 189 4,032 368 697 74 38 419 137 – 779 6,732 December .................... 126 4,017 397 606 60 11 334 121 – 631 6,302 Average ...................... 167 3,780 483 669 60 76 441 122 (s) 812 6,610
2017 January ........................ 206 4,285 345 730 75 134 361 143 – 673 6,952 February ...................... 240 4,098 401 607 80 34 331 96 – 700 6,588 March ........................... 229 4,147 338 630 48 12 379 120 – 689 6,590 April ............................. 168 3,892 417 680 62 86 308 123 – 844 6,579 May .............................. 132 4,159 424 810 49 73 401 167 – 847 7,061 June ............................. 202 3,837 334 784 72 122 503 126 – 779 6,759 July .............................. 376 3,824 357 668 45 64 358 113 – 752 6,555 August ......................... 258 4,023 388 581 74 186 448 67 – 924 6,950 September ................... 250 3,984 374 430 93 118 450 149 – 1,024 6,872 October ........................ 230 3,976 270 654 51 71 355 83 – 897 6,587 November .................... 228 4,046 337 841 43 38 384 61 – 854 6,832 December .................... 166 4,373 363 767 59 7 389 88 – 784 6,995 Average ...................... 224 4,054 362 682 62 79 389 111 – 814 6,778
2018 January ........................ 272 4,424 512 669 69 57 386 80 – 797 7,265 February ...................... 187 4,259 477 713 51 56 297 110 – 692 6,840 March ........................... 84 4,191 364 784 91 90 356 94 – 925 6,978 April ............................. 184 4,269 282 632 64 122 243 205 – 840 6,841 May .............................. 123 4,452 437 608 80 72 491 180 – 1,049 7,492 June ............................. 283 4,545 240 876 53 85 439 151 – 994 7,665 July .............................. 179 4,157 319 681 43 166 454 164 – 1,041 7,205 August ......................... 248 4,233 334 935 67 39 515 175 – 1,028 7,575 September ................... 77 4,034 229 771 44 74 519 207 – 935 6,889 October ........................ 230 4,144 229 718 89 138 271 106 – 763 6,688 November .................... 93 R 4,327 259 601 49 136 254 155 – 638 R 6,510 December .................... 92 4,279 333 635 49 94 271 132 – 620 6,506 Average ...................... 171 4,276 334 719 63 94 375 146 – 862 7,040
a Through 1992, may include imports from republics other than Russia in theformer U.S.S.R. See "Union of Soviet Socialist Republics (U.S.S.R.)" in Glossary.
R=Revised. NA=Not available. – =No data reported. (s)=Less than 500 barrelsper day.
Notes: • See "Organization of the Petroleum Exporting Countries (OPEC)" inGlossary. Petroleum imports not classified as "OPEC" on Table 3.3c are includedon this table. • The country of origin for petroleum products may not be the countryof origin for the crude oil from which the products were produced. For example,refined products imported from West European refining areas may have beenproduced from Middle East crude oil. • Includes imports for the StrategicPetroleum Reserve, which began in October 1977. • Totals may not equal sum of
components due to independent rounding. • U.S. geographic coverage is the 50states and the District of Columbia.
Web Page: See http://www.eia.gov/totalenergy/data/monthly/#petroleum (Exceland CSV files) for all available annual data beginning in 1960 and monthly databeginning in 1973.
Sources: • 1960–1972: Bureau of Mines, Minerals Yearbook, annual reports.• 1973–1975: Bureau of Mines, Mineral Industry Surveys, Petroleum Statement,Annual, annual reports. • 1976–1980: U.S. Energy Information Administration(EIA), Energy Data Reports, Petroleum Statement, Annual, annual reports.• 1981–2017: EIA, Petroleum Supply Annual, annual reports. • 2018:EIA, Petroleum Supply Monthly, monthly reports.
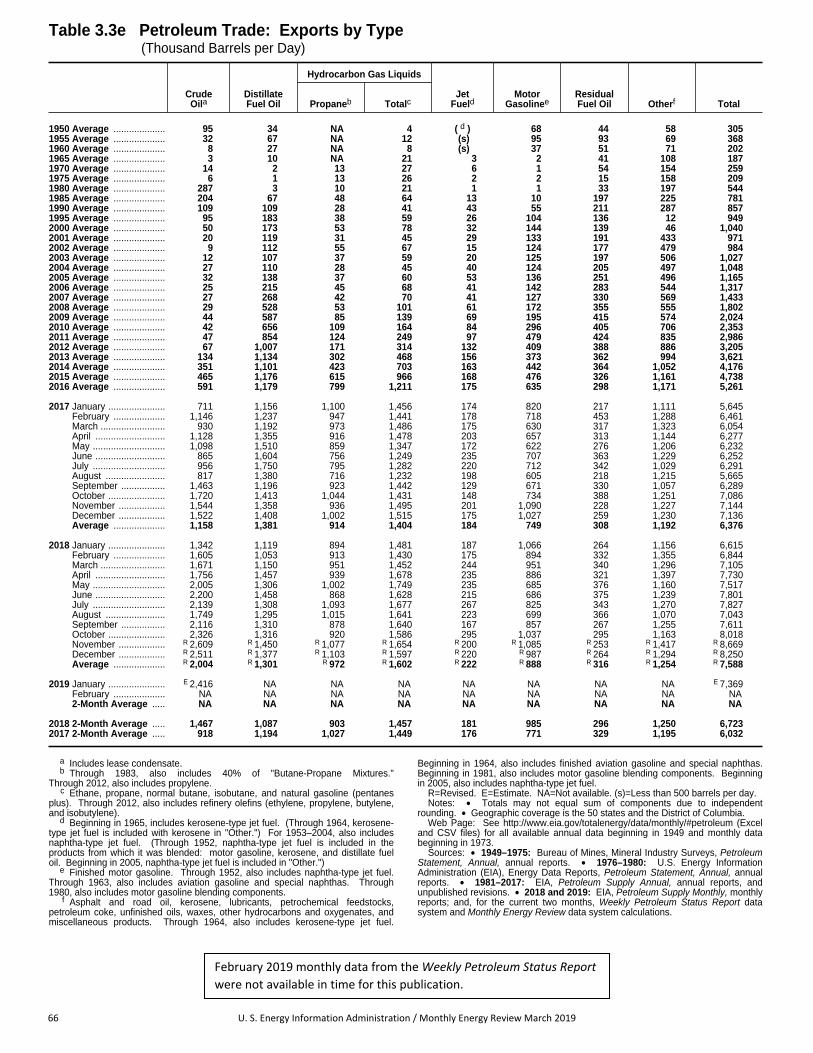
66 U. S. Energy Information Administration / Monthly Energy Review March 2019
Table 3.3e Petroleum Trade: Exports by Type (Thousand Barrels per Day)
CrudeOila
DistillateFuel Oil
Hydrocarbon Gas Liquids
JetFueld
MotorGasolinee
ResidualFuel Oil Otherf TotalPropaneb Totalc
1950 Average .................... 95 34 NA 4 d( ) 68 44 58 3051955 Average .................... 32 67 NA 12 (s) 95 93 69 3681960 Average .................... 8 27 NA 8 (s) 37 51 71 2021965 Average .................... 3 10 NA 21 3 2 41 108 1871970 Average .................... 14 2 13 27 6 1 54 154 2591975 Average .................... 6 1 13 26 2 2 15 158 2091980 Average .................... 287 3 10 21 1 1 33 197 5441985 Average .................... 204 67 48 64 13 10 197 225 7811990 Average .................... 109 109 28 41 43 55 211 287 8571995 Average .................... 95 183 38 59 26 104 136 12 9492000 Average .................... 50 173 53 78 32 144 139 46 1,0402001 Average .................... 20 119 31 45 29 133 191 433 9712002 Average .................... 9 112 55 67 15 124 177 479 9842003 Average .................... 12 107 37 59 20 125 197 506 1,0272004 Average .................... 27 110 28 45 40 124 205 497 1,0482005 Average .................... 32 138 37 60 53 136 251 496 1,1652006 Average .................... 25 215 45 68 41 142 283 544 1,3172007 Average .................... 27 268 42 70 41 127 330 569 1,4332008 Average .................... 29 528 53 101 61 172 355 555 1,8022009 Average .................... 44 587 85 139 69 195 415 574 2,0242010 Average .................... 42 656 109 164 84 296 405 706 2,3532011 Average .................... 47 854 124 249 97 479 424 835 2,9862012 Average .................... 67 1,007 171 314 132 409 388 886 3,2052013 Average .................... 134 1,134 302 468 156 373 362 994 3,6212014 Average .................... 351 1,101 423 703 163 442 364 1,052 4,1762015 Average .................... 465 1,176 615 966 168 476 326 1,161 4,7382016 Average .................... 591 1,179 799 1,211 175 635 298 1,171 5,261
2017 January ...................... 711 1,156 1,100 1,456 174 820 217 1,111 5,645 February .................... 1,146 1,237 947 1,441 178 718 453 1,288 6,461 March ......................... 930 1,192 973 1,486 175 630 317 1,323 6,054 April ........................... 1,128 1,355 916 1,478 203 657 313 1,144 6,277 May ............................ 1,098 1,510 859 1,347 172 622 276 1,206 6,232 June ........................... 865 1,604 756 1,249 235 707 363 1,229 6,252 July ............................ 956 1,750 795 1,282 220 712 342 1,029 6,291 August ....................... 817 1,380 716 1,232 198 605 218 1,215 5,665 September ................. 1,463 1,196 923 1,442 129 671 330 1,057 6,289 October ...................... 1,720 1,413 1,044 1,431 148 734 388 1,251 7,086 November .................. 1,544 1,358 936 1,495 201 1,090 228 1,227 7,144 December .................. 1,522 1,408 1,002 1,515 175 1,027 259 1,230 7,136 Average .................... 1,158 1,381 914 1,404 184 749 308 1,192 6,376
2018 January ...................... 1,342 1,119 894 1,481 187 1,066 264 1,156 6,615 February .................... 1,605 1,053 913 1,430 175 894 332 1,355 6,844 March ......................... 1,671 1,150 951 1,452 244 951 340 1,296 7,105 April ........................... 1,756 1,457 939 1,678 235 886 321 1,397 7,730 May ............................ 2,005 1,306 1,002 1,749 235 685 376 1,160 7,517 June ........................... 2,200 1,458 868 1,628 215 686 375 1,239 7,801 July ............................ 2,139 1,308 1,093 1,677 267 825 343 1,270 7,827 August ....................... 1,749 1,295 1,015 1,641 223 699 366 1,070 7,043 September ................. 2,116 1,310 878 1,640 167 857 267 1,255 7,611 October ...................... 2,326 1,316 920 1,586 295 1,037 295 1,163 8,018 November .................. R 2,609 R 1,450 R 1,077 R 1,654 R 200 R 1,085 R 253 R 1,417 R 8,669 December .................. R 2,511 R 1,377 R 1,103 R 1,597 R 220 R 987 R 264 R 1,294 R 8,250 Average .................... R 2,004 R 1,301 R 972 R 1,602 R 222 R 888 R 316 R 1,254 R 7,588
2019 January ...................... E 2,416 NA NA NA NA NA NA NA E 7,369 February .................... NA NA NA NA NA NA NA NA NA 2-Month Average ..... NA NA NA NA NA NA NA NA NA
2018 2-Month Average ..... 1,467 1,087 903 1,457 181 985 296 1,250 6,7232017 2-Month Average ..... 918 1,194 1,027 1,449 176 771 329 1,195 6,032
a Includes lease condensate.b Through 1983, also includes 40% of "Butane-Propane Mixtures."
Through 2012, also includes propylene.c Ethane, propane, normal butane, isobutane, and natural gasoline (pentanes
plus). Through 2012, also includes refinery olefins (ethylene, propylene, butylene,and isobutylene).
d Beginning in 1965, includes kerosene-type jet fuel. (Through 1964, kerosene-type jet fuel is included with kerosene in "Other.") For 1953–2004, also includesnaphtha-type jet fuel. (Through 1952, naphtha-type jet fuel is included in theproducts from which it was blended: motor gasoline, kerosene, and distillate fueloil. Beginning in 2005, naphtha-type jet fuel is included in "Other.")
e Finished motor gasoline. Through 1952, also includes naphtha-type jet fuel.Through 1963, also includes aviation gasoline and special naphthas. Through1980, also includes motor gasoline blending components.
f Asphalt and road oil, kerosene, lubricants, petrochemical feedstocks,petroleum coke, unfinished oils, waxes, other hydrocarbons and oxygenates, andmiscellaneous products. Through 1964, also includes kerosene-type jet fuel.
Beginning in 1964, also includes finished aviation gasoline and special naphthas.Beginning in 1981, also includes motor gasoline blending components. Beginningin 2005, also includes naphtha-type jet fuel.
R=Revised. E=Estimate. NA=Not available. (s)=Less than 500 barrels per day. Notes: • Totals may not equal sum of components due to independent
rounding. • Geographic coverage is the 50 states and the District of Columbia.Web Page: See http://www.eia.gov/totalenergy/data/monthly/#petroleum (Excel
and CSV files) for all available annual data beginning in 1949 and monthly databeginning in 1973.
Sources: • 1949–1975: Bureau of Mines, Mineral Industry Surveys, PetroleumStatement, Annual, annual reports. • 1976–1980: U.S. Energy InformationAdministration (EIA), Energy Data Reports, Petroleum Statement, Annual, annualreports. • 1981–2017: EIA, Petroleum Supply Annual, annual reports, andunpublished revisions. • 2018 and 2019: EIA, Petroleum Supply Monthly, monthlyreports; and, for the current two months, Weekly Petroleum Status Report datasystem and Monthly Energy Review data system calculations.
February 2019 monthly data from the Weekly Petroleum Status Report
were not available in time for this publication.

U. S. Energy Information Administration / Monthly Energy Review March 2019 67
Table 3.3f Petroleum Trade: Exports by Country of Destination (Thousand Barrels per Day)
Brazil Canada China India Japan MexicoNether-lands
Singa-pore
SouthKorea
UnitedKingdom Other Total
1960 Average ...................... 4 34 NA NA 62 18 6 NA NA 12 NA 2021965 Average ...................... 3 26 NA NA 40 27 10 NA NA 12 NA 1871970 Average ...................... 7 31 NA NA 69 33 15 NA NA 12 NA 2591975 Average ...................... 6 22 NA 1 27 42 23 NA NA 7 NA 2091980 Average ...................... 4 108 – 1 32 28 23 6 2 7 335 5441985 Average ...................... 3 74 – 2 108 61 44 24 27 14 424 7811990 Average ...................... 2 91 – 6 92 89 54 15 60 11 438 8571995 Average ...................... 16 73 2 3 76 125 33 46 57 14 505 9492000 Average ...................... 28 110 3 3 90 358 42 36 20 10 342 1,0402001 Average ...................... 23 112 6 3 62 274 45 67 14 13 352 9712002 Average ...................... 26 106 14 3 74 254 23 81 11 12 380 9842003 Average ...................... 27 141 24 7 69 228 15 51 10 6 447 1,0272004 Average ...................... 27 158 13 11 63 209 36 41 12 14 464 1,0482005 Average ...................... 39 181 12 11 56 268 25 43 16 21 492 1,1652006 Average ...................... 42 159 11 8 58 255 83 45 21 28 607 1,3172007 Average ...................... 46 189 14 14 54 279 81 71 16 9 660 1,4332008 Average ...................... 54 264 13 10 54 333 131 77 18 17 830 1,8022009 Average ...................... 55 223 44 30 58 322 192 115 23 33 928 2,0242010 Average ...................... 123 233 52 10 88 448 165 128 13 19 1,073 2,3532011 Average ...................... 157 351 73 17 79 570 248 121 15 35 1,320 2,9862012 Average ...................... 166 416 85 36 89 565 239 115 16 41 1,435 3,2052013 Average ...................... 179 549 129 41 117 532 274 136 13 36 1,616 3,6212014 Average ...................... 217 809 89 70 150 559 241 124 46 53 1,817 4,1762015 Average ...................... 188 955 191 78 166 690 226 122 65 89 1,968 4,738
2016 January ........................ 243 1,030 239 84 237 737 183 124 126 70 1,902 4,977 February ...................... 189 929 266 107 318 633 249 209 59 52 1,923 4,934 March ........................... 162 840 242 135 228 891 253 157 75 74 2,034 5,092 April ............................. 228 918 272 178 210 791 331 86 98 130 1,953 5,195 May .............................. 241 975 218 198 359 773 313 154 163 108 2,239 5,739 June ............................. 251 1,064 95 181 208 887 301 104 122 117 2,107 5,437 July .............................. 329 1,058 192 205 196 848 262 75 92 89 1,880 5,226 August ......................... 298 964 92 133 151 863 360 75 91 123 1,947 5,097 September ................... 211 864 110 138 322 970 258 229 117 139 2,082 5,439 October ........................ 273 904 252 133 226 967 225 104 99 73 1,729 4,985 November .................... 381 928 243 54 165 994 177 239 157 37 2,051 5,426 December .................... 315 748 213 134 383 1,199 263 210 91 95 1,924 5,574 Average ...................... 260 935 203 140 250 880 265 147 108 92 1,980 5,261
2017 January ........................ 270 809 333 102 323 1,120 155 252 124 89 2,067 5,645 February ...................... 317 827 611 249 379 980 306 306 159 93 2,233 6,461 March ........................... 312 794 387 193 323 883 268 291 128 187 2,288 6,054 April ............................. 405 885 452 191 377 909 152 192 251 167 2,297 6,277 May .............................. 393 957 384 166 249 887 320 125 197 170 2,383 6,232 June ............................. 414 936 272 211 256 1,087 292 237 175 184 2,188 6,252 July .............................. 410 980 208 140 316 1,125 269 188 137 195 2,324 6,291 August ......................... 415 824 354 239 264 1,022 167 162 179 152 1,889 5,665 September ................... 476 872 531 235 463 1,074 261 174 240 175 1,789 6,289 October ........................ 492 655 773 264 393 1,133 312 278 150 211 2,426 7,086 November .................... 444 999 499 217 390 1,377 194 143 257 316 2,308 7,144 December .................... 391 918 576 200 468 1,365 322 182 116 288 2,309 7,136 Average ...................... 395 871 447 200 350 1,081 251 210 176 186 2,209 6,376
2018 January ........................ 357 923 508 161 354 1,364 289 206 74 145 2,235 6,615 February ...................... 394 1,008 608 190 301 1,097 269 233 144 179 2,421 6,844 March ........................... 420 864 594 212 321 1,275 208 135 246 282 2,548 7,105 April ............................. 355 1,028 426 214 338 1,252 377 200 236 336 2,967 7,730 May .............................. 292 1,030 568 264 291 977 340 303 348 279 2,825 7,517 June ............................. 411 907 679 413 289 1,020 409 243 499 303 2,629 7,801 July .............................. 353 959 545 217 503 1,336 312 121 433 231 2,816 7,827 August ......................... 362 841 130 301 433 1,104 289 182 457 273 2,671 7,043 September ................... 376 944 72 276 585 1,176 429 191 406 304 2,852 7,611 October ........................ 584 1,016 102 418 497 1,386 465 201 598 267 2,483 8,018 November .................... R 387 R 1,067 R 71 R 287 R 785 R 1,442 R 531 R 333 R 422 R 255 R 3,089 R 8,669 December .................... 460 931 205 360 728 1,094 425 162 718 372 2,794 8,250 11-Month Averagea .... R 390 R 962 R 390 R 269 R 427 R 1,222 R 356 R 213 R 352 R 260 R 2,685 R 7,526
a 12-month average currently not available.R=Revised. NA=Not available. – =No data reported. Notes: • Totals may not equal sum of components due to independent
rounding. • U.S. geographic coverage is the 50 states and the District ofColumbia.
Web Page: See http://www.eia.gov/totalenergy/data/monthly/#petroleum (Exceland CSV files) for all available annual data beginning in 1960 and monthly data
beginning in 1981.Sources: • 1960–1972: Bureau of Mines, Minerals Yearbook, annual reports.
• 1973–1975: Bureau of Mines, Mineral Industry Surveys, Petroleum Statement,Annual, annual reports. • 1976–1980: U.S. Energy Information Administration(EIA), Energy Data Reports, Petroleum Statement, Annual, annual reports.• 1981–2017: EIA, Petroleum Supply Annual, annual reports. • 2018:EIA, Petroleum Supply Monthly, monthly reports.

68 U. S. Energy Information Administration / Monthly Energy Review March 2019
Figure 3.4 Petroleum Stocks
Total
Petroleum Products
Crude Oil
0.0
0.5
1.0
1.5
2.0
2.5
1950 1955 1960 1965 1970 1975 1980 1985 1990 1995 2000 2005 2010 2015
Bill
ion B
arr
els
Overview, 1949–2018
Non-SPR
SPR
0
250
500
750
1,000
1950 1955 1960 1965 1970 1975 1980 1985 1990 1995 2000 2005 2010 2015
Mill
ion B
arr
els
SPR and Non-SPR Crude Oil Stocks, 1949–2018
Total
Petroleum Products
Crude Oil
0.0
0.5
1.0
1.5
2.0
2.5
J F MAM J J A S ON D J F MAM J J A S ON D J F MAM J J A S ON D
2017 2018 2019
Bill
ion B
arr
els
Overview, Monthly
Motor Gasoline
Distillate Fuel Oil
Propane
Jet Fuel [a]
Residual Fuel Oil 0
50
100
150
200
250
300
J FMAM J J A SOND J FMAM J J A SOND J FMAM J J A S OND
2017 2018 2019
Mill
ion B
arr
els
Selected Products, Monthly
[a] Includes kerosene‐type jet fuel only.
Notes: • SPR=Strategic Petroleum Reserve. • Stocks are at end of period.
Web Page: http://www.eia.gov/totalenergy/data/monthly/#petroleum.
Source: Table 3.4.

U. S. Energy Information Administration / Monthly Energy Review March 2019 69
Table 3.4 Petroleum Stocks (Million Barrels)
Crude Oila
DistillateFuel Oile
Hydrocarbon Gas Liquids
JetFuelh
MotorGasolinei
ResidualFuel Oil Otherj Total
Propane/Propylene
TotalgSPRbNon-
SPRc,d Totald PropanePropy-
lene Totalf
1950 Year ..................... – – 248 248 72 NA NA NA 2 h( ) 116 41 104 5831955 Year ..................... – – 266 266 111 NA NA NA 7 3 165 39 123 7151960 Year ..................... – – 240 240 138 NA NA NA 23 7 195 45 137 7851965 Year ..................... – – 220 220 155 NA NA NA 35 19 175 56 176 8361970 Year ..................... – – 276 276 195 NA NA 44 74 28 209 54 181 1,0181975 Year ..................... – – 271 271 209 NA NA 82 133 30 235 74 181 1,1331980 Year ..................... 108 358 466 205 NA NA 71 137 42 261 92 189 1,3921985 Year ..................... 493 321 814 144 NA NA 39 82 40 223 50 165 1,5191990 Year ..................... 586 323 908 132 NA NA 49 104 52 220 49 156 1,6211995 Year ..................... 592 303 895 130 NA NA 43 100 40 202 37 158 1,5632000 Year ..................... 541 286 826 118 NA NA 41 88 45 196 36 159 1,4682001 Year ..................... 550 312 862 145 NA NA 66 128 42 210 41 158 1,5862002 Year ..................... 599 278 877 134 NA NA 53 113 39 209 31 144 1,5482003 Year ..................... 638 269 907 137 NA NA 50 101 39 207 38 140 1,5682004 Year ..................... 676 286 961 126 NA NA 55 111 40 218 42 146 1,6452005 Year ..................... 685 308 992 136 NA NA 57 117 42 208 37 148 1,6822006 Year ..................... 689 296 984 144 NA NA 62 125 39 212 42 157 1,7032007 Year ..................... 697 268 965 134 NA NA 52 106 39 218 39 146 1,6482008 Year ..................... 702 308 1,010 146 NA NA 55 127 38 214 36 149 1,7192009 Year ..................... 727 307 1,034 166 NA NA 50 113 43 223 37 142 1,7582010 Year ..................... 727 312 1,039 164 46 4 49 120 43 219 41 145 1,7722011 Year ..................... 696 308 1,004 149 48 7 55 127 41 223 34 146 1,7252012 Year ..................... 695 338 1,033 135 63 5 68 152 40 231 34 154 1,7792013 Year ..................... 696 327 1,023 128 40 5 45 125 37 228 38 149 1,7282014 Year ..................... 691 361 1,052 136 72 6 78 174 38 240 34 151 1,8252015 Year ..................... 695 449 1,144 161 91 5 96 194 40 235 42 164 1,9822016 Year ..................... 695 485 1,180 166 77 7 84 200 43 239 41 161 2,030
2017 January ................ 695 507 1,202 170 53 6 59 165 43 261 39 174 2,053 February .............. 695 525 1,220 163 47 3 51 154 44 254 38 177 2,049 March ................... 692 539 1,230 152 40 4 44 148 42 240 38 181 2,030 April ..................... 689 524 1,213 155 38 4 43 153 45 244 37 182 2,028 May ...................... 684 517 1,201 154 46 4 50 170 44 242 37 184 2,034 June ..................... 679 502 1,181 152 57 4 61 190 41 238 33 175 2,010 July ...................... 679 483 1,162 151 64 5 68 206 41 233 31 174 1,998 August ................. 679 460 1,139 148 74 5 79 230 40 227 33 171 1,987 September ........... 674 470 1,143 137 71 5 76 229 44 223 34 168 1,978 October ................ 669 460 1,129 130 73 5 78 231 42 216 30 164 1,941 November ............ 661 453 1,114 133 70 5 75 216 41 225 30 163 1,923 December ........... 663 422 1,084 146 62 5 67 190 41 237 29 167 1,895
2018 January ................ 664 420 1,084 141 46 5 51 157 43 248 32 174 1,879 February .............. 665 424 1,089 139 39 5 44 142 43 253 33 178 1,876 March ................... 665 423 1,089 130 34 4 38 139 40 240 35 188 1,862 April ..................... 664 435 1,099 121 35 4 39 145 41 240 32 186 1,864 May ...................... 660 433 1,093 115 44 4 48 163 41 242 32 183 1,870 June ..................... 660 415 1,075 120 56 4 60 181 41 240 30 180 1,867 July ...................... 660 409 1,069 127 60 4 64 196 41 234 29 176 1,872 August ................. 660 407 1,067 132 67 4 70 213 42 236 28 174 1,892 September ........... 660 416 1,076 137 75 4 79 225 47 240 29 178 1,932 October ................ 655 432 1,087 124 79 5 84 225 42 232 29 176 1,916 November ............ 650 449 1,098 126 74 6 80 209 39 230 30 178 1,910 December ........... 649 R 442 R 1,091 R 140 R 64 R 7 R 71 R 189 R 42 R 246 28 176 R 1,912
2019 January ................ E 649 E 447 E 1,096 E 139 NA NA E 58 F 161 E 42 E 258 E 29 E 183 E 1,908 February .............. NA NA NA NA NA NA NA F 152 NA NA NA NA NA
a Includes lease condensate.b "SPR" is the Strategic Petroleum Reserve, which began in October 1977.
Crude oil stocks in the SPR include non-U.S. stocks held under foreign orcommercial storage agreements.
c All crude oil stocks other than those in “SPR.”d Beginning in 1981, includes stocks of Alaskan crude oil in transit. e Excludes stocks in the Northeast Home Heating Oil Reserve. Beginning in
2009, includes renewable diesel fuel (including biodiesel) blended into distillate fueloil.
f Propane and propylene. Through 1983, also includes 40% of "Butane-Propane Mixtures" and 30% of "Ethane-Propane Mixtures."
g Ethane, propane, normal butane, isobutane, natural gasoline (pentanes plus),and refinery olefins (ethylene, propylene, butylene, and isobutylene). Through1983, also includes plant condensate and unfractionated stream.
h Beginning in 1965, includes kerosene-type jet fuel. (Through 1964,kerosene-type jet fuel is included with kerosene in "Other.") For 1952–2004, alsoincludes naphtha-type jet fuel. (Through 1951, naphtha-type jet fuel is included inthe products from which it was blended—gasoline, kerosene, and distillate fuel oil.Beginning in 2005, naphtha-type jet fuel is included in "Other.")
i Includes finished motor gasoline and motor gasoline blending components;excludes oxygenates. Through 1963, also includes aviation gasoline and specialnaphthas.
j Asphalt and road oil, aviation gasoline blending components, kerosene,lubricants, petrochemical feedstocks, petroleum coke, unfinished oils, waxes,miscellaneous products, oxygenates, renewable fuels, and other hydrocarbons.Through 1964, also includes kerosene-type jet fuel. Beginning in 1964, alsoincludes finished aviation gasoline and special naphthas. Beginning in 2005, alsoincludes naphtha-type jet fuel.
R=Revised. E=Estimate. F=Forecast. NA=Not available. – – =Not applicable. Notes: • Stocks are at end of period. • Totals may not equal sum of
components due to independent rounding. • Geographic coverage is the 50 statesand the District of Columbia.
Web Page: See http://www.eia.gov/totalenergy/data/monthly/#petroleum (Exceland CSV files) for all available annual data beginning in 1949 and monthly databeginning in 1973.
Sources: • 1949–1975: Bureau of Mines, Mineral Industry Surveys, PetroleumStatement, Annual, annual reports. • 1976–1980: U.S. Energy InformationAdministration (EIA), Energy Data Reports, Petroleum Statement, Annual, annualreports. • 1981–2017: EIA, Petroleum Supply Annual, annual reports, andunpublished revisions. • 2018 and 2019: EIA, Petroleum Supply Monthly, monthlyreports; and, for the current two months, Weekly Petroleum Status Report datasystem, Short-Term Integrated Forecasting System, and Monthly Energy Reviewdata system calculations.
February 2019 monthly data from the Weekly Petroleum Status Report
were not available in time for this publication.

70 U. S. Energy Information Administration / Monthly Energy Review March 2019
Figure 3.5 Petroleum Products Supplied by Type (Million Barrels per Day)
Total Petroleum
Motor Gasoline [a]
0
6
12
18
24
1950 1955 1960 1965 1970 1975 1980 1985 1990 1995 2000 2005 2010 2015
Total Petroleum and Motor Gasoline, 1949–2018
Motor Gasoline [a]
Distillate Fuel Oil [b]
Propane
Jet Fuel [c] Residual Fuel Oil
0
3
6
9
12
1950 1955 1960 1965 1970 1975 1980 1985 1990 1995 2000 2005 2010 2015
Selected Products,1949–2018
Motor Gasoline [a]
Distillate Fuel Oil [b]
Propane
Jet Fuel [c] Residual Fuel Oil
0
3
6
9
12
J F M A M J J A S O N D J F M A M J J A S O N D J F M A M J J A S O N D
2017 2018 2019
Selected Products, Monthly
19.32320.461
21.101
0
5
10
15
20
25
2017 2018 2019
Total, January
[a] Beginning in 1993, includes fuel ethanol blended into motor gasoline.
[b] Beginning in 2009, includes renewable diesel fuel (including biodiesel)
blended into distillate fuel oil.
[c] Beginning in 2005, includes kerosene‐type jet fuel only.
Web Page: http://www.eia.gov/totalenergy/data/monthly/#petroleum.
Source: Table 3.5.

U. S. Energy Information Administration / Monthly Energy Review March 2019 71
Table 3.5 Petroleum Products Supplied by Type (Thousand Barrels per Day)
Asphaltand
RoadOil
Avia-tion
Gaso-line
Distil-lateFuelOila
Hydrocarbon Gas Liquids
JetFueld
Kero-sene
Lubri-cants
MotorGaso-linee
Petro-leumCoke
Resid-ual
FuelOil Otherf Total
Propane/Propylene
TotalcPro-pane
Propy-lene Totalb
1950 Average .................... 180 108 1,082 E 146 E 13 E 158 234 d( ) 323 106 2,616 41 1,517 250 6,4581955 Average .................... 254 192 1,592 E 251 E 22 E 273 404 154 320 116 3,463 67 1,526 366 8,4551960 Average .................... 302 161 1,872 E 386 E 33 E 419 621 371 271 117 3,969 149 1,529 435 9,7971965 Average .................... 368 120 2,126 E 523 E 45 E 568 841 602 267 129 4,593 202 1,608 657 11,5121970 Average .................... 447 55 2,540 E 727 E 55 782 1,224 967 263 136 5,785 212 2,204 866 14,6971975 Average .................... 419 39 2,851 E 730 E 60 790 1,352 1,001 159 137 6,675 247 2,462 982 16,3221980 Average .................... 396 35 2,866 E 742 E 72 813 1,590 1,068 158 159 6,579 237 2,508 1,460 17,0561985 Average .................... 425 27 2,868 E 810 E 72 883 1,721 1,218 114 145 6,831 264 1,202 909 15,7261990 Average .................... 483 24 3,021 E 812 E 105 917 1,705 1,522 43 164 7,235 339 1,229 1,225 16,9881995 Average .................... 486 21 3,207 E 938 E 157 1,096 2,100 1,514 54 156 7,789 365 852 1,180 17,7252000 Average .................... 525 20 3,722 E 1,011 E 224 1,235 2,434 1,725 67 166 8,472 406 909 1,255 19,7012001 Average .................... 519 19 3,847 E 932 E 210 1,142 2,200 1,655 72 153 8,610 437 811 1,325 19,6492002 Average .................... 512 18 3,776 E 1,015 E 233 1,248 2,295 1,614 43 151 8,848 463 700 1,342 19,7612003 Average .................... 503 16 3,927 E 977 E 238 1,215 2,205 1,578 55 140 8,935 455 772 1,448 20,0342004 Average .................... 537 17 4,058 E 1,021 E 255 1,276 2,264 1,630 64 141 9,105 524 865 1,525 20,7312005 Average .................... 546 19 4,118 E 986 E 243 1,229 2,146 1,679 70 141 9,159 515 920 1,489 20,8022006 Average .................... 521 18 4,169 E 947 E 268 1,215 2,135 1,633 54 137 9,253 522 689 1,557 20,6872007 Average .................... 494 17 4,196 E 983 E 252 1,235 2,191 1,622 32 142 9,286 490 723 1,487 20,6802008 Average .................... 417 15 3,945 E 924 E 230 1,154 2,044 1,539 14 131 8,989 464 622 1,317 19,4982009 Average .................... 360 14 3,631 E 893 E 267 1,160 2,127 1,393 18 118 8,997 427 511 1,175 18,7712010 Average .................... 362 15 3,800 852 308 1,160 2,265 1,432 20 131 8,993 376 535 1,251 19,1802011 Average .................... 355 15 3,899 851 301 1,153 2,241 1,425 12 125 8,753 361 461 1,240 18,8872012 Average .................... 340 14 3,741 862 312 1,175 2,297 1,398 5 114 8,682 360 369 1,165 18,4872013 Average .................... 323 12 3,827 969 307 1,275 2,501 1,434 5 121 8,843 354 319 1,227 18,9672014 Average .................... 327 12 4,037 870 297 1,167 2,442 1,470 9 126 8,921 347 257 1,151 19,1002015 Average .................... 343 11 3,995 865 297 1,162 2,552 1,548 6 138 9,178 349 259 1,153 19,5342016 Average .................... 351 11 3,877 833 297 1,130 2,536 1,614 9 130 9,317 345 326 1,170 19,687
2017 January ...................... 183 9 3,736 1,320 333 1,653 3,049 1,588 24 136 8,507 419 540 1,133 19,323 February .................... 242 9 3,935 935 371 1,306 2,655 1,517 9 128 9,008 229 279 1,180 19,190 March ......................... 260 10 4,127 892 313 1,205 2,729 1,676 2 143 9,325 180 319 1,288 20,060 April ........................... 316 11 3,763 737 308 1,044 2,524 1,644 2 128 9,295 292 283 1,338 19,595 May ............................ 367 12 3,955 548 331 879 2,451 1,669 3 131 9,550 345 357 1,227 20,066 June ........................... 475 17 3,964 544 306 850 2,479 1,762 2 120 9,772 278 349 1,345 20,561 July ............................ 443 13 3,642 637 298 935 2,588 1,734 1 116 9,595 451 287 1,251 20,119 August ....................... 543 14 4,004 604 278 882 2,249 1,762 1 92 9,752 294 346 1,195 20,251 September ................. 444 10 3,921 802 269 1,071 2,347 1,627 14 114 9,378 346 302 1,137 19,641 October ...................... 411 9 4,011 618 315 933 2,614 1,751 1 123 9,357 174 323 1,214 19,990 November .................. 308 11 4,157 956 317 1,273 2,902 1,685 3 122 9,110 395 394 1,219 20,307 December .................. 209 12 3,975 1,048 338 1,385 3,118 1,756 1 94 9,247 384 314 1,214 20,323 Average .................... 351 11 3,932 803 314 1,117 2,643 1,682 5 121 9,327 316 342 1,228 19,958
2018 January ...................... 204 10 4,394 1,391 315 1,706 3,451 1,586 40 105 8,742 359 340 1,232 20,461 February .................... 219 7 3,962 1,105 300 1,404 3,119 1,599 1 105 8,817 202 282 1,306 19,619 March ......................... 233 13 4,169 989 332 1,321 3,069 1,718 1 134 9,446 288 223 1,280 20,573 April ........................... 242 13 4,154 814 286 1,100 2,830 1,634 1 99 9,187 300 409 1,072 19,941 May ............................ 370 12 4,273 495 304 799 2,543 1,707 8 111 9,550 312 312 1,159 20,357 June ........................... 475 15 3,954 499 330 830 2,632 1,854 1 133 9,798 354 249 1,240 20,705 July ............................ 471 16 3,958 614 305 919 2,806 1,772 1 127 9,640 336 337 1,157 20,621 August ....................... 508 14 4,173 636 316 952 2,889 1,856 1 120 9,748 449 312 1,234 21,302 September ................. 388 9 4,007 711 301 1,011 2,841 1,700 (s) 73 9,118 420 362 1,032 19,951 October ...................... 396 16 4,378 836 263 1,099 2,935 1,662 4 110 9,273 420 305 1,274 20,774 November .................. R 255 7 R 4,128 R 1,007 300 R 1,307 R 3,306 R 1,769 R 1 R 136 R 9,247 R 275 R 320 R 1,104 R 20,548 December .................. R 179 R 12 R 4,028 R 1,194 R 301 R 1,496 R 3,426 R 1,667 R 2 R 92 R 9,219 R 269 R 404 R 1,181 R 20,479 Average .................... R 329 12 R 4,134 R 857 R 305 R 1,161 R 2,987 R 1,711 R 5 R 112 R 9,319 R 333 R 322 R 1,189 R 20,453
2019 January ...................... F 225 RF 11 E 4,331 NA NA E 1,708 RF 3,639 E 1,674 RF 5 RF 189 E 8,990 F 385 E 290 RE 1,362 E 21,101 February .................... F 240 F 6 NA NA NA NA F 3,546 NA F 3 F 139 NA F 310 NA NA NA 2-Month Average ..... F 232 F 8 NA NA NA NA F 3,595 NA F 4 F 166 NA F 350 NA NA NA
2018 2-Month Average ..... 211 8 4,189 1,255 308 1,563 3,293 1,592 22 105 8,778 284 313 1,267 20,0622017 2-Month Average ..... 211 9 3,830 1,137 351 1,488 2,862 1,555 17 132 8,744 329 416 1,155 19,260
a Beginning in 2009, includes renewable diesel fuel (including biodiesel)blended into distillate fuel oil.
b Propane and propylene. Through 1983, also includes 40% of "Butane-Propane Mixtures" and 30% of "Ethane-Propane Mixtures."
c Ethane, propane, normal butane, isobutane, natural gasoline (pentanes plus),and refinery olefins (ethylene, propylene, butylene, and isobutylene). Through1983, also includes plant condensate and unfractionated stream.
d Beginning in 1957, includes kerosene-type jet fuel. For 1952–2004, alsoincludes naphtha-type jet fuel. (Through 1951, naphtha-type jet fuel is included inthe products from which it was blended—gasoline, kerosene, and distillate fuel oil.Beginning in 2005, naphtha-type jet fuel is included in "Other.")
e Finished motor gasoline. Through 1963, also includes special naphthas.Beginning in 1993, also includes fuel ethanol blended into motor gasoline.
f Petrochemical feedstocks, still gas (refinery gas), waxes, and miscellaneousproducts. Beginning in 1964, also includes special naphthas. Beginning in 1981,also includes negative barrels per day of distillate and residual fuel oil reclassified
as unfinished oils, and other products (from both primary and secondary supply)reclassified as gasoline blending components. Beginning in 1983, also includescrude oil burned as fuel. Beginning in 2005, also includes naphtha-type jet fuel.
R=Revised. E=Estimate. F=Forecast. NA=Not available. (s)=Less than 500barrels per day and greater than -500 barrels per day.
Notes: • Petroleum products supplied is an approximation of petroleumconsumption and is synonymous with the term "petroleum consumption" in Tables3.7a–3.8c. See Note 1, "Petroleum Products Supplied and PetroleumConsumption," at end of section. • Totals may not equal sum of components dueto independent rounding. • Geographic coverage is the 50 states and the Districtof Columbia.
Web Page: See http://www.eia.gov/totalenergy/data/monthly/#petroleum (Exceland CSV files) for all available annual data beginning in 1949 and monthly databeginning in 1973.
Sources: See end of section.
February 2019 monthly data from the Weekly Petroleum Status Report
were not available in time for this publication.

72 U. S. Energy Information Administration / Monthly Energy Review March 2019
Figure 3.6 Heat Content of Petroleum Products Supplied by Type
0
10
20
30
40
50
1950 1955 1960 1965 1970 1975 1980 1985 1990 1995 2000 2005 2010 2015
Qu
adri
llio
n B
tuTotal, 1949–2018
0
10
20
30
40
50
1950 1955 1960 1965 1970 1975 1980 1985 1990 1995 2000 2005 2010 2015
Pe
rcent
Petroleum Products Supplied as Share of Total Energy Consumption, 1949–2018
0.0460.002
0.773
0.395
0.294
0.001 0.036
1.408
0.073 0.057
0.280
0.0
0.5
1.0
1.5
Asphalt andRoad Oil
AviationGasoline
DistillateFuel Oil [a]
HydrocarbonGas Liquids
Jet Fuel [b] Kerosene Lubricants MotorGasoline [c]
PetroleumCoke
ResidualFuel Oil
Other [d]
Qu
adri
llion
Btu
By Product, January 2019
[a] Includes renewable diesel fuel (including biodiesel) blended into
distillate fuel oil.
[b] Includes kerosene‐type jet fuel only.
[c] Includes fuel ethanol blended into motor gasoline.
[d] All petroleum products not separately displayed.
Web Page: http://www.eia.gov/totalenergy/data/monthly/#petroleum.
Sources: Tables 1.1 and 3.6.

U. S. Energy Information Administration / Monthly Energy Review March 2019 73
Table 3.6 Heat Content of Petroleum Products Supplied by Type (Trillion Btu)
Asphaltand
Road OilAviationGasoline
DistillateFuel Oilb
HGLa
JetFuele
Kero-sene
Lubri-cants
MotorGasolinef
Petro-leumCoke
ResidualFuel Oil Otherg TotalPropanec Totald
1950 Total ...................... 435 199 2,300 NA 343 e( ) 668 236 5,015 90 3,482 546 13,3151955 Total ...................... 615 354 3,385 NA 592 301 662 258 6,640 147 3,502 798 17,2551960 Total ...................... 734 298 3,992 NA 912 739 563 259 7,631 328 3,517 947 19,9191965 Total ...................... 890 222 4,519 NA 1,232 1,215 553 286 8,806 444 3,691 1,390 23,2461970 Total ...................... 1,082 100 5,401 1,095 1,689 1,973 544 301 11,091 465 5,057 1,817 29,5211975 Total ...................... 1,014 71 6,061 1,107 1,845 2,047 329 304 12,798 542 5,649 2,071 32,7321980 Total ...................... 962 64 6,110 1,142 2,180 2,190 329 354 12,648 522 5,772 3,073 34,2051985 Total ...................... 1,029 50 6,098 1,236 2,309 2,497 236 322 13,098 582 2,759 1,945 30,9251990 Total ...................... 1,170 45 6,422 1,284 2,309 3,129 88 362 13,872 745 2,820 2,589 33,5521995 Total ...................... 1,178 40 6,812 1,534 2,849 3,132 112 346 14,794 802 1,955 2,499 34,5192000 Total ...................... 1,276 36 7,927 1,734 3,288 3,580 140 369 16,127 895 2,091 2,636 38,3662001 Total ...................... 1,257 35 8,170 1,598 2,960 3,426 150 338 16,345 961 1,861 2,793 38,2962002 Total ...................... 1,240 34 8,020 1,747 3,076 3,340 90 334 16,790 1,018 1,605 2,816 38,3632003 Total ...................... 1,220 30 8,341 1,701 2,968 3,265 113 309 16,949 1,000 1,772 3,043 39,0102004 Total ...................... 1,304 31 8,642 1,791 3,047 3,383 133 313 17,316 1,148 1,990 3,205 40,5112005 Total ...................... 1,323 35 8,745 1,721 2,878 3,475 144 312 17,358 1,125 2,111 3,122 40,6272006 Total ...................... 1,261 33 8,831 1,701 2,841 3,379 111 303 17,511 1,141 1,581 3,276 40,2682007 Total ...................... 1,197 32 8,858 1,729 2,912 3,358 67 313 17,428 1,072 1,659 3,134 40,0292008 Total ...................... 1,012 28 8,346 1,620 2,727 3,193 30 291 16,799 1,017 1,432 2,788 37,6622009 Total ...................... 873 27 7,657 1,624 2,791 2,883 36 262 16,711 937 1,173 2,483 35,8332010 Total ...................... 878 27 8,011 1,624 2,976 2,963 41 291 16,632 831 1,228 2,645 36,5222011 Total ...................... 859 27 8,211 1,614 2,899 2,950 25 276 16,175 801 1,058 2,621 35,9032012 Total ...................... 827 25 7,898 1,649 2,992 2,901 11 254 16,085 802 849 2,474 35,1182013 Total ...................... 783 22 8,051 1,785 3,267 2,969 11 268 16,332 786 731 2,583 35,8042014 Total ...................... 793 22 8,492 1,634 3,172 3,042 19 280 16,473 772 590 2,430 36,0842015 Total ...................... 832 21 8,402 1,627 3,331 3,204 13 305 16,941 776 595 2,435 36,8552016 Total ...................... 853 20 8,170 1,586 3,289 3,350 18 289 17,238 771 751 2,553 37,303
2017 January .................. 38 1 667 197 338 279 4 26 1,333 80 105 209 3,080 February ................ 45 1 635 140 261 241 1 22 1,274 39 49 196 2,765 March ..................... 53 2 737 143 301 295 (s) 27 1,461 34 62 237 3,208 April ....................... 63 2 650 120 268 280 (s) 23 1,409 54 53 239 3,040 May ........................ 75 2 706 105 266 293 1 25 1,496 66 69 226 3,225 June ....................... 95 3 684 98 258 300 (s) 22 1,481 51 66 240 3,199 July ........................ 91 2 650 111 283 305 (s) 22 1,503 86 56 231 3,228 August ................... 112 2 714 105 244 310 (s) 17 1,528 56 67 221 3,271 September ............. 88 1 677 123 250 277 2 21 1,422 64 57 204 3,062 October .................. 85 1 716 111 288 308 (s) 23 1,466 33 63 224 3,207 November .............. 61 2 718 146 306 287 1 22 1,381 73 74 217 3,142 December .............. 43 2 710 165 340 309 (s) 18 1,448 73 61 224 3,228 Total ...................... 849 21 8,263 1,564 3,403 3,481 11 267 17,201 708 784 2,667 37,656
2018 January .................. 42 1 785 203 381 279 7 20 R 1,370 68 66 227 3,246 February ................ 41 1 639 151 311 254 (s) 18 R 1,248 35 50 217 R 2,813 March ..................... 48 2 744 157 332 302 (s) 25 1,480 55 43 236 3,268 April ....................... 48 2 718 127 296 278 (s) 18 1,393 55 77 192 3,077 May ........................ 76 2 763 95 273 300 1 21 1,496 59 61 215 3,267 June ....................... 95 2 683 95 274 315 (s) 24 R 1,486 65 47 222 3,213 July ........................ 97 3 707 109 303 312 (s) 24 1,510 64 66 215 3,299 August ................... 104 2 745 113 314 326 (s) 22 1,527 85 61 228 3,416 September ............. 77 1 692 116 298 289 (s) 13 1,382 77 68 185 3,085 October .................. 81 3 782 131 322 292 1 21 1,453 80 59 234 3,327 November .............. R 51 1 R 713 R 150 R 351 R 301 R (s) R 25 R 1,402 R 50 R 60 R 198 R 3,153 December .............. R 37 2 R 719 R 178 R 378 R 293 R (s) R 17 R 1,444 R 51 R 79 R 218 R 3,240 Total ...................... R 797 22 R 8,689 R 1,626 R 3,833 R 3,541 R 11 R 248 R 17,191 R 743 R 738 R 2,588 R 38,401
2019 January .................. F 46 RF 2 E 773 E 203 F 395 E 294 F 1 RF 36 E 1,408 F 73 E 57 E 280 RE 3,365 February ................ F 45 F 1 NA NA F 346 NA F 1 F 24 NA F 53 NA NA NA 2-Month Total ....... F 91 F 2 NA NA F 741 NA F 1 F 59 NA F 126 NA NA NA
2018 2-Month Total ....... 83 2 1,424 354 692 533 7 38 2,617 103 116 444 6,0582017 2-Month Total ....... 83 3 1,302 337 599 520 6 47 2,607 119 154 405 5,845
a Hydrocarbon gas liquids.b Beginning in 2009, includes renewable diesel fuel (including biodiesel)
blended into distillate fuel oil. c Propane and propylene. Through 1983, also includes 40% of "Butane-
Propane Mixtures" and 30% of "Ethane-Propane Mixtures."d Ethane, propane, normal butane, isobutane, natural gasoline (pentanes plus),
and refinery olefins (ethylene, propylene, butylene, and isobutylene). Through1983, also includes plant condensate and unfractionated stream.
e Beginning in 1957, includes kerosene-type jet fuel. For 1952–2004, alsoincludes naphtha-type jet fuel. (Through 1951, naphtha-type jet fuel is included inthe products from which it was blended—gasoline, kerosene, and distillate fuel oil.Beginning in 2005, naphtha-type jet fuel is included in "Other.")
f Finished motor gasoline. Through 1963, also includes special naphthas.Beginning in 1993, also includes fuel ethanol blended into motor gasoline.
g Petrochemical feedstocks, still gas (refinery gas), waxes, and miscellaneousproducts. Beginning in 1964, also includes special naphthas. Beginning in 1981,
also includes negative barrels per day of distillate and residual fuel oil reclassifiedas unfinished oils, and other products (from both primary and secondary supply)reclassified as gasoline blending components. Beginning in 1983, also includescrude oil burned as fuel. Beginning in 2005, also includes naphtha-type jet fuel.
R=Revised. E=Estimate. F=Forecast. NA=Not available. (s)=Less than 0.5trillion Btu and greater than -0.5 trillion Btu.
Notes: • Petroleum products supplied is an approximation of petroleumconsumption and is synonymous with the term "petroleum consumption" in Tables3.7a–3.8c. See Note 1, "Petroleum Products Supplied and PetroleumConsumption," at end of section. • Totals may not equal sum of components dueto independent rounding. • Geographic coverage is the 50 states and the Districtof Columbia.
Web Page: See http://www.eia.gov/totalenergy/data/monthly/#petroleum (Exceland CSV files) for all available annual data beginning in 1949 and monthly databeginning in 1973.
Sources: See end of section.
February 2019 monthly data from the Weekly Petroleum Status Report
were not available in time for this publication.

74 U. S. Energy Information Administration / Monthly Energy Review March 2019
Figure 3.7 Petroleum Consumption by Sector
Transportation
Industrial [a]
Residential and Commercial [a]
Electric Power 0
4
8
12
16
1950 1955 1960 1965 1970 1975 1980 1985 1990 1995 2000 2005 2010 2015
Mill
ion B
arr
els
pe
r D
ay
By Sector, 1949–2018
0.804 0.637
5.096
13.849
0.0930
4
8
12
16
Residential Commercial [a] Industrial [a] Transportation Electric Power
Mill
ion B
arr
els
pe
r D
ay
By Sector, December 2018
106
28
54
33 2
25
69
1
0
20
40
60
80
Residential Commercial Industrial Transportation Electric Power
Perc
en
t
Sector Shares, 1949 and 2018
1949 2018
[a] Includes combined‐heat‐and‐power plants and a small number of electricity‐
only plants.
Web Page: http://www.eia.gov/totalenergy/data/monthly/#petroleum.
Sources: Tables 3.7a–3.7c.

U. S. Energy Information Administration / Monthly Energy Review March 2019 75
Table 3.7a Petroleum Consumption: Residential and Commercial Sectors (Thousand Barrels per Day)
Residential Sector Commercial Sectora
DistillateFuel Oil
HGLb
Kero-sene Total
DistillateFuel Oil
HGLb
Kero-sene
MotorGasolinec,d
PetroleumCoke
ResidualFuel Oil TotalPropane Propane
1950 Average .................... 390 104 168 662 123 28 23 52 NA 185 4111955 Average .................... 562 144 179 885 177 38 24 69 NA 209 5191960 Average .................... 736 217 171 1,123 232 58 23 35 NA 243 5901965 Average .................... 805 275 161 1,242 251 74 26 40 NA 281 6721970 Average .................... 883 392 144 1,419 276 102 30 45 NA 311 7641975 Average .................... 850 365 78 1,293 276 92 24 46 NA 214 6531980 Average .................... 617 222 51 890 243 63 20 56 NA 245 6261985 Average .................... 514 224 77 815 297 68 16 50 NA 99 5301990 Average .................... 460 252 31 742 252 73 6 58 0 100 4891995 Average .................... 426 282 36 743 225 78 11 10 (s) 62 3852000 Average .................... 424 395 46 865 230 107 14 23 (s) 40 4152001 Average .................... 427 375 46 849 239 102 15 20 (s) 30 4062002 Average .................... 404 384 29 817 209 101 8 24 (s) 35 3762003 Average .................... 438 389 34 861 233 112 9 32 (s) 48 4342004 Average .................... 433 364 41 839 221 108 10 23 (s) 53 4162005 Average .................... 402 366 40 809 210 94 10 24 (s) 50 3892006 Average .................... 335 318 32 685 189 88 7 26 (s) 33 3432007 Average .................... 342 345 21 708 181 87 4 32 (s) 33 3372008 Average .................... 354 394 10 758 181 113 2 24 (s) 31 3512009 Average .................... 276 391 13 680 187 99 2 28 (s) 31 3482010 Average .................... 266 378 14 658 185 100 2 28 (s) 27 3432011 Average .................... 248 351 9 608 186 102 2 24 (s) 23 3362012 Average .................... 228 281 4 513 168 96 1 21 (s) 14 3002013 Average .................... 233 331 4 568 163 108 (s) 22 (s) 11 3042014 Average .................... 253 349 7 609 169 114 1 29 (s) 3 3182015 Average .................... 262 318 5 584 171 106 1 d 204 (s) 2 483
2016 January ...................... 306 359 1 666 229 125 (s) 188 (s) 3 546 February .................... 319 346 2 667 239 121 (s) 200 (s) 3 564 March ......................... 211 316 8 535 158 110 1 204 (s) 2 476 April ........................... 192 291 3 485 144 101 (s) 199 (s) 2 447 May ............................ 168 292 6 466 126 102 1 205 0 2 435 June ........................... 119 269 8 396 89 94 1 209 (s) 1 394 July ............................ 122 290 8 421 92 101 1 208 (s) 1 404 August ....................... 95 280 1 376 71 98 (s) 211 0 1 381 September ................. 150 293 10 453 112 102 2 206 0 1 423 October ...................... 204 301 14 520 153 105 2 198 0 2 460 November .................. 228 303 2 532 171 106 (s) 201 (s) 2 480 December .................. 358 329 16 703 268 115 2 202 (s) 3 591 Average .................... 206 306 7 518 154 107 1 203 (s) 2 467
2017 January ...................... 332 367 18 716 248 128 3 R 178 (s) 3 R 560 February .................... 273 318 7 597 204 111 1 R 189 (s) 2 R 507 March ......................... 232 325 2 558 173 113 (s) R 196 (s) 2 R 484 April ........................... 192 300 2 493 143 105 (s) R 195 (s) 2 R 444 May ............................ 133 290 2 425 99 101 (s) R 200 (s) 1 R 402 June ........................... 165 304 1 470 123 106 (s) R 205 (s) 1 R 436 July ............................ 101 312 (s) 413 76 109 (s) R 201 (s) 1 R 387 August ....................... 132 268 1 400 98 93 (s) R 205 (s) 1 R 398 September ................. 132 278 11 421 99 97 2 R 197 (s) 1 R 396 October ...................... 168 297 1 465 125 104 (s) R 196 (s) 1 R 427 November .................. 259 346 2 608 193 121 (s) R 191 (s) 2 R 508 December .................. 350 370 1 721 261 129 (s) R 194 (s) 3 R 587 Average .................... 205 315 4 524 153 110 1 R 196 (s) 2 R 461
2018 January ...................... R 416 415 30 R 862 R 310 145 5 R 183 (s) 3 R 647 February .................... R 296 373 1 R 671 R 221 130 (s) R 185 (s) 2 R 539 March ......................... R 222 369 (s) R 591 R 166 129 (s) R 198 (s) 2 R 495 April ........................... R 212 340 1 R 553 R 158 119 (s) R 193 (s) 2 R 472 May ............................ R 126 302 6 R 434 R 94 105 1 R 200 0 1 R 401 June ........................... R 101 314 1 R 416 R 75 110 (s) R 206 0 1 R 391 July ............................ R 91 330 (s) R 422 R 68 115 (s) R 202 0 1 R 386 August ....................... R 77 336 (s) R 414 R 58 117 (s) R 204 0 1 R 380 September ................. R 110 330 (s) R 440 R 82 115 (s) R 191 (s) 1 R 390 October ...................... R 228 344 3 R 576 R 170 120 1 R 194 (s) 2 R 487 November .................. R 304 R 387 R 1 R 692 R 227 R 135 R (s) R 194 (s) R 2 R 558 December .................. 403 400 2 804 301 140 (s) 193 (s) 3 637 Average .................... 215 353 4 573 161 123 1 195 (s) 2 482
a Commercial sector fuel use, including that at commercial combined-heat-and-power (CHP) and commercial electricity-only plants.
b Hydrocarbon gas liquids.c Finished motor gasoline. Through 1963, also includes special naphthas.
Beginning in 1993, also includes fuel ethanol blended into motor gasoline.d There is a discontinuity in this time series between 2014 and 2015 due to a
change in the method for allocating motor gasoline consumption to the end-usesectors. Beginning in 2015, the commercial and industrial sector shares of motorgasoline consumption are larger than in 2014, while the transportation sector shareis smaller.
R=Revised. NA=Not available. (s)=Less than 500 barrels per day and greaterthan -500 barrels per day.
Notes: • Data are estimates. • For total petroleum consumption by all sectors,see petroleum products supplied data in Table 3.5. Petroleum products supplied isan approximation of petroleum consumption and is synonymous with the term"petroleum consumption" in Tables 3.7a–3.8c. See Note 1, "Petroleum ProductsSupplied and Petroleum Consumption," at end of section. • Totals may not equalsum of components due to independent rounding. • Geographic coverage is the50 states and the District of Columbia.
Web Page: See http://www.eia.gov/totalenergy/data/monthly/#petroleum (Exceland CSV files) for all available annual data beginning in 1949 and monthly databeginning in 1973.
Sources: See end of section.

76 U. S. Energy Information Administration / Monthly Energy Review March 2019
Table 3.7b Petroleum Consumption: Industrial Sector (Thousand Barrels per Day)
Industrial Sectora
Asphaltand
Road OilDistillateFuel Oil
HGLb
Kerosene LubricantsMotor
Gasolinee,fPetroleum
CokeResidualFuel Oil Otherg TotalPropanec Totald
1950 Average .................... 180 328 NA 100 132 43 131 41 617 250 1,8221955 Average .................... 254 466 NA 212 116 47 173 67 686 366 2,3871960 Average .................... 302 476 NA 333 78 48 198 149 689 435 2,7081965 Average .................... 368 541 NA 470 80 62 179 202 689 657 3,2471970 Average .................... 447 577 256 699 89 70 150 203 708 866 3,8081975 Average .................... 419 630 302 863 58 68 116 246 658 982 4,0381980 Average .................... 396 621 516 1,293 87 82 82 234 586 1,460 4,8421985 Average .................... 425 526 569 1,408 21 75 114 261 326 909 4,0651990 Average .................... 483 541 576 1,364 6 84 97 325 179 1,225 4,3041995 Average .................... 486 532 723 1,727 7 80 105 328 147 1,180 4,5942000 Average .................... 525 563 724 1,923 8 86 79 361 105 1,255 4,9032001 Average .................... 519 611 654 1,713 11 79 155 390 89 1,325 4,8922002 Average .................... 512 566 754 1,801 7 78 163 383 83 1,342 4,9342003 Average .................... 503 551 701 1,691 12 72 171 375 96 1,448 4,9182004 Average .................... 537 570 790 1,778 14 73 195 423 108 1,525 5,2222005 Average .................... 546 594 749 1,666 19 72 187 404 123 1,489 5,1002006 Average .................... 521 594 789 1,710 14 71 198 425 104 1,557 5,1932007 Average .................... 494 595 787 1,744 6 73 161 412 84 1,487 5,0562008 Average .................... 417 637 619 1,510 2 67 131 394 84 1,317 4,5592009 Average .................... 360 509 650 1,617 2 61 128 363 57 1,175 4,2722010 Average .................... 362 547 675 1,781 4 61 140 310 52 1,251 4,5092011 Average .................... 355 586 693 1,781 2 58 138 295 59 1,240 4,5132012 Average .................... 340 602 790 1,912 1 53 136 319 30 1,165 4,5592013 Average .................... 323 601 830 2,056 1 57 142 295 21 1,227 4,7222014 Average .................... 327 648 697 1,972 1 59 114 290 18 1,151 4,5812015 Average .................... 343 555 732 2,121 1 64 f 140 295 15 1,153 4,687
2016 January ...................... 195 631 1,082 2,466 (s) 63 132 326 22 1,126 4,961 February .................... 230 685 1,068 2,323 (s) 69 140 305 13 1,362 5,128 March ......................... 254 663 760 2,180 1 67 142 306 26 1,107 4,747 April ........................... 301 506 552 2,004 (s) 61 139 231 33 1,205 4,480 May ............................ 394 444 565 1,982 1 62 143 218 22 1,075 4,342 June ........................... 482 508 461 1,900 1 68 146 185 23 1,159 4,473 July ............................ 472 331 554 2,023 1 53 146 259 28 1,103 4,418 August ....................... 524 517 566 1,924 (s) 58 147 371 21 1,261 4,822 September ................. 439 572 628 2,028 2 58 144 223 17 1,171 4,654 October ...................... 417 569 624 2,143 2 61 138 272 24 1,175 4,803 November .................. 310 596 727 2,104 (s) 56 140 436 21 1,101 4,765 December .................. 195 557 945 2,323 3 54 141 329 21 1,201 4,824 Average .................... 351 548 710 2,117 1 61 142 289 23 1,170 4,700
2017 January ...................... 183 539 1,150 2,546 3 63 R 131 360 34 1,133 R 4,991 February .................... 242 650 870 2,220 1 60 R 138 180 17 1,180 R 4,688 March ......................... 260 745 760 2,284 (s) 67 R 143 139 21 1,288 R 4,946 April ........................... 316 478 634 2,113 (s) 60 R 143 265 18 1,338 R 4,732 May ............................ 367 610 482 2,054 (s) 61 R 147 293 22 1,227 R 4,781 June ........................... 475 521 433 2,062 (s) 56 R 150 221 22 1,345 R 4,851 July ............................ 443 373 508 2,160 (s) 54 R 147 397 18 1,251 R 4,844 August ....................... 543 549 515 1,882 (s) 43 R 150 247 21 1,195 R 4,629 September ................. 444 590 690 1,966 2 53 R 144 301 19 1,137 R 4,656 October ...................... 411 616 526 2,207 (s) 57 R 144 138 20 1,214 R 4,808 November .................. 308 694 798 2,427 (s) 57 R 140 347 28 1,219 R 5,220 December .................. 209 509 877 2,609 (s) 44 R 142 337 21 1,214 R 5,086 Average .................... 351 572 686 2,211 1 56 R 143 269 22 1,228 R 4,854
2018 January ...................... 204 R 698 1,136 2,881 5 49 R 134 303 22 1,232 R 5,527 February .................... 219 R 575 892 2,607 (s) 49 R 135 153 R 17 1,306 R 5,062 March ......................... 233 R 711 815 2,563 (s) 63 R 145 249 R 14 1,280 R 5,257 April ........................... 242 R 614 634 2,363 (s) 46 R 141 260 R 25 1,072 R 4,763 May ............................ 370 R 728 384 2,129 1 52 R 147 287 R 19 1,159 R 4,891 June ........................... 475 R 497 398 2,201 (s) 62 R 151 305 R 17 1,240 R 4,948 July ............................ 471 R 490 466 2,353 (s) 59 R 148 282 R 20 1,157 R 4,982 August ....................... 508 R 622 491 2,428 (s) 56 R 150 397 R 19 1,234 R 5,413 September ................. 388 R 586 559 2,389 (s) 34 R 140 369 R 22 1,032 R 4,961 October ...................... 396 R 695 627 2,463 1 51 R 142 390 R 19 1,274 R 5,431 November .................. R 255 R 553 R 777 R 2,775 R (s) R 63 R 142 R 234 R 20 R 1,104 R 5,147 December .................. 179 427 947 2,877 (s) 43 142 221 25 1,181 5,096 Average .................... 329 600 676 2,502 1 52 143 289 20 1,189 5,125
a Industrial sector fuel use, including that at industrial combined-heat-and-power(CHP) and industrial electricity-only plants.
b Hydrocarbon gas liquids.c Propane and propylene. Through 1983, also includes 40% of "Butane-
Propane Mixtures" and 30% of "Ethane-Propane Mixtures."d Ethane, propane, normal butane, isobutane, natural gasoline (pentanes plus),
and refinery olefins (ethylene, propylene, butylene, and isobutylene). Through1983, also includes plant condensate and unfractionated stream.
e Finished motor gasoline. Through 1963, also includes special naphthas.Beginning in 1993, also includes fuel ethanol blended into motor gasoline.
f There is a discontinuity in this time series between 2014 and 2015 due to achange in the method for allocating motor gasoline consumption to the end-usesectors. Beginning in 2015, the commercial and industrial sector shares of motorgasoline consumption are larger than in 2014, while the transportation sector shareis smaller.
g Petrochemical feedstocks, still gas (refinery gas), waxes, and miscellaneousproducts. Beginning in 1964, also includes special naphthas. Beginning in 1981,
also includes negative barrels per day of distillate and residual fuel oil reclassifiedas unfinished oils, and other products (from both primary and secondary supply)reclassified as gasoline blending components. Beginning in 1983, also includescrude oil burned as fuel. Beginning in 2005, also includes naphtha-type jet fuel.
R=Revised. NA=Not available. (s)=Less than 500 barrels per day and greaterthan -500 barrels per day.
Notes: • Data are estimates. • For total petroleum consumption by all sectors,see petroleum products supplied data in Table 3.5. Petroleum products supplied isan approximation of petroleum consumption and is synonymous with the term"petroleum consumption" in Tables 3.7a–3.8c. See Note 1, "Petroleum ProductsSupplied and Petroleum Consumption," at end of section. • Totals may not equalsum of components due to independent rounding. • Geographic coverage is the50 states and the District of Columbia.
Web Page: See http://www.eia.gov/totalenergy/data/monthly/#petroleum (Exceland CSV files) for all available annual data beginning in 1949 and monthly databeginning in 1973.
Sources: See end of section.

U. S. Energy Information Administration / Monthly Energy Review March 2019 77
Table 3.7c Petroleum Consumption: Transportation and Electric Power Sectors (Thousand Barrels per Day)
Transportation Sector Electric Power Sectora
AviationGasoline
DistillateFuel Oilc
HGLb
JetFuele
Lubri-cants
MotorGasolinef,g
ResidualFuel Oil Total
DistillateFuel Oilh
PetroleumCoke
ResidualFuel Oili TotalPropaned
1950 Average .................... 108 226 2 e( ) 64 2,433 524 3,356 15 NA 192 2071955 Average .................... 192 372 9 154 70 3,221 440 4,458 15 NA 191 2061960 Average .................... 161 418 13 371 68 3,736 367 5,135 10 NA 231 2411965 Average .................... 120 514 23 602 67 4,374 336 6,036 14 NA 302 3161970 Average .................... 55 738 32 967 66 5,589 332 7,778 66 9 853 9281975 Average .................... 39 998 31 992 70 6,512 310 8,951 107 1 1,280 1,3881980 Average .................... 35 1,311 13 1,062 77 6,441 608 9,546 79 2 1,069 1,1511985 Average .................... 27 1,491 21 1,218 71 6,667 342 9,838 40 3 435 4781990 Average .................... 24 1,722 16 1,522 80 7,080 443 10,888 45 14 507 5661995 Average .................... 21 1,973 13 1,514 76 7,674 397 11,668 51 37 247 3342000 Average .................... 20 2,422 8 1,725 81 8,370 386 13,012 82 45 378 5052001 Average .................... 19 2,489 10 1,655 74 8,435 255 12,938 80 47 437 5642002 Average .................... 18 2,536 10 1,614 73 8,662 295 13,208 60 80 287 4272003 Average .................... 16 2,629 13 1,578 68 8,733 249 13,286 76 79 379 5342004 Average .................... 17 2,783 14 1,630 69 8,887 321 13,720 52 101 382 5352005 Average .................... 19 2,858 20 1,679 68 8,948 365 13,957 54 111 382 5472006 Average .................... 18 3,017 20 1,633 67 9,029 395 14,178 35 97 157 2892007 Average .................... 17 3,037 16 1,622 69 9,093 433 14,287 42 78 173 2932008 Average .................... 15 2,738 29 1,539 64 8,834 402 13,621 34 70 104 2092009 Average .................... 14 2,626 20 1,393 57 8,841 344 13,297 33 63 79 1752010 Average .................... 15 2,764 d 6 1,432 70 8,824 389 13,500 38 65 67 1702011 Average .................... 15 2,849 7 1,425 67 8,591 338 13,292 30 66 41 1372012 Average .................... 14 2,719 7 1,398 61 8,525 291 13,015 25 41 33 992013 Average .................... 12 2,804 7 1,434 65 8,679 253 13,255 26 59 34 1192014 Average .................... 12 2,928 7 1,470 67 8,778 195 13,456 39 57 41 1372015 Average .................... 11 2,974 7 1,548 74 g 8,835 202 13,651 33 54 41 128
2016 January ...................... 7 2,645 8 1,449 72 8,334 248 12,763 40 53 34 127 February .................... 11 2,721 8 1,534 79 8,881 128 13,361 31 55 39 126 March ......................... 10 2,892 7 1,547 76 9,027 311 13,869 22 58 22 102 April ........................... 14 2,936 7 1,566 70 8,837 392 13,821 21 63 23 107 May ............................ 11 2,968 7 1,578 70 9,069 275 13,978 26 57 24 107 June ........................... 12 3,113 6 1,723 78 9,253 285 14,469 23 61 29 114 July ............................ 12 3,027 7 1,720 61 9,224 351 14,402 26 63 43 132 August ....................... 14 3,172 6 1,722 66 9,329 254 14,564 24 66 41 131 September ................. 11 3,057 7 1,635 67 9,133 205 14,115 21 62 29 111 October ...................... 10 3,039 7 1,610 70 8,757 284 13,777 20 39 30 89 November .................. 12 2,916 7 1,632 64 8,892 258 13,781 27 49 25 101 December .................. 10 2,830 7 1,653 61 8,940 252 13,754 30 53 29 112 Average .................... 11 2,944 7 1,614 70 8,973 271 13,889 26 57 31 113
2017 January ...................... 9 2,588 8 1,588 72 R 8,198 476 R 12,940 30 58 28 116 February .................... 9 2,783 7 1,517 68 R 8,680 234 R 13,299 25 49 26 99 March ......................... 10 2,951 7 1,676 76 R 8,986 273 R 13,981 26 41 24 91 April ........................... 11 2,928 7 1,644 68 R 8,957 239 R 13,854 21 27 24 72 May ............................ 12 3,088 7 1,669 70 R 9,203 307 R 14,355 25 52 26 104 June ........................... 17 3,132 7 1,762 64 R 9,417 296 R 14,695 23 57 30 110 July ............................ 13 3,070 7 1,734 62 R 9,247 242 R 14,374 22 54 26 101 August ....................... 14 3,205 6 1,762 49 R 9,397 294 R 14,727 20 47 30 97 September ................. 10 3,078 6 1,627 61 R 9,037 254 R 14,073 22 45 27 95 October ...................... 9 3,079 7 1,751 66 R 9,017 274 R 14,203 23 36 27 86 November .................. 11 2,987 8 1,685 65 R 8,779 341 R 13,877 24 47 24 96 December .................. 12 2,806 8 1,756 50 R 8,911 239 R 13,782 50 46 51 147 Average .................... 11 2,976 7 1,682 64 R 8,988 290 R 14,018 26 47 29 101
2018 January ...................... 10 R 2,803 9 1,586 56 R 8,424 R 209 R 13,098 166 56 106 328 February .................... 7 R 2,849 8 1,599 56 R 8,497 R 239 R 13,255 20 49 24 93 March ......................... 13 R 3,050 8 1,718 71 R 9,103 R 186 R 14,149 20 39 21 80 April ........................... 13 R 3,146 8 1,634 53 R 8,853 R 359 R 14,066 23 40 24 87 May ............................ 12 R 3,299 7 1,707 59 R 9,203 R 266 R 14,553 26 25 26 78 June ........................... 15 R 3,255 7 1,854 71 R 9,442 R 202 R 14,845 26 49 30 105 July ............................ 16 R 3,287 7 1,772 68 R 9,289 R 288 R 14,728 21 54 28 103 August ....................... 14 R 3,393 8 1,856 64 R 9,393 262 R 14,990 22 52 R 31 R 105 September ................. 9 R 3,208 7 1,700 39 R 8,786 R 306 R 14,056 20 51 33 105 October ...................... 16 R 3,263 8 1,662 59 R 8,936 R 256 R 14,200 22 29 29 80 November .................. 7 R 3,019 9 R 1,769 R 72 R 8,911 R 273 R 14,061 24 40 26 90 December .................. 12 2,874 9 1,667 49 8,884 354 13,849 23 47 22 93 Average .................... 12 3,122 8 1,711 60 8,981 266 14,160 35 44 34 113
a Electricity-only and combined-heat-and-power (CHP) plants within the NAICS22 category whose primary business is to sell electricity, or electricity and heat, tothe public. Through 1988, data are for electric utilities only; beginning in 1989, dataare for electric utilities and independent power producers.
b Hydrocarbon gas liquids.c Beginning in 2009, includes renewable diesel fuel (including biodiesel)
blended into distillate fuel oil. d There is a discontinuity in this time series between 2009 and 2010 due to a
change in data sources.e Beginning in 1957, includes kerosene-type jet fuel. For 1952–2004, also
includes naphtha-type jet fuel. (Through 1951, naphtha-type jet fuel is included inthe products from which it was blended—gasoline, kerosene, and distillate fuel oil.Beginning in 2005, naphtha-type jet fuel is included in "Other" on Table 3.7b.)
f Finished motor gasoline. Through 1963, also includes special naphthas.Beginning in 1993, also includes fuel ethanol blended into motor gasoline.
g There is a discontinuity in this time series between 2014 and 2015 due to achange in the method for allocating motor gasoline consumption to the end-usesectors. Beginning in 2015, the commercial and industrial sector shares of motorgasoline consumption are larger than in 2014, while the transportation sector shareis smaller.
h Fuel oil nos. 1, 2, and 4. Through 1979, data are for gas turbine and internalcombustion plant use of petroleum. Through 2000, electric utility data also includesmall amounts of kerosene and jet fuel.
i Fuel oil nos. 5 and 6. Through 1979, data are for steam plant use ofpetroleum. Through 2000, electric utility data also include a small amount of fuel oilno. 4.
R=Revised. NA=Not available. Notes: • Transportation sector data are estimates. • For total petroleum
consumption by all sectors, see petroleum products supplied data in Table 3.5.Petroleum products supplied is an approximation of petroleum consumption and issynonymous with the term "petroleum consumption" in Tables 3.7a–3.8c. Othermeasurements of consumption by fuel type or sector may differ. For example, jetfuel product supplied may not equal jet fuel consumed by U.S-flagged aircraft. SeeNote 1, "Petroleum Products Supplied and Petroleum Consumption," at end ofsection. • Totals may not equal sum of components due to independent rounding.• Geographic coverage is the 50 states and the District of Columbia.
Web Page: See http://www.eia.gov/totalenergy/data/monthly/#petroleum (Exceland CSV files) for all available annual data beginning in 1949 and monthly databeginning in 1973.
Sources: See end of section.

78 U. S. Energy Information Administration / Monthly Energy Review March 2019
Figure 3.8a Heat Content of Petroleum Consumption by End‐Use Sector, 1949‐2018 (Quadrillion Btu)
Distillate Fuel Oil
HGL [b] Residual Fuel Oil
Kerosene
0
1
2
3
1950 1955 1960 1965 1970 1975 1980 1985 1990 1995 2000 2005 2010 2015
Residential and Commercial [a] Sectors, Selected Products
Distillate Fuel Oil
Asphalt and Road Oil
HGL [b]
0
1
2
3
4
1950 1955 1960 1965 1970 1975 1980 1985 1990 1995 2000 2005 2010 2015
Industrial [a] Sector, Selected Products
Motor Gasoline [c]
Distillate Fuel Oil [d]
Jet Fuel [e]
0
5
10
15
20
1950 1955 1960 1965 1970 1975 1980 1985 1990 1995 2000 2005 2010 2015
Transportation Sector, Selected Products
[a] Includes combined‐heat‐and‐power plants and a small number of electricity‐
only plants.
[b] Hydrocarbon gas liquids.
[c] Beginning in 1993, includes fuel ethanol blended into motor gasoline.
[d] Beginning in 2009, includes renewable diesel fuel (including biodiesel)
blended into distillate fuel oil.
[e] Beginning in 2005, includes kerosene‐type jet fuel only.
Note: Petroleum products supplied is an approximation of petroleum
consumption and is synonymous with the term “petroleum consumption”
in Tables 3.7a–3.8c. Other measurements of consumption by fuel type or
sector may differ. For example, jet fuel product supplied may not equal jet
fuel consumed by U.S.‐flagged aircraft.
Web Page: http://www.eia.gov/totalenergy/data/monthly/#petroleum.
Sources: Tables 3.8a–3.8c.

U. S. Energy Information Administration / Monthly Energy Review March 2019 79
Figure 3.8b Heat Content of Petroleum Consumption by End‐Use Sector, Monthly (Quadrillion Btu)
Distillate Fuel Oil
HGL [b]
Motor Gasoline
0.00
0.05
0.10
0.15
J F M A M J J A S O N D J F M A M J J A S O N D J F M A M J J A S O N D
2016 2017 2018
Residential and Commercial [a] Sectors, Selected Products
Distillate Fuel Oil
Asphalt and Road Oil
HGL [b]
0.0
0.1
0.2
0.3
0.4
J F M A M J J A S O N D J F M A M J J A S O N D J F M A M J J A S O N D
2016 2017 2018
Industrial [a] Sector, Selected Products
Motor Gasoline [c]
Distillate Fuel Oil [d]
Jet Fuel [e]
0.0
0.6
1.2
1.8
J F M A M J J A S O N D J F M A M J J A S O N D J F M A M J J A S O N D
2016 2017 2018
Transportation Sector, Selected Products
[a] Includes combined‐heat‐and‐power plants and a small number of electricity‐
only plants.
[b] Hydrocarbon gas liquids.
[c] Includes fuel ethanol blended into motor gasoline.
[d] Includes renewable diesel fuel (including biodiesel) blended into distillate
fuel oil.
[e] Includes kerosene‐type jet fuel only.
Note: Petroleum products supplied is an approximation of petroleum
consumption and is synonymous with the term “petroleum consumption”
in Tables 3.7a–3.8c. Other measurements of consumption by fuel type or
sector may differ. For example, jet fuel product supplied may not equal jet
fuel consumed by U.S.‐flagged aircraft.
Web Page: http://www.eia.gov/totalenergy/data/monthly/#petroleum.
Sources: Tables 3.8a–3.8c.

80 U. S. Energy Information Administration / Monthly Energy Review March 2019
Table 3.8a Heat Content of Petroleum Consumption: Residential and Commercial Sectors (Trillion Btu)
Residential Sector Commercial Sectora
DistillateFuel Oil
HGLb
Kero-sene Total
DistillateFuel Oil
HGLb
Kero-sene
MotorGasolinec,d
PetroleumCoke
ResidualFuel Oil TotalPropane Propane
1950 Total ...................... 829 146 347 1,322 262 39 47 100 NA 424 8721955 Total ...................... 1,194 202 371 1,767 377 54 51 133 NA 480 1,0951960 Total ...................... 1,568 305 354 2,227 494 81 48 67 NA 559 1,2481965 Total ...................... 1,713 385 334 2,432 534 103 54 77 NA 645 1,4131970 Total ...................... 1,878 549 298 2,725 587 143 61 86 NA 714 1,5921975 Total ...................... 1,807 512 161 2,479 587 129 49 89 NA 492 1,3461980 Total ...................... 1,316 311 107 1,734 518 88 41 107 NA 565 1,3181985 Total ...................... 1,092 314 159 1,565 631 95 33 96 NA 228 1,0831990 Total ...................... 978 352 64 1,394 536 102 12 111 0 230 9911995 Total ...................... 904 395 74 1,373 478 109 22 18 (s) 141 7692000 Total ...................... 904 555 95 1,553 490 150 30 44 (s) 92 8072001 Total ...................... 907 526 95 1,528 508 143 31 37 (s) 70 7892002 Total ...................... 859 537 60 1,456 444 141 16 45 (s) 80 7252003 Total ...................... 931 544 70 1,546 496 157 19 60 (s) 111 8422004 Total ...................... 923 512 85 1,519 470 152 20 45 (s) 122 8102005 Total ...................... 853 513 84 1,450 447 131 22 46 (s) 116 7622006 Total ...................... 709 446 66 1,221 400 123 15 48 (s) 75 6622007 Total ...................... 721 484 44 1,249 381 121 9 60 (s) 75 6482008 Total ...................... 750 553 21 1,324 384 158 4 45 (s) 71 6622009 Total ...................... 582 547 28 1,157 395 139 4 52 (s) 71 6622010 Total ...................... 562 529 29 1,120 391 140 5 52 (s) 62 6502011 Total ...................... 523 492 19 1,033 391 142 3 44 (s) 54 6352012 Total ...................... 482 395 8 885 355 135 1 39 (s) 31 5622013 Total ...................... 491 463 8 963 344 151 1 40 (s) 24 5612014 Total ...................... 533 489 14 1,036 357 160 2 54 1 8 5812015 Total ...................... 551 445 10 1,007 360 148 1 d 376 1 4 890
2016 January .................. 55 43 (s) 98 41 15 (s) 29 (s) 1 86 February ................ 53 39 (s) 92 40 13 (s) 29 (s) 1 84 March ..................... 38 38 1 77 28 13 (s) 32 (s) (s) 74 April ....................... 33 33 (s) 67 25 12 (s) 30 (s) (s) 67 May ........................ 30 35 1 66 23 12 (s) 32 0 (s) 67 June ....................... 21 31 1 53 15 11 (s) 32 (s) (s) 58 July ........................ 22 35 1 58 16 12 (s) 33 (s) (s) 62 August ................... 17 33 (s) 50 13 12 (s) 33 0 (s) 58 September ............. 26 34 2 61 19 12 (s) 31 0 (s) 63 October .................. 37 36 3 75 27 13 (s) 31 0 (s) 72 November .............. 39 35 (s) 75 30 12 (s) 30 (s) (s) 73 December .............. 64 39 3 106 48 14 (s) 32 (s) 1 94 Total ...................... 435 429 14 878 326 150 2 375 (s) 4 857
2017 January .................. 59 44 3 106 44 15 (s) R 28 (s) 1 R 89 February ................ 44 34 1 79 33 12 (s) R 27 (s) (s) R 72 March ..................... 41 39 (s) 80 31 13 (s) R 31 (s) (s) R 76 April ....................... 33 34 (s) 68 25 12 (s) R 30 (s) (s) R 67 May ........................ 24 34 (s) 59 18 12 (s) R 31 (s) (s) R 61 June ....................... 29 35 (s) 64 21 12 (s) R 31 (s) (s) R 65 July ........................ 18 37 (s) 55 14 13 (s) R 32 (s) (s) R 58 August ................... 24 32 (s) 56 18 11 (s) R 32 (s) (s) R 61 September ............. 23 32 2 57 17 11 (s) R 30 (s) (s) R 59 October .................. 30 35 (s) 65 22 12 (s) R 31 (s) (s) R 66 November .............. 45 40 (s) 85 33 14 (s) R 29 (s) (s) R 77 December .............. 63 44 (s) 107 47 15 (s) R 30 (s) 1 R 93 Total ...................... 432 440 8 881 323 154 1 R 361 (s) 4 R 843
2018 January .................. R 74 49 5 R 129 R 56 17 1 R 29 (s) 1 R 103 February ................ R 48 40 (s) R 88 R 36 14 (s) R 26 (s) (s) R 76 March ..................... R 40 44 (s) R 84 30 15 (s) R 31 (s) (s) R 76 April ....................... R 37 39 (s) R 76 R 27 14 (s) R 29 (s) (s) R 71 May ........................ R 22 36 1 R 59 17 13 (s) R 31 0 (s) R 61 June ....................... R 17 36 (s) 54 13 13 (s) R 31 0 (s) R 57 July ........................ R 16 39 (s) 56 R 12 14 (s) R 32 0 (s) R 58 August ................... 14 40 (s) 54 R 10 14 (s) R 32 0 (s) R 56 September ............. R 19 38 (s) R 57 R 14 13 (s) R 29 (s) (s) R 57 October .................. R 41 41 1 R 82 R 30 14 (s) R 30 (s) (s) R 76 November .............. R 53 R 45 R (s) R 97 R 39 16 (s) R 29 (s) (s) R 85 December .............. 72 48 (s) 120 54 17 (s) 30 (s) 1 101 Total ...................... 454 495 8 957 339 173 1 361 (s) 4 877
a Commercial sector fuel use, including that at commercial combined-heat-and-power (CHP) and commercial electricity-only plants.
b Hydrocarbon gas liquids.c Finished motor gasoline. Through 1963, also includes special naphthas.
Beginning in 1993, also includes fuel ethanol blended into motor gasoline.d There is a discontinuity in this time series between 2014 and 2015 due to a
change in the method for allocating motor gasoline consumption to the end-usesectors. Beginning in 2015, the commercial and industrial sector shares of motorgasoline consumption are larger than in 2014, while the transportation sector shareis smaller.
R=Revised. NA=Not available. (s)=Less than 0.5 trillion Btu and greater than-0.5 trillion Btu.
Notes: • Data are estimates. • For total heat content of petroleum consumptionby all sectors, see data for heat content of petroleum products supplied in Table3.6. Petroleum products supplied is an approximation of petroleum consumptionand is synonymous with the term "petroleum consumption" in Tables 3.7a–3.8c.See Note 1, "Petroleum Products Supplied and Petroleum Consumption," at end ofsection. • Totals may not equal sum of components due to independent rounding.• Geographic coverage is the 50 states and the District of Columbia.
Web Page: See http://www.eia.gov/totalenergy/data/monthly/#petroleum (Exceland CSV files) for all available annual data beginning in 1949 and monthly databeginning in 1973.
Sources: See end of section.

U. S. Energy Information Administration / Monthly Energy Review March 2019 81
Table 3.8b Heat Content of Petroleum Consumption: Industrial Sector (Trillion Btu)
Industrial Sectora
Asphaltand
Road OilDistillateFuel Oil
HGLb
Kerosene LubricantsMotor
Gasolinee,fPetroleum
CokeResidualFuel Oil Otherg TotalPropanec Totald
1950 Total ...................... 435 698 NA 156 274 94 251 90 1,416 546 3,9601955 Total ...................... 615 991 NA 323 241 103 332 147 1,573 798 5,1231960 Total ...................... 734 1,016 NA 507 161 107 381 328 1,584 947 5,7661965 Total ...................... 890 1,150 NA 712 165 137 342 444 1,582 1,390 6,8131970 Total ...................... 1,082 1,226 359 953 185 155 288 446 1,624 1,817 7,7761975 Total ...................... 1,014 1,339 422 1,161 119 149 223 540 1,509 2,071 8,1271980 Total ...................... 962 1,324 725 1,763 181 182 158 516 1,349 3,073 9,5091985 Total ...................... 1,029 1,119 797 1,871 44 166 218 575 748 1,945 7,7141990 Total ...................... 1,170 1,150 807 1,832 12 186 185 714 411 2,589 8,2511995 Total ...................... 1,178 1,130 1,013 2,328 15 178 200 721 337 2,499 8,5862000 Total ...................... 1,276 1,199 1,016 2,571 16 190 150 796 241 2,636 9,0742001 Total ...................... 1,257 1,299 916 2,278 23 174 295 858 203 2,793 9,1792002 Total ...................... 1,240 1,203 1,055 2,383 14 172 308 842 190 2,816 9,1692003 Total ...................... 1,220 1,169 981 2,249 24 159 323 825 220 3,043 9,2332004 Total ...................... 1,304 1,213 1,109 2,364 28 161 371 937 249 3,205 9,8322005 Total ...................... 1,323 1,262 1,049 2,205 39 160 354 894 281 3,122 9,6412006 Total ...................... 1,261 1,258 1,105 2,244 30 156 374 938 239 3,276 9,7762007 Total ...................... 1,197 1,256 1,102 2,285 13 161 302 910 193 3,134 9,4512008 Total ...................... 1,012 1,348 870 1,976 4 150 245 870 194 2,788 8,5872009 Total ...................... 873 1,073 910 2,077 4 135 238 805 130 2,483 7,8182010 Total ...................... 878 1,153 946 2,298 7 136 260 694 120 2,645 8,1912011 Total ...................... 859 1,236 970 2,255 4 127 254 663 135 2,621 8,1552012 Total ...................... 827 1,271 1,109 2,451 2 118 252 717 70 2,474 8,1832013 Total ...................... 783 1,266 1,162 2,644 1 125 263 663 48 2,583 8,3772014 Total ...................... 793 1,366 975 2,514 3 131 210 653 41 2,430 8,1402015 Total ...................... 832 1,170 1,025 2,729 2 142 f 258 663 34 2,435 8,263
2016 January .................. 40 113 129 270 (s) 12 21 62 4 208 731 February ................ 44 115 119 235 (s) 12 21 55 2 235 718 March ..................... 52 119 90 234 (s) 13 22 59 5 205 709 April ....................... 60 88 64 208 (s) 11 21 43 6 215 653 May ........................ 81 80 67 212 (s) 12 22 42 4 199 652 June ....................... 96 88 53 198 (s) 12 22 35 4 208 664 July ........................ 97 59 66 217 (s) 10 23 50 6 205 666 August ................... 108 93 67 206 (s) 11 23 71 4 233 748 September ............. 87 99 72 214 (s) 11 22 42 3 210 687 October .................. 86 102 74 233 (s) 12 22 52 5 217 728 November .............. 62 103 84 219 (s) 10 21 80 4 197 697 December .............. 40 100 112 253 (s) 10 22 63 4 222 715 Total ...................... 853 1,157 997 2,700 2 135 262 653 52 2,553 8,368
2017 January .................. 38 96 137 278 1 12 20 69 7 209 730 February ................ 45 105 93 215 (s) 10 R 20 32 3 196 625 March ..................... 53 133 90 248 (s) 13 22 27 4 237 737 April ....................... 63 83 73 221 (s) 11 R 22 49 3 239 690 May ........................ 75 109 57 219 (s) 12 23 56 4 226 725 June ....................... 95 90 50 210 (s) 10 23 41 4 240 713 July ........................ 91 67 60 232 (s) 10 23 76 3 231 734 August ................... 112 98 61 200 (s) 8 23 48 4 221 714 September ............. 88 102 79 206 (s) 10 22 56 4 204 691 October .................. 85 110 63 240 (s) 11 R 23 27 4 224 722 November .............. 61 120 92 251 (s) 10 21 64 5 217 751 December .............. 43 91 104 280 (s) 8 22 65 4 224 737 Total ...................... 849 1,205 960 2,799 1 125 R 264 610 50 2,667 R 8,571
2018 January .................. 42 R 125 135 313 1 9 21 58 4 227 R 801 February ................ 41 R 93 96 256 (s) 8 19 27 3 217 R 664 March ..................... 48 R 127 97 272 (s) 12 R 23 48 3 236 R 768 April ....................... 48 R 106 73 242 (s) 8 21 48 5 192 R 671 May ........................ 76 R 130 46 224 (s) 10 23 55 4 215 R 736 June ....................... 95 R 86 46 224 (s) 11 23 57 3 222 R 721 July ........................ 97 R 88 55 249 (s) 11 23 54 4 215 R 741 August ................... 104 R 111 58 259 (s) 10 23 76 4 228 R 817 September ............. 77 R 101 64 246 (s) 6 21 68 4 185 R 710 October .................. 81 R 124 75 265 (s) 10 22 R 74 4 234 R 815 November .............. R 51 R 96 R 89 R 290 (s) R 12 R 22 R 43 R 4 R 198 R 715 December .............. 37 76 113 313 (s) 8 22 43 5 218 723 Total ...................... 797 1,265 947 3,154 1 116 264 650 46 2,588 8,882
a Industrial sector fuel use, including that at industrial combined-heat-and-power(CHP) and industrial electricity-only plants.
b Hydrocarbon gas liquids.c Propane and propylene. Through 1983, also includes 40% of "Butane-
Propane Mixtures" and 30% of "Ethane-Propane Mixtures."d Ethane, propane, normal butane, isobutane, natural gasoline (pentanes plus),
and refinery olefins (ethylene, propylene, butylene, and isobutylene). Through1983, also includes plant condensate and unfractionated stream.
e Finished motor gasoline. Through 1963, also includes special naphthas.Beginning in 1993, also includes fuel ethanol blended into motor gasoline.
f There is a discontinuity in this time series between 2014 and 2015 due to achange in the method for allocating motor gasoline consumption to the end-usesectors. Beginning in 2015, the commercial and industrial sector shares of motorgasoline consumption are larger than in 2014, while the transportation sector shareis smaller.
g Petrochemical feedstocks, still gas (refinery gas), waxes, and miscellaneousproducts. Beginning in 1964, also includes special naphthas. Beginning in 1981,
also includes negative barrels per day of distillate and residual fuel oil reclassifiedas unfinished oils, and other products (from both primary and secondary supply)reclassified as gasoline blending components. Beginning in 1983, also includescrude oil burned as fuel. Beginning in 2005, also includes naphtha-type jet fuel.
R=Revised. NA=Not available. (s)=Less than 0.5 trillion Btu and greater than-0.5 trillion Btu.
Notes: • Data are estimates. • For total heat content of petroleum consumptionby all sectors, see data for heat content of petroleum products supplied in Table3.6. Petroleum products supplied is an approximation of petroleum consumptionand is synonymous with the term "petroleum consumption" in Tables 3.7a–3.8c.See Note 1, "Petroleum Products Supplied and Petroleum Consumption," at end ofsection. • Totals may not equal sum of components due to independent rounding.• Geographic coverage is the 50 states and the District of Columbia.
Web Page: See http://www.eia.gov/totalenergy/data/monthly/#petroleum (Exceland CSV files) for all available annual data beginning in 1949 and monthly databeginning in 1973.
Sources: See end of section.

82 U. S. Energy Information Administration / Monthly Energy Review March 2019
Table 3.8c Heat Content of Petroleum Consumption: Transportation and Electric Power Sectors (Trillion Btu)
Transportation Sector Electric Power Sectora
AviationGasoline
DistillateFuel Oilc
HGLb
JetFuele
Lubri-cants
MotorGasolinef,g
ResidualFuel Oil Total
DistillateFuel Oilh
PetroleumCoke
ResidualFuel Oili TotalPropaned
1950 Total .................... 199 480 3 e( ) 141 4,664 1,201 6,690 32 NA 440 4721955 Total .................... 354 791 13 301 155 6,175 1,009 8,799 32 NA 439 4711960 Total .................... 298 892 19 739 152 7,183 844 10,125 22 NA 530 5531965 Total .................... 222 1,093 32 1,215 149 8,386 770 11,866 29 NA 693 7221970 Total .................... 100 1,569 44 1,973 147 10,716 761 15,310 141 19 1,958 2,1171975 Total .................... 71 2,121 43 2,029 155 12,485 711 17,615 226 2 2,937 3,1661980 Total .................... 64 2,795 18 2,179 172 12,383 1,398 19,009 169 5 2,459 2,6341985 Total .................... 50 3,170 30 2,497 156 12,784 786 19,472 85 7 998 1,0901990 Total .................... 45 3,661 23 3,129 176 13,575 1,016 21,626 97 30 1,163 1,2891995 Total .................... 40 4,191 18 3,132 168 14,576 911 23,036 108 81 566 7552000 Total .................... 36 5,159 12 3,580 179 15,933 888 25,787 175 99 871 1,1442001 Total .................... 35 5,286 14 3,426 164 16,013 586 25,524 170 103 1,003 1,2762002 Total .................... 34 5,387 14 3,340 162 16,437 677 26,051 127 175 659 9612003 Total .................... 30 5,584 18 3,265 150 16,565 571 26,184 161 175 869 1,2052004 Total .................... 31 5,925 19 3,383 152 16,901 740 27,150 111 211 879 1,2012005 Total .................... 35 6,068 28 3,475 151 16,958 837 27,553 114 231 876 1,2222006 Total .................... 33 6,390 27 3,379 147 17,088 906 27,972 73 203 361 6372007 Total .................... 32 6,411 22 3,358 152 17,066 994 28,034 89 163 397 6482008 Total .................... 28 5,792 40 3,193 141 16,510 926 26,630 73 146 240 4592009 Total .................... 27 5,537 28 2,883 127 16,422 791 25,814 70 132 181 3822010 Total .................... 27 5,826 d 9 2,963 155 16,320 892 26,191 80 137 154 3702011 Total .................... 27 5,997 10 2,950 148 15,877 776 25,785 64 138 93 2952012 Total .................... 25 5,736 10 2,901 135 15,795 671 25,274 52 85 77 2142013 Total .................... 22 5,894 9 2,969 143 16,030 581 25,648 55 123 77 2552014 Total .................... 22 6,154 9 3,042 149 16,209 447 26,032 82 118 95 2952015 Total .................... 21 6,251 9 3,204 163 g 16,308 463 26,419 70 112 94 276
2016 January ................ 1 472 1 255 14 1,306 48 2,097 7 9 7 23 February .............. 2 454 1 252 14 1,302 23 2,048 5 9 7 22 March ................... 2 516 1 272 14 1,415 61 2,280 4 10 4 18 April ..................... 2 507 1 266 13 1,340 74 2,203 4 11 4 19 May ...................... 2 529 1 277 13 1,421 54 2,297 5 10 5 19 June ..................... 2 537 1 293 14 1,403 54 2,304 4 11 5 20 July ...................... 2 539 1 302 11 1,445 68 2,370 5 11 8 24 August ................. 2 565 1 303 12 1,462 50 2,395 4 12 8 24 September ........... 2 527 1 278 12 1,385 39 2,244 4 11 5 20 October ................ 2 542 1 283 13 1,372 55 2,268 4 7 6 16 November ............ 2 503 1 278 12 1,349 49 2,192 5 8 5 18 December ............ 2 504 1 291 12 1,401 49 2,259 5 9 6 20 Total .................... 20 6,197 10 3,350 154 16,601 623 26,956 55 118 71 244
2017 January ................ 1 462 1 279 14 R 1,284 93 R 2,134 5 10 5 21 February .............. 1 448 1 241 12 R 1,228 41 1,972 4 8 5 16 March ................... 2 526 1 295 14 R 1,408 53 R 2,299 5 7 5 17 April ..................... 2 505 1 280 12 R 1,358 45 R 2,203 4 5 4 13 May ...................... 2 550 1 293 13 R 1,442 60 R 2,361 5 9 5 19 June ..................... 3 540 1 300 12 R 1,428 56 R 2,338 4 10 6 19 July ...................... 2 547 1 305 12 1,448 47 R 2,362 4 10 5 18 August ................. 2 571 1 310 9 R 1,472 57 2,422 4 8 6 18 September ........... 1 531 1 277 11 R 1,370 48 R 2,239 4 8 5 17 October ................ 1 549 1 308 12 1,412 53 R 2,338 4 6 5 16 November ............ 2 516 1 287 12 R 1,331 64 R 2,212 4 8 4 17 December ............ 2 500 1 309 9 R 1,396 47 R 2,264 9 8 10 27 Total .................... 21 6,248 10 3,481 142 R 16,576 665 R 27,144 55 97 66 218
2018 January ................ 1 R 500 1 279 11 R 1,320 41 R 2,153 30 10 21 60 February .............. 1 R 459 1 254 10 R 1,202 42 R 1,969 3 8 4 15 March ................... 2 R 544 1 302 13 R 1,426 36 R 2,325 4 7 4 15 April ..................... 2 R 543 1 278 10 R 1,342 R 68 R 2,244 4 7 4 15 May ...................... 2 R 589 1 300 11 R 1,442 52 R 2,396 5 4 5 14 June ..................... 2 R 562 1 315 13 R 1,432 38 R 2,363 5 8 6 19 July ...................... 3 R 586 1 312 13 R 1,455 56 R 2,426 4 10 R 6 19 August ................. 2 R 605 1 326 12 R 1,472 51 R 2,469 4 9 6 19 September ........... 1 R 554 1 289 7 R 1,332 R 58 R 2,242 4 9 6 19 October ................ 3 R 582 1 292 11 R 1,400 50 R 2,339 4 5 6 15 November ............ 1 R 521 1 R 301 R 13 R 1,351 R 51 R 2,240 4 7 5 16 December ............ 2 513 1 293 9 1,392 69 2,279 4 8 4 17 Total .................... 22 6,559 11 3,541 132 16,567 612 27,444 73 92 77 243
a Electricity-only and combined-heat-and-power (CHP) plants within the NAICS22 category whose primary business is to sell electricity, or electricity and heat, tothe public. Through 1988, data are for electric utilities only; beginning in 1989,data are for electric utilities and independent power producers.
b Hydrocarbon gas liquids.c Beginning in 2009, includes renewable diesel fuel (including biodiesel)
blended into distillate fuel oil. d There is a discontinuity in this time series between 2009 and 2010 due to a
change in data sources.e Beginning in 1957, includes kerosene-type jet fuel. For 1952–2004, also
includes naphtha-type jet fuel. (Through 1951, naphtha-type jet fuel is included inthe products from which it was blended—gasoline, kerosene, and distillate fuel oil.Beginning in 2005, naphtha-type jet fuel is included in "Other" on Table 3.8b.)
f Finished motor gasoline. Through 1963, also includes special naphthas.Beginning in 1993, also includes fuel ethanol blended into motor gasoline.
g There is a discontinuity in this time series between 2014 and 2015 due to achange in the method for allocating motor gasoline consumption to the end-usesectors. Beginning in 2015, the commercial and industrial sector shares of motorgasoline consumption are larger than in 2014, while the transportation sector shareis smaller.
h Fuel oil nos. 1, 2, and 4. Through 1979, data are for gas turbine and internal
combustion plant use of petroleum. Through 2000, electric utility data also includesmall amounts of kerosene and jet fuel.
i Fuel oil nos. 5 and 6. Through 1979, data are for steam plant use ofpetroleum. Through 2000, electric utility data also include a small amount of fueloil no. 4.
R=Revised. NA=Not available. Notes: • Transportation sector data are estimates. • For total heat content of
petroleum consumption by all sectors, see data for heat content of petroleumproducts supplied in Table 3.6. Petroleum products supplied is an approximationof petroleum consumption and is synonymous with the term "petroleumconsumption" in Tables 3.7a–3.8c. Other measurements of consumption by fueltype or sector may differ. For example, jet fuel product supplied may not equal jetfuel consumed by U.S.-flagged aircraft. See Note 1, "Petroleum Products Suppliedand Petroleum Consumption," at end of section. • Totals may not equal sum ofcomponents due to independent rounding. • Geographic coverage is the 50states and the District of Columbia.
Web Page: See http://www.eia.gov/totalenergy/data/monthly/#petroleum (Exceland CSV files) for all available annual data beginning in 1949 and monthly databeginning in 1973.
Sources: See end of section.

U. S. Energy Information Administration / Monthly Energy Review March 2019 83
Petroleum Note 1. Petroleum Products Supplied and Petroleum Consumption. Total petroleum products supplied is the sum of
the products supplied for each petroleum product, crude oil, unfinished oils, and gasoline blending components. This
also includes petroleum products supplied for non‐combustion use in the industrial and transportation sectors (see
Tables 1.11a and 1.11b). In general, except for crude oil, product supplied of each product is computed as follows: field
production, plus renewable fuels and oxygenate plant net production, plus refinery and blender net production, plus
imports, plus net receipts, plus adjustments, minus stock change, minus refinery and blender net inputs, minus exports.
Crude oil product supplied is the sum of crude oil burned on leases and at pipeline pump stations as reported on Form
EIA‐813, "Monthly Crude Oil Report." Prior to 1983, crude oil burned on leases and used at pipeline pump stations was
reported as either distillate or residual fuel oil and was included as product supplied for these products. Petroleum
product supplied (see Tables 3.5 and 3.6) is an approximation of petroleum consumption and is synonymous with the
term "Petroleum Consumption" in Tables 3.7a–3.8c.
Note 2. Petroleum Survey Respondents. The U.S. Energy Information Administration (EIA) uses a number of sources
and methods to maintain the survey respondent lists. On a regular basis, survey managers review such industry
publications as the Oil & Gas Journal and Oil Daily for information on facilities or companies starting up or closing down
operations. Those sources are augmented by articles in newspapers, communications from respondents indicating
changes in status, and information received from survey systems.
To supplement routine frames maintenance and to provide more thorough coverage, a comprehensive frames
investigation is conducted every 3 years. This investigation results in the reassessment and recompilation of the
complete frame for each survey. The effort also includes the evaluation of the impact of potential frame changes on the
historical time series of data from these respondents. The results of this frame study are usually implemented in
January to provide a full year under the same frame.
Note 3. Historical Petroleum Data. Detailed information on petroleum data through 1993 can be found in Notes 1–6
on pages 60 and 61 in the July 2013 Monthly Energy Review (MER) at
http://www.eia.gov/totalenergy/data/monthly/archive/00351307.pdf. The notes discuss:
Note 1, "Petroleum Survey Respondents": In 1993, EIA added numerous companies that produce, blend, store, or
import oxygenates to the monthly surveys.
Note 2, "Motor Gasoline": In 1981, EIA expanded its universe to include nonrefinery blenders and separated blending
components from finished motor gasoline as a reporting category. In 1993, EIA made adjustments to finished motor
gasoline product supplied data to more accurately account for fuel ethanol and motor gasoline blending components
blended into finished motor gasoline.
Note 3, "Distillate and Residual Fuel Oils": In 1981, EIA eliminated the requirement to report crude oil in pipelines or
burned on leases as either distillate or residual fuel oil.
Note 4, "Petroleum New Stock Basis": In 1975, 1979, 1981, and 1983, EIA added numerous respondents to bulk terminal
and pipeline surveys; in 1984, EIA made changes in the reporting of natural gas liquids; and in 1993, EIA changed how it
collected bulk terminal and pipeline stocks of oxygenates. These changes affected stocks reported and stock change
calculations.
Note 5, "Stocks of Alaskan Crude Oil": In 1981, EIA began to include data for stocks of Alaskan crude oil in transit.
Note 6, "Petroleum Data Discrepancies": In 1976, 1978, and 1979, there are some small discrepancies between data in
the MER and the Petroleum Supply Annual.
Table 3.1 Sources
1949–1975: Bureau of Mines, Mineral Industry Surveys, Petroleum Statement, Annual, annual reports.

84 U. S. Energy Information Administration / Monthly Energy Review March 2019
1976–1980: U.S. Energy Information Administration (EIA), Energy Data Reports, Petroleum Statement, Annual, annual
reports.
1981–2001: EIA, Petroleum Supply Annual (PSA), annual reports.
2002 forward: EIA, PSA, annual reports, and unpublished revisions; Petroleum Supply Monthly, monthly reports;
revisions to crude oil production, total field production, and adjustments (based on crude oil production data from:
Form EIA‐914, "Monthly Crude Oil, Lease Condensate, and Natural Gas Production Report"; state government agencies;
U.S. Department of the Interior, Bureau of Safety and Environmental Enforcement, and predecessor agencies; and Form
EIA‐182, "Domestic Crude Oil First Purchase Report"); and, for the current two months, Weekly Petroleum Status Report
data system and Monthly Energy Review data system calculations.
Table 3.2 Sources
1949–1975: Bureau of Mines, Mineral Industry Surveys, Petroleum Statement, Annual, annual reports; and U.S. Energy
Information Administration (EIA) estimates. (For 1967–1975, refinery and blender net production estimates for
propylene are equal to “Propane/Propylene Production at Refineries for Chemical Use”; and estimates for propane are
equal to total propane/propylene minus propylene.)
1976–1980: EIA, Energy Data Reports, Petroleum Statement, Annual, annual reports, and estimates. (Refinery and
blender net production estimates for propylene are equal to “Propane/Propylene Production at Refineries for Chemical
Use”; and estimates for propane are equal to total propane/propylene minus propylene.)
1981–2017: EIA, Petroleum Supply Annual, annual reports, unpublished revisions, and estimates. (For 1981–1985,
refinery and blender net production estimates for propylene are equal to “Propane/Propylene Production at Refineries
for Petrochemical Use”; and estimates for propane are equal to total propane/propylene minus propylene. For 1986–
1988, refinery and blender net production estimates for propylene are created using the 1989 annual propylene share
of “Net Refinery Production of Propane/Propylene”; and estimates for propane are equal to total propane/propylene
minus propylene.)
2018 and 2019: EIA, Petroleum Supply Monthly, monthly reports; and, for the current two months, Weekly Petroleum
Status Report data system, Short‐Term Integrated Forecasting System, and Monthly Energy Review data system
calculations.
Table 3.5 Sources
1949–1975: Bureau of Mines, Mineral Industry Surveys, Petroleum Statement, Annual, annual reports; and U.S. Energy
Information Administration (EIA) estimates. (For 1949–1966, product supplied estimates for total propane/propylene
are created using sales and shipments data from Bureau of Mines, Mineral Industry Surveys, Sales of Liquefied
Petroleum Gases and Ethane, annual reports, and Shipments of Liquefied Petroleum Gases and Ethane, annual reports–
annual growth rates of sales and shipments are applied to the 1967 total propane/propylene product supplied value to
create historical annual estimates. For 1949–1966, product supplied estimates for propylene are created using the 1967
annual propylene share of total propane/propylene product supplied; and estimates for propane are equal to total
propane/propylene minus propylene. For 1967–1975, product supplied estimates for propylene are equal to propylene
refinery and blender net production from Table 3.2; and estimates for propane are equal to total propane/propylene
minus propylene.)
1976–1980: EIA, Energy Data Reports, Petroleum Statement, Annual, annual reports, and estimates. (Product supplied
estimates for propylene are equal to propylene refinery and blender net production from Table 3.2; and estimates for
propane are equal to total propane/propylene minus propylene.)
1981–2017: EIA, Petroleum Supply Annual, annual reports, unpublished revisions, and estimates. (For 1981–1992,
product supplied estimates for propylene are equal to propylene refinery and blender net production from Table 3.2;
and estimates for propane are equal to total propane/propylene minus propylene. For 1993–2009, product supplied

U. S. Energy Information Administration / Monthly Energy Review March 2019 85
estimates for propylene are equal to propylene refinery and blender net production from Table 3.2, plus propylene
imports from Table 3.3b; and estimates for propane are equal to total propane/propylene minus propylene.)
2018 and 2019: EIA, Petroleum Supply Monthly, monthly reports; and, for the current two months, Weekly Petroleum
Status Report data system, Short‐Term Integrated Forecasting System, and Monthly Energy Review data system
calculations.
Table 3.6 Sources
Asphalt and Road Oil Product supplied data in thousand barrels per day for asphalt and road oil are from Table 3.5, and are converted to
trillion Btu by multiplying by the asphalt and road oil heat content factor in Table A1.
Aviation Gasoline Product supplied data in thousand barrels per day for aviation gasoline are from Table 3.5, and are converted to trillion
Btu by multiplying by the aviation gasoline (finished) heat content factor in Table A1.
Distillate Fuel Oil 1949–2008: Product supplied data in thousand barrels per day for distillate fuel oil are from Table 3.5, and are
converted to trillion Btu by multiplying by the distillate fuel oil heat content factors in Table A3.
2009–2011: Consumption data for biodiesel are calculated using biodiesel data from U.S. Energy Information
Administration (EIA), EIA‐22M, “Monthly Biodiesel Production Survey”; and biomass‐based diesel fuel data from EIA‐810,
“Monthly Refinery Report,” EIA‐812, “Monthly Product Pipeline Report,” and EIA‐815, “Monthly Bulk Terminal and
Blender Report” (the data are converted to Btu by multiplying by the biodiesel heat content factor in Table A1).
Consumption data for other renewable diesel fuel are set equal to refinery and blender net inputs data from EIA‐810,
“Monthly Refinery Report,” and EIA‐815, “Monthly Bulk Terminal and Blender Report” (the data are converted to Btu by
multiplying by the other renewable diesel fuel heat content factor in Table A1). Product supplied data for distillate fuel
oil from Table 3.5, minus consumption data for biodiesel and other renewable diesel fuel, are converted to Btu by
multiplying by the distillate fuel oil heat content factors in Table A3. Total distillate fuel oil product supplied is the sum
of values for distillate fuel oil (excluding biodiesel and other renewable diesel fuel), biodiesel, and other renewable
diesel fuel.
2012 forward: Consumption data for biodiesel are from Table 10.4. Consumption data for other renewable diesel fuel
are set equal to refinery and blender net inputs data from EIA‐810, “Monthly Refinery Report,” and EIA‐815, “Monthly
Bulk Terminal and Blender Report” (the data are converted to Btu by multiplying by the other renewable diesel fuel heat
content factor in Table A1). Product supplied data for distillate fuel oil from Table 3.5, minus consumption data for
biodiesel and other renewable diesel fuel, are converted to Btu by multiplying by the distillate fuel oil heat content
factors in Table A3. Total distillate fuel oil product supplied is the sum of the values for distillate fuel oil (excluding
biodiesel and other renewable diesel fuel), biodiesel, and other renewable diesel fuel.
Hydrocarbon Gas Liquids (HGL)—Propane (Including Propylene) Product supplied data in thousand barrels per day for propane (including propylene) are from Table 3.5, and are
converted to trillion Btu by multiplying by the propane/propylene heat content factor in Table A1.
Hydrocarbon Gas Liquids (HGL)—Total Prior to the current two months, product supplied data in thousand barrels per day for the component products of HGL
(ethane, propane, normal butane, isobutane, natural gasoline, and refinery olefins—ethylene, propylene, butylene, and
isobutylene) are from the PSA, PSM, and earlier publications (see sources for Table 3.5). These data are converted to
trillion Btu by multiplying by the appropriate heat content factors in Table A1. Total HGL product supplied is the sum of
the data in trillion Btu for the HGL component products.
For the current two months: Note that "liquefied petroleum gases" ("LPG") below include ethane, propane, normal
butane, isobutane, and refinery olefins (ethylene, propylene, butylene, and isobutylene), but exclude natural gasoline.
Product supplied data in thousand barrels per day for LPG are from EIA's Short‐Term Integrated Forecasting System
86 U. S. Energy Information Administration / Monthly Energy Review March 2019
(STIFS). (The STIFS model results are used in EIA's Short‐Term Energy Outlook, which is accessible on the Web at
https://www.eia.gov/outlooks/steo/.) These data are converted to trillion Btu by multiplying by the previous year's
quantity‐weighted LPG heat content factor (derived using LPG component heat content factors in Table A1). Product
supplied data in thousand barrels per day for natural gasoline are from STIFS, and are converted to trillion Btu by
multiplying by the natural gasoline heat content factor in Table A1. Total HGL product supplied is the sum of the data in
trillion Btu for LPG and natural gasoline.
Jet Fuel Product supplied data in thousand barrels per day for kerosene‐type jet fuel and, through 2004, naphtha‐type jet fuel
are from the PSA, PSM, and earlier publications (see sources for Table 3.5). These data are converted to trillion Btu by
multiplying by the appropriate heat content factors in Table A1. Total jet fuel product supplied is the sum of the data in
trillion Btu for kerosene‐type and naphtha‐type jet fuel.
Kerosene Product supplied data in thousand barrels per day for kerosene are from Table 3.5, and are converted to trillion Btu by
multiplying by the kerosene heat content factor in Table A1.
Lubricants Product supplied data in thousand barrels per day for lubricants are from Table 3.5, and are converted to trillion Btu by
multiplying by the lubricants heat content factor in Table A1.
Motor Gasoline Product supplied data in thousand barrels per day for motor gasoline are from Table 3.5, and are converted to trillion
Btu by multiplying by the motor gasoline heat content factors in Table A3.
Other Petroleum Products Prior to the current two months, product supplied data in thousand barrels per day for "other" petroleum products are
from the PSA, PSM, and earlier publications (see sources for Table 3.5). "Other" petroleum products include
petrochemical feedstocks, special naphthas, still gas (refinery gas), waxes, and miscellaneous products; beginning in
1981, also includes negative barrels per day of distillate and residual fuel oil reclassified as unfinished oils, and other
products (from both primary and secondary supply) reclassified as gasoline blending components; beginning in 1983,
also includes crude oil burned as fuel; and beginning in 2005, also includes naphtha‐type jet fuel. These data are
converted to trillion Btu by multiplying by the appropriate heat content factors in MER Table A1. Total "Other"
petroleum product supplied is the sum of the data in trillion Btu for the individual products.
For the current two months, total "Other" petroleum products supplied is calculated by first estimating total petroleum
products supplied (product supplied data in thousand barrels per day for total petroleum from Table 3.5 are converted
to trillion Btu by multiplying by the total petroleum consumption heat content factor in Table A3), and then subtracting
data in trillion Btu (from Table 3.6) for asphalt and road oil, aviation gasoline, distillate fuel oil, jet fuel, kerosene, total
HGL, lubricants, motor gasoline, petroleum coke, and residual fuel oil.
Petroleum Coke Product supplied data in thousand barrels per day for petroleum coke are from Table 3.5, and are converted to trillion
Btu by multiplying by the petroleum coke heat content factors in Table A3.
Residual Fuel Oil Product supplied data in thousand barrels per day for residual fuel oil are from Table 3.5, and are converted to trillion
Btu by multiplying by the residual fuel oil heat content factor in Table A1.
Total Petroleum Total petroleum products supplied is the sum of the data in trillion Btu for the products (except "Propane") shown in
Table 3.6.

U. S. Energy Information Administration / Monthly Energy Review March 2019 87
Tables 3.7a–3.7c Sources
Petroleum consumption data for 1949–1972 are from the following sources:
1949–1959: Bureau of Mines, Mineral Industry Surveys, Petroleum Statement, Annual, annual reports, and U.S. Energy
Information Administration (EIA) estimates.
1960–1972: EIA, State Energy Data System.
Petroleum consumption data beginning in 1973 are derived from data for "petroleum products supplied" from the
following sources:
1973–1975: Bureau of Mines, Mineral Industry Surveys, Petroleum Statement Annual, annual reports.
1976–1980: EIA, Energy Data Reports, Petroleum Statement Annual, annual reports.
1981–2017: EIA, Petroleum Supply Annual (PSA), annual reports, and unpublished revisions.
2018: EIA, Petroleum Supply Monthly (PSM), monthly reports.
Beginning in 1973, energy‐use allocation procedures by individual product are as follows:
Asphalt and Road Oil All consumption of asphalt and road oil is assigned to the industrial sector.
Aviation Gasoline All consumption of aviation gasoline is assigned to the transportation sector.
Distillate Fuel Oil Distillate fuel oil consumption is assigned to the sectors as follows:
Distillate Fuel Oil, Electric Power Sector See sources for Table 7.4b. For 1973–1979, electric utility consumption of distillate fuel oil is assumed to be the amount
of petroleum (minus small amounts of kerosene and kerosene‐type jet fuel deliveries) consumed in gas turbine and
internal combustion plants. For 1980–2000, electric utility consumption of distillate fuel oil is assumed to be the
amount of light oil (fuel oil nos. 1 and 2, plus small amounts of kerosene and jet fuel) consumed.
Distillate Fuel Oil, End-Use Sectors, Annual Data The aggregate end‐use amount is total distillate fuel oil product supplied minus the amount consumed by the electric
power sector. The end‐use total consumed annually is allocated to the individual end‐use sectors (residential,
commercial, industrial, and transportation) in proportion to each sector's share of sales as reported in EIA's Fuel Oil and
Kerosene Sales (Sales) report series (DOE/EIA‐0535), which is based primarily on data collected by Form EIA‐821, "Annual
Fuel Oil and Kerosene Sales Report" (previously Form EIA‐172). Shares for the current year are based on the most
recent Sales report.
Following are notes on the individual sector groupings:
Beginning in 1979, the residential sector sales total is directly from the Sales reports. Through 1978, each year's sales
subtotal of the heating plus industrial category is split into residential, commercial, and industrial (including farm) in
proportion to the 1979 shares.
Beginning in 1979, the commercial sector sales total is directly from the Sales reports. Through 1978, each year's sales
subtotal of the heating plus industrial category is split into residential, commercial, and industrial (including farm) in
proportion to the 1979 shares.

88 U. S. Energy Information Administration / Monthly Energy Review March 2019
Beginning in 1979, the industrial sector sales total is the sum of the sales for industrial, farm, oil company, off‐highway
diesel, and all other uses. Through 1978, each year's sales subtotal of the heating plus industrial category is split into
residential, commercial, and industrial (including farm) in proportion to the 1979 shares, and this estimated industrial
portion is added to oil company, off‐highway diesel, and all other uses.
The transportation sector sales total is the sum of the sales for railroad, vessel bunkering, on‐highway diesel, and
military uses for all years.
Distillate Fuel Oil, End-Use Sectors, Monthly Data Residential sector and commercial sector monthly consumption is estimated by allocating the annual estimates, which
are described above, into the months in proportion to each month's share of the year's sales of No. 2 heating oil. (For
each month of the current year, the residential and commercial consumption increase from the same month in the
previous year is based on the percent increase in that month's No. 2 heating oil sales from the same month in the
previous year.) The years' No. 2 heating oil sales totals are from the following sources: for 1973–1980, the Ethyl
Corporation, Monthly Report of Heating Oil Sales; for 1981 and 1982, the American Petroleum Institute, Monthly Report
of Heating Oil Sales; and for 1983 forward, EIA, Form EIA‐782A, "Refiners'/Gas Plant Operators' Monthly Petroleum
Product Sales Report," No. 2 Fuel Oil Sales to End Users and for Resale.
The transportation highway use portion is allocated into the months in proportion to each month's share of the year's
total sales for highway use as reported by the Federal Highway Administration's Table MF‐25, "Private and Commercial
Highway Use of Special Fuels by Months." Beginning in 1994, the sales‐for‐highway‐use data are no longer available as a
monthly series; the 1993 data are used for allocating succeeding year's totals into months.
A distillate fuel oil "balance" is calculated as total distillate fuel oil product supplied minus the amount consumed by the
electric power sector, residential sector, commercial sector, and for highway use.
Industrial sector monthly consumption is estimated by multiplying each month's distillate fuel oil "balance" by the
annual industrial consumption share of the annual distillate fuel oil "balance."
Total transportation sector monthly consumption is estimated as total distillate fuel oil product supplied minus the
amount consumed by the residential, commercial, industrial, and electric power sectors.
Hydrocarbon Gas Liquids (HGL)—Propane (Including Propylene) and Total Note that "liquefied petroleum gases" ("LPG") below include ethane, propane, normal butane, isobutane, and refinery
olefins (ethylene, propylene, butylene, and isobutylene), but exclude natural gasoline.
The annual shares of LPG total consumption that are estimated to be used by each sector are applied to each month's
total LPG consumption to create monthly sector consumption estimates. The annual sector shares are calculated as
described below.
Annual residential sector LPG consumption: Through 2002, residential sector LPG consumption is estimated by applying
the average of the state residential shares for 2003–2008 to the combined residential and commercial propane sales.
Beginning in 2003, residential sector LPG consumption is assumed to equal propane retail sales to the residential sector
and sales to retailers.
Annual commercial sector LPG consumption: Through 2002, commercial sector LPG consumption is equal to the
combined residential and commercial propane sales minus residential sector LPG consumption. Beginning in 2003,
commercial sector LPG consumption is assumed to equal commercial sector propane sales.
Annual transportation sector LPG consumption: Through 2009, transportation sector LPG consumption is assumed to
equal the transportation portion of propane sales for internal combustion engines (these sales are allocated between
the transportation and industrial sectors using data for special fuels used on highways provided by the U.S. Department
of Transportation, Federal Highway Administration). Beginning in 2010, transportation sector LPG consumption is from
EIA, Annual Energy Outlook, Table 37, “Transportation Sector Energy Use by Fuel Type within a Mode.”

U. S. Energy Information Administration / Monthly Energy Review March 2019 89
Annual industrial sector LPG consumption: Industrial sector LPG is estimated as the difference between LPG total
product supplied and the sum of the estimated LPG consumption by the residential, commercial, and transportation
sectors. The industrial sector LPG consumption includes LPG used by chemical plants as raw materials or solvents and
used in the production of synthetic rubber; refinery fuel use; use as synthetic natural gas feedstock and use in secondary
recovery projects; all farm use; LPG sold to gas utility companies for distribution through the mains; and a portion of the
use of LPG as an internal combustion engine fuel.
Sources of the annual consumption estimates for creating annual sector shares are:
1973–1982: EIA's "Sales of Liquefied Petroleum Gases and Ethane" reports, based primarily on data collected by Form
EIA‐174, "Sales of Liquefied Petroleum Gases."
1983: End‐use consumption estimates for 1983 are based on 1982 end‐use consumption because the collection of data
under Form EIA‐174 was discontinued after data year 1982.
1984–2007: American Petroleum Institute (API), "Sales of Natural Gas Liquids and Liquefied Refinery Gases," table on
sales of natural gas liquids and liquefied refinery gases by end use. EIA adjusts the data to remove quantities of natural
gasoline and to estimate withheld values.
2008 and 2009: Propane consumption is from API, “Sales of Natural Gas Liquids and Liquefied Refinery Gases,” table on
sales of propane by end use. EIA adjusts the data to estimate withheld values. Other LPG consumption is from EIA, PSA,
annual reports, and is allocated to the industrial sector.
2010 forward: Propane consumption is from API, “Sales of Natural Gas Liquids and Liquefied Refinery Gases,” table on
sales of odorized propane by end use; and EIA, Annual Energy Outlook, Table 37, “Transportation Sector Energy Use by
Fuel Type Within a Mode.” EIA adjusts the data to estimate withheld values. Other LPG consumption is from EIA, PSA,
annual reports, and is allocated to the industrial sector.
Residential sector propane (including propylene) consumption is equal to residential sector LPG consumption.
Commercial sector propane (including propylene) consumption is equal to commercial sector LPG consumption.
Transportation sector propane (including propylene) consumption is equal to transportation sector LPG consumption.
Industrial sector propane (including propylene) consumption is equal to propane (including propylene) product supplied
from the PSA, PSM, and earlier publications (see sources for Table 3.5), minus propane (including propylene)
consumption in the residential, commercial, and transportation sectors.
Industrial sector total HGL consumption: Product supplied data in thousand barrels per day for natural gasoline are from
the PSA, PSM, and earlier publications (see sources for Table 3.5). Industrial sector total HGL consumption is the sum of
industrial sector LPG consumption and natural gasoline product supplied.
Jet Fuel Through 1982, small amounts of kerosene‐type jet fuel were consumed by the electric power sector. Kerosene‐type jet
fuel deliveries to the electric power sector as reported on Form FERC‐423 (formerly Form FPC‐423) were used as
estimates of this consumption. Through 2004, all remaining jet fuel (kerosene‐type and naphtha‐type) is assigned to the
transportation sector. Beginning in 2005, kerosene‐type jet fuel is assigned to the transportation sector, while naphtha‐
type jet fuel is classified under "Other Petroleum Products," which is assigned to the industrial sector. (Note: Petroleum
products supplied is an approximation of petroleum consumption and is synonymous with the term "petroleum
consumption" in Tables 3.7a–3.8c. Other measurements of consumption by fuel type or sector may differ. For example,
jet fuel product supplied may not equal jet fuel consumed by U.S.‐flagged aircraft.)
Kerosene Kerosene product supplied is allocated to the individual end‐use sectors (residential, commercial, and industrial) in
proportion to each sector's share of sales as reported in EIA's Fuel Oil and Kerosene Sales (Sales) report series (DOE/EIA‐
0535), which is based primarily on data collected by Form EIA‐821, "Annual Fuel Oil and Kerosene Sales Report"
(previously Form EIA‐172).

90 U. S. Energy Information Administration / Monthly Energy Review March 2019
Beginning in 1979, the residential sector sales total is directly from the Sales reports. Through 1978, each year's sales
category called "heating" is allocated to the residential, commercial, and industrial sectors in proportion to the 1979
shares.
Beginning in 1979, the commercial sector sales total is directly from the Sales reports. Through 1978, each year's sales
category called "heating" is allocated to the residential, commercial, and industrial sectors in proportion to the 1979
shares.
Beginning in 1979, the industrial sector sales total is the sum of the sales for industrial, farm, and all other uses. Through
1978, each year's sales category called "heating" is allocated to the residential, commercial and industrial sectors in
proportion to the 1979 shares, and the estimated industrial (including farm) portion is added to all other uses.
Lubricants 1973–2009: The consumption of lubricants is allocated to the industrial and transportation sectors for all months
according to proportions developed from annual sales of lubricants to the two sectors from U.S. Department of
Commerce, U.S. Census Bureau, Current Industrial Reports, "Sales of Lubricating and Industrial Oils and Greases." The
1973 shares are applied to 1973 and 1974; the 1975 shares are applied to 1975 and 1976; and the 1977 shares are
applied to 1977 through 2009.
2010 forward: The consumption of lubricants in the industrial sector is estimated by EIA based on Kline & Company data
on finished lubricant demand for industrial (less marine and railroad) use. The consumption of lubricants in the
transportation sector is estimated by EIA based on Kline & Company data on finished lubricant demand for consumer
total, commercial total, marine, and railroad use. Estimates for lubricant consumption from 2010 forward are not
compatible with data before 2010.
Motor Gasoline The total monthly consumption of motor gasoline is allocated to the sectors in proportion to aggregations of annual
sales categories created on the basis of the U.S. Department of Transportation, Federal Highway Administration,
Highway Statistics, Tables MF‐21, MF‐24, and MF‐25, as follows:
Through 2014, commercial sales are the sum of sales for public non‐highway use and miscellaneous use. Beginning in
2015, commercial sales are the sum of sales for public non‐highway use, lawn and garden use, and miscellaneous use.
For all years, industrial sales are the sum of sales for agriculture, construction, and "industrial and commercial" use (as
classified in the Highway Statistics).
Through 2014, transportation sales are the sum of sales for highway use (minus the sales of special fuels, which are
primarily diesel fuel and are accounted for in the transportation sector of distillate fuel) and sales for marine use.
Beginning in 2015, transportation sales are the sum of sales for highway use (minus the sales of special fuels, which are
primarily diesel fuel and are accounted for in the transportation sector of distillate fuel) and sales for boating use and
recreational vehicle use.
Petroleum Coke Portions of petroleum coke are consumed by the electric power sector (see sources for Table 7.4b) and the commercial
sector (see sources for Table 7.4c). The remaining petroleum coke is assigned to the industrial sector.
Residual Fuel Oil Residual fuel oil consumption is assigned to the sectors as follows:
Residual Fuel Oil, Electric Power Sector See sources for Table 7.4b. For 1973–1979, electric utility consumption of residual fuel oil is assumed to be the amount
of petroleum consumed in steam‐electric power plants. For 1980–2000, electric utility consumption of residual fuel oil is
assumed to be the amount of heavy oil (fuel oil nos. 4, 5, and 6) consumed.

U. S. Energy Information Administration / Monthly Energy Review March 2019 91
Residual Fuel Oil, End-Use Sectors, Annual Data The aggregate end‐use amount is total residual fuel oil product supplied minus the amount consumed by the electric
power sector. The end‐use total consumed annually is allocated to the individual end‐use sectors (commercial,
industrial, and transportation) in proportion to each sector's share of sales as reported in EIA's Fuel Oil and Kerosene
Sales (Sales) report series (DOE/EIA‐535), which is based primarily on data collected by Form EIA‐821, "Annual Fuel Oil
and Kerosene Sales Report" (previously Form EIA‐172). Shares for the current year are based on the most recent Sales
report.
Following are notes on the individual sector groupings:
Beginning in 1979, commercial sales data are directly from the Sales reports. Through 1978, each year's sales subtotal of
the heating plus industrial category is allocated to the commercial and industrial sectors in proportion to the 1979
shares.
Beginning in 1979, industrial sales data are the sum of sales for industrial, oil company, and all other uses. Through
1978, each year's sales subtotal of the heating plus industrial category is allocated to the commercial and industrial
sectors in proportion to the 1979 shares, and the estimated industrial portion is added to oil company and all other uses.
Transportation sales are the sum of sales for railroad, vessel bunkering, and military uses for all years.
Residual Fuel Oil, End-Use Sectors, Monthly Data Commercial sector monthly consumption is estimated by allocating the annual estimates, which are described above,
into the months in proportion to each month's share of the year's sales of No. 2 heating oil. (For each month of the
current year, the consumption increase from the same month in the previous year is based on the percent increase in
that month's No. 2 heating oil sales from the same month in the previous year.) The years' No. 2 heating oil sales totals
are from the following sources: for 1973–1980, the Ethyl Corporation, Monthly Report of Heating Oil Sales; for 1981 and
1982, the American Petroleum Institute, Monthly Report of Heating Oil Sales; and for 1983 forward, EIA, Form EIA‐782A,
"Refiners'/Gas Plant Operators' Monthly Petroleum Product Sales Report," No. 2 Fuel Oil Sales to End Users and for
Resale.
A residual fuel oil "balance" is calculated as total residual fuel oil product supplied minus the amount consumed by the
electric power sector, commercial sector, and by industrial combined‐heat‐and‐power plants (see sources for Table
7.4c).
Transportation sector monthly consumption is estimated by multiplying each month's residual fuel oil "balance" by the
annual transportation consumption share of the annual residual fuel oil "balance."
Total industrial sector monthly consumption is estimated as total residual fuel oil product supplied minus the amount
consumed by the commercial, transportation, and electric power sectors.
Other Petroleum Products Consumption of all remaining petroleum products is assigned to the industrial sector. Other petroleum products include
petrochemical feedstocks, special naphthas, still gas (refinery gas), waxes, and miscellaneous products. Beginning in
1981, also includes negative barrels per day of distillate and residual fuel oil reclassified as unfinished oils, and other
products (from both primary and secondary supply) reclassified as gasoline blending components. Beginning in 1983,
also includes crude oil burned as fuel. Beginning in 2005, also includes naphtha‐type jet fuel.
Table 3.8a Sources
Distillate Fuel Oil Residential and commercial sector consumption data in thousand barrels per day for distillate fuel oil are from Table
3.7a, and are converted to trillion Btu by multiplying by the distillate fuel oil heat content factors in Table A3.
Hydrocarbon Gas Liquids (HGL)—Propane (Including Propylene) Residential and commercial sector consumption data in thousand barrels per day for HGL are from Table 3.7a, and are
converted to trillion Btu by multiplying by the propane/propylene heat content factor in Table A1.

92 U. S. Energy Information Administration / Monthly Energy Review March 2019
Kerosene Residential and commercial sector consumption data in thousand barrels per day for kerosene are from Table 3.7a, and
are converted to trillion Btu by multiplying by the kerosene heat content factor in Table A1.
Motor Gasoline Commercial sector consumption data in thousand barrels per day for motor gasoline are from Table 3.7a, and are
converted to trillion Btu by multiplying by the motor gasoline heat content factors in Table A3.
Petroleum Coke 1949–2003: Commercial sector consumption data in thousand barrels per day for petroleum coke are from Table 3.7a,
and are converted to trillion Btu by multiplying by the total petroleum coke heat content factor in Table A1.
2004 forward: Commercial sector consumption data in thousand barrels per day for petroleum coke are from Table
3.7a, and are converted to trillion Btu by multiplying by the marketable petroleum coke heat content factor in Table A1.
Residual Fuel Oil Commercial sector consumption data in thousand barrels per day for residual fuel oil are from Table 3.7a, and are
converted to trillion Btu by multiplying by the residual fuel oil heat content factor in Table A1.
Total Petroleum Residential sector total petroleum consumption is the sum of the data in trillion Btu for the petroleum products shown
under "Residential Sector" in Table 3.8a. Commercial sector total petroleum consumption is the sum of the data in
trillion Btu for the petroleum products shown under "Commercial Sector" in Table 3.8a.
Table 3.8b Sources
Asphalt and Road Oil Industrial sector consumption data in thousand barrels per day for asphalt and road oil are from Table 3.7b, and are
converted to trillion Btu by multiplying by the asphalt and road oil heat content factor in Table A1.
Distillate Fuel Oil Industrial sector consumption data in thousand barrels per day for distillate fuel oil are from Table 3.7b, and are
converted to trillion Btu by multiplying by the distillate fuel oil heat content factors in Table A3.
Hydrocarbon Gas Liquids (HGL)—Propane (Including Propylene) Industrial sector consumption data in thousand barrels per day for HGL are from Table 3.7b, and are converted to trillion
Btu by multiplying by the propane/propylene heat content factor in Table A1.
Hydrocarbon Gas Liquids (HGL)—Total Industrial sector consumption data for HGL are calculated by subtracting HGL consumption data in trillion Btu for the
residential (Table 3.8a), commercial (Table 3.8a), and transportation (Table 3.8c) sectors from total HGL consumption
(Table 3.6).
Kerosene Industrial sector consumption data in thousand barrels per day for kerosene are from Table 3.7b, and are converted to
trillion Btu by multiplying by the kerosene heat content factor in Table A1.
Lubricants Industrial sector consumption data in thousand barrels per day for lubricants are from Table 3.7b, and are converted to
trillion Btu by multiplying by the lubricants heat content factor in Table A1.
Motor Gasoline Industrial sector consumption data in thousand barrels per day for motor gasoline are from Table 3.7b, and are
converted to trillion Btu by multiplying by the motor gasoline heat content factors in Table A3.

U. S. Energy Information Administration / Monthly Energy Review March 2019 93
Other Petroleum Products Industrial sector "Other" petroleum data are equal to the "Other" petroleum data in Table 3.6.
Petroleum Coke 1949–2003: Industrial sector consumption data in thousand barrels per day for petroleum coke are from Table 3.7b,
and are converted to trillion Btu by multiplying by the total petroleum coke heat content factor in Table A1.
2004 forward: Industrial sector consumption data for petroleum coke are calculated by subtracting petroleum coke
consumption data in trillion Btu for the commercial (Table 3.8a) and electric power (Table 3.8c) sectors from total
petroleum coke consumption (Table 3.6).
Residual Fuel Oil Industrial sector consumption data in thousand barrels per day for residual fuel oil are from Table 3.7b, and are
converted to trillion Btu by multiplying by the residual fuel oil heat content factor in Table A1.
Total Petroleum Industrial sector total petroleum consumption is the sum of the data in trillion Btu for the petroleum products shown in
Table 3.8b.
Table 3.8c Sources
Aviation Gasoline Transportation sector consumption data in thousand barrels per day for aviation gasoline are from Table 3.7c, and are
converted to trillion Btu by multiplying by the aviation gasoline (finished) heat content factor in Table A1.
Distillate Fuel Oil, Electric Power Sector Electric power sector consumption data in thousand barrels per day for distillate fuel oil are from Table 3.7c, and are
converted to trillion Btu by multiplying by the distillate fuel oil heat content factors in Table A3.
Distillate Fuel Oil, Transportation Sector 1949–2008: Transportation sector consumption data in thousand barrels per day for distillate fuel oil are from Table
3.7c, and are converted to trillion Btu by multiplying by the distillate fuel oil heat content factors in Table A3.
2009–2011: Consumption data for biodiesel are calculated using biodiesel data from U.S. Energy Information
Administration (EIA), EIA‐22M, “Monthly Biodiesel Production Survey”; and biomass‐based diesel fuel data from EIA‐810,
“Monthly Refinery Report,” EIA‐812, “Monthly Product Pipeline Report,” and EIA‐815, “Monthly Bulk Terminal and
Blender Report” (the data are converted to Btu by multiplying by the biodiesel heat content factor in Table A1).
Consumption data for other renewable diesel fuel are set equal to refinery and blender net inputs data from EIA‐810,
“Monthly Refinery Report,” and EIA‐815, “Monthly Bulk Terminal and Blender Report” (the data are converted to Btu by
multiplying by the other renewable diesel fuel heat content factor in Table A1). Transportation sector distillate fuel oil
consumption data from Table 3.7c, minus consumption data for biodiesel and other renewable diesel fuel, are converted
to Btu by multiplying by the distillate fuel heat content factors in Table A3. Total transportation sector distillate fuel oil
consumption is the sum of the values for distillate fuel oil (excluding biodiesel and other renewable diesel fuel),
biodiesel, and other renewable diesel fuel.
2012 forward: Consumption data for biodiesel are from Table 10.4. Consumption data for other renewable diesel fuel
are set equal to refinery and blender net inputs data from EIA‐810, “Monthly Refinery Report,” and EIA‐815, “Monthly
Bulk Terminal and Blender Report” (the data are converted to Btu by multiplying by the other renewable diesel fuel heat
content factor in Table A1). Transportation sector distillate fuel oil consumption data from Table 3.7c, minus
consumption data for biodiesel and other renewable diesel fuel, are converted to Btu by multiplying by the distillate fuel
oil heat content factors in Table A3. Total transportation sector distillate fuel oil consumption is the sum of the values
for distillate fuel oil (excluding biodiesel and other renewable diesel fuel), biodiesel, and other renewable diesel fuel.

94 U. S. Energy Information Administration / Monthly Energy Review March 2019
Hydrocarbon Gas Liquids (HGL)—Propane (Including Propylene) Transportation sector consumption data in thousand barrels per day for HGL are from Table 3.7c, and are converted to
trillion Btu by multiplying by the propane/propylene heat content factor in Table A1.
Jet Fuel Transportation sector consumption data in thousand barrels per day for kerosene‐type jet fuel and, through 2004,
naphtha‐type jet fuel (see sources for Table 3.7c) are converted to trillion Btu by multiplying by the appropriate heat
content factors in Table A1. Total transportation sector jet fuel consumption is the sum of the data in trillion Btu for
kerosene‐type and naphtha‐type jet fuel. (Note: Petroleum products supplied is an approximation of petroleum
consumption and is synonymous with the term "petroleum consumption" in Tables 3.7a–3.8c. Other measurements of
consumption by fuel type or sector may differ. For example, jet fuel product supplied may not equal jet fuel consumed
by U.S.‐flagged aircraft.)
Lubricants Transportation sector consumption data in thousand barrels per day for lubricants are from Table 3.7c, and are
converted to trillion Btu by multiplying by the lubricants heat content factor in Table A1.
Motor Gasoline Transportation sector consumption data in thousand barrels per day for motor gasoline are from Table 3.7c, and are
converted to trillion Btu by multiplying by the motor gasoline heat content factors in Table A3.
Petroleum Coke 1949–2003: Electric power sector consumption data in thousand barrels per day for petroleum coke are from Table
3.7c, and are converted to trillion Btu by multiplying by the total petroleum coke heat content factor in Table A1.
2004 forward: Electric power sector consumption data in thousand barrels per day for petroleum coke are from Table
3.7c, and are converted to trillion Btu by multiplying by the marketable petroleum coke heat content factor in Table A1.
Residual Fuel Oil Transportation and electric power consumption data in thousand barrels per day for residual fuel oil are from Table 3.7c,
and are converted to trillion Btu by multiplying by the residual fuel oil heat content factor in Table A1.
Total Petroleum Transportation sector total petroleum consumption is the sum of the data in trillion Btu for the petroleum products
shown under "Transportation Sector" in Table 3.8c. Electric power sector total petroleum consumption is the sum of the
data in trillion Btu for the petroleum products shown under "Electric Power Sector" in Table 3.8c.

4. Natural
Gas

96 U. S. Energy Information Administration / Monthly Energy Review March 2019
Figure 4.1 Natural Gas (Trillion Cubic Feet)
Net Imports
Dry Production
Consumption
-5
0
5
10
15
20
25
30
35
1950 1955 1960 1965 1970 1975 1980 1985 1990 1995 2000 2005 2010 2015
Overview, 1949–2018
Commercial
Industrial
Residential
Transportation
Electric Power
0
2
4
6
8
10
12
1950 1955 1960 1965 1970 1975 1980 1985 1990 1995 2000 2005 2010 2015
Consumption by Sector, 1949–2018
Net Imports
Dry Production
Consumption
-0.5
0.0
0.5
1.0
1.5
2.0
2.5
3.0
3.5
J F M A M J J A S O N D J F M A M J J A S O N D J F M A M J J A S O N D
2016 2017 2018
Overview, Monthly
Commercial
Industrial
Residential
Transportation
Electric Power
0.0
0.2
0.4
0.6
0.8
1.0
1.2
1.4
J F M A M J J A S O N D J F M A M J J A S O N D J F M A M J J A S O N D
2016 2017 2018
Consumption by Sector, Monthly
Web Page: http://www.eia.gov/totalenergy/data/monthly/#naturalgas.
Sources: Tables 4.1 and 4.3.

U. S. Energy Information Administration / Monthly Energy Review March 2019 97
Table 4.1 Natural Gas Overview (Billion Cubic Feet)
GrossWith-
drawalsa
MarketedProduction
(Wet)bNGPL
ProductioncDry Gas
Productiond
Supple-mental
GaseousFuelse
Trade NetStorage
With-drawalsf
BalancingItemg
Consump-tionhImports Exports
NetImports
1950 Total .................... 8,480 i 6,282 260 i 6,022 NA 0 26 -26 -54 -175 5,7671955 Total .................... 11,720 i 9,405 377 i 9,029 NA 11 31 -20 -68 -247 8,6941960 Total .................... 15,088 i 12,771 543 i 12,228 NA 156 11 144 -132 -274 11,9671965 Total .................... 17,963 i 16,040 753 i 15,286 NA 456 26 430 -118 -319 15,2801970 Total .................... 23,786 i 21,921 906 i 21,014 NA 821 70 751 -398 -228 21,1391975 Total .................... 21,104 i 20,109 872 i 19,236 NA 953 73 880 -344 -235 19,5381980 Total .................... 21,870 20,180 777 19,403 155 985 49 936 23 -640 19,8771985 Total .................... 19,607 17,270 816 16,454 126 950 55 894 235 -428 17,2811990 Total .................... 21,523 18,594 784 17,810 123 1,532 86 1,447 -513 307 j 19,1741995 Total .................... 23,744 19,506 908 18,599 110 2,841 154 2,687 415 396 22,2072000 Total .................... 24,174 20,198 1,016 19,182 90 3,782 244 3,538 829 -306 23,3332001 Total .................... 24,501 20,570 954 19,616 86 3,977 373 3,604 -1,166 99 22,2392002 Total .................... 23,941 19,885 957 18,928 68 4,015 516 3,499 467 65 23,0272003 Total .................... 24,119 19,974 876 19,099 68 3,944 680 3,264 -197 44 22,2772004 Total .................... 23,970 19,517 927 18,591 60 4,259 854 3,404 -114 461 22,4032005 Total .................... 23,457 18,927 876 18,051 64 4,341 729 3,612 52 236 22,0142006 Total .................... 23,535 19,410 906 18,504 66 4,186 724 3,462 -436 103 21,6992007 Total .................... 24,664 20,196 930 19,266 63 4,608 822 3,785 192 -203 23,1042008 Total .................... 25,636 21,112 953 20,159 61 3,984 963 3,021 34 2 23,2772009 Total .................... 26,057 21,648 1,024 20,624 65 3,751 1,072 2,679 -355 -103 22,9102010 Total .................... 26,816 22,382 1,066 21,316 65 3,741 1,137 2,604 -13 115 24,0872011 Total .................... 28,479 24,036 1,134 22,902 60 3,469 1,506 1,963 -354 -94 24,4772012 Total .................... 29,542 25,283 1,250 24,033 61 3,138 1,619 1,519 -9 -66 25,5382013 Total .................... 29,523 25,562 1,357 24,206 55 2,883 1,572 1,311 546 38 26,1552014 Total .................... 31,405 27,498 1,608 25,890 60 2,695 1,514 1,181 -254 -283 26,5932015 Total .................... 32,915 28,772 1,707 27,065 59 2,718 1,784 935 -547 -268 27,244
2016 January ................ 2,823 2,435 155 2,280 5 274 169 105 741 -40 3,092 February .............. 2,654 2,311 147 2,163 5 252 163 89 411 -16 2,652 March ................... 2,825 2,442 155 2,287 5 241 195 46 53 -34 2,356 April ..................... 2,679 2,362 150 2,211 5 241 178 63 -171 -25 2,084 May ...................... 2,768 2,412 154 2,259 5 248 188 60 -337 -21 1,966 June ..................... 2,628 2,312 147 2,165 5 242 183 59 -229 1 2,001 July ...................... 2,721 2,409 153 2,256 5 265 189 76 -139 -11 2,187 August ................. 2,723 2,390 152 2,238 5 262 214 48 -130 48 2,208 September ........... 2,626 2,297 146 2,151 5 238 202 37 -270 25 1,948 October ................ 2,720 2,365 151 2,214 5 231 176 55 -316 -32 1,925 November ............ 2,678 2,307 147 2,161 5 231 228 3 39 -48 2,159 December ............ 2,747 2,358 150 2,207 5 281 251 30 688 -63 2,866 Total .................... 32,592 28,400 1,808 26,592 57 3,006 2,335 671 340 -216 27,444
2017 January ................ 2,749 2,355 154 2,202 5 292 272 20 687 -1 2,913 February .............. 2,505 2,146 140 2,005 5 255 255 (s) 292 38 2,339 March ................... 2,812 2,431 159 2,272 5 281 272 9 281 -45 2,523 April ..................... 2,703 2,355 154 2,201 5 238 247 -9 -236 -31 1,931 May ...................... 2,787 2,430 159 2,271 5 244 254 -10 -348 -28 1,891 June ..................... 2,693 2,370 155 2,215 5 240 253 -14 -287 -11 1,909 July ...................... 2,764 2,479 162 2,317 6 251 248 2 -155 -29 2,140 August ................. 2,781 2,478 162 2,316 6 248 247 1 -201 -28 2,093 September ........... 2,767 2,434 159 2,275 5 229 250 -21 -323 -17 1,920 October ................ 2,907 2,550 166 2,384 6 244 281 -37 -254 -69 2,030 November ............ 2,884 2,535 165 2,370 6 244 288 -45 90 -66 2,355 December ............ 3,006 2,635 172 2,463 6 278 299 -22 707 -72 3,083 Total .................... 33,357 29,197 1,906 27,291 66 3,042 3,168 -125 254 -360 27,126
2018 January ................ E 2,959 E 2,586 171 E 2,415 6 304 301 3 896 -12 3,308 February .............. E 2,724 E 2,385 163 E 2,222 6 241 276 -36 467 41 2,699 March ................... E 3,048 E 2,673 188 E 2,485 6 274 292 -18 285 R 13 R 2,771 April ..................... E 2,960 E 2,598 185 E 2,413 5 244 279 -35 -32 R -16 2,335 May ...................... E 3,082 E 2,713 193 E 2,521 5 229 273 -44 -423 -12 2,046 June ..................... E 2,955 E 2,641 188 E 2,453 6 230 261 -31 -349 R -31 R 2,048 July ...................... E 3,108 E 2,784 198 E 2,585 5 249 306 -56 -186 R -3 R 2,344 August ................. E 3,180 E 2,845 205 E 2,640 6 239 311 -72 -235 R -30 R 2,309 September ........... E 3,135 E 2,790 199 E 2,591 6 216 302 -86 -334 -20 2,156 October ................ RE 3,272 E 2,909 206 E 2,703 6 217 306 -88 -291 R -53 R 2,276 November ............ RE 3,227 RE 2,849 199 RE 2,650 6 213 R 337 R -124 205 R -48 R 2,689 December ............ E 3,341 E 2,946 200 E 2,746 5 255 362 -108 319 8 2,970 Total .................... E 36,991 E 32,719 2,295 E 30,423 68 2,911 3,607 -696 321 -164 29,952
a Gases withdrawn from natural gas, crude oil, coalbed, and shale gas wells.Includes natural gas, natural gas plant liquids, and nonhydrocarbon gases; butexcludes lease condensate.
b Gross withdrawals minus repressuring, nonhydrocarbon gases removed, andvented and flared. See Note 1, "Natural Gas Production," at end of section.
c Natural gas plant liquids (NGPL) production, gaseous equivalent. This dataseries was previously called "Extraction Loss." See Note 2, "Natural Gas PlantLiquids Production," at end of section.
d Marketed production (wet) minus NGPL production.e See Note 3, "Supplemental Gaseous Fuels," at end of section.f Net withdrawals from underground storage. For 1980–2017, also includes net
withdrawals of liquefied natural gas in above-ground tanks. See Note 4, "NaturalGas Storage," at end of section.
g See Note 5, "Natural Gas Balancing Item," at end of section. Beginning in1980, excludes transit shipments that cross the U.S.-Canada border (i.e., naturalgas delivered to its destination via the other country).
h See Note 6, "Natural Gas Consumption," at end of section.i Through 1979, may include unknown quantities of nonhydrocarbon gases.j For 1989–1992, a small amount of consumption at independent power
producers may be counted in both "Other Industrial" and "Electric Power Sector" on
Table 4.3. See Note 7, "Natural Gas Consumption, 1989–1992," at end of section.R=Revised. E=Estimate. (s)=Less than 0.5 billion cubic feet and greater than
-0.5 billion cubic feet. NA=Not available. Notes: • See Note 8, "Natural Gas Data Adjustments, 1993–2000," at end of
section. • Through 1964, all volumes are shown on a pressure base of 14.65 psia(pounds per square inch absolute) at 60° Fahrenheit; beginning in 1965, thepressure base is 14.73 psia at 60° Fahrenheit. • Totals may not equal sum ofcomponents due to independent rounding. • Geographic coverage is the 50 statesand the District of Columbia (except Alaska, for which underground storage isexcluded from "Net Storage Withdrawals" through 2012).
Web Page: See http://www.eia.gov/totalenergy/data/monthly/#naturalgas (Exceland CSV files) for all available annual data beginning in 1949 and monthly databeginning in 1973.
Sources: • Imports and Exports: Table 4.2. • Consumption: Table 4.3.• Balancing Item: Calculated as consumption minus dry gas production,supplemental gaseous fuels, net imports, and net storage withdrawals. • All OtherData: 1949–2017—U.S. Energy Information Administration (EIA), Natural GasAnnual, annual reports. 2018 forward—EIA, Natural Gas Monthly, February 2019,Table 1.

98 U. S. Energy Information Administration / Monthly Energy Review March 2019
Table 4.2 Natural Gas Trade by Country (Billion Cubic Feet)
Imports Exportsa
Algeriab Canadac Egyptb Mexicoc Nigeriab Qatarb
Trinidadand
Tobagob Otherb,d Total Canadac Japanb Mexicoc Otherb,e Total
1950 Total .................... 0 0 0 0 0 0 0 0 0 3 0 23 0 261955 Total .................... 0 11 0 (s) 0 0 0 0 11 11 0 20 0 311960 Total .................... 0 109 0 47 0 0 0 0 156 6 0 6 0 111965 Total .................... 0 405 0 52 0 0 0 0 456 18 0 8 0 261970 Total .................... 1 779 0 (s) 0 0 0 0 821 11 44 15 0 701975 Total .................... 5 948 0 0 0 0 0 0 953 10 53 9 0 731980 Total .................... 86 797 0 102 0 0 0 0 985 (s) 45 4 0 491985 Total .................... 24 926 0 0 0 0 0 0 950 (s) 53 2 0 551990 Total .................... 84 1,448 0 0 0 0 0 0 1,532 17 53 16 0 861995 Total .................... 18 2,816 0 7 0 0 0 0 2,841 28 65 61 0 1542000 Total .................... 47 3,544 0 12 13 46 99 21 3,782 73 66 106 0 2442001 Total .................... 65 3,729 0 10 38 23 98 14 3,977 167 66 141 0 3732002 Total .................... 27 3,785 0 2 8 35 151 8 4,015 189 63 263 0 5162003 Total .................... 53 3,437 0 0 50 14 378 11 3,944 271 66 343 0 6802004 Total .................... 120 3,607 0 0 12 12 462 46 4,259 395 62 397 0 8542005 Total .................... 97 3,700 73 9 8 3 439 11 4,341 358 65 305 0 7292006 Total .................... 17 3,590 120 13 57 0 389 0 4,186 341 61 322 0 7242007 Total .................... 77 3,783 115 54 95 18 448 18 4,608 482 47 292 2 8222008 Total .................... 0 3,589 55 43 12 3 267 15 3,984 559 39 365 0 9632009 Total .................... 0 3,271 160 28 13 13 236 29 3,751 701 31 338 3 1,0722010 Total .................... 0 3,280 73 30 42 46 190 81 3,741 739 33 333 32 1,1372011 Total .................... 0 3,117 35 3 2 91 129 92 3,469 937 18 499 52 1,5062012 Total .................... 0 2,963 3 (s) 0 34 112 26 3,138 971 14 620 14 1,6192013 Total .................... 0 2,786 0 1 3 7 70 17 2,883 911 0 661 0 1,5722014 Total .................... 0 2,635 0 1 0 0 43 16 2,695 770 13 729 3 1,5142015 Total .................... 0 2,626 0 1 0 0 71 20 2,718 701 8 1,054 20 1,784
2016 January ................ 0 262 0 (s) 0 0 12 0 274 70 0 99 0 169 February .............. 0 242 0 (s) 0 0 10 0 252 62 0 97 3 163 March ................... 0 232 0 (s) 0 0 9 0 241 81 0 103 10 195 April ..................... 0 237 0 (s) 0 0 5 0 241 63 0 105 10 178 May ...................... 0 243 0 (s) 0 0 5 0 248 63 0 116 10 188 June ..................... 0 234 0 (s) 0 0 8 0 242 51 0 116 16 183 July ...................... 0 259 0 (s) 0 0 6 0 265 50 0 123 16 189 August ................. 0 254 0 (s) 0 0 8 0 262 55 0 136 23 214 September ........... 0 236 0 (s) 0 0 3 0 238 61 0 127 13 202 October ................ 0 226 0 (s) 0 0 6 0 231 43 0 130 3 176 November ............ 0 222 0 (s) 0 0 6 3 231 75 0 134 20 228 December ............ 0 272 0 (s) 0 0 9 0 281 97 11 119 23 251 Total .................... 0 2,918 0 1 0 0 84 3 3,006 771 11 1,405 148 2,335
2017 January ................ 0 279 0 (s) 3 0 10 0 292 99 11 136 27 272 February .............. 0 246 0 (s) 0 0 8 0 255 88 4 130 34 255 March ................... 0 276 0 (s) 0 0 5 0 281 100 0 140 33 272 April ..................... 0 233 0 (s) 0 0 5 0 238 81 7 130 29 247 May ...................... 0 239 0 (s) 0 0 5 0 244 64 4 139 47 254 June ..................... 0 234 0 (s) 0 0 5 0 240 67 4 159 24 253 July ...................... 0 245 0 (s) 0 0 5 0 251 60 0 150 39 248 August ................. 0 240 0 (s) 0 0 8 0 248 66 4 142 35 247 September ........... 0 227 0 (s) 0 0 2 0 229 70 0 136 44 250 October ................ 0 242 0 (s) 0 0 2 0 244 68 7 140 66 281 November ............ 0 237 0 (s) 0 0 6 0 244 74 0 145 69 288 December ............ 0 266 0 1 3 0 8 0 278 81 14 139 65 299 Total .................... 0 2,965 0 1 6 0 70 0 3,042 917 53 1,684 513 3,168
2018 January ................ 0 287 0 (s) 0 0 14 3 304 92 4 147 58 301 February .............. 0 233 0 1 0 0 7 0 241 77 7 141 52 276 March ................... 0 268 0 (s) 0 0 4 3 274 68 0 161 63 292 April ..................... 0 241 0 (s) 0 0 3 0 244 63 11 142 64 279 May ...................... 0 227 0 (s) 0 0 2 0 229 40 13 152 68 273 June ..................... 0 228 0 (s) 0 0 3 0 230 52 10 163 37 261 July ...................... 0 243 0 1 0 0 5 0 249 58 13 171 64 306 August ................. 0 233 0 1 0 0 5 0 239 67 10 174 60 311 September ........... 0 213 0 (s) 0 0 3 0 216 72 17 159 54 302 October ................ 0 212 0 (s) 0 0 6 0 217 65 3 157 80 306 November ............ 0 210 0 (s) 0 0 3 0 213 90 21 146 80 R 337 December ............ 0 243 0 (s) (s) 0 12 0 255 101 14 149 98 362 Total .................... 0 2,836 0 3 (s) 0 66 6 2,911 844 122 1,862 778 3,607
a Includes re-exports.b As liquefied natural gas.c By pipeline, except for small amounts of: liquefied natural gas (LNG) imported
from Canada in 1973, 1977, 1981, and 2013 forward; LNG exported to Canada in2007 and 2012 forward; compressed natural gas (CNG) imported from Canada in2014 forward; CNG exported to Canada in 2013 forward; and LNG exported toMexico beginning in 1998. See Note 9, "Natural Gas Imports and Exports," at endof section.
d Australia in 1997–2001 and 2004; Brunei in 2002; Equatorial Guinea in 2007;Indonesia in 1986 and 2000; Malaysia in 1999 and 2002–2005; Norway in2008–2016; Oman in 2000–2005; Peru in 2010 and 2011; United Arab Emirates in1996–2000; United Kingdom in 2018; Yemen in 2010–2015; and Other(unassigned) in 2004–2015.
e Argentina in 2016, 2017 and 2018; Barbados in 2016, 2017 and 2018; Brazil in2010–2012, and 2014–2017; Chile in 2011, 2016, 2017 and 2018; China in 2011,2016, 2017 and 2018; Dominican Republic in 2016 and 2017; Egypt in 2015–2018;India in 2010–2012, 2016, 2017 and 2018; Italy in 2016 and 2017; Jordan in 2016and 2017; Kuwait in 2016 and 2017; Lithuania in 2017; Malta in 2017; Netherlandsin 2017; Pakistan in 2017 and 2018; Poland in 2017; Portugal in 2012, 2016, 2017and 2018; Russia in 2007; South Korea in 2009–2011, 2016, 2017 and 2018; Spain
in 2010–2011, 2016, and 2017; Taiwan in 2015 and 2017; Thailand in 2017; Turkeyin 2015–2018; United Arab Emirates in 2016 and 2017; and United Kingdom in2010 and 2011 and 2017.
R=Revised. (s)=Less than 500 million cubic feet. Notes: • See Note 9, "Natural Gas Imports and Exports," at end of section.
• Through 1964, all volumes are shown on a pressure base of 14.65 psia (poundsper square inch absolute) at 60° Fahrenheit; beginning in 1965, the pressure baseis 14.73 psia at 60° Fahrenheit. • Totals may not equal sum of components due toindependent rounding. • U.S. geographic coverage is the 50 states and the Districtof Columbia.
Web Page: See http://www.eia.gov/totalenergy/data/monthly/#naturalgas (Exceland CSV files) for all available annual data beginning in 1949 and monthly databeginning in 1973.
Sources: • 1949–1954: U.S. Energy Information Administration (EIA) estimatesbased on Bureau of Mines, Minerals Yearbook, "Natural Gas" chapter.• 1955–1971: Federal Power Commission data. • 1972–1987: EIA, FormFPC-14, "Annual Report for Importers and Exporters of Natural Gas."• 1988–2017: EIA, Natural Gas Annual, annual reports. • 2018 forward: EIA,Natural Gas Monthly, February 2019, Tables 4 and 5; and U.S. Department ofEnergy, Office of Fossil Energy, "Natural Gas Imports and Exports."

U. S. Energy Information Administration / Monthly Energy Review March 2019 99
Table 4.3 Natural Gas Consumption by Sector (Billion Cubic Feet)
End-Use Sectors
ElectricPower
Sectorf,g TotalResi-
dentialCom-
merciala
Industrial Transportation
Lease andPlant Fuel
Other Industrial
Total
Pipelinesdand Dis-
tributioneVehicle
Fuel TotalCHPb Non-CHPc Total
1950 Total .................... 1,198 388 928 h( ) 2,498 2,498 3,426 126 NA 126 629 5,7671955 Total .................... 2,124 629 1,131 h( ) 3,411 3,411 4,542 245 NA 245 1,153 8,6941960 Total .................... 3,103 1,020 1,237 h( ) 4,535 4,535 5,771 347 NA 347 1,725 11,9671965 Total .................... 3,903 1,444 1,156 h( ) 5,955 5,955 7,112 501 NA 501 2,321 15,2801970 Total .................... 4,837 2,399 1,399 h( ) 7,851 7,851 9,249 722 NA 722 3,932 21,1391975 Total .................... 4,924 2,508 1,396 h( ) 6,968 6,968 8,365 583 NA 583 3,158 19,5381980 Total .................... 4,752 2,611 1,026 h( ) 7,172 7,172 8,198 635 NA 635 3,682 19,8771985 Total .................... 4,433 2,432 966 h( ) 5,901 5,901 6,867 504 NA 504 3,044 17,2811990 Total .................... 4,391 2,623 1,236 1,055 i 5,963 i 7,018 8,255 660 (s) 660 i 3,245 i 19,1741995 Total .................... 4,850 3,031 1,220 1,258 6,906 8,164 9,384 700 5 705 4,237 22,2072000 Total .................... 4,996 3,182 1,151 1,386 6,757 8,142 9,293 642 13 655 5,206 23,3332001 Total .................... 4,771 3,023 1,119 1,310 6,035 7,344 8,463 625 15 640 5,342 22,2392002 Total .................... 4,889 3,144 1,113 1,240 6,287 7,527 8,640 667 15 682 5,672 23,0272003 Total .................... 5,079 3,179 1,122 1,144 6,007 7,150 8,273 591 18 610 5,135 22,2772004 Total .................... 4,869 3,129 1,098 1,191 6,066 7,256 8,354 566 21 587 5,464 22,4032005 Total .................... 4,827 2,999 1,112 1,084 5,518 6,601 7,713 584 23 607 5,869 22,0142006 Total .................... 4,368 2,832 1,142 1,115 5,412 6,527 7,669 584 24 608 6,222 21,6992007 Total .................... 4,722 3,013 1,226 1,050 5,604 6,655 7,881 621 25 646 6,841 23,1042008 Total .................... 4,892 3,153 1,220 955 5,715 6,670 7,890 648 26 674 6,668 23,2772009 Total .................... 4,779 3,119 1,275 990 5,178 6,167 7,443 670 27 697 6,873 22,9102010 Total .................... 4,782 3,103 1,286 1,029 5,797 6,826 8,112 674 29 703 7,387 24,0872011 Total .................... 4,714 3,155 1,323 1,063 5,931 6,994 8,317 688 30 718 7,574 24,4772012 Total .................... 4,150 2,895 1,396 1,149 6,077 7,226 8,622 731 30 761 9,111 25,5382013 Total .................... 4,897 3,295 1,483 1,170 6,255 7,425 8,909 833 30 863 8,191 26,1552014 Total .................... 5,087 3,466 1,512 1,145 6,501 7,646 9,158 700 35 735 8,146 26,5932015 Total .................... 4,613 3,202 1,576 1,222 6,300 7,522 9,098 678 39 718 9,613 27,244
2016 January ................ 879 503 133 103 618 721 854 78 4 82 774 3,092 February .............. 690 414 126 95 568 663 789 67 3 70 690 2,652 March ................... 455 298 133 99 564 663 796 59 4 63 745 2,356 April ..................... 328 233 128 95 525 620 749 52 3 55 719 2,084 May ...................... 194 171 131 98 515 613 744 49 4 52 804 1,966 June ..................... 123 138 126 101 489 590 716 50 3 53 970 2,001 July ...................... 106 135 131 107 509 616 748 55 4 58 1,140 2,187 August ................. 100 140 130 108 519 628 758 55 4 59 1,151 2,208 September ........... 110 142 125 101 503 604 729 48 3 52 915 1,948 October ................ 187 191 129 99 523 623 751 48 4 51 744 1,925 November ............ 380 281 126 99 556 654 780 54 3 57 662 2,159 December ............ 794 463 128 104 630 734 862 73 4 76 671 2,866 Total .................... 4,347 3,110 1,545 1,209 6,519 7,729 9,274 687 42 729 9,985 27,444
2017 January ................ 831 479 126 107 628 735 861 78 4 83 660 2,913 February .............. 579 359 115 97 554 650 765 63 4 66 569 2,339 March ................... 580 372 130 103 594 697 827 68 4 72 672 2,523 April ..................... 279 212 126 99 533 632 758 51 4 55 627 1,931 May ...................... 199 178 130 102 527 629 759 50 4 54 700 1,891 June ..................... 124 138 127 104 510 615 741 50 4 54 851 1,909 July ...................... 107 134 133 112 512 624 757 56 4 61 1,082 2,140 August ................. 104 137 133 108 529 638 770 56 4 60 1,022 2,093 September ........... 115 145 130 103 513 616 747 51 4 55 859 1,920 October ................ 205 201 137 104 553 657 794 54 4 58 773 2,030 November ............ 468 322 136 104 593 696 832 63 4 67 666 2,355 December ............ 822 487 141 115 647 761 903 83 4 87 785 3,083 Total .................... 4,412 3,164 1,564 1,257 6,693 7,949 9,514 722 49 770 9,266 27,126
2018 January ................ 975 548 E 139 115 655 770 909 E 88 E 4 E 92 785 3,308 February .............. 687 420 E 128 R 101 587 689 816 E 72 E 3 E 75 701 2,699 March ................... 656 413 E 143 107 R 620 726 869 E 74 E 4 E 77 R 755 R 2,771 April ..................... R 438 299 E 139 104 581 685 825 E 62 E 4 E 66 707 2,335 May ...................... 168 162 E 145 104 555 659 805 E 54 E 4 E 58 853 2,046 June ..................... 119 R 140 E 142 107 530 637 779 E 55 E 4 E 58 952 R 2,048 July ...................... 105 135 E 149 112 541 653 802 E 62 E 4 E 66 R 1,236 R 2,344 August ................. 99 141 E 152 R 113 542 656 808 RE 61 E 4 E 65 R 1,195 R 2,309 September ........... 112 145 E 149 108 536 644 794 E 57 E 4 E 61 R 1,045 2,156 October ................ 255 R 236 E 156 107 562 R 670 825 E 61 E 4 E 64 R 895 R 2,276 November ............ R 597 R 383 RE 153 114 R 611 R 725 878 RE 72 E 4 E 75 R 756 R 2,689 December ............ 769 464 E 158 117 636 753 911 E 79 E 4 E 83 744 2,970 Total .................... 4,980 3,485 E 1,753 1,310 6,958 8,268 10,021 E 797 E 43 E 841 10,626 29,952
a All commercial sector fuel use, including that at commercialcombined-heat-and-power (CHP) and commercial electricity-only plants. See Table7.4c for CHP fuel use.
b Industrial combined-heat-and-power (CHP) and a small number of industrialelectricity-only plants.
c All industrial sector fuel use other than that in "Lease and Plant Fuel" and"CHP."
d Natural gas consumed in the operation of pipelines, primarily in compressors.Beginning in 2009, includes line loss, which is known volumes of natural gas thatare the result of leaks, damage, accidents, migration, and/or blow down.
e Natural gas used as fuel in the delivery of natural gas to consumers.Beginning in 2009, includes line loss, which is known volumes of natural gas thatare the result of leaks, damage, accidents, migration, and/or blow down.
f The electric power sector comprises electricity-only andcombined-heat-and-power (CHP) plants within the NAICS 22 category whoseprimary business is to sell electricity, or electricity and heat, to the public.
g Through 1988, data are for electric utilities only. Beginning in 1989, data arefor electric utilities and independent power producers.
h Included in "Non-CHP."i For 1989–1992, a small amount of consumption at independent power
producers may be counted in both "Other Industrial" and "Electric Power Sector."See Note 7, "Natural Gas Consumption, 1989–1992," at end of section.
R=Revised. E=Estimate. NA=Not available. (s)=Less than 500 million cubicfeet.
Notes: • Data are for natural gas, plus a small amount of supplemental gaseousfuels. See Note 3, "Supplemental Gaseous Fuels," at end of section.• See Note 8, "Natural Gas Data Adjustments, 1993–2000," at end of section.
• See Note 2, "Classification of Power Plants Into Energy-Use Sectors," at end ofSection 7. • Through 1964, all volumes are shown on a pressure base of 14.65psia (pounds per square inch absolute) at 60° Fahrenheit; beginning in 1965, thepressure base is 14.73 psia at 60° Fahrenheit. • Totals may not equal sum ofcomponents due to independent rounding. • Geographic coverage is the 50 statesand the District of Columbia.
Web Page: See http://www.eia.gov/totalenergy/data/monthly/#naturalgas (Exceland CSV files) for all available annual data beginning in 1949 and monthly databeginning in 1973.
Sources: • Residential, Commercial, Lease and Plant Fuel, Other IndustrialTotal and Pipelines and Distribution: 1949–2017—U.S. Energy InformationAdministration (EIA), Natural Gas Annual (NGA), annual reports and unpublishedrevisions. 2018 forward—EIA, Natural Gas Monthly (NGM), February 2019,Table 2. • Other Industrial CHP: Table 7.4c. • Other Industrial Non-CHP: Calculated as other industrial total minus other industrial CHP. • Industrial Total: Calculated as lease and plant fuel plus other industrial total. • Vehicle Fuel: 1990and 1991—EIA, NGA 2000, (November 2001), Table 95. 1992–1998—EIA,"Alternatives to Traditional Transportation Fuels 1999" (October 1999), Table 10,and "Alternatives to Traditional Transportation Fuels 2003" (February 2004), Table10. Data for compressed natural gas and liquefied natural gas ingasoline-equivalent gallons were converted to cubic feet by multiplying by the motorgasoline conversion factor (see Table A3) and dividing by the natural gas end-usesectors conversion factor (see Table A4). 1999–2017—EIA, NGA, annual reports. 2018 forward—EIA, NGM, February 2019, Table 2. • Transportation Total: Calculated as pipelines and distribution plus vehicle fuel. • Electric PowerSector: Table 7.4b. • Total Consumption: Calculated as the sum of residential,commercial, industrial total, transportation total, and electric power sector.

100 U. S. Energy Information Administration / Monthly Energy Review March 2019
Table 4.4 Natural Gas in Underground Storage (Volumes in Billion Cubic Feet)
Natural Gas inUnderground Storage,
End of Period
Change in Working GasFrom Same Period
Previous Year Storage Activity
Base Gas Working Gas Totala Volume Percent Withdrawals Injections Netb,c
1950 Total .................... NA NA NA NA NA 175 230 -541955 Total .................... 863 505 1,368 40 8.7 437 505 -681960 Total .................... NA NA 2,184 NA NA 713 844 -1321965 Total .................... 1,848 1,242 3,090 83 7.2 960 1,078 -1181970 Total .................... 2,326 1,678 4,004 257 18.1 1,459 1,857 -3981975 Total .................... 3,162 2,212 5,374 162 7.9 1,760 2,104 -3441980 Total .................... 3,642 2,655 6,297 -99 -3.6 1,910 1,896 141985 Total .................... 3,842 2,607 6,448 -270 -9.4 2,359 2,128 2311990 Total .................... 3,868 3,068 6,936 555 22.1 1,934 2,433 -4991995 Total .................... 4,349 2,153 6,503 -453 -17.4 2,974 2,566 4082000 Total .................... 4,352 1,719 6,071 -806 -31.9 3,498 2,684 8142001 Total .................... 4,301 2,904 7,204 1,185 68.9 2,309 3,464 -1,1562002 Total .................... 4,340 2,375 6,715 -528 -18.2 3,138 2,670 4682003 Total .................... 4,303 2,563 6,866 187 7.9 3,099 3,292 -1932004 Total .................... 4,201 2,696 6,897 133 5.2 3,037 3,150 -1132005 Total .................... 4,200 2,635 6,835 -61 -2.3 3,057 3,002 552006 Total .................... 4,211 3,070 7,281 435 16.5 2,493 2,924 -4312007 Total .................... 4,234 2,879 7,113 -191 -6.2 3,325 3,133 1922008 Total .................... 4,232 2,840 7,073 -39 -1.4 3,374 3,340 342009 Total .................... 4,277 3,130 7,407 290 10.2 2,966 3,315 -3492010 Total .................... 4,301 3,111 7,412 -19 -.6 3,274 3,291 -172011 Total .................... 4,302 3,462 7,764 351 11.3 3,074 3,422 -3482012 Total .................... 4,372 3,413 7,785 -49 -1.4 2,818 2,825 -72013 Total .................... 4,365 2,890 7,255 -523 -15.3 3,702 3,156 5462014 Total .................... 4,365 3,141 7,506 251 8.7 3,586 3,839 -2532015 Total .................... 4,372 3,667 8,038 525 16.7 3,100 3,638 -539
2016 January ................ 4,369 2,938 7,307 531 22.1 795 66 729 February .............. 4,369 2,534 6,904 869 52.2 515 111 403 March ................... 4,360 2,486 6,847 1,015 69.0 264 215 49 April ..................... 4,364 2,646 7,009 852 47.5 130 294 -164 May ...................... 4,366 2,966 7,332 679 29.7 74 402 -329 June ..................... 4,369 3,186 7,555 539 20.4 94 316 -222 July ...................... 4,369 3,318 7,687 394 13.5 150 283 -133 August ................. 4,369 3,441 7,811 200 6.2 162 285 -124 September ........... 4,369 3,705 8,074 91 2.5 88 351 -262 October ................ 4,371 4,013 8,384 70 1.8 78 387 -308 November ............ 4,372 3,977 8,349 50 1.3 213 178 35 December ............ 4,380 3,297 7,677 -370 -10.1 762 87 676 Total .................... 4,380 3,297 7,677 -370 -10.1 3,325 2,977 348
2017 January ................ 4,378 2,622 7,000 -316 -10.8 787 113 675 February .............. 4,377 2,337 6,715 -197 -7.8 422 137 285 March ................... 4,378 2,063 6,440 -424 -17.0 449 175 274 April ..................... 4,379 2,291 6,670 -354 -13.4 122 352 -230 May ...................... 4,385 2,627 7,011 -340 -11.5 90 430 -341 June ..................... 4,354 2,907 7,261 -279 -8.8 105 386 -281 July ...................... 4,356 3,054 7,410 -264 -8.0 154 303 -150 August ................. 4,355 3,250 7,605 -191 -5.6 158 353 -196 September ........... 4,355 3,567 7,923 -138 -3.7 103 419 -317 October ................ 4,354 3,816 8,170 -196 -4.9 131 378 -247 November ............ 4,353 3,709 8,062 -267 -6.7 285 199 86 December ............ 4,360 3,033 7,392 -264 -8.0 785 91 695 Total .................... 4,360 3,033 7,392 -264 -8.0 3,590 3,337 254
2018 January ................ 4,357 2,141 6,498 -481 -18.4 1,037 141 896 February .............. 4,357 1,673 6,030 -664 -28.4 599 133 467 March ................... 4,353 1,391 5,744 -672 -32.6 449 164 285 April ..................... 4,350 1,427 5,778 -864 -37.7 224 256 -32 May ...................... 4,352 1,848 6,200 -779 -29.7 66 489 -423 June ..................... 4,354 2,196 6,550 -711 -24.5 88 436 -349 July ...................... 4,355 2,382 6,737 -672 -22.0 175 362 -186 August ................. 4,356 2,617 6,973 -633 -19.5 172 407 -235 September ........... 4,356 2,951 7,306 -617 -17.3 130 464 -334 October ................ 4,357 3,237 7,594 -580 -15.2 131 422 -291 November ............ 4,356 3,031 7,387 -678 -18.3 418 213 205 December ............ 4,359 2,713 7,072 -320 -10.5 510 191 319 Total .................... 4,359 2,713 7,072 -320 -10.5 3,997 3,676 321
a For total underground storage capacity at the end of each calendar year, seeNote 4, "Natural Gas Storage," at end of section.
b For 1980–2017, data differ from those shown on Table 4.1, which includesliquefied natural gas storage for that period.
c Positive numbers indicate that withdrawals are greater than injections.Negative numbers indicate that injections are greater than withdrawals. Netwithdrawals or injections may not equal the difference between applicable endingstocks. See Note 4, "Natural Gas Storage," at end of section.
NA=Not available. Notes: • Through 1964, all volumes are shown on a pressure base of 14.65
psia (pounds per square inch absolute) at 60° Fahrenheit; beginning in 1965, thepressure base is 14.73 psia at 60° Fahrenheit. • Totals may not equal sum ofcomponents due to independent rounding. • Geographic coverage is the 50 statesand the District of Columbia (except Alaska, which is excluded through 2012).
Web Page: See http://www.eia.gov/totalenergy/data/monthly/#naturalgas (Exceland CSV files) for all available annual data beginning in 1949 and monthly data
beginning in 1973.Sources: • Storage Activity: 1949–1975—U.S. Energy Information
Administration (EIA), Natural Gas Annual 1994, Volume 2, Table 9.1976–1979—EIA, Natural Gas Production and Consumption 1979, Table 1.1980–1995—EIA, Historical Natural Gas Annual 1930 Through 2000, Table 11.1996–2014—EIA, Natural Gas Monthly (NGM), monthly issues. 2015forward—EIA, NGM, February 2019, Table 8. • All Other Data:1954–1974—American Gas Association, Gas Facts, annual issues. 1975 and1976—Federal Energy Administration (FEA), Form FEA-G318-M-0, "UndergroundGas Storage Report," and Federal Power Commission (FPC), Form FPC-8,"Underground Gas Storage Report." 1977 and 1978—EIA, Form FEA-G318-M-0,"Underground Gas Storage Report," and Federal Energy Regulatory Commission(FERC), Form FERC-8, "Underground Gas Storage Report." 1979–1995—EIA,Form EIA-191, "Underground Gas Storage Report," and FERC, Form FERC-8,"Underground Gas Storage Report." 1996–2017—EIA, NGA, annual reports.2018 forward—EIA, NGM, February 2019, Table 8.

U. S. Energy Information Administration / Monthly Energy Review March 2019 101
Natural Gas Note 1. Natural Gas Production. Final annual data are from the U.S. Energy Information Administration's (EIA) Natural
Gas Annual (NGA).
Data for the two most recent months presented are estimated. Some of the data for earlier months are also estimated
or computed. For a discussion of computation and estimation procedures, see EIA's Natural Gas Monthly (NGM).
Monthly data are considered preliminary until after publication of the NGA. Preliminary monthly data are gathered
from reports to the Interstate Oil Compact Commission and the U.S. Minerals Management Service. Volumetric data are
converted, as necessary, to a standard pressure base of 14.73 psia (pounds per square inch absolute) at 60° Fahrenheit.
Unless there are major changes, data are not revised until after publication of the NGA.
Differences between annual data in the NGA and the sum of preliminary monthly data (January–December) are
allocated proportionally to the months to create final monthly data.
Note 2. Natural Gas Plant Liquids Production. Natural gas plant liquids (NGPL) production is the reduction in volume
of natural gas resulting from the removal of natural gas liquid constituents at natural gas processing plants—these
natural gas plant liquids are transferred to petroleum supply.
Annual data are from EIA's Natural Gas Annual (NGA), where they are estimated on the basis of the type and quantity of
liquid products extracted from the gas stream and the calculated volume of such products at standard conditions. For a
detailed explanation of the calculations used to derive estimated NGPL production, see the NGA.
Through 2006, preliminary monthly data are estimated on the basis of NGPL production as an annual percentage of
marketed production. Beginning in 2007, preliminary monthly data are estimated on the basis of NGPL production
reported on Form EIA‐816, "Monthly Natural Gas Liquids Report."
Monthly data are revised and considered final after publication of the NGA. Final monthly data are estimated by
allocating annual NGPL production data to the months on the basis of total natural gas marketed production data from
the NGA.
Note 3. Supplemental Gaseous Fuels. Supplemental gaseous fuels are any substances that, introduced into or
commingled with natural gas, increase the volume available for disposition. Such substances include, but are not limited
to, propane‐air, refinery gas, coke oven gas, still gas, manufactured gas, biomass gas, and air or inert gases added for Btu
stabilization.
Annual data beginning with 1980 are from EIA's Natural Gas Annual (NGA). Unknown quantities of supplemental
gaseous fuels are included in consumption data for 1979 and earlier years. Monthly data are considered preliminary
until after publication of the NGA. Monthly estimates are based on the annual ratio of supplemental gaseous fuels to
the sum of dry gas production, net imports, and net withdrawals from storage. The ratio is applied to the monthly sum
of the three elements to compute a monthly supplemental gaseous fuels figure.
Although the total amount of supplemental gaseous fuels consumed is known for 1980 forward, the amount consumed
by each energy‐use sector is estimated by EIA. These estimates are used to create natural gas (without supplemental
gaseous fuels) data for Tables 1.3, 2.2, 2.3, 2.4, and 2.6 (note: to avoid double‐counting in these tables, supplemental
gaseous fuels are accounted for in their primary energy category: "Coal," "Petroleum," or "Biomass"). It is assumed that
supplemental gaseous fuels are commingled with natural gas consumed by the residential, commercial, other industrial,
and electric power sectors, but are not commingled with natural gas used for lease and plant fuel, pipelines and
distribution, or vehicle fuel. The estimated consumption of supplemental gaseous fuels by each sector (residential,
commercial, other industrial, and electric power) is calculated as that sector's natural gas consumption (see Table 4.3)
divided by the sum of natural gas consumption by the residential, commercial, other industrial, and electric power
sectors (see Table 4.3), and then multiplied by total supplemental gaseous fuels consumption (see Table 4.1). For
estimated sectoral consumption of supplemental gaseous fuels in Btu, the residential, commercial, and other industrial
values in cubic feet are multiplied by the "End‐Use Sectors" conversion factors (see Table A4), and the electric power

102 U. S. Energy Information Administration / Monthly Energy Review March 2019
values in cubic feet are multiplied by the "Electric Power Sector" conversion factors (see Table A4). Total supplemental
gaseous fuels consumption in Btu is calculated as the sum of the Btu values for the sectors.
Note 4. Natural Gas Storage. Natural gas in storage at the end of a reporting period may not equal the quantity derived
by adding or subtracting net injections or withdrawals from the quantity in storage at the end of the previous period.
Injection and withdrawal data from the FERC‐8/EIA‐191 survey may be adjusted to correspond to data from Form EIA‐
176 for publication of EIA's Natural Gas Annual (NGA).
Total underground storage capacity, which includes both active and inactive fields, at the end of each calendar year
since 1975 (first year data were available), in billion cubic feet, was:
Total underground storage capacity, including active and inactive fields (billion cubic feet)
Decade Year‐0 Year‐1 Year‐2 Year‐3 Year‐4 Year‐5 Year‐6 Year‐7 Year‐8 Year‐9
1970s 6,280 6,544 6,678 6,890 6,929
1980s 7,434 7,805 7,915 7,985 8,043 8,087 8,145 8,124 8,124 8,120
1990s 7,794 7,993 7,932 7,989 8,043 7,953 7,980 8,332 8,179 8,229
2000s 8,241 8,182 8,207 8,206 8,255 8,268 8,330 8,402 8,499 8,656
2010s 8,764 8,849 8,991 9,173 9,233 9,231 9,239 9,261 P9,240
P=Preliminary
Through 1990, monthly underground storage data are collected from the Federal Energy Regulatory Commission Form
FERC‐8 (interstate data) and EIA Form EIA‐191 (intrastate data). Beginning in 1991, all data are collected on the revised
Form EIA‐191. Injection and withdrawal data from the EIA‐191 survey may be adjusted to correspond to data from Form
EIA‐176 following publication of EIA's NGA.
The final monthly and annual storage and withdrawal data for 1980–2017 include both underground and liquefied
natural gas (LNG) storage. Annual data on LNG additions and withdrawals are from Form EIA‐176. Monthly data are
estimated by computing the ratio of each month's underground storage additions and withdrawals to annual
underground storage additions and withdrawals and applying the ratio to the annual LNG data.
Note 5. Natural Gas Balancing Item. The balancing item for natural gas represents the difference between the sum of
the components of natural gas supply and the sum of components of natural gas disposition. The differences may be
due to quantities lost or to the effects of data reporting problems. Reporting problems include differences due to the
net result of conversions of flow data metered at varying temperature and pressure bases and converted to a standard
temperature and pressure base; the effect of variations in company accounting and billing practices; differences
between billing cycle and calendar period time frames; and imbalances resulting from the merger of data reporting
systems that vary in scope, format, definitions, and type of respondents.
Note 6. Natural Gas Consumption. Natural gas consumption statistics include data for the following: "Residential
Sector": residential deliveries; "Commercial Sector": commercial deliveries, including to commercial combined‐heat‐and‐
power (CHP) and commercial electricity‐only plants; "Industrial Sector": lease and plant fuel use, and other industrial
deliveries, including to industrial CHP and industrial electricity‐only plants also includes the relatively small amount of
natural gas consumption for non‐combustion use (see Tables 1.11a and 1.11b); "Transportation Sector": pipelines and
distribution use, and vehicle fuel use; and "Electric Power Sector": electric utility and independent power producer use.
Final data for series other than "Other Industrial CHP" and "Electric Power Sector" are from EIA's Natural Gas Annual
(NGA). Monthly data are considered preliminary until after publication of the NGA. For more detailed information on
the methods of estimating preliminary and final monthly data, see EIA's Natural Gas Monthly.
Note 7. Natural Gas Consumption, 1989–1992. Prior to 1993, deliveries to nonutility generators were not separately
collected from natural gas companies on Form EIA‐176, "Annual Report of Natural and Supplemental Gas Supply and
Disposition." As a result, for 1989–1992, those volumes are probably included in both the industrial and electric power
sectors and double‐counted in total consumption. In 1993, 0.28 trillion cubic feet was reported as delivered to
nonutility generators.

U. S. Energy Information Administration / Monthly Energy Review March 2019 103
Note 8. Natural Gas Data Adjustments, 1993–2000. For 1993–2000, the original data for natural gas delivered to
industrial consumers (now "Other Industrial" in Table 4.3) included deliveries to both industrial users and independent
power producers (IPPs). These data were adjusted to remove the estimated consumption at IPPs from "Other Industrial"
and include it with electric utilities under "Electric Power Sector." (To estimate the monthly IPP consumption, the
monthly pattern for Other Industrial CHP in Table 4.3 was used.)
For 1996–2000, monthly data for several natural gas series shown in EIA's Natural Gas Navigator (see
http://www.eia.gov/dnav/ng/ng_cons_sum_dcu_nus_m.htm) were not reconciled and updated to be consistent with
the final annual data in EIA's Natural Gas Annual. In the Monthly Energy Review, monthly data for these series were
adjusted so that the monthly data sum to the final annual values. The Table 4.1 data series (and years) that were
adjusted are: Gross Withdrawals (1996, 1997), Marketed Production (1997), NGPL Production (1997, 1998, and 2000),
Dry Gas Production (1996, 1997), Supplemental Gaseous Fuels (1997–2000), Balancing Item (1997–2000), and Total
Consumption (1997–2000). The Table 4.3 data series (and years) that were adjusted are: Lease and Plant Fuel (1997–
2000), Total Industrial (1997–2000), Pipelines and Distribution (2000), Total Transportation (2000), and Total
Consumption (1997–2000).
Note 9. Natural Gas Imports and Exports. The United States imports natural gas via pipeline from Canada and Mexico;
and imports liquefied natural gas (LNG) via tanker from Algeria, Australia, Brunei, Egypt, Equatorial Guinea, Indonesia,
Malaysia, Nigeria, Norway, Oman, Peru, Qatar, Trinidad and Tobago, the United Arab Emirates, and Yemen. In addition,
small amounts of LNG arrived from Canada in 1973 (667 million cubic feet), 1977 (572 million cubic feet), 1981 (6 million
cubic feet), 2013 (555 million cubic feet), 2014 (132 million cubic feet), 2015 (437 million cubic feet), 2016 (924 million
cubic feet), 2017 (1,569 million cubic feet), and 2018 (1,885 million cubic feet). Also, small amounts of compressed
natural gas (CNG) were imported from Canada in 2014 forward. The United States exports natural gas via pipeline to
Canada and Mexico; and exports LNG via tanker to Argentina, Bahamas, Barbados, Brazil, Chile, China, Columbia,
Dominican Republic, Egypt, India, Israel, Italy, Japan, Jordan, Kuwait, Lithuania, Malta, Netherlands, Pakistan, Panama,
Poland, Portugal, Russia, South Korea, Spain, Taiwan, Thailand, Turkey, United Arab Emirates, and United Kingdom. Also,
small amounts of LNG have gone to Mexico since 1998 and to Canada in 2007 and 2012 forward. Small amounts of CNG
have been exported to Canada since 2013.
Annual and final monthly data are from the annual EIA Form FPC‐14, "Annual Report for Importers and Exporters of
Natural Gas," which requires data to be reported by month for the calendar year.
Preliminary monthly data are EIA estimates. For a discussion of estimation procedures, see EIA's Natural Gas Monthly.
Preliminary data are revised after publication of EIA's U.S. Imports and Exports of Natural Gas.

THIS PAGE INTENTIONALLY LEFT BLANK

5. Crude Oil and Natural Gas
Resource Development
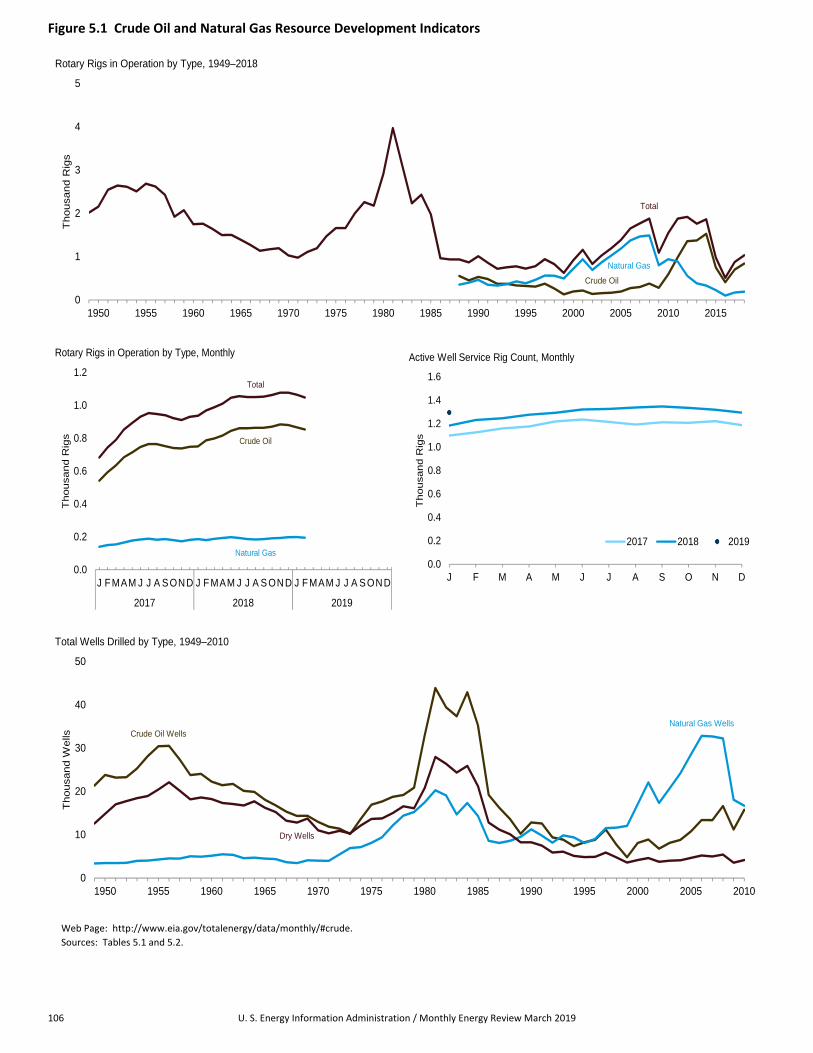
106 U. S. Energy Information Administration / Monthly Energy Review March 2019
Figure 5.1 Crude Oil and Natural Gas Resource Development Indicators
Total
Crude Oil
Natural Gas
0
1
2
3
4
5
1950 1955 1960 1965 1970 1975 1980 1985 1990 1995 2000 2005 2010 2015
Thousand R
igs
Rotary Rigs in Operation by Type, 1949–2018
Total
Natural Gas
Crude Oil
0.0
0.2
0.4
0.6
0.8
1.0
1.2
J F MAM J J A SON D J F MAM J J A S ON D J F MAM J J A SON D
2017 2018 2019
Thousand R
igs
Rotary Rigs in Operation by Type, Monthly
0.0
0.2
0.4
0.6
0.8
1.0
1.2
1.4
1.6
J F M A M J J A S O N D
Th
ou
san
d R
igs
Active Well Service Rig Count, Monthly
2017 2018 2019
Crude Oil Wells Natural Gas Wells
Dry Wells
0
10
20
30
40
50
1950 1955 1960 1965 1970 1975 1980 1985 1990 1995 2000 2005 2010
Thousand W
ells
Total Wells Drilled by Type, 1949–2010
Web Page: http://www.eia.gov/totalenergy/data/monthly/#crude.
Sources: Tables 5.1 and 5.2.

U. S. Energy Information Administration / Monthly Energy Review March 2019 107
Table 5.1 Crude Oil and Natural Gas Drilling Activity Measurements (Number of Rigs)
Rotary Rigs in Operationa
ActiveWell ServiceRig Countc
By Site By Type
TotalbOnshore Offshore Crude Oil Natural Gas
1950 Average ........................ NA NA NA NA 2,154 NA1955 Average ........................ NA NA NA NA 2,686 NA1960 Average ........................ NA NA NA NA 1,748 NA1965 Average ........................ NA NA NA NA 1,388 NA1970 Average ........................ NA NA NA NA 1,028 NA1975 Average ........................ 1,554 106 NA NA 1,660 2,4861980 Average ........................ 2,678 231 NA NA 2,909 4,0891985 Average ........................ 1,774 206 NA NA 1,980 4,7161990 Average ........................ 902 108 532 464 1,010 3,6581995 Average ........................ 622 101 323 385 723 3,0412000 Average ........................ 778 140 197 720 918 2,6922001 Average ........................ 1,003 153 217 939 1,156 2,2672002 Average ........................ 717 113 137 691 830 1,8302003 Average ........................ 924 108 157 872 1,032 1,9672004 Average ........................ 1,095 97 165 1,025 1,192 2,0642005 Average ........................ 1,287 94 194 1,184 1,381 2,2222006 Average ........................ 1,559 90 274 1,372 1,649 2,3642007 Average ........................ 1,695 72 297 1,466 1,768 2,3882008 Average ........................ 1,814 65 379 1,491 1,879 2,5152009 Average ........................ 1,046 44 278 801 1,089 1,7222010 Average ........................ 1,514 31 591 943 1,546 1,8542011 Average ........................ 1,846 32 984 887 1,879 2,0752012 Average ........................ 1,871 48 1,357 558 1,919 2,1132013 Average ........................ 1,705 56 1,373 383 1,761 2,0642014 Average ........................ 1,804 57 1,527 333 1,862 2,0242015 Average ........................ 943 35 750 226 978 1,4812016 Average ........................ 486 23 408 100 509 1,061
2017 January .......................... 659 24 542 140 683 1,099 February ........................ 724 20 593 150 744 1,125 March ............................. 770 19 634 154 789 1,159 April ............................... 833 20 685 166 853 1,176 May ................................ 871 22 714 178 893 1,219 June ............................... 909 22 747 184 931 1,235 July ................................ 931 22 765 189 953 1,215 August ........................... 930 17 764 183 947 1,192 September ..................... 922 18 752 187 940 1,212 October .......................... 901 21 741 180 922 1,207 November ...................... 891 20 738 173 911 1,222 December ...................... 911 19 748 182 930 1,187 Average ........................ 856 20 703 172 876 1,187
2018 January .......................... 919 18 750 187 937 1,183 February ........................ 952 17 788 180 969 1,232 March ............................. 976 13 799 188 989 1,246 April ............................... 995 16 817 193 1,011 1,276 May ................................ 1,026 20 845 198 1,046 1,293 June ............................... 1,037 19 861 193 1,056 1,321 July ................................ 1,032 18 861 187 1,050 1,326 August ........................... 1,031 19 864 184 1,050 1,338 September ..................... 1,033 20 864 187 1,053 1,347 October .......................... 1,041 21 870 192 1,063 1,334 November ...................... 1,055 22 884 193 1,077 1,319 December ...................... 1,054 24 880 198 1,077 1,294 Average ........................ 1,013 19 841 190 1,032 1,292
2019 January .......................... 1,044 21 866 199 1,065 R 1,295 February ........................ 1,029 20 853 195 1,048 NA 2-Month Average ......... 1,036 20 859 197 1,056 NA
2018 2-Month Average ......... 935 17 769 183 953 1,2082017 2-Month Average ......... 692 22 568 145 713 1,112
a Rotary rigs in operation are reported weekly on Fridays. Monthly data areaverages of 4- or 5-week reporting periods. Multi-month data are averages of thereported weekly data over the covered months. Annual data are averages of 52- or53-week reporting periods. Published data are rounded to the nearest wholenumber.
b Sum of rigs drilling for crude oil, rigs drilling for natural gas, and other rigs (notshown) drilling for miscellaneous purposes, such as service wells, injection wells,and stratigraphic tests. Therefore, "Total" values may not equal the sum of "CrudeOil" and "Natural Gas." "Total" values may not equal the sum of "Onshore" and"Offshore" due to independent rounding.
c The number of rigs doing true workovers (where tubing is pulled from the well),or doing rod string and pump repair operations, and that are, on average, crewed
and working every day of the month. R=Revised. NA=Not available. Note: Geographic coverage is the 50 states and the District of Columbia.Web Page: See http://www.eia.gov/totalenergy/data/monthly/#crude (Excel and
CSV files) for all available annual data beginning in 1949 and monthly databeginning in 1973.
Sources: • Rotary Rigs in Operation: Baker Hughes, Inc.,Houston, TX, "North America Rig Count," used with permission. Seehttp://phx.corporate-ir.net/phoenix.zhtml?c=79687&p=irol-reportsother. • ActiveWell Service Rig Count: Assoc. of Energy Service Companies, Friendswood,TX. See https://www.aesc.net/aesc-rig-counts.html.

108 U. S. Energy Information Administration / Monthly Energy Review March 2019
Table 5.2 Crude Oil and Natural Gas Exploratory and Development Wells
Wells Drilled
TotalFootageDrilled
Exploratory Development Total
CrudeOil
NaturalGas Dry Total
CrudeOil
NaturalGas Dry Total
CrudeOil
NaturalGas Dry Total
NumberThousand
Feet
1950 Total .................... 1,583 431 8,292 10,306 22,229 3,008 6,507 31,744 23,812 3,439 14,799 42,050 157,3581955 Total .................... 2,236 874 11,832 14,942 28,196 3,392 8,620 40,208 30,432 4,266 20,452 55,150 226,1821960 Total .................... 1,321 868 9,515 11,704 20,937 4,281 8,697 33,915 22,258 5,149 18,212 45,619 192,1761965 Total .................... 946 515 8,005 9,466 17,119 3,967 8,221 29,307 18,065 4,482 16,226 38,773 174,8821970 Total .................... 757 477 6,162 7,396 12,211 3,534 4,869 20,614 12,968 4,011 11,031 28,010 138,5561975 Total .................... 982 1,248 7,129 9,359 15,966 6,879 6,517 29,362 16,948 8,127 13,646 38,721 180,4941980 Total .................... 1,777 2,099 9,081 12,957 31,182 15,362 11,704 58,248 32,959 17,461 20,785 71,205 316,9431985 Total .................... 1,680 1,200 8,954 11,834 33,581 13,124 12,257 58,962 35,261 14,324 21,211 70,796 314,4091990 Total .................... 778 811 3,652 5,241 12,061 10,435 4,593 27,089 12,839 11,246 8,245 32,330 156,0441995 Total .................... 570 558 2,024 3,152 7,678 7,524 2,790 17,992 8,248 8,082 4,814 21,144 117,1562000 Total .................... 288 657 1,341 2,286 7,802 16,394 2,805 27,001 8,090 17,051 4,146 29,287 144,4252001 Total .................... 357 1,052 1,733 3,142 8,531 21,020 2,865 32,416 8,888 22,072 4,598 35,558 180,1412002 Total .................... 258 844 1,282 2,384 6,517 16,498 2,472 25,487 6,775 17,342 3,754 27,871 145,1592003 Total .................... 350 997 1,297 2,644 7,779 19,725 2,685 30,189 8,129 20,722 3,982 32,833 177,2392004 Total .................... 383 1,671 1,350 3,404 8,406 22,515 2,732 33,653 8,789 24,186 4,082 37,057 204,2792005 Total .................... 539 2,141 1,462 4,142 10,240 26,449 3,191 39,880 10,779 28,590 4,653 44,022 240,3072006 Total .................... 646 2,456 1,547 4,649 12,739 30,382 3,659 46,780 13,385 32,838 5,206 51,429 282,6752007 Total .................... 808 2,794 1,582 5,184 12,563 29,925 3,399 45,887 13,371 32,719 4,981 51,071 301,515
2008 January ................ 88 208 144 440 1,111 2,321 272 3,704 1,199 2,529 416 4,144 25,306 February .............. 82 230 107 419 1,080 2,261 247 3,588 1,162 2,491 354 4,007 24,958 March ................... 66 216 127 409 1,132 2,363 271 3,766 1,198 2,579 398 4,175 26,226 April ..................... 68 189 130 387 1,177 2,415 281 3,873 1,245 2,604 411 4,260 26,920 May ...................... 88 206 124 418 1,317 2,449 240 4,006 1,405 2,655 364 4,424 27,947 June ..................... 63 195 139 397 1,428 2,540 299 4,267 1,491 2,735 438 4,664 28,739 July ...................... 79 163 171 413 1,439 2,695 344 4,478 1,518 2,858 515 4,891 29,140 August ................. 67 165 144 376 1,448 2,735 379 4,562 1,515 2,900 523 4,938 28,942 September ........... 52 166 164 382 1,488 2,667 355 4,510 1,540 2,833 519 4,892 28,960 October ................ 80 243 173 496 1,549 2,841 373 4,763 1,629 3,084 546 5,259 31,505 November ............ 97 192 160 449 1,361 2,418 334 4,113 1,458 2,610 494 4,562 29,276 December ............ 67 172 132 371 1,206 2,196 313 3,715 1,273 2,368 445 4,086 26,222 Total .................... 897 2,345 1,715 4,957 15,736 29,901 3,708 49,345 16,633 32,246 5,423 54,302 334,141
2009 January ................ 80 171 99 350 1,192 2,253 250 3,695 1,272 2,424 349 4,045 28,077 February .............. 62 125 88 275 991 1,925 195 3,111 1,053 2,050 283 3,386 25,440 March ................... 59 146 88 293 867 1,771 210 2,848 926 1,917 298 3,141 25,304 April ..................... 36 68 93 197 755 1,396 205 2,356 791 1,464 298 2,553 21,406 May ...................... 47 90 80 217 584 1,136 156 1,876 631 1,226 236 2,093 20,055 June ..................... 44 91 75 210 804 1,297 189 2,290 848 1,388 264 2,500 16,301 July ...................... 40 100 101 241 789 1,188 217 2,194 829 1,288 318 2,435 13,543 August ................. 49 84 88 221 867 1,372 207 2,446 916 1,456 295 2,667 15,970 September ........... 61 71 96 228 945 1,170 207 2,322 1,006 1,241 303 2,550 15,547 October ................ 55 79 78 212 966 1,167 222 2,355 1,021 1,246 300 2,567 17,261 November ............ 38 83 85 206 931 1,133 199 2,263 969 1,216 284 2,469 16,236 December ............ 34 98 84 216 894 1,074 213 2,181 928 1,172 297 2,397 16,424 Total .................... 605 1,206 1,055 2,866 10,585 16,882 2,470 29,937 11,190 18,088 3,525 32,803 231,562
2010 January ................ 55 91 81 227 898 1,264 169 2,331 953 1,355 250 2,558 15,304 February .............. 44 71 67 182 871 1,096 144 2,111 915 1,167 211 2,293 16,862 March ................... 59 85 88 232 1,062 1,224 216 2,502 1,121 1,309 304 2,734 15,102 April ..................... 49 78 77 204 1,173 1,152 249 2,574 1,222 1,230 326 2,778 17,904 May ...................... 48 107 86 241 1,282 1,208 255 2,745 1,330 1,315 341 2,986 17,987 June ..................... 61 100 90 251 1,385 1,250 302 2,937 1,446 1,350 392 3,188 19,408 July ...................... 46 103 105 254 1,386 1,443 390 3,219 1,432 1,546 495 3,473 20,847 August ................. 56 104 94 254 1,434 1,402 314 3,150 1,490 1,506 408 3,404 22,923 September ........... 57 73 88 218 1,374 1,358 268 3,000 1,431 1,431 356 3,218 23,037 October ................ 75 87 117 279 1,502 1,463 283 3,248 1,577 1,550 400 3,527 22,123 November ............ 62 114 103 279 1,400 1,352 263 3,015 1,462 1,466 366 3,294 24,561 December ............ 57 92 70 219 1,317 1,379 243 2,939 1,374 1,471 313 3,158 23,189 Total .................... 669 1,105 1,066 2,840 15,084 15,591 3,096 33,771 15,753 16,696 4,162 36,611 239,247
Notes: • Data are estimates. • For 1960–1969, data are for well completionreports received by the American Petroleum Institute during the reporting year; forall other years, data are for well completions in a given year. • Through 1989,these well counts include only the original drilling of a hole intended to discover orfurther develop already discovered crude oil or natural gas resources. Other drillingactivities, such as drilling an old well deeper, drilling of laterals from the originalwell, drilling of service and injection wells, and drilling for resources other thancrude oil or natural gas are excluded. Beginning in 1990, a new well is defined asthe first hole in the ground whether it is lateral or not. Due to the methodology usedto estimate ultimate well counts from the available partially reported data, thecounts shown on this page are frequently revised. See Note, "Crude Oil and
Natural Gas Exploratory and Development Wells," at end of section. • Geographiccoverage is the 50 states and the District of Columbia.
Web Page: See http://www.eia.gov/totalenergy/data/monthly/#crude (Excel andCSV files) for all available annual data beginning in 1949 and monthly databeginning in 1973.
Sources: • 1949–1965: Gulf Publishing Company, World Oil,"Forecast-Review" issue. • 1966–1969: American Petroleum Institute (API),Quarterly Review of Drilling Statistics for the United States, annual summaries andmonthly reports. • 1970–1989: U.S. Energy Information Administration (EIA)computations based on well reports submitted to the API. • 1990 forward: EIAcomputations based on well reports submitted to IHS, Inc., Denver, CO.
Data for 2011 forward in this table have been removed while EIA
evaluates the quality of the data and the estimation methodology.

U. S. Energy Information Administration / Monthly Energy Review March 2019 109
Crude Oil and Natural Gas Resource Development Note. Crude Oil and Natural Gas Exploratory and Development Wells. Three well types are considered in the Monthly
Energy Review (MER) drilling statistics: “completed for crude oil,” “completed for natural gas,” and “dry hole.” Wells
that productively encounter both crude oil and natural gas are categorized as “completed for crude oil.” Both
development wells and exploratory wells (new field wildcats, new pool tests, and extension tests) are included in the
statistics. All other classes of wells drilled in connection with the search for producible hydrocarbons are excluded. If a
lateral is drilled at the same time as the original hole it is not counted separately, but its footage is included.
Prior to the March 1985 MER, drilling statistics consisted of completion data for the above types and classes of wells as
reported to the American Petroleum Institute (API) during a given month. Due to time lags between the date of well
completion and the date of completion reporting to the API, as‐reported well completions proved to be an inaccurate
indicator of drilling activity. During 1982, for example, as‐reported well completions rose, while the number of actual
completions fell. Consequently, the drilling statistics published since the March 1985 MER are U.S. Energy Information
Administration (EIA) estimates produced by statistically imputing well counts and footage based on the partial data
available from the API. These estimates are subject to continuous revision as new data, some of which pertain to earlier
months and years, become available. Additional information about the EIA estimation methodology may be found in
“Estimating Well Completions,” a feature article published in the March 1985 MER.

THIS PAGE INTENTIONALLY LEFT BLANK

6. Coal

112 U. S. Energy Information Administration / Monthly Energy Review March 2019
Figure 6.1 Coal (Million Short Tons)
Production
Net Exports
Consumption
0
200
400
600
800
1,000
1,200
1,400
1950 1955 1960 1965 1970 1975 1980 1985 1990 1995 2000 2005 2010 2015
Overview, 1949–2018
Industrial[a]
Electric Power
Residential, Commercial[a] and Transportation[b]
0
200
400
600
800
1,000
1,200
1950 1955 1960 1965 1970 1975 1980 1985 1990 1995 2000 2005 2010 2015
Consumption by Sector, 1949–2018
Production
Consumption
Net Exports
0
20
40
60
80
J F M A M J J A S O N D J F M A M J J A S O N D J F M A M J J A S O N D
2017 2018 2019
Overview, Monthly
0
20
40
60
80
J F M A M J J A S O N D
Electric Power Sector Consumption, Monthly
2016 2017 2018
[a] Includes combined‐heat‐power (CHP) plants and a small number of
electricity‐only‐plants.
[b] For 1978 forward, small amounts of transportation sector use are
included in “Industrial.”
Web Page: http://www.eia.gov/totalenergy/data/monthly/#coal.
Sources: Tables 6.1 and 6.2.

U. S. Energy Information Administration / Monthly Energy Review March 2019 113
Table 6.1 Coal Overview (Thousand Short Tons)
Productiona
WasteCoal
Suppliedb
TradeStock
Changed,e
Losses andUnaccounted
fore,f ConsumptionImports Exports Net Importsc
1950 Total .................... 560,388 NA 365 29,360 -28,995 27,829 9,462 494,1021955 Total .................... 490,838 NA 337 54,429 -54,092 -3,974 -6,292 447,0121960 Total .................... 434,329 NA 262 37,981 -37,719 -3,194 1,722 398,0811965 Total .................... 526,954 NA 184 51,032 -50,848 1,897 2,244 471,9651970 Total .................... 612,661 NA 36 71,733 -71,697 11,100 6,633 523,2311975 Total .................... 654,641 NA 940 66,309 -65,369 32,154 -5,522 562,6401980 Total .................... 829,700 NA 1,194 91,742 -90,548 25,595 10,827 702,7301985 Total .................... 883,638 NA 1,952 92,680 -90,727 -27,934 2,796 818,0491990 Total .................... 1,029,076 3,339 2,699 105,804 -103,104 26,542 -1,730 904,4981995 Total .................... 1,032,974 8,561 9,473 88,547 -79,074 -275 632 962,1042000 Total .................... 1,073,612 9,089 12,513 58,489 -45,976 -48,309 938 1,084,0952001 Total .................... 1,127,689 10,085 19,787 48,666 -28,879 41,630 7,120 1,060,1462002 Total .................... 1,094,283 9,052 16,875 39,601 -22,726 10,215 4,040 1,066,3552003 Total .................... 1,071,753 10,016 25,044 43,014 -17,970 -26,659 -4,403 1,094,8612004 Total .................... 1,112,099 11,299 27,280 47,998 -20,718 -11,462 6,887 1,107,2552005 Total .................... 1,131,498 13,352 30,460 49,942 -19,482 -9,702 9,092 1,125,9782006 Total .................... 1,162,750 14,409 36,246 49,647 -13,401 42,642 8,824 1,112,2922007 Total .................... 1,146,635 14,076 36,347 59,163 -22,816 5,812 4,085 1,127,9982008 Total .................... 1,171,809 14,146 34,208 81,519 -47,311 12,354 5,740 1,120,5482009 Total .................... 1,074,923 13,666 22,639 59,097 -36,458 39,668 14,985 997,4782010 Total .................... 1,084,368 13,651 19,353 81,716 -62,363 -13,039 182 1,048,5142011 Total .................... 1,095,628 13,209 13,088 107,259 -94,171 211 11,506 1,002,9482012 Total .................... 1,016,458 11,196 9,159 125,746 -116,586 6,902 14,980 889,1852013 Total .................... 984,842 11,279 8,906 117,659 -108,753 -38,525 1,451 924,4422014 Total .................... 1,000,049 12,090 11,350 97,257 -85,907 -2,601 11,101 917,7312015 Total .................... 896,941 9,969 11,318 73,958 -62,640 40,704 5,452 798,1152016 Total .................... 728,364 10,138 9,850 60,271 -50,421 -45,441 2,452 731,071
2017 January ................ 68,414 1,027 743 7,385 -6,642 -6,368 1,161 68,006 February .............. 64,389 916 612 6,908 -6,296 4,246 2,383 52,381 March ................... 64,335 975 560 8,013 -7,453 1,096 3,436 53,325 April ..................... 58,754 651 493 7,236 -6,744 2,198 1,898 48,565 May ...................... 62,115 696 1,053 7,243 -6,190 -2,116 3,536 55,202 June ..................... 66,229 777 651 7,317 -6,666 -5,351 2,592 63,099 July ...................... 62,966 907 956 7,177 -6,221 -10,088 -6,473 74,214 August ................. 70,582 901 839 8,573 -7,734 -5,767 -713 70,229 September ........... 62,891 801 513 8,894 -8,381 -2,349 -1,378 59,039 October ................ 66,368 630 582 9,159 -8,577 1,847 2,137 54,436 November ............ 64,345 668 368 9,552 -9,185 2,135 -1,663 55,357 December ............ 63,220 1,003 408 9,495 -9,087 -5,516 -2,352 63,003 Total .................... 774,609 9,951 7,777 96,953 -89,176 -26,033 4,562 716,856
2018 January ................ 61,937 1,013 500 8,772 -8,273 R -13,394 R -842 68,913 February .............. 60,235 834 349 9,022 -8,673 R -1,077 R 3,576 49,897 March ................... 65,467 909 518 9,426 -8,908 R 5,496 R 3,213 R 48,759 April ..................... 58,032 714 494 11,092 -10,598 R 2,350 R 1,020 R 44,777 May ...................... 61,196 771 544 9,645 -9,102 R -2,004 R 3,174 R 51,695 June ..................... 61,557 789 509 10,138 -9,629 R -7,514 R 59 60,173 July ...................... 62,945 878 692 9,532 -8,840 R -10,463 R -2,572 68,018 August ................. 69,301 907 484 10,052 -9,569 R -8,632 R 1,376 R 67,895 September ........... 62,417 807 263 9,483 -9,220 R -2,446 R -1,695 R 58,145 October ................ 65,354 F 825 304 10,681 -10,377 R 5,195 R -2,555 53,163 November ............ 62,264 F 825 400 8,872 -8,472 R -1,603 R -235 R 56,455 December ............ 63,000 RF 825 R 898 R 8,916 R -8,018 R -1,106 R -3,192 R 60,105 Total .................... 753,706 R 10,097 R 5,954 R 115,632 R -109,678 R -35,197 R 1,328 R 687,993
2019 January ................ 62,479 NA NA NA NA NA NA NA February .............. 55,140 NA NA NA NA NA NA NA 2-Month Total ..... 117,619 NA NA NA NA NA NA NA
2018 2-Month Total ..... 122,172 1,847 849 17,795 -16,946 -14,471 2,734 118,8102017 2-Month Total ..... 132,803 1,943 1,355 14,294 -12,938 -2,122 3,543 120,387
a Beginning in 2001, includes a small amount of refuse recovery (coalrecaptured from a refuse mine and cleaned to reduce the concentration ofnoncombustible materials).
b Waste coal (including fine coal, coal obtained from a refuse bank or slurrydam, anthracite culm, bituminous gob, and lignite waste) consumed by the electricpower and industrial sectors. Beginning in 1989, waste coal supplied is counted asa supply-side item to balance the same amount of waste coal included in"Consumption."
c Net imports equal imports minus exports. A minus sign indicates exports aregreater than imports.
d A negative value indicates a decrease in stocks and a positive value indicatesan increase. See Table 6.3 for stocks data coverage.
e In 1949, stock change is included in "Losses and Unaccounted for."f The difference between calculated coal supply and disposition, due to coal
quantities lost or to data reporting problems.R=Revised. NA=Not available. F=Forecast. Notes: • For methodology used to calculate production, consumption, and
stocks, see Note 1, "Coal Production," Note 2, "Coal Consumption," and Note 3,"Coal Stocks," at end of section. • Data values preceded by "F" are derived fromthe U.S. Energy Information Administration’s Short-Term Integrated ForecastingSystem. See Note 4, "Coal Forecast Values," at end of section. • Totals may notequal sum of components due to independent rounding. • Geographic coverage isthe 50 states and the District of Columbia.
Web Page: See http://www.eia.gov/totalenergy/data/monthly/#coal (Excel andCSV files) for all available annual data beginning in 1949 and monthly databeginning in 1973.
Sources: See end of section.

114 U. S. Energy Information Administration / Monthly Energy Review March 2019
Table 6.2 Coal Consumption by Sector (Thousand Short Tons)
End-Use Sectors
ElectricPower
Sectore,f TotalResi-
dential
Commercial Industrial
Trans-portationCHPa Otherb Total
CokePlants
Other Industrial
TotalCHPc Non-CHPd Total
1950 Total .................... 51,562 g( ) 63,021 63,021 104,014 h( ) 120,623 120,623 224,637 63,011 91,871 494,1021955 Total .................... 35,590 g( ) 32,852 32,852 107,743 h( ) 110,096 110,096 217,839 16,972 143,759 447,0121960 Total .................... 24,159 g( ) 16,789 16,789 81,385 h( ) 96,017 96,017 177,402 3,046 176,685 398,0811965 Total .................... 14,635 g( ) 11,041 11,041 95,286 h( ) 105,560 105,560 200,846 655 244,788 471,9651970 Total .................... 9,024 g( ) 7,090 7,090 96,481 h( ) 90,156 90,156 186,637 298 320,182 523,2311975 Total .................... 2,823 g( ) 6,587 6,587 83,598 h( ) 63,646 63,646 147,244 24 405,962 562,6401980 Total .................... 1,355 g( ) 5,097 5,097 66,657 h( ) 60,347 60,347 127,004 h( ) 569,274 702,7301985 Total .................... 1,711 g( ) 6,068 6,068 41,056 h( ) 75,372 75,372 116,429 h( ) 693,841 818,0491990 Total .................... 1,345 1,191 4,189 5,379 38,877 27,781 48,549 76,330 115,207 h( ) f 782,567 904,4981995 Total .................... 755 1,419 3,633 5,052 33,011 29,363 43,693 73,055 106,067 h( ) 850,230 962,1042000 Total .................... 454 1,547 2,126 3,673 28,939 28,031 37,177 65,208 94,147 h( ) 985,821 1,084,0952001 Total .................... 481 1,448 2,441 3,888 26,075 25,755 39,514 65,268 91,344 h( ) 964,433 1,060,1462002 Total .................... 533 1,405 2,506 3,912 23,656 26,232 34,515 60,747 84,403 h( ) 977,507 1,066,3552003 Total .................... 551 1,816 1,869 3,685 24,248 24,846 36,415 61,261 85,509 h( ) 1,005,116 1,094,8612004 Total .................... 512 1,917 2,693 4,610 23,670 26,613 35,582 62,195 85,865 h( ) 1,016,268 1,107,2552005 Total .................... 378 1,922 2,420 4,342 23,434 25,875 34,465 60,340 83,774 h( ) 1,037,485 1,125,9782006 Total .................... 290 1,886 1,050 2,936 22,957 25,262 34,210 59,472 82,429 h( ) 1,026,636 1,112,2922007 Total .................... 353 1,927 1,247 3,173 22,715 22,537 34,078 56,615 79,331 h( ) 1,045,141 1,127,9982008 Total .................... i( ) 2,021 1,485 3,506 22,070 21,902 32,491 54,393 76,463 h( ) 1,040,580 1,120,5482009 Total .................... i( ) 1,798 1,412 3,210 15,326 19,766 25,549 45,314 60,641 h( ) 933,627 997,4782010 Total .................... i( ) 1,720 1,361 3,081 21,092 24,638 24,650 49,289 70,381 h( ) 975,052 1,048,5142011 Total .................... i( ) 1,668 1,125 2,793 21,434 22,319 23,919 46,238 67,671 h( ) 932,484 1,002,9482012 Total .................... i( ) 1,450 595 2,045 20,751 20,065 22,773 42,838 63,589 h( ) 823,551 889,1852013 Total .................... i( ) 1,356 595 1,951 21,474 19,761 23,294 43,055 64,529 h( ) 857,962 924,4422014 Total .................... i( ) 1,063 824 1,887 21,297 19,076 23,870 42,946 64,243 h( ) 851,602 917,7312015 Total .................... i( ) 798 706 1,503 19,708 16,984 21,475 38,459 58,167 h( ) 738,444 798,1152016 Total .................... i( ) 683 500 1,183 16,485 14,720 20,129 34,849 51,333 h( ) 678,554 731,071
2017 January ................ i( ) 71 65 136 1,431 1,264 1,579 2,844 4,274 h( ) 63,595 68,006 February .............. i( ) 58 53 111 1,368 1,077 1,778 2,854 4,222 h( ) 48,048 52,381 March ................... i( ) 66 61 126 1,438 1,141 1,695 2,836 4,274 h( ) 48,925 53,325 April ..................... i( ) 42 29 71 1,441 1,008 1,688 2,696 4,137 h( ) 44,358 48,565 May ...................... i( ) 39 27 66 1,482 1,043 1,658 2,702 4,184 h( ) 50,952 55,202 June ..................... i( ) 40 27 67 1,402 1,045 1,665 2,710 4,111 h( ) 58,920 63,099 July ...................... i( ) 47 21 68 1,494 1,042 1,728 2,769 4,264 h( ) 69,882 74,214 August ................. i( ) 43 19 62 1,528 1,050 1,707 2,757 4,285 h( ) 65,883 70,229 September ........... i( ) 45 20 65 1,469 991 1,734 2,725 4,194 h( ) 54,780 59,039 October ................ i( ) 42 34 76 1,470 1,098 1,694 2,791 4,261 h( ) 50,099 54,436 November ............ i( ) 52 43 95 1,457 1,077 1,716 2,793 4,250 h( ) 51,013 55,357 December ............ i( ) 66 54 119 1,559 1,139 1,647 2,787 4,346 h( ) 58,538 63,003 Total .................... i( ) 610 451 1,061 17,538 12,975 20,289 33,264 50,801 h( ) 664,993 716,856
2018 January ................ i( ) 70 71 141 1,458 1,245 1,463 2,708 4,166 h( ) 64,606 68,913 February .............. i( ) 54 55 109 1,288 1,111 1,632 2,742 4,031 h( ) 45,757 49,897 March ................... i( ) 51 53 104 1,482 1,140 1,594 2,734 4,216 h( ) 44,439 R 48,759 April ..................... i( ) 45 23 69 1,549 R 1,016 1,543 2,558 4,107 h( ) R 40,601 R 44,777 May ...................... i( ) 41 21 61 1,596 1,041 R 1,511 2,552 4,148 h( ) R 47,485 R 51,695 June ..................... i( ) 42 21 63 1,465 R 989 1,567 2,556 4,021 h( ) 56,089 60,173 July ...................... i( ) 47 8 55 1,592 R 978 R 1,542 2,520 4,112 h( ) 63,851 68,018 August ................. i( ) 49 9 58 1,569 R 942 1,575 2,517 4,086 h( ) R 63,751 R 67,895 September ........... i( ) 51 9 59 1,577 977 1,534 2,511 4,088 h( ) R 53,998 R 58,145 October ................ i( ) 42 F 36 F 78 F 2,015 R 933 F 1,616 F 2,549 F 4,564 h( ) R 48,520 53,163 November ............ i( ) 48 F 47 F 96 F 1,868 1,018 F 1,683 F 2,701 F 4,570 h( ) R 51,789 R 56,455 December ............ i( ) 47 F 46 F 93 F 1,795 1,078 F 1,528 F 2,607 F 4,402 h( ) 55,610 60,105 Total .................... i( ) 587 E 399 E 986 E 19,254 12,468 E 18,787 E 31,256 E 50,510 h( ) 636,498 687,993
a Commercial combined-heat-and-power (CHP) and a small number ofcommercial electricity-only plants, such as those at hospitals and universities.See Note 2, "Classification of Power Plants Into Energy-Use Sectors," at end ofSection 7.
b All commercial sector fuel use other than that in "Commercial CHP."c Industrial combined-heat-and-power (CHP) and a small number of industrial
electricity-only plants. See Note 2, "Classification of Power Plants Into Energy-UseSectors," at end of Section 7.
d All industrial sector fuel use other than that in "Coke Plants" and "IndustrialCHP."
e The electric power sector comprises electricity-only and combined-heat-and-power (CHP) plants within the NAICS 22 category whose primary business isto sell electricity, or electricity and heat, to the public.
f Through 1988, data are for electric utilities only. Beginning in 1989, data arefor electric utilities and independent power producers.
g Included in "Commercial Other."
h Included in "Industrial Non-CHP."i Beginning in 2008, residential coal consumption data are no longer collected
by the U.S. Energy Information Administration (EIA). R=Revised. E=Estimate. F=Forecast. Notes: • CHP monthly values are from Table 7.4c; electric power sector monthly
values are from Table 7.4b; all other monthly values are estimates derived fromcollected quarterly and annual data. See Note 2, "Coal Consumption," at end ofsection. • Data values preceded by "F" are derived from EIA’s Short-TermIntegrated Forecasting System. See Note 4, "Coal Forecast Values," at end ofsection. • Totals may not equal sum of components due to independent rounding.• Geographic coverage is the 50 states and the District of Columbia.
Web Page: See http://www.eia.gov/totalenergy/data/monthly/#coal (Excel andCSV files) for all available annual data beginning in 1949 and monthly databeginning in 1973.
Sources: See end of section.

U. S. Energy Information Administration / Monthly Energy Review March 2019 115
Table 6.3 Coal Stocks by Sector (Thousand Short Tons)
Producersand
Distributors
End-Use Sectors
ElectricPower
Sectorc,d Total
Residentialaand
Commercial
Industrial
TotalCoke Plants Otherb Total
1950 Year ..................... NA 2,462 16,809 26,182 42,991 45,453 31,842 77,2951955 Year ..................... NA 998 13,422 15,880 29,302 30,300 41,391 71,6911960 Year ..................... NA 666 11,122 11,637 22,759 23,425 51,735 75,1601965 Year ..................... NA 353 10,640 13,122 23,762 24,115 54,525 78,6401970 Year ..................... NA 300 9,045 11,781 20,826 21,126 71,908 93,0341975 Year ..................... 12,108 233 8,797 8,529 17,326 17,559 110,724 140,3911980 Year ..................... 24,379 NA 9,067 11,951 21,018 21,018 183,010 228,4071985 Year ..................... 33,133 NA 3,420 10,438 13,857 13,857 156,376 203,3671990 Year ..................... 33,418 NA 3,329 8,716 12,044 12,044 156,166 201,6291995 Year ..................... 34,444 NA 2,632 5,702 8,334 8,334 126,304 169,0832000 Year ..................... 31,905 NA 1,494 4,587 6,081 6,081 102,296 140,2822001 Year ..................... 35,900 NA 1,510 6,006 7,516 7,516 138,496 181,9122002 Year ..................... 43,257 NA 1,364 5,792 7,156 7,156 141,714 192,1272003 Year ..................... 38,277 NA 905 4,718 5,623 5,623 121,567 165,4682004 Year ..................... 41,151 NA 1,344 4,842 6,186 6,186 106,669 154,0062005 Year ..................... 34,971 NA 2,615 5,582 8,196 8,196 101,137 144,3042006 Year ..................... 36,548 NA 2,928 6,506 9,434 9,434 140,964 186,9462007 Year ..................... 33,977 NA 1,936 5,624 7,560 7,560 151,221 192,7582008 Year ..................... 34,688 498 2,331 6,007 8,338 8,836 161,589 205,1122009 Year ..................... 47,718 529 1,957 5,109 7,066 7,595 189,467 244,7802010 Year ..................... 49,820 552 1,925 4,525 6,451 7,003 174,917 231,7402011 Year ..................... 51,897 603 2,610 4,455 7,065 7,668 172,387 231,9512012 Year ..................... 46,157 583 2,522 4,475 6,997 7,581 185,116 238,8532013 Year ..................... 45,652 495 2,200 4,097 6,297 6,792 147,884 200,3282014 Year ..................... 38,894 449 2,640 4,196 6,836 7,285 151,548 197,7272015 Year ..................... 35,871 394 2,236 4,382 6,618 7,012 195,548 238,4312016 Year ..................... 25,309 360 1,675 3,637 5,312 5,672 162,009 192,990
2017 January ................ 24,974 352 1,579 3,503 5,082 5,434 156,214 186,622 February .............. 25,170 343 1,483 3,370 4,853 5,196 160,502 190,868 March ................... 25,190 335 1,388 3,236 4,624 4,959 161,815 191,964 April ..................... 25,169 333 1,467 3,256 4,723 5,056 163,937 194,162 May ...................... 24,350 331 1,547 3,275 4,822 5,153 162,542 192,045 June ..................... 23,430 329 1,626 3,295 4,921 5,250 158,014 186,694 July ...................... 25,465 332 1,641 3,357 4,998 5,330 145,811 176,606 August ................. 24,226 335 1,655 3,419 5,075 5,409 141,204 170,839 September ........... 23,430 337 1,670 3,482 5,152 5,489 139,571 168,490 October ................ 23,459 328 1,686 3,402 5,088 5,416 141,463 170,338 November ............ 23,705 319 1,702 3,322 5,024 5,343 143,424 172,472 December ........... 23,999 310 1,718 3,242 4,960 5,270 137,687 166,956
2018 January ................ F 24,769 298 1,648 3,124 4,772 5,070 R 123,723 R 153,562 February .............. F 26,594 287 1,578 3,008 4,586 4,873 R 121,019 R 152,485 March ................... F 26,775 275 1,508 2,892 4,400 4,675 R 126,532 R 157,982 April ..................... F 26,558 269 1,544 2,890 4,434 4,703 R 129,071 R 160,332 May ...................... F 25,142 263 1,580 2,889 4,469 4,732 R 128,454 R 158,328 June ..................... F 24,524 257 1,616 2,888 4,504 4,761 R 121,529 R 150,814 July ...................... F 24,691 259 1,681 2,926 4,606 4,866 R 110,794 R 140,351 August ................. F 22,574 261 1,746 2,966 4,711 4,972 R 104,172 R 131,719 September ........... F 23,413 263 1,811 3,005 4,816 5,079 R 100,781 R 129,273 October ................ F 24,198 F 262 F 1,825 F 2,975 F 4,799 F 5,062 R 105,209 R 134,468 November ............ F 23,490 F 261 F 1,845 F 2,945 F 4,791 F 5,051 R 104,324 R 132,866 December ........... F 23,978 F 255 F 1,865 F 2,876 F 4,741 F 4,996 102,786 131,760
a Through 1979, data are for the residential and commercial sectors. Beginningin 2008, data are for the commercial sector only.
b Through 1979, data are for manufacturing plants and the transportation sector. For 1980–2007, data are for manufacturing plants only. Beginning in 2008, dataare for manufacturing plants and coal transformation/processing plants.
c The electric power sector comprises electricity-only and combined-heat-and-power (CHP) plants within the NAICS 22 category whose primary business is to sellelectricity, or electricity and heat, to the public.
d Excludes waste coal. Through 1998, data are for electric utilities only. Beginning in 1999, data are for electric utilities and independent power producers.
R=Revised. NA=Not available. F=Forecast. Notes: • Stocks are at end of period. • Electric power sector monthly values
are from Table 7.5; producers and distributors monthly values are estimatesderived from collected annual data; all other monthly values are estimates derivedfrom collected quarterly values. • Data values preceded by "F" are derived fromthe U.S. Energy Information Administration’s Short-Term Integrated ForecastingSystem. See Note 4, "Coal Forecast Values," at end of section. • Totals may notequal sum of components due to independent rounding. • Geographic coverage isthe 50 states and the District of Columbia.
Web Page: See http://www.eia.gov/totalenergy/data/monthly/#coal (Excel andCSV files) for all available annual data beginning in 1949 and monthly databeginning in 1973.
Sources: See end of section.

116 U. S. Energy Information Administration / Monthly Energy Review March 2019
Coal Note 1. Coal Production. Preliminary monthly estimates of national coal production are the sum of weekly estimates
developed by the U.S. Energy Information Administration (EIA) and published in the Weekly Coal Production report.
When a week extends into a new month, production is allocated on a daily basis and added to the appropriate month.
Weekly estimates are based on Association of American Railroads (AAR) data showing the number of railcars loaded
with coal during the week by Class I and certain other railroads.
Through 2001, the weekly coal production model converted AAR data into short tons of coal by using the average
number of short tons of coal per railcar loaded reported in the “Quarterly Freight Commodity Statistics” from the
Surface Transportation Board. If an average coal tonnage per railcar loaded was not available for a specific railroad, the
national average was used. To derive the estimate of total weekly production, the total rail tonnage for the week was
divided by the ratio of quarterly production shipped by rail and total quarterly production. Data for the corresponding
quarter of previous years were used to derive this ratio. This method ensured that the seasonal variations were
preserved in the production estimates.
From 2002 through 2014, the weekly coal production model used statistical auto regressive methods to estimate
national coal production as a function of railcar loadings of coal, heating degree‐days, and cooling degree‐days. On
Thursday of each week, EIA received from the AAR data for the previous week. The latest weekly national data for
heating degree‐days and cooling degree‐days were obtained from the National Oceanic and Atmospheric
Administration’s Climate Prediction Center.
Beginning in 2015, the revised weekly coal production model uses statistical auto regressive methods to estimate
national coal production as a function of railcar loadings of coal. EIA receives AAR data on Thursday of each week for
prior week car loadings. The weekly coal model is run and a national level coal production estimate is obtained. From
there, state‐level estimates are calculated using historical state production share. The state estimates are then
aggregated to various regional‐level estimates. The weekly coal model is refit every quarter after preliminary coal data
are available.
When preliminary quarterly data become available, the monthly and weekly estimates are adjusted to conform to the
quarterly figures. The adjustment procedure uses historical state‐level production data, the methodology for which can
be seen in the documentation located at http://www.eia.gov/coal/production/weekly/. Initial estimates of annual
production published in January of the following year are based on preliminary production data covering the first nine
months (three quarters) and weekly/monthly estimates for the fourth quarter. All quarterly, monthly, and weekly
production figures are adjusted to conform to the final annual production data published in the Monthly Energy Review
in the fall of the following year.
Note 2. Coal Consumption. Forecast data (designated by an “F”) are derived from forecasted values shown in EIA’s Short‐
Term Energy Outlook (DOE/EIA‐0202) table titled “U.S. Coal Supply, Consumption, and Inventories.” The monthly
estimates are based on the quarterly values, which are released in March, June, September, and December. The estimates
are revised quarterly as collected data become available from the data sources. Sector‐specific information follows.
Residential and Commercial—Through 2007, coal consumption by the residential and commercial sectors is reported to EIA
for the two sectors combined; EIA estimates the amount consumed by the sectors individually. To create the estimates, it
is first assumed that an occupied coal‐heated housing unit consumes fuel at the same Btu rate as an oil‐heated housing
unit. Then, for the years in which data are available on the number of occupied housing units by heating source (1973–
1981 and subsequent odd‐numbered years), residential consumption of coal is estimated using the following steps: a
ratio is created of the number of occupied housing units heated by coal to the number of occupied housing units heated
by oil; that ratio is then multiplied by the Btu quantity of oil consumed by the residential sector to derive an estimate of
the Btu quantity of coal consumed by the residential sector; and, finally, the amount estimated as the residential sector
consumption is subtracted from the residential and commercial sectors’ combined consumption to derive the
commercial sector’s estimated consumption. Beginning in 2008, residential coal consumption data are not collected by
EIA, and commercial coal consumption data are taken directly from reported data.
U. S. Energy Information Administration / Monthly Energy Review March 2019 117
Industrial Coke Plants—Through 1979, monthly coke plant consumption data were taken directly from reported data.
For 1980–1987, coke plant consumption estimates were derived by proportioning reported quarterly data by using the
ratios of monthly‐to‐quarterly consumption data in 1979, the last year in which monthly data were reported. Beginning
in 1988, monthly coke plant consumption estimates are derived from the reported quarterly data by using monthly
ratios of raw steel production data from the American Iron and Steel Institute. The ratios are the monthly raw steel
production from open hearth and basic oxygen process furnaces as a proportion of the quarterly production from those
kinds of furnaces. Coal coke consumption values also include the relativity small amount consumed for non‐combustion
use (See Tables 1.11a and 1.11b).
Industrial Other—Through 1977, monthly consumption data for the other industrial sector (all industrial users minus
coke plants) were derived by using reported data to modify baseline consumption figures from the most recent U.S.
Census Bureau Annual Survey of Manufactures or Census of Manufactures. For 1978 and 1979, monthly estimates were
derived from data reported on Forms EIA‐3 and EIA‐6. For 1980–1987, monthly figures were estimated by
proportioning quarterly data by using the ratios of monthly‐to‐quarterly consumption data in 1979, the last year in
which monthly data were reported on Form EIA‐3. Beginning in 1988, monthly consumption for the other
industrial sector is estimated from reported quarterly data by using ratios derived from industrial production
indices published by the Board of Governors of the Federal Reserve System. Indices for six major industry groups
are used as the basis for calculating the ratios: food manufacturing, which is North American Industry
Classification System (NAICS) code 311; paper manufacturing, NAICS 322; chemical manufacturing, NAICS 325;
petroleum and coal products, NAICS 324; non‐metallic mineral products manufacturing, NAICS 327; and primary
metal manufacturing, NAICS 331. The monthly ratios are computed as the monthly sum of the weighted indices as
a proportion of the quarterly sum of the weighted indices by using the 1977 proportion as the weights. Through
2007, quarterly consumption data for the other industrial sector were derived by adding beginning stocks at
manufacturing plants to current receipts and subtracting ending stocks at manufacturing plants. In this
calculation, current receipts are the greater of either reported receipts from manufacturing plants (Form EIA‐3) or
reported shipments to the other industrial sector (Form EIA‐6), thereby ensuring that agriculture, forestry, fishing,
and construction consumption data were included where appropriate. Beginning in 2008, quarterly consumption
totals for other industrial coal include data for manufacturing and mining only. Over time, surveyed coal
consumption data for agriculture, forestry, fishing, and construction dwindled to about 20–30 thousand short tons
annually. Therefore, in 2008, EIA consolidated its programs by eliminating agriculture, forestry, fishing, and
construction as surveyed sectors.
Electric Power Sector—Monthly consumption data for electric power plants are taken directly from reported data.
Note 3. Coal Stocks. Coal stocks data are reported by major end‐use sector. Forecast data (designated by an “F”)
are derived from forecasted values shown in EIA’s Short‐Term Energy Outlook (DOE/EIA‐0202) table titled “U.S.
Coal Supply, Consumption, and Inventories.” The monthly estimates are based on the quarterly values (released in
March, June, September, and December) or annual values. The estimates are revised as collected data become
available from the data sources. Sector‐specific information follows.
Producers and Distributors—Through 1997, quarterly stocks at producers and distributors were taken directly
from reported data. Monthly data were estimated by using one‐third of the current quarterly change to indicate
the monthly change in stocks. Beginning in 1998, end‐of‐year stocks are taken from reported data. Monthly stocks
are estimated by a model.
Residential and Commercial—Through 1979, stock estimates for the residential and commercial sector were taken
directly from reported data. For 1980–2007, stock estimates were not collected. Beginning in 2008, quarterly
commercial (excluding residential) stocks data are collected on Form EIA‐3 (data for “Commercial and Institutional
Coal Users”).
Industrial Coke Plants—Through 1979, monthly stocks at coke plants were taken directly from reported data. Beginning
118 U. S. Energy Information Administration / Monthly Energy Review March 2019
in 1980, coke plant stocks are estimated by using one‐third of the current quarterly change to indicate the monthly
change in stocks. Quarterly stocks are taken directly from data reported on Form EIA‐5.
Industrial Other—Through 1977, stocks for the other industrial sector were derived by using reported data to modify
baseline figures from a one‐time Bureau of Mines survey of consumers. For 1978–1982, monthly estimates were
derived by judgmentally proportioning reported quarterly data based on representative seasonal patterns of supply and
demand. Beginning in 1983, other industrial coal stocks are estimated as indicated above for coke plants. Quarterly
stocks are taken directly from data reported on Form EIA‐3 and therefore include only manufacturing industries; data for
agriculture, forestry, fishing, mining, and construction stocks are not available.
Electric Power Sector—Monthly stocks data at electric power plants are taken directly from reported data.
Note 4. Coal Forecast Values. Data values preceded by “F” in this section are forecast values. They are derived from EIA’s
Short‐Term Integrated Forecasting System (STIFS). The model is driven primarily by data and assumptions about key
macroeconomic variables, the world oil price, and weather. The coal forecast relies on other variables as well, such as
alternative fuel prices (natural gas and oil) and power generation by sources other than fossil fuels, including nuclear and
hydroelectric power. Each month, EIA staff review the model output and make adjustments, if appropriate, based on their
knowledge of developments in the coal industry.
The STIFS model results are published monthly in EIA’s Short‐Term Energy Outlook, which is accessible on the Web at
http://www.eia.gov/forecasts/steo/.
Table 6.1 Sources
Production 1949–September 1977: U.S. Department of the Interior, Bureau of Mines, Minerals Yearbook and Minerals Industry
Surveys.
October 1977 forward: U.S. Energy Information Administration (EIA), Weekly Coal Production.
Waste Coal Supplied 1989–1997: EIA, Form EIA‐867, “Annual Nonutility Power Producer Report.”
1998–2000: EIA, Form EIA‐860B, “Annual Electric Generator Report—Nonutility.”
2001–2003: EIA, Form EIA‐906, “Power Plant Report,” and Form EIA‐3, “Quarterly Coal Consumption and Quality
Report—Manufacturing Plants,” and predecessor forms. 2004–2007: EIA, Form EIA‐906, “Power Plant Report,” Form
EIA‐920, “Combined Heat and Power Plant Report,” and Form EIA‐3, “Quarterly Coal Consumption and Quality
Report—Manufacturing Plants,” and predecessor forms. 2008 forward: EIA, Form EIA‐923, “Power Plant Operations
Report,” and Form EIA‐3, “Quarterly Survey of Industrial, Commercial, and Institutional Coal Users” (formerly called,
“Quarterly Survey of Non‐Electric Sector Coal Data”); and, for forecast values, EIA, Short‐Term Integrated Forecasting
System.
Imports and Exports 1949 forward: U.S. Department of Commerce, U.S. Census Bureau, Monthly Reports IM 145 (Imports) and EM 545 (Exports).
Stock Change 1950 forward: Calculated from data in Table 6.3.
Losses and Unaccounted for 1949 forward: Calculated as the sum of production, imports, and waste coal supplied, minus exports, stock change, and
consumption.
Consumption 1949 forward: Table 6.2.

U. S. Energy Information Administration / Monthly Energy Review March 2019 119
Table 6.2 Sources
Residential and Commercial Total Through 2007, coal consumption by the residential and commercial sectors combined is reported to the U.S. Energy
Information Administration (EIA). EIA estimates the sectors individually using the method described in Note 2,
“Consumption,” at the end of Section 6. Data for the residential and commercial sectors combined are from:
1949–1976: U.S. Department of the Interior (DOI), Bureau of Mines (BOM), Minerals Yearbook.
January–September 1977: DOI, BOM, Form 6‐1400, “Monthly Coal Report, Retail Dealers—Upper Lake Docks.” October 1977–
1979: EIA, Form EIA‐2, “Monthly Coal Report, Retail Dealers—Upper Lake Docks.”
1980–1997: EIA, Form EIA‐6, “Coal Distribution Report,” quarterly.
1998–2007: DOI, Mine Safety and Health Administration, Form 7000‐2, “Quarterly Coal Consumption and Quality Report—
Coke Plants.”
Commercial Total Beginning in 2008, coal consumption by the commercial (excluding residential) sector is reported to EIA. Data for total
commercial consumption are from: 2008 forward: EIA, Form EIA‐3, “Quarterly Survey of Industrial, Commercial, and
Institutional Coal Users” (formerly called, “Quarterly Survey of Non‐Electric Sector Coal Data”); and, for forecast values, EIA,
Short‐Term Integrated Forecasting System (STIFS).
Commercial CHP 1989 forward: Table 7.4c.
Commercial Other 1949 forward: Calculated as “Commercial Total” minus “Commercial CHP.”
Industrial Coke Plants 1949–September 1977: DOI, BOM, Minerals Yearbook and Minerals Industry Surveys.
October 1977–1980: EIA, Form EIA‐5/5A, “Coke and Coal Chemicals—Monthly/Annual Supplement.”
1981–1984: EIA, Form EIA‐5/5A, “Coke Plant Report—Quarterly/Annual Supplement.”
1985 forward: EIA, Form EIA–5, “Quarterly Coal Consumption and Quality Report—Coke Plants”; and, for forecast
values, EIA, STIFS.
Other Industrial Total 1949–September 1977: DOI, BOM, Minerals Yearbook and Minerals Industry Surveys.
October 1977–1979: EIA, Form EIA‐3, “Quarterly Coal Consumption and Quality Report—Manufacturing Plants,” and
predecessor forms.
1980–1997: EIA, Form EIA‐3, “Quarterly Coal Consumption and Quality Report—Manufacturing Plants,” and
predecessor forms and Form EIA‐6, “Coal Distribution Report,” quarterly.
1998–2007: EIA, Form EIA‐3, “Quarterly Coal Consumption and Quality Report—Manufacturing Plants,” and predecessor
forms, Form EIA‐6A, “Coal Distribution Report,” annual, and Form EIA‐7A, “Coal Production Report,” annual.
2008 forward: EIA, Form EIA‐3, “Quarterly Survey of Industrial, Commercial, and Institutional Coal Users” (formerly
called, “Quarterly Survey of Non‐Electric Sector Coal Data”) and Form EIA‐7A, “Coal Production Report,” annual; and, for
forecast values, EIA, STIFS.
Other Industrial CHP 1989 forward: Table 7.4c.

120 U. S. Energy Information Administration / Monthly Energy Review March 2019
Other Industrial Non-CHP 1949 forward: Calculated as “Other Industrial Total” minus “Other Industrial CHP.”
Transportation 1949–1976: DOI, BOM, Minerals Yearbook. January–September 1977: DOI, BOM, Form 6‐1400, “Monthly Coal Report, Retail Dealers—Upper Lake Docks.” October–
December 1977: EIA, Form EIA‐6, “Coal Distribution Report,” quarterly.
Electric Power 1949 forward: Table 7.4b.
Table 6.3 Sources
Producers and Distributors 1973–1979: U.S. Department of the Interior (DOI), Bureau of Mines (BOM), Form 6‐1419Q, “Distribution of Bituminous
Coal and Lignite Shipments.”
1980–1997: U.S. Energy Information Administration (EIA), Form EIA‐6, “Coal Distribution Report,” quarterly.
1998–2007: EIA, Form EIA‐6A, “Coal Distribution Report,” annual.
2008 forward: EIA, Form EIA‐3, “Quarterly Survey of Industrial, Commercial, and Institutional Coal Users” (formerly
called, “Quarterly Survey of Non‐Electric Sector Coal Data”); (data for “Commercial and Institutional Coal Users”); and,
for forecast values, EIA, STIFS.
Residential and Commercial 1949–1976: DOI, BOM, Minerals Yearbook.
January–September 1977: DOI, BOM, Form 6‐1400, “Monthly Coal Report, Retail Dealers—Upper Lake Docks.”
October 1977–1979: EIA, Form EIA‐2, “Monthly Coal Report, Retail Dealers—Upper Lake Docks.”
2008 forward: EIA, Form EIA‐3, “Quarterly Survey of Industrial, Commercial, and Institutional Coal Users” (formerly
called “Quarterly Survey of Non‐Electric Coal Data); and, for forecast values, EIA, STIFS.
Industrial Coke Plants 1949–September 1977: DOI, BOM, Minerals Yearbook and Minerals Industry Surveys.
October 1977–1980: EIA, Form EIA‐5/5A, “Coke and Coal Chemicals—Monthly/Annual.”
1981–1984: EIA, Form EIA‐5/5A, “Coke Plant Report—Quarterly/Annual Supplement.”
1985 forward: EIA, Form EIA‐5, “Quarterly Coal Consumption and Quality Report—Coke Plants” and, for forecast
values, EIA, STIFS.
Industrial Other 1949–September 1977: DOI, BOM, Minerals Yearbook and Minerals Industry Surveys.
October 1977–2007: EIA, Form EIA‐3, “Quarterly Coal Consumption and Quality Report—Manufacturing Plants,” and
predecessor forms.
2008 forward: EIA, Form EIA‐3, “Quarterly Survey of Industrial, Commercial, and Institutional Coal Users” (formerly
called, “Quarterly Survey of Non‐Electric Sector Coal Data”); and, for forecast values, EIA, STIFS.
Electric Power 1949 forward: Table 7.5.

7. Electricity

122 U. S. Energy Information Administration / Monthly Energy Review March 2019
Figure 7.1 Electricity Overview (Billion Kilowatthours)
4,018
13146 58 14
3,802
144
0
1,000
2,000
3,000
4,000
5,000
Electric Power Commercial Industrial Imports Exports Retail Sales [b] Direct Use [c]
Net Generation [a] Trade End Use
Overview, 2018
Total [d]
Electric Power
Industrial
0
1,000
2,000
3,000
4,000
5,000
1990 1995 2000 2005 2010 2015
Net Generation [a] by Sector, 1989–2018
Total [d]
Electric Power
Industrial
0
100
200
300
400
500
J F M A M J J A S O N D J F M A M J J A S O N D J F M A M J J A S O N D
2016 2017 2018
Net Generation [a] by Sector, Monthly
Imports
Exports
0
20
40
60
80
1950 1955 1960 1965 1970 1975 1980 1985 1990 1995 2000 2005 2010 2015
Trade, 1949–2018
[a] Data are for utility‐scale facilities.
[b] Electricity retail sales to ultimate customers reported by electric utilities
and other energy service providers.
[c] See “Direct Use” in Glossary.
[d] Includes commercial sector.
Web Page: http://www.eia.gov/totalenergy/data/monthly/#electricity.
Source: Table 7.1.
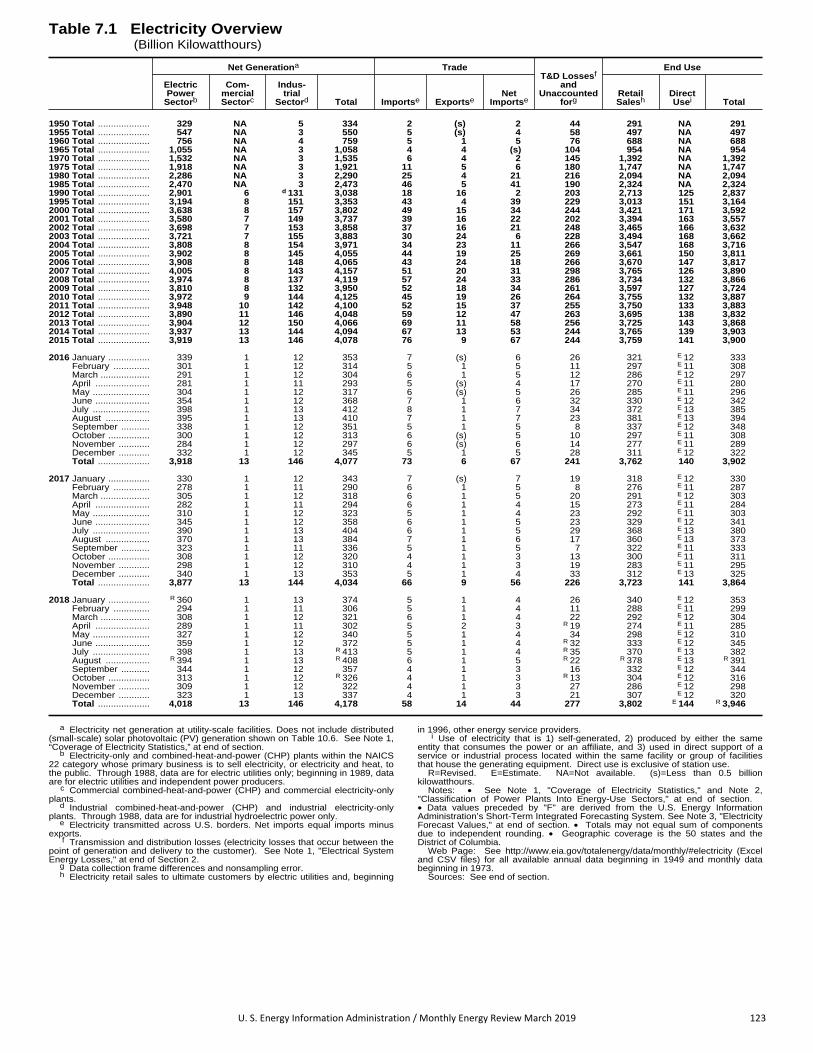
U. S. Energy Information Administration / Monthly Energy Review March 2019 123
Table 7.1 Electricity Overview (Billion Kilowatthours)
Net Generationa TradeT&D Lossesf
andUnaccounted
forg
End Use
ElectricPower
Sectorb
Com-mercialSectorc
Indus-trial
Sectord Total Importse ExportseNet
ImportseRetailSalesh
DirectUsei Total
1950 Total .................... 329 NA 5 334 2 (s) 2 44 291 NA 2911955 Total .................... 547 NA 3 550 5 (s) 4 58 497 NA 4971960 Total .................... 756 NA 4 759 5 1 5 76 688 NA 6881965 Total .................... 1,055 NA 3 1,058 4 4 (s) 104 954 NA 9541970 Total .................... 1,532 NA 3 1,535 6 4 2 145 1,392 NA 1,3921975 Total .................... 1,918 NA 3 1,921 11 5 6 180 1,747 NA 1,7471980 Total .................... 2,286 NA 3 2,290 25 4 21 216 2,094 NA 2,0941985 Total .................... 2,470 NA 3 2,473 46 5 41 190 2,324 NA 2,3241990 Total .................... 2,901 6 d 131 3,038 18 16 2 203 2,713 125 2,8371995 Total .................... 3,194 8 151 3,353 43 4 39 229 3,013 151 3,1642000 Total .................... 3,638 8 157 3,802 49 15 34 244 3,421 171 3,5922001 Total .................... 3,580 7 149 3,737 39 16 22 202 3,394 163 3,5572002 Total .................... 3,698 7 153 3,858 37 16 21 248 3,465 166 3,6322003 Total .................... 3,721 7 155 3,883 30 24 6 228 3,494 168 3,6622004 Total .................... 3,808 8 154 3,971 34 23 11 266 3,547 168 3,7162005 Total .................... 3,902 8 145 4,055 44 19 25 269 3,661 150 3,8112006 Total .................... 3,908 8 148 4,065 43 24 18 266 3,670 147 3,8172007 Total .................... 4,005 8 143 4,157 51 20 31 298 3,765 126 3,8902008 Total .................... 3,974 8 137 4,119 57 24 33 286 3,734 132 3,8662009 Total .................... 3,810 8 132 3,950 52 18 34 261 3,597 127 3,7242010 Total .................... 3,972 9 144 4,125 45 19 26 264 3,755 132 3,8872011 Total .................... 3,948 10 142 4,100 52 15 37 255 3,750 133 3,8832012 Total .................... 3,890 11 146 4,048 59 12 47 263 3,695 138 3,8322013 Total .................... 3,904 12 150 4,066 69 11 58 256 3,725 143 3,8682014 Total .................... 3,937 13 144 4,094 67 13 53 244 3,765 139 3,9032015 Total .................... 3,919 13 146 4,078 76 9 67 244 3,759 141 3,900
2016 January ................ 339 1 12 353 7 (s) 6 26 321 E 12 333 February .............. 301 1 12 314 5 1 5 11 297 E 11 308 March ................... 291 1 12 304 6 1 5 12 286 E 12 297 April ..................... 281 1 11 293 5 (s) 4 17 270 E 11 280 May ...................... 304 1 12 317 6 (s) 5 26 285 E 11 296 June ..................... 354 1 12 368 7 1 6 32 330 E 12 342 July ...................... 398 1 13 412 8 1 7 34 372 E 13 385 August ................. 395 1 13 410 7 1 7 23 381 E 13 394 September ........... 338 1 12 351 5 1 5 8 337 E 12 348 October ................ 300 1 12 313 6 (s) 5 10 297 E 11 308 November ............ 284 1 12 297 6 (s) 6 14 277 E 11 289 December ............ 332 1 12 345 5 1 5 28 311 E 12 322 Total .................... 3,918 13 146 4,077 73 6 67 241 3,762 140 3,902
2017 January ................ 330 1 12 343 7 (s) 7 19 318 E 12 330 February .............. 278 1 11 290 6 1 5 8 276 E 11 287 March ................... 305 1 12 318 6 1 5 20 291 E 12 303 April ..................... 282 1 11 294 6 1 4 15 273 E 11 284 May ...................... 310 1 12 323 5 1 4 23 292 E 11 303 June ..................... 345 1 12 358 6 1 5 23 329 E 12 341 July ...................... 390 1 13 404 6 1 5 29 368 E 13 380 August ................. 370 1 13 384 7 1 6 17 360 E 13 373 September ........... 323 1 11 336 5 1 5 7 322 E 11 333 October ................ 308 1 12 320 4 1 3 13 300 E 11 311 November ............ 298 1 12 310 4 1 3 19 283 E 11 295 December ............ 340 1 13 353 5 1 4 33 312 E 13 325 Total .................... 3,877 13 144 4,034 66 9 56 226 3,723 141 3,864
2018 January ................ R 360 1 13 374 5 1 4 26 340 E 12 353 February .............. 294 1 11 306 5 1 4 11 288 E 11 299 March ................... 308 1 12 321 6 1 4 22 292 E 12 304 April ..................... 289 1 11 302 5 2 3 R 19 274 E 11 285 May ...................... 327 1 12 340 5 1 4 34 298 E 12 310 June ..................... 359 1 12 372 5 1 4 R 32 333 E 12 345 July ...................... 398 1 13 R 413 5 1 4 R 35 370 E 13 382 August ................. R 394 1 13 R 408 6 1 5 R 22 R 378 E 13 R 391 September ........... 344 1 12 357 4 1 3 16 332 E 12 344 October ................ 313 1 12 R 326 4 1 3 R 13 304 E 12 316 November ............ 309 1 12 322 4 1 3 27 286 E 12 298 December ............ 323 1 13 337 4 1 3 21 307 E 12 320 Total .................... 4,018 13 146 4,178 58 14 44 277 3,802 E 144 R 3,946
a Electricity net generation at utility-scale facilities. Does not include distributed(small-scale) solar photovoltaic (PV) generation shown on Table 10.6. See Note 1,“Coverage of Electricity Statistics,” at end of section.
b Electricity-only and combined-heat-and-power (CHP) plants within the NAICS22 category whose primary business is to sell electricity, or electricity and heat, tothe public. Through 1988, data are for electric utilities only; beginning in 1989, dataare for electric utilities and independent power producers.
c Commercial combined-heat-and-power (CHP) and commercial electricity-onlyplants.
d Industrial combined-heat-and-power (CHP) and industrial electricity-onlyplants. Through 1988, data are for industrial hydroelectric power only.
e Electricity transmitted across U.S. borders. Net imports equal imports minusexports.
f Transmission and distribution losses (electricity losses that occur between thepoint of generation and delivery to the customer). See Note 1, "Electrical SystemEnergy Losses," at end of Section 2.
g Data collection frame differences and nonsampling error.h Electricity retail sales to ultimate customers by electric utilities and, beginning
in 1996, other energy service providers.i Use of electricity that is 1) self-generated, 2) produced by either the same
entity that consumes the power or an affiliate, and 3) used in direct support of aservice or industrial process located within the same facility or group of facilitiesthat house the generating equipment. Direct use is exclusive of station use.
R=Revised. E=Estimate. NA=Not available. (s)=Less than 0.5 billionkilowatthours.
Notes: • See Note 1, "Coverage of Electricity Statistics," and Note 2,"Classification of Power Plants Into Energy-Use Sectors," at end of section. • Data values preceded by "F" are derived from the U.S. Energy InformationAdministration’s Short-Term Integrated Forecasting System. See Note 3, "ElectricityForecast Values," at end of section. • Totals may not equal sum of componentsdue to independent rounding. • Geographic coverage is the 50 states and theDistrict of Columbia.
Web Page: See http://www.eia.gov/totalenergy/data/monthly/#electricity (Exceland CSV files) for all available annual data beginning in 1949 and monthly databeginning in 1973.
Sources: See end of section.

124 U. S. Energy Information Administration / Monthly Energy Review March 2019
Figure 7.2 Electricity Net Generation (Billion Kilowatthours)
Coal
Nuclear Electric Power
Petroleum
Natural Gas
Renewable Energy
0
500
1,000
1,500
2,000
2,500
1950 1955 1960 1965 1970 1975 1980 1985 1990 1995 2000 2005 2010 2015
Total (All Sectors), Major Sources, 1949–2018
Coal
Nuclear Electric Power Petroleum
Natural Gas
Renewable Energy [a]
0
50
100
150
200
J F M A M J J A S O N D J F M A M J J A S O N D J F M A M J J A S O N D
2016 2017 2018
Total (All Sectors), Major Sources, Monthly
1,366
1,139
807
679
23
0
200
400
600
800
1,000
1,200
1,400
1,600
NaturalGas
Coal Nuclear ElectricPower
RenewableEnergy [a]
Petroleum
Electric Power Sector, Major Sources, 2018
8.3
2.3
0.3 0.2
0
2
4
6
8
10
Natural Gas Waste Coal Petroleum
Commercial Sector, Major Sources, 2018
94.0
28.0
8.2 7.51.4 1.3
0
20
40
60
80
100
Natural Gas Wood Other Gases [b] Coal HydroelectricPower [c]
Petroleum
Industrial Sector, Major Sources, 2018
[a] Conventional hydroelectric power, wood, waste, geothermal, solar, and
wind.
[b] Blast furnace gas, and other manufactured and waste derived from fossil
fuels.
[c] Conventional hydroelectric power.
Note: Data are for utility‐scale facilities.
Web Page: http://www.eia.gov/totalenergy/data/monthly/#electricity.
Sources: Tables 7.2a‐7.2c.

U. S. Energy Information Administration / Monthly Energy Review March 2019 125
Table 7.2a Electricity Net Generation: Total (All Sectors) (Sum of Tables 7.2b and 7.2c; Million Kilowatthours)
Fossil Fuels
NuclearElectricPower
Hydro-electricPumpedStoragee
Renewable Energy
TotaljCoalaPetro-leumb
NaturalGasc
OtherGasesd
Conven-tionalHydro-electricPowerf
Biomass
Geo-thermal Solari WindWoodg Wasteh
1950 Total .............. 154,520 33,734 44,559 NA 0 f( ) 100,885 390 NA NA NA NA 334,0881955 Total .............. 301,363 37,138 95,285 NA 0 f( ) 116,236 276 NA NA NA NA 550,2991960 Total .............. 403,067 47,987 157,970 NA 518 f( ) 149,440 140 NA 33 NA NA 759,1561965 Total .............. 570,926 64,801 221,559 NA 3,657 f( ) 196,984 269 NA 189 NA NA 1,058,3861970 Total .............. 704,394 184,183 372,890 NA 21,804 f( ) 250,957 136 220 525 NA NA 1,535,1111975 Total .............. 852,786 289,095 299,778 NA 172,505 f( ) 303,153 18 174 3,246 NA NA 1,920,7551980 Total .............. 1,161,562 245,994 346,240 NA 251,116 f( ) 279,182 275 158 5,073 NA NA 2,289,6001985 Total .............. 1,402,128 100,202 291,946 NA 383,691 f( ) 284,311 743 640 9,325 11 6 2,473,0021990 Totalk ............ 1,594,011 126,460 372,765 10,383 576,862 -3,508 292,866 32,522 13,260 15,434 367 2,789 3,037,8271995 Total .............. 1,709,426 74,554 496,058 13,870 673,402 -2,725 310,833 36,521 20,405 13,378 497 3,164 3,353,4872000 Total .............. 1,966,265 111,221 601,038 13,955 753,893 -5,539 275,573 37,595 23,131 14,093 493 5,593 3,802,1052001 Total .............. 1,903,956 124,880 639,129 9,039 768,826 -8,823 216,961 35,200 14,548 13,741 543 6,737 3,736,6442002 Total .............. 1,933,130 94,567 691,006 11,463 780,064 -8,743 264,329 38,665 15,044 14,491 555 10,354 3,858,4522003 Total .............. 1,973,737 119,406 649,908 15,600 763,733 -8,535 275,806 37,529 15,812 14,424 534 11,187 3,883,1852004 Total .............. 1,978,301 121,145 710,100 15,252 788,528 -8,488 268,417 38,117 15,421 14,811 575 14,144 3,970,5552005 Total .............. 2,012,873 122,225 760,960 13,464 781,986 -6,558 270,321 38,856 15,420 14,692 550 17,811 4,055,4232006 Total .............. 1,990,511 64,166 816,441 14,177 787,219 -6,558 289,246 38,762 16,099 14,568 508 26,589 4,064,7022007 Total .............. 2,016,456 65,739 896,590 13,453 806,425 -6,896 247,510 39,014 16,525 14,637 612 34,450 4,156,7452008 Total .............. 1,985,801 46,243 882,981 11,707 806,208 -6,288 254,831 37,300 17,734 14,840 864 55,363 4,119,3882009 Total .............. 1,755,904 38,937 920,979 10,632 798,855 -4,627 273,445 36,050 18,443 15,009 891 73,886 3,950,3312010 Total .............. 1,847,290 37,061 987,697 11,313 806,968 -5,501 260,203 37,172 18,917 15,219 1,212 94,652 4,125,0602011 Total .............. 1,733,430 30,182 1,013,689 11,566 790,204 -6,421 319,355 37,449 19,222 15,316 1,818 120,177 4,100,1412012 Total .............. 1,514,043 23,190 1,225,894 11,898 769,331 -4,950 276,240 37,799 19,823 15,562 4,327 140,822 4,047,7652013 Total .............. 1,581,115 27,164 1,124,836 12,853 789,016 -4,681 268,565 40,028 20,830 15,775 9,036 167,840 4,065,9642014 Total .............. 1,581,710 30,232 1,126,609 12,022 797,166 -6,174 259,367 42,340 21,650 15,877 17,691 181,655 4,093,6062015 Total .............. 1,352,398 28,249 1,333,482 13,117 797,178 -5,091 249,080 41,929 21,703 15,918 24,893 190,719 4,077,601
2016 January .......... 113,459 2,361 110,044 1,195 72,525 -312 25,615 3,600 1,795 1,332 1,486 18,466 352,719 February ........ 92,705 2,209 98,552 1,062 65,638 -399 24,139 3,406 1,708 1,243 2,242 20,138 313,685 March ............. 72,173 1,801 103,890 1,197 66,149 -384 27,390 3,403 1,809 1,315 2,617 21,939 304,390 April ............... 72,113 1,839 98,876 1,132 62,732 -452 25,878 2,967 1,811 1,209 2,880 20,799 292,894 May ................ 81,695 1,958 110,430 1,053 66,576 -321 25,486 3,187 1,909 1,342 3,425 18,848 316,784 June ............... 116,034 1,977 131,395 1,043 67,175 -497 23,237 3,414 1,794 1,251 3,473 16,303 367,781 July ................ 136,316 2,322 151,554 1,077 70,349 -784 21,455 3,658 1,840 1,311 3,945 17,618 411,887 August ........... 135,635 2,335 154,760 1,064 71,526 -902 19,570 3,722 1,860 1,324 3,969 13,589 409,701 September ..... 114,138 1,926 125,603 1,020 65,448 -715 16,368 3,407 1,757 1,327 3,635 16,404 351,484 October .......... 99,194 1,571 102,898 913 60,733 -561 17,339 3,176 1,693 1,353 3,191 20,335 312,945 November ...... 86,940 1,869 93,942 1,013 65,179 -607 18,808 3,391 1,891 1,364 2,767 19,406 297,062 December ...... 118,747 2,035 96,364 1,037 71,662 -753 22,528 3,615 1,944 1,454 2,424 23,146 345,343 Total .............. 1,239,149 24,205 1,378,307 12,807 805,694 -6,686 267,812 40,947 21,813 15,826 36,054 226,993 4,076,675
2017 January .......... 115,333 2,065 95,473 1,046 73,121 -435 26,788 3,505 1,948 1,383 2,030 19,840 343,190 February ........ 86,822 1,597 82,694 977 63,560 -508 23,643 3,186 1,694 1,239 2,555 21,198 289,652 March ............. 89,365 1,649 95,022 1,060 65,093 -521 29,272 3,457 1,854 1,385 4,245 24,993 317,935 April ............... 81,335 1,277 88,418 1,001 56,743 -439 29,390 3,149 1,755 1,337 4,696 24,613 294,325 May ................ 92,777 1,818 98,067 1,055 61,313 -423 32,384 3,189 1,859 1,283 5,663 22,450 322,518 June ............... 107,508 1,902 117,317 992 67,011 -568 30,222 3,439 1,795 1,214 6,175 19,809 357,916 July ................ 127,697 1,806 146,994 1,048 71,314 -759 26,491 3,703 1,813 1,355 5,753 15,960 404,386 August ........... 119,488 1,734 141,209 1,134 72,384 -638 21,851 3,753 1,808 1,345 5,434 13,621 384,342 September ..... 98,203 1,637 118,112 1,060 68,098 -606 19,067 3,294 1,696 1,297 5,115 17,855 335,861 October .......... 89,775 1,528 106,852 999 65,995 -463 18,284 3,306 1,717 1,229 4,821 25,306 320,376 November ...... 90,986 1,658 94,883 1,001 66,618 -478 20,565 3,430 1,795 1,289 3,409 24,082 310,315 December ...... 106,546 2,719 111,373 1,096 73,700 -656 22,377 3,738 1,877 1,571 3,389 24,575 353,452 Total .............. 1,205,835 21,390 1,296,415 12,469 804,950 -6,495 300,333 41,152 21,610 15,927 53,286 254,303 4,034,268
2018 January .......... 118,939 R 6,243 R 110,046 R 994 74,649 -547 R 25,596 R 3,759 1,854 R 1,407 R 3,407 R 26,862 R 374,324 February ........ 81,922 1,518 R 96,002 R 990 64,790 -315 R 25,533 R 3,379 1,761 R 1,326 R 4,113 R 24,096 R 306,115 March ............. R 80,612 1,459 R 104,933 R 1,064 67,033 -490 R 25,951 R 3,535 1,870 1,414 R 5,203 R 27,283 R 320,982 April ............... 73,383 1,546 R 99,446 R 940 59,133 -377 R 27,490 R 3,096 1,766 R 1,246 R 6,249 R 26,783 R 301,739 May ................ 85,311 1,437 R 116,107 R 1,000 67,320 -390 R 30,434 R 3,550 1,744 R 1,434 R 7,070 R 23,603 R 339,694 June ............... R 101,509 1,827 R 130,823 1,010 69,688 -433 R 27,955 R 3,573 1,787 R 1,369 R 7,804 R 24,376 R 372,398 July ................ R 115,477 R 1,892 R 167,250 R 1,105 72,456 -644 R 24,014 R 3,690 1,798 1,436 R 6,938 R 16,014 R 412,542 August ........... R 115,216 R 1,914 R 162,377 R 1,225 72,282 -747 R 21,400 R 3,570 1,797 1,429 R 6,981 R 19,530 R 407,981 September ..... R 96,742 1,874 R 142,772 1,001 64,725 -603 R 18,665 R 3,284 1,635 1,388 R 6,469 R 17,977 R 356,728 October .......... 87,452 1,473 R 124,171 930 59,397 -492 R 18,781 R 3,277 1,766 R 1,347 R 5,223 R 21,147 R 325,563 November ...... R 93,005 R 1,652 R 107,109 933 63,948 -343 R 22,176 R 3,284 1,752 R 1,397 R 3,958 R 22,457 R 322,409 December ...... 96,825 1,737 106,978 998 71,657 -522 23,728 3,414 1,825 1,535 3,188 24,825 337,334 Total .............. 1,146,393 24,572 1,468,013 12,191 807,078 -5,905 291,724 41,411 21,354 16,728 66,604 274,952 4,177,810
a Anthracite, bituminous coal, subbituminous coal, lignite, waste coal, and coalsynfuel.
b Distillate fuel oil, residual fuel oil, petroleum coke, jet fuel, kerosene, otherpetroleum, waste oil, and, beginning in 2011, propane.
c Natural gas, plus a small amount of supplemental gaseous fuels.d Blast furnace gas, and other manufactured and waste gases derived from
fossil fuels. Through 2010, also includes propane gas.e Pumped storage facility production minus energy used for pumping.f Through 1989, hydroelectric pumped storage is included in "Conventional
Hydroelectric Power."g Wood and wood-derived fuels.h Municipal solid waste from biogenic sources, landfill gas, sludge waste,
agricultural byproducts, and other biomass. Through 2000, also includesnon-renewable waste (municipal solid waste from non-biogenic sources, andtire-derived fuels).
i Electricity net generation from solar thermal and photovoltaic (PV) energy atutility-scale facilities. Does not include distributed (small-scale) solar photovoltaic
generation. See Table 10.6.j Includes batteries, chemicals, hydrogen, pitch, purchased steam, sulfur,
miscellaneous technologies, and, beginning in 2001, non-renewable waste(municipal solid waste from non-biogenic sources, and tire-derived fuels).
k Through 1988, all data except hydroelectric are for electric utilities only;hydroelectric data through 1988 include industrial plants as well as electric utilities.Beginning in 1989, data are for electric utilities, independent power producers,commercial plants, and industrial plants.
R=Revised. NA=Not available. Notes: • Data are for utility-scale facilities. See Note 1, "Coverage of Electricity
Statistics," at end of section. • Totals may not equal sum of components due toindependent rounding. • Geographic coverage is the 50 states and the District ofColumbia.
Web Page: See http://www.eia.gov/totalenergy/data/monthly/#electricity (Exceland CSV files) for all available annual data beginning in 1949 and monthly databeginning in 1973.
Sources: See end of section, “Table 7.2b Sources” and “Table 7.2c Sources.”

126 U. S. Energy Information Administration / Monthly Energy Review March 2019
Table 7.2b Electricity Net Generation: Electric Power Sector (Subset of Table 7.2a; Million Kilowatthours)
Fossil Fuels
NuclearElectricPower
Hydro-electricPumpedStoragee
Renewable Energy
TotaljCoalaPetro-leumb
NaturalGasc
OtherGasesd
Conven-tionalHydro-electricPowerf
Biomass
Geo-thermal Solari WindWoodg Wasteh
1950 Total .............. 154,520 33,734 44,559 NA 0 f( ) 95,938 390 NA NA NA NA 329,1411955 Total .............. 301,363 37,138 95,285 NA 0 f( ) 112,975 276 NA NA NA NA 547,0381960 Total .............. 403,067 47,987 157,970 NA 518 f( ) 145,833 140 NA 33 NA NA 755,5491965 Total .............. 570,926 64,801 221,559 NA 3,657 f( ) 193,851 269 NA 189 NA NA 1,055,2521970 Total .............. 704,394 184,183 372,890 NA 21,804 f( ) 247,714 136 220 525 NA NA 1,531,8681975 Total .............. 852,786 289,095 299,778 NA 172,505 f( ) 300,047 18 174 3,246 NA NA 1,917,6491980 Total .............. 1,161,562 245,994 346,240 NA 251,116 f( ) 276,021 275 158 5,073 NA NA 2,286,4391985 Total .............. 1,402,128 100,202 291,946 NA 383,691 f( ) 281,149 743 640 9,325 11 6 2,469,8411990 Totalk ............ 1,572,109 118,864 309,486 621 576,862 -3,508 289,753 7,032 11,500 15,434 367 2,789 2,901,3221995 Total .............. 1,686,056 68,146 419,179 1,927 673,402 -2,725 305,410 7,597 17,986 13,378 497 3,164 3,194,2302000 Total .............. 1,943,111 105,192 517,978 2,028 753,893 -5,539 271,338 8,916 20,307 14,093 493 5,593 3,637,5292001 Total .............. 1,882,826 119,149 554,940 586 768,826 -8,823 213,749 8,294 12,944 13,741 543 6,737 3,580,0532002 Total .............. 1,910,613 89,733 607,683 1,970 780,064 -8,743 260,491 9,009 13,145 14,491 555 10,354 3,698,4582003 Total .............. 1,952,714 113,697 567,303 2,647 763,733 -8,535 271,512 9,528 13,808 14,424 534 11,187 3,721,1592004 Total .............. 1,957,188 114,678 627,172 3,568 788,528 -8,488 265,064 9,736 13,062 14,811 575 14,144 3,808,3602005 Total .............. 1,992,054 116,482 683,829 3,777 781,986 -6,558 267,040 10,570 13,031 14,692 550 17,811 3,902,1922006 Total .............. 1,969,737 59,708 734,417 4,254 787,219 -6,558 286,254 10,341 13,927 14,568 508 26,589 3,908,0772007 Total .............. 1,998,390 61,306 814,752 4,042 806,425 -6,896 245,843 10,711 14,294 14,637 612 34,450 4,005,3432008 Total .............. 1,968,838 42,881 802,372 3,200 806,208 -6,288 253,096 10,638 15,379 14,840 864 55,363 3,974,3492009 Total .............. 1,741,123 35,811 841,006 3,058 798,855 -4,627 271,506 10,738 15,954 15,009 891 73,886 3,809,8372010 Total .............. 1,827,738 34,679 901,389 2,967 806,968 -5,501 258,455 11,446 16,376 15,219 1,206 94,636 3,972,3862011 Total .............. 1,717,891 28,202 926,290 2,939 790,204 -6,421 317,531 10,733 15,989 15,316 1,727 120,121 3,948,1862012 Total .............. 1,500,557 20,072 1,132,791 2,984 769,331 -4,950 273,859 11,050 16,555 15,562 4,164 140,749 3,890,3582013 Total .............. 1,567,722 24,510 1,028,949 4,322 789,016 -4,681 265,058 12,302 16,918 15,775 8,724 167,742 3,903,7152014 Total .............. 1,568,774 28,043 1,033,172 3,358 797,166 -6,174 258,046 15,027 17,602 15,877 17,304 181,496 3,937,0032015 Total .............. 1,340,993 26,505 1,237,656 3,715 797,178 -5,091 247,636 14,563 17,823 15,918 24,456 190,547 3,919,294
2016 January .......... 112,624 2,217 101,786 344 72,525 -312 25,464 1,202 1,490 1,332 1,458 18,447 339,200 February ........ 91,909 2,079 90,849 299 65,638 -399 24,006 1,183 1,424 1,243 2,201 20,118 301,122 March ............. 71,346 1,695 95,849 360 66,149 -384 27,226 1,135 1,491 1,315 2,571 21,920 291,262 April ............... 71,419 1,745 91,257 317 62,732 -452 25,735 883 1,501 1,209 2,831 20,781 280,548 May ................ 80,935 1,814 102,482 313 66,576 -321 25,355 947 1,585 1,342 3,375 18,832 303,879 June ............... 115,197 1,847 123,043 351 67,175 -497 23,125 1,094 1,516 1,251 3,418 16,290 354,445 July ................ 135,420 2,186 142,558 346 70,349 -784 21,337 1,242 1,534 1,311 3,886 17,605 397,635 August ........... 134,762 2,210 145,610 332 71,526 -902 19,458 1,313 1,557 1,324 3,908 13,579 395,328 September ..... 113,347 1,822 117,197 346 65,448 -715 16,279 1,168 1,474 1,327 3,584 16,391 338,260 October .......... 98,474 1,450 94,754 234 60,733 -561 17,229 952 1,406 1,353 3,147 20,318 300,073 November ...... 86,275 1,737 85,907 351 65,179 -607 18,721 1,066 1,577 1,364 2,729 19,388 284,282 December ...... 117,955 1,908 88,088 318 71,662 -753 22,390 1,234 1,628 1,454 2,389 23,122 332,044 Total .............. 1,229,663 22,710 1,279,380 3,912 805,694 -6,686 266,326 13,420 18,183 15,826 35,497 226,790 3,918,078
2017 January .......... 114,572 1,947 86,885 349 73,121 -435 26,635 1,189 1,646 1,383 2,011 19,822 329,751 February ........ 86,158 1,491 75,045 308 63,560 -508 23,513 1,061 1,423 1,239 2,526 21,179 277,548 March ............. 88,688 1,519 86,855 358 65,093 -521 29,126 1,216 1,544 1,385 4,200 24,968 304,996 April ............... 80,743 1,179 80,578 300 56,743 -439 29,221 975 1,465 1,337 4,646 24,591 281,892 May ................ 92,141 1,720 90,021 350 61,313 -423 32,205 977 1,554 1,283 5,605 22,429 309,762 June ............... 106,825 1,793 108,833 324 67,011 -568 30,083 1,093 1,515 1,214 6,109 19,791 344,617 July ................ 127,019 1,687 137,841 369 71,314 -759 26,363 1,239 1,513 1,355 5,690 15,948 390,204 August ........... 118,810 1,610 132,376 360 72,384 -638 21,741 1,271 1,508 1,345 5,374 13,611 370,387 September ..... 97,560 1,543 110,219 346 68,098 -606 18,978 1,088 1,422 1,297 5,059 17,840 323,400 October .......... 89,114 1,427 98,826 326 65,995 -463 18,171 1,083 1,436 1,229 4,771 25,283 307,760 November ...... 90,347 1,543 86,819 352 66,618 -478 20,421 1,163 1,496 1,289 3,372 24,059 297,585 December ...... 105,860 2,582 102,457 383 73,700 -656 22,255 1,286 1,564 1,571 3,358 24,552 339,547 Total .............. 1,197,838 20,039 1,196,754 4,126 804,950 -6,495 298,711 13,641 18,084 15,927 52,723 254,074 3,877,450
2018 January .......... 118,151 R 6,050 R 101,254 329 74,649 -547 R 25,462 R 1,316 1,567 R 1,407 R 3,375 R 26,834 R 360,468 February ........ R 81,226 1,413 R 88,169 326 64,790 -315 R 25,399 R 1,155 1,500 R 1,326 R 4,072 R 24,070 R 293,720 March ............. R 79,910 1,352 R 96,975 346 67,033 -490 R 25,806 R 1,172 1,582 1,414 R 5,151 R 27,253 R 308,123 April ............... R 72,769 1,442 R 91,456 334 59,133 -377 R 27,346 R 872 1,492 R 1,246 R 6,183 R 26,755 R 289,228 May ................ R 84,660 1,333 107,960 R 360 67,320 -390 R 30,283 R 1,125 1,471 R 1,434 R 6,995 R 23,578 R 326,710 June ............... R 100,873 1,699 122,324 330 69,688 -433 R 27,818 R 1,206 1,526 R 1,369 R 7,712 R 24,353 R 359,105 July ................ R 114,811 1,760 R 158,158 363 72,456 -644 R 23,882 R 1,216 1,530 1,436 R 6,861 R 15,995 R 398,473 August ........... R 114,554 R 1,803 R 153,127 393 72,282 -747 R 21,277 R 1,169 R 1,527 1,429 6,900 R 19,510 R 393,724 September ..... R 96,121 1,757 R 134,147 319 64,725 -603 R 18,547 R 1,047 1,390 1,388 R 6,393 R 17,957 R 343,548 October .......... 86,881 1,366 R 115,791 259 59,397 -492 R 18,652 R 1,032 1,489 R 1,347 R 5,165 R 21,122 R 312,618 November ...... R 92,407 R 1,555 R 98,296 298 63,948 -343 R 22,032 R 1,002 1,485 R 1,397 R 3,918 R 22,431 R 309,038 December ...... 96,172 1,619 98,001 342 71,657 -522 23,576 1,020 1,542 1,502 3,156 24,799 323,498 Total .............. 1,138,535 23,148 1,365,658 3,998 807,078 -5,905 290,080 13,333 18,102 16,695 65,882 274,656 4,018,253
a Anthracite, bituminous coal, subbituminous coal, lignite, waste coal, and coalsynfuel.
b Distillate fuel oil, residual fuel oil, petroleum coke, jet fuel, kerosene, otherpetroleum, waste oil, and, beginning in 2011, propane.
c Natural gas, plus a small amount of supplemental gaseous fuels.d Blast furnace gas, and other manufactured and waste gases derived from
fossil fuels. Through 2010, also includes propane gas.e Pumped storage facility production minus energy used for pumping.f Through 1989, hydroelectric pumped storage is included in "Conventional
Hydroelectric Power."g Wood and wood-derived fuels.h Municipal solid waste from biogenic sources, landfill gas, sludge waste,
agricultural byproducts, and other biomass. Through 2000, also includesnon-renewable waste (municipal solid waste from non-biogenic sources, andtire-derived fuels).
i Electricity net generation from solar thermal and photovoltaic (PV) energy atutility-scale facilities. Does not include distributed (small-scale) solar photovoltaic
generation. See Table 10.6.j Includes batteries, chemicals, hydrogen, pitch, purchased steam, sulfur,
miscellaneous technologies, and, beginning in 2001, non-renewable waste(municipal solid waste from non-biogenic sources, and tire-derived fuels).
k Through 1988, data are for electric utilities only. Beginning in 1989, data arefor electric utilites and independent power producers.
R=Revised. NA=Not available. Notes: • Data are for utility-scale facilities. See Note 1, "Coverage of Electricity
Statistics," at end of section. • The electric power sector comprises electricity-onlyand combined-heat-and-power (CHP) plants within the NAICS 22 category whoseprimary business is to sell electricity, or electricity and heat, to the public. • Totalsmay not equal sum of components due to independent rounding. • Geographiccoverage is the 50 states and the District of Columbia.
Web Page: See http://www.eia.gov/totalenergy/data/monthly/#electricity (Exceland CSV files) for all available annual data beginning in 1949 and monthly databeginning in 1973.
Sources: See end of section.

U. S. Energy Information Administration / Monthly Energy Review March 2019 127
Table 7.2c Electricity Net Generation: Commercial and Industrial Sectors (Subset of Table 7.2a; Million Kilowatthours)
Commercial Sectora Industrial Sectorb
CoalcPetro-leumd
NaturalGase
Biomass
Totalg CoalcPetro-leumd
NaturalGase
OtherGasesh
Hydro-electricPoweri
Biomass
TotalkWastef Woodj Wastef
1950 Total .................... NA NA NA NA NA NA NA NA NA 4,946 NA NA 4,9461955 Total .................... NA NA NA NA NA NA NA NA NA 3,261 NA NA 3,2611960 Total .................... NA NA NA NA NA NA NA NA NA 3,607 NA NA 3,6071965 Total .................... NA NA NA NA NA NA NA NA NA 3,134 NA NA 3,1341970 Total .................... NA NA NA NA NA NA NA NA NA 3,244 NA NA 3,2441975 Total .................... NA NA NA NA NA NA NA NA NA 3,106 NA NA 3,1061980 Total .................... NA NA NA NA NA NA NA NA NA 3,161 NA NA 3,1611985 Total .................... NA NA NA NA NA NA NA NA NA 3,161 NA NA 3,1611990 Total .................... 796 589 3,272 812 5,837 21,107 7,008 60,007 9,641 2,975 25,379 949 130,8301995 Total .................... 998 379 5,162 1,519 8,232 22,372 6,030 71,717 11,943 5,304 28,868 900 151,0252000 Total .................... 1,097 432 4,262 1,985 7,903 22,056 5,597 78,798 11,927 4,135 28,652 839 156,6732001 Total .................... 995 438 4,434 1,007 7,416 20,135 5,293 79,755 8,454 3,145 26,888 596 149,1752002 Total .................... 992 431 4,310 1,053 7,415 21,525 4,403 79,013 9,493 3,825 29,643 846 152,5802003 Total .................... 1,206 423 3,899 1,289 7,496 19,817 5,285 78,705 12,953 4,222 27,988 715 154,5302004 Total .................... 1,340 499 3,969 1,562 8,270 19,773 5,967 78,959 11,684 3,248 28,367 797 153,9252005 Total .................... 1,353 375 4,249 1,657 8,492 19,466 5,368 72,882 9,687 3,195 28,271 733 144,7392006 Total .................... 1,310 235 4,355 1,599 8,371 19,464 4,223 77,669 9,923 2,899 28,400 572 148,2542007 Total .................... 1,371 189 4,257 1,599 8,273 16,694 4,243 77,580 9,411 1,590 28,287 631 143,1282008 Total .................... 1,261 142 4,188 1,534 7,926 15,703 3,219 76,421 8,507 1,676 26,641 821 137,1132009 Total .................... 1,096 163 4,225 1,748 8,165 13,686 2,963 75,748 7,574 1,868 25,292 740 132,3292010 Total .................... 1,111 124 4,725 1,672 8,592 18,441 2,258 81,583 8,343 1,668 25,706 869 144,0822011 Total .................... 1,049 89 5,487 2,315 10,080 14,490 1,891 81,911 8,624 1,799 26,691 917 141,8752012 Total .................... 883 196 6,603 2,319 11,301 12,603 2,922 86,500 8,913 2,353 26,725 948 146,1072013 Total .................... 839 124 7,154 2,567 12,234 12,554 2,531 88,733 8,531 3,463 27,691 1,346 150,0152014 Total .................... 595 255 7,227 2,681 12,520 12,341 1,934 86,209 8,664 1,282 27,239 1,367 144,0832015 Total .................... 509 191 7,471 2,637 12,595 10,896 1,552 88,355 9,401 1,410 27,318 1,243 145,712
2016 January ................ 43 9 605 212 1,022 793 135 7,653 851 130 2,392 93 12,497 February .............. 45 9 570 192 967 750 121 7,133 763 115 2,217 92 11,597 March ................... 46 4 579 210 1,011 781 102 7,462 837 142 2,266 108 12,117 April ..................... 24 6 551 205 961 670 87 7,067 815 128 2,079 106 11,386 May ...................... 20 6 607 218 1,019 740 138 7,341 740 119 2,238 106 11,886 June ..................... 23 5 692 202 1,089 814 125 7,661 692 99 2,310 76 12,248 July ...................... 24 9 831 216 1,263 873 127 8,165 731 104 2,408 90 12,989 August ................. 26 7 859 215 1,298 847 118 8,291 732 92 2,398 89 13,075 September ........... 29 4 700 206 1,114 762 101 7,706 674 65 2,231 76 12,111 October ................ 27 5 617 202 1,021 693 117 7,527 679 88 2,220 86 11,851 November ............ 35 8 521 210 927 630 124 7,514 662 69 2,323 104 11,852 December ............ 42 9 598 208 1,015 750 118 7,678 720 117 2,375 108 12,283 Total .................... 383 82 7,730 2,496 12,706 9,103 1,412 91,197 8,895 1,269 27,458 1,134 145,890
2017 January ................ 41 14 681 213 1,098 720 104 7,907 696 126 2,308 89 12,341 February .............. 32 8 597 188 963 632 98 7,052 668 115 2,118 83 11,142 March ................... 33 10 652 214 1,071 644 120 7,515 702 131 2,239 95 11,868 April ..................... 20 5 574 202 976 573 93 7,266 701 146 2,169 88 11,457 May ...................... 19 7 619 225 1,069 616 91 7,428 704 155 2,205 80 11,686 June ..................... 21 6 718 207 1,135 662 104 7,765 668 124 2,340 73 12,164 July ...................... 25 7 786 222 1,227 653 112 8,367 679 115 2,457 79 12,956 August ................. 23 9 766 218 1,202 655 116 8,067 774 93 2,475 82 12,754 September ........... 27 7 701 202 1,107 615 86 7,191 715 75 2,204 72 11,354 October ................ 24 6 661 197 1,079 637 94 7,366 673 84 2,217 85 11,537 November ............ 29 8 611 207 1,020 610 108 7,453 649 121 2,261 91 11,710 December ............ 35 24 674 218 1,114 651 113 8,242 713 99 2,446 95 12,790 Total .................... 329 112 8,042 2,515 13,060 7,669 1,239 91,619 8,343 1,383 27,440 1,012 143,758
2018 January ................ 44 NM R 673 199 R 1,124 744 R 148 R 8,119 R 665 112 R 2,435 87 R 12,732 February .............. R 32 9 R 635 179 R 1,008 664 96 R 7,197 665 112 2,218 82 R 11,387 March ................... 26 9 R 651 199 R 1,063 676 97 R 7,307 R 718 122 R 2,358 89 R 11,796 April ..................... 22 9 R 634 190 R 1,040 591 94 R 7,356 R 607 119 R 2,222 85 R 11,471 May ...................... 19 9 644 195 R 1,070 632 96 R 7,503 R 640 125 R 2,420 78 R 11,915 June ..................... 21 8 706 193 R 1,148 615 120 R 7,793 680 114 R 2,359 68 12,144 July ...................... 25 12 R 821 194 R 1,251 R 641 R 121 R 8,271 R 742 113 R 2,465 73 R 12,819 August ................. 30 10 831 196 R 1,269 633 R 100 R 8,419 R 832 106 R 2,391 74 R 12,989 September ........... 29 9 R 749 179 R 1,148 592 108 R 7,876 682 103 R 2,229 65 R 12,031 October ................ 24 8 R 673 197 1,070 547 99 R 7,707 671 115 R 2,241 80 R 11,876 November ............ 27 13 R 641 184 1,014 R 572 84 R 8,172 634 127 R 2,279 82 R 12,357 December ............ 29 11 685 197 1,114 623 106 8,292 656 135 2,386 85 12,723 Total .................... 327 154 8,343 2,304 13,318 7,531 1,270 94,012 8,193 1,403 28,002 948 146,239
a Commercial combined-heat-and-power (CHP) and commercial electricity-onlyplants.
b Industrial combined-heat-and-power (CHP) and industrial electricity-onlyplants.
c Anthracite, bituminous coal, subbituminous coal, lignite, waste coal, and coalsynfuel.
d Distillate fuel oil, residual fuel oil, petroleum coke, jet fuel, kerosene, otherpetroleum, waste oil, and, beginning in 2011, propane.
e Natural gas, plus a small amount of supplemental gaseous fuels.f Municipal solid waste from biogenic sources, landfill gas, sludge waste,
agricultural byproducts, and other biomass. Through 2000, also includesnon-renewable waste (municipal solid waste from non-biogenic sources, andtire-derived fuels).
g Includes a small amount of conventional hydroelectric power, geothermal,other gases, solar photovoltaic (PV) energy, wind, wood, and other, which are notseparately displayed. Does not include distributed (small-scale) solar photovoltaicgeneration. shown on Table 10.6.
h Blast furnace gas, and other manufactured and waste gases derived from
fossil fuels. Through 2010, also includes propane gas.i Conventional hydroelectric power.j Wood and wood-derived fuels.k Includes photovoltaic (PV) energy, wind, batteries, chemicals, hydrogen, pitch,
purchased steam, sulfur, miscellaneous technologies, and, beginning in 2001,non-renewable waste (municipal solid waste from non-biogenic sources, andtire-derived fuels). Does not include distributed (small-scale) solar photovoltaicgeneration shown on Table 10.6.
R=Revised. NA=Not available. NM=Not meaningful. Notes: • Data are for utility-scale facilities. See Note 1, "Coverage of Electricity
Statistics," at end of section. • See Note 2, "Classification of Power Plants IntoEnergy-Use Sectors," at end of section. • Totals may not equal sum of componentsdue to independent rounding. • Geographic coverage is the 50 states and theDistrict of Columbia.
Web Page: See http://www.eia.gov/totalenergy/data/monthly/#electricity (Exceland CSV files) for all available annual data beginning in 1949 and monthly databeginning in 1973.
Sources: See end of section.

128 U. S. Energy Information Administration / Monthly Energy Review March 2019
Figure 7.3 Consumption of Selected Combustible Fuels for Electricity Generation
Total [a]
Electric Power
Industrial
0.0
0.2
0.4
0.6
0.8
1.0
1.2
1990 1995 2000 2005 2010 2015
Bill
ion S
hort
Ton
s
Coal by Sector,1989–2018
Total [a]
Electric Power
Industrial
0
50
100
150
200
250
300
1990 1995 2000 2005 2010 2015
Mill
ion B
arr
els
Petroleum by Sector,1989–2018
Total [a]
Electric Power
Industrial
0
2
4
6
8
10
12
1990 1995 2000 2005 2010 2015
Trilli
on C
ubic
Feet
Natural Gas by Sector,1989–2018
Total [a]
Electric Power
Industrial
0
50
100
150
200
1990 1995 2000 2005 2010 2015
Trilli
on B
tu
Other Gases [b] by Sector,1989–2018
Total [a]
Electric Power
Industrial
0
250
500
750
1990 1995 2000 2005 2010 2015
Trilli
on B
tu
Wood by Sector,1989–2018
Total
Electric Power
Industrial Commercial
0
100
200
300
400
1990 1995 2000 2005 2010 2015
Trilli
on B
tu
Waste by Sector,1989–2018
[a] Includes commercial sector.
[b] Blast furnace gas, and other manufactured and waste gases derived from
fossil fuels. Through 2010, also includes propane gas.
Note: Data are for utility‐scale facilities.
Web Page: http://www.eia.gov/totalenergy/data/monthly/#electricity.
Sources: Tables 7.3a‐7.3c.

U. S. Energy Information Administration / Monthly Energy Review March 2019 129
Table 7.3a Consumption of Combustible Fuels for Electricity Generation: Total (All Sectors) (Sum of Tables 7.3b and 7.3c)
Coala
Petroleum
NaturalGasf
OtherGasesg
Biomass
OtherjDistillateFuel Oilb
ResidualFuel Oilc
OtherLiquidsd
PetroleumCokee Totale Woodh Wastei
ThousandShort Tons Thousand Barrels
ThousandShort Tons
ThousandBarrels
BillionCubic Feet Trillion Btu
1950 Total .................... 91,871 5,423 69,998 NA NA 75,421 629 NA 5 NA NA1955 Total .................... 143,759 5,412 69,862 NA NA 75,274 1,153 NA 3 NA NA1960 Total .................... 176,685 3,824 84,371 NA NA 88,195 1,725 NA 2 NA NA1965 Total .................... 244,788 4,928 110,274 NA NA 115,203 2,321 NA 3 NA NA1970 Total .................... 320,182 24,123 311,381 NA 636 338,686 3,932 NA 1 2 NA1975 Total .................... 405,962 38,907 467,221 NA 70 506,479 3,158 NA (s) 2 NA1980 Total .................... 569,274 29,051 391,163 NA 179 421,110 3,682 NA 3 2 NA1985 Total .................... 693,841 14,635 158,779 NA 231 174,571 3,044 NA 8 7 NA1990 Totalk .................. 792,457 18,143 190,652 437 1,914 218,800 3,692 112 442 211 361995 Total .................... 860,594 19,615 95,507 680 3,355 132,578 4,738 133 480 316 422000 Total .................... 994,933 31,675 143,381 1,450 3,744 195,228 5,691 126 496 330 462001 Total .................... 972,691 31,150 165,312 855 3,871 216,672 5,832 97 486 228 1602002 Total .................... 987,583 23,286 109,235 1,894 6,836 168,597 6,126 131 605 257 1912003 Total .................... 1,014,058 29,672 142,518 2,947 6,303 206,653 5,616 156 519 249 1932004 Total .................... 1,020,523 20,163 142,088 2,856 7,677 203,494 5,675 135 344 230 1832005 Total .................... 1,041,448 20,651 141,518 2,968 8,330 206,785 6,036 110 355 230 1732006 Total .................... 1,030,556 13,174 58,473 2,174 7,363 110,634 6,462 115 350 241 1722007 Total .................... 1,046,795 15,683 63,833 2,917 6,036 112,615 7,089 115 353 245 1682008 Total .................... 1,042,335 12,832 38,191 2,822 5,417 80,932 6,896 97 339 267 1722009 Total .................... 934,683 12,658 28,576 2,328 4,821 67,668 7,121 84 320 272 1702010 Total .................... 979,684 14,050 23,997 2,056 4,994 65,071 7,680 90 350 281 1842011 Total .................... 934,938 11,231 14,251 1,844 5,012 52,387 7,884 91 348 279 2052012 Total .................... 825,734 9,285 11,755 1,565 3,675 40,977 9,485 103 390 290 2042013 Total .................... 860,729 9,784 11,766 1,681 4,852 47,492 8,596 115 398 298 2002014 Total .................... 853,634 14,465 14,704 2,363 4,412 53,593 8,544 110 431 314 2002015 Total .................... 739,594 12,438 14,124 2,363 4,044 49,145 10,017 106 407 313 204
2016 January ................ 61,983 1,258 1,049 165 342 4,179 786 7 32 25 17 February .............. 50,516 920 1,131 178 330 3,877 702 6 31 24 15 March ................... 39,864 698 678 119 362 3,306 758 6 30 25 16 April ..................... 39,065 644 687 90 382 3,330 735 6 25 26 16 May ...................... 45,032 808 752 102 370 3,514 819 6 27 26 17 June ..................... 63,186 707 864 123 380 3,594 986 6 30 25 17 July ...................... 74,132 810 1,348 129 400 4,289 1,158 6 32 26 18 August ................. 73,798 769 1,274 187 419 4,325 1,168 6 34 26 18 September ........... 62,335 640 856 124 376 3,500 932 6 31 25 17 October ................ 54,537 636 929 64 250 2,879 761 5 28 24 16 November ............ 48,076 830 734 107 307 3,204 679 6 29 26 16 December ............ 64,847 943 893 159 336 3,672 686 6 32 27 17 Total .................... 677,371 9,662 11,195 1,548 4,253 43,671 10,170 74 360 305 199
2017 January ................ 63,460 940 846 151 368 3,775 679 6 31 27 16 February .............. 47,985 714 724 104 277 2,928 587 6 28 24 14 March ................... 48,840 814 738 105 265 2,984 690 6 31 26 16 April ..................... 44,279 658 718 103 168 2,317 647 6 27 25 15 May ...................... 50,898 808 811 94 329 3,357 720 6 28 26 16 June ..................... 58,852 707 908 148 350 3,512 873 6 30 26 16 July ...................... 69,769 689 811 93 344 3,312 1,105 6 33 26 17 August ................. 65,761 655 930 124 300 3,211 1,043 6 33 26 17 September ........... 54,713 692 820 110 276 3,004 878 6 29 24 15 October ................ 50,015 731 844 100 228 2,816 792 6 29 24 15 November ............ 50,882 751 711 129 293 3,054 686 6 30 25 15 December ............ 58,457 1,548 1,581 285 292 4,875 806 6 33 26 16 Total .................... 663,911 9,707 10,442 1,547 3,490 39,144 9,508 71 364 304 190
2018 January ................ 64,517 R 5,155 3,273 R 619 349 R 10,790 804 6 32 26 16 February .............. 45,655 578 676 114 275 2,743 717 6 29 25 14 March ................... 44,388 629 666 114 245 2,636 771 6 30 27 16 April ..................... 40,554 711 716 102 246 2,757 727 6 26 25 15 May ...................... R 47,470 839 810 131 161 2,587 872 6 31 25 16 June ..................... R 56,031 815 898 114 312 3,388 972 6 31 26 16 July ...................... 63,805 R 686 R 874 131 R 344 R 3,408 R 1,255 6 32 25 16 August ................. 63,710 R 724 R 948 145 R 327 R 3,454 R 1,216 7 30 26 16 September ........... 53,945 R 641 992 142 316 3,356 1,064 6 28 23 14 October ................ 48,488 695 895 141 190 R 2,680 R 914 5 28 24 15 November ............ R 51,720 R 759 766 R 129 247 R 2,888 R 777 5 27 24 15 December ............ 55,549 745 691 183 299 3,116 764 6 29 25 16 Total .................... 635,833 12,977 12,205 2,063 3,311 43,802 10,855 69 351 301 184
a Anthracite, bituminous coal, subbituminous coal, lignite, waste coal, and coalsynfuel.
b Fuel oil nos. 1, 2, and 4. For 1949–1979, data are for gas turbine and internalcombustion plant use of petroleum. For 1980–2000, electric utility data also includesmall amounts of kerosene and jet fuel.
c Fuel oil nos. 5 and 6. For 1949–1979, data are for steam plant use ofpetroleum. For 1980–2000, electric utility data also include a small amount of fueloil no. 4.
d Jet fuel, kerosene, other petroleum liquids, waste oil, and, beginning in 2011,propane.
e Petroleum coke is converted from short tons to barrels by multiplying by 5.f Natural gas, plus a small amount of supplemental gaseous fuels.
g Blast furnace gas, and other manufactured and waste gases derived fromfossil fuels. Through 2010, also includes propane gas.
h Wood and wood-derived fuels.i Municipal solid waste from biogenic sources, landfill gas, sludge waste,
agricultural byproducts, and other biomass. Through 2000, also includesnon-renewable waste (municipal solid waste from non-biogenic sources, and
tire-derived fuels).j Batteries, chemicals, hydrogen, pitch, purchased steam, sulfur, miscellaneous
technologies, and, beginning in 2001, non-renewable waste (municipal solid wastefrom non-biogenic sources, and tire-derived fuels).
k Through 1988, data are for electric utilities only. Beginning in 1989, data arefor electric utilities, independent power producers, commercial plants, and industrialplants.
R=Revised. NA=Not available. (s)=Less than 0.5 trillion Btu. Notes: • Data are for utility-scale facilities. See Note 1, "Coverage of Electricity
Statistics," at end of section. • Data are for fuels consumed to produce electricity. Data also include fuels consumed to produce useful thermal output at a smallnumber of electric utility combined-heat-and-power (CHP) plants. • Totals may notequal sum of components due to independent rounding. • Geographic coverage isthe 50 states and the District of Columbia.
Web Page: See http://www.eia.gov/totalenergy/data/monthly/#electricity (Exceland CSV files) for all available annual data beginning in 1949 and monthly databeginning in 1973.
Sources: See “Table 7.3b Sources” at end of section and sources for Table 7.3c.
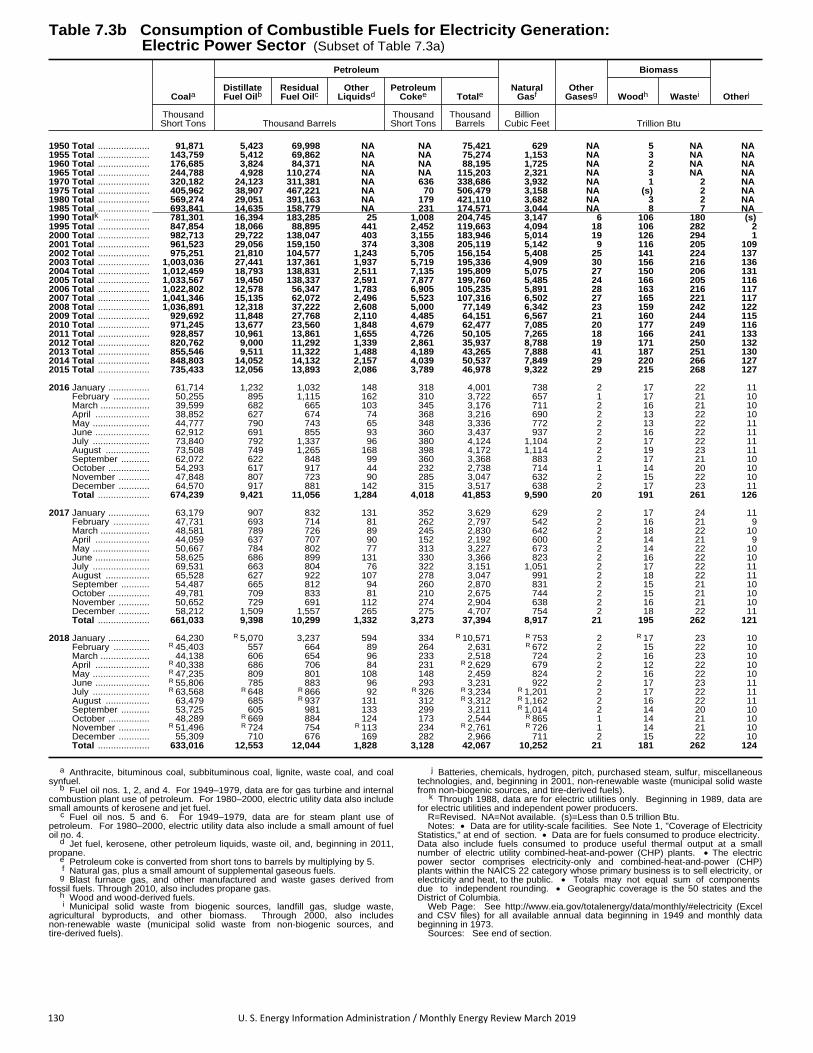
130 U. S. Energy Information Administration / Monthly Energy Review March 2019
Table 7.3b Consumption of Combustible Fuels for Electricity Generation: Electric Power Sector (Subset of Table 7.3a)
Coala
Petroleum
NaturalGasf
OtherGasesg
Biomass
OtherjDistillateFuel Oilb
ResidualFuel Oilc
OtherLiquidsd
PetroleumCokee Totale Woodh Wastei
ThousandShort Tons Thousand Barrels
ThousandShort Tons
ThousandBarrels
BillionCubic Feet Trillion Btu
1950 Total .................... 91,871 5,423 69,998 NA NA 75,421 629 NA 5 NA NA1955 Total .................... 143,759 5,412 69,862 NA NA 75,274 1,153 NA 3 NA NA1960 Total .................... 176,685 3,824 84,371 NA NA 88,195 1,725 NA 2 NA NA1965 Total .................... 244,788 4,928 110,274 NA NA 115,203 2,321 NA 3 NA NA1970 Total .................... 320,182 24,123 311,381 NA 636 338,686 3,932 NA 1 2 NA1975 Total .................... 405,962 38,907 467,221 NA 70 506,479 3,158 NA (s) 2 NA1980 Total .................... 569,274 29,051 391,163 NA 179 421,110 3,682 NA 3 2 NA1985 Total .................... 693,841 14,635 158,779 NA 231 174,571 3,044 NA 8 7 NA1990 Totalk .................. 781,301 16,394 183,285 25 1,008 204,745 3,147 6 106 180 (s)1995 Total .................... 847,854 18,066 88,895 441 2,452 119,663 4,094 18 106 282 22000 Total .................... 982,713 29,722 138,047 403 3,155 183,946 5,014 19 126 294 12001 Total .................... 961,523 29,056 159,150 374 3,308 205,119 5,142 9 116 205 1092002 Total .................... 975,251 21,810 104,577 1,243 5,705 156,154 5,408 25 141 224 1372003 Total .................... 1,003,036 27,441 137,361 1,937 5,719 195,336 4,909 30 156 216 1362004 Total .................... 1,012,459 18,793 138,831 2,511 7,135 195,809 5,075 27 150 206 1312005 Total .................... 1,033,567 19,450 138,337 2,591 7,877 199,760 5,485 24 166 205 1162006 Total .................... 1,022,802 12,578 56,347 1,783 6,905 105,235 5,891 28 163 216 1172007 Total .................... 1,041,346 15,135 62,072 2,496 5,523 107,316 6,502 27 165 221 1172008 Total .................... 1,036,891 12,318 37,222 2,608 5,000 77,149 6,342 23 159 242 1222009 Total .................... 929,692 11,848 27,768 2,110 4,485 64,151 6,567 21 160 244 1152010 Total .................... 971,245 13,677 23,560 1,848 4,679 62,477 7,085 20 177 249 1162011 Total .................... 928,857 10,961 13,861 1,655 4,726 50,105 7,265 18 166 241 1332012 Total .................... 820,762 9,000 11,292 1,339 2,861 35,937 8,788 19 171 250 1322013 Total .................... 855,546 9,511 11,322 1,488 4,189 43,265 7,888 41 187 251 1302014 Total .................... 848,803 14,052 14,132 2,157 4,039 50,537 7,849 29 220 266 1272015 Total .................... 735,433 12,056 13,893 2,086 3,789 46,978 9,322 29 215 268 127
2016 January ................ 61,714 1,232 1,032 148 318 4,001 738 2 17 22 11 February .............. 50,255 895 1,115 162 310 3,722 657 1 17 21 10 March ................... 39,599 682 665 103 345 3,176 711 2 16 21 10 April ..................... 38,852 627 674 74 368 3,216 690 2 13 22 10 May ...................... 44,777 790 743 65 348 3,336 772 2 13 22 11 June ..................... 62,912 691 855 93 360 3,437 937 2 16 22 11 July ...................... 73,840 792 1,337 96 380 4,124 1,104 2 17 22 11 August ................. 73,508 749 1,265 168 398 4,172 1,114 2 19 23 11 September ........... 62,072 622 848 99 360 3,368 883 2 17 21 10 October ................ 54,293 617 917 44 232 2,738 714 1 14 20 10 November ............ 47,848 807 723 90 285 3,047 632 2 15 22 10 December ............ 64,570 917 881 142 315 3,517 638 2 17 23 11 Total .................... 674,239 9,421 11,056 1,284 4,018 41,853 9,590 20 191 261 126
2017 January ................ 63,179 907 832 131 352 3,629 629 2 17 24 11 February .............. 47,731 693 714 81 262 2,797 542 2 16 21 9 March ................... 48,581 789 726 89 245 2,830 642 2 18 22 10 April ..................... 44,059 637 707 90 152 2,192 600 2 14 21 9 May ...................... 50,667 784 802 77 313 3,227 673 2 14 22 10 June ..................... 58,625 686 899 131 330 3,366 823 2 16 22 10 July ...................... 69,531 663 804 76 322 3,151 1,051 2 17 22 11 August ................. 65,528 627 922 107 278 3,047 991 2 18 22 11 September ........... 54,487 665 812 94 260 2,870 831 2 15 21 10 October ................ 49,781 709 833 81 210 2,675 744 2 15 21 10 November ............ 50,652 729 691 112 274 2,904 638 2 16 21 10 December ............ 58,212 1,509 1,557 265 275 4,707 754 2 18 22 11 Total .................... 661,033 9,398 10,299 1,332 3,273 37,394 8,917 21 195 262 121
2018 January ................ 64,230 R 5,070 3,237 594 334 R 10,571 R 753 2 R 17 23 10 February .............. R 45,403 557 664 89 264 2,631 R 672 2 15 22 10 March ................... 44,138 606 654 96 233 2,518 724 2 16 23 10 April ..................... R 40,338 686 706 84 231 R 2,629 679 2 12 22 10 May ...................... R 47,235 809 801 108 148 2,459 824 2 16 22 10 June ..................... R 55,806 785 883 96 293 3,231 922 2 17 23 11 July ...................... R 63,568 R 648 R 866 92 R 326 R 3,234 R 1,201 2 17 22 11 August ................. 63,479 685 R 937 131 312 R 3,312 R 1,162 2 16 22 11 September ........... 53,725 605 981 133 299 3,211 R 1,014 2 14 20 10 October ................ 48,289 R 669 884 124 173 2,544 R 865 1 14 21 10 November ............ R 51,496 R 724 754 R 113 234 R 2,761 R 726 1 14 21 10 December ............ 55,309 710 676 169 282 2,966 711 2 15 22 10 Total .................... 633,016 12,553 12,044 1,828 3,128 42,067 10,252 21 181 262 124
a Anthracite, bituminous coal, subbituminous coal, lignite, waste coal, and coalsynfuel.
b Fuel oil nos. 1, 2, and 4. For 1949–1979, data are for gas turbine and internalcombustion plant use of petroleum. For 1980–2000, electric utility data also includesmall amounts of kerosene and jet fuel.
c Fuel oil nos. 5 and 6. For 1949–1979, data are for steam plant use ofpetroleum. For 1980–2000, electric utility data also include a small amount of fueloil no. 4.
d Jet fuel, kerosene, other petroleum liquids, waste oil, and, beginning in 2011,propane.
e Petroleum coke is converted from short tons to barrels by multiplying by 5.f Natural gas, plus a small amount of supplemental gaseous fuels.
g Blast furnace gas, and other manufactured and waste gases derived fromfossil fuels. Through 2010, also includes propane gas.
h Wood and wood-derived fuels.i Municipal solid waste from biogenic sources, landfill gas, sludge waste,
agricultural byproducts, and other biomass. Through 2000, also includesnon-renewable waste (municipal solid waste from non-biogenic sources, andtire-derived fuels).
j Batteries, chemicals, hydrogen, pitch, purchased steam, sulfur, miscellaneoustechnologies, and, beginning in 2001, non-renewable waste (municipal solid wastefrom non-biogenic sources, and tire-derived fuels).
k Through 1988, data are for electric utilities only. Beginning in 1989, data arefor electric utilities and independent power producers.
R=Revised. NA=Not available. (s)=Less than 0.5 trillion Btu. Notes: • Data are for utility-scale facilities. See Note 1, "Coverage of Electricity
Statistics," at end of section. • Data are for fuels consumed to produce electricity. Data also include fuels consumed to produce useful thermal output at a smallnumber of electric utility combined-heat-and-power (CHP) plants. • The electricpower sector comprises electricity-only and combined-heat-and-power (CHP)plants within the NAICS 22 category whose primary business is to sell electricity, orelectricity and heat, to the public. • Totals may not equal sum of components due to independent rounding. • Geographic coverage is the 50 states and theDistrict of Columbia.
Web Page: See http://www.eia.gov/totalenergy/data/monthly/#electricity (Exceland CSV files) for all available annual data beginning in 1949 and monthly databeginning in 1973.
Sources: See end of section.

U. S. Energy Information Administration / Monthly Energy Review March 2019 131
Table 7.3c Consumption of Selected Combustible Fuels for Electricity Generation: Commercial and Industrial Sectors (Subset of Table 7.3a)
Commercial Sectora Industrial Sectorb
Coalc PetroleumdNaturalGase
Biomass
Coalc PetroleumdNaturalGase
OtherGasesg
Biomass
OtheriWastef Woodh Wastef
ThousandShort Tons
ThousandBarrels
BillionCubic Feet
TrillionBtu
ThousandShort Tons
ThousandBarrels
BillionCubic Feet Trillion Btu
1990 Total .................... 417 953 28 15 10,740 13,103 517 104 335 16 361995 Total .................... 569 649 43 21 12,171 12,265 601 114 373 13 402000 Total .................... 514 823 37 26 11,706 10,459 640 107 369 10 452001 Total .................... 532 1,023 36 15 10,636 10,530 654 88 370 7 442002 Total .................... 477 834 33 18 11,855 11,608 685 106 464 15 432003 Total .................... 582 894 38 19 10,440 10,424 668 127 362 13 462004 Total .................... 377 766 33 19 7,687 6,919 566 108 194 5 412005 Total .................... 377 585 34 20 7,504 6,440 518 85 189 5 462006 Total .................... 347 333 35 21 7,408 5,066 536 87 187 3 452007 Total .................... 361 258 34 19 5,089 5,041 554 88 188 4 412008 Total .................... 369 166 33 20 5,075 3,617 520 73 179 5 392009 Total .................... 317 190 34 23 4,674 3,328 520 62 160 4 422010 Total .................... 314 172 39 24 8,125 2,422 555 70 172 8 552011 Total .................... 347 137 47 31 5,735 2,145 572 74 182 7 572012 Total .................... 307 279 63 33 4,665 4,761 633 84 219 8 542013 Total .................... 513 335 67 36 4,670 3,892 642 74 210 11 502014 Total .................... 202 462 72 36 4,629 2,594 623 81 210 11 542015 Total .................... 163 260 70 35 3,999 1,907 625 77 191 10 58
2016 January ................ 12 14 3 3 258 164 44 5 14 1 4 February .............. 13 13 3 3 248 142 42 5 14 1 4 March ................... 13 6 3 3 252 124 44 5 14 1 4 April ..................... 7 8 3 3 206 106 42 5 13 1 4 May ...................... 6 8 4 3 249 170 43 5 14 1 5 June ..................... 7 7 4 3 266 151 45 4 14 1 5 July ...................... 7 11 5 3 285 154 48 4 15 1 5 August ................. 8 10 5 3 282 143 49 4 15 1 5 September ........... 8 7 4 3 254 125 45 4 14 1 5 October ................ 8 7 4 3 237 135 43 4 14 1 4 November ............ 10 11 3 3 218 146 44 4 14 1 4 December ............ 12 13 4 3 266 142 45 4 15 1 4 Total .................... 111 116 46 34 3,021 1,701 534 53 169 10 53
2017 January ................ 11 22 4 3 270 124 47 4 14 1 4 February .............. 9 14 4 3 245 117 42 4 13 1 4 March ................... 9 16 4 3 250 139 45 4 14 1 4 April ..................... 6 10 4 3 214 115 43 4 13 1 4 May ...................... 6 16 4 3 224 114 44 4 14 1 4 June ..................... 6 14 4 3 221 132 46 4 14 1 4 July ...................... 7 16 5 3 230 145 49 4 15 1 5 August ................. 7 20 5 3 227 143 47 5 15 1 5 September ........... 8 15 4 3 218 119 42 4 13 1 4 October ................ 7 14 4 3 227 127 43 4 14 1 4 November ............ 8 16 4 3 222 135 44 4 14 1 4 December ............ 9 33 4 3 236 134 49 4 15 1 4 Total .................... 95 204 50 34 2,783 1,545 541 49 169 8 49
2018 January ................ 12 68 4 3 274 R 152 48 4 15 1 4 February .............. 9 16 4 3 243 96 42 4 13 1 3 March ................... 8 14 4 3 243 104 43 4 14 1 4 April ..................... 6 16 4 3 210 111 44 4 14 1 3 May ...................... 6 20 4 3 230 108 44 4 15 1 4 June ..................... 6 19 4 3 219 138 46 4 14 1 3 July ...................... 7 28 5 3 R 230 R 146 R 48 4 15 1 3 August ................. 9 25 5 3 R 223 R 116 49 5 14 1 4 September ........... 8 21 5 2 212 125 46 4 13 (s) 3 October ................ 7 18 4 3 191 118 45 4 13 1 4 November ............ 7 24 4 3 R 216 R 102 48 4 14 1 4 December ............ 8 22 4 3 232 127 49 4 14 1 4 Total .................... 94 292 52 32 2,723 1,444 552 48 170 8 42
a Commercial combined-heat-and-power (CHP) and commercial electricity-onlyplants.
b Industrial combined-heat-and-power (CHP) and industrial electricity-onlyplants.
c Anthracite, bituminous coal, subbituminous coal, lignite, waste coal, and coalsynfuel.
d Distillate fuel oil, residual fuel oil, petroleum coke, jet fuel, kerosene, otherpetroleum, waste oil, and, beginning in 2011, propane.
e Natural gas, plus a small amount of supplemental gaseous fuels.f Municipal solid waste from biogenic sources, landfill gas, sludge waste,
agricultural byproducts, and other biomass. Through 2000, also includesnon-renewable waste (municipal solid waste from non-biogenic sources, andtire-derived fuels).
g Blast furnace gas, and other manufactured and waste gases derived fromfossil fuels. Through 2010, also includes propane gas.
h Wood and wood-derived fuels.i Batteries, chemicals, hydrogen, pitch, purchased steam, sulfur, miscellaneous
technologies, and, beginning in 2001, non-renewable waste (municipal solid wastefrom non-biogenic sources, and tire-derived fuels).
R=Revised. (s)=Less than 0.5 trillion Btu. Notes: • Data are for utility-scale facilities. See Note 1, "Coverage of Electricity
Statistics," at end of section. • See Note 2, “Classification of Power Plants IntoEnergy-Use Sectors,” at end of section. • Data are for fuels consumed to produceelectricity. Through 1988, data are not available. • Totals may not equal sum ofcomponents due to independent rounding. • Geographic coverage is the 50 statesand the District of Columbia.
Web Page: See http://www.eia.gov/totalenergy/data/monthly/#electricity (Exceland CSV files) for all available annual and monthly data beginning in 1989.
Sources: • 1989–1997: U.S. Energy Information Administration (EIA), FormEIA-867, "Annual Nonutility Power Producer Report." • 1998–2000: EIA, FormEIA-860B, "Annual Electric Generator Report—Nonutility." • 2001–2003: EIA,Form EIA-906, "Power Plant Report." • 2004–2007: EIA, Form EIA-906, "PowerPlant Report," and Form EIA-920, "Combined Heat and Power Plant Report." • 2008 forward: EIA, Form EIA-923, "Power Plant Operations Report."

132 U. S. Energy Information Administration / Monthly Energy Review March 2019
Figure 7.4 Consumption of Selected Combustible Fuels for Electricity Generation and Useful Thermal Output
Total [a]
Electric Power
Industrial
0.0
0.3
0.6
0.9
1.2
1990 1995 2000 2005 2010 2015
Bill
ion S
ho
rt T
ons
Coal by Sector,1989–2018
Total [a]
Electric Power
Industrial
0
50
100
150
200
250
300
350
1990 1995 2000 2005 2010 2015
Mill
ion
Barr
els
Petroleum by Sector,1989–2018
Total [a]
Electric Power
Industrial
0
2
4
6
8
10
12
14
1990 1995 2000 2005 2010 2015
Trilli
on
Cub
ic F
eet
Natural Gas by Sector,1989–2018
Total [a]
Electric Power
Industrial
0
100
200
300
400
1990 1995 2000 2005 2010 2015
Tri
llio
n B
tu
Other Gases [b] by Sector,1989–2018
Total [a]
Electric Power
Industrial
0.0
0.4
0.8
1.2
1.6
1990 1995 2000 2005 2010 2015
Qu
ad
rilli
on
Btu
Wood by Sector,1989–2018
Total
Electric Power
Industrial Commercial
0
100
200
300
400
500
1990 1995 2000 2005 2010 2015
Tri
llio
n B
tu
Waste by Sector,1989–2018
[a] Includes commercial sector.
[b] Blast furnace gas, and other manufactured and waste gases derived from
fossil fuels. Through 2010, also includes propane gas.
Note: Data are for utility‐scale facilities.
Web Page: http://www.eia.gov/totalenergy/data/monthly/#electricity.
Sources: Tables 7.4a‐7.4c.

U. S. Energy Information Administration / Monthly Energy Review March 2019 133
Table 7.4a Consumption of Combustible Fuels for Electricity Generation and Useful Thermal Output: Total (All Sectors) (Sum of Tables 7.4b and 7.4c)
Coala
Petroleum
NaturalGasf
OtherGasesg
Biomass
OtherjDistillateFuel Oilb
ResidualFuel Oilc
OtherLiquidsd
PetroleumCokee Totale Woodh Wastei
ThousandShort Tons Thousand Barrels
ThousandShort Tons
ThousandBarrels
BillionCubic Feet Trillion Btu
1950 Total .................... 91,871 5,423 69,998 NA NA 75,421 629 NA 5 NA NA1955 Total .................... 143,759 5,412 69,862 NA NA 75,274 1,153 NA 3 NA NA1960 Total .................... 176,685 3,824 84,371 NA NA 88,195 1,725 NA 2 NA NA1965 Total .................... 244,788 4,928 110,274 NA NA 115,203 2,321 NA 3 NA NA1970 Total .................... 320,182 24,123 311,381 NA 636 338,686 3,932 NA 1 2 NA1975 Total .................... 405,962 38,907 467,221 NA 70 506,479 3,158 NA (s) 2 NA1980 Total .................... 569,274 29,051 391,163 NA 179 421,110 3,682 NA 3 2 NA1985 Total .................... 693,841 14,635 158,779 NA 231 174,571 3,044 NA 8 7 NA1990 Totalk .................. 811,538 20,194 209,081 1,332 2,832 244,765 4,346 288 1,256 257 861995 Total .................... 881,012 21,697 112,168 1,322 4,590 158,140 5,572 313 1,382 374 972000 Total .................... 1,015,398 34,572 156,673 2,904 4,669 217,494 6,677 356 1,380 401 1092001 Total .................... 991,635 33,724 177,137 1,418 4,532 234,940 6,731 263 1,182 263 2292002 Total .................... 1,005,144 24,749 118,637 3,257 7,353 183,409 6,986 278 1,287 289 2522003 Total .................... 1,031,778 31,825 152,859 4,576 7,067 224,593 6,337 294 1,266 293 2622004 Total .................... 1,044,798 23,520 157,478 4,764 8,721 229,364 6,727 353 1,360 282 2542005 Total .................... 1,065,281 24,446 156,915 4,270 9,113 231,193 7,021 348 1,353 289 2372006 Total .................... 1,053,783 14,655 69,846 3,396 8,622 131,005 7,404 341 1,399 300 2472007 Total .................... 1,069,606 17,042 74,616 4,237 7,299 132,389 7,962 329 1,336 304 2392008 Total .................... 1,064,503 14,137 43,477 3,765 6,314 92,948 7,689 300 1,263 328 2122009 Total .................... 955,190 14,800 33,672 3,218 5,828 80,830 7,938 259 1,137 333 2282010 Total .................... 1,001,411 15,247 26,944 2,777 6,053 75,231 8,502 262 1,226 346 2372011 Total .................... 956,470 11,735 16,877 2,540 6,092 61,610 8,724 282 1,241 340 2612012 Total .................... 845,066 9,945 13,571 2,185 5,021 50,805 10,371 302 1,273 355 2522013 Total .................... 879,078 10,277 14,199 2,212 6,338 58,378 9,479 305 1,318 376 2362014 Total .................... 871,741 15,107 16,615 2,908 5,695 63,106 9,410 304 1,378 395 2362015 Total .................... 756,226 12,924 16,136 3,008 5,188 58,009 10,952 290 1,351 398 237
2016 January ................ 63,607 1,303 1,185 215 427 4,840 888 25 116 32 20 February .............. 52,019 1,045 1,263 238 425 4,669 794 23 110 31 18 March ................... 41,297 736 762 175 447 3,910 854 26 110 33 19 April ..................... 40,280 681 783 131 455 3,871 823 25 100 33 20 May ...................... 46,297 876 818 166 466 4,190 912 25 105 33 20 June ..................... 64,539 768 928 179 480 4,274 1,082 25 109 30 20 July ...................... 75,604 860 1,426 186 502 4,981 1,260 25 113 31 21 August ................. 75,232 803 1,350 230 520 4,983 1,273 25 115 32 22 September ........... 63,592 674 915 174 451 4,016 1,027 24 106 29 20 October ................ 55,798 674 1,017 112 342 3,514 853 23 104 31 19 November ............ 49,331 877 808 153 406 3,867 769 24 110 33 19 December ............ 66,362 982 977 214 431 4,327 785 26 132 34 20 Total .................... 693,958 10,278 12,231 2,173 5,352 51,441 11,322 296 1,330 383 238
2017 January ................ 64,930 987 943 207 449 4,381 781 26 121 35 19 February .............. 49,183 741 790 148 347 3,412 678 23 108 30 17 March ................... 50,132 846 825 139 355 3,584 787 25 119 33 19 April ..................... 45,408 687 787 146 242 2,829 736 24 110 31 18 May ...................... 52,034 836 878 136 406 3,881 813 26 112 31 19 June ..................... 60,005 726 973 183 441 4,087 968 24 116 30 19 July ...................... 70,971 710 870 129 430 3,861 1,209 25 122 31 21 August ................. 66,975 678 988 163 390 3,780 1,145 25 124 31 21 September ........... 55,817 723 894 139 352 3,517 975 24 111 28 18 October ................ 51,238 758 919 139 314 3,386 889 25 115 30 18 November ............ 52,142 797 873 164 373 3,696 782 25 118 32 18 December ............ 59,743 1,678 1,769 340 368 5,629 913 26 125 33 19 Total .................... 678,578 10,168 11,508 2,033 4,467 46,043 10,677 299 1,400 375 226
2018 January ................ 65,921 R 5,475 3,578 711 421 R 11,870 R 914 26 R 120 34 18 February .............. 46,922 608 R 747 161 338 3,206 R 815 24 112 31 17 March ................... R 45,631 673 748 153 307 3,110 R 875 26 116 34 18 April ..................... R 41,662 742 790 144 323 3,293 R 824 24 111 31 17 May ...................... R 48,567 876 894 174 225 3,069 R 969 24 R 115 31 18 June ..................... 57,119 852 1,037 158 378 3,937 R 1,072 25 R 116 30 19 July ...................... R 64,876 R 734 R 940 191 R 416 R 3,944 R 1,362 26 R 120 30 19 August ................. R 64,743 R 767 R 1,036 180 R 395 R 3,960 R 1,323 R 27 121 30 19 September ........... 55,025 R 683 1,091 171 389 R 3,887 R 1,166 24 110 27 17 October ................ R 49,496 729 991 180 264 3,221 R 1,015 25 114 31 18 November ............ R 52,856 R 816 854 R 165 312 R 3,396 R 883 24 113 31 18 December ............ 56,735 810 801 278 376 3,766 874 26 120 32 19 Total .................... 649,554 13,766 13,507 2,666 4,144 50,660 12,091 302 1,388 372 217
a Anthracite, bituminous coal, subbituminous coal, lignite, waste coal, and coalsynfuel.
b Fuel oil nos. 1, 2, and 4. For 1949–1979, data are for gas turbine and internalcombustion plant use of petroleum. For 1980–2000, electric utility data also includesmall amounts of kerosene and jet fuel.
c Fuel oil nos. 5 and 6. For 1949–1979, data are for steam plant use ofpetroleum. For 1980–2000, electric utility data also include a small amount of fueloil no. 4.
d Jet fuel, kerosene, other petroleum liquids, waste oil, and, beginning in 2011,propane.
e Petroleum coke is converted from short tons to barrels by multiplying by 5.f Natural gas, plus a small amount of supplemental gaseous fuels.
g Blast furnace gas, and other manufactured and waste gases derived fromfossil fuels. Through 2010, also includes propane gas.
h Wood and wood-derived fuels.i Municipal solid waste from biogenic sources, landfill gas, sludge waste,
agricultural byproducts, and other biomass. Through 2000, also includes
non-renewable waste (municipal solid waste from non-biogenic sources, andtire-derived fuels).
j Batteries, chemicals, hydrogen, pitch, purchased steam, sulfur, miscellaneoustechnologies, and, beginning in 2001, non-renewable waste (municipal solid wastefrom non-biogenic sources, and tire-derived fuels).
k Through 1988, data are for electric utilities only. Beginning in 1989, data arefor electric utilities, independent power producers, commercial plants, and industrialplants.
R=Revised. NA=Not available. (s)=Less than 0.5 trillion Btu. Notes: • Data are for utility-scale facilities. See Note 1, "Coverage of Electricity
Statistics," at end of section. • Totals may not equal sum of components due toindependent rounding. • Geographic coverage is the 50 states and the District ofColumbia.
Web Page: See http://www.eia.gov/totalenergy/data/monthly/#electricity (Exceland CSV files) for all available annual data beginning in 1949 and monthly databeginning in 1973.
Sources: See “Table 7.4b Sources” at end of section and sources for Table 7.4c.

134 U. S. Energy Information Administration / Monthly Energy Review March 2019
Table 7.4b Consumption of Combustible Fuels for Electricity Generation and Useful Thermal Output: Electric Power Sector (Subset of Table 7.4a)
Coala
Petroleum
NaturalGasf
OtherGasesg
Biomass
OtherjDistillateFuel Oilb
ResidualFuel Oilc
OtherLiquidsd
PetroleumCokee Totale Woodh Wastei
ThousandShort Tons Thousand Barrels
ThousandShort Tons
ThousandBarrels
BillionCubic Feet Trillion Btu
1950 Total .................... 91,871 5,423 69,998 NA NA 75,421 629 NA 5 NA NA1955 Total .................... 143,759 5,412 69,862 NA NA 75,274 1,153 NA 3 NA NA1960 Total .................... 176,685 3,824 84,371 NA NA 88,195 1,725 NA 2 NA NA1965 Total .................... 244,788 4,928 110,274 NA NA 115,203 2,321 NA 3 NA NA1970 Total .................... 320,182 24,123 311,381 NA 636 338,686 3,932 NA 1 2 NA1975 Total .................... 405,962 38,907 467,221 NA 70 506,479 3,158 NA (s) 2 NA1980 Total .................... 569,274 29,051 391,163 NA 179 421,110 3,682 NA 3 2 NA1985 Total .................... 693,841 14,635 158,779 NA 231 174,571 3,044 NA 8 7 NA1990 Totalk .................. 782,567 16,567 184,915 26 1,008 206,550 3,245 11 129 188 (s)1995 Total .................... 850,230 18,553 90,023 499 2,674 122,447 4,237 24 125 296 22000 Total .................... 985,821 30,016 138,513 454 3,275 185,358 5,206 25 134 318 12001 Total .................... 964,433 29,274 159,504 377 3,427 206,291 5,342 15 126 211 1132002 Total .................... 977,507 21,876 104,773 1,267 5,816 156,996 5,672 33 150 230 1432003 Total .................... 1,005,116 27,632 138,279 2,026 5,799 196,932 5,135 41 167 230 1402004 Total .................... 1,016,268 19,107 139,816 2,713 7,372 198,498 5,464 58 165 223 1382005 Total .................... 1,037,485 19,675 139,409 2,685 8,083 202,184 5,869 84 185 221 1232006 Total .................... 1,026,636 12,646 57,345 1,870 7,101 107,365 6,222 65 182 231 1252007 Total .................... 1,045,141 15,327 63,086 2,594 5,685 109,431 6,841 61 186 237 1242008 Total .................... 1,040,580 12,547 38,241 2,670 5,119 79,056 6,668 61 177 258 1312009 Total .................... 933,627 12,035 28,782 2,210 4,611 66,081 6,873 55 180 261 1242010 Total .................... 975,052 13,790 24,503 1,877 4,777 64,055 7,387 52 196 264 1242011 Total .................... 932,484 11,021 14,803 1,658 4,837 51,667 7,574 50 182 255 1432012 Total .................... 823,551 9,080 12,203 1,339 2,974 37,495 9,111 54 190 262 1432013 Total .................... 857,962 9,598 12,283 1,489 4,285 44,794 8,191 60 207 262 1392014 Total .................... 851,602 14,235 15,132 2,208 4,132 52,235 8,146 44 251 279 1372015 Total .................... 738,444 12,193 14,929 2,131 3,907 48,787 9,613 44 244 281 136
2016 January ................ 62,135 1,240 1,058 149 329 4,093 774 4 21 23 12 February .............. 50,661 910 1,143 176 321 3,832 690 3 20 22 11 March ................... 39,948 691 680 111 357 3,265 745 4 19 24 11 April ..................... 39,159 631 688 75 376 3,272 719 3 15 24 11 May ...................... 45,082 796 757 65 354 3,391 804 3 16 24 12 June ..................... 63,250 697 866 94 368 3,499 970 4 18 23 12 July ...................... 74,237 797 1,345 97 389 4,186 1,140 4 20 24 12 August ................. 73,890 754 1,277 169 408 4,241 1,151 4 21 24 12 September ........... 62,385 627 859 100 370 3,436 915 4 19 22 11 October ................ 54,621 623 932 45 244 2,818 744 3 16 22 11 November ............ 48,179 813 735 92 295 3,116 662 4 18 24 11 December ............ 65,006 930 901 151 326 3,614 671 4 21 25 12 Total .................... 678,554 9,510 11,242 1,322 4,138 42,763 9,985 45 224 281 139
2017 January ................ 63,595 916 856 147 362 3,728 660 4 20 26 12 February .............. 48,048 697 730 87 272 2,872 569 3 18 22 10 March ................... 48,925 794 733 90 256 2,898 672 4 21 24 11 April ..................... 44,358 640 716 90 162 2,255 627 4 17 22 10 May ...................... 50,952 789 812 78 324 3,297 700 4 17 24 11 June ..................... 58,920 690 910 133 340 3,435 851 4 18 24 11 July ...................... 69,882 667 815 77 332 3,220 1,082 4 20 24 12 August ................. 65,883 630 932 109 289 3,118 1,022 4 21 23 12 September ........... 54,780 675 822 95 270 2,942 859 4 18 22 11 October ................ 50,099 713 847 82 221 2,746 773 4 18 22 10 November ............ 51,013 734 707 113 285 2,979 666 4 19 23 11 December ............ 58,538 1,536 1,585 276 286 4,828 785 4 21 24 12 Total .................... 664,993 9,481 10,464 1,375 3,399 38,318 9,266 46 229 280 132
2018 January ................ 64,606 R 5,141 3,294 R 623 344 R 10,780 785 4 20 25 11 February .............. 45,757 561 674 90 273 2,690 701 4 18 23 11 March ................... 44,439 611 664 97 242 2,584 R 755 4 19 25 11 April ..................... R 40,601 691 715 86 242 2,700 707 4 15 23 11 May ...................... R 47,485 817 813 108 155 2,512 853 4 R 18 23 11 June ..................... 56,089 791 895 97 296 3,261 952 4 R 19 24 12 July ...................... 63,851 R 652 R 876 93 335 R 3,298 R 1,236 4 20 23 12 August ................. R 63,751 690 R 947 132 322 R 3,379 R 1,195 R 4 19 24 12 September ........... R 53,998 609 994 133 307 3,270 R 1,045 4 17 21 10 October ................ R 48,520 674 898 126 183 2,612 R 895 4 17 23 11 November ............ R 51,789 R 728 767 R 114 243 R 2,823 R 756 3 16 23 11 December ............ 55,610 714 696 228 292 3,095 744 4 18 24 11 Total .................... 636,498 12,680 12,231 1,927 3,233 43,005 10,626 46 215 280 136
a Anthracite, bituminous coal, subbituminous coal, lignite, waste coal, and coalsynfuel.
b Fuel oil nos. 1, 2, and 4. For 1949–1979, data are for gas turbine and internalcombustion plant use of petroleum. For 1980–2000, electric utility data also includesmall amounts of kerosene and jet fuel.
c Fuel oil nos. 5 and 6. For 1949–1979, data are for steam plant use ofpetroleum. For 1980–2000, electric utility data also include a small amount of fueloil no. 4.
d Jet fuel, kerosene, other petroleum liquids, waste oil, and, beginning in 2011,propane.
e Petroleum coke is converted from short tons to barrels by multiplying by 5.f Natural gas, plus a small amount of supplemental gaseous fuels.
g Blast furnace gas, and other manufactured and waste gases derived fromfossil fuels. Through 2010, also includes propane gas.
h Wood and wood-derived fuels.i Municipal solid waste from biogenic sources, landfill gas, sludge waste,
agricultural byproducts, and other biomass. Through 2000, also includesnon-renewable waste (municipal solid waste from non-biogenic sources, and
tire-derived fuels).j Batteries, chemicals, hydrogen, pitch, purchased steam, sulfur, miscellaneous
technologies, and, beginning in 2001, non-renewable waste (municipal solid wastefrom non-biogenic sources, and tire-derived fuels).
k Through 1988, data are for electric utilities only. Beginning in 1989, data arefor electric utilities and independent power producers.
R=Revised. NA=Not available. (s)=Less than 0.5 trillion Btu. Notes: • Data are for utility-scale facilities. See Note 1, "Coverage of Electricity
Statistics," at end of section. • The electric power sector comprises electricity-onlyand combined-heat-and-power (CHP) plants within the NAICS 22 category whoseprimary business is to sell electricity, or electricity and heat, to the public. • Totalsmay not equal sum of components due to independent rounding. • Geographiccoverage is the 50 states and the District of Columbia.
Web Page: See http://www.eia.gov/totalenergy/data/monthly/#electricity (Exceland CSV files) for all available annual data beginning in 1949 and monthly databeginning in 1973.
Sources: See end of section.

U. S. Energy Information Administration / Monthly Energy Review March 2019 135
Table 7.4c Consumption of Selected Combustible Fuels for Electricity Generation and Useful Thermal Output: Commercial and Industrial Sectors (Subset of Table 7.4a)
Commercial Sectora Industrial Sectorb
Coalc PetroleumdNaturalGase
Biomass
Coalc PetroleumdNaturalGase
OtherGasesg
Biomass
OtheriWastef Woodh Wastef
ThousandShort Tons
ThousandBarrels
BillionCubic Feet
TrillionBtu
ThousandShort Tons
ThousandBarrels
BillionCubic Feet Trillion Btu
1990 Total .................... 1,191 2,056 46 28 27,781 36,159 1,055 275 1,125 41 861995 Total .................... 1,419 1,245 78 40 29,363 34,448 1,258 290 1,255 38 952000 Total .................... 1,547 1,615 85 47 28,031 30,520 1,386 331 1,244 35 1082001 Total .................... 1,448 1,832 79 25 25,755 26,817 1,310 248 1,054 27 1012002 Total .................... 1,405 1,250 74 26 26,232 25,163 1,240 245 1,136 34 922003 Total .................... 1,816 1,449 58 29 24,846 26,212 1,144 253 1,097 34 1032004 Total .................... 1,917 2,009 72 34 26,613 28,857 1,191 295 1,193 24 942005 Total .................... 1,922 1,630 68 34 25,875 27,380 1,084 264 1,166 34 942006 Total .................... 1,886 935 68 36 25,262 22,706 1,115 277 1,216 33 1022007 Total .................... 1,927 752 70 31 22,537 22,207 1,050 268 1,148 36 982008 Total .................... 2,021 671 66 34 21,902 13,222 955 239 1,084 35 602009 Total .................... 1,798 521 76 36 19,766 14,228 990 204 955 35 822010 Total .................... 1,720 437 86 36 24,638 10,740 1,029 210 1,029 47 912011 Total .................... 1,668 333 87 43 22,319 9,610 1,063 232 1,057 43 942012 Total .................... 1,450 457 111 45 20,065 12,853 1,149 249 1,082 47 812013 Total .................... 1,356 887 118 47 19,761 12,697 1,170 246 1,109 67 692014 Total .................... 1,063 758 119 47 19,076 10,112 1,145 260 1,122 70 722015 Total .................... 798 622 116 47 16,984 8,600 1,222 246 1,103 70 73
2016 January ................ 75 68 11 4 1,397 679 103 22 95 5 6 February .............. 75 49 10 4 1,282 788 95 20 89 5 5 March ................... 74 21 10 4 1,275 624 99 22 90 6 5 April ..................... 46 26 9 4 1,076 573 95 22 85 5 6 May ...................... 37 22 10 4 1,178 776 98 22 89 5 6 June ..................... 46 21 11 4 1,243 754 101 21 91 3 6 July ...................... 46 45 13 4 1,321 749 107 21 92 3 6 August ................. 49 28 14 4 1,292 714 108 21 93 4 7 September ........... 50 16 11 4 1,157 564 101 20 86 3 6 October ................ 50 16 10 4 1,126 680 99 20 88 5 6 November ............ 60 47 9 4 1,093 704 99 20 91 5 6 December ............ 75 46 10 4 1,280 667 104 22 111 5 5 Total .................... 683 404 127 48 14,720 8,273 1,209 251 1,100 54 70
2017 January ................ 71 68 14 4 1,264 584 107 22 100 5 5 February .............. 58 43 12 4 1,077 496 97 20 89 4 5 March ................... 66 50 12 4 1,141 637 103 21 98 5 5 April ..................... 42 24 10 4 1,008 550 99 20 93 4 5 May ...................... 39 34 11 4 1,043 550 102 22 95 3 5 June ..................... 40 27 13 4 1,045 625 104 20 97 3 6 July ...................... 47 30 15 4 1,042 611 112 21 101 3 6 August ................. 43 45 15 4 1,050 618 108 22 102 3 6 September ........... 45 35 13 4 991 539 103 20 92 3 5 October ................ 42 33 13 4 1,098 607 104 21 97 4 5 November ............ 52 38 12 4 1,077 679 104 21 98 5 5 December ............ 66 88 14 4 1,139 713 115 22 103 5 5 Total .................... 610 516 154 48 12,975 7,209 1,257 253 1,166 47 65
2018 January ................ 70 186 R 14 4 1,245 R 904 115 22 100 5 5 February .............. 54 50 R 13 4 1,111 466 R 101 20 93 4 4 March ................... 51 44 R 13 4 1,140 482 107 22 97 5 5 April ..................... 45 38 R 12 4 R 1,016 555 104 20 95 5 4 May ...................... 41 37 R 12 4 1,041 520 104 20 97 4 5 June ..................... 42 36 R 13 4 R 989 640 107 21 R 97 3 5 July ...................... 47 58 R 14 4 R 978 R 588 112 22 100 3 4 August ................. 49 50 R 14 4 R 942 R 531 R 113 R 23 R 102 3 5 September ........... 51 42 R 13 3 977 576 108 21 93 3 4 October ................ 42 39 13 4 R 933 570 107 21 R 96 4 5 November ............ 48 62 12 4 1,018 511 114 21 96 5 5 December ............ 47 67 13 4 1,078 604 117 22 101 5 5 Total .................... 587 706 155 44 12,468 6,949 1,310 255 1,167 47 55
a Commercial combined-heat-and-power (CHP) and commercial electricity-onlyplants.
b Industrial combined-heat-and-power (CHP) and industrial electricity-onlyplants.
c Anthracite, bituminous coal, subbituminous coal, lignite, waste coal, and coalsynfuel.
d Distillate fuel oil, residual fuel oil, petroleum coke, jet fuel, kerosene, otherpetroleum, waste oil, and, beginning in 2011, propane.
e Natural gas, plus a small amount of supplemental gaseous fuels.f Municipal solid waste from biogenic sources, landfill gas, sludge waste,
agricultural byproducts, and other biomass. Through 2000, also includesnon-renewable waste (municipal solid waste from non-biogenic sources, andtire-derived fuels).
g Blast furnace gas, and other manufactured and waste gases derived fromfossil fuels. Through 2010, also includes propane gas.
h Wood and wood-derived fuels.i Batteries, chemicals, hydrogen, pitch, purchased steam, sulfur, miscellaneous
technologies, and, beginning in 2001, non-renewable waste (municipal solid wastefrom non-biogenic sources, and tire-derived fuels).
R=Revised. Notes: • Data are for utility-scale facilities. See Note 1, "Coverage of Electricity
Statistics," at end of section. • See Note 2, "Classification of Power Plants IntoEnergy-Use Sectors," at end of section. • Totals may not equal sum ofcomponents due to independent rounding. • Geographic coverage is the 50 statesand the District of Columbia.
Web Page: See http://www.eia.gov/totalenergy/data/monthly/#electricity (Exceland CSV files) for all available annual and monthly data beginning in 1989.
Sources: • 1989–1997: U.S. Energy Information Administration (EIA), FormEIA-867, "Annual Nonutility Power Producer Report." • 1998–2000: EIA, FormEIA-860B, "Annual Electric Generator Report—Nonutility." • 2001–2003: EIA,Form EIA-906, "Power Plant Report." • 2004–2007: EIA, Form EIA-906, "PowerPlant Report," and Form EIA-920, "Combined Heat and Power Plant Report."• 2008 forward: EIA, Form EIA-923, "Power Plant Operations Report."

136 U. S. Energy Information Administration / Monthly Energy Review March 2019
Figure 7.5 Stocks of Coal and Petroleum: Electric Power Sector
0
50
100
150
200
250
1950 1955 1960 1965 1970 1975 1980 1985 1990 1995 2000 2005 2010 2015
Mill
ion S
hort
Tons
Coal, 1949–2018
0
50
100
150
200
1950 1955 1960 1965 1970 1975 1980 1985 1990 1995 2000 2005 2010 2015
Mill
ion B
arr
els
Total Petroleum, 1949–2018
0
50
100
150
200
250
J F M A M J J A S O N D
Mill
ion S
hort
Tons
Coal, Monthly
2016 2017 2018
0
10
20
30
40
50
J F M A M J J A S O N D
Mill
ion B
arr
els
Total Petroleum, Monthly
2016 2017 2018
Note: Data are for utility‐sale facilities.
Web Page: http://www.eia.gov/totalenergy/data/monthly/#electricity.
Source: Table 7.5.

U. S. Energy Information Administration / Monthly Energy Review March 2019 137
Table 7.5 Stocks of Coal and Petroleum: Electric Power Sector
Coala
Petroleum
Distillate Fuel Oilb Residual Fuel Oilc Other Liquidsd Petroleum Cokee Totale,f
Thousand Short Tons Thousand Barrels Thousand Short Tons Thousand Barrels
1950 Year ............................. 31,842 NA NA NA NA 10,2011955 Year ............................. 41,391 NA NA NA NA 13,6711960 Year ............................. 51,735 NA NA NA NA 19,5721965 Year ............................. 54,525 NA NA NA NA 25,6471970 Year ............................. 71,908 NA NA NA 239 39,1511975 Year ............................. 110,724 16,432 108,825 NA 31 125,4131980 Year ............................. 183,010 30,023 105,351 NA 52 135,6351985 Year ............................. 156,376 16,386 57,304 NA 49 73,9331990 Year ............................. 156,166 16,471 67,030 NA 94 83,9701995 Year ............................. 126,304 15,392 35,102 NA 65 50,8212000 Yearg ........................... 102,296 15,127 24,748 NA 211 40,9322001 Year ............................. 138,496 20,486 34,594 NA 390 57,0312002 Year ............................. 141,714 17,413 25,723 800 1,711 52,4902003 Year ............................. 121,567 19,153 25,820 779 1,484 53,1702004 Year ............................. 106,669 19,275 26,596 879 937 51,4342005 Year ............................. 101,137 18,778 27,624 1,012 530 50,0622006 Year ............................. 140,964 18,013 28,823 1,380 674 51,5832007 Year ............................. 151,221 18,395 24,136 1,902 554 47,2032008 Year ............................. 161,589 17,761 21,088 1,955 739 44,4982009 Year ............................. 189,467 17,886 19,068 2,257 1,394 46,1812010 Year ............................. 174,917 16,758 16,629 2,319 1,019 40,8002011 Year ............................. 172,387 16,649 15,491 2,707 508 37,3872012 Year ............................. 185,116 16,433 12,999 2,792 495 34,6982013 Year ............................. 147,884 16,068 12,926 2,679 390 33,6222014 Year ............................. 151,548 18,309 12,764 2,432 827 37,6432015 Year ............................. 195,548 17,955 12,566 2,363 1,340 39,586
2016 January ........................ 187,203 17,930 12,020 2,357 1,320 38,907 February ...................... 187,064 17,662 11,645 2,337 1,323 38,262 March ........................... 191,553 17,501 11,733 2,335 1,240 37,768 April ............................. 193,185 17,637 11,982 2,169 1,181 37,693 May .............................. 192,417 17,856 12,094 2,189 1,071 37,495 June ............................. 182,086 17,859 11,936 2,197 905 36,519 July .............................. 168,119 17,726 11,696 2,183 858 35,897 August ......................... 158,908 17,820 11,595 2,150 780 35,464 September ................... 156,567 17,852 11,640 2,145 768 35,476 October ........................ 160,932 18,017 11,630 2,184 813 35,893 November .................... 170,277 18,324 11,953 2,227 833 36,668 December ................... 162,009 17,855 11,789 2,195 845 36,064
2017 January ........................ 156,214 17,718 11,858 2,186 768 35,601 February ...................... 160,502 17,588 11,744 2,168 756 35,277 March ........................... 161,815 17,336 12,681 2,157 785 36,099 April ............................. 163,937 17,362 12,439 2,168 844 36,187 May .............................. 162,542 17,265 12,170 2,143 772 35,439 June ............................. 158,014 17,082 11,993 2,133 742 34,916 July .............................. 145,811 17,150 11,740 2,143 724 34,655 August ......................... 141,204 17,091 11,531 2,129 749 34,497 September ................... 139,571 16,844 11,382 2,120 798 34,334 October ........................ 141,463 16,806 11,292 2,128 862 34,537 November .................... 143,424 16,980 11,381 2,140 859 34,796 December ................... 137,687 16,356 10,930 2,008 864 33,612
2018 January ........................ R 123,723 R 14,989 R 9,676 R 1,842 R 721 R 30,109 February ...................... R 121,019 R 15,223 R 10,137 R 1,878 R 689 R 30,685 March ........................... R 126,532 R 15,143 R 10,102 R 1,881 R 717 R 30,710 April ............................. R 129,071 R 15,064 R 10,032 R 1,884 R 710 R 30,527 May .............................. R 128,454 R 15,176 R 9,927 R 1,950 R 715 R 30,628 June ............................. R 121,529 R 14,860 R 9,871 R 1,846 R 583 R 29,491 July .............................. R 110,794 R 14,800 R 9,356 R 1,806 R 643 R 29,178 August ......................... R 104,172 R 14,396 R 8,694 R 1,737 R 607 R 27,863 September ................... R 100,781 R 14,430 R 8,434 R 1,729 R 576 R 27,476 October ........................ R 105,209 R 14,468 R 8,404 R 1,630 R 517 R 27,088 November .................... R 104,324 R 14,706 R 8,206 R 1,625 R 546 R 27,269 December ................... 102,786 14,906 8,557 1,619 541 27,787
a Anthracite, bituminous coal, subbituminous coal, and lignite; excludes wastecoal.
b Fuel oil nos. 1, 2 and 4. For 1973–1979, data are for gas turbine and internalcombustion plant stocks of petroleum. For 1980–2000, electric utility data alsoinclude small amounts of kerosene and jet fuel.
c Fuel oil nos. 5 and 6. For 1973–1979, data are for steam plant stocks ofpetroleum. For 1980–2000, electric utility data also include a small amount of fueloil no. 4.
d Jet fuel and kerosene. Through 2003, data also include a small amount ofwaste oil.
e Petroleum coke is converted from short tons to barrels by multiplying by 5.f Distillate fuel oil and residual fuel oil. Beginning in 1970, also includes
petroleum coke. Beginning in 2002, also includes other liquids.g Through 1998, data are for electric utilities only. Beginning in 1999, data are
for electric utilities and independent power producers.R=Revised. NA=Not available. Notes: • Data are for utility-scale facilities. See Note 1, "Coverage of Electricity
Statistics," at end of section. • The electric power sector comprises electricity-onlyand combined-heat-and-power (CHP) plants within the NAICS 22 category whose
primary business is to sell electricity, or electricity and heat, to the public. • Stocksare at end of period. • Totals may not equal sum of components due toindependent rounding. • Geographic coverage is the 50 states and the District ofColumbia.
Web Page: See http://www.eia.gov/totalenergy/data/monthly/#electricity (Exceland CSV files) for all available annual data beginning in 1949 and monthly databeginning in 1973.
Sources: • 1949–September 1977: Federal Power Commission, Form FPC-4,"Monthly Power Plant Report." • October 1977–1981: Federal Energy RegulatoryCommission, Form FPC-4, "Monthly Power Plant Report." • 1982–1988: U.S.Energy Information Administration (EIA), Form EIA-759, "Monthly Power PlantReport." • 1989–1997: EIA, Form EIA-759, "Monthly Power Plant Report," andForm EIA-867, "Annual Nonutility Power Producer Report." • 1998–2000: EIA,Form EIA-759, "Monthly Power Plant Report," and Form EIA-860B, "Annual ElectricGenerator Report—Nonutility." • 2001–2003: EIA, Form EIA-906, "Power PlantReport." • 2004–2007: EIA, Form EIA-906, "Power Plant Report," and FormEIA-920, "Combined Heat and Power Plant Report." • 2008 forward: EIA, FormEIA-923, "Power Plant Operations Report."

138 U. S. Energy Information Administration / Monthly Energy Review March 2019
Figure 7.6 Electricity End Use (Billion Kilowatthours)
Total
Retail Sales [a]
Direct Use [b]
0
1,000
2,000
3,000
4,000
5,000
1990 1995 2000 2005 2010 2015
Electricity End Use Overview,1989–2018
122.6
107.7
76.2
0.70
40
80
120
160
Residential Commercial [c] Industrial Transportation [d]
Retail Sales [a] by Sector, December 2018
Residential
Commercial [c]
Industrial
Transportation [d]
0
500
1,000
1,500
2,000
1950 1955 1960 1965 1970 1975 1980 1985 1990 1995 2000 2005 2010 2015
Retail Sales [a] by Sector, 1949–2018
Residential
Commercial [c]
Industrial
Transportation [d]
0
30
60
90
120
150
180
J F M A M J J A S O N D J F M A M J J A S O N D J F M A M J J A S O N D
2016 2017 2018
Retail Sales [a] by Sector, Monthly
3,762 3,723 3,802
0
1,000
2,000
3,000
4,000
2016 2017 2018
Retail Sales [a] Total, January–December
[a] Electricity retail sales to ultimate customers reported by utilities and
other energy service providers.
[b] See “Direct Use” in Glossary.
[c] Commercial sector, including public street and highway lighting, inter‐
departmental sales, and other sales to public authorities.
[d] Transportation sector, including sales to railroads and railways.
Web Page: http://www.eia.gov/totalenergy/data/monthly/#electricity.
Source: Table 7.6.

U. S. Energy Information Administration / Monthly Energy Review March 2019 139
Table 7.6 Electricity End Use (Million Kilowatthours)
Retail Salesa
Direct UsefTotal
End UsegResidential Commercialb IndustrialcTranspor-
tationdTotal
Retail Salese
1950 Total .................... 72,200 E 65,971 146,479 E 6,793 291,443 NA 291,4431955 Total .................... 128,401 E 102,547 259,974 E 5,826 496,748 NA 496,7481960 Total .................... 201,463 E 159,144 324,402 E 3,066 688,075 NA 688,0751965 Total .................... 291,013 E 231,126 428,727 E 2,923 953,789 NA 953,7891970 Total .................... 466,291 E 352,041 570,854 E 3,115 1,392,300 NA 1,392,3001975 Total .................... 588,140 E 468,296 687,680 E 2,974 1,747,091 NA 1,747,0911980 Total .................... 717,495 558,643 815,067 3,244 2,094,449 NA 2,094,4491985 Total .................... 793,934 689,121 836,772 4,147 2,323,974 NA 2,323,9741990 Total .................... 924,019 838,263 945,522 4,751 2,712,555 124,529 2,837,0841995 Total .................... 1,042,501 953,117 1,012,693 4,975 3,013,287 150,677 3,163,9632000 Total .................... 1,192,446 1,159,347 1,064,239 5,382 3,421,414 170,943 3,592,3572001 Total .................... 1,201,607 1,190,518 996,609 5,724 3,394,458 162,649 3,557,1072002 Total .................... 1,265,180 1,204,531 990,238 5,517 3,465,466 166,184 3,631,6502003 Total .................... 1,275,824 1,198,728 1,012,373 6,810 3,493,734 168,295 3,662,0292004 Total .................... 1,291,982 1,230,425 1,017,850 7,224 3,547,479 168,470 3,715,9492005 Total .................... 1,359,227 1,275,079 1,019,156 7,506 3,660,969 150,016 3,810,9842006 Total .................... 1,351,520 1,299,744 1,011,298 7,358 3,669,919 146,927 3,816,8452007 Total .................... 1,392,241 1,336,315 1,027,832 8,173 3,764,561 125,670 3,890,2312008 Total .................... 1,380,662 1,336,133 1,009,516 7,653 3,733,965 132,197 3,866,1612009 Total .................... 1,364,758 1,306,853 917,416 7,768 3,596,795 126,938 3,723,7332010 Total .................... 1,445,708 1,330,199 971,221 7,712 3,754,841 131,910 3,886,7522011 Total .................... 1,422,801 1,328,057 991,316 7,672 3,749,846 132,754 3,882,6002012 Total .................... 1,374,515 1,327,101 985,714 7,320 3,694,650 137,657 3,832,3062013 Total .................... 1,394,812 1,337,079 985,352 7,625 3,724,868 143,462 3,868,3302014 Total .................... 1,407,208 1,352,158 997,576 7,758 3,764,700 138,574 3,903,2742015 Total .................... 1,404,096 1,360,752 986,508 7,637 3,758,992 141,168 3,900,160
2016 January ................ 130,972 110,410 78,848 660 320,890 E 11,921 332,811 February .............. 115,959 103,452 76,748 646 296,806 E 11,078 307,884 March ................... 100,227 105,739 79,237 609 285,812 E 11,576 297,388 April ..................... 88,244 102,045 78,647 595 269,531 E 10,886 280,418 May ...................... 94,198 108,437 81,491 581 284,708 E 11,379 296,087 June ..................... 125,211 120,363 83,672 631 329,878 E 11,759 341,637 July ...................... 154,409 130,038 87,076 648 372,172 E 12,567 384,739 August ................. 156,442 135,019 89,101 631 381,192 E 12,673 393,865 September ........... 129,363 123,493 83,259 637 336,752 E 11,661 348,413 October ................ 101,508 112,963 81,597 613 296,681 E 11,350 308,031 November ............ 93,244 105,060 78,421 592 277,317 E 11,268 288,585 December ............ 121,281 110,172 78,616 653 310,722 E 11,726 322,448 Total .................... 1,411,058 1,367,191 976,715 7,497 3,762,462 139,844 3,902,306
2017 January ................ 129,212 109,488 78,809 667 318,177 E 12,093 330,270 February .............. 100,968 99,640 74,534 635 275,777 E 10,892 286,669 March ................... 103,096 107,173 80,530 645 291,444 E 11,643 303,087 April ..................... 90,725 102,589 78,899 589 272,801 E 11,188 283,989 May ...................... 98,281 109,872 83,134 583 291,871 E 11,478 303,348 June ..................... 122,543 120,013 85,399 628 328,583 E 11,967 340,550 July ...................... 149,900 129,277 87,806 630 367,613 E 12,763 380,376 August ................. 142,007 128,481 89,134 640 360,263 E 12,558 372,820 September ........... 118,779 118,789 83,540 618 321,726 E 11,213 332,939 October ................ 102,811 113,287 82,815 626 299,539 E 11,353 310,892 November ............ 98,321 104,973 79,456 598 283,347 E 11,455 294,802 December ............ 122,005 109,306 80,242 664 312,216 E 12,512 324,728 Total .................... 1,378,648 1,352,888 984,298 7,523 3,723,356 141,114 3,864,470
2018 January ................ 148,978 R 114,618 R 76,061 751 R 340,408 RE 12,468 R 352,876 February .............. 113,383 R 102,001 R 71,948 643 R 287,975 RE 11,154 R 299,129 March ................... 106,939 R 107,886 R 76,811 625 R 292,262 E 11,572 R 303,833 April ..................... 95,128 R 102,922 75,241 608 R 273,898 RE 11,258 R 285,156 May ...................... R 103,395 R 112,597 81,461 591 R 298,044 RE 11,684 R 309,728 June ..................... 129,478 R 121,578 R 81,527 628 R 333,212 RE 11,961 R 345,173 July ...................... R 153,031 R 130,916 R 85,041 640 R 369,629 RE 12,661 R 382,289 August ................. R 152,951 R 134,479 R 89,632 686 R 377,748 RE 12,830 R 390,578 September ........... R 128,459 R 121,581 R 81,192 648 R 331,881 RE 11,859 R 343,741 October ................ R 106,638 R 115,861 R 81,023 R 636 R 304,157 RE 11,649 R 315,807 November ............ 103,372 R 104,622 76,927 622 R 285,543 RE 12,032 R 297,574 December ............ 122,620 107,678 76,213 660 307,171 E 12,451 319,622 Total .................... 1,464,373 1,376,741 953,076 7,738 3,801,928 E 143,579 R 3,945,507
a Electricity retail sales to ultimate customers reported by electric utilitiesand, beginning in 1996, other energy service providers.
b Commercial sector, including public street and highway lighting,interdepartmental sales, and other sales to public authorities.
c Industrial sector. Through 2002, excludes agriculture and irrigation;beginning in 2003, includes agriculture and irrigation.
d Transportation sector, including sales to railroads and railways.e The sum of "Residential," "Commercial," "Industrial," and "Transportation."f Use of electricity that is 1) self-generated, 2) produced by either the same
entity that consumes the power or an affiliate, and 3) used in direct support of aservice or industrial process located within the same facility or group of facilities
that house the generating equipment. Direct use is exclusive of station use.g The sum of "Total Retail Sales" and "Direct Use."R=Revised. E=Estimate. NA=Not available. Notes: • See Note 1, "Coverage of Electricity Statistics," at end of section.
• Totals may not equal sum of components due to independent rounding.• Geographic coverage is the 50 states and the District of Columbia.
Web Page: See http://www.eia.gov/totalenergy/data/monthly/#electricity(Excel and CSV files) for all available annual data beginning in 1949 andmonthly data beginning in 1973.
Sources: See end of section.

140 U. S. Energy Information Administration / Monthly Energy Review March 2019
Electricity Note 1. Coverage of Electricity Statistics. Data in Section 7 cover the following:
Through 1984, data for electric utilities also include institutions (such as universities) and military facilities that
generated electricity primarily for their own use; beginning in 1985, data for electric utilities exclude institutions and
military facilities. Beginning in 1989, data for the commercial sector include institutions and military facilities.
The generation, consumption, and stocks data in Section 7 are for utility‐scale facilities—those with a combined
generation nameplate capacity of 1 megawatt or more. Data exclude distributed (small‐scale) facilities—those with a
combined generator nameplate capacity of less than 1 megawatt. For data on distributed solar photovoltaic (PV)
generation in the residential, commercial, and industrial sectors, see Table 10.6.
Note 2. Classification of Power Plants into Energy‐Use Sectors. The U.S. Energy Information Administration (EIA)
classifies power plants (both electricity‐only and combined‐heat‐and‐power plants) into energy‐use sectors based on the
North American Industry Classification System (NAICS), which replaced the Standard Industrial Classification (SIC) system
in 1997. Plants with a NAICS code of 22 are assigned to the Electric Power Sector. Those with NAICS codes beginning
with 11 (agriculture, forestry, fishing, and hunting); 21 (mining, including oil and gas extraction); 23 (construction); 31–
33 (manufacturing); 2212 (natural gas distribution); and 22131 (water supply and irrigation systems) are assigned to the
Industrial Sector. Those with all other codes are assigned to the Commercial Sector. Form EIA‐860, "Annual Electric
Generator Report," asks respondents to indicate the primary purpose of the facility by assigning a NAICS code from the
list at http://www.eia.gov/survey/form/eia_860/instructions.pdf.
Note 3. Electricity Forecast Values. Data values preceded by "F" in this section are forecast values. They are derived
from EIA's Short‐Term Integrated Forecasting System (STIFS). STIFS is driven primarily by data and assumptions about
key macroeconomic variables, energy prices, and weather. The electricity forecast relies on additional variables such as
alternative fuel prices (natural gas and oil) and power generation by sources other than fossil fuels, including nuclear,
renewables, and hydroelectric power. Each month, EIA staff review the model output and make adjustments, if
appropriate, based on their knowledge of developments in the electricity industry.
The STIFS model results are published monthly in EIA's Short‐Term Energy Outlook, which is accessible on the Web at
http://www.eia.gov/forecasts/steo/.
Table 7.1 Sources
Net Generation, Electric Power Sector 1949 forward: Table 7.2b.
Net Generation, Commercial and Industrial Sectors 1949 forward: Table 7.2c.
Trade 1949–September 1977: Unpublished Federal Power Commission data.
October 1977–1980: Unpublished Economic Regulatory Administration (ERA) data.
1981: U.S. Department of Energy (DOE), Office of Energy Emergency Operations, "Report on Electric Energy Exchanges
with Canada and Mexico for Calendar Year 1981," April 1982 (revised June 1982).
1982 and 1983: DOE, ERA, Electricity Exchanges Across International Borders.
1984–1986: DOE, ERA, Electricity Transactions Across International Borders.
1987 and 1988: DOE, ERA, Form ERA‐781R, "Annual Report of International Electrical Export/Import Data."
1989: DOE, Fossil Energy, Form FE‐781R, "Annual Report of International Electrical Export/Import Data."

U. S. Energy Information Administration / Monthly Energy Review March 2019 141
1990–2000: National Energy Board of Canada; and DOE, Office of Electricity Delivery and Energy Reliability, Form
FE‐781R, "Annual Report of International Electrical Export/Import Data."
2001–May 2011: National Energy Board of Canada; DOE, Office of Electricity Delivery and Energy Reliability, Form
OE‐781R, "Monthly Electricity Imports and Exports Report," and predecessor form; and California Independent System
Operator.
June 2011–2015: National Energy Board of Canada; California Independent System Operator; and EIA estimates for
Texas transfers.
2016 forward: EIA, Form EIA‐111, "Quarterly Electricity Imports and Exports Report"; and for forecast values, EIA Short‐
Term Integrated Forecasting System (STIFS).
T&D Losses and Unaccounted for 1949 forward: Calculated as the sum of total net generation and imports minus end use and exports.
End Use 1949 forward: Table 7.6.
Table 7.2b Sources
1949–September 1977: Federal Power Commission, Form FPC‐4, "Monthly Power Plant Report."
October 1977–1981: Federal Energy Regulatory Commission, Form FPC‐4, "Monthly Power Plant Report."
1982–1988: U.S. Energy Information Administration (EIA), Form EIA‐759, "Monthly Power Plant Report."
1989–1997: EIA, Form EIA‐759, "Monthly Power Plant Report," and Form EIA‐867, "Annual Nonutility Power Producer
Report."
1998–2000: EIA, Form EIA‐759, "Monthly Power Plant Report," and Form EIA‐860B, "Annual Electric Generator Report—
Nonutility."
2001–2003: EIA, Form EIA‐906, "Power Plant Report."
2004–2007: EIA, Form EIA‐906, "Power Plant Report," and Form EIA‐920, "Combined Heat and Power Plant Report."
2008 forward: EIA, Form EIA‐923, "Power Plant Operations Report".
Table 7.2c Sources
Industrial Sector, Hydroelectric Power, 1949–1988
1949–September 1977: Federal Power Commission (FPC), Form FPC‐4, "Monthly Power Plant Report," for plants with
generating capacity exceeding 10 megawatts, and FPC, Form FPC‐12C, "Industrial Electric Generating Capacity," for all
other plants.
October 1977–1978: Federal Energy Regulatory Commission (FERC), Form FPC‐4, "Monthly Power Plant Report," for
plants with generating capacity exceeding 10 megawatts, and FERC, Form FPC‐12C, "Industrial Electric Generating
Capacity," for all other plants.
1979: FERC, Form FPC‐4, "Monthly Power Plant Report," for plants with generating capacity exceeding 10 megawatts,
and U.S. Energy Information Administration (EIA) estimates for all other plants.
1980–1988: Estimated by EIA as the average generation over the 6‐year period of 1974–1979.
All Data, 1989 Forward 1989–1997: EIA, Form EIA‐867, "Annual Nonutility Power Producer Report."

142 U. S. Energy Information Administration / Monthly Energy Review March 2019
1998–2000: EIA, Form EIA‐860B, "Annual Electric Generator Report—Nonutility."
2001–2003: EIA, Form EIA‐906, "Power Plant Report."
2004–2007: EIA, Form EIA‐906, "Power Plant Report," and Form EIA‐920, "Combined Heat and Power Plant Report."
2008 forward: EIA, Form EIA‐923, "Power Plant Operations Report".
Table 7.3b Sources
1949–September 1977: Federal Power Commission, Form FPC‐4, "Monthly Power Plant Report."
October 1977–1981: Federal Energy Regulatory Commission, Form FPC‐4, "Monthly Power Plant Report."
1982–1988: U.S. Energy Information Administration (EIA), Form EIA‐759, "Monthly Power Plant Report."
1989–1997: EIA, Form EIA‐759, "Monthly Power Plant Report," and Form EIA‐867, "Annual Nonutility Power Producer
Report."
1998–2000: EIA, Form EIA‐759, "Monthly Power Plant Report," and Form EIA‐860B, "Annual Electric Generator Report—
Nonutility."
2001–2003: EIA, Form EIA‐906, "Power Plant Report."
2004–2007: EIA, Form EIA‐906, "Power Plant Report," and Form EIA‐920, "Combined Heat and Power Plant Report."
2008 forward: EIA, Form EIA‐923, "Power Plant Operations Report".
Table 7.4b Sources
1949–September 1977: Federal Power Commission, Form FPC‐4, "Monthly Power Plant Report."
October 1977–1981: Federal Energy Regulatory Commission, Form FPC‐4, "Monthly Power Plant Report."
1982–1988: U.S. Energy Information Administration (EIA), Form EIA‐759, "Monthly Power Plant Report."
1989–1997: EIA, Form EIA‐759, "Monthly Power Plant Report," and Form EIA‐867, "Annual Nonutility Power Producer
Report."
1998–2000: EIA, Form EIA‐759, "Monthly Power Plant Report," and Form EIA‐860B, "Annual Electric Generator Report—
Nonutility."
2001–2003: EIA, Form EIA‐906, "Power Plant Report."
2004–2007: EIA, Form EIA‐906, "Power Plant Report," and Form EIA‐920, "Combined Heat and Power Plant Report."
2008 forward: EIA, Form EIA‐923, "Power Plant Operations Report".
Table 7.6 Sources
Retail Sales, Residential and Industrial 1949–September 1977: Federal Power Commission, Form FPC‐5, "Monthly Statement of Electric Operating Revenue and
Income."
October 1977–February 1980: Federal Energy Regulatory Commission (FERC), Form FPC‐5, "Monthly Statement of
Electric Operating Revenue and Income."
March 1980–1982: FERC, Form FPC‐5, "Electric Utility Company Monthly Statement."
1983: U.S. Energy Information Administration (EIA), Form EIA‐826, "Electric Utility Company Monthly Statement."

U. S. Energy Information Administration / Monthly Energy Review March 2019 143
1984–2003: EIA, Form EIA‐861, "Annual Electric Utility Report."
2004 forward: EIA, Electric Power Monthly (EPM), February 2019, Table 5.1.
Retail Sales, Commercial 1949–2002: Data are estimates. See estimation methodology at
http://www.eia.gov/state/seds/sep_use/notes/use_elec.pdf.
2003: EIA, Form EIA‐861, "Annual Electric Utility Report."
2004 forward: EIA, EPM, February 2019, Table 5.1.
Retail Sales, Transportation 1949–2002: Data are estimates. See estimation methodology at
http://www.eia.gov/state/seds/sep_use/notes/use_elec.pdf.
2003: EIA, Form EIA‐861, "Annual Electric Utility Report."
2004 forward: EIA, EPM February 2019, Table 5.1.
Direct Use, Annual 1989–1997: EIA, Form EIA‐867, "Annual Nonutility Power Producer Report."
1998–2000: EIA, Form EIA‐860B, "Annual Electric Generator Report—Nonutility."
2001–2017: EIA, Electric Power Annual 2017, December 2018, Table 2.2.
2018: Sum of monthly estimates.
Direct Use, Monthly 1989 forward: Annual shares are calculated as annual direct use divided by annual commercial and industrial net
generation (on Table 7.1). Then monthly direct use estimates are calculated as the annual share multiplied by the
monthly commercial and industrial net generation values. For 2018, the 2017 annual share is used.

THIS PAGE INTENTIONALLY LEFT BLANK

8. Nuclear
Energy

146 U. S. Energy Information Administration / Monthly Energy Review March 2019
Figure 8.1 Nuclear Energy Overview
Nuclear Electric Power
Total
0
1
2
3
4
5
1960 1965 1970 1975 1980 1985 1990 1995 2000 2005 2010 2015
Tri
llion K
ilow
att
hours
Electricity Net Generation,1957–2018
0
5
10
15
20
25
1960 1965 1970 1975 1980 1985 1990 1995 2000 2005 2010 2015
Pe
rce
nt
Nuclear Share of Electricity Net Generation,1957–2018
71.66273.700
71.657
0
20
40
60
80
2016 2017 2018
Bill
ion K
ilow
atthours
Nuclear Electricity Net Generation–December
0
20
40
60
80
100
120
J F M A M J J A S O N D
Pe
rce
nt
Capacity Factor, Monthly
2016 2017 2018
Web Page: http://www.eia.gov/totalenergy/data/monthly/#nuclear.
Sources: Tables 7.2a and 8.1.

U. S. Energy Information Administration / Monthly Energy Review March 2019 147
Table 8.1 Nuclear Energy Overview
TotalOperableUnitsa,b
Net SummerCapacity of
Operable Unitsb,cNuclear Electricity
Net Generation
Nuclear Shareof Electricity
Net Generation Capacity Factord
Number Million Kilowatts Million Kilowatthours Percent
1957 Total .......................... 1 0.055 10 (s) NA1960 Total .......................... 3 .411 518 .1 NA1965 Total .......................... 13 .793 3,657 .3 NA1970 Total .......................... 20 7.004 21,804 1.4 NA1975 Total .......................... 57 37.267 172,505 9.0 55.91980 Total .......................... 71 51.810 251,116 11.0 56.31985 Total .......................... 96 79.397 383,691 15.5 58.01990 Total .......................... 112 99.624 576,862 19.0 66.01995 Total .......................... 109 99.515 673,402 20.1 77.42000 Total .......................... 104 97.860 753,893 19.8 88.12001 Total .......................... 104 98.159 768,826 20.6 89.42002 Total .......................... 104 98.657 780,064 20.2 90.32003 Total .......................... 104 99.209 763,733 19.7 87.92004 Total .......................... 104 99.628 788,528 19.9 90.12005 Total .......................... 104 99.988 781,986 19.3 89.32006 Total .......................... 104 100.334 787,219 19.4 89.62007 Total .......................... 104 100.266 806,425 19.4 91.82008 Total .......................... 104 100.755 806,208 19.6 d 91.12009 Total .......................... 104 101.004 798,855 20.2 90.32010 Total .......................... 104 101.167 806,968 19.6 91.12011 Total .......................... 104 c 101.419 790,204 19.3 89.12012 Total .......................... 104 101.885 769,331 19.0 86.12013 Total .......................... 100 99.240 789,016 19.4 89.92014 Total .......................... 99 98.569 797,166 19.5 91.72015 Total .......................... 99 98.672 797,178 19.6 92.3
2016 January ...................... 99 98.921 72,525 20.6 98.5 February .................... 99 98.921 65,638 20.9 95.3 March ......................... 99 98.921 66,149 21.7 89.9 April ........................... 99 98.921 62,732 21.4 88.1 May ............................ 99 98.921 66,576 21.0 90.5 June ........................... 99 100.043 67,175 18.3 94.2 July ............................ 100 100.043 70,349 17.1 94.5 August ....................... 100 100.043 71,526 17.5 96.1 September ................. 100 100.043 65,448 18.6 90.9 October ...................... 99 99.565 60,733 19.4 81.7 November .................. 99 99.565 65,179 21.9 90.9 December .................. 99 99.565 71,662 20.8 96.7 Total .......................... 99 99.565 805,694 19.8 92.3
2017 January ...................... 99 99.610 73,121 21.3 98.7 February .................... 99 99.610 63,560 21.9 94.9 March ......................... 99 99.610 65,093 20.5 87.8 April ........................... 99 99.610 56,743 19.3 79.1 May ............................ 99 99.610 61,313 19.0 82.7 June ........................... 99 99.610 67,011 18.7 93.4 July ............................ 99 99.629 71,314 17.6 96.2 August ....................... 99 99.629 72,384 18.8 97.6 September ................. 99 99.629 68,098 20.3 94.9 October ...................... 99 99.629 65,995 20.6 89.0 November .................. 99 99.629 66,618 21.5 92.9 December .................. 99 99.629 73,700 20.9 99.4 Total .......................... 99 99.629 804,950 20.0 92.2
2018 January ...................... 99 RE 99.653 74,649 19.9 E 100.7 February .................... 99 RE 99.653 64,790 21.2 RE 96.7 March ......................... 99 RE 99.653 67,033 20.9 E 90.4 April ........................... 99 RE 99.653 59,133 19.6 E 82.4 May ............................ 99 RE 99.653 67,320 19.8 E 90.8 June ........................... 99 RE 99.653 69,688 18.7 E 97.1 July ............................ 99 RE 99.653 72,456 17.6 E 97.7 August ....................... 99 RE 99.653 72,282 R 17.7 E 97.5 September ................. 98 RE 99.200 64,725 18.1 E 90.4 October ...................... 98 RE 99.200 59,397 R 18.2 E 80.5 November .................. 98 RE 99.355 63,948 R 19.8 E 89.4 December .................. 98 E 99.355 71,657 21.2 E 96.9 Total .......................... 98 E 99.355 807,078 19.3 E 92.6
a Total of nuclear generating units holding full-power licenses, or equivalentpermission to operate, at end of period. See Note 1, "Operable Nuclear Reactors,"at end of section.
b At end of period.c For the definition of "Net Summer Capacity," see Note 2, "Nuclear Capacity,"
at end of section. Beginning in 2011, monthly capacity values are estimated in twosteps: 1) uprates and derates reported on Form EIA-860M are added to specificmonths; and 2) the difference between the resulting year-end capacity (from datareported on Form EIA-860M) and final capacity (reported on Form EIA-860) isallocated to the month of January.
d Beginning in 2008, capacity factor data are calculated using a new
methodology. For an explanation of the method of calculating the capacity factor,see Note 2, "Nuclear Capacity," at end of section.
R=Revised. E=Estimate. NA=Not available. (s)=Less than 0.05%. Notes: • For a discussion of nuclear reactor unit coverage, see Note 1,
"Operable Nuclear Reactors," at end of section. • Nuclear electricity netgeneration totals may not equal sum of components due to independent rounding.• Geographic coverage is the 50 states and the District of Columbia.
Web Page: See http://www.eia.gov/totalenergy/data/monthly/#nuclear (Exceland CSV files) for all available annual data beginning in 1957 and monthly databeginning in 1973.
Sources: See end of section.

148 U. S. Energy Information Administration / Monthly Energy Review March 2019
Figure 8.2 Uranium Overview
Domestic Production
Purchased Imports
Exports Sales
0
25
50
75
1950 1955 1960 1965 1970 1975 1980 1985 1990 1995 2000 2005 2010 2015
Mill
ion
Pou
nds
Ura
nium
Oxi
deProduction and Trade, 1949–2018
Domestic Supplies
Electric Plants
Total
0
50
100
150
200
250
1985 1990 1995 2000 2005 2010 2015
Mill
ion
Pou
nds
Ura
nium
Oxi
de
Inventories, End of Year 1981–2017
Purchased Imports
Domestic Purchases
0
20
40
60
1985 1990 1995 2000 2005 2010 2015
Dol
lars
[a]
per
Pou
nds
Ura
nium
Oxi
de
Average Prices, 1981–2017
[a] Prices are not adjusted for inflation. See “Nominal Dollars” in Glossary.
Note: See “Uranium Oxide” in Glossary.
Web Page: http://www.eia.gov/totalenergy/data/monthly/#nuclear.
Source: Table 8.2.

U. S. Energy Information Administration / Monthly Energy Review March 2019 149
Table 8.2 Uranium Overview
DomesticConcentrateProductiona
PurchasedImportsb
ExportbSales
Electric PlantPurchases
From DomesticSuppliers
Loaded IntoU.S. Nuclear
Reactorsc
Inventories Average Price
DomesticSuppliers
ElectricPlants Total
PurchasedImports
DomesticPurchases
Million Pounds Uranium Oxide Dollarsd per Pound Uranium Oxide
1950 .......... 0.92 5.5 0.0 NA NA NA NA NA NA NA1955 .......... 5.56 7.6 .0 NA NA NA NA NA NA NA1960 .......... 35.28 36.0 .0 NA NA NA NA NA NA NA1965 .......... 20.88 8.0 .0 NA NA NA NA NA NA NA1970 .......... 25.81 .0 4.2 NA NA NA NA NA – – NA1975 .......... 23.20 1.4 1.0 NA NA NA NA NA NA NA1980 .......... 43.70 3.6 5.8 NA NA NA NA NA NA NA1981 .......... 38.47 6.6 4.4 32.6 NA NA NA 159.2 32.90 34.651982 .......... 26.87 17.1 6.2 27.1 NA NA NA 174.8 27.23 38.371983 .......... 21.16 8.2 3.3 24.2 NA NA NA 191.8 26.16 38.211984 .......... 14.88 12.5 2.2 22.5 NA 25.0 160.2 185.2 21.86 32.651985 .......... 11.31 11.7 5.3 21.7 NA 23.7 153.2 176.9 20.08 31.431986 .......... 13.51 13.5 1.6 18.9 NA 27.0 144.1 171.1 20.07 30.011987 .......... 12.99 15.1 1.0 20.8 NA 25.4 137.8 163.2 19.14 27.371988 .......... 13.13 15.8 3.3 17.6 NA 19.3 125.5 144.8 19.03 26.151989 .......... 13.84 13.1 2.1 18.4 NA 22.2 115.8 138.1 16.75 19.561990 .......... 8.89 23.7 2.0 20.5 NA 26.4 102.7 129.1 12.55 15.701991 .......... 7.95 16.3 3.5 26.8 34.6 20.7 98.0 118.7 15.55 13.661992 .......... 5.65 23.3 2.8 23.4 43.0 25.2 92.1 117.3 11.34 13.451993 .......... 3.06 21.0 3.0 15.5 45.1 24.5 81.2 105.7 10.53 13.141994 .......... 3.35 36.6 17.7 22.7 40.4 21.5 65.4 86.9 8.95 10.301995 .......... 6.04 41.3 9.8 22.3 51.1 13.7 58.7 72.5 10.20 11.111996 .......... 6.32 45.4 11.5 23.7 46.2 13.9 66.1 80.0 13.15 13.811997 .......... 5.64 43.0 17.0 19.4 48.2 40.4 65.9 106.2 11.81 12.871998 .......... 4.70 43.7 15.1 21.6 38.2 70.7 65.8 136.5 11.19 12.311999 .......... 4.61 47.6 8.5 21.4 58.8 68.8 58.3 127.1 10.55 11.882000 .......... 3.98 44.9 13.6 24.3 51.5 56.5 54.8 111.3 9.84 11.452001 .......... 2.64 46.7 11.7 27.5 52.7 48.1 55.6 103.8 9.51 10.452002 .......... e,E2.34 52.7 15.4 22.7 57.2 48.7 53.5 102.1 10.05 10.352003 .......... e,E2.00 53.0 13.2 21.7 62.3 39.9 45.6 85.5 10.59 10.842004 .......... 2.28 66.1 13.2 28.2 50.1 37.5 57.7 95.2 12.25 11.912005 .......... 2.69 65.5 20.5 27.3 58.3 29.1 64.7 93.8 14.83 13.982006 .......... 4.11 64.8 18.7 27.9 51.7 29.1 77.5 106.6 19.31 18.542007 .......... 4.53 54.1 14.8 18.5 45.5 31.2 81.2 112.4 34.18 33.132008 .......... 3.90 57.1 17.2 20.4 51.3 27.0 83.0 110.0 41.30 43.432009 .......... 3.71 58.9 23.5 17.6 49.4 26.8 84.8 111.5 41.23 44.532010 .......... 4.23 55.3 23.1 16.2 44.3 24.7 86.5 111.3 47.01 44.882011 .......... 3.99 54.4 16.7 19.8 50.9 22.3 89.8 112.1 54.00 53.412012 .......... 4.15 56.2 18.0 21.5 49.5 23.3 97.6 120.9 51.44 56.512013 .......... 4.66 57.4 18.9 23.3 42.6 21.3 113.1 134.4 48.27 52.512014 .......... 4.89 56.5 20.0 20.5 50.5 18.7 114.0 132.7 44.03 43.992015 .......... 3.34 64.2 25.7 19.6 47.4 14.3 121.1 135.5 42.95 43.032016 .......... 2.92 50.7 17.2 18.8 41.7 16.7 128.0 144.6 40.45 41.642017 .......... 2.44 42.1 14.0 14.0 P 45.5 P 19.0 P 123.7 P 142.7 37.09 38.572018 .......... P 1.47 NA NA NA NA NA NA NA NA NA
a See "Uranium Concentrate" in Glossary.b Import quantities through 1970 are reported for fiscal years. Prior to 1968, the
Atomic Energy Commission was the sole purchaser of all imported uranium oxide. Trade data prior to 1982 were for transactions conducted by uranium suppliersonly. For 1982 forward, transactions by uranium buyers (consumers) have beenincluded. Buyer imports and exports prior to 1982 are believed to be small.
c Does not include any fuel rods removed from reactors and later reloaded.d Prices are not adjusted for inflation. See "Nominal Dollars" in Glossary.e Value has been rounded to avoid disclosure of individual company data.P=Preliminary. E=Estimate. NA=Not available. – – =Not applicable. Note: See "Uranium Oxide" in Glossary.
Web Page: See http://www.eia.gov/totalenergy/data/monthly#nuclear (Excel andCSV files) for all available annual data beginning in 1949.
Sources: • 1949–1966: U.S. Department of Energy, Grand Junction Office,Statistical Data of the Uranium Industry, Report No. GJO-100, annual reports.• 1967–2002: U.S. Energy Information Administration (EIA), Uranium IndustryAnnual, annual reports. • 2003–2015: EIA, "Domestic Uranium ProductionReport," annual reports; and EIA, "Uranium Marketing Annual Report," annualreports. • 2016 forward: EIA, "Domestic Uranium Production Report 4th Quarter2018" (February 2019), Table 1; and EIA, "2017 Uranium Marketing Annual Report"(May 2018), Tables 5, 18, 19, 21, and 22.

150 U. S. Energy Information Administration / Monthly Energy Review March 2019
Nuclear Energy Note 1. Operable Nuclear Reactors. A reactor is defined as operable when it possesses a full‐power license from the
Nuclear Regulatory Commission or its predecessor, the Atomic Energy Commission, or equivalent permission to operate,
at the end of the year or month shown. The definition includes units retaining full‐power licenses during long, non‐
routine shutdowns that for a time rendered them unable to generate electricity.
Note 2. Nuclear Capacity. Nuclear generating units may have more than one type of net capacity rating, including the
following:
(a) Net Summer Capacity—The steady hourly output that generating equipment is expected to supply to system load,
exclusive of auxiliary power, as demonstrated by test at the time of summer peak demand. Auxiliary power of a typical
nuclear power plant is about 5% of gross generation.
(b) Net Design Capacity or Net Design Electrical Rating (DER)—The nominal net electrical output of a unit, specified by
the utility and used for plant design.
Through 2007, the monthly capacity factors are calculated as the monthly nuclear electricity net generation divided by
the maximum possible nuclear electricity net generation for that month. The maximum possible nuclear electricity net
generation is the number of hours in the month (assuming 24‐hour days, with no adjustment for changes to or from
Daylight Savings Time) multiplied by the net summer capacity of operable nuclear generating units at the end of the
month. That fraction is then multiplied by 100 to obtain a percentage. Annual capacity factors are calculated as the
annual nuclear electricity net generation divided by the annual maximum possible nuclear electricity net generation (the
sum of the monthly values for maximum possible nuclear electricity net generation). For the methodology used to
calculate capacity factors beginning in 2008, see U.S. Energy Information Administration, Electric Power Monthly,
Appendix C notes on “Average Capacity Factors.”
Table 8.1 Sources
Total Operable Units and Net Summer Capacity of Operable Units 1957–1982: Compiled from various sources, primarily U.S. Department of Energy, Office of Nuclear Reactor Programs,
“U.S. Central Station Nuclear Electric Generating Units: Significant Milestones.”
1983 forward: U.S. Energy Information Administration (EIA), Form EIA‐860, “Annual Electric Generator Report,” and
predecessor forms; Form EIA‐860M, “Monthly Update to the Annual Electric Generator Report”; and monthly updates as
appropriate. See https://www.eia.gov/nuclear/generation/index.html for a list of operable units.
Nuclear Electricity Net Generation and Nuclear Share of Electricity Net Generation 1957 forward: Table 7.2a.
Capacity Factor 1973–2007: Calculated by EIA using the method described above in Note 2.
2008 forward: EIA, Form EIA‐860, “Annual Electric Generator Report”; Form EIA‐860M, “Monthly Update to the Annual
Electric Generator Report”; and Form EIA‐923, “Power Plant Operations Report.”

9. Energy
Prices

152 U. S. Energy Information Administration / Monthly Energy Review March 2019
Figure 9.1 Petroleum Prices
Domestic First Purchase Price
Composite Refiner Acquisition Cost
0
20
40
60
80
100
120
1950 1955 1960 1965 1970 1975 1980 1985 1990 1995 2000 2005 2010 2015
Dolla
rs [
a]
pe
r B
arr
el
Crude Oil Prices, 1949–2018
0
25
50
75
J F M A M J J A S O N D J F M A M J J A S O N D J F M A M J J A S O N D
2017 2018 2019
Dolla
rs [
a]
pe
r B
arr
el
Composite Refiner Acquisition Cost, Monthly
2.222
1.981 1.9731.852
1.608
0.796
0.0
0.5
1.0
1.5
2.0
2.5
No.2Fuel Oil
No.2Diesel Fuel
Finished MotorGasoline
Kerosene-TypeJet Fuel
Residual FuelOil
Propane(Consumer Grade)
Dol
lars
[a]
per
Gal
lon
(Exc
ludi
ng T
axes
)
Refiner Prices to End Users: Select Products, December 2018
[a] Prices are not adjusted for inflation. See “Nominal Dollars” in Glossary.
Web Page: http://www.eia.gov/totalenergy/data/monthly/#prices.
Sources: Tables 9.1, 9.5 and 9.7.

U. S. Energy Information Administration / Monthly Energy Review March 2019 153
Table 9.1 Crude Oil Price Summary (Dollarsa per Barrel)
Domestic FirstPurchase Pricec
F.O.B. Costof Importsd
Landed Costof Importse
Refiner Acquisition Costb
Domestic Imported Composite
1950 Average .................. 2.51 NA NA NA NA NA1955 Average .................. 2.77 NA NA NA NA NA1960 Average .................. 2.88 NA NA NA NA NA1965 Average .................. 2.86 NA NA NA NA NA1970 Average .................. 3.18 NA NA E 3.46 E 2.96 E 3.401975 Average .................. 7.67 11.18 12.70 8.39 13.93 10.381980 Average .................. 21.59 32.37 33.67 24.23 33.89 28.071985 Average .................. 24.09 25.84 26.67 26.66 26.99 26.751990 Average .................. 20.03 20.37 21.13 22.59 21.76 22.221995 Average .................. 14.62 15.69 16.78 17.33 17.14 17.232000 Average .................. 26.72 26.27 27.53 29.11 27.70 28.262001 Average .................. 21.84 20.46 21.82 24.33 22.00 22.952002 Average .................. 22.51 22.63 23.91 24.65 23.71 24.102003 Average .................. 27.56 25.86 27.69 29.82 27.71 28.532004 Average .................. 36.77 33.75 36.07 38.97 35.90 36.982005 Average .................. 50.28 47.60 49.29 52.94 48.86 50.242006 Average .................. 59.69 57.03 59.11 62.62 59.02 60.242007 Average .................. 66.52 66.36 67.97 69.65 67.04 67.942008 Average .................. 94.04 90.32 93.33 98.47 92.77 94.742009 Average .................. 56.35 57.78 60.23 59.49 59.17 59.292010 Average .................. 74.71 74.19 76.50 78.01 75.86 76.692011 Average .................. 95.73 101.66 102.92 100.71 102.63 101.872012 Average .................. 94.52 99.78 101.00 100.72 101.09 100.932013 Average .................. 95.99 96.56 96.99 102.91 98.11 100.492014 Average .................. 87.39 85.65 88.16 94.05 89.56 92.022015 Average .................. 44.39 41.91 45.38 49.94 46.38 48.39
2016 January .................... 27.02 23.67 27.36 32.17 27.48 29.99 February .................. 25.52 24.68 27.04 30.28 26.66 28.53 March ....................... 31.87 29.74 32.06 35.29 32.24 33.82 April ......................... 35.59 32.73 35.43 39.30 35.90 37.71 May .......................... 41.02 38.31 40.73 44.77 40.88 42.88 June ......................... 43.96 41.92 43.55 47.57 44.13 45.96 July .......................... 40.71 38.76 41.05 44.88 41.48 43.26 August ..................... 40.46 38.26 40.40 44.18 41.21 42.70 September ............... 40.55 38.28 40.81 44.47 40.86 42.73 October .................... 45.00 42.36 43.97 48.66 44.76 46.85 November ................ 41.65 40.12 42.59 46.10 41.80 44.06 December ................ 47.12 44.52 46.74 50.45 46.72 48.66 Average .................. 38.29 36.37 38.56 42.41 38.75 40.66
2017 January .................... 48.19 44.62 47.05 51.81 48.12 49.99 February .................. 49.41 45.91 48.08 53.15 49.38 51.24 March ....................... 46.39 44.09 46.26 50.60 46.53 48.65 April ......................... 47.23 43.60 46.00 51.34 47.47 49.47 May .......................... 45.19 43.92 46.15 49.58 47.21 48.47 June ......................... 42.17 41.34 43.85 46.26 44.03 45.25 July .......................... 43.42 42.09 44.82 47.59 44.76 46.27 August ..................... 44.96 44.18 46.93 48.76 47.62 48.22 September ............... 47.17 46.50 49.80 51.07 50.46 50.78 October .................... 49.12 47.22 51.11 53.71 51.40 52.67 November ................ 55.19 52.11 56.10 58.92 56.30 57.75 December ................ 56.98 53.68 56.96 61.10 57.44 59.53 Average .................. 48.05 45.58 48.50 52.05 49.12 50.68
2018 January .................... 62.25 55.73 58.19 66.08 59.39 63.13 February .................. 61.20 53.42 56.73 64.68 57.94 61.71 March ....................... 60.68 53.35 56.32 64.03 56.75 60.80 April ......................... 63.50 58.53 60.61 67.14 61.25 64.42 May .......................... 66.16 62.95 65.15 71.31 66.08 69.00 June ......................... 62.80 63.09 65.48 69.55 66.85 68.31 July .......................... 67.00 62.35 65.43 73.31 66.77 70.28 August ..................... 62.64 61.35 64.11 69.45 65.48 67.68 September ............... 63.55 61.56 63.69 71.04 66.42 69.15 October .................... 65.18 R 60.19 61.84 73.08 67.74 70.97 November ................ 55.65 R 44.19 R 46.93 62.47 R 54.40 59.01 December ................ R 47.72 R 33.61 R 37.04 R 53.25 R 42.80 R 48.83 Average .................. 61.41 56.60 59.02 67.04 60.95 64.37
2019 January .................... NA NA NA E 53.04 E 45.63 E 49.61
a Prices are not adjusted for inflation. See "Nominal Dollars" in Glossary.b See Note 1, "Crude Oil Refinery Acquisition Costs," at end of section.c See Note 2, "Crude Oil Domestic First Purchase Prices," at end of section.d See Note 3, "Crude Oil F.O.B. Costs," at end of section.e See Note 4, "Crude Oil Landed Costs," at end of section.R=Revised. NA=Not available. E=Estimate. Notes: • Domestic first purchase prices and refinery acquisition costs for the
current two months are preliminary. F.O.B. and landed costs for the current threemonths are preliminary. • Through 1980, F.O.B. and landed costs reflect the
period of reporting; beginning in 1981, they reflect the period of loading. • Annualaverages are the averages of the monthly prices, weighted by volume.• Geographic coverage is the 50 states, the District of Columbia, Puerto Rico, theVirgin Islands, and all U.S. Territories and Possessions.
Web Page: See http://www.eia.gov/totalenergy/data/monthly/#prices (Excel andCSV files) for all available annual data beginning in 1949 and monthly databeginning in 1973.
Sources: See end of section.

154 U. S. Energy Information Administration / Monthly Energy Review March 2019
Table 9.2 F.O.B. Costs of Crude Oil Imports From Selected Countries (Dollarsa per Barrel)
Selected CountriesPersian
GulfNationsb
TotalOPECc
TotalNon-OPECcAngola Colombia Mexico Nigeria
SaudiArabia
UnitedKingdom Venezuela
1973 Averaged ................. W W – 7.81 3.25 – 5.39 3.68 5.43 4.801975 Average .................. 10.97 – 11.44 11.82 10.87 – 11.04 10.88 11.34 10.621980 Average .................. 33.45 W 31.06 35.93 28.17 34.36 24.81 28.92 32.21 32.851985 Average .................. 26.30 – 25.33 28.04 22.04 27.64 23.64 23.31 25.67 25.961990 Average .................. 20.23 20.75 19.26 22.46 20.36 23.43 19.55 18.54 20.40 20.321995 Average .................. 16.58 16.73 15.64 17.40 W 16.94 13.86 W 15.36 16.022000 Average .................. 27.90 29.04 25.39 28.70 24.62 27.21 24.45 24.72 25.56 26.772001 Average .................. 23.25 24.25 18.89 24.85 18.98 23.30 18.01 18.89 19.73 21.042002 Average .................. 24.09 24.64 21.60 25.38 23.92 24.50 20.13 23.38 22.18 22.932003 Average .................. 28.22 28.89 24.83 29.40 25.03 28.76 23.81 25.17 25.36 26.212004 Average .................. 37.26 37.73 31.55 38.71 34.08 37.30 31.78 33.08 33.95 33.582005 Average .................. 52.48 51.89 43.00 55.95 47.96 54.48 46.39 47.21 49.60 45.792006 Average .................. 62.23 59.77 52.91 65.69 56.09 66.03 55.80 56.02 59.18 55.352007 Average .................. 67.80 67.93 61.35 76.64 W 69.96 64.10 69.93 69.58 62.692008 Average .................. 95.66 91.17 84.61 102.06 93.03 96.33 88.06 91.44 93.15 87.152009 Average .................. 57.07 57.90 56.47 64.61 57.87 65.63 55.58 59.53 58.53 57.162010 Average .................. 78.18 72.56 72.46 80.83 76.44 W 70.30 75.65 75.23 73.242011 Average .................. 111.82 100.21 100.90 115.35 107.08 – 97.23 106.47 105.34 98.492012 Average .................. 111.23 106.43 101.84 114.51 106.65 – 100.15 105.45 104.39 95.712013 Average .................. 107.71 101.24 98.40 110.06 101.16 W 97.52 100.62 100.57 93.672014 Average .................. W 80.75 86.55 W 95.60 – 84.51 94.03 89.76 82.952015 Average .................. W 47.52 44.90 W 47.53 – 40.73 46.95 43.25 41.19
2016 January .................... W W 24.12 W 26.24 – 20.73 25.73 25.05 22.66 February .................. W 24.91 24.50 37.83 27.46 – 22.57 26.58 27.01 23.35 March ....................... 35.33 30.47 29.01 W 34.14 – 27.31 32.32 31.37 28.35 April ......................... W 33.57 30.79 W 37.13 – 29.07 35.67 34.08 31.92 May .......................... W 39.00 39.04 W 42.44 W 36.65 40.55 40.51 37.04 June ......................... 49.56 41.64 42.27 48.79 45.16 – 39.33 43.77 43.73 40.22 July .......................... 45.00 36.91 39.99 W 42.11 – 35.69 40.91 39.61 38.09 August ..................... W 36.80 38.73 W 42.48 – 37.56 40.44 40.44 36.78 September ............... W 40.36 38.44 W 42.31 – 36.95 40.37 40.01 37.18 October .................... W 40.59 42.91 W 47.10 – 40.38 45.17 44.66 40.37 November ................ W 39.80 39.55 W 42.50 W 38.39 41.40 42.31 38.33 December ................ W 45.27 45.34 W 48.79 W 44.75 47.95 47.44 42.34 Average .................. 42.68 35.28 36.22 46.20 39.30 W 34.71 38.76 38.51 34.81
2017 January .................... – 47.92 45.50 W W – 45.94 47.61 47.30 43.25 February .................. W 46.97 45.91 W 51.03 – 45.69 50.01 49.11 43.63 March ....................... W 46.05 42.10 W 48.54 – 42.47 47.78 46.83 41.73 April ......................... W 46.76 44.32 W 50.00 W 43.71 48.93 47.16 41.46 May .......................... W 44.70 44.85 W 47.95 – 42.27 47.14 46.08 42.66 June ......................... W 41.30 41.86 48.88 45.41 – 39.16 44.45 43.52 40.28 July .......................... W 44.44 44.33 50.26 46.94 – 41.72 45.95 45.40 40.39 August ..................... W 47.16 46.33 52.18 49.33 – 45.41 48.06 48.32 41.38 September ............... – W 48.06 W 53.41 – 49.22 51.74 52.36 43.26 October .................... – 52.69 49.01 58.58 55.44 – 52.51 50.92 53.93 44.21 November ................ – W 54.66 W 60.22 W 55.88 59.12 58.89 48.57 December ................ – W 55.32 W 62.09 – 58.27 60.36 61.52 49.87 Average .................. W 48.34 46.66 54.77 51.30 W 45.60 50.16 49.55 43.30
2018 January .................... W 61.24 58.75 W 65.03 W 62.07 63.50 64.12 51.34 February .................. W 59.66 56.74 W 63.19 W 55.72 61.90 61.07 49.79 March ....................... – W 56.73 W 65.04 W 56.84 61.90 60.90 49.09 April ......................... W 65.95 57.68 W 68.33 W 63.17 66.05 66.09 53.73 May .......................... – W 63.32 W 70.57 W 66.56 69.66 70.07 58.99 June ......................... W W 64.46 W 71.32 W 64.82 70.18 69.44 59.81 July .......................... W 68.32 66.21 – 70.62 – 62.93 70.30 67.64 59.84 August ..................... W 67.29 63.08 W 70.91 W 63.09 69.96 68.31 57.46 September ............... W W 68.15 W 72.90 W 68.94 72.05 71.80 56.39 October .................... W W R 73.93 W R 74.73 W 68.44 R 74.61 R 73.26 R 54.31 November ................ – 64.87 R 63.95 W R 63.21 W R 53.70 R 64.75 R 61.27 R 36.02 December ................ – 50.04 52.98 – 58.24 – 48.60 54.64 53.02 25.13 Average .................. 74.44 62.51 63.04 71.47 68.94 71.65 61.86 66.96 66.06 51.72
a Prices are not adjusted for inflation. See "Nominal Dollars" in Glossary.b Bahrain, Iran, Iraq, Kuwait, Qatar, Saudi Arabia, United Arab Emirates, and
the Neutral Zone (between Kuwait and Saudi Arabia).c See "Organization of the Petroleum Exporting Countries (OPEC)" in Glossary
for exact years of each country’s membership. On this table, "Total OPEC" for allyears includes Algeria, Iran, Iraq, Kuwait, Libya, Nigeria, Qatar, Saudi Arabia,United Arab Emirates, and Venezuela; Angola is included in "Total OPEC" 2007forward; Gabon is included in "Total OPEC" 1974–1995 and July 2016 forward;Ecuador is included in "Total OPEC" 1973–1992 and 2008 forward; Indonesia isincluded in "Total OPEC" 1973–2008 and 2016.
d Based on October, November, and December data only.R=Revised. – =No data reported. W=Value withheld to avoid disclosure of
individual company data.Notes: • The Free on Board (F.O.B.) cost at the country of origin excludes all
costs related to insurance and transportation. See "F.O.B. (Free on Board)" inGlossary, and Note 3, "Crude Oil F.O.B. Costs," at end of section. • Values for thecurrent two months are preliminary. • Through 1980, prices reflect the period ofreporting; beginning in 1981, prices reflect the period of loading.• Annual averages are averages of the monthly prices, including prices notpublished, weighted by volume. • Cargoes that are purchased on a "netback"basis, or under similar contractual arrangements whereby the actual purchase priceis not established at the time the crude oil is acquired for importation into the UnitedStates, are not included in the published data until the actual prices have beendetermined and reported. • U.S. geographic coverage is the 50 states and theDistrict of Columbia.
Web Page: See http://www.eia.gov/totalenergy/data/monthly/#prices (Excel andCSV files) for all available annual and monthly data beginning in 1973.
Sources: See end of section.

U. S. Energy Information Administration / Monthly Energy Review March 2019 155
Table 9.3 Landed Costs of Crude Oil Imports From Selected Countries (Dollarsa per Barrel)
Selected CountriesPersian
GulfNationsb
TotalOPECc
TotalNon-OPECcAngola Canada Colombia Mexico Nigeria
SaudiArabia
UnitedKingdom Venezuela
1973 Averaged ............... W 5.33 W – 9.08 5.37 – 5.99 5.91 6.85 5.641975 Average ................ 11.81 12.84 – 12.61 12.70 12.50 – 12.36 12.64 12.70 12.701980 Average ................ 34.76 30.11 W 31.77 37.15 29.80 35.68 25.92 30.59 33.56 33.991985 Average ................ 27.39 25.71 – 25.63 28.96 24.72 28.36 24.43 25.50 26.86 26.531990 Average ................ 21.51 20.48 22.34 19.64 23.33 21.82 22.65 20.31 20.55 21.23 20.981995 Average ................ 17.66 16.65 17.45 16.19 18.25 16.84 17.91 14.81 16.78 16.61 16.952000 Average ................ 29.57 26.69 29.68 26.03 30.04 26.58 29.26 26.05 26.77 27.29 27.802001 Average ................ 25.13 20.72 25.88 19.37 26.55 20.98 25.32 19.81 20.73 21.52 22.172002 Average ................ 25.43 22.98 25.28 22.09 26.45 24.77 26.35 21.93 24.13 23.83 23.972003 Average ................ 30.14 26.76 30.55 25.48 31.07 27.50 30.62 25.70 27.54 27.70 27.682004 Average ................ 39.62 34.51 39.03 32.25 40.95 37.11 39.28 33.79 36.53 36.84 35.292005 Average ................ 54.31 44.73 53.42 43.47 57.55 50.31 55.28 47.87 49.68 51.36 47.312006 Average ................ 64.85 53.90 62.13 53.76 68.26 59.19 67.44 57.37 58.92 61.21 57.142007 Average ................ 71.27 60.38 70.91 62.31 78.01 70.78 72.47 66.13 69.83 71.14 63.962008 Average ................ 98.18 90.00 93.43 85.97 104.83 94.75 96.95 90.76 93.59 95.49 90.592009 Average ................ 61.32 57.60 58.50 57.35 68.01 62.14 63.87 57.78 62.15 61.90 58.582010 Average ................ 80.61 72.80 74.25 72.86 83.14 79.29 80.29 72.43 78.60 78.28 74.682011 Average ................ 114.05 89.92 102.57 101.21 116.43 108.83 118.45 100.14 108.01 107.84 98.642012 Average ................ 114.95 84.24 107.07 102.45 116.88 108.15 W 101.58 107.74 107.56 95.052013 Average ................ 110.81 84.41 103.00 99.06 112.87 102.60 111.23 99.34 102.53 102.98 91.992014 Average ................ 99.25 81.30 88.29 87.48 102.16 94.91 W 86.88 95.30 93.10 84.672015 Average ................ 51.73 41.99 49.53 45.51 54.70 49.78 W 42.87 49.43 47.44 44.09
2016 January .................. 34.83 26.32 26.23 24.82 W 30.96 – 21.64 30.85 28.94 26.33 February ................ 33.04 24.62 26.32 25.19 39.44 31.86 W 23.49 30.91 29.63 25.43 March ..................... 36.68 29.31 33.38 29.65 42.86 36.19 W 28.83 34.84 34.02 30.35 April ....................... 40.91 34.19 36.71 31.91 W 39.75 – 31.20 38.00 36.80 34.42 May ........................ 49.14 38.43 42.28 39.67 W 43.46 W 38.14 42.56 42.48 39.55 June ....................... 49.06 41.97 43.88 42.50 51.05 45.90 – 40.04 44.70 44.70 42.65 July ........................ 47.04 39.41 40.90 40.30 48.46 43.80 W 37.00 42.77 41.78 40.48 August ................... 49.43 37.84 40.78 39.34 50.20 43.67 W 38.66 42.74 42.46 39.01 September ............. 46.15 38.62 43.43 38.86 49.91 44.22 – 38.11 43.31 42.62 39.60 October .................. 48.88 41.79 43.44 43.44 W 46.95 – 41.61 45.50 45.65 42.64 November .............. 49.08 39.81 42.97 40.20 52.80 47.04 W 39.53 45.68 44.98 40.52 December .............. 53.63 43.34 48.83 45.84 55.62 50.38 W 45.69 49.38 49.07 44.83 Average ................ 44.65 36.27 38.86 36.64 48.11 42.14 W 35.50 41.20 40.54 37.09
2017 January .................. – 44.70 49.17 46.35 54.74 50.40 W 47.53 49.35 49.22 45.76 February ................ W 44.97 49.66 46.57 54.42 52.27 – 46.28 50.92 50.48 46.26 March ..................... W 43.00 48.29 42.97 W 50.36 W 43.91 49.58 48.91 44.03 April ....................... W 43.05 48.38 44.65 W 50.18 W 44.53 49.03 48.47 44.31 May ........................ W 44.24 45.92 45.51 51.83 49.17 W 43.50 47.37 47.36 45.23 June ....................... 50.74 41.76 44.89 42.36 50.36 47.97 W 40.88 46.86 45.77 42.67 July ........................ 50.20 41.60 46.72 45.17 50.89 48.22 – 42.25 47.48 46.91 43.36 August ................... 52.23 43.18 48.56 46.86 53.18 51.43 W 46.16 49.71 49.55 45.41 September ............. 56.59 45.14 52.43 49.63 57.99 55.03 W 50.98 52.93 53.53 47.42 October .................. W 45.68 53.95 50.28 59.35 58.34 W 53.05 55.14 55.71 48.21 November .............. 61.03 51.16 59.52 55.47 64.27 61.66 62.24 57.19 59.63 59.83 53.67 December .............. W 51.15 61.58 56.01 67.20 63.52 – 58.80 61.48 62.13 53.90 Average ................ 54.17 44.93 50.60 47.73 56.48 52.56 56.11 47.02 51.42 51.26 46.67
2018 January .................. 66.55 51.20 63.25 59.85 69.15 64.81 W 62.79 63.94 64.83 54.64 February ................ W 48.23 62.55 57.37 69.60 65.30 68.19 55.98 63.21 62.93 52.91 March ..................... 70.27 47.01 63.59 56.99 70.59 66.77 W 57.72 63.72 63.56 51.07 April ....................... W 52.22 66.34 58.62 W 69.44 73.82 63.51 67.09 66.99 56.36 May ........................ W 58.19 70.63 64.03 79.38 71.28 W 67.45 70.85 71.50 61.72 June ....................... 76.28 58.57 70.64 65.38 W 72.17 72.88 65.81 71.49 70.65 62.95 July ........................ 75.55 58.99 71.20 66.82 W 72.56 – 63.67 71.62 70.54 62.54 August ................... 75.45 56.78 68.79 64.18 W 72.79 72.41 64.12 71.58 70.44 60.79 September ............. 75.83 52.35 73.88 69.79 W 72.56 W 70.73 72.26 72.45 58.76 October .................. W R 47.93 R 73.27 R 74.79 W R 73.75 W R 69.31 R 72.24 R 72.19 R 57.35 November .............. – R 28.04 R 69.02 R 64.63 R 68.03 R 66.36 W R 55.82 R 65.54 R 63.52 R 38.36 December .............. – 18.78 54.51 54.34 W 58.90 W 48.73 57.54 56.71 27.55 Average ................ 73.42 48.48 67.07 63.73 72.13 69.41 73.51 62.70 67.63 67.33 54.41
a Prices are not adjusted for inflation. See "Nominal Dollars" in Glossary.b Bahrain, Iran, Iraq, Kuwait, Qatar, Saudi Arabia, United Arab Emirates, and
the Neutral Zone (between Kuwait and Saudi Arabia).c See "Organization of the Petroleum Exporting Countries (OPEC)" in Glossary
for exact years of each country’s membership. On this table, "Total OPEC" for allyears includes Algeria, Iran, Iraq, Kuwait, Libya, Nigeria, Qatar, Saudi Arabia,United Arab Emirates, and Venezuela; Angola is included in "Total OPEC" 2007forward; Gabon is included in "Total OPEC" 1974–1995 and July 2016 forward;Ecuador is included in "Total OPEC" 1973–1992 and 2008 forward; Indonesia isincluded in "Total OPEC" 1973–2008 and 2016.
d Based on October, November, and December data only.R=Revised. – =No data reported. W=Value withheld to avoid disclosure of
individual company data.Notes: • See "Landed Costs" in Glossary, and Note 4, "Crude Oil Landed
Costs," at end of section. • Values for the current two months are preliminary.• Through 1980, prices reflect the period of reporting; beginning in 1981, prices
reflect the period of loading. • Annual averages are averages of the monthlyprices, including prices not published, weighted by volume. • Cargoes that arepurchased on a "netback" basis, or under similar contractual arrangementswhereby the actual purchase price is not established at the time the crude oil isacquired for importation into the United States, are not included in the publisheddata until the actual prices have been determined and reported. • U.S. geographiccoverage is the 50 states and the District of Columbia.
Web Page: See http://www.eia.gov/totalenergy/data/monthly/#prices (Excel andCSV files) for all available annual and monthly data beginning in 1973.
Sources: • October 1973–September 1977: Federal Energy Administration,Form FEA-F701-M-0, "Transfer Pricing Report." • October 1977–December1977: U.S. Energy Information Administration (EIA), Form FEA-F701-M-0,"Transfer Pricing Report." • 1978–2007: EIA, Petroleum Marketing Annual 2008,Table 22. • 2008 forward: EIA, Petroleum Marketing Monthly, March 2019, Table22.

156 U. S. Energy Information Administration / Monthly Energy Review March 2019
Table 9.4 Retail Motor Gasoline and On-Highway Diesel Fuel Prices (Dollarsa per Gallon, Including Taxes)
Platt’s / Bureau of Labor Statistics Data U.S. Energy Information Administration Data
Motor Gasoline by Grade Regular Motor Gasoline by Area Type
On-HighwayDiesel Fuel
LeadedRegular
UnleadedRegular
UnleadedPremiumb All Gradesc
ConventionalGasoline Areasd
ReformulatedGasoline Arease All Areas
1950 Average .............. 0.268 NA NA NA – – – – – – – –1955 Average .............. .291 NA NA NA – – – – – – – –1960 Average .............. .311 NA NA NA – – – – – – – –1965 Average .............. .312 NA NA NA – – – – – – – –1970 Average .............. .357 NA NA NA – – – – – – – –1975 Average .............. .567 NA NA NA – – – – – – – –1980 Average .............. 1.191 1.245 NA 1.221 – – – – – – – –1985 Average .............. 1.115 1.202 1.340 1.196 – – – – – – – –1990 Average .............. 1.149 1.164 1.349 1.217 NA NA NA NA1995 Average .............. – – 1.147 1.336 1.205 1.103 1.163 1.111 1.1092000 Average .............. – – 1.510 1.693 1.563 1.462 1.543 1.484 1.4912001 Average .............. – – 1.461 1.657 1.531 1.384 1.498 1.420 1.4012002 Average .............. – – 1.358 1.556 1.441 1.313 1.408 1.345 1.3192003 Average .............. – – 1.591 1.777 1.638 1.516 1.655 1.561 1.5092004 Average .............. – – 1.880 2.068 1.923 1.812 1.937 1.852 1.8102005 Average .............. – – 2.295 2.491 2.338 2.240 2.335 2.270 2.4022006 Average .............. – – 2.589 2.805 2.635 2.533 2.654 2.572 2.7052007 Average .............. – – 2.801 3.033 2.849 2.767 2.857 2.796 2.8852008 Average .............. – – 3.266 3.519 3.317 3.213 3.314 3.246 3.8032009 Average .............. – – 2.350 2.607 2.401 2.315 2.433 2.353 2.4672010 Average .............. – – 2.788 3.047 2.836 2.742 2.864 2.782 2.9922011 Average .............. – – 3.527 3.792 3.577 3.476 3.616 3.521 3.8402012 Average .............. – – 3.644 3.922 3.695 3.552 3.757 3.618 3.9682013 Average .............. – – 3.526 3.843 3.584 3.443 3.635 3.505 3.9222014 Average .............. – – 3.367 3.713 3.425 3.299 3.481 3.358 3.8252015 Average .............. – – 2.448 2.866 2.510 2.334 2.629 2.429 2.707
2016 January ................ – – 1.967 2.455 2.034 1.843 2.170 1.949 2.143 February .............. – – 1.767 2.248 1.833 1.681 1.936 1.764 1.998 March ................... – – 1.958 2.411 2.021 1.895 2.124 1.969 2.090 April ..................... – – 2.134 2.585 2.196 2.027 2.293 2.113 2.152 May ...................... – – 2.264 2.710 2.324 2.199 2.413 2.268 2.315 June ..................... – – 2.363 2.807 2.422 2.303 2.497 2.366 2.423 July ...................... – – 2.225 2.702 2.287 2.157 2.411 2.239 2.405 August ................. – – 2.155 2.629 2.218 2.119 2.300 2.178 2.351 September ........... – – 2.208 2.682 2.269 2.161 2.339 2.219 2.394 October ................ – – 2.243 2.719 2.304 2.186 2.382 2.249 2.454 November ............ – – 2.187 2.675 2.246 2.105 2.343 2.182 2.439 December ............ – – 2.230 2.698 2.289 2.192 2.385 2.254 2.510 Average .............. – – 2.142 2.610 2.204 2.070 2.296 2.143 2.304
2017 January ................ – – 2.351 2.815 2.409 2.285 2.482 2.349 2.580 February .............. – – 2.299 2.793 2.360 2.227 2.467 2.304 2.568 March ................... – – 2.323 2.827 2.386 2.243 2.498 2.325 2.554 April ..................... – – 2.418 2.909 2.479 2.340 2.579 2.417 2.583 May ...................... – – 2.386 2.894 2.448 2.303 2.577 2.391 2.560 June ..................... – – 2.337 2.859 2.400 2.257 2.536 2.347 2.511 July ...................... – – 2.281 2.800 2.344 2.211 2.486 2.300 2.496 August ................. – – 2.374 2.883 2.436 2.297 2.557 2.380 2.595 September ........... – – 2.630 3.120 2.688 2.570 2.802 2.645 2.785 October ................ – – 2.484 2.996 2.545 2.430 2.663 2.505 2.794 November ............ – – 2.548 3.056 2.608 2.474 2.751 2.564 2.909 December ............ – – 2.459 2.985 2.521 2.388 2.663 2.477 2.909 Average .............. – – 2.408 2.911 2.469 2.333 2.586 2.415 2.650
2018 January ................ – – 2.539 3.042 2.596 2.467 2.738 2.555 3.018 February .............. – – 2.575 3.091 2.632 2.488 2.795 2.587 3.046 March ................... – – 2.572 3.101 2.631 2.488 2.808 2.591 2.988 April ..................... – – 2.737 3.258 2.795 2.652 2.978 2.757 3.096 May ...................... – – 2.907 3.423 2.963 2.808 3.096 2.901 3.244 June ..................... – – 2.914 3.440 2.970 2.802 3.078 2.891 3.253 July ...................... – – 2.873 3.399 2.930 2.770 3.015 2.849 3.233 August ................. – – 2.862 3.384 2.919 2.768 2.983 2.836 3.218 September ........... – – 2.873 3.400 2.930 2.769 2.979 2.836 3.262 October ................ – – 2.887 3.431 2.945 2.785 3.017 2.860 3.365 November ............ – – 2.671 3.251 2.733 2.561 2.829 2.647 3.300 December ............ – – 2.414 3.015 2.479 2.263 2.581 2.366 3.123 Average .............. – – 2.735 3.270 2.794 2.631 2.904 2.719 3.178
2019 January ................ – – 2.289 2.874 2.352 2.145 2.464 2.248 2.980 February .............. – – 2.353 2.901 2.412 2.223 2.495 2.309 2.997
a Prices are not adjusted for inflation. See "Nominal Dollars" in Glossary.b The 1981 average (available in Web file) is based on September through
December data only.c Also includes grades of motor gasoline not shown separately.d Any area that does not require the sale of reformulated gasoline.e "Reformulated Gasoline Areas" are ozone nonattainment areas designated by
the U.S. Environmental Protection Agency that require the use of reformulatedgasoline (RFG). Areas are reclassified each time a shift in or out of an RFGprogram occurs due to federal or state regulations.
NA=Not available. – – =Not applicable. Notes: • See Note 5, "Motor Gasoline Prices," at end of section. • See "Motor
Gasoline Grades," "Motor Gasoline, Conventional," "Motor Gasoline, Oxygenated,"and "Motor Gasoline, Reformulated" in Glossary. • Geographic coverage: forcolumns 1–4, current coverage is 85 urban areas; for columns 5–7, coverage is the50 states and the District of Columbia; for column 8, coverage is the 48 contiguous
states and the District of Columbia.Web Page: See http://www.eia.gov/totalenergy/data/monthly/#prices (Excel and
CSV files) for all available annual data beginning in 1949 and monthly databeginning in 1973.
Sources: • Motor Gasoline by Grade, Monthly Data: October 1973forward—U.S. Department of Labor, Bureau of Labor Statistics (BLS), U.S. CityAverage Gasoline Prices. • Motor Gasoline by Grade, Annual Data:1949–1973—Platt’s Oil Price Handbook and Oilmanac, 1974, 51st Edition. 1974forward—calculated by the U.S. Energy Information Administration (EIA) as simpleaverages of the BLS monthly data. • Regular Motor Gasoline by Area Type:EIA, calculated as simple averages of weighted weekly estimates from "WeeklyU.S. Retail Gasoline Prices, Regular Grade." • On-Highway Diesel Fuel: EIA,calculated as simple averages of weighted weekly estimates from "Weekly RetailOn-Highway Diesel Prices."

U. S. Energy Information Administration / Monthly Energy Review March 2019 157
Table 9.5 Refiner Prices of Residual Fuel Oil (Dollarsa per Gallon, Excluding Taxes)
Residual Fuel OilSulfur Content LessThan or Equal to 1%
Residual Fuel OilSulfur Content
Greater Than 1% Average
Sales forResale
Sales to End Users
Sales forResale
Sales to End Users
Sales forResale
Sales to End Users
1978 Average ...................... 0.293 0.314 0.245 0.275 0.263 0.2981980 Average ...................... .608 .675 .479 .523 .528 .6071985 Average ...................... .610 .644 .560 .582 .577 .6101990 Average ...................... .472 .505 .372 .400 .413 .4441995 Average ...................... .383 .436 .338 .377 .363 .3922000 Average ...................... .627 .708 .512 .566 .566 .6022001 Average ...................... .523 .642 .428 .492 .476 .5312002 Average ...................... .546 .640 .508 .544 .530 .5692003 Average ...................... .728 .804 .588 .651 .661 .6982004 Average ...................... .764 .835 .601 .692 .681 .7392005 Average ...................... 1.115 1.168 .842 .974 .971 1.0482006 Average ...................... 1.202 1.342 1.085 1.173 1.136 1.2182007 Average ...................... 1.406 1.436 1.314 1.350 1.350 1.3742008 Average ...................... 1.918 2.144 1.843 1.889 1.866 1.9642009 Average ...................... 1.337 1.413 1.344 1.306 1.342 1.3412010 Average ...................... 1.756 1.920 1.679 1.619 1.697 1.7132011 Average ...................... 2.389 2.736 2.316 2.257 2.336 2.4012012 Average ...................... 2.548 3.025 2.429 2.433 2.457 2.5922013 Average ...................... 2.363 2.883 2.249 2.353 2.278 2.4822014 Average ...................... 2.153 2.694 1.996 2.221 2.044 2.3252015 Average ...................... .971 1.529 .999 1.227 .996 1.285
2016 January ........................ .477 W .502 .641 .499 .710 February ...................... .475 NA .508 .606 .504 .632 March ........................... .582 NA .555 .672 .558 .693 April ............................. .633 W .614 .734 .616 .782 May .............................. .729 W .722 .868 .723 .922 June ............................. .850 W .823 .911 .825 .983 July .............................. .876 W .834 .948 .835 1.030 August ......................... .842 W .811 .924 .815 .990 September ................... .846 W .855 1.059 .854 1.076 October ........................ .961 W .935 1.091 .938 1.115 November .................... .920 NA .907 1.040 .908 1.106 December .................... 1.024 W 1.031 1.206 1.030 1.230 Average ...................... .736 1.138 .746 .897 .745 .945
2017 January ........................ 1.099 W 1.121 1.249 1.119 1.309 February ...................... 1.174 W 1.115 1.243 1.121 1.291 March ........................... 1.103 W 1.075 1.186 1.077 1.239 April ............................. 1.038 W 1.039 1.147 1.039 1.201 May .............................. .986 W 1.047 1.153 1.043 1.213 June ............................. .937 W .995 1.129 .991 1.195 July .............................. 1.026 W 1.040 1.154 1.039 1.211 August ......................... 1.042 W 1.081 1.142 1.079 1.204 September ................... 1.150 W 1.137 1.295 1.138 1.314 October ........................ 1.153 W 1.178 1.249 1.176 1.304 November .................... 1.302 W 1.277 1.384 1.279 1.413 December .................... 1.254 W 1.249 1.447 1.249 1.484 Average ...................... 1.112 W 1.117 1.237 1.116 1.287
2018 January ........................ 1.301 W 1.311 1.476 1.310 1.507 February ...................... 1.221 W 1.325 1.415 1.319 1.490 March ........................... 1.227 W 1.306 1.386 1.302 1.452 April ............................. 1.311 W 1.349 1.438 1.348 1.504 May .............................. 1.462 W 1.501 1.615 1.500 1.667 June ............................. 1.487 W 1.558 1.643 1.553 1.731 July .............................. 1.543 W 1.583 1.709 1.581 1.767 August ......................... 1.499 W 1.552 1.680 1.549 1.764 September ................... 1.520 W 1.561 1.696 1.560 1.761 October ........................ 1.620 W 1.703 1.816 1.700 1.875 November .................... 1.360 W R 1.562 1.731 R 1.556 1.827 December .................... 1.252 W 1.295 1.467 1.293 1.608
a Prices are not adjusted for inflation. See "Nominal Dollars" in Glossary.R=Revised. NA=Not available. W=Value withheld to avoid disclosure of
individual company data.Notes: • Sales for resale are those made to purchasers other than ultimate
consumers. Sales to end users are those made directly to ultimate consumers,including bulk consumers (such as agriculture, industry, and electric utilities) andcommercial consumers. • Values for the current month are preliminary.• Through 1982, prices are U.S. Energy Information Administration (EIA)
estimates. See Note 6, "Historical Petroleum Prices," at end of section.• Geographic coverage is the 50 states and the District of Columbia.
Web Page: See http://www.eia.gov/totalenergy/data/monthly/#prices (Excel andCSV files) for all available annual data beginning in 1978 and monthly databeginning in 1982.
Sources: • 1978–2007: EIA, Petroleum Marketing Annual 2007, Table 17.• 2008 forward: EIA, Petroleum Marketing Monthly, March 2019, Table 16.

158 U. S. Energy Information Administration / Monthly Energy Review March 2019
Table 9.6 Refiner Prices of Petroleum Products for Resale (Dollarsa per Gallon, Excluding Taxes)
FinishedMotor
Gasolineb
FinishedAviationGasoline
Kerosene-Type
Jet Fuel Kerosene
No. 2FuelOil
No. 2DieselFuel
Propane(Consumer
Grade)
1978 Average ...................... 0.434 0.537 0.386 0.404 0.369 0.365 0.2371980 Average ...................... .941 1.128 .868 .864 .803 .801 .4151985 Average ...................... .835 1.130 .794 .874 .776 .772 .3981990 Average ...................... .786 1.063 .773 .839 .697 .694 .3861995 Average ...................... .626 .975 .539 .580 .511 .538 .3442000 Average ...................... .963 1.330 .880 .969 .886 .898 .5952001 Average ...................... .886 1.256 .763 .821 .756 .784 .5402002 Average ...................... .828 1.146 .716 .752 .694 .724 .4312003 Average ...................... 1.002 1.288 .871 .955 .881 .883 .6072004 Average ...................... 1.288 1.627 1.208 1.271 1.125 1.187 .7512005 Average ...................... 1.670 2.076 1.723 1.757 1.623 1.737 .9332006 Average ...................... 1.969 2.490 1.961 2.007 1.834 2.012 1.0312007 Average ...................... 2.182 2.758 2.171 2.249 2.072 2.203 1.1942008 Average ...................... 2.586 3.342 3.020 2.851 2.745 2.994 1.4372009 Average ...................... 1.767 2.480 1.719 1.844 1.657 1.713 .9212010 Average ...................... 2.165 2.874 2.185 2.299 2.147 2.214 1.2122011 Average ...................... 2.867 3.739 3.014 3.065 2.907 3.034 1.4672012 Average ...................... 2.929 3.919 3.080 3.163 3.031 3.109 1.0332013 Average ...................... 2.812 3.869 2.953 3.084 2.966 3.028 1.0482014 Average ...................... 2.618 3.687 2.763 2.882 2.741 2.812 1.1652015 Average ...................... 1.726 2.764 1.592 1.735 1.565 1.667 .555
2016 January ........................ 1.187 2.122 1.022 1.183 .976 1.015 .460 February ...................... 1.046 1.908 1.017 1.155 .948 1.043 .470 March ........................... 1.335 2.230 1.100 1.208 1.070 1.189 .497 April ............................. 1.476 2.457 1.155 1.193 1.113 1.251 .458 May .............................. 1.613 2.528 1.311 1.327 1.291 1.432 .511 June ............................. 1.643 2.591 1.428 1.445 1.404 1.531 .497 July .............................. 1.490 2.505 1.354 1.297 1.305 1.426 .476 August ......................... 1.508 2.405 1.313 1.408 1.307 1.440 .453 September ................... 1.514 2.506 1.366 1.402 1.341 1.471 .494 October ........................ 1.568 2.551 1.471 1.580 1.443 1.592 .608 November .................... 1.427 2.433 1.406 1.485 1.386 1.469 .588 December .................... 1.585 2.462 1.511 1.685 1.507 1.606 .703 Average ...................... 1.454 2.404 1.295 1.383 1.239 1.378 .523
2017 January ........................ 1.627 2.614 1.561 1.761 1.560 1.636 .788 February ...................... 1.625 2.592 1.592 1.657 1.553 1.641 .792 March ........................... 1.634 2.618 1.520 1.580 1.495 1.581 .671 April ............................. 1.723 2.724 1.545 1.572 1.499 1.627 .641 May .............................. 1.668 2.620 1.459 1.481 1.447 1.552 .631 June ............................. 1.574 2.552 1.378 1.360 1.375 1.465 .585 July .............................. 1.621 2.608 1.436 1.468 1.392 1.533 .634 August ......................... 1.711 2.710 1.587 1.630 1.522 1.681 .742 September ................... 1.826 2.893 1.771 1.809 1.668 1.847 .864 October ........................ 1.730 2.716 1.704 1.805 1.695 1.852 .942 November .................... 1.806 2.841 1.795 1.961 1.781 1.936 .997 December .................... 1.720 2.691 1.846 2.034 1.841 1.918 .991 Average ...................... 1.689 2.682 1.603 1.730 1.600 1.691 .800
2018 January ........................ 1.849 2.900 1.969 2.209 1.990 2.042 .990 February ...................... 1.823 2.893 1.911 2.088 1.889 1.972 .889 March ........................... 1.889 2.904 1.893 1.969 1.848 1.952 .827 April ............................. 2.054 3.085 2.032 2.075 1.982 2.099 .792 May .............................. 2.205 3.181 2.175 2.205 2.143 2.258 .867 June ............................. 2.135 3.138 2.152 2.145 2.089 2.203 .807 July .............................. 2.148 3.111 2.140 2.133 2.079 2.192 .854 August ......................... 2.118 3.085 2.148 2.169 2.114 2.203 .907 September ................... 2.136 3.124 2.214 2.246 2.214 2.282 .951 October ........................ 2.090 3.099 2.296 2.437 2.281 2.379 .948 November .................... R 1.732 2.762 R 2.100 2.206 R 2.098 2.130 R .826 December .................... 1.509 2.463 1.812 1.954 1.796 1.794 .799
a Prices are not adjusted for inflation. See "Nominal Dollars" in Glossary.b See Note 5, "Motor Gasoline Prices," at end of section.R=Revised. Notes: • Sales for resale are those made to purchasers other than ultimate
consumers. Sales to end users are shown in Table 9.7; they are sales madedirectly to ultimate consumers, including bulk consumers (such as agriculture,industry, and electric utilities) and residential and commercial consumers. • Valuesfor the current month are preliminary. • Through 1982, prices are U.S. Energy
Information Administration (EIA) estimates. See Note 6, "Historical PetroleumPrices," at end of section. • Geographic coverage is the 50 states and the Districtof Columbia.
Web Page: See http://www.eia.gov/totalenergy/data/monthly/#prices (Excel andCSV files) for all available annual data beginning in 1978 and monthly databeginning in 1982.
Sources: • 1978–2007: EIA, Petroleum Marketing Annual 2007, Table 4.• 2008 forward: EIA, Petroleum Marketing Monthly, March 2019, Table 4.

U. S. Energy Information Administration / Monthly Energy Review March 2019 159
Table 9.7 Refiner Prices of Petroleum Products to End Users (Dollarsa per Gallon, Excluding Taxes)
FinishedMotor
Gasolineb
FinishedAviationGasoline
Kerosene-Type
Jet Fuel Kerosene
No. 2FuelOil
No. 2DieselFuel
Propane(Consumer
Grade)
1978 Average ...................... 0.484 0.516 0.387 0.421 0.400 0.377 0.3351980 Average ...................... 1.035 1.084 .868 .902 .788 .818 .4821985 Average ...................... .912 1.201 .796 1.030 .849 .789 .7171990 Average ...................... .883 1.120 .766 .923 .734 .725 .7451995 Average ...................... .765 1.005 .540 .589 .562 .560 .4922000 Average ...................... 1.106 1.306 .899 1.123 .927 .935 .6032001 Average ...................... 1.032 1.323 .775 1.045 .829 .842 .5062002 Average ...................... .947 1.288 .721 .990 .737 .762 .4192003 Average ...................... 1.156 1.493 .872 1.224 .933 .944 .5772004 Average ...................... 1.435 1.819 1.207 1.160 1.173 1.243 .8392005 Average ...................... 1.829 2.231 1.735 1.957 1.705 1.786 1.0892006 Average ...................... 2.128 2.682 1.998 2.244 1.982 2.096 1.3582007 Average ...................... 2.345 2.849 2.165 2.263 2.241 2.267 1.4892008 Average ...................... 2.775 3.273 3.052 3.283 2.986 3.150 1.8922009 Average ...................... 1.888 2.442 1.704 2.675 1.962 1.834 1.2202010 Average ...................... 2.301 3.028 2.201 3.063 2.462 2.314 1.4812011 Average ...................... 3.050 3.803 3.054 3.616 3.193 3.117 1.7092012 Average ...................... 3.154 3.971 3.104 3.843 3.358 3.202 1.1392013 Average ...................... 3.049 3.932 2.979 3.842 3.335 3.122 1.0282014 Average ...................... 2.855 3.986 2.772 W 3.329 2.923 1.0972015 Average ...................... 2.003 W 1.629 W 2.016 1.819 .481
2016 January ........................ 1.505 W 1.038 W 1.450 1.198 .377 February ...................... 1.332 W 1.032 W 1.407 1.185 .409 March ........................... 1.552 W 1.133 W 1.555 1.317 .481 April ............................. 1.725 W 1.187 W 1.631 1.386 .472 May .............................. 1.869 W 1.342 W 1.733 1.555 .533 June ............................. 1.961 W 1.464 W 1.861 1.661 .514 July .............................. 1.804 W 1.393 W 1.814 1.577 .491 August ......................... 1.754 W 1.330 W NA 1.577 .460 September ................... 1.788 W 1.394 W 1.805 1.601 .507 October ........................ 1.819 W 1.506 W 1.941 1.706 .599 November .................... 1.759 W 1.426 W 1.787 1.599 .557 December .................... 1.849 W 1.539 W 1.997 1.718 .666 Average ...................... 1.730 W 1.319 W 1.716 1.511 .498
2017 January ........................ 1.900 W 1.584 W NA 1.747 .774 February ...................... 1.862 W 1.615 W 2.033 1.755 .814 March ........................... 1.904 W 1.554 W 1.909 1.699 .657 April ............................. 1.997 W 1.595 W 2.081 1.747 .652 May .............................. 1.963 W 1.492 2.637 NA 1.693 .650 June ............................. 1.906 W 1.434 2.600 1.739 1.618 .611 July .............................. 1.871 W 1.478 2.621 1.728 1.665 .667 August ......................... 1.952 W 1.613 2.579 1.904 1.792 .768 September ................... 2.154 W 1.795 2.703 2.044 1.959 .895 October ........................ 2.042 W 1.743 W 2.048 1.982 .972 November .................... 2.122 W 1.831 W 2.134 2.047 1.011 December .................... 2.034 W 1.869 W 2.263 2.037 1.028 Average ...................... 1.976 W 1.629 W 2.010 1.811 .772
2018 January ........................ 2.108 W 2.012 W 2.206 2.144 .971 February ...................... 2.127 W 1.970 W 2.365 2.107 .948 March ........................... 2.160 W 1.924 W 2.484 2.076 .842 April ............................. 2.315 W 2.080 W 2.486 2.201 .839 May .............................. 2.494 W 2.221 3.219 2.478 2.368 .916 June ............................. 2.469 W 2.196 3.292 2.413 2.340 .883 July .............................. 2.442 W 2.176 W 2.436 2.316 .956 August ......................... 2.421 W 2.183 3.272 2.499 2.327 .989 September ................... 2.428 W 2.257 3.189 2.612 2.388 1.062 October ........................ 2.441 W 2.349 W 2.696 2.500 .988 November .................... 2.205 W 2.162 W 2.431 R 2.282 R .876 December .................... 1.973 W 1.852 W 2.222 1.981 .796
a Prices are not adjusted for inflation. See "Nominal Dollars" in Glossary.b See Note 5, "Motor Gasoline Prices," at end of section.R=Revised. NA=Not available. W=Value withheld to avoid disclosure of
individual company data.Notes: • Sales to end users are those made directly to ultimate consumers,
including bulk consumers (such as agriculture, industry, and electric utilities) andresidential and commercial consumers. Sales for resale are shown in Table 9.6;they are sales made to purchasers other than ultimate consumers. • Values forthe current month are preliminary. • Through 1982, prices are U.S. Energy
Information Administration (EIA) estimates. See Note 6, "Historical PetroleumPrices," at end of section. • Geographic coverage is the 50 states and the Districtof Columbia.
Web Page: See http://www.eia.gov/totalenergy/data/monthly/#prices (Excel andCSV files) for all available annual data beginning in 1978 and monthly databeginning in 1982.
Sources: • 1978–2007: EIA, Petroleum Marketing Annual 2007, Table 2.• 2008 forward: EIA, Petroleum Marketing Monthly, March 2019, Table 2.

160 U. S. Energy Information Administration / Monthly Energy Review March 2019
Figure 9.2 Average Retail Prices of Electricity (Cents [a] per Kilowatthour)
Commercial
Industrial
Residential
Transportation
Other [b]
0
2
4
6
8
10
12
14
1960 1965 1970 1975 1980 1985 1990 1995 2000 2005 2010 2015
By Sector, 1960–2018
Industrial
Commercial
Residential
Transportation
0
2
4
6
8
10
12
14
J F M A M J J A S O N D J F M A M J J A S O N D J F M A M J J A S O N D
2016 2017 2018
By Sector, Monthly
10.27 10.48 10.58
0
2
4
6
8
10
12
2016 2017 2018
Total, January–December
12.47
10.33
6.65
9.72
0
3
6
9
12
15
Residential Commercial Industrial Transportation
By Sector, December 2018
[a] Prices are not adjusted for inflation. See “Nominal Dollars” in Glossary.
[b] Public street and highway lighting, interdepartmental sales, other sales
to public authorities, agricultural and irrigation, and transportation including
railroads and railways.
Note: Includes taxes.
Web Page: http://www.eia.gov/totalenergy/data/monthly/#prices.
Source: Table 9.8.

U. S. Energy Information Administration / Monthly Energy Review March 2019 161
Table 9.8 Average Retail Prices of Electricity (Centsa per Kilowatthour, Including Taxes)
Residential Commercialb Industrialc Transportationd Othere Total
1960 Average ...................... 2.60 2.40 1.10 NA 1.90 1.801965 Average ...................... 2.40 2.20 1.00 NA 1.80 1.701970 Average ...................... 2.20 2.10 1.00 NA 1.80 1.701975 Average ...................... 3.50 3.50 2.10 NA 3.10 2.901980 Average ...................... 5.40 5.50 3.70 NA 4.80 4.701985 Average ...................... 7.39 7.27 4.97 NA 6.09 6.441990 Average ...................... 7.83 7.34 4.74 NA 6.40 6.571995 Average ...................... 8.40 7.69 4.66 NA 6.88 6.892000 Average ...................... 8.24 7.43 4.64 NA 6.56 6.812001 Average ...................... 8.58 7.92 5.05 NA 7.20 7.292002 Average ...................... 8.44 7.89 4.88 NA 6.75 7.202003 Average ...................... 8.72 8.03 5.11 7.54 – – 7.442004 Average ...................... 8.95 8.17 5.25 7.18 – – 7.612005 Average ...................... 9.45 8.67 5.73 8.57 – – 8.142006 Average ...................... 10.40 9.46 6.16 9.54 – – 8.902007 Average ...................... 10.65 9.65 6.39 9.70 – – 9.132008 Average ...................... 11.26 10.26 6.96 10.71 – – 9.742009 Average ...................... 11.51 10.16 6.83 10.66 – – 9.822010 Average ...................... 11.54 10.19 6.77 10.56 – – 9.832011 Average ...................... 11.72 10.24 6.82 10.46 – – 9.902012 Average ...................... 11.88 10.09 6.67 10.21 – – 9.842013 Average ...................... 12.13 10.26 6.89 10.55 – – 10.072014 Average ...................... 12.52 10.74 7.10 10.45 – – 10.442015 Average ...................... 12.65 10.64 6.91 10.09 – – 10.41
2016 January ........................ 11.99 10.08 6.44 9.52 – – 9.97 February ...................... 12.14 10.25 6.42 9.61 – – 10.00 March ........................... 12.56 10.23 6.46 9.56 – – 10.00 April ............................. 12.43 10.19 6.44 9.53 – – 9.83 May .............................. 12.79 10.31 6.57 9.28 – – 10.06 June ............................. 12.73 10.66 7.03 9.75 – – 10.52 July .............................. 12.68 10.68 7.23 9.84 – – 10.70 August ......................... 12.88 10.76 7.23 10.04 – – 10.81 September ................... 12.87 10.77 7.14 10.00 – – 10.68 October ........................ 12.46 10.55 6.73 9.62 – – 10.15 November .................... 12.75 10.32 6.66 9.22 – – 10.10 December .................... 12.23 10.17 6.67 9.49 – – 10.09 Average ...................... 12.55 10.43 6.76 9.63 – – 10.27
2017 January ........................ 12.21 10.21 6.59 9.39 – – 10.13 February ...................... 12.79 10.48 6.63 9.50 – – 10.28 March ........................... 12.89 10.46 6.71 9.49 – – 10.28 April ............................. 12.72 10.40 6.60 9.46 – – 10.07 May .............................. 13.07 10.59 6.78 9.61 – – 10.34 June ............................. 13.20 11.01 7.19 10.18 – – 10.83 July .............................. 13.08 10.97 7.31 10.12 – – 10.95 August ......................... 13.15 11.01 7.22 10.06 – – 10.91 September ................... 13.28 11.03 7.17 9.99 – – 10.86 October ........................ 12.80 10.78 6.91 9.57 – – 10.40 November .................... 12.94 10.49 6.73 9.50 – – 10.28 December .................... 12.45 10.28 6.54 9.35 – – 10.17 Average ...................... 12.89 10.66 6.88 9.68 – – 10.48
2018 January ........................ 12.25 10.49 R 6.96 R 9.44 – – 10.47 February ...................... 12.66 R 10.65 6.81 R 9.84 – – 10.48 March ........................... 12.99 10.49 6.66 R 9.43 – – R 10.40 April ............................. 12.88 10.44 6.58 R 9.48 – – 10.23 May .............................. 13.15 R 10.50 6.82 9.46 – – 10.41 June ............................. R 13.04 10.82 7.18 R 10.16 – – 10.79 July .............................. 13.13 R 10.98 7.34 R 10.19 – – 11.03 August ......................... R 13.28 R 11.00 R 7.21 R 9.69 – – R 11.02 September ................... 13.01 10.68 7.09 R 10.30 – – 10.70 October ........................ 12.87 R 10.75 6.91 R 9.84 – – 10.46 November .................... 12.95 10.56 6.88 9.72 – – 10.43 December .................... 12.47 10.33 6.65 9.72 – – 10.27 Average ...................... 12.89 10.66 6.93 9.77 – – 10.58
a Prices are not adjusted for inflation. See "Nominal Price" in Glossary.b Commercial sector. For 1960–2002, prices exclude public street and highway
lighting, interdepartmental sales, and other sales to public authorities.c Industrial sector. For 1960–2002, prices exclude agriculture and irrigation.d Transportation sector, including railroads and railways.e Public street and highway lighting, interdepartmental sales, other sales to
public authorities, agriculture and irrigation, and transportation including railroadsand railways.
R=Revised. NA=Not available. – – =Not applicable. Notes: • Beginning in 2003, the category "Other" has been replaced by
"Transportation," and the categories "Commercial" and "Industrial" have beenredefined. • Prices are calculated by dividing revenue by sales. Revenue may notcorrespond to sales for a particular month because of energy service providerbilling and accounting procedures. That lack of correspondence could result inuncharacteristic increases or decreases in the monthly prices. • Prices includestate and local taxes, energy or demand charges, customer service charges,environmental surcharges, franchise fees, fuel adjustments, and othermiscellaneous charges applied to end-use customers during normal billingoperations. Prices do not include deferred charges, credits, or other adjustments,such as fuel or revenue from purchased power, from previous reporting periods.• Through 1979, data are for Classes A and B privately owned electric utilities only.
(Class A utilities are those with operating revenues of $2.5 million or more; Class Butilities are those with operating revenues between $1 million and $2.5 million.) For1980–1982, data are for selected Class A utilities whose electric operatingrevenues were $100 million or more during the previous year. For 1983, data arefor a selected sample of electric utilities. Beginning in 1984, data are for a censusof electric utilities. Beginning in 1996, data also include energy service providersselling to retail customers. • See Note 7, "Electricity Retail Prices," at end ofsection for plant coverage, and for information on preliminary and final values.• Geographic coverage is the 50 states and the District of Columbia.
Web Page: See http://www.eia.gov/totalenergy/data/monthly/#prices (Excel andCSV files) for all available annual data beginning in 1960 and monthly databeginning in 1976.
Sources: • 1960–September 1977: Federal Power Commission, Form FPC-5,"Monthly Statement of Electric Operating Revenues and Income." • October1977–February 1980: Federal Energy Regulatory Commission (FERC), FormFPC-5, "Monthly Statement of Electric Operating Revenues and Income." • March1980–1982: FERC, Form FERC-5, "Electric Utility Company Monthly Statement."• 1983: U.S. Energy Information Administration (EIA), Form EIA-826, "ElectricUtility Company Monthly Statement." • 1984–2010: EIA, Form EIA-861, "AnnualElectric Power Industry Report." • 2011 forward: EIA, Electric Power Monthly,February 2019, Table 5.3.

162 U. S. Energy Information Administration / Monthly Energy Review March 2019
Figure 9.3 Cost of Fossil‐Fuel Receipts at Electric Generating Plants (Dollars [a] per Million Btu, Including Taxes)
Coal
Natural Gas
Residual Fuel Oil
0
5
10
15
20
25
1975 1980 1985 1990 1995 2000 2005 2010 2015
Costs, 1973–2018
Coal
Natural Gas
Residual Fuel Oil
0
5
10
15
20
J F M A M J J A S O N D J F M A M J J A S O N D J F M A M J J A S O N D
2016 2017 2018
Costs, Monthly
12.22
9.65
3.96
2.08 2.07
14.6313.60
3.63
2.04 2.17
14.2713.58
4.73
2.12 2.03
0
5
10
15
20
Distillate Fuel Oil Residual Fuel Oil Natural Gas Coal Petroleum Coke
By Fuel TypeDecember 2016 December 2017 December 2018
[a] Prices are not adjusted for inflation. See “Nominal Dollars” in
Glossary.
Web Page: http://www.eia.gov/totalenergy/data/monthly/#prices.
Source: Table 9.9.

U. S. Energy Information Administration / Monthly Energy Review March 2019 163
Table 9.9 Cost of Fossil-Fuel Receipts at Electric Generating Plants (Dollarsa per Million Btu, Including Taxes)
Coal
Petroleum
Natural Gase All Fossil FuelsfResidual Fuel Oilb Distillate Fuel Oilc Petroleum Coke Totald
1973 Average .................... 0.41 0.79 NA NA 0.80 0.34 0.481975 Average .................... .81 2.01 NA NA 2.02 .75 1.041980 Average .................... 1.35 4.27 NA NA 4.35 2.20 1.931985 Average .................... 1.65 4.24 NA NA 4.32 3.44 2.091990 Average .................... 1.45 3.32 5.38 .80 3.35 2.32 1.691995 Average .................... 1.32 2.59 3.99 .65 2.57 1.98 1.452000 Average .................... 1.20 4.29 6.65 .58 4.18 4.30 1.742001 Average .................... 1.23 3.73 6.30 .78 3.69 4.49 1.732002 Averageg ................... 1.25 3.73 5.34 .78 3.34 3.56 1.862003 Average .................... 1.28 4.66 6.82 .72 4.33 5.39 2.282004 Average .................... 1.36 4.73 8.02 .83 4.29 5.96 2.482005 Average .................... 1.54 7.06 11.72 1.11 6.44 8.21 3.252006 Average .................... 1.69 7.85 13.28 1.33 6.23 6.94 3.022007 Average .................... 1.77 8.64 14.85 1.51 7.17 7.11 3.232008 Average .................... 2.07 13.62 21.46 2.11 10.87 9.01 4.122009 Average .................... 2.21 8.98 13.22 1.61 7.02 4.74 3.042010 Average .................... 2.27 12.57 16.61 2.28 9.54 5.09 3.262011 Average .................... 2.39 18.35 22.46 3.03 12.48 4.72 3.292012 Average .................... 2.38 21.03 23.49 2.24 12.48 3.42 2.832013 Average .................... 2.34 19.26 23.03 2.18 11.57 4.33 3.092014 Average .................... 2.37 18.30 21.88 1.98 11.60 5.00 3.312015 Average .................... 2.22 9.89 14.06 1.84 6.74 3.23 2.65
2016 January ...................... 2.12 7.08 8.90 1.38 4.56 3.02 2.52 February .................... 2.11 5.77 8.78 1.30 3.66 2.70 2.36 March ......................... 2.17 5.63 9.46 1.41 3.62 2.23 2.21 April ........................... 2.16 7.53 9.97 1.35 4.53 2.42 2.31 May ............................ 2.16 9.07 10.76 1.32 5.70 2.39 2.31 June ........................... 2.10 8.93 12.22 1.41 6.13 2.67 2.39 July ............................ 2.11 11.72 12.08 1.47 6.38 2.97 2.55 August ....................... 2.11 8.55 11.41 1.75 5.24 2.95 2.52 September ................. 2.12 8.42 11.29 2.07 5.23 3.07 2.55 October ...................... 2.07 8.75 12.04 1.98 5.85 3.13 2.51 November .................. 2.08 9.03 12.01 2.26 6.24 3.02 2.47 December .................. 2.08 9.65 12.22 2.07 5.93 3.96 2.82 Average .................... 2.11 8.45 10.90 1.65 5.24 2.87 2.47
2017 January ...................... 2.09 11.25 13.02 2.14 7.80 4.11 2.88 February .................... 2.06 10.77 12.98 2.00 6.37 3.56 2.63 March ......................... 2.07 11.42 12.35 2.06 7.66 3.35 2.66 April ........................... 2.08 10.64 13.00 2.00 7.01 3.38 2.65 May ............................ 2.09 10.69 12.22 2.05 6.69 3.48 2.70 June ........................... 2.07 10.48 11.56 2.11 6.18 3.29 2.64 July ............................ 2.06 9.99 11.82 2.09 5.97 3.21 2.64 August ....................... 2.05 10.03 12.95 2.08 6.31 3.13 2.56 September ................. 2.02 10.06 14.52 2.10 6.42 3.16 2.56 October ...................... 2.03 10.61 14.11 2.31 6.88 3.13 2.54 November .................. 2.04 10.28 14.61 2.49 8.04 3.35 2.62 December .................. 2.04 13.60 14.63 2.17 8.90 3.63 2.80 Average .................... 2.06 11.00 13.22 2.13 7.10 3.37 2.65
2018 January ...................... 2.07 11.33 15.96 2.38 11.32 5.02 3.50 February .................... 2.07 11.51 15.00 2.43 8.26 3.61 2.79 March ......................... 2.04 12.10 14.91 2.54 7.69 3.18 2.57 April ........................... 2.07 12.21 16.07 2.56 8.08 3.13 2.58 May ............................ 2.05 12.82 16.78 2.41 10.31 3.04 2.56 June ........................... 2.05 13.85 16.91 2.73 9.14 3.11 2.61 July ............................ 2.06 13.76 16.40 2.71 8.12 3.29 2.73 August ....................... 2.06 R 14.38 R 16.76 2.79 R 8.22 R 3.28 2.69 September ................. 2.05 13.92 17.35 2.94 8.85 3.11 2.62 October ...................... 2.05 14.52 17.66 2.48 10.29 3.39 2.71 November .................. 2.06 15.27 16.20 2.21 R 9.47 4.16 3.01 December .................. 2.12 13.58 14.27 2.03 9.17 4.73 3.25 Average .................... 2.06 12.98 16.09 2.54 9.27 3.55 2.80
a Prices are not adjusted for inflation. See "Nominal Dollars" in Glossary.b For 1973–2001, electric utility data are for heavy oil (fuel oil nos. 5 and 6, and
small amounts of fuel oil no. 4).c For 1973–2001, electric utility data are for light oil (fuel oil nos. 1 and 2).d For all years, includes residual fuel oil and distillate fuel oil. For 1990 forward,
also includes petroleum coke. For 1973–2012, also includes jet fuel, kerosene, andwaste oil. For 1983–2012, also includes other petroleum, such as propane andrefined motor oil.
e Natural gas, plus a small amount of supplemental gaseous fuels. For1973–2000, data also include a small amount of blast furnace gas and other gasesderived from fossil fuels.
f Weighted average of costs shown under "Coal," "Petroleum," and "NaturalGas."
g Through 2001, data are for electric utilities only. Beginning in 2002, data alsoinclude independent power producers, and electric generating plants in the
commercial and industrial sectors.R=Revised. NA=Not available. Notes: • Receipts are purchases of fuel. • Yearly costs are averages of
monthly values, weighted by quantities in Btu. • For this table, there are severalbreaks in the data series related to what plants and fuels are covered. Beginning in2013, data cover all regulated generating plants; plus unregulated plants whosetotal fossil-fueled nameplate generating capacity is 50 megawatts or more for coal,and 200 megawatts or more for natural gas, residual fuel oil, distillate fuel oil, andpetroleum coke. For data coverage before 2013, see EIA, Electric Power Monthly,Appendix C, Form EIA-923 notes, “Receipts and cost and quality of fossil fuels”section. • Geographic coverage is the 50 states and the District of Columbia.
Web Page: See http://www.eia.gov/totalenergy/data/monthly/#prices (Excel andCSV files) for all available annual and monthly data beginning in 1973.
Sources: See end of section.

164 U. S. Energy Information Administration / Monthly Energy Review March 2019
Figure 9.4 Natural Gas Prices (Dollars [a] per Thousand Cubic Feet)
Wellhead
City Gate
0
2
4
6
8
10
1950 1955 1960 1965 1970 1975 1980 1985 1990 1995 2000 2005 2010 2015
Wellhead and Citygate, 1949–2018
Industrial [b]
Commercial [b]
Residential [b]
Transportation
Electric Power [b]
0
4
8
12
16
1970 1975 1980 1985 1990 1995 2000 2005 2010 2015
Consuming Sectors,1967–2018
Residential [b]
Industrial [b]
Commercial [b]
Electric Power [b]
0
5
10
15
20
J F M A M J J A S O N D J F M A M J J A S O N D J F M A M J J A S O N D
2016 2017 2018
Consuming Sectors, Monthly
[a] Prices are not adjusted for inflation. See “Nominal Dollars” in Glossary.
[b] Includes taxes.
Web Page: http://www.eia.gov/totalenergy/data/monthly/#prices.
Source: Table 9.10.

U. S. Energy Information Administration / Monthly Energy Review March 2019 165
Table 9.10 Natural Gas Prices (Dollarsa per Thousand Cubic Feet)
WellheadPricef
City-gate
Priceg
Consuming Sectorsb
Residential Commercialc Industriald Transportation Electric Powere
PricehPercentageof Sectori Priceh
Percentageof Sectori Priceh
Percentageof Sectori
Vehicle Fuelj Priceh Priceh
Percentageof Sectori,k
1950 Average .................... 0.07 NA NA NA NA NA NA NA NA NA NA1955 Average .................... .10 NA NA NA NA NA NA NA NA NA NA1960 Average .................... .14 NA NA NA NA NA NA NA NA NA NA1965 Average .................... .16 NA NA NA NA NA NA NA NA NA NA1970 Average .................... .17 NA 1.09 NA .77 NA .37 NA NA .29 NA1975 Average .................... .44 NA 1.71 NA 1.35 NA .96 NA NA .77 96.11980 Average .................... 1.59 NA 3.68 NA 3.39 NA 2.56 NA NA 2.27 96.91985 Average .................... 2.51 3.75 6.12 NA 5.50 NA 3.95 68.8 NA 3.55 94.01990 Average .................... 1.71 3.03 5.80 99.2 4.83 86.6 2.93 35.2 3.39 2.38 76.81995 Average .................... 1.55 2.78 6.06 99.0 5.05 76.7 2.71 24.5 3.98 2.02 71.42000 Average .................... 3.68 4.62 7.76 92.6 6.59 63.9 4.45 19.8 5.54 4.38 50.52001 Average .................... 4.00 5.72 9.63 92.4 8.43 66.0 5.24 20.8 6.60 4.61 40.22002 Average .................... 2.95 4.12 7.89 97.9 6.63 77.4 4.02 22.7 5.10 e 3.68 83.92003 Average .................... 4.88 5.85 9.63 97.5 8.40 78.2 5.89 22.1 6.19 5.57 91.22004 Average .................... 5.46 6.65 10.75 97.7 9.43 78.0 6.53 23.6 7.16 6.11 89.82005 Average .................... 7.33 8.67 12.70 98.1 11.34 82.1 8.56 24.0 9.14 8.47 91.32006 Average .................... 6.39 8.61 13.73 98.1 12.00 80.8 7.87 23.4 8.72 7.11 93.42007 Average .................... 6.25 8.16 13.08 98.0 11.34 80.4 7.68 22.2 8.50 7.31 92.22008 Average .................... 7.97 9.18 13.89 97.5 12.23 79.7 9.65 20.4 11.75 9.26 101.12009 Average .................... 3.67 6.48 12.14 97.4 10.06 77.8 5.33 18.8 8.13 4.93 101.12010 Average .................... 4.48 6.18 11.39 97.4 9.47 77.5 5.49 18.0 6.25 5.27 100.82011 Average .................... 3.95 5.63 11.03 96.3 8.91 67.3 5.13 16.3 7.48 4.89 101.22012 Average .................... E 2.66 4.73 10.65 95.8 8.10 65.2 3.88 16.2 8.04 3.54 95.52013 Average .................... NA 4.88 10.32 95.7 8.08 65.8 4.64 16.6 9.76 4.49 94.92014 Average .................... NA 5.71 10.97 95.5 8.90 65.8 5.62 15.9 NA 5.19 94.62015 Average .................... NA 4.26 10.38 95.6 7.91 65.7 3.93 14.8 NA 3.38 94.6
2016 January ...................... NA 3.39 8.28 96.0 6.75 70.4 3.62 15.4 NA 3.18 95.1 February .................... NA 3.48 8.36 95.8 6.86 69.4 3.58 15.8 NA 2.83 95.2 March ......................... NA 3.49 9.19 95.6 7.08 66.7 3.02 15.5 NA 2.33 95.7 April ........................... NA 3.22 9.65 95.6 6.98 65.0 3.00 14.6 NA 2.52 95.9 May ............................ NA 3.44 11.62 95.4 7.32 60.2 2.90 14.7 NA 2.49 96.0 June ........................... NA 3.84 14.43 95.7 7.72 58.0 2.89 14.7 NA 2.77 95.7 July ............................ NA 4.42 16.56 95.9 8.14 56.9 3.57 14.3 NA 3.07 95.4 August ....................... NA 4.33 17.60 95.8 8.30 54.7 3.59 14.7 NA 3.07 95.6 September ................. NA 4.60 16.78 96.0 8.28 56.2 3.74 14.6 NA 3.18 95.7 October ...................... NA 4.19 13.74 95.9 7.96 59.9 3.87 14.5 NA 3.23 95.4 November .................. NA 3.90 10.77 96.0 7.67 63.5 3.86 14.6 NA 3.14 95.5 December .................. NA 3.96 9.06 96.0 7.27 68.2 4.27 15.0 NA 4.15 95.4 Average .................... NA 3.71 10.05 95.8 7.28 64.8 3.51 14.9 NA 2.99 95.6
2017 January ...................... NA 4.21 9.32 95.9 7.58 70.5 4.87 15.0 NA 4.31 94.6 February .................... NA 4.13 10.01 95.8 7.89 69.0 4.56 14.9 NA 3.72 95.5 March ......................... NA 3.84 9.86 95.7 7.68 67.7 3.94 14.9 NA 3.51 95.6 April ........................... NA 4.20 11.34 95.2 8.04 65.0 4.13 14.5 NA 3.50 96.0 May ............................ NA 4.42 13.26 95.5 8.31 60.8 4.03 13.9 NA 3.61 96.8 June ........................... NA 4.82 16.06 94.4 8.75 58.2 4.06 14.5 NA 3.40 96.0 July ............................ NA 4.73 17.86 95.8 8.81 57.2 3.93 14.6 NA 3.32 95.1 August ....................... NA 4.61 18.22 95.6 8.76 55.9 3.79 14.2 NA 3.24 95.6 September ................. NA 4.52 16.92 96.1 8.52 56.2 3.84 13.7 NA 3.27 95.1 October ...................... NA 4.03 13.36 96.4 7.97 61.5 3.79 14.2 NA 3.24 95.2 November .................. NA 3.97 10.15 96.0 7.51 65.8 3.85 14.5 NA 3.50 94.9 December .................. NA 4.00 9.29 96.5 7.42 69.1 4.21 15.0 NA 3.81 94.8 Average .................... NA 4.16 10.91 95.9 7.88 65.4 4.10 14.5 NA 3.51 95.4
2018 January ...................... NA 4.29 8.91 96.1 7.43 71.2 4.48 15.0 NA 5.35 87.6 February .................... NA 3.99 9.63 96.0 7.82 69.1 4.86 14.6 NA 3.74 86.8 March ......................... NA 3.71 9.78 95.9 7.74 68.4 4.02 15.0 NA 3.32 88.2 April ........................... NA 3.64 10.04 95.6 7.63 R 65.4 3.90 14.8 NA 3.25 88.5 May ............................ NA 4.12 R 13.64 94.8 R 8.46 59.7 3.81 13.9 NA 3.15 85.4 June ........................... NA 4.46 16.51 95.7 R 8.66 R 57.4 3.78 13.8 NA 3.21 87.7 July ............................ NA 4.69 17.92 95.8 8.93 56.1 3.76 13.7 NA R 3.41 R 84.9 August ....................... NA 4.84 18.63 95.6 8.74 54.8 3.67 13.9 NA 3.39 R 86.1 September ................. NA 4.71 17.32 96.2 8.64 56.5 3.75 13.8 NA 3.21 86.7 October ...................... NA R 4.10 12.26 96.5 7.71 R 61.0 4.04 13.8 NA 3.50 R 88.4 November .................. NA R 4.29 9.43 96.4 R 7.35 66.5 4.51 14.2 NA 4.32 R 88.8 December .................. NA 4.74 9.63 96.2 7.75 67.8 5.46 14.3 NA 4.89 91.6 Average .................... NA 4.21 10.52 96.0 7.83 65.5 4.20 14.2 NA 3.68 87.3
a Prices are not adjusted for inflation. See "Nominal Dollars" in Glossary.b See Note 8, "Natural Gas Prices," at end of section.c Commercial sector, including commercial combined-heat-and-power (CHP)
and commercial electricity-only plants. See Note 2, "Classification of Power PlantsInto Energy-Use Sectors," at end of Section 7.
d Industrial sector, including industrial combined-heat-and-power (CHP) andindustrial electricity-only plants. See Note 2, "Classification of Power Plants IntoEnergy-Use Sectors," at end of Section 7.
e The electric power sector comprises electricity-only andcombined-heat-and-power (CHP) plants within the NAICS 22 category whoseprimary business is to sell electricity, or electricity and heat, to the public.Through 2001, data are for electric utilities only; beginning in 2002, data alsoinclude independent power producers.
f See "Natural Gas Wellhead Price" in Glossary.g See "Citygate" in Glossary.h Includes taxes.i The percentage of the sector’s consumption in Table 4.3 for which price data
are available. For details on how the percentages are derived, see Table 9.10sources at end of section.
j Much of the natural gas delivered for vehicle fuel represents deliveries tofueling stations that are used primarily or exclusively by fleet vehicles. Thus, theprices are often those associated with the cost of gas in the operation of fleetvehicles.
k Percentages exceed 100% when reported natural gas receipts are greaterthan reported natural gas consumption—this can occur whencombined-heat-and-power plants report fuel receipts related to non-electricgenerating activities.
R=Revised. NA=Not available. E=Estimate. Notes: • Prices are for natural gas, plus a small amount of supplemental
gaseous fuels. • Prices are intended to include all taxes. See Note 8, "NaturalGas Prices," at end of section. • Wellhead annual and year-to-date prices aresimple averages of the monthly prices; all other annual and year-to-date prices arevolume-weighted averages of the monthly prices. • Geographic coverage is the 50states and the District of Columbia.
Web Page: See http://www.eia.gov/totalenergy/data/monthly/#prices (Excel andCSV files) for all available annual data beginning in 1949 and monthly databeginning in 1976.
Sources: See end of section.

166 U. S. Energy Information Administration / Monthly Energy Review March 2019
Energy Prices Note 1. Crude Oil Refinery Acquisition Costs. Beginning with January 1981, refiner acquisition costs of crude oil are
from data collected on U.S. Energy Information Administration (EIA) Form EIA‐14, "Refiners' Monthly Cost Report."
Those costs were previously published from data collected on Economic Regulatory Administration (ERA) Form ERA‐49,
"Domestic Crude Oil Entitlements Program Refiners Monthly Report." Form ERA‐49 was discontinued with the decontrol
of crude oil on January 28, 1981. Crude oil purchases and costs are defined for Form EIA‐14 in accordance with
conventions used for Form ERA‐49. The respondents for the two forms are also essentially the same. However, due to
possible different interpretations of the filing requirements and a different method for handling prior period
adjustments, care must be taken when comparing the data collected on the two forms.
The refiner acquisition cost of crude oil is the average price paid by refiners for crude oil booked into their refineries in
accordance with accounting procedures generally accepted and consistently and historically applied by the refiners
concerned. Domestic crude oil is that oil produced in the United States or from the outer continental shelf as defined in
43 USC Section 1331. Imported crude oil is either that oil reported on Form ERA‐51, "Transfer Pricing Report," or any
crude oil that is not domestic oil. The composite cost is the weighted average of domestic and imported crude oil costs.
Crude oil costs and volumes reported on Form ERA‐49 excluded unfinished oils but included the Strategic Petroleum
Reserve (SPR). Crude oil costs and volumes reported on Federal Energy Administration (FEA) Form FEA‐P110‐M‐1,
"Refiners' Monthly Cost Allocation Report," included unfinished oils but excluded SPR. Imported averages derived from
Form ERA‐49 exclude oil purchased for SPR, whereas the composite averages derived from Form ERA‐49 include SPR.
None of the prices derived from Form EIA‐14 include either unfinished oils or SPR.
Note 2. Crude Oil Domestic First Purchase Prices. The average domestic first purchase price represents the average
price at which all domestic crude oil is purchased. Crude oil domestic first purchase prices were derived as follows: for
1949–1973, weighted average domestic first purchase values as reported by state agencies and calculated by the Bureau
of Mines; for 1974 and 1975, weighted averages of a sample survey of major first purchasers' purchases; for 1976
forward, weighted averages of all first purchasers' purchases. The data series was previously called "Actual Domestic
Wellhead Price."
Note 3. Crude Oil F.O.B. Costs. F.O.B. literally means "Free on Board." It denotes a transaction whereby the seller
makes the product available with an agreement on a given port at a given price; it is the responsibility of the buyer to
arrange for the transportation and insurance.
Note 4. Crude Oil Landed Costs. The landed cost of imported crude oil from selected countries does not represent the
total cost of all imported crude. Prior to April 1975, imported crude costs to U.S. company‐owned refineries in the
Caribbean were not included in the landed cost, and costs of crude oil from countries that export only small amounts to
the United States were also excluded. Beginning in April 1975, however, coverage was expanded to include U.S.
company‐owned refineries in the Caribbean. Landed costs do not include supplemental fees.
Note 5. Motor Gasoline Prices. Several different series of motor gasoline prices are published in this section. U.S. city
average retail prices of motor gasoline by grade are calculated monthly by the Bureau of Labor Statistics during the
development of the Consumer Price Index (CPI). These prices include all federal, state, and local taxes paid at the time of
sale. Prior to 1977, prices were collected in 56 urban areas. From 1978 forward, prices are collected from a new sample
of service stations in 85 urban areas selected to represent all urban consumers—about 80 percent of the total U.S.
population. The service stations are selected initially, and on a replacement basis, in such a way that they represent the
purchasing habits of the CPI population. Service stations in the current sample include those providing all types of
service (i.e., full‐, mini‐, and self‐serve).
Regular motor gasoline prices by area type are determined by EIA in a weekly survey of retail motor gasoline outlets
(Form EIA‐878, "Motor Gasoline Price Survey"). Prices include all federal, state, and local taxes paid at the time of sale.
A representative sample of outlets by geographic area and size is randomly selected from a sampling frame of
approximately 115,000 retail motor gasoline outlets. Monthly and annual prices are simple averages of weighted

U. S. Energy Information Administration / Monthly Energy Review March 2019 167
weekly estimates from "Weekly U.S. Retail Gasoline Prices, Regular Grade." For more information on the survey
methodology, see EIA, Weekly Petroleum Status Report, Appendix B, "Weekly Petroleum Price Surveys" section.
Refiner prices of finished motor gasoline for resale and to end users are determined by EIA in a monthly survey of
refiners and gas plant operators (Form EIA‐782A). The prices do not include any federal, state, or local taxes paid at the
time of sale. Estimates of prices prior to January 1983 are based on Form FEA‐P302‐M‐1/EIA‐460, "Petroleum Industry
Monthly Report for Product Prices," and also exclude all federal, state, or local taxes paid at the time of sale. Sales for
resale are those made to purchasers who are other‐than‐ultimate consumers. Sales to end users are sales made directly
to the consumer of the product, including bulk consumers (such as agriculture, industry, and utilities) and residential and
commercial consumers.
Note 6. Historical Petroleum Prices. Starting in January 1983, Form EIA‐782, "Monthly Petroleum Product Sales
Report," replaced 10 previous surveys. Every attempt was made to continue the most important price series. However,
prices published through December 1982 and those published since January 1983 do not necessarily form continuous
data series due to changes in survey forms, definitions, instructions, populations, samples, processing systems, and
statistical procedures. To provide historical data, continuous series were generated for annual data 1978–1982 and for
monthly data 1981 and 1982 by estimating the prices that would have been published had Form EIA‐782 survey and
system been in operation at that time. This form of estimation was performed after detailed adjustment was made for
product and sales type matching and for discontinuity due to other factors. An important difference between the
previous and present prices is the distinction between wholesale and resale and between retail and end user. The resale
category continues to include sales among resellers. However, sales to bulk consumers, such as utility, industrial, and
commercial accounts previously included in the wholesale category, are now counted as made to end users. The end‐
user category continues to include retail sales through company‐owned and operated outlets but also includes sales to
the bulk consumers such as agriculture, industry, and electric utilities. Additional information may be found in
"Estimated Historic Time Series for the EIA‐782," a feature article by Paula Weir, printed in the December 1983 [3]
Petroleum Marketing Monthly, published by EIA.
Note 7. Electricity Retail Prices. Average annual retail prices of electricity have the following plant coverage: Through
1979, annual data are for Classes A and B privately owned electric utilities only. For 1980–1982, annual data are for
selected Class A utilities whose electric operating revenues were $100 million or more during the previous year. For
1983, annual data are for a selected sample of electric utilities. Beginning in 1984, data are for a census of electric
utilities. Beginning in 1996, annual data also include energy service providers selling to retail customers.
Average monthly retail prices of electricity have the following plant coverage: Through 1985, monthly data are derived
from selected privately owned electric utilities and, therefore, are not national averages. Beginning in 1986, monthly
data are based on a sample of publicly and privately owned electric utilities. Beginning in 1996, monthly data also
include energy service providers selling to retail customers.
Preliminary monthly data are from Form EIA‐861M (formerly Form EIA‐826), "Monthly Electric Power Industry Report,"
which is a monthly collection of data from approximately 450 of the largest publicly and privately owned electric utilities
as well as a census of energy service providers with retail sales in deregulated states; a model is then applied to the
collected data to estimate for the entire universe of U.S. electric utilities. Preliminary annual data are the sum of the
monthly revenues divided by the sum of the monthly sales. When final annual data become available each year from
Form EIA‐861, "Annual Electric Power Industry Report," their ratios to the preliminary Form EIA‐861M values are used to
derive adjusted final monthly values.
Note 8. Natural Gas Prices. Natural gas prices are intended to include all taxes. Instructions on the data collection
forms specifically direct that all federal, state, and local taxes, surcharges, and/or adjustments billed to consumers are to
be included. However, sales and other taxes itemized on more than 3,000 consumers' bills are sometimes excluded by
the reporting utilities. Delivered‐to‐consumers prices for 1987 forward represent natural gas delivered and sold to
residential, commercial, industrial, vehicle fuel, and electric power consumers. They do not include the price of natural

168 U. S. Energy Information Administration / Monthly Energy Review March 2019
gas delivered on behalf of third parties to residential, commercial, industrial, and vehicle fuel customers except for
certain states in the residential and commercial sectors for 2002 forward. Volumes of natural gas delivered on behalf of
third parties are included in the consumption data shown in Table 4.3. Additional information is available in EIA, Natural
Gas Monthly, Appendix C.
Table 9.1 Sources
Domestic First Purchase Price 1949–1976: U.S. Department of the Interior (DOI), Bureau of Mines (BOM), Minerals Yearbook, "Crude Petroleum and
Petroleum Products" chapter.
1977: Federal Energy Administration, based on Form FEA‐P124, "Domestic Crude Oil Purchaser's Monthly Report."
1978–2009: U.S. Energy Information Administration (EIA), Petroleum Marketing Annual 2009, Table 1.
2010 forward: EIA, Petroleum Marketing Monthly, March 2019, Table 1.
F.O.B. and Landed Cost of Imports October 1973–September 1977: Federal Energy Administration, Form FEA‐F701‐M‐0, "Transfer Pricing Report."
October–December 1977: EIA, Form FEA‐F701‐M‐0, "Transfer Pricing Report."
1978–2009: EIA, Petroleum Marketing Annual 2009, Table 1.
2010 forward: EIA, Petroleum Marketing Monthly, March 2019, Table 1.
Refiner Acquisition Cost 1968–1973: EIA estimates. The cost of domestic crude oil was derived by adding estimated transportation costs to the
reported average domestic first purchase price. The cost of imported crude oil was derived by adding an estimated
ocean transport cost based on the published "Average Freight Rate Assessment" to the average "Free Alongside Ship"
value published by the U.S. Census Bureau.
1974–1976: DOI, BOM, Minerals Yearbook, "Crude Petroleum and Petroleum Products" chapter.
1977: January–September, FEA, based on Form FEA‐P110‐M‐1, "Refiners' Monthly Cost Allocation Report."
1977: October–December, EIA, based on Form FEA‐P110‐M‐1, "Refiners' Monthly Cost Allocation Report."
1978–2009: EIA, Petroleum Marketing Annual 2009, Table 1.
2010 forward: EIA, Petroleum Marketing Monthly, March 2019, Table 1.
Table 9.2 Sources
October 1973–September 1977: Federal Energy Administration, Form FEA‐F701‐M‐0, "Transfer Pricing Report."
October 1977–December 1977: U.S. Energy Information Administration (EIA), Form FEA‐F701‐M‐0, "Transfer Pricing
Report."
1978–2009: EIA, Petroleum Marketing Annual 2009, Table 21.
2010 forward: EIA, Petroleum Marketing Monthly, March 2019, Table 21.
Table 9.9 Sources
1973–September 1977: Federal Power Commission, Form FPC‐423, "Monthly Report of Cost and Quality of Fuels for

U. S. Energy Information Administration / Monthly Energy Review March 2019 169
Electric Utility Plants." October 1977–December 1977: Federal Energy Regulatory Commission, Form FERC‐423,
"Monthly Report of Cost and Quality of Fuels for Electric Utility Plants."
1978 and 1979: U.S. Energy Information Administration (EIA), Form FERC‐423, "Monthly Report of Cost and Quality of
Fuels for Electric Utility Plants."
1980–1989: EIA, Electric Power Monthly, May issues.
1990–2000: EIA, Electric Power Monthly, March 2003, Table 26.
2001–2007: EIA, Electric Power Monthly, October 2008, Table 4.1; Federal Energy Regulatory Commission, Form
FERC‐423, "Monthly Report of Cost and Quality of Fuels for Electric Utility Plants"; and EIA, Form EIA‐423, "Monthly Cost
and Qualit
y of Fuels for Electric Plants Report."
2008 forward: EIA, Electric Power Monthly, February 2019, Table 4.1; and Form EIA‐923, "Power Plant Operations
Report."
Table 9.10 Sources
All Prices Except Vehicle Fuel and Electric Power 1949–2015: U.S. Energy Information Administration (EIA), Natural Gas Annual (NGA), annual reports and unpublished
revisions.
2016 forward: EIA, Natural Gas Monthly (NGM), February 2019, Table 3.
Vehicle Fuel Price 1989–2013: EIA, NGA, annual reports.
Electric Power Sector Price 1967–1972: EIA, NGA, annual reports.
1973–1998: EIA, NGA 2000, Table 96.
1999–2002: EIA, NGM, November 2004, Table 4.
2003–2007: Federal Energy Regulatory Commission, Form FERC‐423, "Monthly Report of Cost and Quality of Fuels for
Electric Utility Plants," and EIA, Form EIA‐423 "Monthly Cost and Quality of Fuels for Electric Plants Report."
2008 forward: Form EIA‐923, "Power Plant Operations Report."
Percentage of Residential Sector 1989–2013: EIA, Form EIA‐176, "Annual Report of Natural and Supplemental Gas Supply and Disposition." Calculated as
the total amount of natural gas delivered to residential consumers minus the amount delivered for the account of
others, and then divided by the total amount delivered to residential consumers.
2014 forward: EIA, Form EIA‐857, "Monthly Report of Natural Gas Purchases and Deliveries to Consumers."
Percentage of Commercial Sector 1987–2015: EIA, NGA, annual reports. Calculated as the total amount of natural gas delivered to commercial consumers
minus the amount delivered for the account of others, and then divided by the total amount delivered to commercial
consumers.
2016 forward: EIA, NGM, February 2019, Table 3.

170 U. S. Energy Information Administration / Monthly Energy Review March 2019
Percentage of Industrial Sector 1982–2015: EIA, NGA, annual reports. Calculated as the total amount of natural gas delivered to industrial consumers
minus the amount delivered for the account of others, and then divided by the total amount delivered to industrial
consumers.
2016 forward: EIA, NGM, February 2019, Table 3.
Percentage of Electric Power Sector 1973–2001: Calculated by EIA as the quantity of natural gas receipts by electric utilities reported on Form FERC‐423,
"Monthly Report of Cost and Quality of Fuels for Electric Utility Plants" (and predecessor forms) divided by the quantity
of natural gas consumed by the electric power sector (for 1973 –1988, see Monthly Energy Review (MER), Table 7.3b; for
1989–2001, see MER, Table 7.4b).
2002–2007: Calculated by EIA as the quantity of natural gas receipts by electric utilities and independent power
producers reported on Form FERC‐423, "Monthly Report of Cost and Quality of Fuels for Electric Utility Plants," and EIA‐
423, "Monthly Cost and Quality of Fuels for Electric Plants Report," divided by the quantity of natural gas consumed by
the electric power sector (see MER, Table 7.4b).
2008 forward: Calculated by EIA as the quantity of natural gas receipts by electric utilities and independent power
producers reported on Form EIA‐923, "Power Plant Operations Report," divided by the quantity of natural gas consumed
by the electric power sector (see MER, Table 7.4b).

10. Renewable
Energy

172 U. S. Energy Information Administration / Monthly Energy Review March 2019
Figure 10.1 Renewable Energy Consumption (Quadrillion Btu)
Hydroelectric Power [b]
Biomass [a]
Solar [a] Wind [a]
0
2
4
6
1950 1955 1960 1965 1970 1975 1980 1985 1990 1995 2000 2005 2010 2015
Major Sources, 1949–2018
2.7
2.52.4
2.3
0.9
0.5
0.2
0
1
2
3
HydroelectricPower [b]
Wind [a] Wood [a] Biofuels [a] Solar [a] Waste [a] Geothermal [a]
By Source, 2018
0.8
0.3
2.6
1.4
6.5
0
2
4
6
8
Residential Commercial Industrial Transportation ElectricPower
By Sector, 2018
Nuclear Electric Power Renewable Energy
Fossil Fuels
0
20
40
60
80
100
1950 1955 1960 1965 1970 1975 1980 1985 1990 1995 2000 2005 2010 2015
Compared With Other Resources, 1949–2018
[a] See Table 10.1 for definition. [b] Conventional hydroelectric power.
Web Page: http://www.eia.gov/totalenergy/data/monthly/#renewable.
Sources: Tables 1.3 and 10.1–10.2c.

U. S. Energy Information Administration / Monthly Energy Review March 2019 173
Table 10.1 Renewable Energy Production and Consumption by Source (Trillion Btu)
Productiona Consumption
Biomass TotalRenew-
ableEnergyd
Hydro-electricPowere
Geo-thermalf Solarg Windh
Biomass TotalRenew-
ableEnergy
Bio-fuelsb Totalc Woodi Wastej
Bio-fuelsk Total
1950 Total .................... NA 1,562 2,978 1,415 NA NA NA 1,562 NA NA 1,562 2,9781955 Total .................... NA 1,424 2,784 1,360 NA NA NA 1,424 NA NA 1,424 2,7841960 Total .................... NA 1,320 2,928 1,608 (s) NA NA 1,320 NA NA 1,320 2,9281965 Total .................... NA 1,335 3,396 2,059 2 NA NA 1,335 NA NA 1,335 3,3961970 Total .................... NA 1,431 4,070 2,634 6 NA NA 1,429 2 NA 1,431 4,0701975 Total .................... NA 1,499 4,687 3,155 34 NA NA 1,497 2 NA 1,499 4,6871980 Total .................... NA 2,475 5,428 2,900 53 NA NA 2,474 2 NA 2,475 5,4281985 Total .................... 93 3,016 6,084 2,970 97 (s) (s) 2,687 236 93 3,016 6,0841990 Total .................... 111 2,735 6,040 3,046 171 59 29 2,216 408 111 2,735 6,0401995 Total .................... 198 3,099 6,557 3,205 152 68 33 2,370 531 200 3,101 6,5592000 Total .................... 233 3,006 6,102 2,811 164 63 57 2,262 511 236 3,008 6,1042001 Total .................... 254 2,624 5,162 2,242 164 62 70 2,006 364 253 2,622 5,1602002 Total .................... 308 2,705 5,731 2,689 171 60 105 1,995 402 303 2,701 5,7262003 Total .................... 401 2,805 5,942 2,793 173 58 113 2,002 401 403 2,806 5,9442004 Total .................... 486 2,996 6,063 2,688 178 58 142 2,121 389 498 3,008 6,0752005 Total .................... 561 3,101 6,221 2,703 181 58 178 2,137 403 574 3,114 6,2332006 Total .................... 716 3,212 6,586 2,869 181 61 264 2,099 397 766 3,262 6,6372007 Total .................... 970 3,472 6,510 2,446 186 65 341 2,089 413 983 3,485 6,5232008 Total .................... 1,374 3,868 7,191 2,511 192 74 546 2,059 435 1,357 3,851 7,1742009 Total .................... 1,570 3,957 7,624 2,669 200 78 721 1,935 452 1,553 3,940 7,6082010 Total .................... 1,868 4,553 8,313 2,539 208 90 923 2,217 468 1,821 4,506 8,2662011 Total .................... 2,029 4,704 9,298 3,103 212 111 1,168 2,213 462 1,934 4,609 9,2032012 Total .................... 1,929 4,547 8,884 2,629 212 157 1,340 2,151 467 1,890 4,508 8,8452013 Total .................... 1,981 4,816 9,418 2,562 214 225 1,601 2,338 496 2,014 4,848 9,4512014 Total .................... 2,103 5,020 9,766 2,467 214 337 1,728 2,401 516 2,077 4,994 9,7402015 Total .................... 2,161 4,992 9,728 2,321 212 426 1,777 2,312 518 2,153 4,983 9,719
2016 January ................ 185 425 875 236 18 26 170 193 42 173 408 859 February .............. 176 404 865 223 17 35 186 181 40 173 395 855 March ................... 190 425 942 253 18 43 203 186 44 187 416 932 April ..................... 175 396 891 239 16 48 192 174 43 175 392 887 May ...................... 189 420 902 235 18 55 174 181 43 193 417 899 June ..................... 189 421 859 215 17 56 151 183 40 192 415 853 July ...................... 196 431 870 198 17 61 163 189 41 202 432 872 August ................. 198 437 822 181 18 61 125 191 42 205 438 823 September ........... 187 413 788 151 17 55 151 180 39 193 412 787 October ................ 194 421 835 160 18 49 188 180 41 196 417 831 November ............ 192 423 835 174 18 41 179 183 43 195 421 833 December ............ 203 464 941 208 19 37 214 209 45 204 457 935 Total .................... 2,275 5,081 10,427 2,472 210 569 2,096 2,230 503 2,287 5,020 10,366
2017 January ................ 197 445 926 247 18 33 183 196 45 181 422 904 February .............. 177 398 867 218 16 40 195 176 40 168 383 852 March ................... 197 442 1,022 270 18 62 230 194 43 191 429 1,009 April ..................... 183 412 997 271 18 69 227 183 41 185 408 993 May ...................... 197 432 1,035 298 17 81 207 188 41 202 431 1,034 June ..................... 192 427 990 278 16 86 183 188 40 199 428 991 July ...................... 196 439 932 244 18 83 147 197 41 196 434 926 August ................. 203 450 874 201 18 79 125 199 41 205 445 869 September ........... 192 421 852 176 17 73 164 183 38 190 411 842 October ................ 201 438 924 168 17 68 233 190 40 196 427 913 November ............ 203 443 921 189 17 50 222 191 42 194 426 905 December ............ 205 458 959 206 20 49 226 200 43 195 439 940 Total .................... 2,344 5,204 11,298 2,767 210 774 2,343 2,285 495 2,304 5,084 11,179
2018 January ................ 198 451 1,002 236 18 50 R 247 203 44 191 437 R 988 February .............. 182 R 418 R 950 235 17 58 222 186 41 165 R 391 924 March ................... 200 448 1,032 239 18 R 75 251 198 44 191 R 433 1,018 April ..................... 190 429 R 1,034 253 17 89 247 190 41 179 411 R 1,016 May ...................... 201 R 444 1,060 280 19 99 217 198 41 199 R 437 1,053 June ..................... 200 445 1,051 258 18 107 R 225 196 40 193 429 1,036 July ...................... 210 459 946 221 19 100 148 203 40 200 442 R 929 August ................. 212 464 958 197 19 99 180 203 40 205 448 R 943 September ........... 193 428 874 172 18 90 166 190 36 182 R 408 854 October ................ 204 R 451 R 912 173 18 75 195 196 41 196 433 894 November ............ 198 R 440 R 928 204 18 58 207 R 192 41 R 187 R 421 R 908 December ............ 200 453 969 219 19 50 229 202 43 191 436 952 Total .................... 2,389 5,329 11,716 2,688 217 949 2,533 2,357 492 2,279 5,128 11,515
a For hydroelectric power, geothermal, solar, wind, and biomass waste,production equals consumption. For biofuels, production equals total biomassinputs to the production of fuel ethanol and biodiesel. For wood, through 2015,production equals consumption; beginning in 2016, production equals consumptionplus densified biomass exports.
b Total biomass inputs to the production of fuel ethanol and biodiesel.c Wood and wood-derived fuels, biomass waste, and total biomass inputs to the
production of fuel ethanol and biodiesel.d Hydroelectric power, geothermal, solar, wind, and biomass.e Conventional hydroelectricity net generation (converted to Btu by multiplying
by the total fossil fuels heat rate factors in Table A6).f Geothermal electricity net generation (converted to Btu by multiplying by the
total fossil fuels heat rate factors in Table A6), and geothermal heat pump anddirect use energy.
g Solar photovoltaic (PV) and solar thermal electricity net generation (convertedto Btu by multiplying by the total fossil fuels heat rate factors in Table A6), and solarthermal direct use energy.
h Wind electricity net generation (converted to Btu by multiplying by the totalfossil fuels heat rate factors in Table A6).
i Wood and wood-derived fuels.
j Municipal solid waste from biogenic sources, landfill gas, sludge waste,agricultural byproducts, and other biomass. Through 2000, also includesnon-renewable waste (municipal solid waste from non-biogenic sources, andtire-derived fuels).
k Fuel ethanol (minus denaturant), biodiesel, other renewable diesel fuel, andother renewable fuels consumption; plus losses and co-products from theproduction of fuel ethanol and biodiesel.
R=Revised. NA=Not available. (s)=Less than 0.5 trillion Btu.Notes: • Production data are estimates. Consumption data are estimates,
except for hydroelectric power in 1949–1978 and 1989 forward, and wind. • SeeNote, "Renewable Energy Production and Consumption," at end of section.• Totals may not equal sum of components due to independent rounding.• Geographic coverage is the 50 states and the District of Columbia.
Web Page: See http://www.eia.gov/totalenergy/data/monthly/#renewable (Exceland CSV files) for all available annual data beginning in 1949 and monthly databeginning in 1973.
Sources: • Production: Tables 10.2a–10.4 and U.S. Energy InformationAdministration, Form EIA-63C, "Densified Biomass Fuel Report."• Consumption: Tables 10.2a–10.2c.

174 U. S. Energy Information Administration / Monthly Energy Review March 2019
Table 10.2a Renewable Energy Consumption: Residential and Commercial Sectors (Trillion Btu)
Residential Sector Commercial Sectora
Geo-thermalb Solarc
Biomass
Total
Hydro-electricPowere
Geo-thermalb Solarf Windg
Biomass
TotalWoodd Woodd WastehFuel
Ethanoli,j Total
1950 Total .................... NA NA 1,006 1,006 NA NA NA NA 19 NA NA 19 191955 Total .................... NA NA 775 775 NA NA NA NA 15 NA NA 15 151960 Total .................... NA NA 627 627 NA NA NA NA 12 NA NA 12 121965 Total .................... NA NA 468 468 NA NA NA NA 9 NA NA 9 91970 Total .................... NA NA 401 401 NA NA NA NA 8 NA NA 8 81975 Total .................... NA NA 425 425 NA NA NA NA 8 NA NA 8 81980 Total .................... NA NA 850 850 NA NA NA NA 21 NA NA 21 211985 Total .................... NA NA 1,010 1,010 NA NA NA NA 24 NA (s) 24 241990 Total .................... 6 55 580 640 1 3 (s) – 66 28 (s) 94 981995 Total .................... 7 63 520 589 1 5 (s) – 72 40 (s) 113 1192000 Total .................... 9 58 420 486 1 8 1 – 71 47 (s) 119 1282001 Total .................... 9 55 370 435 1 8 1 – 67 25 (s) 92 1012002 Total .................... 10 53 380 443 (s) 9 1 – 69 26 (s) 95 1052003 Total .................... 13 52 400 465 1 11 1 – 71 29 1 101 1142004 Total .................... 14 51 410 475 1 12 1 – 70 34 1 105 1202005 Total .................... 16 50 430 496 1 14 2 – 70 34 1 105 1212006 Total .................... 18 53 380 451 1 14 2 – 65 36 1 103 1202007 Total .................... 22 55 420 497 1 14 4 – 70 31 2 103 1212008 Total .................... 26 58 470 555 1 15 6 – 73 34 2 109 1302009 Total .................... 33 60 504 597 1 17 7 (s) 73 36 3 112 1372010 Total .................... 37 65 541 642 1 19 11 (s) 72 36 3 111 1422011 Total .................... 40 71 524 635 (s) 20 19 (s) 69 43 3 115 1542012 Total .................... 40 79 438 557 (s) 20 32 1 61 45 3 108 1612013 Total .................... 40 91 572 703 (s) 20 41 1 70 47 3 120 1822014 Total .................... 40 109 579 727 (s) 20 52 1 76 47 4 127 2002015 Total .................... 40 127 513 680 (s) 20 57 1 79 47 j 26 152 230
2016 January ................ 3 8 38 49 (s) 2 3 (s) 7 4 2 13 19 February .............. 3 10 35 48 (s) 2 4 (s) 7 4 2 12 18 March ................... 3 13 38 54 (s) 2 5 (s) 7 4 2 13 20 April ..................... 3 14 37 54 (s) 2 6 (s) 7 4 2 13 20 May ...................... 3 16 38 57 (s) 2 6 (s) 7 4 2 13 21 June ..................... 3 17 37 56 (s) 2 6 (s) 7 4 2 13 21 July ...................... 3 17 38 58 (s) 2 6 (s) 7 4 2 14 22 August ................. 3 17 38 58 (s) 2 6 (s) 7 4 2 14 22 September ........... 3 15 37 55 (s) 2 6 (s) 7 4 2 13 20 October ................ 3 13 38 55 (s) 2 5 (s) 7 4 2 13 20 November ............ 3 11 37 51 (s) 2 4 (s) 7 4 2 13 19 December ............ 3 10 38 51 (s) 2 4 (s) 7 4 2 13 19 Total .................... 40 160 448 647 2 20 62 1 84 48 26 158 242
2017 January ................ 3 10 37 50 (s) 2 4 (s) 7 4 2 14 20 February .............. 3 11 33 47 (s) 2 4 (s) 7 4 2 12 18 March ................... 3 16 37 56 (s) 2 6 (s) 7 4 2 13 21 April ..................... 3 18 36 56 (s) 2 7 (s) 7 4 2 13 22 May ...................... 3 19 37 59 (s) 2 8 (s) 7 4 2 13 23 June ..................... 3 20 36 59 (s) 2 8 (s) 7 4 2 13 23 July ...................... 3 20 37 61 (s) 2 8 (s) 7 4 2 13 23 August ................. 3 20 37 60 (s) 2 8 (s) 7 4 2 13 23 September ........... 3 18 36 57 (s) 2 7 (s) 7 4 2 R 12 21 October ................ 3 16 37 56 (s) 2 6 (s) 7 4 2 13 21 November ............ 3 12 36 51 (s) 2 5 (s) 7 4 2 13 20 December ............ 3 12 37 52 (s) 2 5 (s) 7 4 2 R 13 20 Total .................... 40 191 433 664 2 20 76 1 84 48 R 25 R 156 R 255
2018 January ................ 3 12 44 59 (s) 2 5 (s) 7 4 2 13 21 February .............. 3 13 40 56 (s) 2 6 (s) 7 4 2 12 20 March ................... 3 18 44 65 NM 2 8 (s) 7 4 2 13 23 April ..................... 3 20 43 66 (s) 2 9 (s) 7 4 2 12 23 May ...................... 3 23 44 70 NM 2 10 (s) 7 4 2 13 25 June ..................... 3 23 43 69 NM 2 10 (s) 7 4 2 13 25 July ...................... 3 24 44 71 NM 2 10 (s) 7 4 2 13 25 August ................. 3 23 44 70 NM 2 10 (s) 7 4 2 13 25 September ........... 3 20 43 66 (s) 2 9 (s) 7 3 2 12 23 October ................ 3 18 44 65 NM 2 8 (s) 7 4 2 13 23 November ............ 3 14 43 60 NM 2 6 (s) 7 4 2 13 21 December ............ 3 13 44 61 (s) 2 6 (s) 7 4 2 13 21 Total .................... 40 221 517 778 2 20 96 2 84 44 25 153 273
a Commercial sector, including commercial combined-heat-and-power (CHP)and commercial electricity-only plants. See Note 2, "Classification of Power PlantsInto Energy-Use Sectors," at end of Section 7.
b Geothermal heat pump and direct use energy.c Distributed (small-scale) solar photovoltaic (PV) electricity generation in the
residential sector (converted to Btu by multiplying by the fossil fuels heat ratefactors in Table A6) and distributed solar thermal energy in the residential,commercial, and industrial sectors. See Table 10.5.
d Wood and wood-derived fuels.e Conventional hydroelectricity net generation (converted to Btu by multiplying
by the total fossil fuels heat rate factors in Table A6).f Solar photovoltaic (PV) electricity net generation in the commercial sector
(converted to Btu by multiplying by the total fossil fuels heat rate factors in TableA6), both utility-scale and distributed (small-scale). See Table 10.5.
g Wind electricity net generation (converted to Btu by multiplying by the totalfossil fuels heat rate factors in Table A6).
h Municipal solid waste from biogenic sources, landfill gas, sludge waste,agricultural byproducts, and other biomass. Through 2000, also includesnon-renewable waste (municipal solid waste from non-biogenic sources, and
tire-derived fuels).i The fuel ethanol (minus denaturant) portion of motor fuels, such as E10,
consumed by the commercial sector.j There is a discontinuity in this time series between 2014 and 2015 due to a
change in the method for allocating motor gasoline consumption to the end-usesectors. Beginning in 2015, the commercial and industrial sector shares of fuelethanol consumption are larger than in 2014, while the transportation sector shareis smaller.
R=Revised. NA=Not available. NM=Not meaningful. – =No data reported.(s)=Less than 0.5 trillion Btu.
Notes: • Residential sector data are estimates. Commercial sector data areestimates, except for hydroelectric power, wind, and biomass waste. • Totals maynot equal sum of components due to independent rounding. • Geographiccoverage is the 50 states and the District of Columbia.
Web Page: See http://www.eia.gov/totalenergy/data/monthly/#renewable (Exceland CSV files) for all available annual data beginning in 1949 and monthly databeginning in 1973.
Sources: See end of section.

U. S. Energy Information Administration / Monthly Energy Review March 2019 175
Table 10.2b Renewable Energy Consumption: Industrial and Transportation Sectors (Trillion Btu)
Industrial Sectora Transportation Sector
Hydro-electricPowerb
Geo-thermalc Solard Winde
Biomass
Total
Biomass
Woodf WastegFuel
Ethanolh,i
Lossesand Co-
productsj TotalFuel
Ethanoli,kBio-
diesell Totalm
1950 Total .................... 69 NA NA NA 532 NA NA NA 532 602 NA NA NA1955 Total .................... 38 NA NA NA 631 NA NA NA 631 669 NA NA NA1960 Total .................... 39 NA NA NA 680 NA NA NA 680 719 NA NA NA1965 Total .................... 33 NA NA NA 855 NA NA NA 855 888 NA NA NA1970 Total .................... 34 NA NA NA 1,019 NA NA NA 1,019 1,053 NA NA NA1975 Total .................... 32 NA NA NA 1,063 NA NA NA 1,063 1,096 NA NA NA1980 Total .................... 33 NA NA NA 1,600 NA NA NA 1,600 1,633 NA NA NA1985 Total .................... 33 NA NA NA 1,645 230 1 42 1,918 1,951 50 NA 501990 Total .................... 31 2 (s) – 1,442 192 1 49 1,684 1,717 60 NA 601995 Total .................... 55 3 (s) – 1,652 195 2 86 1,934 1,992 112 NA 1122000 Total .................... 42 4 (s) – 1,636 145 1 99 1,881 1,928 135 NA 1352001 Total .................... 33 5 (s) – 1,443 129 3 108 1,681 1,719 141 1 1422002 Total .................... 39 5 (s) – 1,396 146 3 130 1,676 1,720 168 2 1702003 Total .................... 43 3 (s) – 1,363 142 4 168 1,678 1,725 228 2 2302004 Total .................... 33 4 (s) – 1,476 132 6 201 1,815 1,852 286 3 2902005 Total .................... 32 4 (s) – 1,452 148 7 227 1,834 1,871 327 12 3392006 Total .................... 29 4 1 – 1,472 130 10 280 1,892 1,926 442 33 4752007 Total .................... 16 5 1 – 1,413 145 10 369 1,937 1,958 557 45 6022008 Total .................... 17 5 1 – 1,339 143 12 519 2,012 2,035 786 39 8252009 Total .................... 18 4 2 – 1,178 154 13 603 1,948 1,972 894 41 9352010 Total .................... 16 4 3 – 1,409 168 17 727 2,320 2,343 1,041 33 1,0752011 Total .................... 17 4 4 (s) 1,438 165 17 756 2,375 2,401 1,045 113 1,1592012 Total .................... 22 4 7 (s) 1,462 159 17 711 2,349 2,382 1,045 115 1,1602013 Total .................... 33 4 9 (s) 1,489 187 18 709 2,403 2,449 1,072 182 1,2842014 Total .................... 12 4 11 1 1,495 190 14 757 2,456 2,484 1,093 181 1,3022015 Total .................... 13 4 14 (s) 1,476 190 i 18 776 2,460 2,491 i 1,110 191 1,334
2016 January ................ 1 (s) 1 (s) 127 15 1 66 209 212 88 13 104 February .............. 1 (s) 1 (s) 119 15 1 63 197 200 90 15 107 March ................... 1 (s) 2 (s) 121 16 2 67 206 210 96 17 116 April ..................... 1 (s) 2 (s) 115 15 1 61 193 196 89 18 110 May ...................... 1 (s) 2 (s) 121 15 2 66 204 207 97 23 123 June ..................... 1 (s) 2 (s) 121 13 2 66 202 205 97 21 122 July ...................... 1 (s) 2 (s) 124 14 2 69 208 211 99 27 129 August ................. 1 (s) 2 (s) 124 14 2 70 209 213 101 28 132 September ........... 1 (s) 2 (s) 117 13 1 66 197 200 94 26 123 October ................ 1 (s) 2 (s) 120 15 2 68 204 207 96 25 124 November ............ 1 (s) 1 (s) 122 15 1 67 206 208 95 26 124 December ............ 1 (s) 1 (s) 143 16 2 71 231 234 100 26 129 Total .................... 12 4 19 1 1,474 174 18 801 2,467 2,503 1,143 266 1,443
2017 January ................ 1 (s) 1 (s) 132 15 1 71 220 222 91 13 107 February .............. 1 (s) 1 (s) 118 14 1 63 196 199 84 14 101 March ................... 1 (s) 2 (s) 129 15 2 70 216 220 96 19 118 April ..................... 1 (s) 2 (s) 123 14 1 64 203 207 94 21 117 May ...................... 1 (s) 2 (s) 127 14 2 69 211 215 100 25 129 June ..................... 1 (s) 2 (s) 128 12 2 67 208 212 100 25 129 July ...................... 1 (s) 2 (s) 133 13 2 68 216 219 99 24 125 August ................. 1 (s) 2 (s) 134 13 2 71 220 223 103 26 131 September ........... 1 (s) 2 (s) 123 13 2 67 R 204 207 96 22 120 October ................ 1 (s) 2 (s) 128 14 2 70 214 217 99 22 123 November ............ 1 (s) 1 (s) 129 15 2 71 216 219 97 21 120 December ............ 1 (s) 1 (s) 135 15 2 71 223 226 97 21 120 Total .................... 13 4 22 1 1,539 168 18 821 2,547 2,587 R 1,156 253 R 1,439
2018 January ................ 1 (s) 1 (s) 131 15 2 70 218 221 98 18 117 February .............. 1 (s) 1 (s) 122 14 1 63 200 203 81 14 98 March ................... 1 (s) 2 (s) 128 15 2 69 214 218 96 20 R 119 April ..................... 1 (s) 2 (s) 126 14 1 66 208 211 88 20 110 May ...................... 1 (s) 3 (s) 128 14 2 69 213 217 103 21 126 June ..................... 1 (s) 3 (s) 127 12 2 69 210 214 98 22 121 July ...................... 1 (s) 3 (s) 132 13 2 72 219 223 101 22 124 August ................. 1 (s) 3 (s) R 134 13 2 73 221 225 104 23 128 September ........... 1 (s) 2 (s) R 124 13 1 66 R 204 207 91 21 113 October ................ 1 (s) 2 (s) 128 15 2 70 214 218 99 22 122 November ............ 1 (s) 2 (s) 127 14 R 2 68 211 214 R 94 19 R 116 December ............ 1 (s) 2 (s) 133 15 2 68 218 221 97 21 119 Total .................... 13 4 25 1 1,540 168 18 823 2,549 2,593 1,150 242 1,413
a Industrial sector, including industrial combined-heat-and-power (CHP) andindustrial electricity-only plants. See Note 2, "Classification of Power Plants IntoEnergy-Use Sectors," at end of Section 7.
b Conventional hydroelectricity net generation (converted to Btu by multiplyingby the total fossil fuels heat rate factors in Table A6).
c Geothermal heat pump and direct use energy.d Solar photovoltaic (PV) electricity net generation in the industrial sector
(converted to Btu by multiplying by the total fossil fuels heat rate factors in TableA6), both utility-scale and distributed (small-scale). See Table 10.5.
e Wind electricity net generation (converted to Btu by multiplying by the totalfossil fuels heat rate factors in Table A6).
f Wood and wood-derived fuels.g Municipal solid waste from biogenic sources, landfill gas, sludge waste,
agricultural byproducts, and other biomass. Through 2000, also includesnon-renewable waste (municipal solid waste from non-biogenic sources, andtire-derived fuels).
h The fuel ethanol (minus denaturant) portion of motor fuels, such as E10,consumed by the industrial sector.
i There is a discontinuity in this time series between 2014 and 2015 due to achange in the method for allocating motor gasoline consumption to the end-usesectors. Beginning in 2015, the commercial and industrial sector shares of fuelethanol consumption are larger than in 2014, while the transportation sector shareis smaller.
j Losses and co-products from the production of fuel ethanol and biodiesel.Does not include natural gas, electricity, and other non-biomass energy used in theproduction of fuel ethanol and biodiesel—these are included in the industrial sectorconsumption statistics for the appropriate energy source.
k The fuel ethanol (minus denaturant) portion of motor fuels, such as E10 andE85, consumed by the transportation sector.
l Although there is biodiesel use in other sectors, all biodiesel consumption isassigned to the transportation sector.
m Beginning in 2009, includes other renewable diesel fuel and other renewablefuels consumption. See "Renewable Diesel Fuel (Other)" and "Renewable Fuels(Other)" in Glossary.
R=Revised. NA=Not available. – =No data reported. (s)=Less than 0.5 trillionBtu.
Notes: • Industrial sector data are estimates, except for hydroelectric power in1949–1978 and 1989 forward, and wind. Transportation sector data are estimates,except for biodiesel beginning in 2012. • Totals may not equal sum of componentsdue to independent rounding. • Geographic coverage is the 50 states and theDistrict of Columbia.
Web Page: See http://www.eia.gov/totalenergy/data/monthly/#renewable (Exceland CSV files) for all available annual data beginning in 1949 and monthly databeginning in 1973.
Sources: See end of section.

176 U. S. Energy Information Administration / Monthly Energy Review March 2019
Table 10.2c Renewable Energy Consumption: Electric Power Sector (Trillion Btu)
Hydro-electricPowera
Geo-thermalb Solarc Windd
Biomass
TotalWoode Wastef Total
1950 Total .................... 1,346 NA NA NA 5 NA 5 1,3511955 Total .................... 1,322 NA NA NA 3 NA 3 1,3251960 Total .................... 1,569 (s) NA NA 2 NA 2 1,5711965 Total .................... 2,026 2 NA NA 3 NA 3 2,0311970 Total .................... 2,600 6 NA NA 1 2 4 2,6091975 Total .................... 3,122 34 NA NA (s) 2 2 3,1581980 Total .................... 2,867 53 NA NA 3 2 4 2,9251985 Total .................... 2,937 97 (s) (s) 8 7 14 3,0491990 Totalg .................. 3,014 161 4 29 129 188 317 3,5241995 Total .................... 3,149 138 5 33 125 296 422 3,7472000 Total .................... 2,768 144 5 57 134 318 453 3,4272001 Total .................... 2,209 142 6 70 126 211 337 2,7632002 Total .................... 2,650 147 6 105 150 230 380 3,2882003 Total .................... 2,749 146 5 113 167 230 397 3,4112004 Total .................... 2,655 148 6 142 165 223 388 3,3392005 Total .................... 2,670 147 6 178 185 221 406 3,4062006 Total .................... 2,839 145 5 264 182 231 412 3,6652007 Total .................... 2,430 145 6 341 186 237 423 3,3452008 Total .................... 2,494 146 9 546 177 258 435 3,6302009 Total .................... 2,650 146 9 721 180 261 441 3,9672010 Total .................... 2,521 148 12 923 196 264 459 4,0642011 Total .................... 3,085 149 17 1,167 182 255 437 4,8552012 Total .................... 2,606 148 40 1,339 190 262 453 4,5862013 Total .................... 2,529 151 83 1,600 207 262 470 4,8332014 Total .................... 2,454 151 165 1,726 251 279 530 5,0262015 Total .................... 2,308 148 228 1,776 244 281 525 4,985
2016 January ................ 235 12 13 170 21 23 44 475 February .............. 222 11 20 186 20 22 43 482 March ................... 251 12 24 202 19 24 43 533 April ..................... 238 11 26 192 15 24 39 506 May ...................... 234 12 31 174 16 24 40 491 June ..................... 213 12 32 150 18 23 41 448 July ...................... 197 12 36 163 20 24 44 451 August ................. 180 12 36 125 21 24 45 399 September ........... 150 12 33 151 19 22 41 388 October ................ 159 12 29 188 16 22 37 426 November ............ 173 13 25 179 18 24 42 432 December ............ 207 13 22 213 21 25 46 501 Total .................... 2,459 146 328 2,094 224 281 505 5,531
2017 January ................ 245 13 19 183 20 26 46 505 February .............. 217 11 23 195 18 22 41 487 March ................... 268 13 39 230 21 24 45 595 April ..................... 269 12 43 227 17 22 39 590 May ...................... 297 12 52 207 17 24 40 607 June ..................... 277 11 56 182 18 24 42 569 July ...................... 243 12 52 147 20 24 44 498 August ................. 200 12 50 125 21 23 45 432 September ........... 175 12 47 164 18 22 40 438 October ................ 167 11 44 233 18 22 40 496 November ............ 188 12 31 222 19 23 42 495 December ............ 205 14 31 226 21 24 45 522 Total .................... 2,752 147 486 2,341 229 280 510 6,235
2018 January ................ 235 13 31 247 20 25 45 571 February .............. 234 12 38 222 18 23 R 41 547 March ................... 238 13 R 47 251 19 25 44 593 April ..................... 252 R 11 57 R 246 15 23 38 605 May ...................... 279 13 R 64 217 R 18 23 42 615 June ..................... 256 13 71 224 R 19 24 43 607 July ...................... 220 13 63 147 20 23 43 487 August ................. 196 13 64 180 19 24 42 495 September ........... 171 13 59 R 165 17 21 R 37 R 445 October ................ 172 12 48 195 17 23 40 R 466 November ............ 203 13 36 207 16 23 39 498 December ............ 217 14 29 228 18 24 41 530 Total .................... 2,673 154 607 2,530 215 280 495 6,459
a Conventional hydroelectricity net generation (converted to Btu by multiplyingby the total fossil fuels heat rate factors in Table A6).
b Geothermal electricity net generation (converted to Btu by multiplying by thetotal fossil fuels heat rate factors in Table A6).
c Solar photovoltaic (PV) and solar thermal electricity net generation in theelectric power sector (converted to Btu by multiplying by the total fossil fuels heatrate factors in Table A6). See Table 10.5.
d Wind electricity net generation (converted to Btu by multiplying by the totalfossil fuels heat rate factors in Table A6).
e Wood and wood-derived fuels.f Municipal solid waste from biogenic sources, landfill gas, sludge waste,
agricultural byproducts, and other biomass. Through 2000, also includesnon-renewable waste (municipal solid waste from non-biogenic sources, and
tire-derived fuels).g Through 1988, data are for electric utilities only. Beginning in 1989, data are
for electric utilities and independent power producers.R=Revised. NA=Not available. (s)=Less than 0.5 trillion Btu.Notes: • The electric power sector comprises electricity-only and
combined-heat-and-power (CHP) plants within the NAICS 22 category whoseprimary business is to sell electricity, or electricity and heat, to the public. • Totalsmay not equal sum of components due to independent rounding. • Geographiccoverage is the 50 states and the District of Columbia.
Web Page: See http://www.eia.gov/totalenergy/data/monthly/#renewable (Exceland CSV files) for all available annual data beginning in 1949 and monthly databeginning in 1973.
Sources: Tables 7.2b, 7.4b, and A6.

U. S. Energy Information Administration / Monthly Energy Review March 2019 177
Table 10.3 Fuel Ethanol Overview
Feed-stocka
Lossesand Co-
productsbDena-turantc Productiond
Traded
Stocksd,fStock
Changed,g Consumptiond
Consump-tion
MinusDenaturanth
NetImportse
TBtu TBtu Mbbl Mbbl MMgal TBtu Mbbl Mbbl Mbbl Mbbl MMgal TBtu TBtu
1981 Total .................. 13 6 40 1,978 83 7 NA NA NA 1,978 83 7 71985 Total .................. 93 42 294 14,693 617 52 NA NA NA 14,693 617 52 511990 Total .................. 111 49 356 17,802 748 63 NA NA NA 17,802 748 63 621995 Total .................. 198 86 647 32,325 1,358 115 387 2,186 -207 32,919 1,383 117 1142000 Total .................. 233 99 773 38,627 1,622 138 116 3,400 -624 39,367 1,653 140 1372001 Total .................. 253 108 841 42,028 1,765 150 315 4,298 898 41,445 1,741 148 1442002 Total .................. 307 130 1,019 50,956 2,140 182 306 6,200 1,902 49,360 2,073 176 1712003 Total .................. 400 168 1,335 66,772 2,804 238 292 5,978 -222 67,286 2,826 240 2332004 Total .................. 482 201 1,621 81,058 3,404 289 3,542 6,002 24 84,576 3,552 301 2932005 Total .................. 550 227 1,859 92,961 3,904 331 3,234 5,563 -439 96,634 4,059 344 3352006 Total .................. 683 280 2,326 116,294 4,884 414 17,408 8,760 3,197 130,505 5,481 465 4532007 Total .................. 907 368 3,105 155,263 6,521 553 10,457 10,535 1,775 163,945 6,886 584 5692008 Total .................. 1,286 518 4,433 221,637 9,309 790 12,610 14,226 3,691 230,556 9,683 821 8002009 Total .................. 1,503 602 5,688 260,424 10,938 928 4,720 16,594 2,368 262,776 11,037 936 9102010 Total .................. 1,823 726 6,506 316,617 13,298 1,127 -9,115 17,941 1,347 306,155 12,858 1,090 1,0612011 Total .................. 1,904 754 6,649 331,646 13,929 1,181 -24,365 18,238 297 306,984 12,893 1,093 1,0652012 Total .................. 1,801 709 6,264 314,714 13,218 1,120 -5,891 20,350 2,112 306,711 12,882 1,092 1,0642013 Total .................. 1,805 707 6,181 316,493 13,293 1,126 -5,761 16,424 -3,926 314,658 13,216 1,120 1,0922014 Total .................. 1,938 755 6,476 340,781 14,313 1,212 -18,371 18,739 2,315 320,095 13,444 1,139 1,1112015 Total .................. 1,998 774 6,636 352,553 14,807 1,254 -17,632 21,596 2,857 332,064 13,947 1,181 1,153
2016 January .............. 172 66 617 30,452 1,279 108 -2,294 23,347 1,751 26,407 1,109 94 92 February ............ 162 63 586 28,810 1,210 103 -2,024 23,171 -176 26,962 1,132 96 93 March ................. 175 67 601 30,957 1,300 110 -2,612 22,730 -441 28,786 1,209 102 100 April ................... 159 61 557 28,208 1,185 100 -2,919 21,336 -1,394 26,683 1,121 95 93 May .................... 171 66 586 30,346 1,275 108 -1,627 20,962 -374 29,093 1,222 104 101 June ................... 172 66 567 30,443 1,279 108 -1,045 21,284 322 29,076 1,221 103 101 July .................... 178 68 570 31,469 1,322 112 -1,641 21,381 97 29,731 1,249 106 103 August ............... 180 69 564 31,856 1,338 113 -1,924 21,198 -183 30,115 1,265 107 105 September ......... 170 65 544 30,048 1,262 107 -2,315 20,713 -485 28,218 1,185 100 98 October .............. 175 67 563 31,006 1,302 110 -2,946 20,113 -600 28,660 1,204 102 100 November .......... 173 67 559 30,706 1,290 109 -3,074 19,463 -650 28,282 1,188 101 98 December .......... 185 71 606 32,680 1,373 116 -2,583 19,758 295 29,802 1,252 106 104 Total .................. 2,072 798 6,920 366,981 15,413 1,306 -27,002 19,758 -1,838 341,817 14,356 1,216 1,187
2017 January .............. 185 71 600 32,887 1,381 117 -2,844 22,679 2,921 27,122 1,139 96 94 February ............ 165 63 545 29,307 1,231 104 -3,605 23,195 516 25,186 1,058 90 87 March ................. 182 70 603 32,393 1,361 115 -3,023 23,981 786 28,584 1,201 102 99 April ................... 167 64 545 29,639 1,245 105 -1,918 23,671 -310 28,031 1,177 100 97 May .................... 180 69 562 31,863 1,338 113 -2,831 22,855 -816 29,848 1,254 106 104 June ................... 173 66 543 30,794 1,293 110 -2,045 21,770 -1,085 29,834 1,253 106 104 July .................... 177 68 559 31,384 1,318 112 -2,553 21,167 -603 29,434 1,236 105 102 August ............... 184 70 577 32,672 1,372 116 -2,029 21,186 19 30,624 1,286 109 106 September ......... 173 66 535 30,701 1,289 109 -1,757 21,507 321 28,623 1,202 102 100 October .............. 182 70 536 32,212 1,353 115 -2,419 21,663 156 29,637 1,245 105 103 November .......... 184 71 523 32,631 1,371 116 -2,069 23,203 1,540 29,022 1,219 103 101 December .......... 186 71 529 32,952 1,384 117 -4,175 23,043 -160 28,937 1,215 103 101 Total .................. 2,138 819 6,657 379,435 15,936 1,349 -31,268 23,043 3,285 344,882 14,485 1,226 1,199
2018 January .............. 182 69 504 32,428 1,362 115 -2,104 24,229 i 1,181 29,143 1,224 104 102 February ............ 166 63 441 29,519 1,240 105 -5,298 24,335 106 24,115 1,013 86 84 March ................. 181 69 484 32,216 1,353 R 114 -5,122 22,883 -1,452 28,546 1,199 R 101 100 April ................... 172 65 462 30,532 1,282 R 108 -3,866 23,256 373 26,293 1,104 93 92 May .................... 181 69 487 32,215 1,353 R 114 -2,280 22,636 -620 30,555 1,283 109 106 June ................... 180 68 473 31,924 1,341 R 113 -3,609 21,880 -756 29,071 1,221 103 101 July .................... 188 72 519 33,496 1,407 119 -2,487 22,802 922 30,087 1,264 107 105 August ............... 190 72 527 33,773 1,418 120 -2,638 22,833 31 31,104 1,306 111 108 September ......... 173 66 471 30,667 1,288 109 -2,106 24,422 1,589 26,972 1,133 96 94 October .............. 182 69 450 32,380 1,360 115 -3,714 23,675 -747 29,413 1,235 105 103 November .......... 177 68 470 31,514 1,324 112 R -3,384 23,679 4 R 28,126 R 1,181 R 100 R 98 December .......... 178 68 518 31,736 1,333 113 -3,075 23,338 -341 29,002 1,218 103 101 Total .................. 2,152 819 5,806 382,400 16,061 1,359 -39,682 23,338 i 290 342,428 14,382 1,217 1,193
a Total corn and other biomass inputs to the production of undenatured ethanolused for fuel ethanol.
b Losses and co-products from the production of fuel ethanol. Does not includenatural gas, electricity, and other non-biomass energy used in the production of fuelethanol—these are included in the industrial sector consumption statistics for theappropriate energy source.
c The amount of denaturant in fuel ethanol produced.d Includes denaturant.e Through 2009, data are for fuel ethanol imports only; data for fuel ethanol
exports are not available. Beginning in 2010, data are for fuel ethanol importsminus fuel ethanol (including industrial alcohol) exports.
f Stocks are at end of period.g A negative value indicates a decrease in stocks and a positive value indicates
an increase.h Consumption of fuel ethanol minus denaturant. Data for fuel ethanol minus
denaturant are used to develop data for "Renewable Energy/Biomass" in Tables10.1–10.2b, as well as in Sections 1 and 2.
i Derived from the preliminary 2017 stocks value (23,048 thousand barrels), notthe final 2017 value (23,043 thousand barrels) that is shown under "Stocks."
R=Revised. NA=Not available. Notes: • Mbbl = thousand barrels. MMgal = million U.S. gallons. TBtu = trillion
Btu. • Fuel ethanol data in thousand barrels are converted to million gallons bymultiplying by 0.042, and are converted to Btu by multiplying by the approximateheat content of fuel ethanol—see Table A3. • Through 1980, data are notavailable. For 1981–1992, data are estimates. For 1993–2008, only data forfeedstock, losses and co-products, and denaturant are estimates.Beginning in 2009, only data for feedstock, and losses and co-products, areestimates. • See "Denaturant," "Ethanol," "Fuel Ethanol," and "Fuel Ethanol MinusDenaturant" in Glossary. • Totals may not equal sum of components due toindependent rounding. • Geographic coverage is the 50 states and the District ofColumbia.
Web Page: See http://www.eia.gov/totalenergy/data/monthly/#renewable (Exceland CSV files) for all available annual and monthly data beginning in 1981.
Sources: See end of section.

178 U. S. Energy Information Administration / Monthly Energy Review March 2019
Table 10.4 Biodiesel and Other Renewable Fuels Overview
Biodiesel
OtherRenew-
ableFuelsf
Feed-stocka
Lossesand Co-
prod-uctsb Production
Trade
StocksdStock
Changee ConsumptionImports ExportsNet
Importsc
TBtu TBtu Mbbl MMgal TBtu Mbbl Mbbl Mbbl Mbbl Mbbl Mbbl MMgal TBtu TBtu
2001 Total .................... 1 (s) 204 9 1 81 41 40 NA NA 244 10 1 NA2002 Total .................... 1 (s) 250 10 1 197 57 140 NA NA 390 16 2 NA2003 Total .................... 2 (s) 338 14 2 97 113 -17 NA NA 322 14 2 NA2004 Total .................... 4 (s) 666 28 4 101 128 -27 NA NA 639 27 3 NA2005 Total .................... 12 (s) 2,162 91 12 214 213 1 NA NA 2,163 91 12 NA2006 Total .................... 32 (s) 5,963 250 32 1,105 856 250 NA NA 6,213 261 33 NA2007 Total .................... 63 1 11,662 490 62 3,455 6,696 -3,241 NA NA 8,422 354 45 NA2008 Total .................... 88 1 16,145 678 87 7,755 16,673 -8,918 NA NA 7,228 304 39 NA2009 Total .................... 67 1 12,281 516 66 1,906 6,546 -4,640 711 711 g 7,663 322 41 –2010 Total .................... 44 1 8,177 343 44 564 2,588 -2,024 672 -39 6,192 260 33 (s)2011 Total .................... 125 2 23,035 967 123 890 1,799 -908 2,005 h 1,028 21,099 886 113 12012 Total .................... 128 2 23,588 991 126 853 3,056 -2,203 1,984 -20 21,406 899 115 12013 Total .................... 176 2 32,368 1,359 173 8,152 4,675 3,477 3,810 1,825 34,020 1,429 182 302014 Total .................... 165 2 30,452 1,279 163 4,578 1,974 2,604 3,131 -679 33,735 1,417 181 282015 Total .................... 163 2 30,080 1,263 161 8,399 2,091 6,308 3,943 813 35,575 1,494 191 33
2016 January ................ 14 (s) 2,490 105 13 248 42 206 4,222 279 2,416 101 13 3 February .............. 14 (s) 2,504 105 13 287 49 238 4,133 -89 2,831 119 15 2 March ................... 16 (s) 2,861 120 15 565 234 331 4,167 34 3,159 133 17 3 April ..................... 16 (s) 2,856 120 15 969 246 723 4,358 192 3,388 142 18 3 May ...................... 18 (s) 3,222 135 17 1,117 335 782 4,091 -268 4,272 179 23 3 June ..................... 17 (s) 3,205 135 17 1,630 220 1,410 4,726 635 3,980 167 21 3 July ...................... 18 (s) 3,331 140 18 1,681 250 1,431 4,443 -283 5,045 212 27 3 August ................. 18 (s) 3,385 142 18 1,873 235 1,638 4,265 -177 5,201 218 28 3 September ........... 17 (s) 3,206 135 17 1,835 150 1,685 4,227 -38 4,929 207 26 3 October ................ 19 (s) 3,433 144 18 1,822 114 1,708 4,690 463 4,678 196 25 3 November ............ 19 (s) 3,408 143 18 2,184 143 2,041 5,314 624 4,825 203 26 3 December ............ 19 (s) 3,425 144 18 2,668 80 2,588 6,398 1,083 4,929 207 26 3 Total .................... 203 3 37,327 1,568 200 16,879 2,098 14,781 6,398 2,455 49,653 2,085 266 34
2017 January ................ 12 (s) 2,208 93 12 241 42 199 6,397 (s) 2,407 101 13 3 February .............. 12 (s) 2,238 94 12 549 59 490 6,475 78 2,650 111 14 3 March ................... 15 (s) 2,761 116 15 650 136 514 6,189 -286 3,561 150 19 3 April ..................... 16 (s) 3,020 127 16 681 283 398 5,706 -484 3,901 164 21 3 May ...................... 18 (s) 3,242 136 17 948 239 709 4,909 -797 4,748 199 25 3 June ..................... 18 (s) 3,344 140 18 1,736 226 1,510 5,052 144 4,711 198 25 4 July ...................... 19 (s) 3,560 150 19 1,670 453 1,217 5,405 353 4,424 186 24 2 August ................. 19 (s) 3,559 149 19 1,582 387 1,195 5,356 -49 4,803 202 26 2 September ........... 19 (s) 3,507 147 19 205 100 105 4,849 -507 4,119 173 22 2 October ................ 19 (s) 3,515 148 19 386 217 169 4,485 -364 4,047 170 22 2 November ............ 19 (s) 3,523 148 19 222 49 173 4,233 -252 3,948 166 21 1 December ............ 19 (s) 3,515 148 19 504 35 469 4,268 35 3,949 166 21 2 Total .................... 206 3 37,993 1,596 204 9,374 2,228 7,146 4,268 -2,130 47,269 1,985 253 30
2018 January ................ 16 (s) 2,945 124 16 246 102 144 4,557 i -193 3,282 138 18 2 February .............. 16 (s) 2,996 126 16 146 103 43 4,924 367 2,672 112 14 3 March ................... 19 (s) 3,493 147 19 457 255 202 4,916 -8 3,702 155 20 3 April ..................... 18 (s) 3,344 140 18 308 217 91 4,681 -235 3,670 154 20 2 May ...................... 19 (s) 3,538 149 19 325 382 -57 4,257 -424 3,905 164 21 2 June ..................... 20 (s) 3,718 156 20 296 275 21 3,845 -412 4,150 174 22 1 July ...................... 21 (s) 3,892 163 21 157 259 -102 3,583 -262 4,052 170 22 1 August ................. 22 (s) 4,028 169 22 281 263 18 3,412 -172 4,217 177 23 1 September ........... 21 (s) 3,850 162 21 277 190 87 3,360 -52 3,989 168 21 1 October ................ 22 (s) 4,039 170 22 468 188 280 3,647 287 4,032 169 22 1 November ............ 21 (s) 3,783 159 20 416 R 156 R 260 4,056 409 R 3,633 R 153 19 2 December ............ 22 (s) 3,991 168 21 536 61 475 4,684 628 3,838 161 21 2 Total .................... 237 3 43,616 1,832 234 3,913 2,453 1,460 4,684 i -65 45,141 1,896 242 21
a Total vegetable oil and other biomass inputs to the production ofbiodiesel—calculated by multiplying biodiesel production by 5.433 million Btu perbarrel. See "Biodiesel Feedstock" entry in the "Thermal Conversion Factor SourceDocumentation" at the end of Appendix A.
b Losses and co-products from the production of biodiesel. Does not includenatural gas, electricity, and other non-biomass energy used in the production ofbiodiesel—these are included in the industrial sector consumption statistics for theappropriate energy source.
c Net imports equal imports minus exports.d Stocks are at end of period. Includes biodiesel stocks at (or in) refineries,
pipelines, and bulk terminals. Beginning in 2011, also includes stocks at biodieselproduction plants.
e A negative value indicates a decrease in stocks and a positive value indicatesan increase.
f Other renewable diesel fuel and other renewable fuels consumption. See"Renewable Diesel Fuel (Other)" and "Renewable Fuels (Other)" in Glossary.
g In 2009, because of incomplete data coverage and differing data sources, a"Balancing Item" amount of 733 thousand barrels (653 thousand barrels in January2009; 80 thousand barrels in February 2009) is used to balance biodiesel supplyand disposition.
h Derived from the final 2010 stocks value for bulk terminals and biodieselproduction plants (977 thousand barrels), not the final 2010 value for bulk terminalsonly (672 thousand barrels) that is shown under “Stocks.”
i Derived from the preliminary 2017 stocks value (4,750 thousand barrels), notthe final 2017 value (4,268 thousand barrels) that is shown under “Stocks.”
R=Revised. NA=Not available. – =No data reported. (s)=Less than 0.5 trillionBtu and greater than -0.5 trillion Btu, or less than 500 barrels and greater than -500barrels.
Notes: • Mbbl = thousand barrels. MMgal = million U.S. gallons. TBtu = trillionBtu. • Biodiesel data in thousand barrels are converted to million gallons bymultiplying by 0.042, and are converted to Btu by multiplying by 5.359 million Btuper barrel (the approximate heat content of biodiesel—see Table A1). • Through2000, data are not available. Beginning in 2001, data not from U.S. EnergyInformation Administration (EIA) surveys are estimates. • Totals may not equalsum of components due to independent rounding. • Geographic coverage is the50 states and the District of Columbia.
Web Page: See http://www.eia.gov/totalenergy/data/monthly/#renewable (Exceland CSV files) for all available annual and monthly data beginning in 2001.
Sources: See end of section.

U. S. Energy Information Administration / Monthly Energy Review March 2019 179
Table 10.5 Solar Energy Consumption (Trillion Btu)
Distributeda Solar Energyb Utility-Scalec Solar Energyb
TotalkHeatf
Electricityd
Totalg
Electricitye
ResidentialSector
CommercialSector
IndustrialSector Total
CommercialSectorh
IndustrialSectori
ElectricPowerSectorj Total
1985 Total ...................... NA NA NA NA NA NA NA NA (s) (s) (s)1990 Total ...................... 55 (s) (s) (s) (s) 55 – – 4 4 591995 Total ...................... 63 (s) (s) (s) 1 63 – – 5 5 682000 Total ...................... 57 (s) 1 (s) 1 58 – – 5 5 632001 Total ...................... 55 (s) 1 (s) 1 56 – – 6 6 622002 Total ...................... 53 1 1 (s) 2 54 – – 6 6 602003 Total ...................... 51 1 1 (s) 2 53 – – 5 5 582004 Total ...................... 50 1 1 (s) 2 53 – – 6 6 582005 Total ...................... 49 1 2 (s) 3 52 – – 6 6 582006 Total ...................... 51 2 2 1 5 56 – – 5 5 612007 Total ...................... 53 2 4 1 7 59 – – 6 6 652008 Total ...................... 54 4 6 1 11 65 (s) – 9 9 742009 Total ...................... 55 5 7 2 14 69 (s) – 9 9 782010 Total ...................... 56 9 11 3 23 79 (s) (s) 12 12 902011 Total ...................... 58 13 19 4 36 93 1 (s) 17 18 1112012 Total ...................... 59 20 30 7 56 116 1 (s) 40 41 1572013 Total ...................... 61 31 38 9 78 138 3 (s) 83 86 2252014 Total ...................... 62 47 49 11 107 169 4 (s) 165 168 3372015 Total ...................... 62 65 53 14 132 194 4 (s) 228 232 426
2016 January .................. 3 5 3 1 9 12 (s) (s) 13 14 26 February ................ 4 6 4 1 11 14 (s) (s) 20 21 35 March ..................... 5 8 5 2 14 19 (s) (s) 24 24 43 April ....................... 6 9 5 2 16 21 (s) (s) 26 27 48 May ........................ 6 10 6 2 17 24 (s) (s) 31 32 55 June ....................... 6 10 6 2 18 24 (s) (s) 32 32 56 July ........................ 7 11 6 2 18 25 1 (s) 36 36 61 August ................... 6 10 6 2 18 24 1 (s) 36 37 61 September ............. 6 9 5 2 16 22 (s) (s) 33 34 55 October .................. 5 8 5 2 14 19 (s) (s) 29 29 49 November .............. 4 7 4 1 12 16 (s) (s) 25 26 41 December .............. 4 6 4 1 11 15 (s) (s) 22 22 37 Total ...................... 62 98 57 19 174 236 5 (s) 328 333 569
2017 January .................. 3 6 4 1 11 15 (s) (s) 19 19 33 February ................ 4 7 4 1 13 16 (s) (s) 23 24 40 March ..................... 5 11 6 2 18 23 (s) (s) 39 39 62 April ....................... 6 12 6 2 20 26 (s) (s) 43 43 69 May ........................ 6 13 7 2 22 29 (s) (s) 52 52 81 June ....................... 6 14 7 2 23 29 1 (s) 56 57 86 July ........................ 7 14 7 2 24 30 1 (s) 52 53 83 August ................... 6 13 7 2 23 29 1 (s) 50 50 79 September ............. 6 12 7 2 21 26 (s) (s) 47 47 73 October .................. 5 11 6 2 18 24 (s) (s) 44 44 68 November .............. 4 8 5 1 14 18 (s) (s) 31 31 50 December .............. 4 8 5 1 14 17 (s) (s) 31 31 49 Total ...................... 63 128 71 22 221 284 5 (s) 486 491 774
2018 January .................. 3 8 5 1 15 18 (s) (s) 31 31 50 February ................ 4 9 6 1 16 20 (s) (s) 38 38 58 March ..................... 5 13 7 2 22 28 (s) (s) R 47 48 R 75 April ....................... 6 15 8 2 25 31 1 (s) 57 58 89 May ........................ 6 16 9 2 28 34 1 (s) R 64 65 99 June ....................... 7 17 9 2 28 35 1 (s) 71 72 107 July ........................ 7 17 10 3 29 36 1 (s) 63 64 100 August ................... 7 16 9 2 28 34 1 (s) 64 64 99 September ............. 6 14 8 2 25 31 1 (s) 59 60 90 October .................. 5 13 7 2 22 27 (s) (s) 48 48 75 November .............. 4 10 6 2 18 22 (s) (s) 36 36 58 December .............. 4 9 5 1 16 20 (s) (s) 29 29 50 Total ...................... 63 158 90 24 272 335 6 1 607 614 949
a Data are estimates for distributed (small-scale) facilities (combined generatornameplate capacity less than 1 megawatt).
b See "Photovoltaic Energy" and "Solar Thermal Energy" in Glossary.c Data are for utility-scale facilities (combined generator nameplate capacity of 1
megawatt or more).d Solar photovoltaic (PV) electricity generation at distributed (small-scale)
facilities connected to the electric power grid (converted to Btu by multiplying by thefossil fuels heat rate factors in Table A6).
e Solar photovoltaic (PV) and solar thermal electricity net generation atutility-scale facilities (converted to Btu by multiplying by the fossil fuels heat ratefactors in Table A6).
f Solar thermal direct use energy in the residential, commercial, and industrialsectors for all end uses, such as pool heating, hot water heating, and spaceheating.
g Data are the sum of "Distributed Solar Energy Heat" and "Distributed SolarEnergy Electricity."
h Commercial combined-heat-and-power (CHP) and commercial electricity-onlyplants. See Note 2, "Classification of Power Plants Into Energy-Use Sectors," atend of Section 7.
i Industrial combined-heat-and-power (CHP) and industrial electricity-onlyplants. See Note 2, "Classification of Power Plants Into Energy-Use Sectors," atend of Section 7.
j Electricity-only and combined-heat-and-power (CHP) plants within the NAICS22 category whose primary business is to sell electricity, or electricity and heat, tothe public. Through 1988, data are for electric utilities only; beginning in 1989, dataare for electric utilities and independent power producers.
k Data are the sum of "Distributed Solar Energy Total" and "Utility-Scale SolarEnergy Total."
R=Revised. NA=Not available. – =No data reported. (s)=Less than 0.5 trillionBtu.
Notes: • Distributed (small-scale) solar energy data for all years, andutility-scale solar energy data for the current two years, are estimates. • Totalsmay not equal sum of components due to independent rounding. • Geographiccoverage is the 50 states and the District of Columbia.
Web Page: See http://www.eia.gov/totalenergy/data/monthly/#renewable (Exceland CSV files) for all available annual and monthly data beginning in 1984.
Sources: See end of section.

180 U. S. Energy Information Administration / Monthly Energy Review March 2019
Table 10.6 Solar Electricity Net Generation (Million Kilowatthours)
Distributeda Solar Generationb Utility-Scalec Solar Generationb
TotalResidential
SectorCommercial
SectorIndustrial
Sector TotalCommercial
SectordIndustrialSectore
ElectricPowerSectorf Total
1985 Total ...................... NA NA NA NA NA NA 11 11 111990 Total ...................... 12 17 4 32 – – 367 367 3991995 Total ...................... 20 29 6 56 – – 497 497 5522000 Total ...................... 39 55 12 107 – – 493 493 6002001 Total ...................... 47 67 15 129 – – 543 543 6722002 Total ...................... 56 79 18 153 – – 555 555 7082003 Total ...................... 65 93 21 178 – – 534 534 7122004 Total ...................... 81 115 25 221 – – 575 575 7962005 Total ...................... 121 172 38 332 – – 550 550 8822006 Total ...................... 177 251 56 484 – – 508 508 9912007 Total ...................... 250 355 79 683 – – 612 612 1,2952008 Total ...................... 401 570 126 1,097 (s) – 864 864 1,9622009 Total ...................... 539 766 170 1,475 (s) – 891 891 2,3662010 Total ...................... 900 1,170 259 2,329 5 2 1,206 1,212 3,5412011 Total ...................... 1,358 1,911 423 3,692 84 7 1,727 1,818 5,5092012 Total ...................... 2,058 3,169 702 5,929 148 14 4,164 4,327 10,2562013 Total ...................... 3,217 4,023 891 8,131 294 17 8,724 9,036 17,1672014 Total ...................... 4,947 5,146 1,139 11,233 371 16 17,304 17,691 28,9242015 Total ...................... 6,999 5,689 1,451 14,139 416 21 24,456 24,893 39,032
2016 January .................. 520 346 113 980 26 1 1,458 1,486 2,465 February ................ 622 398 124 1,145 39 2 2,201 2,242 3,386 March ..................... 835 520 171 1,525 44 2 2,571 2,617 4,143 April ....................... 951 566 186 1,703 46 2 2,831 2,880 4,583 May ........................ 1,058 616 206 1,879 48 3 3,375 3,425 5,304 June ....................... 1,099 623 206 1,928 53 3 3,418 3,473 5,401 July ........................ 1,146 640 214 2,000 55 3 3,886 3,945 5,945 August ................... 1,113 620 209 1,942 58 3 3,908 3,969 5,911 September ............. 989 556 190 1,735 48 2 3,584 3,635 5,370 October .................. 884 493 174 1,552 42 2 3,147 3,191 4,743 November .............. 726 393 139 1,257 36 2 2,729 2,767 4,024 December .............. 653 387 128 1,167 33 1 2,389 2,424 3,591 Total ...................... 10,595 6,158 2,060 18,812 529 27 35,497 36,054 54,866
2017 January .................. 703 420 123 1,246 17 1 2,011 2,030 3,276 February ................ 789 458 137 1,384 27 2 2,526 2,555 3,939 March ..................... 1,147 629 197 1,972 42 3 4,200 4,245 6,218 April ....................... 1,283 699 213 2,195 46 4 4,646 4,696 6,891 May ........................ 1,415 770 239 2,423 53 4 5,605 5,663 8,086 June ....................... 1,469 777 241 2,487 61 5 6,109 6,175 8,662 July ........................ 1,495 808 252 2,555 58 5 5,690 5,753 8,308 August ................... 1,446 788 246 2,480 55 5 5,374 5,434 7,914 September ............. 1,293 709 223 2,225 52 4 5,059 5,115 7,340 October .................. 1,157 632 201 1,990 47 4 4,771 4,821 6,811 November .............. 904 502 156 1,561 34 3 3,372 3,409 4,970 December .............. 841 492 138 1,472 29 3 3,358 3,389 4,861 Total ...................... 13,942 7,685 2,364 23,990 521 42 52,723 53,286 77,276
2018 January .................. 922 R 547 R 146 R 1,615 28 4 R 3,375 R 3,407 R 5,022 February ................ 1,008 599 154 R 1,762 R 35 5 R 4,072 R 4,113 R 5,875 March ..................... 1,394 813 R 220 R 2,427 45 7 R 5,151 R 5,203 R 7,630 April ....................... 1,596 R 900 R 240 2,736 57 8 R 6,183 R 6,249 R 8,984 May ........................ R 1,758 986 R 266 R 3,010 R 65 9 R 6,995 R 7,070 R 10,080 June ....................... 1,793 999 R 267 R 3,060 81 11 R 7,712 R 7,804 R 10,863 July ........................ R 1,839 R 1,032 R 276 R 3,147 68 9 R 6,861 R 6,938 R 10,085 August ................... R 1,762 R 989 R 268 3,018 R 70 11 6,900 R 6,981 R 9,999 September ............. 1,545 R 890 R 245 2,681 66 10 R 6,393 R 6,469 R 9,150 October .................. 1,391 R 786 R 223 2,400 R 50 8 R 5,165 R 5,223 R 7,624 November .............. 1,114 R 624 R 176 1,914 34 6 R 3,918 R 3,958 R 5,873 December .............. 1,025 591 159 1,774 28 4 3,156 3,188 4,962 Total ...................... 17,146 9,756 2,641 29,543 629 92 65,882 66,604 96,147
a Data are estimates for solar photovoltaic (PV) electricity generation atsmall-scale facilities (combined generator nameplate capacity less than 1megawatt) connected to the electric power grid.
b See "Photovoltaic Energy" and "Solar Thermal Energy" in Glossary.c Solar photovoltaic (PV) and solar thermal electricity net generation at
utility-scale facilities (combined generator nameplate capacity of 1 megawatt ormore).
d Commercial combined-heat-and-power (CHP) and commercial electricity-onlyplants. See Note 2, "Classification of Power Plants Into Energy-Use Sectors," atend of Section 7.
e Industrial combined-heat-and-power (CHP) and industrial electricity-onlyplants. See Note 2, "Classification of Power Plants Into Energy-Use Sectors," atend of Section 7.
f Electricity-only and combined-heat-and-power (CHP) plants within the NAICS22 category whose primary business is to sell electricity, or electricity and heat, tothe public. Through 1988, data are for electric utilities only; beginning in 1989, dataare for electric utilities and independent power producers.
R=Revised. NA=Not available. – =No data reported. (s)=Less than 0.5 millionkilowatthours.
Notes: • Distributed (small-scale) solar generation data for all years, andutility-scale solar energy data for the current two years, are estimates. • Totalsmay not equal sum of components due to independent rounding. • Geographiccoverage is the 50 states and the District of Columbia.
Web Page: See http://www.eia.gov/totalenergy/data/monthly/#renewable (Exceland CSV files) for all available annual and monthly data beginning in 1984.
Sources: • Distributed Solar Generation: 1989–2013—Calculated asdistributed solar energy consumption (see Table 10.5) divided by the total fossilfuels heat rate factors (see Table A6). 2014 forward—U.S. Energy InformationAdministration (EIA), Electric Power Monthly, monthly reports, Tables 1.1, 1.2.C,1.2.D, and 1.2.E. • Utility-Scale Solar Generation: 1984–1988—EIA, FormEIA-759, "Monthly Power Plant Report." 1989–1997: EIA, Form EIA-759, "MonthlyPower Plant Report," and Form EIA-867, "Annual Nonutility Power ProducerReport." 1998–2000: EIA, Form EIA-759, "Monthly Power Plant Report," and FormEIA-860B, "Annual Electric Generator Report—Nonutility." 2001–2003: EIA, FormEIA-906, "Power Plant Report." 2004–2007: EIA, Form EIA-906, "Power PlantReport," and Form EIA-920, "Combined Heat and Power Plant Report." 2008forward: EIA, Form EIA-923, "Power Plant Operations Report." • Total:Calculated as distributed solar generation plus utility-scale solar generation.

U. S. Energy Information Administration / Monthly Energy Review March 2019 181
Renewable Energy Note. Renewable Energy Production and Consumption. In Tables 1.1, 1.3, and 10.1, renewable energy consumption
consists of: conventional hydroelectricity net generation (converted to Btu by multiplying by the total fossil fuels heat
rate factors in Table A6); geothermal electricity net generation (converted to Btu by multiplying by the total fossil fuels
heat rate factors in Table A6), and geothermal heat pump and geothermal direct use energy; solar thermal and
photovoltaic electricity net generation (converted to Btu by multiplying by the total fossil fuels heat rate factors in Table
A6), and solar thermal direct use energy; wind electricity net generation (converted to Btu by multiplying by the total
fossil fuels heat rate factors in Table A6); wood and wood‐derived fuels consumption; biomass waste (municipal solid
waste from biogenic sources, landfill gas, sludge waste, agricultural byproducts, and other biomass) consumption; fuel
ethanol (minus denaturant), biodiesel, and other renewable fuels consumption; and losses and co‐products from the
production of fuel ethanol and biodiesel. In Tables 1.1, 1.2, and 10.1, renewable energy production is assumed to equal
consumption for all renewable energy sources except biofuels and wood. Biofuels production comprises biomass inputs
to the production of fuel ethanol and biodiesel. Wood production is the sum of wood consumption and densified
biomass exports.
Table 10.2a Sources
Residential Sector, Geothermal 1989–2011: Annual estimates by the U.S Energy Information Administration (EIA) based on data from Oregon Institute
of Technology, Geo‐Heat Center.
2012 forward: Annual estimates assumed by EIA to be equal to that of 2011.
(For 1989 forward, monthly estimates are created by dividing the annual estimates by the number of days in the year
and then multiplying by the number of days in the month.)
Residential Sector, Solar 1989 forward: Residential sector solar consumption is the sum of the values for "Distributed Solar Energy Consumption:
Heat" (which includes solar thermal direct use energy in the residential, commercial, and industrial sectors) from Table
10.5 and "Distributed Solar Energy Consumption: Electricity, Residential Sector" from Table 10.5.
Residential Sector, Wood 1949–1979: Annual estimates are from EIA, Estimates of U.S. Wood Energy Consumption from 1949 to 1981, Table A2.
1980–2008: Annual estimates are based on EIA, Form EIA‐457, "Residential Energy Consumption Survey"; and National
Oceanic and Atmospheric Administration regional heating degree‐day data.
2009 forward: Annual estimates based on EIA, Form‐457, “Residential Energy Consumption Survey”; and residential
wood consumption growth rates from EIA's Annual Energy Outlook data system.
(For 1973 forward, monthly estimates are created by dividing the annual estimates by the number of days in the year
and then multiplying by the number of days in the month.)
Residential Sector, Total Renewable Energy 1949–1988: Residential sector total renewable energy consumption is equal to residential sector wood consumption.
1989 forward: Residential sector total renewable energy consumption is the sum of the residential sector consumption
values for geothermal, solar, and wood.
Commercial Sector, Hydroelectric Power 1989 forward: Commercial sector conventional hydroelectricity net generation data from EIA, Form EIA‐923, "Power
Plant Operations Report," and predecessor forms, are converted to Btu by multiplying by the total fossil fuels heat rate
factors in Table A6.

182 U. S. Energy Information Administration / Monthly Energy Review March 2019
Commercial Sector, Geothermal 1989–2011: Annual estimates by EIA based on data from Oregon Institute of Technology, Geo‐Heat Center.
2012 forward: Annual estimates assumed by EIA to be equal to that of 2011.
(For 1989 forward, monthly estimates are created by dividing the annual estimates by the number of days in the year
and then multiplying by the number of days in the month.)
Commercial Sector, Solar 1989 forward: Commercial sector solar consumption is the sum of the values for "Distributed Solar Energy
Consumption: Electricity, Commercial Sector" from Table 10.5 and "Utility‐Scale Solar Energy Consumption: Electricity,
Commercial Sector" from Table 10.5.
Commercial Sector, Wind 2009 forward: Commercial sector wind electricity net generation data from EIA, Form EIA‐923, "Power Plant Operations
Report," are converted to Btu by multiplying by the total fossil fuels heat rate factors in Table A6.
Commercial Sector, Wood 1949–1979: Annual estimates are from EIA, Estimates of U.S. Wood Energy Consumption from 1949 to 1981, Table A2.
1980–1983: Annual estimates are from EIA, Estimates of U.S. Wood Energy Consumption 1980 –1983, Table ES1.
1984: Annual estimate assumed by EIA to be equal to that of 1983.
1985–1988: Annual estimates interpolated by EIA.
(For 1973–1988, monthly estimates are created by dividing the annual estimates by the number of days in the year and
then multiplying by the number of days in the month.)
1989 forward: Monthly/annual commercial sector combined‐heat‐and‐power (CHP) wood consumption data are from
EIA, Form EIA‐923, "Power Plant Operations Report," and predecessor forms. Annual estimates for commercial sector
non‐CHP wood consumption are based on EIA, Form EIA‐871, "Commercial Buildings Energy Consumption Survey" (for
2014 forward, the annual estimates are based on commercial sector wood consumption growth rates from EIA's Annual
Energy Outlook data system). For 1989 forward, monthly estimates for commercial sector non‐CHP wood consumption
are created by dividing the annual estimates by the number of days in the year and then multiplying by the number of
days in the month. Commercial sector total wood consumption is the sum of commercial sector CHP and non‐CHP wood
consumption.
Commercial Sector, Biomass Waste 1989 forward: Table 7.4c.
Commercial Sector, Fuel Ethanol (Minus Denaturant) 1981 forward: The commercial sector share of motor gasoline consumption is equal to commercial sector motor
gasoline consumption from Table 3.7a divided by motor gasoline product supplied from Table 3.5. Commercial sector
fuel ethanol (minus denaturant) consumption is equal to fuel ethanol (minus denaturant) consumption from Table 10.3
multiplied by the commercial sector share of motor gasoline consumption. Note that there is a discontinuity in this time
series between 2014 and 2015 due to a change in the method for allocating motor gasoline consumption to the end‐use
sectors; beginning in 2015, the commercial and industrial sector shares of fuel ethanol consumption are larger than in
2014, while the transportation sector share is smaller.
Commercial Sector, Total Biomass 1949–1980: Commercial sector total biomass consumption is equal to commercial sector wood consumption.

U. S. Energy Information Administration / Monthly Energy Review March 2019 183
1981–1988: Commercial sector total biomass consumption is the sum of the commercial sector consumption values for
wood and fuel ethanol (minus denaturant).
1989 forward: Commercial sector total biomass consumption is the sum of the commercial sector consumption values
for wood, waste, and fuel ethanol (minus denaturant).
Commercial Sector, Total Renewable Energy 1949–1988: Commercial sector total renewable energy consumption is equal to commercial sector total biomass
consumption.
1989–2007: Commercial sector total renewable energy consumption is the sum of the commercial sector consumption
values for conventional hydroelectric power, geothermal, and total biomass.
2008: Commercial sector total renewable energy consumption is the sum of the commercial sector consumption values
for conventional hydroelectric power, geothermal, solar, and total biomass.
2009 forward: Commercial sector total renewable energy is the sum of the commercial sector consumption values for
conventional hydroelectric power, geothermal, solar, wind, and total biomass.
Table 10.2b Sources
Industrial Sector, Hydroelectric Power 1949 forward: Industrial sector conventional hydroelectricity net generation data from Table 7.2c are converted to Btu
by multiplying by the total fossil fuels heat rate factors in Table A6.
Industrial Sector, Geothermal 1989–2009: Annual estimates by the U.S. Energy Information Administration (EIA) based on data from Oregon Institute
of Technology, Geo‐Heat Center.
2010 forward: Annual estimates assumed by EIA to be equal to that of 2009.
(For 1989 forward, monthly estimates are created by dividing the annual estimates by the number of days in the year
and then multiplying by the number of days in the month.)
Industrial Sector, Solar 1989 forward: Industrial sector solar consumption is the sum of the values for "Distributed Solar Energy Consumption:
Electricity, Industrial Sector" from Table 10.5 and "Utility‐Scale Solar Energy Consumption: Electricity, Industrial Sector"
from Table 10.6.
Industrial Sector, Wind 2011 forward: Industrial sector wind electricity net generation data from EIA, Form EIA‐923, "Power Plant Operations
Report," are converted to Btu by multiplying by the total fossil fuels heat rate factors in Table A6.
Industrial Sector, Wood 1949–1979: Annual estimates are from EIA, Estimates of U.S. Wood Energy Consumption from 1949 to 1981, Table A2.
1980–1983: Annual estimates are from EIA, Estimates of U.S. Wood Energy Consumption 1980 –1983, Table ES1.
1984: Annual estimate is from EIA, Estimates of U.S. Biofuels Consumption 1990, Table 1.
1985 and 1986: Annual estimates interpolated by EIA.
1987: Annual estimate is from EIA, Estimates of Biofuels Consumption in the United States During 1987, Table 2.
1988: Annual estimate interpolated by EIA.

184 U. S. Energy Information Administration / Monthly Energy Review March 2019
(For 1973–1988, monthly estimates are created by dividing the annual estimates by the number of days in the year and
then multiplying by the number of days in the month.)
1989 forward: Monthly/annual industrial sector combined‐heat‐and‐power (CHP) wood consumption data are from EIA,
Form EIA‐923, "Power Plant Operations Report," and predecessor forms. Annual estimates for industrial sector non‐CHP
wood consumption are based on EIA, Form EIA‐846, "Manufacturing Energy Consumption Survey" (for 2015 forward, the
annual estimates are assumed by EIA to be equal to that of 2014). For 1989 forward, monthly estimates for industrial
sector non‐CHP wood consumption are created by dividing the annual estimates by the number of days in the year and
then multiplying by the number of days in the month. Industrial sector total wood consumption is the sum of industrial
sector CHP and non‐CHP wood consumption.
Industrial Sector, Biomass Waste 1981: Annual estimate is calculated as total waste consumption (from EIA, Estimates of U.S. Biofuels Consumption 1990,
Table 8) minus electric power sector waste consumption (from MER Table 10.2c).
1982 and 1983: Annual estimates are calculated as total waste consumption (based on Estimates of U.S. Biofuels
Consumption 1990, Table 8) minus electric power sector waste consumption (from MER, Table 10.2c).
1984: Annual estimate is calculated as total waste consumption (from EIA, Estimates of U.S. Biofuels Consumption 1990,
Table 8) minus electric power sector waste consumption (from MER, Table 10.2c).
1985 and 1986: Annual estimates interpolated by EIA.
1987: Annual estimate is calculated as total waste consumption (from EIA, Estimates of U.S. Biofuels Consumption 1990,
Table 8) minus electric power sector waste consumption (from MER, Table 10.2c).
1988: Annual estimate interpolated by EIA.
(For 1973–1988, monthly estimates are created by dividing the annual estimates by the number of days in the year and
then multiplying by the number of days in the month.)
1989 forward: Monthly/annual industrial sector combined‐heat‐and‐power (CHP) consumption data are from Table
7.4c. Annual estimates for industrial sector non‐CHP waste consumption are based on information presented in
Government Advisory Associates, Resource Recovery Yearbook and Methane Recovery Yearbook, and information
provided by the U.S. Environmental Protection Agency, Landfill Methane Outreach Program (for 2014 forward, the
annual estimates are assumed by EIA to be equal to that of 2013). For 1989 forward, monthly estimates for industrial
sector non‐CHP waste consumption are created by dividing the annual estimates by the number of days in the year and
then multiplying by the number of days in the month. Industrial sector total waste consumption is the sum of industrial
sector CHP and non‐CHP waste consumption.
Industrial Sector, Fuel Ethanol (Minus Denaturant) 1981 forward: The industrial sector share of motor gasoline consumption is equal to industrial sector motor gasoline
consumption from Table 3.7b divided by motor gasoline product supplied from Table 3.5. Industrial sector fuel ethanol
(minus denaturant) consumption is equal to fuel ethanol (minus denaturant) consumption from Table 10.3 multiplied by
the industrial sector share of motor gasoline consumption. Note that there is a discontinuity in this time series between
2014 and 2015 due to a change in the method for allocating motor gasoline consumption to the end‐use sectors;
beginning in 2015, the commercial and industrial sector shares of fuel ethanol consumption are larger than in 2014,
while the transportation sector share is smaller.
Industrial Sector, Biomass Losses and Co-products 1981 forward: Calculated as fuel ethanol losses and co‐products from Table 10.3 plus biodiesel losses and co‐products
from Table 10.4.
U. S. Energy Information Administration / Monthly Energy Review March 2019 185
Industrial Sector, Total Biomass 1949–1980: Industrial sector total biomass consumption is equal to industrial sector wood consumption.
1981 forward: Industrial sector total biomass consumption is the sum of the industrial sector consumption values for
wood, waste, fuel ethanol (minus denaturant), and biomass losses and co‐products.
Industrial Sector, Total Renewable Energy 1949–1988: Industrial sector total renewable energy consumption is the sum of the industrial sector consumption
values for conventional hydroelectric power and total biomass.
1989–2009: Industrial sector total renewable energy consumption is the sum of the industrial sector consumption
values for conventional hydroelectric power, geothermal, and total biomass.
2010: Industrial sector total renewable energy consumption is the sum of the industrial sector consumption values for
conventional hydroelectric power, geothermal, solar, and total biomass.
2011 forward: Industrial sector total renewable energy consumption is the sum of the industrial sector consumption
values for conventional hydroelectric power, geothermal, solar, wind, and total biomass.
Transportation Sector, Fuel Ethanol (Minus Denaturant) 1981 forward: The transportation sector share of motor gasoline consumption is equal to transportation sector motor
gasoline consumption from Table 3.7c divided by motor gasoline product supplied from Table 3.5. Transportation sector
fuel ethanol (minus denaturant) consumption is equal to fuel ethanol (minus denaturant) consumption from Table 10.3
multiplied by the transportation sector share of motor gasoline consumption. Note that there is a discontinuity in this
time series between 2014 and 2015 due to a change in the method for allocating motor gasoline consumption to the
end‐use sectors; beginning in 2015, the commercial and industrial sector shares of fuel ethanol consumption are larger
than in 2014, while the transportation sector share is smaller.
Transportation Sector, Biodiesel 2001 forward: Table 10.4. Transportation sector biodiesel consumption is assumed to equal total biodiesel
consumption.
Transportation Sector, Other Renewable Fuels 2009 forward: Table 10.4.
Transportation Sector, Total Renewable Energy 1981–2000: Transportation sector total renewable energy consumption is equal to transportation sector fuel ethanol
(minus denaturant) consumption.
2001–2008: Transportation sector total renewable energy consumption is the sum of the transportation sector
consumption values for fuel ethanol (minus denaturant) and biodiesel.
2009 forward: Transportation sector total renewable energy consumption is the sum of the transportation sector
consumption values for fuel ethanol (minus denaturant), biodiesel, and other renewable fuels.
Table 10.3 Sources
Feedstock 1981 forward: Calculated as fuel ethanol production (in thousand barrels) minus denaturant, and then multiplied by the
fuel ethanol feedstock factor—see Table A3.
Losses and Co-products 1981 forward: Calculated as fuel ethanol feedstock plus denaturant minus fuel ethanol production.

186 U. S. Energy Information Administration / Monthly Energy Review March 2019
Denaturant 1981–2008: Data in thousand barrels for petroleum denaturant in fuel ethanol produced are estimated as 2% of fuel
ethanol production; these data are converted to Btu by multiplying by 4.645 million Btu per barrel (the estimated
quantity‐weighted factor of natural gasoline and conventional motor gasoline used as denaturant).
2009–2017: U.S. Energy Information Administration (EIA), Petroleum Supply Annual (PSA), annual reports, Table 1. Data
in thousand barrels for net production of natural gasoline at renewable fuels and oxygenate plants are multiplied by ‐1;
these data are converted to Btu by multiplying by 4.620 million Btu per barrel (the approximate heat content of natural
gasoline). Data in thousand barrels for net production of conventional motor gasoline and motor gasoline blending
components at renewable fuels and oxygenate plants are multiplied by ‐1; these data are converted to Btu by
multiplying by 5.222 million Btu per barrel (the approximate heat content of motor gasoline blending components).
Total denaturant is the sum of the values for natural gasoline, conventional motor gasoline, and motor gasoline blending
components.
2018: EIA, Petroleum Supply Monthly (PSM), monthly reports, Table 1. Data in thousand barrels for net production of
natural gasoline at renewable fuels and oxygenate plants are multiplied by ‐1; these data are converted to Btu by
multiplying by 4.620 million Btu per barrel (the approximate heat content of natural gasoline). Data in thousand barrels
for net production of conventional motor gasoline and motor gasoline blending components at renewable fuels and
oxygenate plants are multiplied by ‐1; these data are converted to Btu by multiplying by 5.222 million Btu per barrel (the
approximate heat content of motor gasoline blending components). Total denaturant is the sum of the values for
natural gasoline, conventional motor gasoline, and motor gasoline blending components.
Production 1981–1992: Fuel ethanol production is assumed to equal fuel ethanol consumption—see sources for "Consumption."
1993–2004: Calculated as fuel ethanol consumption plus fuel ethanol stock change minus fuel ethanol net imports.
These data differ slightly from the original production data from EIA, Form EIA‐819, "Monthly Oxygenate Report," and
predecessor form, which were not reconciled and updated to be consistent with the final balance.
2005–2008: EIA, Form EIA‐819, "Monthly Oxygenate Report."
2009–2017: EIA, PSA, annual reports, Table 1, data for net production of fuel ethanol at renewable fuels and oxygenate
plants.
2018: EIA, PSM, monthly reports, Table 1, data for net production of fuel ethanol at renewable fuels and oxygenate
plants.
Trade, Stocks, and Stock Change 1992–2017: EIA, PSA, annual reports, Table 1.
2018: EIA, PSM, monthly reports, Table 1.
Consumption 1981–1989: EIA, Estimates of U.S. Biofuels Consumption 1990, Table 10; and interpolated values for 1982, 1983, 1985,
1986, and 1988.
1990–1992: EIA, Estimates of U.S. Biomass Energy Consumption 1992, Table D2; and interpolated value for 1991.
1993–2004: EIA, PSA, annual reports, Tables 2 and 16. Calculated as 10% of oxygenated finished motor gasoline field
production (Table 2), plus fuel ethanol refinery input (Table 16).
2005–2008: EIA, PSA, annual reports, Tables 1 and 15. Calculated as motor gasoline blending components adjustments
(Table 1), plus finished motor gasoline adjustments (Table 1), plus fuel ethanol refinery and blender net inputs (Table
15).

U. S. Energy Information Administration / Monthly Energy Review March 2019 187
2009–2017: EIA, PSA, annual reports, Table 1. Calculated as fuel ethanol refinery and blender net inputs minus fuel
ethanol adjustments.
2018: EIA, PSM, monthly reports, Table 1. Calculated as fuel ethanol refinery and blender net inputs minus fuel ethanol
adjustments.
Consumption Minus Denaturant 1981 forward: Calculated as fuel ethanol consumption minus the amount of denaturant in fuel ethanol consumed.
Denaturant in fuel ethanol consumed is estimated by multiplying denaturant in fuel ethanol produced by the fuel
ethanol consumption‐to‐production ratio.
Table 10.4 Sources
Biodiesel Feedstock 2001 forward: Calculated as biodiesel production in thousand barrels multiplied by 5.433 million Btu per barrel (the
biodiesel feedstock factor—see "Biodiesel Feedstock" entry in the "Thermal Conversion Factor Source Documentation"
at the end of Appendix A).
Biodiesel Losses and Co-products 2001 forward: Calculated as biodiesel feedstock minus biodiesel production.
Biodiesel Production 2001–2005: U.S. Department of Agriculture, Commodity Credit Corporation, Bioenergy Program records. Annual data
are derived from quarterly data. Monthly data are estimated by dividing the annual data by the number of days in the
year and then multiplying by the number of days in the month.
2006: U.S. Department of Commerce, U.S. Census Bureau, "M311K—Fats and Oils: Production, Consumption, and
Stocks," data for soybean oil consumed in methyl esters (biodiesel). In addition, the U.S. Energy Information
Administration (EIA) estimates that 14.4 million gallons of yellow grease were consumed in methyl esters (biodiesel).
2007: U.S. Department of Commerce, U.S. Census Bureau, "M311K—Fats and Oils: Production, Consumption, and
Stocks," data for all fats and oils consumed in methyl esters (biodiesel).
2008: EIA, Monthly Biodiesel Production Report, December 2009 (release date October 2010), Table 11. Monthly data
for 2008 are estimated based on U.S. Department of Commerce, U.S. Census Bureau, M311K data, multiplied by the EIA
2008 annual value's share of the M311K 2008 annual value.
2009 and 2010: EIA, Monthly Biodiesel Production Report, monthly reports, Table 1.
2011–2017: EIA, Petroleum Supply Annual (PSA), annual reports, Table 1, data for renewable fuels except fuel ethanol.
2018: EIA, Petroleum Supply Monthly (PSM), monthly reports, Table 1, data for renewable fuels except fuel ethanol.
Biodiesel Trade 2001–2011: For imports, U.S. Department of Agriculture, data for the following Harmonized Tariff Schedule codes:
3824.90.40.20, "Fatty Esters Animal/Vegetable Mixture" (data through June 2010); and 3824.90.40.30,
"Biodiesel/Mixes" (data for July 2010–2011). For exports, U.S. Department of Agriculture, data for the following
Schedule B codes: 3824.90.40.00, "Fatty Substances Animal/Vegetable/Mixture" (data through 2010); and
3824.90.40.30, "Biodiesel <70%" (data for 2011). (The data above are converted from pounds to gallons by dividing by
7.4.) Although these categories include products other than biodiesel (such as biodiesel coprocessed with petroleum
feedstocks; and products destined for soaps, cosmetics, and other items), biodiesel is the largest component. In the
absence of other reliable data for biodiesel trade, EIA sees these data as good substitutes.
2012–2017: EIA, PSA, annual reports, Tables 25 and 31, data for biomass‐based diesel fuel.

188 U. S. Energy Information Administration / Monthly Energy Review March 2019
2018: EIA, PSM, monthly reports, Tables 37 and 49, data for biomass‐based diesel fuel.
Biodiesel Stocks and Stock Change 2009 forward: EIA, biodiesel data from EIA‐22M, "Monthly Biodiesel Production Survey"; and biomass‐based diesel fuel
data from EIA‐810, "Monthly Refinery Report," EIA‐812, "Monthly Product Pipeline Report," and EIA‐815, "Monthly Bulk
Terminal and Blender Report."
Biodiesel Consumption 2001–2008: Calculated as biodiesel production plus biodiesel net imports.
January and February 2009: EIA, PSA, Table 1, data for refinery and blender net inputs of renewable fuels except fuel
ethanol.
March 2009 forward: Calculated as biodiesel production plus biodiesel net imports minus biodiesel stock change.
Other Renewable Fuels 2009 forward: Consumption data for "Other Renewable Diesel Fuel" are set equal to refinery and blender net inputs
data from EIA, EIA‐810, “Monthly Refinery Report,” and EIA‐815, “Monthly Bulk Terminal and Blender Report” (data are
converted to Btu by multiplying by the other renewable diesel fuel heat content factor in Table A1). Consumption data
for “Other Renewable Fuels” are set equal to refinery and blender net inputs data from EIA, EIA‐810, “Monthly Refinery
Report,” and EIA‐815, “Monthly Bulk Terminal and Blender Report” (data are converted to Btu by multiplying by the
other renewable fuels heat content factor in Table A1). "Other Renewable Fuels" in Table 10.4 is calculated as other
renewable diesel fuel consumption plus other renewable fuels consumption.
Table 10.5 Sources
Distributed Solar Energy Consumption: Heat
Annual Data 1989–2009: Annual estimates by the U.S. Energy Information Administration (EIA) based on EIA, Form EIA‐63A, "Annual
Solar Thermal Collector/Reflector Shipments Report." Solar energy consumption by solar thermal non‐electric
applications (mainly in the residential sector, but with some in the commercial and industrial sectors) is based on
assumptions about the stock of equipment in place and other factors.
2010 forward: Annual estimates based on commercial sector solar thermal growth rates from EIA's Annual Energy
Outlook (AEO) data system. (Annual estimates are subject to revision when a new AEO is released.)
Monthly Data 1989–2013: Monthly estimates for each year are obtained by allocating a given year's annual value to the months in
that year. Each month's allocator is the average of that month's "Distributed Solar Energy Consumption: Electricity,
Total" values in 2014 and 2015. The allocators, when rounded, are as follows: January—5%; February—6%; March—8%;
April—9%; May—10%; June—10%; July—10%; August—10%; September—9%; October—9%; November—7%; and
December—7%.
2014 forward: Once all 12 months of "Distributed Solar Energy Consumption: Electricity, Total" data are available for a
given year, they are used as allocators and applied to the annual estimate in order to derive monthly estimates for that
year. Initial monthly estimates for the current year use the previous year’s allocators.
Distributed Solar Energy Consumption: Electricity, Residential Sector Beginning in 2014, monthly and annual data for residential sector distributed (small‐scale) solar photovoltaic generation
are from EIA, Electric Power Monthly, Table 1.2.E. Those data are converted to consumption data in Btu by multiplying
by the total fossil fuels heat rate factors in MER Table A6.

U. S. Energy Information Administration / Monthly Energy Review March 2019 189
Backcasts for earlier periods are developed as follows:
Annual Data 1989–2003: Annual growth rates are calculated based on distributed (small‐scale) solar electricity consumption in all
sectors. Consumption is estimated using information on shipments of solar panels from EIA, Form EIA‐63B, "Annual
Photovoltaic Cell/Module Shipments Report," and assumptions about the stock of equipment in place and other factors.
The growth rates are applied to more recent data to create historical annual estimates.
2004–2008: Annual growth rates based on commercial sector solar photovoltaic growth rates from EIA's Annual Energy
Outlook (AEO) data system are applied to more recent data to create historical annual estimates. (Annual estimates are
subject to revision when a new AEO is released.)
2009–2013: Annual growth rates based on residential sector solar photovoltaic growth rates from EIA's Annual Energy
Outlook (AEO) data system are applied to more recent data to create historical annual estimates. (Annual estimates are
subject to revision when a new AEO is released.)
Monthly Data 1989–2013: See "Distributed Solar Energy Consumption: Heat, Monthly Data."
Distributed Solar Energy Consumption: Electricity, Commercial Sector Beginning in 2014, monthly and annual data for commercial sector distributed (small‐scale) solar photovoltaic
generation are from EIA, Electric Power Monthly, Table 1.2.C. Those data are converted to consumption data in Btu by
multiplying by the total fossil fuels heat rate factors in MER Table A6.
Backcasts for earlier periods are developed as follows:
Annual Data 1989–2003: Annual growth rates based on EIA, Form EIA‐63B, "Annual Photovoltaic Cell/Module Shipments Report,"
are applied to more recent data to create historical annual estimates. (See "Distributed Solar Energy Consumption:
Electricity, Residential Sector" sources above for details.)
2004–2013: Annual growth rates based on commercial sector solar photovoltaic growth rates from EIA's Annual Energy
Outlook (AEO) data system are applied to more recent data to create historical annual estimates. (Annual estimates are
subject to revision when a new AEO is released.)
Monthly Data 1989–2013: See "Distributed Solar Energy Consumption: Heat, Monthly Data."
Distributed Solar Energy Consumption: Electricity, Industrial Sector Beginning in 2014, monthly and annual data for industrial sector distributed (small‐scale) solar photovoltaic generation
are from EIA, Electric Power Monthly, Table 1.2.D. Those data are converted to consumption data in Btu by multiplying
by the total fossil fuels heat rate factors in MER Table A6.
Backcasts for earlier periods are developed as follows:
Annual Data 1989–2003: Annual growth rates based on EIA, Form EIA‐63B, "Annual Photovoltaic Cell/Module Shipments Report,"
are applied to more recent data to create historical annual estimates. (See "Distributed Solar Energy Consumption:
Electricity, Residential Sector" sources above for details.)
2004–2013: Annual growth rates based on commercial sector solar photovoltaic growth rates from EIA's Annual Energy
Outlook (AEO) data system are applied to more recent data to create historical annual estimates. (Annual estimates are
subject to revision when a new AEO is released.)

190 U. S. Energy Information Administration / Monthly Energy Review March 2019
Monthly Data 1989–2013: See "Distributed Solar Energy Consumption: Heat, Monthly Data."
Distributed Solar Energy Consumption: Electricity, Total 1989 forward: Distributed (small‐scale) solar energy consumption for total electricity is the sum of the distributed solar
energy consumption (for electricity) values for the residential, commercial, and industrial sectors.
Distributed Solar Energy Consumption: Total 1989 forward: Distributed (small‐scale) solar energy consumption total is the sum of distributed solar energy
consumption values for heat and total electricity.
Utility-Scale Solar Energy Consumption: Electricity, Commercial Sector 2008 forward: Commercial sector solar photovoltaic and solar thermal electricity net generation data from EIA, Form
EIA‐923, "Power Plant Operations Report," are converted to Btu by multiplying by the total fossil fuels heat rate factors
in Table A6.
Utility-Scale Solar Energy Consumption: Electricity, Industrial Sector 2010 forward: Industrial sector solar photovoltaic and solar thermal electricity net generation data from EIA, Form EIA‐
923, "Power Plant Operations Report," are converted to Btu by multiplying by the total fossil fuels heat rate factors in
Table A6.
Utility-Scale Solar Energy Consumption: Electricity, Electric Power Sector 1984 forward: Electric power sector solar photovoltaic and solar thermal electricity net generation data from Table 7.2b
are converted to Btu by multiplying the total fossil fuels heat rate factors in Table A6.
Utility-Scale Solar Energy Consumption: Electricity, Total 1984 forward: Utility‐scale solar energy consumption for total electricity is the sum of the utility‐scale solar energy
consumption (for electricity) values for the commercial, industrial, and electric power sectors.
Solar Energy Consumption: Total 1984 forward: Total solar energy consumption is the sum of the values for total distributed solar energy consumption
and total utility‐scale solar energy consumption.

11. International Petroleum
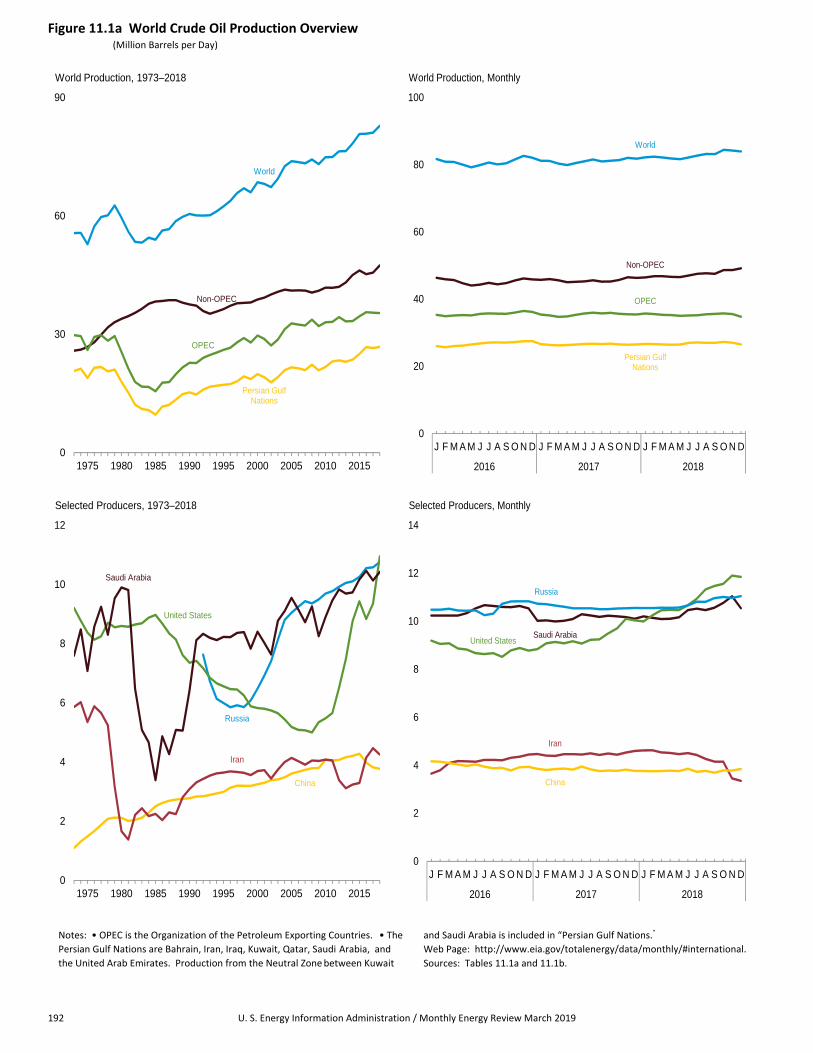
192 U. S. Energy Information Administration / Monthly Energy Review March 2019
Figure 11.1a World Crude Oil Production Overview (Million Barrels per Day)
Non-OPEC
Persian Gulf Nations
OPEC
World
0
30
60
90
1975 1980 1985 1990 1995 2000 2005 2010 2015
World Production, 1973–2018
World
Non-OPEC
Persian Gulf Nations
OPEC
0
20
40
60
80
100
J F M A M J J A S O N D J F M A M J J A S O N D J F M A M J J A S O N D
2016 2017 2018
World Production, Monthly
Russia
China
Iran
United States
Saudi Arabia
0
2
4
6
8
10
12
1975 1980 1985 1990 1995 2000 2005 2010 2015
Selected Producers, 1973–2018
Saudi Arabia United States
Russia
Iran
China
0
2
4
6
8
10
12
14
J F M A M J J A S O N D J F M A M J J A S O N D J F M A M J J A S O N D
2016 2017 2018
Selected Producers, Monthly
Notes: • OPEC is the Organization of the Petroleum Exporting Countries. • The
Persian Gulf Nations are Bahrain, Iran, Iraq, Kuwait, Qatar, Saudi Arabia, and
the United Arab Emirates. Production from the Neutral Zone between Kuwait
and Saudi Arabia is included in “Persian Gulf Nations.”
Web Page: http://www.eia.gov/totalenergy/data/monthly/#international.
Sources: Tables 11.1a and 11.1b.

U. S. Energy Information Administration / Monthly Energy Review March 2019 193
Figure 11.1b World Crude Oil Production by Selected Countries (Million Barrels per Day)
1.291
3.451
10.545
1.460
2.010
0.957
2.850
4.815
3.351
0.200
0.519
1.592
1.242
11.849
1.086
11.051
1.535
1.733
0.635
3.845
4.379
1.710
3.165
10.105
1.500
2.099
0.999
2.732
4.393
4.596
0.200
0.520
1.640
1.306
10.040
0.741
10.553
1.567
1.903
0.635
3.764
4.287
0 2 4 6 8 10 12 14
Venezuela
United Arab Emirates
Saudi Arabia
Qatar
Nigeria
Libya
Kuwait
Iraq
Iran
Gabon
Ecuador
Angola
Algeria
United States
United Kingdom
Russia
Norway
Mexico
Egypt
China
Canada
Selected Non-OPEC and OPEC Countries
December 2017
December 2018
Note: OPEC is the Organization of the Petroleum Exporting Countries.
Web Page: http://www.eia.gov/totalenergy/data/monthly/#international.
Sources: Tables 11.1a and 11.1b.
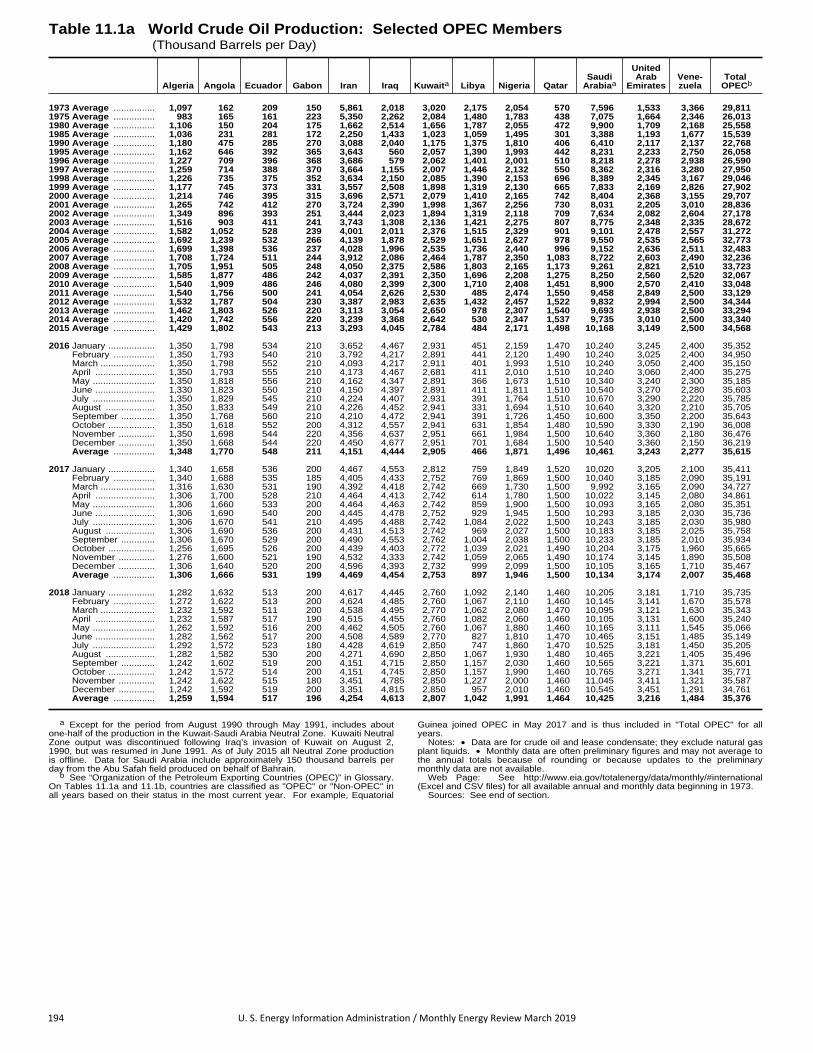
194 U. S. Energy Information Administration / Monthly Energy Review March 2019
Table 11.1a World Crude Oil Production: Selected OPEC Members (Thousand Barrels per Day)
Algeria Angola Ecuador Gabon Iran Iraq Kuwaita Libya Nigeria QatarSaudi
Arabiaa
UnitedArab
EmiratesVene-zuela
Total OPECb
1973 Average ................ 1,097 162 209 150 5,861 2,018 3,020 2,175 2,054 570 7,596 1,533 3,366 29,8111975 Average ................ 983 165 161 223 5,350 2,262 2,084 1,480 1,783 438 7,075 1,664 2,346 26,0131980 Average ................ 1,106 150 204 175 1,662 2,514 1,656 1,787 2,055 472 9,900 1,709 2,168 25,5581985 Average ................ 1,036 231 281 172 2,250 1,433 1,023 1,059 1,495 301 3,388 1,193 1,677 15,5391990 Average ................ 1,180 475 285 270 3,088 2,040 1,175 1,375 1,810 406 6,410 2,117 2,137 22,7681995 Average ................ 1,162 646 392 365 3,643 560 2,057 1,390 1,993 442 8,231 2,233 2,750 26,0581996 Average ................ 1,227 709 396 368 3,686 579 2,062 1,401 2,001 510 8,218 2,278 2,938 26,5901997 Average ................ 1,259 714 388 370 3,664 1,155 2,007 1,446 2,132 550 8,362 2,316 3,280 27,9501998 Average ................ 1,226 735 375 352 3,634 2,150 2,085 1,390 2,153 696 8,389 2,345 3,167 29,0461999 Average ................ 1,177 745 373 331 3,557 2,508 1,898 1,319 2,130 665 7,833 2,169 2,826 27,9022000 Average ................ 1,214 746 395 315 3,696 2,571 2,079 1,410 2,165 742 8,404 2,368 3,155 29,7072001 Average ................ 1,265 742 412 270 3,724 2,390 1,998 1,367 2,256 730 8,031 2,205 3,010 28,8362002 Average ................ 1,349 896 393 251 3,444 2,023 1,894 1,319 2,118 709 7,634 2,082 2,604 27,1782003 Average ................ 1,516 903 411 241 3,743 1,308 2,136 1,421 2,275 807 8,775 2,348 2,335 28,6722004 Average ................ 1,582 1,052 528 239 4,001 2,011 2,376 1,515 2,329 901 9,101 2,478 2,557 31,2722005 Average ................ 1,692 1,239 532 266 4,139 1,878 2,529 1,651 2,627 978 9,550 2,535 2,565 32,7732006 Average ................ 1,699 1,398 536 237 4,028 1,996 2,535 1,736 2,440 996 9,152 2,636 2,511 32,4832007 Average ................ 1,708 1,724 511 244 3,912 2,086 2,464 1,787 2,350 1,083 8,722 2,603 2,490 32,2362008 Average ................ 1,705 1,951 505 248 4,050 2,375 2,586 1,803 2,165 1,173 9,261 2,821 2,510 33,7232009 Average ................ 1,585 1,877 486 242 4,037 2,391 2,350 1,696 2,208 1,275 8,250 2,560 2,520 32,0672010 Average ................ 1,540 1,909 486 246 4,080 2,399 2,300 1,710 2,408 1,451 8,900 2,570 2,410 33,0482011 Average ................ 1,540 1,756 500 241 4,054 2,626 2,530 485 2,474 1,550 9,458 2,849 2,500 33,1292012 Average ................ 1,532 1,787 504 230 3,387 2,983 2,635 1,432 2,457 1,522 9,832 2,994 2,500 34,3442013 Average ................ 1,462 1,803 526 220 3,113 3,054 2,650 978 2,307 1,540 9,693 2,938 2,500 33,2942014 Average ................ 1,420 1,742 556 220 3,239 3,368 2,642 530 2,347 1,537 9,735 3,010 2,500 33,3402015 Average ................ 1,429 1,802 543 213 3,293 4,045 2,784 484 2,171 1,498 10,168 3,149 2,500 34,568
2016 January .................. 1,350 1,798 534 210 3,652 4,467 2,931 451 2,159 1,470 10,240 3,245 2,400 35,352 February ................ 1,350 1,793 540 210 3,792 4,217 2,891 441 2,120 1,490 10,240 3,025 2,400 34,950 March ..................... 1,350 1,798 552 210 4,093 4,217 2,911 401 1,993 1,510 10,240 3,050 2,400 35,150 April ....................... 1,350 1,793 555 210 4,173 4,467 2,681 411 2,010 1,510 10,240 3,060 2,400 35,275 May ........................ 1,350 1,818 556 210 4,162 4,347 2,891 366 1,673 1,510 10,340 3,240 2,300 35,185 June ....................... 1,330 1,823 550 210 4,150 4,397 2,891 411 1,811 1,510 10,540 3,270 2,280 35,603 July ........................ 1,350 1,829 545 210 4,224 4,407 2,931 391 1,764 1,510 10,670 3,290 2,220 35,785 August ................... 1,350 1,833 549 210 4,226 4,452 2,941 331 1,694 1,510 10,640 3,320 2,210 35,705 September ............. 1,350 1,768 560 210 4,210 4,472 2,941 391 1,726 1,450 10,600 3,350 2,200 35,643 October .................. 1,350 1,618 552 200 4,312 4,557 2,941 631 1,854 1,480 10,590 3,330 2,190 36,008 November .............. 1,350 1,698 544 220 4,356 4,637 2,951 661 1,984 1,500 10,640 3,360 2,180 36,476 December .............. 1,350 1,668 544 220 4,450 4,677 2,951 701 1,684 1,500 10,540 3,360 2,150 36,219 Average ................ 1,348 1,770 548 211 4,151 4,444 2,905 466 1,871 1,496 10,461 3,243 2,277 35,615
2017 January .................. 1,340 1,658 536 200 4,467 4,553 2,812 759 1,849 1,520 10,020 3,205 2,100 35,411 February ................ 1,340 1,688 535 185 4,405 4,433 2,752 769 1,869 1,500 10,040 3,185 2,090 35,191 March ..................... 1,316 1,630 531 190 4,392 4,418 2,742 669 1,730 1,500 9,992 3,165 2,090 34,727 April ....................... 1,306 1,700 528 210 4,464 4,413 2,742 614 1,780 1,500 10,022 3,145 2,080 34,861 May ........................ 1,306 1,660 533 200 4,464 4,463 2,742 859 1,900 1,500 10,093 3,165 2,080 35,351 June ....................... 1,306 1,690 540 200 4,445 4,478 2,752 929 1,945 1,500 10,293 3,185 2,030 35,736 July ........................ 1,306 1,670 541 210 4,495 4,488 2,742 1,084 2,022 1,500 10,243 3,185 2,030 35,980 August ................... 1,306 1,690 536 200 4,431 4,513 2,742 969 2,027 1,500 10,183 3,185 2,025 35,758 September ............. 1,306 1,670 529 200 4,490 4,553 2,762 1,004 2,038 1,500 10,233 3,185 2,010 35,934 October .................. 1,256 1,695 526 200 4,439 4,403 2,772 1,039 2,021 1,490 10,204 3,175 1,960 35,665 November .............. 1,276 1,600 521 190 4,532 4,333 2,742 1,059 2,065 1,490 10,174 3,145 1,890 35,508 December .............. 1,306 1,640 520 200 4,596 4,393 2,732 999 2,099 1,500 10,105 3,165 1,710 35,467 Average ................ 1,306 1,666 531 199 4,469 4,454 2,753 897 1,946 1,500 10,134 3,174 2,007 35,468
2018 January .................. 1,282 1,632 513 200 4,617 4,445 2,760 1,092 2,140 1,460 10,205 3,181 1,710 35,735 February ................ 1,272 1,622 513 200 4,624 4,485 2,760 1,067 2,110 1,460 10,145 3,141 1,670 35,578 March ..................... 1,232 1,592 511 200 4,538 4,495 2,770 1,062 2,080 1,470 10,095 3,121 1,630 35,343 April ....................... 1,232 1,587 517 190 4,515 4,455 2,760 1,082 2,060 1,460 10,105 3,131 1,600 35,240 May ........................ 1,262 1,592 516 200 4,462 4,505 2,760 1,067 1,880 1,460 10,165 3,111 1,545 35,066 June ....................... 1,282 1,562 517 200 4,508 4,589 2,770 827 1,810 1,470 10,465 3,151 1,485 35,149 July ........................ 1,292 1,572 523 180 4,428 4,619 2,850 747 1,860 1,470 10,525 3,181 1,450 35,205 August ................... 1,282 1,582 530 200 4,271 4,690 2,850 1,067 1,930 1,480 10,465 3,221 1,405 35,496 September ............. 1,242 1,602 519 200 4,151 4,715 2,850 1,157 2,030 1,460 10,565 3,221 1,371 35,601 October .................. 1,242 1,572 514 200 4,151 4,745 2,850 1,157 1,990 1,460 10,765 3,271 1,341 35,771 November .............. 1,242 1,622 515 180 3,451 4,785 2,850 1,227 2,000 1,460 11,045 3,411 1,321 35,587 December .............. 1,242 1,592 519 200 3,351 4,815 2,850 957 2,010 1,460 10,545 3,451 1,291 34,761 Average ................ 1,259 1,594 517 196 4,254 4,613 2,807 1,042 1,991 1,464 10,425 3,216 1,484 35,376
a Except for the period from August 1990 through May 1991, includes aboutone-half of the production in the Kuwait-Saudi Arabia Neutral Zone. Kuwaiti NeutralZone output was discontinued following Iraq’s invasion of Kuwait on August 2,1990, but was resumed in June 1991. As of July 2015 all Neutral Zone productionis offline. Data for Saudi Arabia include approximately 150 thousand barrels perday from the Abu Safah field produced on behalf of Bahrain.
b See “Organization of the Petroleum Exporting Countries (OPEC)” in Glossary.On Tables 11.1a and 11.1b, countries are classified as "OPEC" or "Non-OPEC" inall years based on their status in the most current year. For example, Equatorial
Guinea joined OPEC in May 2017 and is thus included in "Total OPEC" for allyears.
Notes: • Data are for crude oil and lease condensate; they exclude natural gasplant liquids. • Monthly data are often preliminary figures and may not average tothe annual totals because of rounding or because updates to the preliminarymonthly data are not available.
Web Page: See http://www.eia.gov/totalenergy/data/monthly/#international(Excel and CSV files) for all available annual and monthly data beginning in 1973.
Sources: See end of section.

U. S. Energy Information Administration / Monthly Energy Review March 2019 195
Table 11.1b World Crude Oil Production: Persian Gulf Nations, Non-OPEC, and World (Thousand Barrels per Day)
PersianGulf
Nationsb
Selected Non-OPECa ProducersTotalNon-
OPECa WorldCanada China Egypt Mexico NorwayFormerU.S.S.R. Russia
UnitedKingdom
UnitedStates
1973 Average .................... 20,668 1,798 1,090 165 465 32 8,324 – – 2 9,208 25,833 55,6791975 Average .................... 18,934 1,430 1,490 235 705 189 9,523 – – 12 8,375 26,779 52,8281980 Average .................... 17,961 1,435 2,114 595 1,936 486 11,706 – – 1,622 8,597 33,935 59,5581985 Average .................... 9,630 1,471 2,505 887 2,745 773 11,585 – – 2,530 8,971 38,306 53,9651990 Average .................... 15,278 1,553 2,774 873 2,553 1,630 10,975 – – 1,820 7,355 37,564 60,4971995 Average .................... 17,208 1,805 2,990 920 2,711 2,766 – – 5,995 2,489 6,560 36,376 62,4341996 Average .................... 17,367 1,837 3,131 922 2,944 3,091 – – 5,850 2,568 6,465 37,228 63,8181997 Average .................... 18,095 1,922 3,200 856 3,104 3,142 – – 5,920 2,518 6,452 37,856 65,8061998 Average .................... 19,337 1,981 3,198 834 3,160 3,011 – – 5,854 2,616 6,252 37,985 67,0321999 Average .................... 18,667 1,907 3,195 852 2,998 3,019 – – 6,079 2,684 5,881 38,065 65,9672000 Average .................... 19,897 1,977 3,249 768 3,104 3,222 – – 6,479 2,275 5,822 38,820 68,5272001 Average .................... 19,114 2,029 3,300 720 3,218 3,226 – – 6,917 2,282 5,801 39,296 68,1322002 Average .................... 17,824 2,171 3,390 715 3,263 3,131 – – 7,408 2,292 5,744 40,112 67,2902003 Average .................... 19,154 2,306 3,409 713 3,459 3,042 – – 8,132 2,093 5,649 40,788 69,4602004 Average .................... 20,906 2,398 3,485 673 3,476 2,954 – – 8,805 1,845 5,441 41,323 72,5952005 Average .................... 21,644 2,369 3,609 623 3,423 2,698 – – 9,043 1,649 5,184 41,097 73,8692006 Average .................... 21,377 2,525 3,673 616 3,345 2,491 – – 9,247 1,490 5,086 41,138 73,6212007 Average .................... 20,904 2,628 3,736 608 3,143 2,270 – – 9,437 1,498 5,074 41,095 73,3312008 Average .................... 22,301 2,579 3,790 633 2,839 2,182 – – 9,357 1,391 5,000 40,578 74,3012009 Average .................... 20,898 2,579 3,796 649 2,646 2,067 – – 9,495 1,328 5,349 41,054 73,1212010 Average .................... 21,736 2,741 4,078 636 2,621 1,871 – – 9,694 1,233 5,478 41,839 74,8872011 Average .................... 23,102 2,901 4,052 637 2,600 1,760 – – 9,774 1,026 5,654 41,779 74,9082012 Average .................... 23,394 3,138 4,074 642 2,593 1,612 – – 9,922 888 6,502 42,023 76,3672013 Average .................... 23,037 3,325 4,164 645 2,562 1,533 – – 10,054 801 7,467 43,155 76,4492014 Average .................... 23,582 3,613 4,208 645 2,469 1,562 – – 10,107 787 8,759 45,021 78,3622015 Average .................... 24,989 3,677 4,278 686 2,302 1,610 – – 10,253 893 9,431 46,187 80,755
2016 January ...................... 26,054 3,877 4,166 671 2,294 1,657 – – 10,485 1,003 9,197 46,356 81,708 February .................... 25,704 3,797 4,150 662 2,247 1,675 – – 10,485 1,014 9,055 45,937 80,886 March ......................... 26,070 3,767 4,091 661 2,249 1,632 – – 10,522 987 9,081 45,675 80,825 April ........................... 26,180 3,429 4,039 665 2,210 1,666 – – 10,450 989 8,866 44,753 80,029 May ............................ 26,539 2,811 3,977 663 2,207 1,608 – – 10,440 991 8,824 44,050 79,235 June ........................... 26,807 3,112 4,038 660 2,213 1,480 – – 10,453 897 8,671 44,328 79,931 July ............................ 27,081 3,657 3,941 659 2,192 1,762 – – 10,254 980 8,635 44,864 80,650 August ....................... 27,138 3,855 3,878 653 2,179 1,603 – – 10,316 841 8,670 44,402 80,107 September ................. 27,072 3,849 3,892 647 2,146 1,430 – – 10,729 826 8,519 44,783 80,426 October ...................... 27,259 3,893 3,784 645 2,135 1,766 – – 10,826 760 8,787 45,563 81,572 November .................. 27,493 4,135 3,918 635 2,105 1,785 – – 10,832 948 8,888 46,156 82,632 December .................. 27,527 3,968 3,937 626 2,067 1,706 – – 10,830 961 8,778 45,871 82,091 Average .................... 26,748 3,679 3,983 654 2,187 1,648 – – 10,551 933 8,831 45,227 80,842
2017 January ...................... 26,622 4,097 3,855 630 2,054 1,653 – – 10,733 970 8,840 45,756 81,167 February .................... 26,360 4,137 3,803 622 2,051 1,693 – – 10,713 945 9,083 45,970 81,161 March ......................... 26,254 3,917 3,843 613 2,053 1,745 – – 10,654 943 9,140 45,625 80,352 April ........................... 26,331 3,577 3,863 622 2,046 1,738 – – 10,603 915 9,085 45,063 79,924 May ............................ 26,472 3,690 3,822 630 2,053 1,636 – – 10,543 930 9,168 45,157 80,508 June ........................... 26,698 3,793 3,947 631 2,042 1,576 – – 10,543 937 9,074 45,302 81,038 July ............................ 26,698 3,990 3,832 628 2,020 1,653 – – 10,546 912 9,230 45,603 81,583 August ....................... 26,599 4,154 3,760 636 1,962 1,584 – – 10,507 831 9,244 45,213 80,971 September ................. 26,768 3,950 3,779 644 1,761 1,473 – – 10,503 885 9,495 45,236 81,170 October ...................... 26,528 3,902 3,769 638 1,933 1,576 – – 10,530 944 9,703 45,727 81,392 November .................. 26,461 4,230 3,820 634 1,896 1,520 – – 10,543 979 10,103 46,536 82,044 December .................. 26,536 4,287 3,764 635 1,903 1,567 – – 10,553 741 10,040 46,333 81,800 Average .................... 26,528 3,977 3,821 630 1,981 1,618 – – 10,580 911 9,352 45,625 81,092
2018 January ...................... 26,708 4,131 3,763 634 1,953 1,650 – – 10,550 R 1,020 E 9,995 R 46,491 R 82,226 February .................... 26,655 4,284 3,753 639 1,919 1,598 – – 10,552 R 1,007 E 10,248 R 46,830 R 82,408 March ......................... 26,529 4,309 3,758 639 1,888 1,549 – – 10,566 R 950 E 10,461 R 46,817 R 82,160 April ........................... 26,466 3,996 3,774 645 1,911 1,544 – – 10,562 R 1,077 E 10,475 R 46,619 R 81,859 May ............................ 26,503 4,206 3,761 647 1,891 1,348 – – 10,569 R 992 E 10,464 R 46,572 R 81,638 June ........................... 26,993 4,188 3,857 614 1,871 1,517 – – 10,663 R 953 E 10,672 R 47,040 R 82,189 July ............................ 27,113 4,311 3,732 637 1,865 1,556 – – 10,814 R 1,003 E 10,936 R 47,533 R 82,738 August ....................... 27,017 4,520 3,768 645 1,841 1,535 – – 10,811 R 927 E 11,325 R 47,697 R 83,193 September ................. 27,002 4,174 3,694 643 1,849 1,335 – – 10,964 R 902 E 11,470 R 47,552 R 83,153 October ...................... 27,282 4,420 3,789 636 R 1,985 1,511 – – 11,014 R 1,043 RE 11,559 R 48,680 R 84,451 November .................. 27,042 4,225 3,779 641 R 1,720 1,525 – – 10,972 R 1,037 RE 11,905 R 48,660 R 84,247 December .................. 26,512 4,379 3,845 635 1,733 1,535 – – 11,051 1,086 E 11,849 49,180 83,941 Average .................... 26,819 4,263 3,773 638 1,869 1,517 – – 10,759 1,000 E 10,950 47,478 82,854
a See "Organization of the Petroleum Exporting Countries (OPEC)" in Glossary.On Tables 11.1a and 11.1b, countries are classified as "OPEC" or "Non-OPEC" inall years based on their status in the most current year. For example, EquatorialGuinea joined OPEC in May 2017 and is thus included in "Total OPEC" for allyears.
b Bahrain, Iran, Iraq, Kuwait, Qatar, Saudi Arabia, United Arab Emirates, andthe Neutral Zone (between Kuwait and Saudi Arabia).
R=Revised. – – =Not applicable. E=Estimate. Notes: • Data are for crude oil and lease condensate; they exclude natural gas
plant liquids. • Monthly data are often preliminary figures and may not average tothe annual totals because of rounding or because updates to the preliminarymonthly data are not available. • Data for countries may not sum to World totalsdue to independent rounding. • U.S. geographic coverage is the 50 states and theDistrict of Columbia.
Web Page: See http://www.eia.gov/totalenergy/data/monthly/#international(Excel and CSV files) for all available annual and monthly data beginning in 1973.
Sources: See end of section.

196 U. S. Energy Information Administration / Monthly Energy Review March 2019
Figure 11.2 Petroleum Consumption in OECD Countries (Million Barrels per Day)
World
OECD
United States
OECD Europe Japan
0
20
40
60
80
100
120
1975 1980 1985 1990 1995 2000 2005 2010 2015
Overview, 1973–2018
48.114 48.26647.070
0
20
40
60
2016 2017 2018
OECD Total, December
20.479
2.592
4.198
2.305
1.620
1.202
2.195
1.578
20.323
2.721
4.497
2.475
1.603
1.220
2.309
1.692
0 5 10 15 20 25
United States
South Korea
Japan
Canada
United Kingdom
Italy
Germany
France
By Selected OECD Countries
December 2017
December 2018
Note: OECD is the Organization for Economic Cooperation and
Development. Web Page: http://www.eia.gov/totalenergy/data/monthly/#international.
Source: Table 11.2.

U. S. Energy Information Administration / Monthly Energy Review March 2019 197
Table 11.2 Petroleum Consumption in OECD Countries (Thousand Barrels per Day)
France Germanya ItalyUnited
KingdomOECD
Europeb Canada JapanSouthKorea
UnitedStates
OtherOECDc OECDd World
1973 Average .................... 2,601 3,324 2,068 2,341 15,879 1,729 4,949 281 17,308 1,768 41,913 57,2371975 Average .................... 2,252 2,957 1,855 1,911 14,314 1,779 4,621 311 16,322 1,885 39,232 56,1981980 Average .................... 2,256 3,082 1,934 1,725 14,995 1,873 4,960 537 17,056 2,449 41,870 63,1131985 Average .................... 1,753 2,651 1,705 1,617 12,769 1,514 4,436 552 15,726 2,699 37,696 58,1761990 Average .................... 1,827 2,682 1,868 1,776 13,789 1,722 5,223 1,048 16,988 2,968 41,738 66,6601995 Average .................... 1,915 2,882 1,942 1,816 14,899 1,799 5,581 2,008 17,725 3,453 45,465 69,8611996 Average .................... 1,943 2,922 1,920 1,852 15,216 1,853 5,587 2,101 18,309 3,486 46,552 71,9131997 Average .................... 1,962 2,917 1,934 1,810 15,354 1,940 5,545 2,255 18,620 3,577 47,292 73,1291998 Average .................... 2,040 2,923 1,943 1,792 15,653 1,931 5,348 1,917 18,917 3,649 47,415 73,9501999 Average .................... 2,034 2,836 1,891 1,811 15,558 2,016 5,486 2,084 19,519 3,750 48,414 75,6042000 Average .................... 2,001 2,767 1,854 1,765 15,399 2,008 5,361 2,135 19,701 3,850 48,454 77,1472001 Average .................... 2,054 2,807 1,835 1,747 15,585 2,029 5,269 2,132 19,649 3,796 48,459 77,9212002 Average .................... 1,991 2,710 1,870 1,739 15,546 2,040 5,314 2,149 19,761 3,800 48,610 78,6482003 Average .................... 2,001 2,679 1,860 1,759 15,670 2,155 5,296 2,175 20,034 3,767 49,096 80,2732004 Average .................... 2,008 2,648 1,829 1,789 15,774 2,233 5,159 2,155 20,731 3,976 50,029 83,4112005 Average .................... 1,990 2,624 1,781 1,819 15,856 2,326 5,164 2,191 20,802 4,039 50,378 84,6452006 Average .................... 1,991 2,636 1,777 1,805 15,905 2,322 5,038 2,180 20,687 4,051 50,183 85,8472007 Average .................... 1,975 2,407 1,729 1,751 15,637 2,412 4,904 2,240 20,680 4,190 50,064 87,2572008 Average .................... 1,935 2,533 1,667 1,729 15,489 2,324 4,667 2,142 19,498 4,134 48,254 86,8242009 Average .................... 1,859 2,434 1,544 1,649 14,763 2,269 4,266 2,188 18,771 4,020 46,278 85,8602010 Average .................... 1,818 2,467 1,544 1,624 14,731 2,380 4,340 2,269 19,180 3,920 46,819 88,6932011 Average .................... 1,778 2,392 1,494 1,582 14,256 2,408 4,353 2,259 18,887 4,121 46,284 89,4892012 Average .................... 1,736 2,389 1,370 1,534 13,791 2,453 4,631 2,322 18,487 4,162 45,845 90,8272013 Average .................... 1,714 2,435 1,260 1,512 13,606 2,429 4,487 2,328 18,967 4,073 45,891 92,2592014 Average .................... 1,691 2,374 1,266 1,518 13,529 2,387 4,261 2,348 19,100 3,988 45,613 93,8742015 Average .................... 1,691 2,368 1,274 1,556 13,828 2,417 4,142 2,473 19,534 3,966 46,359 95,861
2016 January ...................... 1,565 2,274 1,092 1,490 12,895 2,462 4,365 2,670 19,063 3,996 45,450 NA February .................... 1,677 2,440 1,226 1,639 13,862 2,426 4,650 2,726 19,847 4,175 47,685 NA March ......................... 1,714 2,448 1,236 1,535 13,914 2,395 4,376 2,509 19,728 4,072 46,994 NA April ........................... 1,658 2,451 1,265 1,608 13,996 2,352 3,943 2,493 19,340 3,999 46,123 NA May ............................ 1,657 2,259 1,230 1,546 13,618 2,396 3,550 2,550 19,328 3,915 45,356 NA June ........................... 1,575 2,286 1,286 1,651 14,036 2,483 3,531 2,519 19,846 4,043 46,458 NA July ............................ 1,677 2,372 1,289 1,548 14,051 2,492 3,750 2,448 19,776 3,989 46,505 NA August ....................... 1,697 2,425 1,235 1,605 14,583 2,623 3,831 2,660 20,275 4,063 48,034 NA September ................. 1,733 2,399 1,303 1,643 14,547 2,549 3,693 2,617 19,757 3,998 47,161 NA October ...................... 1,662 2,431 1,221 1,591 14,282 2,438 3,748 2,507 19,650 3,896 46,522 NA November .................. 1,560 2,475 1,190 1,593 14,075 2,481 4,128 2,755 19,659 4,062 47,159 NA December .................. 1,654 2,347 1,271 1,561 14,058 2,558 4,567 2,818 19,984 4,129 48,114 NA Average .................... 1,652 2,383 1,237 1,583 13,992 2,471 4,010 2,605 19,687 4,027 46,793 96,934
2017 January ...................... 1,737 2,342 1,132 1,450 13,491 2,373 4,148 2,597 19,323 3,778 45,708 NA February .................... 1,704 2,421 1,184 1,658 13,885 2,349 4,533 2,664 19,190 R 4,062 R 46,683 NA March ......................... 1,708 2,577 1,235 1,497 14,102 2,398 4,250 2,599 20,060 4,113 47,523 NA April ........................... 1,624 2,438 1,149 1,634 13,833 2,182 3,786 2,451 19,595 4,064 45,911 NA May ............................ 1,669 2,492 1,234 1,519 14,214 2,435 3,500 2,521 20,066 R 4,148 R 46,884 NA June ........................... 1,746 2,495 1,324 1,634 14,713 2,460 3,469 2,492 20,561 R 4,166 47,861 NA July ............................ 1,728 2,498 1,302 1,592 14,611 2,487 3,583 2,565 20,119 4,009 R 47,374 NA August ....................... 1,712 2,500 1,233 1,589 14,548 2,583 3,693 2,548 20,251 4,129 R 47,751 NA September ................. 1,847 2,475 1,283 1,650 14,964 2,498 3,624 2,611 19,641 4,085 47,424 NA October ...................... 1,622 2,416 1,294 1,569 14,489 2,504 3,596 2,564 19,990 R 3,922 R 47,064 NA November .................. 1,676 2,556 1,240 1,632 14,552 2,586 4,093 2,680 20,307 4,097 R 48,315 NA December .................. 1,692 2,309 1,220 1,603 14,165 2,475 4,497 2,721 20,323 4,086 48,266 NA Average .................... 1,705 2,460 1,236 1,584 14,298 2,445 3,894 2,584 19,958 4,054 47,233 R 98,458
2018 January ...................... 1,590 2,204 1,163 1,441 R 13,323 2,360 4,257 2,704 20,461 4,041 R 47,146 NA February .................... 1,784 2,511 1,301 1,702 R 14,639 2,377 4,556 2,686 19,619 4,167 R 48,043 NA March ......................... 1,759 2,396 1,281 1,573 R 14,339 2,236 4,031 2,502 20,573 4,206 R 47,887 NA April ........................... 1,699 2,340 1,270 1,634 R 14,164 2,253 3,604 2,544 19,941 4,051 R 46,556 NA May ............................ 1,657 2,263 1,261 1,561 R 14,011 2,408 3,437 2,559 20,357 4,137 R 46,908 NA June ........................... 1,714 2,310 1,292 1,655 R 14,465 2,371 3,238 2,537 20,705 4,157 R 47,473 NA July ............................ 1,789 2,338 1,339 1,554 R 14,836 2,548 3,504 2,511 20,621 4,120 R 48,140 NA August ....................... 1,713 2,364 1,262 1,633 R 14,710 2,538 3,599 2,484 21,302 4,081 R 48,714 NA September ................. 1,704 2,329 1,284 1,653 R 14,443 2,590 3,496 2,455 19,951 4,057 R 46,992 NA October ...................... 1,825 2,346 1,317 1,536 R 14,573 2,636 3,623 2,274 20,774 R 4,040 R 47,920 NA November .................. 1,643 2,323 R 1,251 R 1,674 R 14,179 R 2,515 3,862 2,426 R 20,548 R 4,070 R 47,599 NA December .................. 1,578 2,195 1,202 1,621 13,645 2,305 4,198 2,592 20,479 3,851 47,070 NA Average .................... 1,704 2,325 1,268 1,602 14,274 2,428 3,780 2,522 R 20,453 4,081 47,537 99,935
a Data are for unified Germany, i.e., the former East Germany and WestGermany.
b "OECD Europe" consists of Austria, Belgium, Denmark, Finland, France,Germany, Greece, Iceland, Ireland, Italy, Luxembourg, the Netherlands, Norway,Portugal, Spain, Sweden, Switzerland, Turkey, and the United Kingdom; for 1984forward, Czech Republic, Hungary, Poland, and Slovakia; and, for 2000 forward,Slovenia.
c "Other OECD" consists of Australia, New Zealand, and the U.S. Territories; for1984 forward, Mexico; for 2000 forward, Chile, Estonia, and Israel; and, for 2016forward, Latvia.
d The Organization for Economic Cooperation and Development (OECD)consists of "OECD Europe," Canada, Japan, South Korea, the United States, and"Other OECD."
R=Revised. NA=Not available.
Notes: • Totals may not equal sum of components due to independentrounding. • U.S. geographic coverage is the 50 states and the District ofColumbia.
Web Page: See http://www.eia.gov/totalenergy/data/monthly/#international(Excel and CSV files) for all available annual and monthly data beginning in 1973.
Sources: • United States: Table 3.1. • Chile, East Germany, FormerCzechoslovakia, Hungary, Mexico, Poland, South Korea, Non-OECDCountries, U.S. Territories, and World: 1973–1979—U.S. Energy InformationAdministration (EIA), International Energy Database. • Countries Other ThanUnited States: 1980–2008—EIA, International Energy Statistics (IES). • OECDCountries, and U.S. Territories: 2009 forward—EIA, IES. • World: 2009forward—EIA, International Energy Statistics Database. • All OtherData:—International Energy Agency (IEA), Quarterly Oil Statistics and EnergyBalances in OECD Countries, various issues.

198 U. S. Energy Information Administration / Monthly Energy Review March 2019
Figure 11.3 Petroleum Stocks in OECD Countries (Billion Barrels)
OECD
United States
OECD Europe
Japan
0
1
2
3
4
5
1975 1980 1985 1990 1995 2000 2005 2010 2015
Overview, End of Year, 1973–2018
4.592
4.409 4.407
0
1
2
3
4
5
2016 2017 2018
OECD Stocks, End of Month, December
1.912
0.206
0.565
0.194
0.075
0.125
0.271
0.160
1.895
0.231
0.563
0.189
0.080
0.125
0.279
0.166
0.0 0.5 1.0 1.5 2.0 2.5
United States
South Korea
Japan
Canada
United Kingdom
Italy
Germany
France
Selected OECD Countries, End of Month
December 2017
December 2018
Note: OECD is the Organization for Economic Cooperation and Development.
Web Page: http://www.eia.gov/totalenergy/data/monthly/#international.
Source: Table 11.3.

U. S. Energy Information Administration / Monthly Energy Review March 2019 199
Table 11.3 Petroleum Stocks in OECD Countries (Million Barrels)
France Germanya ItalyUnited
KingdomOECD
Europeb Canada JapanSouthKorea
UnitedStates
OtherOECDc OECDd
1973 Year ......................... 201 181 152 156 1,070 140 303 NA 1,008 67 2,5881975 Year ......................... 225 187 143 165 1,154 174 375 NA 1,133 67 2,9031980 Year ......................... 243 319 170 168 1,464 164 495 NA 1,392 72 3,5871985 Year ......................... 139 277 156 131 1,154 112 500 13 1,519 119 3,4171990 Year ......................... 143 280 171 103 1,221 143 572 64 1,621 126 3,7481995 Year ......................... 155 302 162 101 1,260 132 631 92 1,563 122 3,7991996 Year ......................... 154 303 152 103 1,265 127 651 123 1,507 126 3,8001997 Year ......................... 161 299 147 100 1,277 144 685 124 1,560 123 3,9131998 Year ......................... 169 323 153 104 1,362 139 649 129 1,647 120 4,0451999 Year ......................... 160 290 148 101 1,263 141 629 132 1,493 113 3,7712000 Year ......................... 170 272 157 100 1,326 143 634 140 1,468 126 3,8362001 Year ......................... 165 273 151 113 1,316 154 634 143 1,586 120 3,9542002 Year ......................... 170 253 156 104 1,284 155 615 140 1,548 111 3,8542003 Year ......................... 179 273 153 100 1,327 165 636 155 1,568 104 3,9562004 Year ......................... 177 267 154 101 1,329 154 635 149 1,645 107 4,0202005 Year ......................... 185 283 151 95 1,382 168 612 135 1,682 112 4,0902006 Year ......................... 182 283 153 103 1,416 169 631 152 1,703 112 4,1822007 Year ......................... 180 275 152 92 1,401 163 621 143 1,648 119 4,0962008 Year ......................... 179 279 148 93 1,443 162 629 135 1,719 122 4,2112009 Year ......................... 175 284 146 89 1,435 157 591 155 1,758 116 4,2132010 Year ......................... 168 287 143 83 1,395 184 590 165 1,772 118 4,2242011 Year ......................... 165 281 135 80 1,341 178 592 167 1,725 116 4,1192012 Year ......................... 162 288 126 80 1,350 174 594 181 1,779 106 4,1842013 Year ......................... 167 290 125 78 1,356 170 580 185 1,728 110 4,1272014 Year ......................... 168 284 119 78 1,359 193 581 197 1,825 113 4,2682015 Year ......................... 168 285 117 81 1,468 188 582 228 1,982 108 4,556
2016 January .................... 171 287 120 83 1,509 187 580 219 2,014 110 4,618 February .................. 169 289 123 81 1,519 183 564 233 2,018 107 4,623 March ....................... 166 289 120 77 1,504 184 560 236 2,024 109 4,616 April ......................... 171 286 126 77 1,503 180 566 230 2,035 110 4,624 May .......................... 167 289 123 81 1,510 169 574 235 2,051 112 4,649 June ......................... 167 288 121 82 1,501 175 573 238 2,049 116 4,653 July .......................... 169 290 125 75 1,523 186 577 238 2,066 118 4,707 August ..................... 167 287 130 80 1,508 186 585 233 2,066 114 4,692 September ............... 167 285 127 78 1,490 185 587 239 2,051 113 4,665 October .................... 163 287 128 77 1,474 190 587 238 2,053 112 4,653 November ................ 166 283 126 80 1,479 190 573 238 2,056 105 4,641 December ............... 162 285 124 82 1,471 183 562 230 2,030 115 4,592
2017 January .................... 166 285 129 82 1,510 185 562 238 2,053 R 120 R 4,667 February .................. 166 285 131 82 1,513 187 556 236 2,049 119 4,659 March ....................... 168 280 134 81 1,506 185 546 238 2,030 121 4,627 April ......................... 165 283 131 84 1,513 181 558 240 2,028 121 4,643 May .......................... 167 280 132 81 1,491 180 572 238 2,034 125 R 4,640 June ......................... 165 277 134 81 1,483 183 566 236 2,010 121 4,599 July .......................... 170 279 131 80 1,481 188 577 240 1,998 118 4,602 August ..................... 170 278 131 80 1,468 186 582 240 1,987 117 R 4,581 September ............... 165 274 128 78 1,444 186 571 244 1,978 114 4,536 October .................... 165 273 125 79 1,424 184 575 241 1,941 R 117 4,483 November ................ 164 271 125 82 1,430 185 574 235 1,923 R 110 R 4,457 December ............... 166 279 125 80 1,423 189 563 231 1,895 109 4,409
2018 January .................... 167 283 125 83 1,468 186 560 225 1,879 116 4,434 February .................. 165 278 130 80 1,463 184 545 230 1,876 117 4,415 March ....................... 166 280 126 79 1,455 192 539 213 1,862 117 4,377 April ......................... 168 277 129 79 1,456 186 553 207 1,864 115 4,380 May .......................... 168 277 128 81 R 1,446 190 559 202 1,870 116 4,384 June ......................... 168 278 125 83 R 1,443 190 549 210 1,867 113 R 4,372 July .......................... 167 278 133 82 1,450 190 557 207 1,872 116 R 4,392 August ..................... 165 277 132 81 R 1,443 200 567 202 1,892 115 R 4,418 September ............... 165 273 125 R 77 R 1,417 195 561 200 1,932 114 R 4,419 October .................... 162 271 125 R 75 R 1,399 194 573 202 1,916 118 R 4,402 November ................ 160 269 124 R 74 R 1,393 R 190 578 211 1,910 111 R 4,393 December ............... 160 271 125 75 1,406 194 565 206 1,912 124 4,407
a Through December 1983, the data for Germany are for the former WestGermany only. Beginning with January 1984, the data for Germany are for theunified Germany, i.e., the former East Germany and West Germany.
b "OECD Europe" consists of Austria, Belgium, Denmark, Finland, France,Germany, Greece, Iceland, Ireland, Italy, Luxembourg, the Netherlands, Norway,Portugal, Spain, Sweden, Switzerland, Turkey, and the United Kingdom; for 1984forward, Czech Republic, Hungary, Poland, and Slovakia; and, for 2000 forward,Slovenia.
c "Other OECD" consists of Australia, New Zealand, and the U.S. Territories; for1984 forward, Mexico; for 2000 forward, Chile, Estonia, and Israel; and, for 2016forward, Latvia.
d The Organization for Economic Cooperation and Development (OECD)consists of "OECD Europe," Canada, Japan, South Korea, the United States, and"Other OECD."
R=Revised. NA=Not available. Notes: • Stocks are at end of period. • Petroleum stocks include crude
oil (including strategic reserves), unfinished oils, natural gas liquids, and refinedproducts. • In the United States in January 1975, 1981, and 1983, numerousrespondents were added to bulk terminal and pipeline surveys, thereby affectingsubsequent stocks reported. New-basis end-of-year U.S. stocks, in million barrels,would have been 1,121 in 1974, 1,425 in 1980, and 1,461 in 1982. • Totals maynot equal sum of components due to independent rounding. • U.S. geographiccoverage is the 50 states and the District of Columbia.
Web Page: See http://www.eia.gov/totalenergy/data/monthly/#international(Excel and CSV files) for all available annual and monthly data beginning in 1973.
Sources: • United States: Table 3.4. • U.S. Territories: 1983forward—U.S. Energy Information Administration, International Energy Database.• All Other Data: 1973–1982—International Energy Agency (IEA), Quarterly OilStatistics and Energy Balances, various issues. 1983—IEA, Monthly Oil and GasStatistics Database. 1984 forward—IEA, Monthly Oil Data Service, March 15,2019.

200 U. S. Energy Information Administration / Monthly Energy Review March 2019
International Petroleum
Tables 11.1a and 11.1b Sources
United States Table 3.1.
All Other Countries and World, Annual Data 1973–1979: U.S. Energy Information Administration (EIA), International Energy Annual 1981, Table 8.
1980 forward: EIA, International Energy Statistics Database, March 2019.
All Other Countries and World, Monthly Data 1973–1980: Petroleum Intelligence Weekly (PIW), Oil & Gas Journal (OGJ), and EIA adjustments.
1981–1993: PIW, OGJ, and other industry sources.
1994 forward: EIA, International Energy Statistics Database, March 2019.

12. Environment

202 U. S. Energy Information Administration / Monthly Energy Review March 2019
Figure 12.1 Carbon Dioxide Emissions From Energy Consumption by Source (Million Metric Tons of Carbon Dioxide)
0
2,000
4,000
6,000
8,000
1975 1980 1985 1990 1995 2000 2005 2010 2015
Total [a], 1973–2018
0
200
400
600
J F M A M J J A S O N D J F M A M J J A S O N D J F M A M J J A S O N D
2016 2017 2018
Total [a], Monthly
Petroleum
Coal [b]
Natural Gas
0
1,000
2,000
3,000
1975 1980 1985 1990 1995 2000 2005 2010 2015
By Major Source, 1973–2018
Petroleum
Coal [b]
Natural Gas
0
50
100
150
200
250
J F M A M J J A S O N D J F M A M J J A S O N D J F M A M J J A S O N D
2016 2017 2018
By Major Source, Monthly
5,172 5,1315,274
0
1,000
2,000
3,000
4,000
5,000
6,000
2016 2017 2018
Total [a], January–December
111
162
200
0 50 100 150 200 250
Coal [b]
Natural Gas
Petroleum
By Major Source, December 2018
[a] Excludes emissions from biomass energy consumption.
[b] Includes coal coke net imports.
Web Page: http://www.eia.gov/totalenergy/data/monthly/#environment.
Source: Table 12.1.
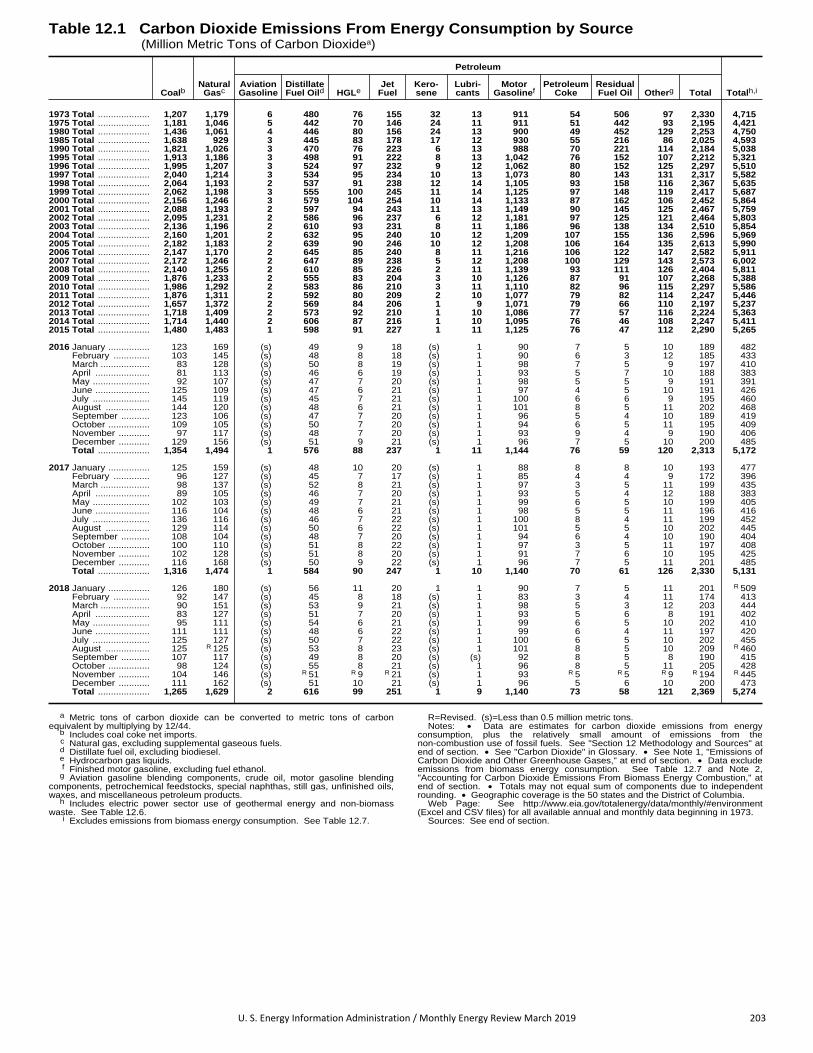
U. S. Energy Information Administration / Monthly Energy Review March 2019 203
Table 12.1 Carbon Dioxide Emissions From Energy Consumption by Source (Million Metric Tons of Carbon Dioxidea)
CoalbNatural
Gasc
Petroleum
Totalh,iAviationGasoline
DistillateFuel Oild HGLe
JetFuel
Kero-sene
Lubri-cants
MotorGasolinef
PetroleumCoke
ResidualFuel Oil Otherg Total
1973 Total .................... 1,207 1,179 6 480 76 155 32 13 911 54 506 97 2,330 4,7151975 Total .................... 1,181 1,046 5 442 70 146 24 11 911 51 442 93 2,195 4,4211980 Total .................... 1,436 1,061 4 446 80 156 24 13 900 49 452 129 2,253 4,7501985 Total .................... 1,638 929 3 445 83 178 17 12 930 55 216 86 2,025 4,5931990 Total .................... 1,821 1,026 3 470 76 223 6 13 988 70 221 114 2,184 5,0381995 Total .................... 1,913 1,186 3 498 91 222 8 13 1,042 76 152 107 2,212 5,3211996 Total .................... 1,995 1,207 3 524 97 232 9 12 1,062 80 152 125 2,297 5,5101997 Total .................... 2,040 1,214 3 534 95 234 10 13 1,073 80 143 131 2,317 5,5821998 Total .................... 2,064 1,193 2 537 91 238 12 14 1,105 93 158 116 2,367 5,6351999 Total .................... 2,062 1,198 3 555 100 245 11 14 1,125 97 148 119 2,417 5,6872000 Total .................... 2,156 1,246 3 579 104 254 10 14 1,133 87 162 106 2,452 5,8642001 Total .................... 2,088 1,193 2 597 94 243 11 13 1,149 90 145 125 2,467 5,7592002 Total .................... 2,095 1,231 2 586 96 237 6 12 1,181 97 125 121 2,464 5,8032003 Total .................... 2,136 1,196 2 610 93 231 8 11 1,186 96 138 134 2,510 5,8542004 Total .................... 2,160 1,201 2 632 95 240 10 12 1,209 107 155 136 2,596 5,9692005 Total .................... 2,182 1,183 2 639 90 246 10 12 1,208 106 164 135 2,613 5,9902006 Total .................... 2,147 1,170 2 645 85 240 8 11 1,216 106 122 147 2,582 5,9112007 Total .................... 2,172 1,246 2 647 89 238 5 12 1,208 100 129 143 2,573 6,0022008 Total .................... 2,140 1,255 2 610 85 226 2 11 1,139 93 111 126 2,404 5,8112009 Total .................... 1,876 1,233 2 555 83 204 3 10 1,126 87 91 107 2,268 5,3882010 Total .................... 1,986 1,292 2 583 86 210 3 11 1,110 82 96 115 2,297 5,5862011 Total .................... 1,876 1,311 2 592 80 209 2 10 1,077 79 82 114 2,247 5,4462012 Total .................... 1,657 1,372 2 569 84 206 1 9 1,071 79 66 110 2,197 5,2372013 Total .................... 1,718 1,409 2 573 92 210 1 10 1,086 77 57 116 2,224 5,3632014 Total .................... 1,714 1,440 2 606 87 216 1 10 1,095 76 46 108 2,247 5,4112015 Total .................... 1,480 1,483 1 598 91 227 1 11 1,125 76 47 112 2,290 5,265
2016 January ................ 123 169 (s) 49 9 18 (s) 1 90 7 5 10 189 482 February .............. 103 145 (s) 48 8 18 (s) 1 90 6 3 12 185 433 March ................... 83 128 (s) 50 8 19 (s) 1 98 7 5 9 197 410 April ..................... 81 113 (s) 46 6 19 (s) 1 93 5 7 10 188 383 May ...................... 92 107 (s) 47 7 20 (s) 1 98 5 5 9 191 391 June ..................... 125 109 (s) 47 6 21 (s) 1 97 4 5 10 191 426 July ...................... 145 119 (s) 45 7 21 (s) 1 100 6 6 9 195 460 August ................. 144 120 (s) 48 6 21 (s) 1 101 8 5 11 202 468 September ........... 123 106 (s) 47 7 20 (s) 1 96 5 4 10 189 419 October ................ 109 105 (s) 50 7 20 (s) 1 94 6 5 11 195 409 November ............ 97 117 (s) 48 7 20 (s) 1 93 9 4 9 190 406 December ............ 129 156 (s) 51 9 21 (s) 1 96 7 5 10 200 485 Total .................... 1,354 1,494 1 576 88 237 1 11 1,144 76 59 120 2,313 5,172
2017 January ................ 125 159 (s) 48 10 20 (s) 1 88 8 8 10 193 477 February .............. 96 127 (s) 45 7 17 (s) 1 85 4 4 9 172 396 March ................... 98 137 (s) 52 8 21 (s) 1 97 3 5 11 199 435 April ..................... 89 105 (s) 46 7 20 (s) 1 93 5 4 12 188 383 May ...................... 102 103 (s) 49 7 21 (s) 1 99 6 5 10 199 405 June ..................... 116 104 (s) 48 6 21 (s) 1 98 5 5 11 196 416 July ...................... 136 116 (s) 46 7 22 (s) 1 100 8 4 11 199 452 August ................. 129 114 (s) 50 6 22 (s) 1 101 5 5 10 202 445 September ........... 108 104 (s) 48 7 20 (s) 1 94 6 4 10 190 404 October ................ 100 110 (s) 51 8 22 (s) 1 97 3 5 11 197 408 November ............ 102 128 (s) 51 8 20 (s) 1 91 7 6 10 195 425 December ............ 116 168 (s) 50 9 22 (s) 1 96 7 5 11 201 485 Total .................... 1,316 1,474 1 584 90 247 1 10 1,140 70 61 126 2,330 5,131
2018 January ................ 126 180 (s) 56 11 20 1 1 90 7 5 11 201 R 509 February .............. 92 147 (s) 45 8 18 (s) 1 83 3 4 11 174 413 March ................... 90 151 (s) 53 9 21 (s) 1 98 5 3 12 203 444 April ..................... 83 127 (s) 51 7 20 (s) 1 93 5 6 8 191 402 May ...................... 95 111 (s) 54 6 21 (s) 1 99 6 5 10 202 410 June ..................... 111 111 (s) 48 6 22 (s) 1 99 6 4 11 197 420 July ...................... 125 127 (s) 50 7 22 (s) 1 100 6 5 10 202 455 August ................. 125 R 125 (s) 53 8 23 (s) 1 101 8 5 10 209 R 460 September ........... 107 117 (s) 49 8 20 (s) (s) 92 8 5 8 190 415 October ................ 98 124 (s) 55 8 21 (s) 1 96 8 5 11 205 428 November ............ 104 146 (s) R 51 R 9 R 21 (s) 1 93 R 5 R 5 R 9 R 194 R 445 December ............ 111 162 (s) 51 10 21 (s) 1 96 5 6 10 200 473 Total .................... 1,265 1,629 2 616 99 251 1 9 1,140 73 58 121 2,369 5,274
a Metric tons of carbon dioxide can be converted to metric tons of carbonequivalent by multiplying by 12/44.
b Includes coal coke net imports.c Natural gas, excluding supplemental gaseous fuels.d Distillate fuel oil, excluding biodiesel.e Hydrocarbon gas liquids.f Finished motor gasoline, excluding fuel ethanol.
g Aviation gasoline blending components, crude oil, motor gasoline blendingcomponents, petrochemical feedstocks, special naphthas, still gas, unfinished oils,waxes, and miscellaneous petroleum products.
h Includes electric power sector use of geothermal energy and non-biomasswaste. See Table 12.6.
i Excludes emissions from biomass energy consumption. See Table 12.7.
R=Revised. (s)=Less than 0.5 million metric tons. Notes: • Data are estimates for carbon dioxide emissions from energy
consumption, plus the relatively small amount of emissions from thenon-combustion use of fossil fuels. See "Section 12 Methodology and Sources" atend of section. • See "Carbon Dioxide" in Glossary. • See Note 1, "Emissions ofCarbon Dioxide and Other Greenhouse Gases," at end of section. • Data excludeemissions from biomass energy consumption. See Table 12.7 and Note 2,"Accounting for Carbon Dioxide Emissions From Biomass Energy Combustion," atend of section. • Totals may not equal sum of components due to independentrounding. • Geographic coverage is the 50 states and the District of Columbia.
Web Page: See http://www.eia.gov/totalenergy/data/monthly/#environment(Excel and CSV files) for all available annual and monthly data beginning in 1973.
Sources: See end of section.
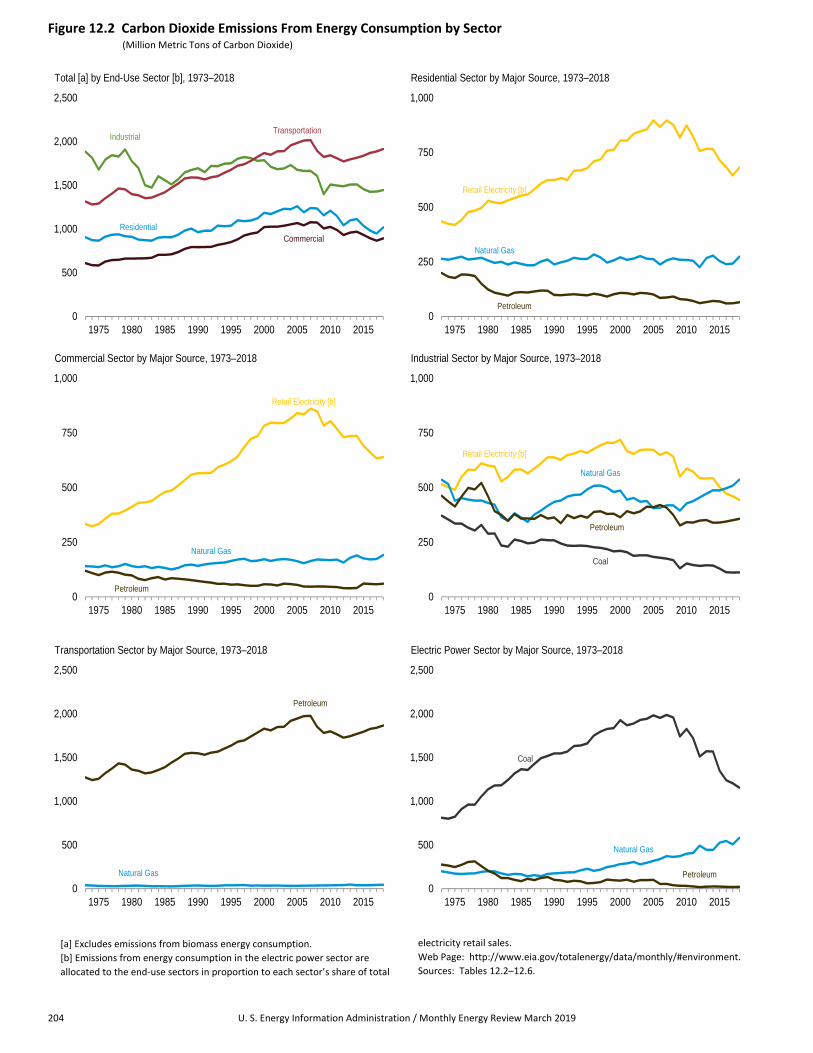
204 U. S. Energy Information Administration / Monthly Energy Review March 2019
Figure 12.2 Carbon Dioxide Emissions From Energy Consumption by Sector (Million Metric Tons of Carbon Dioxide)
Industrial Transportation
Residential Commercial
0
500
1,000
1,500
2,000
2,500
1975 1980 1985 1990 1995 2000 2005 2010 2015
Total [a] by End-Use Sector [b], 1973–2018
Retail Electricity [b]
Natural Gas
Petroleum 0
250
500
750
1,000
1975 1980 1985 1990 1995 2000 2005 2010 2015
Residential Sector by Major Source, 1973–2018
Retail Electricity [b]
Natural Gas
Petroleum 0
250
500
750
1,000
1975 1980 1985 1990 1995 2000 2005 2010 2015
Commercial Sector by Major Source, 1973–2018
Retail Electricity [b]
Natural Gas
Petroleum
Coal
0
250
500
750
1,000
1975 1980 1985 1990 1995 2000 2005 2010 2015
Industrial Sector by Major Source, 1973–2018
Petroleum
Natural Gas
0
500
1,000
1,500
2,000
2,500
1975 1980 1985 1990 1995 2000 2005 2010 2015
Transportation Sector by Major Source, 1973–2018
Coal
Natural Gas
Petroleum
0
500
1,000
1,500
2,000
2,500
1975 1980 1985 1990 1995 2000 2005 2010 2015
Electric Power Sector by Major Source, 1973–2018
[a] Excludes emissions from biomass energy consumption.
[b] Emissions from energy consumption in the electric power sector are
allocated to the end‐use sectors in proportion to each sector’s share of total
electricity retail sales.
Web Page: http://www.eia.gov/totalenergy/data/monthly/#environment.
Sources: Tables 12.2–12.6.

U. S. Energy Information Administration / Monthly Energy Review March 2019 205
Table 12.2 Carbon Dioxide Emissions From Energy Consumption: Residential Sector (Million Metric Tons of Carbon Dioxidea)
CoalNaturalGasb
Petroleum
RetailElectricitye Totalf
DistillateFuel Oilc HGLd Kerosene Total
1973 Total .......................... 9 264 147 36 16 199 435 9071975 Total .......................... 6 266 132 32 12 176 419 8671980 Total .......................... 3 256 96 20 8 124 529 9111985 Total .......................... 4 241 80 20 11 111 553 9091990 Total .......................... 3 238 72 22 5 98 624 9631995 Total .......................... 2 263 66 25 5 96 678 1,0391996 Total .......................... 2 284 68 30 6 104 710 1,0991997 Total .......................... 2 270 64 29 7 99 719 1,0901998 Total .......................... 1 247 56 27 8 91 759 1,0971999 Total .......................... 1 257 60 33 8 102 762 1,1222000 Total .......................... 1 271 66 35 7 108 805 1,1852001 Total .......................... 1 259 66 33 7 106 805 1,1712002 Total .......................... 1 265 63 34 4 101 835 1,2032003 Total .......................... 1 276 68 34 5 108 847 1,2322004 Total .......................... 1 264 67 32 6 106 856 1,2272005 Total .......................... 1 262 62 32 6 101 897 1,2612006 Total .......................... 1 237 52 28 5 85 869 1,1912007 Total .......................... 1 257 53 31 3 86 897 1,2412008 Total .......................... NA 266 55 35 2 91 877 1,2342009 Total .......................... NA 259 43 35 2 79 819 1,1572010 Total .......................... NA 259 41 33 2 77 874 1,2102011 Total .......................... NA 255 38 31 1 71 823 1,1492012 Total .......................... NA 225 35 25 1 61 757 1,0432013 Total .......................... NA 267 36 29 1 66 768 1,1002014 Total .......................... NA 278 39 31 1 71 766 1,1152015 Total .......................... NA 253 40 28 1 69 714 1,037
2016 January ...................... NA 48 4 3 (s) 7 65 120 February .................... NA 38 4 2 (s) 6 52 96 March ......................... NA 25 3 2 (s) 5 41 71 April ........................... NA 18 2 2 (s) 5 37 60 May ............................ NA 11 2 2 (s) 4 43 58 June ........................... NA 7 2 2 (s) 4 65 75 July ............................ NA 6 2 2 (s) 4 84 93 August ....................... NA 6 1 2 (s) 3 83 92 September ................. NA 6 2 2 (s) 4 64 74 October ...................... NA 10 3 2 (s) 5 49 64 November .................. NA 21 3 2 (s) 5 43 69 December .................. NA 44 5 2 (s) 7 62 113 Total .......................... NA 239 32 27 1 60 683 982
2017 January ...................... NA 46 4 3 (s) 7 63 116 February .................... NA 32 3 2 (s) 5 44 81 March ......................... NA 32 3 2 (s) 5 45 83 April ........................... NA 15 2 2 (s) 5 39 59 May ............................ NA 11 2 2 (s) 4 45 60 June ........................... NA 7 2 2 (s) 4 58 69 July ............................ NA 6 1 2 (s) 4 77 86 August ....................... NA 6 2 2 (s) 4 70 80 September ................. NA 6 2 2 (s) 4 55 65 October ...................... NA 11 2 2 (s) 4 46 62 November .................. NA 26 3 3 (s) 6 46 77 December .................. NA 45 5 3 (s) 7 60 112 Total .......................... NA 242 32 28 1 60 646 948
2018 January ...................... NA 54 R 5 3 (s) 9 73 135 February .................... NA 38 4 3 (s) 6 49 92 March ......................... NA 36 3 3 (s) 6 45 87 April ........................... NA 24 3 2 (s) 5 40 69 May ............................ NA 9 2 2 (s) 4 47 60 June ........................... NA 7 1 2 (s) 4 61 71 July ............................ NA 6 1 2 (s) 4 77 86 August ....................... NA 5 1 3 (s) 4 R 74 R 83 September ................. NA 6 1 2 (s) 4 61 71 October ...................... NA 14 3 3 (s) 6 49 R 68 November .................. NA R 33 4 3 (s) 7 50 89 December .................. NA 42 5 3 (s) 8 58 108 Total .......................... NA 273 33 31 1 65 681 1,019
a Metric tons of carbon dioxide can be converted to metric tons of carbonequivalent by multiplying by 12/44.
b Natural gas, excluding supplemental gaseous fuels.c Distillate fuel oil, excluding biodiesel.d Hydrocarbon gas liquids.e Emissions from energy consumption (for electricity and a small amount of
useful thermal output) in the electric power sector are allocated to the end-usesectors in proportion to each sector’s share of total electricity retail sales. SeeTables 7.6 and 12.6.
f Excludes emissions from biomass energy consumption. See Table 12.7.R=Revised. NA=Not available. (s)=Less than 0.5 million metric tons.
Notes: • Data are estimates for carbon dioxide emissions from energyconsumption. See "Section 12 Methodology and Sources" at end of section.• See "Carbon Dioxide" in Glossary. • See Note 1, "Emissions of Carbon Dioxideand Other Greenhouse Gases," at end of section. • Data exclude emissions frombiomass energy consumption. See Table 12.7 and Note 2, "Accounting for CarbonDioxide Emissions From Biomass Energy Combustion," at end of section. • Totalsmay not equal sum of components due to independent rounding. • Geographiccoverage is the 50 states and the District of Columbia.
Web Page: See http://www.eia.gov/totalenergy/data/monthly/#environment(Excel and CSV files) for all available annual and monthly data beginning in 1973.
Sources: See end of section.

206 U. S. Energy Information Administration / Monthly Energy Review March 2019
Table 12.3 Carbon Dioxide Emissions From Energy Consumption: Commercial Sector (Million Metric Tons of Carbon Dioxidea)
CoalNaturalGasb
Petroleum
RetailElectricityf Totalg
DistillateFuel Oilc HGLd Kerosene
MotorGasolinee
PetroleumCoke
ResidualFuel Oil Total
1973 Total ........................ 15 141 47 9 5 6 NA 52 120 334 6091975 Total ........................ 14 136 43 8 4 6 NA 39 100 333 5831980 Total ........................ 11 141 38 6 3 8 NA 44 98 412 6621985 Total ........................ 13 132 46 6 2 7 NA 18 79 480 7041990 Total ........................ 12 142 39 6 1 8 0 18 73 566 7931995 Total ........................ 11 164 35 7 2 1 (s) 11 56 620 8511996 Total ........................ 12 171 35 8 2 2 (s) 11 57 643 8831997 Total ........................ 12 174 32 8 2 3 (s) 9 54 686 9261998 Total ........................ 9 164 31 7 2 3 (s) 7 50 724 9471999 Total ........................ 10 165 32 9 2 2 (s) 6 51 735 9602000 Total ........................ 9 173 36 9 2 3 (s) 7 58 783 1,0222001 Total ........................ 9 164 37 9 2 3 (s) 6 57 797 1,0272002 Total ........................ 9 170 32 9 1 3 (s) 6 52 795 1,0262003 Total ........................ 8 173 36 10 1 4 (s) 9 60 796 1,0372004 Total ........................ 10 170 34 10 1 3 (s) 10 58 815 1,0532005 Total ........................ 9 163 33 8 2 3 (s) 9 55 841 1,0692006 Total ........................ 6 154 29 8 1 3 (s) 6 47 835 1,0432007 Total ........................ 7 164 28 8 1 4 (s) 6 46 861 1,0782008 Total ........................ 8 171 28 10 (s) 3 (s) 6 47 849 1,0752009 Total ........................ 7 169 29 9 (s) 3 (s) 6 47 784 1,0072010 Total ........................ 7 168 29 9 (s) 3 (s) 5 46 804 1,0252011 Total ........................ 6 171 29 9 (s) 3 (s) 4 45 768 9902012 Total ........................ 4 157 26 9 (s) 3 (s) 2 40 731 9322013 Total ........................ 4 179 25 10 (s) 3 (s) 2 39 736 9582014 Total ........................ 4 190 26 10 (s) 4 (s) 1 41 736 9702015 Total ........................ 3 176 26 9 (s) 25 (s) (s) 61 692 932
2016 January .................... (s) 28 3 1 (s) 2 (s) (s) 6 55 89 February .................. (s) 23 3 1 (s) 2 (s) (s) 6 46 75 March ....................... (s) 16 2 1 (s) 2 (s) (s) 5 43 65 April ......................... (s) 13 2 1 (s) 2 (s) (s) 5 43 61 May .......................... (s) 9 2 1 (s) 2 0 (s) 5 49 63 June ......................... (s) 8 1 1 (s) 2 (s) (s) 4 63 74 July .......................... (s) 7 1 1 (s) 2 (s) (s) 4 70 82 August ..................... (s) 8 1 1 (s) 2 0 (s) 4 71 83 September ............... (s) 8 1 1 (s) 2 0 (s) 4 61 73 October .................... (s) 11 2 1 (s) 2 0 (s) 5 54 70 November ................ (s) 15 2 1 (s) 2 (s) (s) 5 48 69 December ................ (s) 25 4 1 (s) 2 (s) (s) 7 56 88 Total ........................ 2 171 24 9 (s) 25 (s) (s) 59 662 894
2017 January .................... (s) 26 3 1 (s) 2 (s) (s) 6 53 86 February .................. (s) 20 2 1 (s) 2 (s) (s) 5 44 R 68 March ....................... (s) 20 2 1 (s) 2 (s) (s) 5 47 73 April ......................... (s) 12 2 1 (s) 2 (s) (s) 5 44 60 May .......................... (s) 10 1 1 (s) 2 (s) (s) 4 50 64 June ......................... (s) 8 2 1 (s) 2 (s) (s) 4 57 69 July .......................... (s) 7 1 1 (s) 2 (s) (s) 4 66 78 August ..................... (s) 8 1 1 (s) 2 (s) (s) 4 63 75 September ............... (s) 8 1 1 (s) 2 (s) (s) 4 55 67 October .................... (s) 11 2 1 (s) 2 (s) (s) R 4 51 67 November ................ (s) 18 2 1 (s) 2 (s) (s) 5 49 72 December ................ (s) 27 3 1 (s) 2 (s) (s) R 6 53 87 Total ........................ 2 174 24 10 (s) R 24 (s) (s) R 58 633 R 867
2018 January .................... (s) 30 4 1 (s) 2 (s) (s) 7 56 R 93 February .................. (s) 23 3 1 (s) 2 (s) (s) 5 44 72 March ....................... (s) 23 2 1 (s) 2 (s) (s) 5 46 74 April ......................... (s) 16 2 1 (s) 2 (s) (s) 5 43 R 64 May .......................... (s) 9 1 1 (s) 2 0 (s) 4 51 64 June ......................... (s) 8 1 1 (s) 2 0 (s) 4 57 69 July .......................... (s) 7 1 1 (s) 2 0 (s) 4 66 77 August ..................... (s) 8 1 1 (s) 2 0 (s) 4 R 65 77 September ............... (s) 8 1 1 (s) 2 (s) (s) 4 58 70 October .................... (s) 13 2 1 (s) 2 (s) (s) 5 53 71 November ................ (s) 21 3 1 (s) 2 (s) (s) 6 50 77 December ................ (s) 25 4 1 (s) 2 (s) (s) 7 50 83 Total ........................ 2 191 25 11 (s) 24 (s) (s) 60 640 893
a Metric tons of carbon dioxide can be converted to metric tons of carbonequivalent by multiplying by 12/44.
b Natural gas, excluding supplemental gaseous fuels.c Distillate fuel oil, excluding biodiesel.d Hydrocarbon gas liquids.e Finished motor gasoline, excluding fuel ethanol.f Emissions from energy consumption (for electricity and a small amount of
useful thermal output) in the electric power sector are allocated to the end-usesectors in proportion to each sector’s share of total electricity retail sales. SeeTables 7.6 and 12.6.
g Excludes emissions from biomass energy consumption. See Table 12.7.R=Revised. NA=Not available. (s)=Less than 0.5 million metric tons.
Notes: • Data are estimates for carbon dioxide emissions from energyconsumption. See "Section 12 Methodology and Sources" at end of section.• See "Carbon Dioxide" in Glossary. • See Note 1, "Emissions of Carbon Dioxideand Other Greenhouse Gases," at end of section. • Data exclude emissions frombiomass energy consumption. See Table 12.7 and Note 2, "Accounting for CarbonDioxide Emissions From Biomass Energy Combustion," at end of section. • Totalsmay not equal sum of components due to independent rounding. • Geographiccoverage is the 50 states and the District of Columbia.
Web Page: See http://www.eia.gov/totalenergy/data/monthly/#environment(Excel and CSV files) for all available annual and monthly data beginning in 1973.
Sources: See end of section.

U. S. Energy Information Administration / Monthly Energy Review March 2019 207
Table 12.4 Carbon Dioxide Emissions From Energy Consumption: Industrial Sector (Million Metric Tons of Carbon Dioxidea)
Coal
CoalCokeNet
ImportsNaturalGasb
PetroleumRetailElec-
tricityg TotalhDistillateFuel Oilc HGLd
Kero-sene
Lubri-cants
MotorGasolinee
PetroleumCoke
ResidualFuel Oil Otherf Total
1973 Total .................... 371 -1 536 106 28 11 7 18 53 142 97 463 515 1,8841975 Total .................... 336 2 440 97 27 9 6 16 51 115 93 413 490 1,6801980 Total .................... 289 -4 430 96 54 13 7 11 49 103 129 461 601 1,7761985 Total .................... 256 -2 363 81 55 3 6 15 54 57 86 358 583 1,5581990 Total .................... 258 1 435 84 46 1 7 13 67 32 114 363 638 1,6951995 Total .................... 233 7 492 82 58 1 7 14 68 25 107 362 659 1,7521996 Total .................... 227 3 508 86 59 1 6 14 72 25 125 389 678 1,8041997 Total .................... 224 5 509 88 58 1 7 15 70 22 131 392 694 1,8241998 Total .................... 219 8 500 88 56 2 7 14 80 16 116 379 706 1,8111999 Total .................... 208 7 480 86 57 1 7 11 85 14 119 381 704 1,7802000 Total .................... 211 7 486 87 58 1 7 11 77 17 106 364 719 1,7872001 Total .................... 204 3 444 94 51 2 6 21 79 14 125 392 667 1,7122002 Total .................... 188 7 453 88 52 1 6 22 79 13 121 382 654 1,6842003 Total .................... 190 6 435 85 48 2 6 23 78 15 134 391 672 1,6942004 Total .................... 190 16 438 88 52 2 6 26 85 17 136 413 674 1,7322005 Total .................... 183 5 406 92 48 3 6 25 82 20 135 410 672 1,6772006 Total .................... 179 7 408 91 47 2 6 26 85 16 147 421 650 1,6642007 Total .................... 175 3 418 91 50 1 6 21 83 13 143 408 662 1,6662008 Total .................... 168 5 419 98 38 (s) 6 17 78 13 126 375 642 1,6082009 Total .................... 131 -3 395 78 38 (s) 5 16 73 9 107 327 550 1,4002010 Total .................... 153 -1 427 84 43 1 5 17 68 8 115 342 587 1,5082011 Total .................... 146 1 438 90 39 (s) 5 17 65 9 114 340 574 1,4982012 Total .................... 141 (s) 455 93 50 (s) 4 17 70 5 110 349 543 1,4892013 Total .................... 145 -2 472 92 53 (s) 5 17 65 3 116 351 542 1,5082014 Total .................... 143 -2 488 100 45 (s) 5 14 64 3 108 339 543 1,5112015 Total .................... 129 -2 487 85 53 (s) 5 17 65 2 112 340 502 1,456
2016 January ................ 10 (s) 46 8 6 (s) (s) 1 6 (s) 10 32 39 126 February .............. 10 (s) 42 8 5 (s) (s) 1 5 (s) 12 33 34 119 March ................... 10 (s) 43 9 4 (s) (s) 1 6 (s) 9 30 32 115 April ..................... 9 (s) 40 6 4 (s) (s) 1 4 (s) 10 27 33 109 May ...................... 9 (s) 40 6 4 (s) (s) 1 4 (s) 9 25 37 111 June ..................... 9 (s) 38 6 3 (s) (s) 1 3 (s) 10 25 44 116 July ...................... 9 (s) 40 4 4 (s) (s) 2 5 (s) 9 24 47 121 August ................. 9 (s) 41 7 4 (s) (s) 2 7 (s) 11 31 47 127 September ........... 9 (s) 39 7 4 (s) (s) 1 4 (s) 10 27 41 117 October ................ 9 (s) 40 7 4 (s) (s) 1 5 (s) 11 30 39 118 November ............ 9 -1 42 8 4 (s) (s) 1 8 (s) 9 30 36 117 December ............ 10 (s) 46 7 5 (s) (s) 1 6 (s) 10 31 40 127 Total .................... 113 -2 497 84 51 (s) 5 17 64 4 120 345 473 1,426
2017 January ................ 9 (s) 46 7 6 (s) (s) 1 7 (s) 10 32 38 125 February .............. 9 (s) 41 8 4 (s) (s) 1 3 (s) 9 26 33 108 March ................... 9 (s) 44 10 5 (s) (s) 1 3 (s) 11 31 35 119 April ..................... 9 (s) 41 6 4 (s) (s) 1 5 (s) 12 29 34 112 May ...................... 9 (s) 41 8 4 (s) (s) 2 6 (s) 10 30 38 117 June ..................... 9 (s) 40 7 3 (s) (s) R 2 4 (s) 11 27 41 116 July ...................... 9 (s) 41 5 4 (s) (s) 2 7 (s) 11 29 45 124 August ................. 9 (s) 41 7 4 (s) (s) 2 5 (s) 10 28 44 122 September ........... 9 (s) 40 7 4 (s) (s) 1 5 (s) 10 29 39 116 October ................ 9 (s) 42 8 4 (s) (s) 1 3 (s) 11 28 37 117 November ............ 9 (s) 44 9 5 (s) (s) 1 6 (s) 10 32 37 123 December ............ 10 (s) 48 7 5 (s) (s) 1 6 (s) 11 31 39 128 Total .................... 112 -3 509 88 52 (s) 5 R 18 60 3 126 351 461 1,429
2018 January ................ 9 (s) 49 R 9 6 (s) (s) 1 6 (s) 11 R 34 37 R 129 February .............. 9 (s) 44 R 7 5 (s) (s) 1 3 (s) 11 R 27 31 R 110 March ................... 9 (s) 46 R 9 5 (s) (s) R 2 5 (s) 12 R 33 33 R 121 April ..................... 9 (s) 44 R 8 4 (s) (s) 1 5 (s) 8 R 27 31 112 May ...................... 9 (s) 43 R 10 3 (s) (s) 2 5 (s) 10 R 30 37 R 119 June ..................... 9 (s) 42 R 6 3 (s) (s) R 2 6 (s) 11 R 28 38 R 117 July ...................... 9 (s) 43 R 6 4 (s) (s) 2 5 (s) 10 R 28 43 R 122 August ................. 9 (s) 43 R 8 4 (s) (s) 2 7 (s) 10 R 32 R 44 R 128 September ........... 9 (s) 42 R 7 4 (s) (s) 1 7 (s) 8 R 28 39 R 118 October ................ 10 (s) 44 R 9 5 (s) (s) 1 7 (s) 11 R 34 37 R 126 November ............ 10 (s) 47 R 7 R 5 (s) (s) 1 R 4 (s) R 9 R 28 37 R 122 December ............ 10 (s) 49 6 6 (s) (s) 1 4 (s) 10 28 36 122 Total .................... 112 -3 536 92 56 (s) 4 18 63 3 121 357 443 1,446
a Metric tons of carbon dioxide can be converted to metric tons of carbonequivalent by multiplying by 12/44.
b Natural gas, excluding supplemental gaseous fuels.c Distillate fuel oil, excluding biodiesel.d Hydrocarbon gas liquids.e Finished motor gasoline, excluding fuel ethanol.f Aviation gasoline blending components, crude oil, motor gasoline blending
components, petrochemical feedstocks, special naphthas, still gas, unfinished oils,waxes, and miscellaneous petroleum products.
g Emissions from energy consumption (for electricity and a small amount ofuseful thermal output) in the electric power sector are allocated to the end-usesectors in proportion to each sector’s share of total electricity retail sales. SeeTables 7.6 and 12.6.
h Excludes emissions from biomass energy consumption. See Table 12.7.
R=Revised. (s)=Less than 0.5 million metric tons and greater than -0.5 millionmetric tons.
Notes: • Data are estimates for carbon dioxide emissions from energyconsumption, plus the relatively small amount of emissions from thenon-combustion use of fossil fuels. See "Section 12 Methodology and Sources" atend of section. • See "Carbon Dioxide" in Glossary. • See Note 1, "Emissions ofCarbon Dioxide and Other Greenhouse Gases," at end of section. • Data excludeemissions from biomass energy consumption. See Table 12.7 and Note 2,"Accounting for Carbon Dioxide Emissions From Biomass Energy Combustion," atend of section. • Totals may not equal sum of components due to independentrounding. • Geographic coverage is the 50 states and the District of Columbia.
Web Page: See http://www.eia.gov/totalenergy/data/monthly/#environment(Excel and CSV files) for all available annual and monthly data beginning in 1973.
Sources: See end of section.

208 U. S. Energy Information Administration / Monthly Energy Review March 2019
Table 12.5 Carbon Dioxide Emissions From Energy Consumption: Transportation Sector (Million Metric Tons of Carbon Dioxidea)
CoalNaturalGasb
PetroleumRetailElec-
tricityf TotalgAviationGasoline
DistillateFuel Oilc HGLd
JetFuel
Lubri-cants
MotorGasolinee
ResidualFuel Oil Total
1973 Total ........................ (s) 39 6 163 3 152 6 886 57 1,273 2 1,3151975 Total ........................ (s) 32 5 155 3 145 6 889 56 1,258 2 1,2921980 Total ........................ h( ) 34 4 204 1 155 6 881 110 1,363 2 1,4001985 Total ........................ h( ) 28 3 232 2 178 6 908 62 1,391 3 1,4211990 Total ........................ h( ) 36 3 268 1 223 7 967 80 1,548 3 1,5881995 Total ........................ h( ) 38 3 307 1 222 6 1,026 72 1,637 3 1,6791996 Total ........................ h( ) 39 3 327 1 232 6 1,046 67 1,681 3 1,7241997 Total ........................ h( ) 41 3 341 1 234 6 1,055 56 1,698 3 1,7421998 Total ........................ h( ) 35 2 352 1 238 7 1,088 53 1,741 3 1,7791999 Total ........................ h( ) 36 3 365 1 245 7 1,113 52 1,786 3 1,8262000 Total ........................ h( ) 36 3 377 1 254 7 1,119 70 1,830 4 1,8702001 Total ........................ h( ) 35 2 387 1 243 6 1,125 46 1,810 4 1,8492002 Total ........................ h( ) 37 2 394 1 237 6 1,156 53 1,849 4 1,8902003 Total ........................ h( ) 33 2 408 1 231 6 1,159 45 1,853 5 1,8912004 Total ........................ h( ) 32 2 433 1 240 6 1,180 58 1,921 5 1,9572005 Total ........................ h( ) 33 2 444 2 246 6 1,180 66 1,946 5 1,9842006 Total ........................ h( ) 33 2 467 2 240 5 1,187 71 1,974 5 2,0122007 Total ........................ h( ) 35 2 469 1 238 6 1,183 78 1,977 5 2,0182008 Total ........................ h( ) 37 2 424 3 226 5 1,119 73 1,852 5 1,8932009 Total ........................ h( ) 38 2 400 2 204 5 1,107 62 1,782 5 1,8252010 Total ........................ h( ) 38 2 423 1 210 6 1,089 70 1,800 5 1,8432011 Total ........................ h( ) 39 2 431 1 209 6 1,057 61 1,766 4 1,8092012 Total ........................ h( ) 41 2 411 1 206 5 1,051 53 1,728 4 1,7742013 Total ........................ h( ) 47 2 416 1 210 5 1,066 46 1,745 4 1,7972014 Total ........................ h( ) 40 2 435 1 216 6 1,077 35 1,771 4 1,8152015 Total ........................ h( ) 40 1 441 1 227 6 1,083 37 1,796 4 1,839
2016 January .................... h( ) 5 (s) 33 (s) 18 1 87 4 143 (s) 148 February .................. h( ) 4 (s) 32 (s) 18 1 86 2 139 (s) 143 March ....................... h( ) 3 (s) 36 (s) 19 1 94 5 155 (s) 159 April ......................... h( ) 3 (s) 36 (s) 19 (s) 89 6 150 (s) 153 May .......................... h( ) 3 (s) 37 (s) 20 (s) 94 4 156 (s) 159 June ......................... h( ) 3 (s) 38 (s) 21 1 93 4 156 (s) 160 July .......................... h( ) 3 (s) 37 (s) 21 (s) 96 5 161 (s) 164 August ..................... h( ) 3 (s) 39 (s) 21 (s) 97 4 162 (s) 166 September ............... h( ) 3 (s) 36 (s) 20 (s) 92 3 152 (s) 155 October .................... h( ) 3 (s) 38 (s) 20 (s) 91 4 154 (s) 157 November ................ h( ) 3 (s) 35 (s) 20 (s) 89 4 148 (s) 152 December ................ h( ) 4 (s) 35 (s) 21 (s) 93 4 153 (s) 157 Total ........................ h( ) 40 1 431 1 237 6 1,102 49 1,827 4 1,871
2017 January .................... h( ) 5 (s) 33 (s) 20 1 85 7 145 (s) 150 February .................. h( ) 4 (s) 32 (s) 17 (s) R 82 3 134 (s) 138 March ....................... h( ) 4 (s) 37 (s) 21 1 93 4 156 (s) 160 April ......................... h( ) 3 (s) 35 (s) 20 (s) 90 4 149 (s) 153 May .......................... h( ) 3 (s) 38 (s) 21 (s) 96 5 160 (s) 163 June ......................... h( ) 3 (s) 37 (s) 21 (s) 95 4 158 (s) 162 July .......................... h( ) 3 (s) 38 (s) 22 (s) 96 4 160 (s) 164 August ..................... h( ) 3 (s) 40 (s) 22 (s) 98 5 164 (s) 168 September ............... h( ) 3 (s) 37 (s) 20 (s) 91 4 152 (s) 155 October .................... h( ) 3 (s) 38 (s) 22 (s) 94 4 159 (s) 162 November ................ h( ) 4 (s) 36 (s) 20 (s) 88 5 150 (s) 154 December ................ h( ) 5 (s) 35 (s) 22 (s) R 93 4 R 154 (s) 159 Total ........................ h( ) 42 1 436 1 247 5 R 1,099 52 R 1,842 4 R 1,888
2018 January .................... h( ) 5 (s) R 35 (s) 20 (s) 87 3 R 146 (s) R 151 February .................. h( ) 4 (s) R 32 (s) 18 (s) 80 3 R 134 (s) R 138 March ....................... h( ) 4 (s) R 38 (s) 21 (s) 95 3 R 158 (s) R 162 April ......................... h( ) 4 (s) R 38 (s) 20 (s) 89 5 R 153 (s) R 157 May .......................... h( ) 3 (s) R 41 (s) 21 (s) 95 4 R 163 (s) R 166 June ......................... h( ) 3 (s) R 39 (s) 22 (s) 95 3 R 161 (s) R 164 July .......................... h( ) 4 (s) R 41 (s) 22 (s) R 97 4 R 165 (s) R 169 August ..................... h( ) 4 (s) R 43 (s) 23 (s) 97 4 R 168 (s) R 172 September ............... h( ) 3 (s) R 39 (s) 20 (s) 88 5 R 153 (s) R 156 October .................... h( ) 4 (s) R 41 (s) 21 (s) 93 4 R 159 (s) R 163 November ................ h( ) 4 (s) R 37 (s) R 21 (s) 90 R 4 R 152 (s) R 157 December ................ h( ) 5 (s) 36 (s) 21 (s) 92 5 155 (s) 160 Total ........................ h( ) 46 2 461 1 251 5 1,099 48 1,866 4 1,915
a Metric tons of carbon dioxide can be converted to metric tons of carbonequivalent by multiplying by 12/44.
b Natural gas, excluding supplemental gaseous fuels.c Distillate fuel oil, excluding biodiesel.d Hydrocarbon gas liquids.e Finished motor gasoline, excluding fuel ethanol.f Emissions from energy consumption (for electricity and a small amount of
useful thermal output) in the electric power sector are allocated to the end-usesectors in proportion to each sector’s share of total electricity retail sales. SeeTables 7.6 and 12.6.
g Excludes emissions from biomass energy consumption. See Table 12.7.h Beginning in 1978, the small amounts of coal consumed for transportation are
reported as industrial sector consumption.
R=Revised. (s)=Less than 0.5 million metric tons. Notes: • Data are estimates for carbon dioxide emissions from energy
consumption, plus the relatively small amount of emissions from thenon-combustion use of fossil fuels. See "Section 12 Methodology and Sources" atend of section. • See "Carbon Dioxide" in Glossary. • See Note 1, "Emissions ofCarbon Dioxide and Other Greenhouse Gases," at end of section. • Data excludeemissions from biomass energy consumption. See Table 12.7 and Note 2,"Accounting for Carbon Dioxide Emissions From Biomass Energy Combustion," atend of section. • Totals may not equal sum of components due to independentrounding. • Geographic coverage is the 50 states and the District of Columbia.
Web Page: See http://www.eia.gov/totalenergy/data/monthly/#environment(Excel and CSV files) for all available annual and monthly data beginning in 1973.
Sources: See end of section.

U. S. Energy Information Administration / Monthly Energy Review March 2019 209
Table 12.6 Carbon Dioxide Emissions From Energy Consumption: Electric Power Sector (Million Metric Tons of Carbon Dioxidea)
CoalNaturalGasb
Petroleum
Geo-thermal
Non-BiomassWasted Totale
DistillateFuel Oilc
PetroleumCoke
ResidualFuel Oil Total
1973 Total ............................ 812 199 20 2 254 276 NA NA 1,2861975 Total ............................ 824 172 17 (s) 231 248 NA NA 1,2441980 Total ............................ 1,137 200 12 1 194 207 NA NA 1,5441985 Total ............................ 1,367 166 6 1 79 86 NA NA 1,6191990 Total ............................ 1,548 176 7 3 92 102 (s) 6 1,8311995 Total ............................ 1,661 228 8 8 45 61 (s) 10 1,9601996 Total ............................ 1,752 205 8 8 50 66 (s) 10 2,0331997 Total ............................ 1,797 219 8 10 56 75 (s) 10 2,1011998 Total ............................ 1,828 248 10 13 82 105 (s) 10 2,1921999 Total ............................ 1,836 260 10 11 76 97 (s) 10 2,2042000 Total ............................ 1,927 281 13 10 69 91 (s) 10 2,3102001 Total ............................ 1,870 290 12 11 79 102 (s) 11 2,2732002 Total ............................ 1,890 306 9 18 52 79 (s) 13 2,2882003 Total ............................ 1,931 278 12 18 69 98 (s) 11 2,3192004 Total ............................ 1,943 297 8 22 69 99 (s) 11 2,3502005 Total ............................ 1,984 319 8 24 69 101 (s) 11 2,4162006 Total ............................ 1,954 338 5 21 28 55 (s) 12 2,3582007 Total ............................ 1,987 372 6 17 31 54 (s) 11 2,4252008 Total ............................ 1,959 362 5 15 19 39 (s) 12 2,3732009 Total ............................ 1,741 373 5 13 14 33 (s) 11 2,1582010 Total ............................ 1,828 399 6 14 12 32 (s) 11 2,2702011 Total ............................ 1,723 409 5 14 7 26 (s) 11 2,1702012 Total ............................ 1,511 493 4 9 6 19 (s) 11 2,0342013 Total ............................ 1,571 444 4 13 6 23 (s) 11 2,0502014 Total ............................ 1,569 444 6 12 7 26 (s) 11 2,0502015 Total ............................ 1,350 527 5 11 7 24 (s) 11 1,913
2016 January ........................ 114 42 1 1 1 2 (s) 1 159 February ...................... 93 38 (s) 1 1 2 (s) 1 133 March ........................... 73 41 (s) 1 (s) 2 (s) 1 117 April ............................. 72 39 (s) 1 (s) 2 (s) 1 114 May .............................. 82 44 (s) 1 (s) 2 (s) 1 129 June ............................. 116 53 (s) 1 (s) 2 (s) 1 172 July .............................. 136 62 (s) 1 1 2 (s) 1 201 August ......................... 135 63 (s) 1 1 2 (s) 1 201 September ................... 114 50 (s) 1 (s) 2 (s) 1 167 October ........................ 100 41 (s) 1 (s) 1 (s) 1 143 November .................... 88 36 (s) 1 (s) 2 (s) 1 127 December .................... 119 37 (s) 1 (s) 2 (s) 1 158 Total ............................ 1,241 547 4 12 6 22 (s) 11 1,821
2017 January ........................ 115 36 (s) 1 (s) 2 (s) 1 154 February ...................... 87 31 (s) 1 (s) 1 (s) 1 121 March ........................... 89 37 (s) 1 (s) 1 (s) 1 128 April ............................. 80 34 (s) (s) (s) 1 (s) 1 117 May .............................. 92 38 (s) 1 (s) 2 (s) 1 133 June ............................. 107 47 (s) 1 (s) 2 (s) 1 156 July .............................. 127 59 (s) 1 (s) 2 (s) 1 189 August ......................... 119 56 (s) 1 (s) 2 (s) 1 178 September ................... 99 47 (s) 1 (s) 1 (s) 1 149 October ........................ 91 42 (s) 1 (s) 1 (s) 1 135 November .................... 92 36 (s) 1 (s) 1 (s) 1 131 December .................... 106 43 1 1 1 2 (s) 1 152 Total ............................ 1,206 507 4 10 5 19 (s) 11 1,743
2018 January ........................ 117 43 2 1 2 5 (s) 1 166 February ...................... 83 38 (s) 1 (s) 1 (s) 1 124 March ........................... 81 41 (s) 1 (s) 1 (s) 1 124 April ............................. 74 39 (s) 1 (s) 1 (s) 1 115 May .............................. 86 47 (s) (s) (s) 1 (s) 1 135 June ............................. 102 52 (s) 1 (s) 2 (s) 1 156 July .............................. 116 R 68 (s) 1 (s) 2 (s) 1 186 August ......................... 116 R 65 (s) 1 (s) 2 (s) 1 184 September ................... 98 57 (s) 1 (s) 2 (s) 1 158 October ........................ 88 49 (s) 1 (s) 1 (s) 1 139 November .................... 94 41 (s) 1 (s) 1 (s) 1 R 138 December .................... 101 41 (s) 1 (s) 1 (s) 1 144 Total ............................ 1,154 581 5 9 6 21 (s) 11 1,768
a Metric tons of carbon dioxide can be converted to metric tons of carbonequivalent by multiplying by 12/44.
b Natural gas, excluding supplemental gaseous fuels.c Distillate fuel oil, excluding biodiesel.d Municipal solid waste from non-biogenic sources, and tire-derived fuels.
Through 1994, also includes blast furnace gas, and other manufactured and wastegases derived from fossil fuels.
e Excludes emissions from biomass energy consumption. See Table 12.7.R=Revised. NA=Not available. (s)=Less than 0.5 million metric tons. Notes: • Data are estimates for carbon dioxide emissions from energy
consumption. See "Section 12 Methodology and Sources" at end of section.• See "Carbon Dioxide" in Glossary. • See Note 1, "Emissions of Carbon Dioxideand Other Greenhouse Gases," at end of section. • Data exclude emissions frombiomass energy consumption. See Table 12.7 and Note 2, "Accounting for CarbonDioxide Emissions From Biomass Energy Combustion," at end of section. • Totalsmay not equal sum of components due to independent rounding. • Geographiccoverage is the 50 states and the District of Columbia.
Web Page: See http://www.eia.gov/totalenergy/data/monthly/#environment(Excel and CSV files) for all available annual and monthly data beginning in 1973.
Sources: See end of section.

210 U. S. Energy Information Administration / Monthly Energy Review March 2019
Table 12.7 Carbon Dioxide Emissions From Biomass Energy Consumption (Million Metric Tons of Carbon Dioxidea)
By Source By Sector
WoodbBiomassWastec
FuelEthanold
Bio-diesel Total
Resi-dential
Com-merciale
Indus-trialf
Trans-portation
ElectricPowerg Total
1973 Total ...................... 143 (s) NA NA 143 33 1 109 NA (s) 1431975 Total ...................... 140 (s) NA NA 141 40 1 100 NA (s) 1411980 Total ...................... 232 (s) NA NA 232 80 2 150 NA (s) 2321985 Total ...................... 252 14 3 NA 270 95 2 168 3 1 2701990 Total ...................... 208 24 4 NA 237 54 8 147 4 23 2371995 Total ...................... 222 30 8 NA 260 49 9 166 8 28 2601996 Total ...................... 229 32 6 NA 266 51 10 170 6 30 2661997 Total ...................... 222 30 7 NA 259 40 10 172 7 30 2591998 Total ...................... 205 30 8 NA 242 36 9 160 8 30 2421999 Total ...................... 208 29 8 NA 245 37 9 161 8 30 2452000 Total ...................... 212 27 9 NA 248 39 9 161 9 29 2482001 Total ...................... 188 33 10 (s) 231 35 9 147 10 31 2312002 Total ...................... 187 36 12 (s) 235 36 9 144 12 35 2352003 Total ...................... 188 36 16 (s) 240 38 9 141 16 37 2402004 Total ...................... 199 35 20 (s) 255 38 10 151 20 36 2552005 Total ...................... 200 37 23 1 261 40 10 150 23 37 2612006 Total ...................... 197 36 31 2 266 36 9 151 33 38 2662007 Total ...................... 196 37 39 3 276 39 9 146 41 39 2762008 Total ...................... 193 39 55 3 290 44 10 139 57 40 2902009 Total ...................... 182 41 62 3 288 47 10 125 64 41 2882010 Total ...................... 208 42 73 2 325 51 10 149 74 42 3252011 Total ...................... 208 42 73 8 331 49 11 151 80 40 3312012 Total ...................... 202 42 73 8 325 41 10 153 80 42 3252013 Total ...................... 219 45 75 13 353 54 11 158 87 43 3532014 Total ...................... 225 47 76 13 361 54 12 158 88 49 3612015 Total ...................... 217 47 79 14 357 48 13 157 90 48 357
2016 January .................. 18 4 6 1 29 4 1 13 7 4 29 February ................ 17 4 6 1 28 3 1 13 7 4 28 March ..................... 17 4 7 1 29 4 1 13 8 4 29 April ....................... 16 4 6 1 28 3 1 12 7 4 28 May ........................ 17 4 7 2 30 4 1 13 8 4 30 June ....................... 17 4 7 2 29 3 1 13 8 4 29 July ........................ 18 4 7 2 31 4 1 13 9 4 31 August ................... 18 4 7 2 31 4 1 13 9 4 31 September ............. 17 4 7 2 29 3 1 12 8 4 29 October .................. 17 4 7 2 29 4 1 13 8 3 29 November .............. 17 4 7 2 30 3 1 13 8 4 30 December .............. 20 4 7 2 33 4 1 15 9 4 33 Total ...................... 209 46 81 20 356 42 14 155 98 47 356
2017 January .................. 18 4 6 1 30 3 1 14 7 4 30 February ................ 16 4 6 1 27 3 1 12 7 4 27 March ..................... 18 4 7 1 30 3 1 14 8 4 30 April ....................... 17 4 7 2 29 3 1 13 8 4 29 May ........................ 18 4 7 2 30 3 1 13 9 4 30 June ....................... 18 4 7 2 30 3 1 13 9 4 30 July ........................ 18 4 7 2 31 3 1 14 8 4 31 August ................... 19 4 7 2 32 3 1 14 9 4 32 September ............. 17 3 7 2 29 3 1 13 8 4 29 October .................. 18 4 7 2 30 3 1 13 8 4 30 November .............. 18 4 7 2 30 3 1 14 8 4 30 December .............. 19 4 7 2 31 3 1 14 8 4 31 Total ...................... 214 45 82 19 360 41 14 161 98 47 360
2018 January .................. 19 4 7 1 31 4 1 14 8 4 31 February ................ 17 4 6 1 28 4 1 13 7 4 28 March ..................... 19 4 7 1 31 4 1 13 8 4 31 April ....................... 18 4 6 1 29 4 1 13 7 R 3 29 May ........................ 19 4 7 2 31 4 1 13 9 4 31 June ....................... 18 4 7 2 31 4 1 13 8 4 31 July ........................ 19 4 7 2 31 4 1 14 9 4 31 August ................... 19 4 7 2 32 4 1 14 9 4 32 September ............. 18 3 6 2 29 4 1 13 8 3 29 October .................. 18 4 7 2 31 4 1 13 8 4 31 November .............. 18 4 7 1 30 4 1 13 8 4 30 December .............. 19 4 7 2 31 4 1 14 8 4 31 Total ...................... 221 45 82 18 365 49 14 161 97 46 365
a Metric tons of carbon dioxide can be converted to metric tons of carbonequivalent by multiplying by 12/44.
b Wood and wood-derived fuels.c Municipal solid waste from biogenic sources, landfill gas, sludge waste,
agricultural byproducts, and other biomass.d Fuel ethanol minus denaturant.e Commercial sector, including commercial combined-heat-and-power (CHP)
and commercial electricity-only plants.f Industrial sector, including industrial combined-heat-and-power (CHP) and
industrial electricity-only plants.g The electric power sector comprises electricity-only and combined-heat-and-
power (CHP) plants within the NAICS 22 category whose primary business is to sellelectricity, or electricity and heat, to the public.
R=Revised. NA=Not available. (s)=Less than 0.5 million metric tons. Notes: • Carbon dioxide emissions from biomass energy consumption are
excluded from the energy-related carbon dioxide emissions reported in Tables12.1–12.6. See Note 2, "Accounting for Carbon Dioxide Emissions From BiomassEnergy Combustion," at end of section. • Data are estimates. See "Section 12Methodology and Sources" at end of section. • See "Carbon Dioxide" in Glossary.• See Note 1, "Emissions of Carbon Dioxide and Other Greenhouse Gases," atend of section. • Totals may not equal sum of components due to independentrounding. • Geographic coverage is the 50 states and the District of Columbia.
Web Page: See http://www.eia.gov/totalenergy/data/monthly/#environment(Excel and CSV files) for all available annual and monthly data beginning in 1973.
Sources: See end of section.

U. S. Energy Information Administration / Monthly Energy Review March 2019 211
Environment Note 1. Emissions of Carbon Dioxide and Other Greenhouse Gases. Greenhouse gases are those gases—such as water
vapor, carbon dioxide (CO2), methane, nitrous oxide, hydrofluorocarbons (HFCs), perfluorocarbons (PFCs), and sulfur
hexafluoride—that are transparent to solar (short‐wave) radiation but opaque to long‐wave (infrared) radiation, thus
preventing long‐wave radiant energy from leaving Earth's atmosphere. The net effect is a trapping of absorbed
radiation and a tendency to warm the planet's surface.
Energy‐related carbon dioxide emissions account for about 98% of U.S. CO2 emissions. The vast majority of CO2
emissions come from fossil fuel combustion, with smaller amounts from the non‐combustion use of fossil fuels, as well
as from electricity generation using geothermal energy and non‐biomass waste. Other sources of CO2 emissions include
industrial processes, such as cement and limestone production. Data in the U.S. Energy Information Administration's
(EIA) Monthly Energy Review (MER) Tables 12.1–12.6 are estimates for U.S. CO2 emissions from energy consumption,
plus the non‐combustion use of fossil fuels (excluded are estimates for CO2 emissions from biomass energy
consumption, which appear in MER Table 12.7).
For annual U.S. estimates for emissions of CO2 from all sources, as well as for emissions of other greenhouse gases, see
EIA's Emissions of Greenhouse Gases Report at http://www.eia.gov/environment/emissions/ghg_report/.
Note 2. Accounting for Carbon Dioxide Emissions From Biomass Energy Combustion. Carbon dioxide (CO2) emissions
from the combustion of biomass to produce energy are excluded from the energy‐related CO2 emissions reported in
MER Tables 12.1–12.6, but appear in MER Table 12.7. According to current international convention (see the
Intergovernmental Panel on Climate Change's "2006 IPCC Guidelines for National Greenhouse Gas Inventories"), carbon
released through biomass combustion is excluded from reported energy‐related emissions. The release of carbon from
biomass combustion is assumed to be balanced by the uptake of carbon when the feedstock is grown, resulting in zero
net emissions over some period of time. (This is not to say that biomass energy is carbon‐neutral. Energy inputs are
required in order to grow, fertilize, and harvest the feedstock and to produce and process the biomass into fuels.)
However, analysts have debated whether increased use of biomass energy may result in a decline in terrestrial carbon
stocks, leading to a net positive release of carbon rather than the zero net release assumed by its exclusion from
reported energy‐related emissions. For example, the clearing of forests for biofuel crops could result in an initial release
of carbon that is not fully recaptured in subsequent use of the land for agriculture.
To reflect the potential net emissions, the international convention for greenhouse gas inventories is to report biomass
emissions in the category "agriculture, forestry, and other land use," usually based on estimates of net changes in
carbon stocks over time.
This indirect accounting of CO2 emissions from biomass can potentially lead to confusion in accounting for and
understanding the flow of CO2 emissions within energy and non‐energy systems. In recognition of this issue, reporting
of CO2 emissions from biomass combustion alongside other energy‐related CO2 emissions offers an alternative
accounting treatment. It is important, however, to avoid misinterpreting emissions from fossil energy and biomass
energy sources as necessarily additive. Instead, the combined total of direct CO2 emissions from biomass and energy‐
related CO2 emissions implicitly assumes that none of the carbon emitted was previously or subsequently reabsorbed in
terrestrial sinks or that other emissions sources offset any such sequestration.
Section 12 Methodology and Sources
To estimate carbon dioxide emissions from energy consumption for the Monthly Energy Review (MER), Tables 12.1–
12.7, the U.S. Energy Information Administration (EIA) uses the following methodology and sources:
Step 1. Determine Fuel Consumption Coal—Coal sectoral (residential, commercial, coke plants, other industrial, transportation, electric power) consumption
data in thousand short tons are from MER Table 6.2. Coal sectoral consumption data are converted to trillion Btu by
multiplying by the coal heat content factors in MER Table A5.

212 U. S. Energy Information Administration / Monthly Energy Review March 2019
Coal Coke Net Imports—Coal coke net imports data in trillion Btu are derived from coal coke imports and exports data in
MER Tables 1.4a and 1.4b.
Natural Gas (excluding supplemental gaseous fuels)—Natural gas sectoral consumption data in trillion Btu are from MER
Tables 2.2–2.6.
Petroleum—Total and sectoral consumption (product supplied) data in thousand barrels per day for asphalt and road oil,
aviation gasoline, distillate fuel oil, hydrocarbon gas liquids (HGL), jet fuel, kerosene, lubricants, motor gasoline,
petroleum coke, and residual fuel oil are from MER Tables 3.5 and 3.7a–3.7c. For the component products of HGL
(ethane/ethylene, propane/propylene, normal butane/butylene, isobutane/isobutylene, and natural gasoline) and
"other petroleum" (aviation gasoline blending components, crude oil, motor gasoline blending components, naphthas
for petrochemical feedstock use, other oils for petrochemical feedstock use, special naphthas, still gas, unfinished oils,
waxes, and miscellaneous petroleum products), consumption (product supplied) data in thousand barrels per day are
from EIA's Petroleum Supply Annual (PSA), Petroleum Supply Monthly (PSM), and earlier publications (see sources for
MER Table 3.5). Petroleum consumption data by product are converted to trillion Btu by multiplying by the petroleum
heat content factors in MER Tables A1 and A3.
Biomass—Sectoral consumption data in trillion Btu for wood, biomass waste, fuel ethanol (minus denaturant), and
biodiesel are from MER Tables 10.2a–10.2c.
Step 2. Remove Biofuels From Petroleum Distillate Fuel Oil—Beginning in 2009, the distillate fuel oil data (for total and transportation sector) in Step 1 include
biodiesel and other renewable diesel fuel, which are non‐fossil renewable fuels.
2009–2011: To remove the biodiesel portion from distillate fuel oil, data for biodiesel consumption (calculated using
data from EIA, EIA‐22M, “Monthly Biodiesel Production Survey”) and biomass‐based diesel fuel data (from EIA‐810,
“Monthly Refinery Report,” EIA‐812, “Monthly Product Pipeline Report,” and EIA‐815, “Monthly Bulk Terminal and
Blender Report”) are converted to trillion Btu by multiplying by the biodiesel heat content factor in MER Table A1, and
then subtracted from the distillate fuel oil consumption values. To remove the other renewable diesel fuel portion from
distillate fuel oil, data for refinery and blender net inputs (from EIA‐810, “Monthly Refinery Report,” and EIA‐815,
“Monthly Bulk Terminal and Blender Report”) are converted to trillion Btu by multiplying by the other renewable diesel
fuel heat content factor in MER Table A1, and then subtracted from the distillate fuel oil consumption values.
2012 forward: To remove the biodiesel portion from distillate fuel oil, data for biodiesel consumption (from MER Table
10.4) is subtracted from the distillate fuel oil consumption values. To remove the other renewable diesel fuel portion
from distillate fuel oil, data for refinery and blender net inputs (from EIA‐810, “Monthly Refinery Report,” and EIA‐815,
“Monthly Bulk Terminal and Blender Report”) are converted to trillion Btu by multiplying by the other renewable diesel
fuel heat content factor in MER Table A1, and then subtracted from the distillate fuel oil consumption values.
Motor Gasoline—Beginning in 1993, the motor gasoline data (for total, commercial sector, industrial sector, and
transportation sector) in Step 1 include fuel ethanol, a non‐fossil renewable fuel. To remove the fuel ethanol portion
from motor gasoline, data in trillion Btu for fuel ethanol consumption (from MER Tables 10.2a, 10.2b, and 10.3) are
subtracted from the motor gasoline consumption values. (Note that about 2% of fuel ethanol is fossil‐based petroleum
denaturant, to make the fuel ethanol undrinkable. For 1993–2008, petroleum denaturant is double counted in the PSA
product supplied statistics, in both the original product category—e.g., natural gasoline—and also in the finished motor
gasoline category; for this time period for MER Section 12, petroleum denaturant is removed along with the fuel ethanol
from motor gasoline, but left in the original product. Beginning in 2009, petroleum denaturant is counted only in the
PSA/PSM product supplied statistics for motor gasoline; for this time period for MER Section 12, petroleum denaturant
is left in motor gasoline.)

U. S. Energy Information Administration / Monthly Energy Review March 2019 213
Step 3. Remove Carbon Sequestered by Non-Combustion Use The following fuels have industrial non‐combustion uses as chemical feedstocks and other products: coal, natural gas,
asphalt and road oil, distillate fuel oil, hydrocarbon gas liquids (ethane/ethylene, propane/propylene, normal
butane/butylene, isobutane/isobutylene, and natural gasoline), lubricants (which have industrial and transportation
non‐combustion uses), naphthas for petrochemical feedstock use, other oils for petrochemical feedstock use, petroleum
coke, residual fuel oil, special naphthas, still gas, waxes, and miscellaneous petroleum products. In the non‐combustion
use of these fuels, some of the carbon is sequestered, and is thus subtracted from the fuel consumption values in Steps
1 and 2.
Estimates of annual non‐combustion use and associated carbon sequestration are developed by EIA using the
methodology detailed in "Documentation for Emissions of Greenhouse Gases in the United States 2008" at
https://www.eia.gov/environment/archive/1605/ggrpt/documentation/pdf/0638_2008.pdf.
To obtain monthly estimates of non‐combustion use and associated carbon sequestration, monthly patterns for
industrial consumption and product supplied data series are used. For coal non‐combustion use, the monthly pattern
for coke plants coal consumption from MER Table 6.2 is used. For natural gas, the monthly pattern for other industrial
non‐CHP natural gas consumption from MER Table 4.3 is used. For distillate fuel oil, petroleum coke, and residual fuel
oil, the monthly patterns for industrial consumption from MER Table 3.7b are used. For the other petroleum products,
the monthly patterns for product supplied from the PSA and PSM are used. See Tables 1.11a and 1.11b for estimates of
fossil fuel non‐combustion uses.
Step 4. Determine Carbon Dioxide Emissions From Energy Consumption Carbon dioxide (CO2) emissions data in million metric tons are calculated by multiplying consumption values in trillion
Btu from Steps 1 and 2 (minus the carbon sequestered in non‐combustion use in Step 3) by the CO2 emissions factors at
http://www.eia.gov/environment/archive/1605/ggrpt/excel/CO2_coeffs_09_v2.xls.
Coal—CO2 emissions for coal are calculated for each sector (residential, commercial, coke plants, other industrial,
transportation, electric power). Total coal emissions are the sum of the sectoral coal emissions.
Coal Coke Net Imports—CO2 emissions for coal coke net imports are calculated.
Natural Gas—CO2 emissions for natural gas are calculated for each sector (residential, commercial, industrial,
transportation, electric power). Total natural gas emissions are the sum of the sectoral natural gas emissions.
Petroleum—CO2 emissions are calculated for each petroleum product. Total petroleum emissions are the sum of the
product emissions. Total HGL emissions are the sum of the emissions for the component products (ethane/ethylene,
propane/propylene, normal butane/butylene, isobutane/isobutylene, and natural gasoline); residential, commercial,
and transportation sector HGL emissions are estimated by multiplying consumption values in trillion Btu from MER
Tables 3.8a and 3.8c by the propane emissions factor; industrial sector HGL emissions are estimated as total HGL
emissions minus emissions by the other sectors.
Geothermal and Non‐Biomass Waste—Annual CO2 emissions data for geothermal and non‐biomass waste are EIA
estimates based on Form EIA‐923, "Power Plant Operations Report" (and predecessor forms). Monthly estimates are
created by dividing the annual data by the number of days in the year and then multiplying by the number of days in the
month. (Annual estimates for the current year are set equal to those of the previous year.)
Biomass—CO2 emissions for wood, biomass waste, fuel ethanol (minus denaturant), and biodiesel are calculated for
each sector. Total emissions for each biomass fuel are the sum of the sectoral emissions. The following factors, in
million metric tons CO2 per quadrillion Btu, are used: wood—93.80; biomass waste—90.70; fuel ethanol—68.44; and
biodiesel—73.84. For 1973–1988, the biomass portion of waste in MER Tables 10.2a–10.2c is estimated as 67%; for
1989–2000, the biomass portion of waste is estimated as 67% in 1989 to 58% in 2000, based on the biogenic shares of
total municipal solid waste shown in EIA's "Methodology for Allocating Municipal Solid Waste to Biogenic and Non‐
Biogenic Energy," Table 1 at http://www.eia.gov/totalenergy/data/monthly/pdf/historical/msw.pdf.

THIS PAGE INTENTIONALLY LEFT BLANK

Appendices

216 U. S. Energy Information Administration / Monthly Energy Review March 2019
Appendix A: British Thermal Unit Conversion Factors The thermal conversion factors presented in the following tables can be used to estimate the heat content in British thermal units (Btu) of a given amount of energy measured in physical units, such as barrels or cubic feet. For example, 10 barrels of asphalt has a heat content of approximately 66.36 million Btu (10 barrels x 6.636 million Btu per barrel = 66.36 million Btu).
The heat content rates (i.e., thermal conversion factors) provided in this section represent the gross (or higher or upper) energy content of the fuels. Gross heat content rates are applied in all Btu calculations for the Monthly Energy Review and are commonly used in energy calculations in the United States; net (or lower) heat content rates are typically used in European energy calculations. The difference between the two rates is the amount of energy that is consumed to vaporize water that is created during the combustion process. Generally, the difference ranges from 2% to 10%, depending on the specific fuel and its hydrogen content. Some fuels, such as unseasoned wood, can be more than 40% different in their gross and net heat content rates. See “Heat Content” and “British Thermal Unit (Btu)” in the Glossary for more information.
In general, the annual thermal conversion factors presented in Tables A2 through A6 are computed from final annual data or from the best available data and labeled “preliminary.” Often, the current year’s factors are labeled “estimate,” and are set equal to the previous year’s values until data become available to calculate the factors. The source of each factor is described in the section entitled “Thermal Conversion Factor Source Documentation,” which follows Table A6 in this appendix.
Table A1. Approximate Heat Content of Petroleum and Other Liquids (Million Btu per Barrel, Except as Noted)
Commodity Heat Content Commodity Heat Content Asphalt and Road Oil 6.636 Motor Gasoline Blending Components (MGBC) Aviation Gasoline (Finished) 5.048 Through 2006 5.253 Aviation Gasoline Blending Components 5.048 Beginning in 2007 5.222 Biodiesel 5.359 Oxygenates (excluding Fuel Ethanol) 4.247 Crude Oil–see Table A2 Petrochemical Feedstocks Distillate Fuel Oil–see Table A3 for averages Naphtha Less Than 401°F 5.248 15 ppm sulfur and under 5.770 Other Oils Equal to or Greater Than 401°F 5.825 Greater than 15 ppm to 500 ppm sulfur 5.817 Petroleum Coke–see Table A3 for averages Greater than 500 ppm sulfur 5.825 Total, through 2003 6.024 Fuel Ethanol–see Table A3 Catalyst, beginning in 2004 a 6.287 Hydrocarbon Gas Liquids Marketable, beginning in 2004 5.719 Ethane/Ethylene 3.082 Plant Condensate 5.418 Propane/Propylene 3.836 Renewable Fuels Except Fuel Ethanol b 5.359; b 5.494 Normal Butane/Butylene 4.326 Residual Fuel Oil 6.287 Isobutane/Isobutylene 3.974 Special Naphthas 5.248 Natural Gasoline (Pentanes Plus) 4.620 Still Gas c 6.287; c 6.000 Hydrogen a 6.287 Unfinished Oils 5.825 Jet Fuel, Kerosene Type 5.670 Unfractionated Stream 5.418 Jet Fuel, Naphtha Type 5.355 Waxes 5.537 Kerosene 5.670 Miscellaneous Products 5.796 Lubricants 6.065 Other Hydrocarbons 5.825 Motor Gasoline (Finished)–see Tables A2/A3
a Per residual fuel oil equivalent barrel (6.287 million Btu per barrel). b The biodiesel heat content factor, 5.359 million Btu per barrel, is used for “Biomass-Based Diesel Fuel” and “Other Renewable Fuels”; however, a
factor of 5.494 million Btu per barrel is used for “Other Renewable Diesel Fuel.” c Through 2015, the still gas heat content factor is 6.000 million Btu per fuel oil equivalent barrel; beginning in 2016, the factor is 6.287 million Btu
per residual fuel oil equivalent barrel. Note: The values in this table are for gross heat contents. See "Heat Content" in Glossary. Web Page: http://www.eia.gov/totalenergy/data/monthly/#appendices. Sources: See “Thermal Conversion Factor Source Documentation,” which follows Table A6.

U. S. Energy Information Administration / Monthly Energy Review March 2019 217
Table A2. Approximate Heat Content of Petroleum Production, Imports, and Exports (Million Btu per Barrel)
Production
Imports Exports
CrudeOila
Petroleum Products
TotalCrudeOila
Petroleum Products
TotalCrudeOila
Natural GasPlant Liquids
MotorGasolineb
TotalProducts
MotorGasolinec
TotalProducts
1950 ...................... 5.800 4.522 5.943 5.253 6.263 6.080 5.800 5.253 5.751 5.7661955 ...................... 5.800 4.406 5.924 5.253 6.234 6.040 5.800 5.253 5.765 5.7681960 ...................... 5.800 4.295 5.911 5.253 6.161 6.021 5.800 5.253 5.835 5.8341965 ...................... 5.800 4.264 5.872 5.253 6.123 5.997 5.800 5.253 5.742 5.7431970 ...................... 5.800 4.146 5.822 5.253 6.088 5.985 5.800 5.253 5.811 5.8101975 ...................... 5.800 3.984 5.821 5.253 5.935 5.858 5.800 5.253 5.747 5.7481980 ...................... 5.800 3.914 5.812 5.253 5.748 5.796 5.800 5.253 5.841 5.8201981 ...................... 5.800 3.930 5.818 5.253 5.659 5.775 5.800 5.253 5.837 5.8211982 ...................... 5.800 3.872 5.826 5.253 5.664 5.775 5.800 5.253 5.829 5.8201983 ...................... 5.800 3.839 5.825 5.253 5.677 5.774 5.800 5.253 5.800 5.8001984 ...................... 5.800 3.812 5.823 5.253 5.613 5.745 5.800 5.253 5.867 5.8501985 ...................... 5.800 3.815 5.832 5.253 5.572 5.736 5.800 5.253 5.819 5.8141986 ...................... 5.800 3.797 5.903 5.253 5.624 5.808 5.800 5.253 5.839 5.8321987 ...................... 5.800 3.804 5.901 5.253 5.599 5.820 5.800 5.253 5.860 5.8581988 ...................... 5.800 3.800 5.900 5.253 5.618 5.820 5.800 5.253 5.842 5.8401989 ...................... 5.800 3.826 5.906 5.253 5.641 5.833 5.800 5.253 5.869 5.8571990 ...................... 5.800 3.822 5.934 5.253 5.614 5.849 5.800 5.253 5.838 5.8331991 ...................... 5.800 3.807 5.948 5.253 5.636 5.873 5.800 5.253 5.827 5.8231992 ...................... 5.800 3.804 5.953 5.253 5.623 5.877 5.800 5.253 5.774 5.7771993 ...................... 5.800 3.801 5.954 5.253 5.539 5.866 5.800 5.253 5.681 5.6931994 ...................... 5.800 3.794 5.950 5.253 5.416 5.835 5.800 5.253 5.693 5.7041995 ...................... 5.800 3.796 5.938 5.253 5.345 5.830 5.800 5.253 5.692 5.7031996 ...................... 5.800 3.777 5.947 5.253 5.373 5.828 5.800 5.253 5.663 5.6781997 ...................... 5.800 3.762 5.954 5.253 5.333 5.836 5.800 5.253 5.663 5.6781998 ...................... 5.800 3.769 5.953 5.253 5.314 5.833 5.800 5.253 5.505 5.5391999 ...................... 5.800 3.744 5.942 5.253 5.291 5.815 5.800 5.253 5.530 5.5642000 ...................... 5.800 3.733 5.959 5.253 5.309 5.823 5.800 5.253 5.529 5.5422001 ...................... 5.800 3.735 5.976 5.253 5.330 5.838 5.800 5.253 5.637 5.6412002 ...................... 5.800 3.729 5.971 5.253 5.362 5.845 5.800 5.253 5.517 5.5192003 ...................... 5.800 3.739 5.970 5.253 5.381 5.845 5.800 5.253 5.628 5.6302004 ...................... 5.800 3.724 5.981 5.253 5.429 5.853 5.800 5.253 5.532 5.5392005 ...................... 5.800 3.724 5.977 5.253 5.436 5.835 5.800 5.253 5.504 5.5132006 ...................... 5.800 3.712 5.980 5.253 5.431 5.836 5.800 5.219 5.415 5.4232007 ...................... 5.800 3.701 5.985 5.222 5.483 5.857 5.800 5.188 5.465 5.4712008 ...................... 5.800 3.706 5.990 5.222 5.459 5.861 5.800 5.215 5.587 5.5912009 ...................... 5.800 3.692 5.988 5.222 5.509 5.878 5.800 5.221 5.674 5.6772010 ...................... 5.800 3.674 5.989 5.222 5.545 5.892 5.800 5.214 5.601 5.6042011 ...................... 5.800 3.672 6.008 5.222 5.538 5.905 5.800 5.216 5.526 5.5302012 ...................... 5.800 3.683 6.165 5.222 5.501 6.035 5.800 5.217 5.520 5.5262013 ...................... 5.800 3.714 6.010 5.222 5.497 5.899 5.800 5.216 5.470 5.4822014 ...................... 5.800 3.723 6.035 5.222 5.518 5.929 5.800 5.218 5.369 5.4062015 ...................... 5.717 3.744 6.065 5.222 5.504 5.941 5.682 5.218 5.279 5.3192016 ...................... 5.722 3.714 6.053 5.222 5.491 5.929 5.724 5.218 5.184 5.2452017 ...................... 5.723 3.699 6.050 5.222 5.489 5.930 5.738 5.221 5.151 5.2582018 ...................... RP 5.705 RP 3.683 RP 6.067 P 5.222 RP 5.490 RP 5.938 RP 5.721 RP 5.222 RP 5.099 RP 5.2642019 ...................... E 5.705 E 3.683 E 6.067 E 5.222 E 5.490 E 5.938 E 5.721 E 5.222 E 5.099 E 5.264
a Includes lease condensate.b Excludes fuel ethanol, methyl tertiary butyl ether (MTBE), and other oxygenates blended into motor gasoline.c Through 2005, excludes fuel ethanol, MTBE, and other oxygenates blended into motor gasoline. Beginning in 2006, includes MTBE, but excludes fuel ethanol and other
oxygenates blended into motor gasoline.R=Revised. P=Preliminary. E=Estimate.Note: The values in this table are for gross heat contents. See "Heat Content" in Glossary. Web Page: See http://www.eia.gov/totalenergy/data/monthly/#appendices (Excel and CSV files) for all available annual data beginning in 1949.Sources: See "Thermal Conversion Factor Source Documentation," which follows Table A6.

218 U. S. Energy Information Administration / Monthly Energy Review March 2019
Table A3. Approximate Heat Content of Petroleum Consumption and Fuel Ethanol (Million Btu per Barrel)
Total Petroleuma Consumption by SectorDistillateFuel Oil
Consump-tionf
HydrocarbonGas
LiquidsConsump-
tiong
MotorGasoline(Finished)Consump-
tionh
PetroleumCoke
Consump-tioni
FuelEthanolj
FuelEthanolFeed-stock
FactorkResi-
dentialCom-
mercialbIndus-trialb
Trans-porta-tionb,c
ElectricPowerd,e Totalb,c
1950 ............ 5.473 5.817 5.953 5.461 6.254 5.649 5.825 4.011 5.253 6.024 NA NA1955 ............ 5.469 5.781 5.881 5.407 6.254 5.591 5.825 4.011 5.253 6.024 NA NA1960 ............ 5.417 5.781 5.818 5.387 6.267 5.555 5.825 4.011 5.253 6.024 NA NA1965 ............ 5.364 5.760 5.748 5.386 6.267 5.532 5.825 4.011 5.253 6.024 NA NA1970 ............ 5.260 5.708 5.595 5.393 6.252 5.503 5.825 g 3.779 5.253 6.024 NA NA1975 ............ 5.253 5.649 5.513 5.392 6.250 5.494 5.825 3.739 5.253 6.024 NA NA1980 ............ 5.321 5.751 5.366 5.441 6.254 5.479 5.825 3.746 5.253 6.024 3.563 6.5861981 ............ 5.283 5.693 5.299 5.433 6.258 5.448 5.825 3.715 5.253 6.024 3.563 6.5621982 ............ 5.266 5.698 5.247 5.423 6.258 5.415 5.825 3.678 5.253 6.024 3.563 6.5391983 ............ 5.140 5.591 5.254 5.416 6.255 5.406 5.825 3.633 5.253 6.024 3.563 6.5151984 ............ 5.307 5.657 5.207 5.418 6.251 5.395 5.825 3.677 5.253 6.024 3.563 6.4921985 ............ 5.263 5.598 5.199 5.423 6.247 5.387 5.825 3.676 5.253 6.024 3.563 6.4691986 ............ 5.268 5.632 5.269 5.426 6.257 5.418 5.825 3.710 5.253 6.024 3.563 6.4461987 ............ 5.239 5.594 5.233 5.429 6.249 5.403 5.825 3.734 5.253 6.024 3.563 6.4231988 ............ 5.257 5.597 5.228 5.433 6.250 5.410 5.825 3.719 5.253 6.024 3.563 6.4001989 ............ 5.194 5.549 5.219 5.438 d 6.240 5.410 5.825 3.747 5.253 6.024 3.563 6.3771990 ............ 5.145 5.553 5.253 5.442 6.244 5.411 5.825 3.712 5.253 6.024 3.563 6.3551991 ............ 5.094 5.528 5.167 5.441 6.246 5.384 5.825 3.708 5.253 6.024 3.563 6.3321992 ............ 5.124 5.513 5.168 5.443 6.238 5.378 5.825 3.722 5.253 6.024 3.563 6.3091993 ............ 5.102 b 5.504 b 5.177 b 5.412 6.230 b 5.363 5.825 3.709 h 5.217 6.024 3.563 6.2871994 ............ 5.095 5.512 5.149 5.413 6.213 5.353 f 5.820 3.730 5.214 6.024 3.563 6.2641995 ............ 5.060 5.475 5.121 5.409 6.187 5.336 5.820 3.718 5.204 6.024 3.563 6.2421996 ............ 4.995 5.430 5.114 5.416 6.194 5.333 5.820 3.708 5.211 6.024 3.563 6.2201997 ............ 4.986 5.387 5.119 5.410 6.198 5.332 5.820 3.704 5.205 6.024 3.563 6.1981998 ............ 4.972 5.361 5.136 5.406 6.210 5.344 5.819 3.697 5.203 6.024 3.563 6.1761999 ............ 4.899 5.287 5.091 5.406 6.204 5.323 5.819 3.706 5.202 6.024 3.563 6.1672000 ............ 4.905 5.312 5.056 5.415 6.188 5.321 5.819 3.692 5.201 6.024 3.563 6.1592001 ............ 4.934 5.321 5.141 5.405 6.199 5.340 5.819 3.685 5.201 6.024 3.563 6.1512002 ............ 4.883 5.289 5.092 5.403 6.172 5.318 5.819 3.671 5.199 6.024 3.563 6.1432003 ............ 4.918 5.312 5.143 5.400 6.182 5.335 5.819 3.688 5.197 6.024 3.563 6.1062004 ............ 4.949 5.323 5.144 5.407 6.134 5.339 5.818 3.677 5.196 i 5.982 3.563 6.0692005 ............ 4.913 5.359 5.179 5.408 6.126 5.351 5.818 3.674 5.192 5.982 3.563 6.0322006 ............ 4.883 5.295 5.158 5.405 6.038 5.333 5.803 3.644 5.185 5.987 3.563 5.9952007 ............ 4.830 5.269 5.121 5.376 6.064 5.303 5.784 3.641 5.142 5.996 3.563 5.9592008 ............ 4.769 5.155 5.146 5.342 6.013 5.278 5.780 3.645 5.106 5.992 3.563 5.9222009 ............ 4.661 5.215 5.014 c 5.319 5.987 c 5.230 5.781 3.595 5.089 6.017 3.563 5.9012010 ............ 4.661 5.193 4.977 5.315 5.956 5.217 5.778 3.600 5.067 6.059 3.561 5.8802011 ............ 4.654 5.174 4.951 5.315 5.900 5.208 5.776 3.543 5.063 6.077 3.560 5.8592012 ............ 4.711 5.124 4.903 5.306 5.925 5.190 5.774 3.559 5.062 6.084 3.560 5.8382013 ............ 4.645 5.052 4.861 5.302 5.892 5.172 5.774 3.579 5.060 6.089 3.559 5.8172014 ............ 4.661 5.014 4.868 5.300 5.906 5.176 5.773 3.558 5.059 6.100 3.558 5.7972015 ............ 4.718 5.049 4.830 5.302 5.915 5.169 5.773 3.576 5.057 6.085 3.558 5.7762016 ............ 4.628 5.020 4.864 5.303 5.885 5.177 5.773 3.543 5.055 6.104 3.558 5.7552017 ............ E 4.608 E 5.008 E 4.838 E 5.305 5.893 5.169 5.772 3.527 5.053 6.132 3.556 5.7352018 ............ RE 4.576 RE 4.987 RE 4.748 RE 5.310 RP 5.904 RP 5.144 P 5.772 RP 3.516 RP 5.054 RP 6.116 RP 3.553 5.7152019 ............ E 4.576 E 4.987 E 4.748 E 5.310 E 5.904 E 5.144 E 5.772 E 3.516 E 5.054 E 6.116 E 3.553 5.694
a Petroleum products supplied, including natural gas plant liquids and crude oil burned directly as fuel. Quantity-weighted averages of the petroleum products included ineach category are calculated by using heat content values for individual products shown in Tables A1 and A3.
b Beginning in 1993, includes fuel ethanol blended into motor gasoline. c Beginning in 2009, includes renewable diesel fuel (including biodiesel) blended into distillate fuel oil. d Electricity-only and combined-heat-and-power (CHP) plants within the NAICS 22 category whose primary business is to sell electricity, or electricity and heat, to the
public. Through 1988, data are for electric utilities only; beginning in 1989, data are for electric utilities and independent power producers.e Electric power sector factors are weighted average heat contents for distillate fuel oil, petroleum coke, and residual fuel oil; they exclude other liquids.f There is a discontinuity in this time series between 1993 and 1994; beginning in 1994, the single constant factor is replaced by a quantity-weighted factor.
Quantity-weighted averages of the sulfur-content categories of distillate fuel oil are calculated by using heat content values shown in Table A1. Excludes renewable dieselfuel (including biodiesel) blended into distillate fuel oil.
g There is a discontinuity in this time series between 1966 and 1967; beginning in 1967, the single constant factor is replaced by a quantity-weighted factor. Quantity-weighted averages of the major components of hydrocarbon gas liquids are calculated by using heat content values shown in Table A1.
h Through 1992, excludes oxygenates. Beginning in 1993, includes fuel ethanol blended into motor gasoline; and for 1993–2006, also includes methyl tertiary butylether (MTBE) and other oxygenates blended into motor gasoline.
i There is a discontinuity in this time series between 2003 and 2004; beginning in 2004, the single constant factor is replaced by a quantity-weighted factor. Quantity-weighted averages of the two categories of petroleum coke are calculated by using heat content values shown in Table A1.
j Includes denaturant (petroleum added to ethanol to make it undrinkable). Fuel ethanol factors are weighted average heat contents for undenatured ethanol (3.539million Btu per barrel) and products used as denaturant (natural gasoline, finished motor gasoline, and motor gasoline blending components—see Tables A1 and A3 forfactors). The factor for 2009 is used as the estimated factor for 1980–2008.
k Corn input to the production of undenatured ethanol (million Btu corn per barrel undenatured ethanol), used as the factor to estimate total biomass inputs to theproduction of undenatured ethanol. Observed ethanol yields (gallons undenatured ethanol per bushel of corn) are 2.5 in 1980, 2.666 in 1998, 2.68 in 2002, 2.78 in 2008, and2.82 in 2012; yields in other years are estimated. Corn is assumed to have a gross heat content of 0.392 million Btu per bushel. Undenatured ethanol is assumed to have agross heat content of 3.539 million Btu per barrel.
R=Revised. P=Preliminary. E=Estimate. NA=Not available. Note: The heat content values in this table are for gross heat contents. See "Heat Content" in Glossary. Web Page: See http://www.eia.gov/totalenergy/data/monthly/#appendices (Excel and CSV files) for all available annual data beginning in 1949.Sources: See "Thermal Conversion Factor Source Documentation," which follows Table A6.
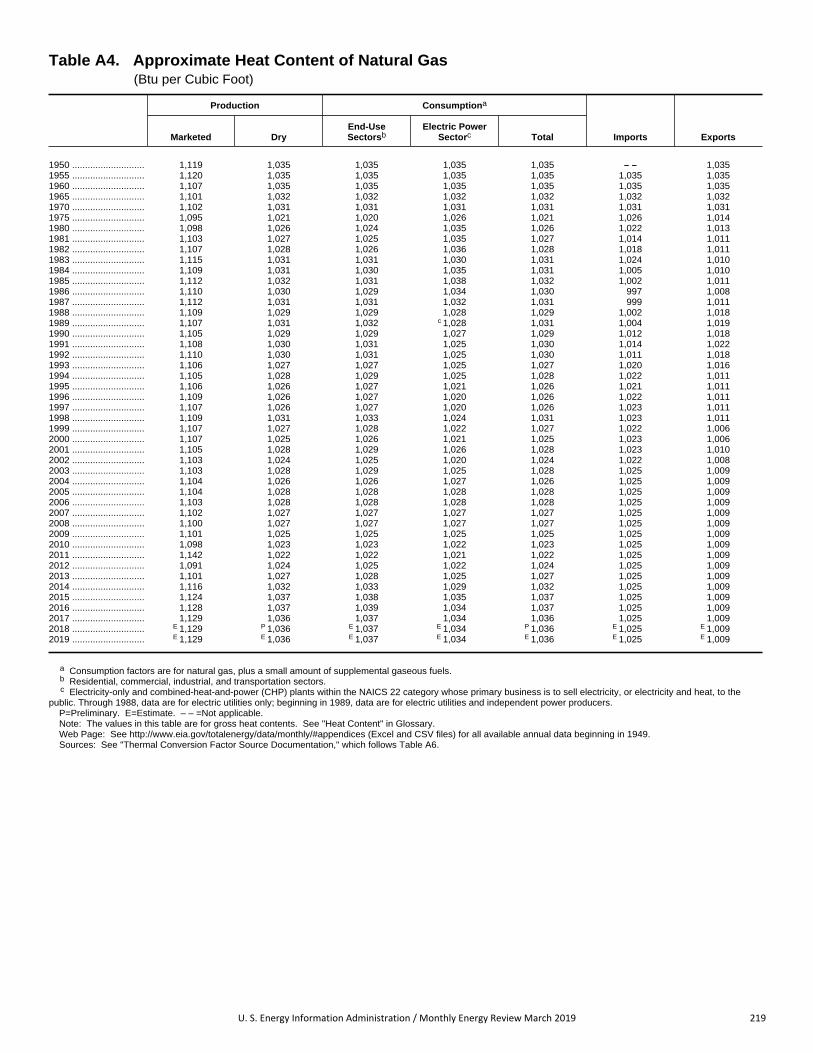
U. S. Energy Information Administration / Monthly Energy Review March 2019 219
Table A4. Approximate Heat Content of Natural Gas (Btu per Cubic Foot)
Production Consumptiona
Imports ExportsMarketed DryEnd-UseSectorsb
Electric PowerSectorc Total
1950 ............................ 1,119 1,035 1,035 1,035 1,035 – – 1,0351955 ............................ 1,120 1,035 1,035 1,035 1,035 1,035 1,0351960 ............................ 1,107 1,035 1,035 1,035 1,035 1,035 1,0351965 ............................ 1,101 1,032 1,032 1,032 1,032 1,032 1,0321970 ............................ 1,102 1,031 1,031 1,031 1,031 1,031 1,0311975 ............................ 1,095 1,021 1,020 1,026 1,021 1,026 1,0141980 ............................ 1,098 1,026 1,024 1,035 1,026 1,022 1,0131981 ............................ 1,103 1,027 1,025 1,035 1,027 1,014 1,0111982 ............................ 1,107 1,028 1,026 1,036 1,028 1,018 1,0111983 ............................ 1,115 1,031 1,031 1,030 1,031 1,024 1,0101984 ............................ 1,109 1,031 1,030 1,035 1,031 1,005 1,0101985 ............................ 1,112 1,032 1,031 1,038 1,032 1,002 1,0111986 ............................ 1,110 1,030 1,029 1,034 1,030 997 1,0081987 ............................ 1,112 1,031 1,031 1,032 1,031 999 1,0111988 ............................ 1,109 1,029 1,029 1,028 1,029 1,002 1,0181989 ............................ 1,107 1,031 1,032 c 1,028 1,031 1,004 1,0191990 ............................ 1,105 1,029 1,029 1,027 1,029 1,012 1,0181991 ............................ 1,108 1,030 1,031 1,025 1,030 1,014 1,0221992 ............................ 1,110 1,030 1,031 1,025 1,030 1,011 1,0181993 ............................ 1,106 1,027 1,027 1,025 1,027 1,020 1,0161994 ............................ 1,105 1,028 1,029 1,025 1,028 1,022 1,0111995 ............................ 1,106 1,026 1,027 1,021 1,026 1,021 1,0111996 ............................ 1,109 1,026 1,027 1,020 1,026 1,022 1,0111997 ............................ 1,107 1,026 1,027 1,020 1,026 1,023 1,0111998 ............................ 1,109 1,031 1,033 1,024 1,031 1,023 1,0111999 ............................ 1,107 1,027 1,028 1,022 1,027 1,022 1,0062000 ............................ 1,107 1,025 1,026 1,021 1,025 1,023 1,0062001 ............................ 1,105 1,028 1,029 1,026 1,028 1,023 1,0102002 ............................ 1,103 1,024 1,025 1,020 1,024 1,022 1,0082003 ............................ 1,103 1,028 1,029 1,025 1,028 1,025 1,0092004 ............................ 1,104 1,026 1,026 1,027 1,026 1,025 1,0092005 ............................ 1,104 1,028 1,028 1,028 1,028 1,025 1,0092006 ............................ 1,103 1,028 1,028 1,028 1,028 1,025 1,0092007 ............................ 1,102 1,027 1,027 1,027 1,027 1,025 1,0092008 ............................ 1,100 1,027 1,027 1,027 1,027 1,025 1,0092009 ............................ 1,101 1,025 1,025 1,025 1,025 1,025 1,0092010 ............................ 1,098 1,023 1,023 1,022 1,023 1,025 1,0092011 ............................ 1,142 1,022 1,022 1,021 1,022 1,025 1,0092012 ............................ 1,091 1,024 1,025 1,022 1,024 1,025 1,0092013 ............................ 1,101 1,027 1,028 1,025 1,027 1,025 1,0092014 ............................ 1,116 1,032 1,033 1,029 1,032 1,025 1,0092015 ............................ 1,124 1,037 1,038 1,035 1,037 1,025 1,0092016 ............................ 1,128 1,037 1,039 1,034 1,037 1,025 1,0092017 ............................ 1,129 1,036 1,037 1,034 1,036 1,025 1,0092018 ............................ E 1,129 P 1,036 E 1,037 E 1,034 P 1,036 E 1,025 E 1,0092019 ............................ E 1,129 E 1,036 E 1,037 E 1,034 E 1,036 E 1,025 E 1,009
a Consumption factors are for natural gas, plus a small amount of supplemental gaseous fuels.b Residential, commercial, industrial, and transportation sectors.c Electricity-only and combined-heat-and-power (CHP) plants within the NAICS 22 category whose primary business is to sell electricity, or electricity and heat, to the
public. Through 1988, data are for electric utilities only; beginning in 1989, data are for electric utilities and independent power producers.P=Preliminary. E=Estimate. – – =Not applicable. Note: The values in this table are for gross heat contents. See "Heat Content" in Glossary. Web Page: See http://www.eia.gov/totalenergy/data/monthly/#appendices (Excel and CSV files) for all available annual data beginning in 1949.Sources: See "Thermal Conversion Factor Source Documentation," which follows Table A6.
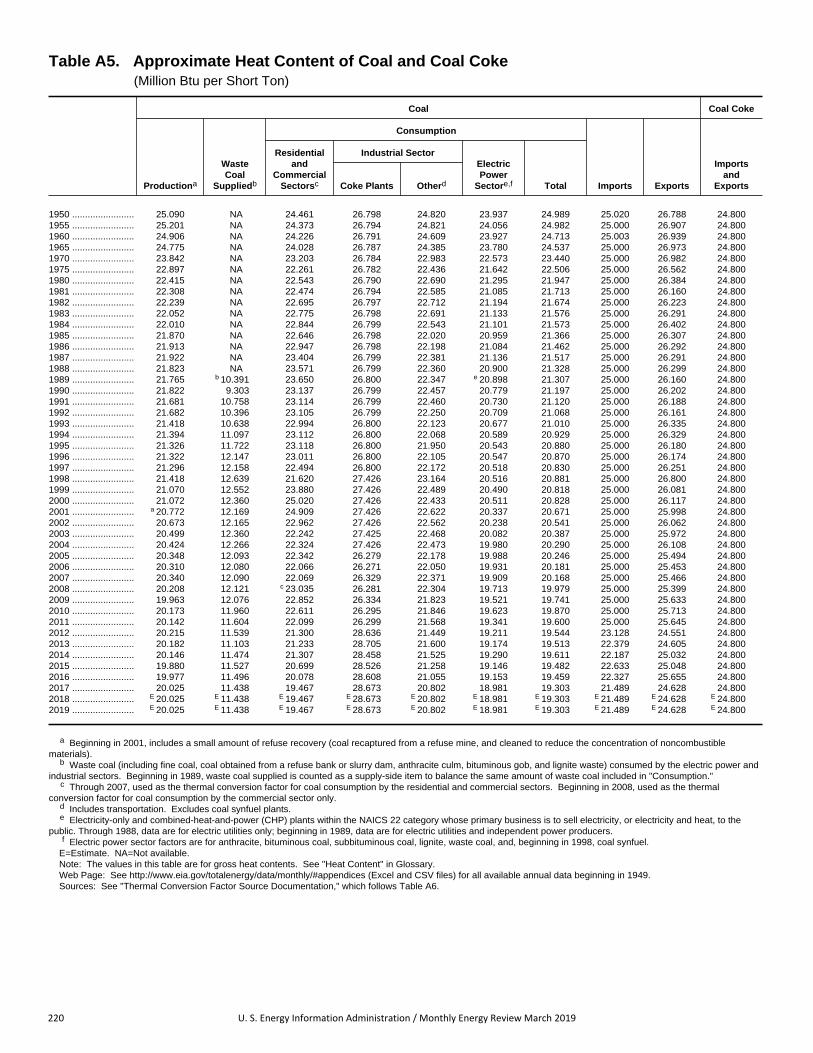
220 U. S. Energy Information Administration / Monthly Energy Review March 2019
Table A5. Approximate Heat Content of Coal and Coal Coke (Million Btu per Short Ton)
Coal Coal Coke
Productiona
WasteCoal
Suppliedb
Consumption
Imports Exports
Importsand
Exports
Residentialand
CommercialSectorsc
Industrial SectorElectricPower
Sectore,f TotalCoke Plants Otherd
1950 ........................ 25.090 NA 24.461 26.798 24.820 23.937 24.989 25.020 26.788 24.8001955 ........................ 25.201 NA 24.373 26.794 24.821 24.056 24.982 25.000 26.907 24.8001960 ........................ 24.906 NA 24.226 26.791 24.609 23.927 24.713 25.003 26.939 24.8001965 ........................ 24.775 NA 24.028 26.787 24.385 23.780 24.537 25.000 26.973 24.8001970 ........................ 23.842 NA 23.203 26.784 22.983 22.573 23.440 25.000 26.982 24.8001975 ........................ 22.897 NA 22.261 26.782 22.436 21.642 22.506 25.000 26.562 24.8001980 ........................ 22.415 NA 22.543 26.790 22.690 21.295 21.947 25.000 26.384 24.8001981 ........................ 22.308 NA 22.474 26.794 22.585 21.085 21.713 25.000 26.160 24.8001982 ........................ 22.239 NA 22.695 26.797 22.712 21.194 21.674 25.000 26.223 24.8001983 ........................ 22.052 NA 22.775 26.798 22.691 21.133 21.576 25.000 26.291 24.8001984 ........................ 22.010 NA 22.844 26.799 22.543 21.101 21.573 25.000 26.402 24.8001985 ........................ 21.870 NA 22.646 26.798 22.020 20.959 21.366 25.000 26.307 24.8001986 ........................ 21.913 NA 22.947 26.798 22.198 21.084 21.462 25.000 26.292 24.8001987 ........................ 21.922 NA 23.404 26.799 22.381 21.136 21.517 25.000 26.291 24.8001988 ........................ 21.823 NA 23.571 26.799 22.360 20.900 21.328 25.000 26.299 24.8001989 ........................ 21.765 b 10.391 23.650 26.800 22.347 e 20.898 21.307 25.000 26.160 24.8001990 ........................ 21.822 9.303 23.137 26.799 22.457 20.779 21.197 25.000 26.202 24.8001991 ........................ 21.681 10.758 23.114 26.799 22.460 20.730 21.120 25.000 26.188 24.8001992 ........................ 21.682 10.396 23.105 26.799 22.250 20.709 21.068 25.000 26.161 24.8001993 ........................ 21.418 10.638 22.994 26.800 22.123 20.677 21.010 25.000 26.335 24.8001994 ........................ 21.394 11.097 23.112 26.800 22.068 20.589 20.929 25.000 26.329 24.8001995 ........................ 21.326 11.722 23.118 26.800 21.950 20.543 20.880 25.000 26.180 24.8001996 ........................ 21.322 12.147 23.011 26.800 22.105 20.547 20.870 25.000 26.174 24.8001997 ........................ 21.296 12.158 22.494 26.800 22.172 20.518 20.830 25.000 26.251 24.8001998 ........................ 21.418 12.639 21.620 27.426 23.164 20.516 20.881 25.000 26.800 24.8001999 ........................ 21.070 12.552 23.880 27.426 22.489 20.490 20.818 25.000 26.081 24.8002000 ........................ 21.072 12.360 25.020 27.426 22.433 20.511 20.828 25.000 26.117 24.8002001 ........................ a 20.772 12.169 24.909 27.426 22.622 20.337 20.671 25.000 25.998 24.8002002 ........................ 20.673 12.165 22.962 27.426 22.562 20.238 20.541 25.000 26.062 24.8002003 ........................ 20.499 12.360 22.242 27.425 22.468 20.082 20.387 25.000 25.972 24.8002004 ........................ 20.424 12.266 22.324 27.426 22.473 19.980 20.290 25.000 26.108 24.8002005 ........................ 20.348 12.093 22.342 26.279 22.178 19.988 20.246 25.000 25.494 24.8002006 ........................ 20.310 12.080 22.066 26.271 22.050 19.931 20.181 25.000 25.453 24.8002007 ........................ 20.340 12.090 22.069 26.329 22.371 19.909 20.168 25.000 25.466 24.8002008 ........................ 20.208 12.121 c 23.035 26.281 22.304 19.713 19.979 25.000 25.399 24.8002009 ........................ 19.963 12.076 22.852 26.334 21.823 19.521 19.741 25.000 25.633 24.8002010 ........................ 20.173 11.960 22.611 26.295 21.846 19.623 19.870 25.000 25.713 24.8002011 ........................ 20.142 11.604 22.099 26.299 21.568 19.341 19.600 25.000 25.645 24.8002012 ........................ 20.215 11.539 21.300 28.636 21.449 19.211 19.544 23.128 24.551 24.8002013 ........................ 20.182 11.103 21.233 28.705 21.600 19.174 19.513 22.379 24.605 24.8002014 ........................ 20.146 11.474 21.307 28.458 21.525 19.290 19.611 22.187 25.032 24.8002015 ........................ 19.880 11.527 20.699 28.526 21.258 19.146 19.482 22.633 25.048 24.8002016 ........................ 19.977 11.496 20.078 28.608 21.055 19.153 19.459 22.327 25.655 24.8002017 ........................ 20.025 11.438 19.467 28.673 20.802 18.981 19.303 21.489 24.628 24.8002018 ........................ E 20.025 E 11.438 E 19.467 E 28.673 E 20.802 E 18.981 E 19.303 E 21.489 E 24.628 E 24.8002019 ........................ E 20.025 E 11.438 E 19.467 E 28.673 E 20.802 E 18.981 E 19.303 E 21.489 E 24.628 E 24.800
a Beginning in 2001, includes a small amount of refuse recovery (coal recaptured from a refuse mine, and cleaned to reduce the concentration of noncombustiblematerials).
b Waste coal (including fine coal, coal obtained from a refuse bank or slurry dam, anthracite culm, bituminous gob, and lignite waste) consumed by the electric power andindustrial sectors. Beginning in 1989, waste coal supplied is counted as a supply-side item to balance the same amount of waste coal included in "Consumption."
c Through 2007, used as the thermal conversion factor for coal consumption by the residential and commercial sectors. Beginning in 2008, used as the thermalconversion factor for coal consumption by the commercial sector only.
d Includes transportation. Excludes coal synfuel plants.e Electricity-only and combined-heat-and-power (CHP) plants within the NAICS 22 category whose primary business is to sell electricity, or electricity and heat, to the
public. Through 1988, data are for electric utilities only; beginning in 1989, data are for electric utilities and independent power producers.f Electric power sector factors are for anthracite, bituminous coal, subbituminous coal, lignite, waste coal, and, beginning in 1998, coal synfuel.
E=Estimate. NA=Not available. Note: The values in this table are for gross heat contents. See "Heat Content" in Glossary. Web Page: See http://www.eia.gov/totalenergy/data/monthly/#appendices (Excel and CSV files) for all available annual data beginning in 1949.Sources: See "Thermal Conversion Factor Source Documentation," which follows Table A6.

U. S. Energy Information Administration / Monthly Energy Review March 2019 221
Table A6. Approximate Heat Rates for Electricity, and Heat Content of Electricity (Btu per Kilowatthour)
Approximate Heat Ratesa for Electricity Net Generation
Heat Contentj ofElectricityk
Fossil Fuelsb
Nuclearh
NoncombustibleRenewableEnergyg,iCoalc Petroleumd
NaturalGase
TotalFossil Fuelsf,g
1950 .............................. NA NA NA 14,030 – – 14,030 3,4121955 .............................. NA NA NA 11,699 – – 11,699 3,4121960 .............................. NA NA NA 10,760 11,629 10,760 3,4121965 .............................. NA NA NA 10,453 11,804 10,453 3,4121970 .............................. NA NA NA 10,494 10,977 10,494 3,4121975 .............................. NA NA NA 10,406 11,013 10,406 3,4121980 .............................. NA NA NA 10,388 10,908 10,388 3,4121981 .............................. NA NA NA 10,453 11,030 10,453 3,4121982 .............................. NA NA NA 10,454 11,073 10,454 3,4121983 .............................. NA NA NA 10,520 10,905 10,520 3,4121984 .............................. NA NA NA 10,440 10,843 10,440 3,4121985 .............................. NA NA NA 10,447 10,622 10,447 3,4121986 .............................. NA NA NA 10,446 10,579 10,446 3,4121987 .............................. NA NA NA 10,419 10,442 10,419 3,4121988 .............................. NA NA NA 10,324 10,602 10,324 3,4121989 .............................. NA NA NA 10,432 10,583 10,432 3,4121990 .............................. NA NA NA 10,402 10,582 10,402 3,4121991 .............................. NA NA NA 10,436 10,484 10,436 3,4121992 .............................. NA NA NA 10,342 10,471 10,342 3,4121993 .............................. NA NA NA 10,309 10,504 10,309 3,4121994 .............................. NA NA NA 10,316 10,452 10,316 3,4121995 .............................. NA NA NA 10,312 10,507 10,312 3,4121996 .............................. NA NA NA 10,340 10,503 10,340 3,4121997 .............................. NA NA NA 10,213 10,494 10,213 3,4121998 .............................. NA NA NA 10,197 10,491 10,197 3,4121999 .............................. NA NA NA 10,226 10,450 10,226 3,4122000 .............................. NA NA NA 10,201 10,429 10,201 3,4122001 .............................. 10,378 10,742 10,051 b 10,333 10,443 10,333 3,4122002 .............................. 10,314 10,641 9,533 10,173 10,442 10,173 3,4122003 .............................. 10,297 10,610 9,207 10,125 10,422 10,125 3,4122004 .............................. 10,331 10,571 8,647 10,016 10,428 10,016 3,4122005 .............................. 10,373 10,631 8,551 9,999 10,436 9,999 3,4122006 .............................. 10,351 10,809 8,471 9,919 10,435 9,919 3,4122007 .............................. 10,375 10,794 8,403 9,884 10,489 9,884 3,4122008 .............................. 10,378 11,015 8,305 9,854 10,452 9,854 3,4122009 .............................. 10,414 10,923 8,160 9,760 10,459 9,760 3,4122010 .............................. 10,415 10,984 8,185 9,756 10,452 9,756 3,4122011 .............................. 10,444 10,829 8,152 9,716 10,464 9,716 3,4122012 .............................. 10,498 10,991 8,039 9,516 10,479 9,516 3,4122013 .............................. 10,459 10,713 7,948 9,541 10,449 9,541 3,4122014 .............................. 10,428 10,814 7,907 9,510 10,459 9,510 3,4122015 .............................. 10,495 10,687 7,878 9,319 10,458 9,319 3,4122016 .............................. 10,493 10,811 7,870 9,232 10,459 9,232 3,4122017 .............................. 10,465 10,834 7,812 9,213 10,459 9,213 3,4122018 .............................. E 10,465 E 10,834 E 7,812 E 9,213 E 10,459 E 9,213 3,4122019 .............................. E 10,465 E 10,834 E 7,812 E 9,213 E 10,459 E 9,213 3,412
a The values in columns 1–6 of this table are for net heat rates. See "Heat Rate" in Glossary.b Through 2000, heat rates are for fossil-fueled steam-electric plants at electric utilities. Beginning in 2001, heat rates are for all fossil-fueled plants at electric utilities and
electricity-only independent power producers.c Includes anthracite, bituminous coal, subbituminous coal, lignite, and, beginning in 2002, waste coal and coal synfuel.d Includes distillate fuel oil, residual fuel oil, jet fuel, kerosene, petroleum coke, and waste oil.e Includes natural gas and supplemental gaseous fuels.f Includes coal, petroleum, natural gas, and, beginning in 2001, other gases (blast furnace gas, propane gas, and other manufactured and waste gases derived from fossil
fuels).g The fossil-fuels heat rate is used as the thermal conversion factor for electricity net generation from noncombustible renewable energy (hydro, geothermal, solar
thermal, photovoltaic, and wind) to approximate the quantity of fossil fuels replaced by these sources. Through 2000, also used as the thermal conversion factor for woodand waste electricity net generation at electric utilities; beginning in 2001, Btu data for wood and waste at electric utilities are available from surveys.
h Used as the thermal conversion factor for nuclear electricity net generation.i Technology-based geothermal heat rates are no longer used in Btu calculations in this report. For technology-based geothermal heat rates for 1960–2010, see the
Annual Energy Review 2010, Table A6.j See "Heat Content" in Glossary.
k The value of 3,412 Btu per kilowatthour is a constant. It is used as the thermal conversion factor for electricity retail sales, and electricity imports and exports.E=Estimate. NA=Not available. – – =Not applicable. Web Page: See http://www.eia.gov/totalenergy/data/monthly/#appendices (Excel and CSV files) for all available annual data beginning in 1949.Sources: See "Thermal Conversion Factor Source Documentation," which follows this table.

THIS PAGE INTENTIONALLY LEFT BLANK

U. S. Energy Information Administration / Monthly Energy Review March 2019 223
Thermal Conversion Factor Source Documentation
Approximate Heat Content of Petroleum and Natural Gas Liquids
Asphalt. The U.S. Energy Information Administration (EIA) adopted the thermal conversion factor of 6.636 million
British thermal units (Btu) per barrel as estimated by the Bureau of Mines and first published in the Petroleum
Statement, Annual, 1956.
Aviation Gasoline Blending Components. Assumed by EIA to be 5.048 million Btu per barrel or equal to the thermal conversion factor for Aviation Gasoline (Finished).
Aviation Gasoline (Finished). EIA adopted the thermal conversion factor of 5.048 million Btu per barrel as adopted by the Bureau of Mines from the Texas Eastern Transmission Corporation publication Competition and Growth in American Energy Markets 1947–1985, a 1968 release of historical and projected statistics.
Butane‐Propane Mixture. EIA adopted the Bureau of Mines calculation of 4.130 million Btu per barrel based on an assumed mixture of 60% normal butane and 40% propane. See Normal Butane/Butylene and Propane/Propylene.
Crude Oil Exports. • 1949–2014: Assumed by EIA to be 5.800 million Btu per barrel or equal to the thermal conversion factor for crude oil produced in the United States. See Crude Oil Production. • 2015 forward: Calculated annually by EIA based on conversion of American Petroleum Institute (API) gravity ranges of crude oil exports as reported in trade data from the U.S. Census Bureau. Specific gravity (SG) = 141.5 / (131.5 + API gravity). The higher heating value (HHV) in million Btu per barrel = SG * (7.801796 ‐ 1.3213 * SG2).
Crude Oil Imports. Calculated annually by EIA as the average of the thermal conversion factors for each type of crude oil imported weighted by the quantities imported. Thermal conversion factors for each type were calculated on a foreign country basis, by determining the average American Petroleum Institute (API) gravity of crude oil imported from each foreign country from Form ERA‐60 in 1977 and converting average API gravity to average Btu content by using National Bureau of Standards, Miscellaneous Publication No. 97, Thermal Properties of Petroleum Products, 1933.
Crude Oil Production. • 1949–2014: EIA adopted the thermal conversion factor of 5.800 million Btu per barrel as reported in a Bureau of Mines internal memorandum, “Bureau of Mines Standard Average Heating Values of Various Fuels, Adopted January 3, 1950.” • 2015 forward: Calculated annually by EIA based on conversion of American Petroleum Institute (API) gravity ranges of crude oil production as reported on Form EIA‐914, “Monthly Crude Oil, Lease Condensate, and Natural Gas Production Report.” Specific gravity (SG) = 141.5 / (131.5 + API gravity). The higher heating value (HHV) in million Btu per barrel = SG * (7.801796 ‐ 1.3213 * SG2).
Distillate Fuel Oil Consumption. • 1949–1993: EIA adopted the Bureau of Mines thermal conversion factor of 5.825 million Btu per barrel as reported in a Bureau of Mines internal memorandum, “Bureau of Mines Standard Average Heating Values of Various Fuels, Adopted January 3, 1950.” • 1994 forward: Calculated by EIA as the annual quantity‐weighted average of the conversion factors for Distillate Fuel Oil, 15 ppm Sulfur and Under (5.770 million Btu per barrel), Distillate Fuel Oil, Greater Than 15 ppm to 500 ppm Sulfur (5.817 million Btu per barrel), and Distillate Fuel Oil, Greater Than 500 ppm Sulfur (5.825 million Btu per barrel).
Distillate Fuel Oil, 15 ppm Sulfur and Under. EIA adopted the thermal conversion factor of 5.770 million Btu per barrel (137,380 Btu per gallon) for U.S. conventional diesel from U.S. Department of Energy, Argonne National Laboratory, “The Greenhouse Gases, Regulated Emissions, and Energy Use in Transportation Model” (GREET), version GREET1_2013, October 2013.
Distillate Fuel Oil, Greater Than 15 ppm to 500 ppm Sulfur. EIA adopted the thermal conversion factor of 5.817 million Btu per barrel (138,490 Btu per gallon) for low‐sulfur diesel from U.S. Department of Energy, Argonne Laboratory, “The Greenhouse Gases, Regulated Emissions, and Energy Use in Transportation Model” (GREET), version GREET1_2013, October 2013.
Distillate Fuel Oil, Greater Than 500 ppm Sulfur. EIA adopted the Bureau of Mines thermal conversion factor of 5.825 million Btu per barrel as reported in a Bureau of Mines internal memorandum, “Bureau of Mines Standard Average Heating Values of Various Fuels, Adopted January 3, 1950.”
Ethane/Ethylene. EIA adopted the Bureau of Mines thermal conversion factor of 3.082 million Btu per barrel as published in the California Oil World and Petroleum Industry, First Issue, April 1942.

224 U. S. Energy Information Administration / Monthly Energy Review March 2019
Ethane‐Propane Mixture. EIA calculation of 3.308 million Btu per barrel based on an assumed mixture of 70% ethane and 30% propane. See Ethane/Ethylene and Propane/Propylene.
Hydrocarbon Gas Liquids. • 1949–1966: U.S. Department of the Interior, Bureau of Mines, Mineral Industry Surveys, “Crude Petroleum and Petroleum Products, 1956,” Table 4 footnote, constant value of 4.011 million Btu per barrel. • 1967 forward: Calculated annually by EIA as the average of the thermal conversion factors for all hydrocarbon gas liquids consumed (see Table A1) weighted by the quantities consumed. The component products of hydrocarbon gas liquids are ethane (including ethylene), propane (including propylene), normal butane (including butylene), isobutane (including isobutylene), butane‐propane mixtures, ethane‐propane mixtures, and natural gasoline (pentanes plus). For 1967–1980, quantities consumed are from EIA, Energy Data Reports, “Petroleum Statement, Annual,” Table 1. For 1981 forward, quantities consumed are from EIA, Petroleum Supply Annual, Table 2.
Hydrogen. Assumed by EIA to be 6.287 million Btu per barrel or equal to the thermal conversion factor for Residual Fuel Oil.
Isobutane/Isobutylene. EIA adopted the Bureau of Mines thermal conversion factor of 3.974 million Btu per barrel as published in the California Oil World and Petroleum Industry, First Issue, April 1942.
Jet Fuel, Kerosene‐Type. EIA adopted the Bureau of Mines thermal conversion factor of 5.670 million Btu per barrel for “Jet Fuel, Commercial” as published by the Texas Eastern Transmission Corporation in the report Competition and Growth in American Energy Markets 1947–1985, a 1968 release of historical and projected statistics.
Jet Fuel, Naphtha‐Type. EIA adopted the Bureau of Mines thermal conversion factor of 5.355 million Btu per barrel for “Jet Fuel, Military” as published by the Texas Eastern Transmission Corporation in the report Competition and Growth in American Energy Markets 1947–1985, a 1968 release of historical and projected statistics.
Kerosene. EIA adopted the Bureau of Mines thermal conversion factor of 5.670 million Btu per barrel as reported in a Bureau of Mines internal memorandum, “Bureau of Mines Standard Average Heating Values of Various Fuels, Adopted January 3, 1950.”
Lubricants. EIA adopted the thermal conversion factor of 6.065 million Btu per barrel as estimated by the Bureau of Mines and first published in the Petroleum Statement, Annual, 1956.
Miscellaneous Products. EIA adopted the thermal conversion factor of 5.796 million Btu per barrel as estimated by the Bureau of Mines and first published in the Petroleum Statement, Annual, 1956.
Motor Gasoline Blending Components. • 1949–2006: EIA adopted the Bureau of Mines thermal conversion factor of 5.253 million Btu per barrel for “Gasoline, Motor Fuel” as published by the Texas Eastern Transmission Corporation in Appendix V of Competition and Growth in American Markets 1947‐1985, a 1968 release of historical and projected statistics. • 2007 forward: EIA adopted the thermal conversion factor of 5.222 million Btu per barrel (124,340 Btu per gallon) for gasoline blendstock from U.S. Department of Energy, Argonne National Laboratory, “The Greenhouse Gases, Regulated Emissions, and Energy Use in Transportation Model” (GREET), version GREET1_2013, October 2013.
Motor Gasoline Exports. • 1949–2005: EIA adopted the Bureau of Mines thermal conversion factor of 5.253 million Btu per barrel for “Gasoline, Motor Fuel” as published by the Texas Eastern Transmission Corporation in Appendix V of Competition and Growth in American Energy Markets 1947–1985, a 1968 release of historical and projected statistics. • 2006 forward: Calculated by EIA as the annual quantity‐weighted average of the conversion factors for gasoline blendstock and the methyl tertiary butyl ether (MTBE) blended into motor gasoline exports. The factor for gasoline blendstock is 5.253 million Btu per barrel in 2006 and 5.222 million Btu per barrel beginning in 2007 (see Motor Gasoline Blending Components). For MTBE, EIA adopted the thermal conversion factor of 4.247 million Btu per barrel (101,130 Btu per gallon) from U.S. Department of Energy, Argonne National Laboratory, “The Greenhouse Gases, Regulated Emissions, and Energy Use in Transportation Model” (GREET), version GREET1_2013, October 2013.
Motor Gasoline (Finished) Consumption. • 1949–1992: EIA adopted the Bureau of Mines thermal conversion factor of 5.253 million Btu per barrel for “Gasoline, Motor Fuel” as published by the Texas Eastern Transmission Corporation in Appendix V of Competition and Growth in American Markets 1947‐1985, a 1968 release of historical and projected statistics. • 1993–2006: Calculated by EIA as the annual quantity‐weighted average of the conversion factors for gasoline blendstock and the oxygenates blended into motor gasoline. The factor for gasoline blendstock is 5.253 million Btu per barrel (the motor gasoline factor used for previous years). The factors for fuel ethanol are shown in Table A3 (see Fuel Ethanol, Denatured). The following factors for other oxygenates are from U.S. Department of Energy, Argonne National Laboratory, “The Greenhouse Gases, Regulated Emissions, and Energy Use in Transportation Model” (GREET), version GREET1_2013, October 2013—methyl tertiary butyl ether (MTBE): 4.247 million Btu per barrel (101,130 Btu per

U. S. Energy Information Administration / Monthly Energy Review March 2019 225
gallon); tertiary amyl methyl ether (TAME): 4.560 million Btu per barrel (108,570 Btu per gallon); ethyl tertiary butyl ether (ETBE): 4.390 million Btu per barrel (104,530 Btu per gallon); methanol: 2.738 million Btu per barrel (65,200 Btu per gallon); and butanol: 4.555 million Btu per barrel (108,458 Btu per gallon). • 2007 forward: Calculated by EIA as the annual quantity‐weighted average of the conversion factors for gasoline blendstock and fuel ethanol blended into motor gasoline. The factor for gasoline blendstock is 5.222 million Btu per barrel (124,340 Btu per gallon), which is from the GREET model (see above). The factors for fuel ethanol are shown in Table A3 (see Fuel Ethanol, Denatured).
Motor Gasoline Imports. • 1949–2006: EIA adopted the Bureau of Mines thermal conversion factor of 5.253 million Btu per barrel for “Gasoline, Motor Fuel” as published by the Texas Eastern Transmission Corporation in Appendix V of Competition and Growth in American Energy Markets 1947–1985, a 1968 release of historical and projected statistics. • 2007 forward: EIA adopted the thermal conversion factor of 5.222 million Btu per barrel (124,340 Btu per gallon) for gasoline blendstock from U.S. Department of Energy, Argonne National Laboratory, “The Greenhouse Gases, Regulated Emissions, and Energy Use in Transportation Model” (GREET), version GREET1_2013, October 2013.
Natural Gas Plant Liquids Production. Calculated annually by EIA as the average of the thermal conversion factors for each natural gas plant liquid produced weighted by the quantities produced.
Natural Gasoline. EIA adopted the thermal conversion factor of 4.620 million Btu per barrel as estimated by the Bureau of Mines and first published in the Petroleum Statement, Annual 1956.
Normal Butane/Butylene. EIA adopted the Bureau of Mines thermal conversion factor of 4.326 million Btu per barrel as published in the California Oil World and Petroleum Industry, First Issue, April 1942.
Other Hydrocarbons. Assumed by EIA to be 5.825 million Btu per barrel or equal to the thermal conversion factor for Unfinished Oils.
Oxygenates (Excluding Fuel Ethanol). EIA adopted the thermal conversion factor of 4.247 million Btu per barrel (101,130 Btu per gallon) for methyl tertiary butyl ether (MTBE) from U.S. Department of Energy, Argonne National Laboratory, “The Greenhouse Gases, Regulated Emissions, and Energy Use in Transportation Model” (GREET), version GREET1_2013, October 2013.
Petrochemical Feedstocks, Naphtha Less Than 401 Degrees Fahrenheit. Assumed by EIA to be 5.248 million Btu per barrel or equal to the thermal conversion factor for Special Naphthas.
Petrochemical Feedstocks, Other Oils Equal to or Greater Than 401 Degrees Fahrenheit. Assumed by EIA to be 5.825 million Btu per barrel or equal to the thermal conversion factor for Distillate Fuel Oil.
Petrochemical Feedstocks, Still Gas. Assumed by EIA to be equal to the thermal conversion factor for Still Gas.
Petroleum Coke, Catalyst. Assumed by EIA to be 6.287 million Btu per barrel or equal to the thermal conversion factor for Residual Fuel Oil.
Petroleum Coke, Marketable. EIA adopted the thermal conversion factor of 5.719 million Btu per barrel, calculated by dividing 28,595,925 Btu per short ton for petroleum coke (from U.S. Department of Energy, Argonne National Laboratory, “The Greenhouse Gases, Regulated Emissions, and Energy Use in Transportation Model” (GREET), version GREET1_October 2013) by 5.0 barrels per short ton (as given in the Bureau of Mines Form 6‐1300‐M and successor EIA forms).
Petroleum Coke, Total. • 1949–2003: EIA adopted the thermal conversion factor of 6.024 million Btu per barrel as reported in Btu per short ton in the Bureau of Mines internal memorandum, “Bureau of Mines Standard Average Heating Values of Various Fuels, Adopted January 3, 1950.” The Bureau of Mines calculated this factor by dividing 30.120 million Btu per short ton, as given in the referenced Bureau of Mines internal memorandum, by 5.0 barrels per short ton, as given in the Bureau of Mines Form 6‐1300‐M and successor EIA forms. • 2004 forward: Calculated by EIA as the annual quantity‐weighted average of the conversion factors for Petroleum Coke, Catalyst (6.287 million Btu per barrel) and Petroleum Coke, Marketable (5.719 million Btu per barrel).
Petroleum Consumption, Commercial Sector. Calculated annually by EIA as the average of the thermal conversion factors for all petroleum products consumed by the commercial sector weighted by the estimated quantities consumed by the commercial sector. The quantities of petroleum products consumed by the commercial sector are estimated in the State Energy Data System—see documentation at http://www.eia.gov/state/seds/sep_use/notes/use_petrol.pdf.
Petroleum Consumption, Electric Power Sector. Calculated annually by EIA as the average of the thermal conversion factors for distillate fuel oil, petroleum coke, and residual fuel oil consumed by the electric power sector weighted by

226 U. S. Energy Information Administration / Monthly Energy Review March 2019
the quantities consumed by the electric power sector. Data are from Form EIA‐923, “Power Plant Operations Report,” and predecessor forms.
Petroleum Consumption, Industrial Sector. Calculated annually by EIA as the average of the thermal conversion factors for all petroleum products consumed by the industrial sector weighted by the estimated quantities consumed by the industrial sector. The quantities of petroleum products consumed by the industrial sector are estimated in the State Energy Data System—see documentation at http://www.eia.gov/state/seds/sep_use/notes/use_petrol.pdf.
Petroleum Consumption, Residential Sector. Calculated annually by EIA as the average of the thermal conversion factors for all petroleum products consumed by the residential sector weighted by the estimated quantities consumed by the residential sector. The quantities of petroleum products consumed by the residential sector are estimated in the State Energy Data System—see documentation at http://www.eia.gov/state/seds/sep_use/notes/use_petrol.pdf.
Petroleum Consumption, Total. Calculated annually by EIA as the average of the thermal conversion factors for all petroleum products consumed weighted by the quantities consumed.
Petroleum Consumption, Transportation Sector. Calculated annually by EIA as the average of the thermal conversion factors for all petroleum products consumed by the transportation sector weighted by the estimated quantities consumed by the transportation sector. The quantities of petroleum products consumed by the transportation sector are estimated in the State Energy Data System—see documentation at http://www.eia.gov/state/seds/sep_use/notes/use_petrol.pdf.
Petroleum Products Exports. Calculated annually by EIA as the average of the thermal conversion factors for each petroleum product exported weighted by the quantities exported.
Petroleum Products Imports. Calculated annually by EIA as the average of the thermal conversion factors for each petroleum product imported weighted by the quantities imported.
Plant Condensate. Estimated to be 5.418 million Btu per barrel by EIA from data provided by McClanahan Consultants, Inc., Houston, Texas.
Propane/Propylene. EIA adopted the Bureau of Mines thermal conversion factor of 3.836 million Btu per barrel as published in the California Oil World and Petroleum Industry, First Issue, April 1942.
Renewable Fuels Except Fuel Ethanol. For “Biomass‐Based Diesel Fuel” and “Other Renewable Fuels,” EIA assumed the thermal conversion factor to be 5.359 million Btu per barrel or equal to the thermal conversion factor for Biodiesel. For “Other Renewable Diesel Fuel,” EIA adopted the thermal conversion factor of 5.494 million Btu per barrel (130,817 Btu per gallon) for renewable diesel II (UOP‐HDO) from U.S. Department of Energy, Argonne National Laboratory, “The Greenhouse Gases, Regulated Emissions, and Energy Use in Transportation Model” (GREET), version GREET1_2013, October 2013.
Residual Fuel Oil. EIA adopted the thermal conversion factor of 6.287 million Btu per barrel as reported in the Bureau of Mines internal memorandum, “Bureau of Mines Standard Average Heating Values of Various Fuels, Adopted January 3, 1950.”
Road Oil. EIA adopted the Bureau of Mines thermal conversion factor of 6.636 million Btu per barrel, which was assumed to be equal to that of Asphalt and was first published by the Bureau of Mines in the Petroleum Statement, Annual, 1970.
Special Naphthas. EIA adopted the Bureau of Mines thermal conversion factor of 5.248 million Btu per barrel, which was assumed to be equal to that of the total gasoline (aviation and motor) factor and was first published in the Petroleum Statement, Annual, 1970.
Still Gas. • 1949–2015: EIA adopted the Bureau of Mines estimated thermal conversion factor of 6.000 million Btu per barrel, first published in the Petroleum Statement, Annual, 1970. • 2016 forward: Assumed by EIA to be 6.287 million Btu per barrel or equal to the thermal conversion factor for Residual Fuel Oil.
Total Petroleum Exports. Calculated annually by EIA as the average of the thermal conversion factors for crude oil and each petroleum product exported weighted by the quantities exported. See Crude Oil Exports and Petroleum Products Exports.
Total Petroleum Imports. Calculated annually by EIA as the average of the thermal conversion factors for each type of crude oil and petroleum product imported weighted by the quantities imported. See Crude Oil Imports and Petroleum Products Imports.

U. S. Energy Information Administration / Monthly Energy Review March 2019 227
Unfinished Oils. EIA assumed the thermal conversion factor to be 5.825 million Btu per barrel or equal to that for Distillate Fuel Oil and first published it in EIA’s Annual Report to Congress, Volume 3, 1977.
Unfractionated Stream. EIA assumed the thermal conversion factor to be 5.418 million Btu per barrel or equal to that for Plant Condensate and first published it in EIA’s Annual Report to Congress, Volume 2, 1981.
Waxes. EIA adopted the thermal conversion factor of 5.537 million Btu per barrel as estimated by the Bureau of Mines and first published in the Petroleum Statement, Annual, 1956.
Approximate Heat Content of Biofuels Biodiesel. EIA estimated the thermal conversion factor for biodiesel to be 5.359 million Btu per barrel, or 17,253 Btu per pound.
Biodiesel Feedstock. EIA used soybean oil input to the production of biodiesel (million Btu soybean oil per barrel biodiesel) as the factor to estimate total biomass inputs to the production of biodiesel. EIA assumed that 7.65 pounds of soybean oil are needed to produce one gallon of biodiesel, and 5.433 million Btu of soybean oil are needed to produce one barrel of biodiesel. EIA also assumed that soybean oil has a gross heat content of 16,909 Btu per pound, or 5.483 million Btu per barrel.
Ethanol (Undenatured). EIA adopted the thermal conversion factor of 3.539 million Btu per barrel published in “Oxygenate Flexibility for Future Fuels,” a paper presented by William J. Piel of the ARCO Chemical Company at the National Conference on Reformulated Gasolines and Clean Air Act Implementation, Washington, DC, October 1991.
Fuel Ethanol (Denatured). • 1981–2008: EIA used the 2009 factor. • 2009 forward: Calculated by EIA as the annual quantity‐weighted average of the thermal conversion factors for undenatured ethanol (3.539 million Btu per barrel), natural gasoline used as denaturant (4.620 million Btu per barrel), and conventional motor gasoline and motor gasoline blending components used as denaturant (5.253 million Btu per barrel). The quantity of ethanol consumed is from EIA’s Petroleum Supply Annual (PSA) and Petroleum Supply Monthly (PSM), Table 1, data for renewable fuels and oxygenate plant net production of fuel ethanol. The quantity of natural gasoline used as denaturant is from PSA/PSM, Table 1, data for renewable fuels and oxygenate plant net production of natural gasoline, multiplied by ‐1. The quantity of conventional motor gasoline and motor gasoline blending components used as denaturant is from PSA/PSM, Table 1, data for renewable fuels and oxygenate plant net production of conventional motor gasoline and motor gasoline blending components, multiplied by ‐1.
Fuel Ethanol Feedstock. EIA used corn input to the production of undenatured ethanol (million Btu corn per barrel undenatured ethanol) as the annual factor to estimate total biomass inputs to the production of undenatured ethanol. EIA used the following observed ethanol yields (in gallons undenatured ethanol per bushel of corn) from U.S. Department of Agriculture: 2.5 in 1980, 2.666 in 1998, 2.68 in 2002; and from University of Illinois at Chicago, Energy Resources Center, “2012 Corn Ethanol: Emerging Plant Energy and Environmental Technologies”: 2.78 in 2008, and 2.82 in 2012. EIA estimated the ethanol yields in other years. EIA also assumed that corn has a gross heat content of 0.392 million Btu per bushel.
Approximate Heat Content of Natural Gas Natural Gas Consumption, Electric Power Sector. Calculated annually by EIA by dividing the heat content of natural gas consumed by the electric power sector by the quantity consumed. Data are from Form EIA‐923, “Power Plant Operations Report,” and predecessor forms.
Natural Gas Consumption, End‐Use Sectors. Calculated annually by EIA by dividing the heat content of natural gas
consumed by the end‐use sectors (residential, commercial, industrial, and transportation) by the quantity consumed.
The heat content of natural gas consumed by the end‐use sectors is calculated as the total heat content of natural gas
consumed minus the heat content of natural gas consumed by the electric power sector. The quantity of natural gas
consumed by the end‐use sectors is calculated as the total quantity of natural gas consumed minus the quantity of
natural gas consumed by the electric power sector. Data are from Form EIA‐176, “Annual Report of Natural and
Supplemental Gas Supply and Disposition”; and Form EIA‐923, “Power Plant Operations Report,” and predecessor forms.
Natural Gas Consumption, Total. • 1949–1962: EIA adopted the thermal conversion factor of 1,035 Btu per cubic foot as estimated by the Bureau of Mines and first published in the Petroleum Statement, Annual, 1956. • 1963–1979: EIA adopted the thermal conversion factor calculated annually by the American Gas Association (AGA) and

228 U. S. Energy Information Administration / Monthly Energy Review March 2019
published in Gas Facts, an AGA annual publication. • 1980 forward: Calculated annually by EIA by dividing the total heat content of natural gas consumed by the total quantity consumed.
Natural Gas Exports. • 1949–1972: Assumed by EIA to be equal to the thermal conversion factor for dry natural gas consumed (see Natural Gas Consumption, Total). • 1973 forward: Calculated annually by EIA by dividing the heat content of natural gas exported by the quantity exported. For 1973–1995, data are from Form FPC‐14, “Annual Report for Importers and Exporters of Natural Gas.” Beginning in 1996, data are from U.S. Department of Energy, Office of Fossil Energy, Natural Gas Imports and Exports.
Natural Gas Imports. • 1949–1972: Assumed by EIA to be equal to the thermal conversion factor for dry natural gas consumed (see Natural Gas Consumption, Total). • 1973 forward: Calculated annually by EIA by dividing the heat content of natural gas imported by the quantity imported. For 1973–1995, data are from Form FPC‐14, “Annual Report for Importers and Exporters of Natural Gas.” Beginning in 1996, data are from U.S. Department of Energy, Office of Fossil Energy, Natural Gas Imports and Exports.
Natural Gas Production, Dry. Assumed by EIA to be equal to the thermal conversion factor for dry natural gas consumed. See Natural Gas Consumption, Total.
Natural Gas Production, Marketed. Calculated annually by EIA by dividing the heat content of dry natural gas produced (see Natural Gas Production, Dry) and natural gas liquids produced (see Natural Gas Liquids Production) by the total quantity of marketed natural gas produced.
Approximate Heat Content of Coal and Coal Coke Coal Coke Imports and Exports. EIA adopted the Bureau of Mines estimate of 24.800 million Btu per short ton.
Coal Consumption, Electric Power Sector. Calculated annually by EIA by dividing the heat content of coal consumed by the electric power sector by the quantity consumed. Data are from Form EIA‐923, “Power Plant Operations Report,” and predecessor forms.
Coal Consumption, Industrial Sector, Coke Plants. • 1949–2011: Calculated annually by EIA based on the reported volatility (low, medium, or high) of coal received by coke plants. (For 2011, EIA used the following volatility factors, in million Btu per short ton: low volatile—26.680; medium volatile—27.506; and high volatile—25.652.) Data are from Form EIA‐5, “Quarterly Coal Consumption and Quality Report—Coke Plants,” and predecessor forms. • 2012 forward:
Calculated annually by EIA by dividing the heat content of coal received by coke plants by the quantity received.
Through June 2014, data are from Form EIA‐5, “Quarterly Coal Consumption and Quality Report—Coke Plants”;
beginning in July 2014, data are from Form EIA‐3, “Quarterly Survey of Industrial, Commercial, and Institutional Coal
Users” (formerly called “Quarterly Survey of Non‐Electric Sector Coal Data”).
Coal Consumption, Industrial Sector, Other. • 1949–2007: Calculated annually by EIA by dividing the heat content of coal received by manufacturing plants by the quantity received. Data are from Form EIA‐3, “Quarterly Coal Consumption and Quality Report—Manufacturing Plants,” and predecessor forms. • 2008 forward: Calculated annually by EIA by dividing the heat content of coal received by manufacturing, gasification, and liquefaction plants by the quantity received. Data are from Form EIA‐3, “Quarterly Survey of Industrial, Commercial, and Institutional Coal Users” (formerly called “Quarterly Survey of Non‐Electric Sector Coal Data”).
Coal Consumption, Residential and Commercial Sectors. • 1949–1999: Calculated annually by EIA by dividing the heat content of coal received by the residential and commercial sectors by the quantity received. Data are from Form EIA‐6, “Coal Distribution Report,” and predecessor forms. • 2000–2007: Calculated annually by EIA by dividing the heat content of coal consumed by commercial combined‐heat‐and‐power (CHP) plants by the quantity consumed. Data are from Form EIA‐923, “Power Plant Operations Report,” and predecessor forms. • 2008 forward: Calculated annually by EIA by dividing the heat content of coal received by commercial and institutional users by the quantity received. Data are from Form EIA‐3, “Quarterly Survey of Industrial, Commercial, and Institutional Coal Users” (formerly called “Quarterly Survey of Non‐Electric Sector Coal Data”).
Coal Consumption, Total. Calculated annually by EIA by dividing the total heat content of coal consumed by all sectors by the total quantity consumed.
Coal Exports. • 1949–2011: Calculated annually by EIA by dividing the heat content of steam coal and metallurgical coal exported by the quantity exported. Data are from U.S. Department of Commerce, U.S. Census Bureau, “Monthly Report EM 545,” and predecessor forms. • 2012 forward: Calculated annually by EIA by dividing the heat content of

U. S. Energy Information Administration / Monthly Energy Review March 2019 229
steam coal and metallurgical coal exported by the quantity exported. The average heat content of steam coal is derived from receipts data from Form EIA‐3, “Quarterly Survey of Industrial, Commercial, and Institutional Coal Users” (formerly called “Quarterly Survey of Non‐Electric Sector Coal Data”), and Form EIA‐923, “Power Plant Operations Report.” Through June 2014, the average heat content of metallurgical coal is derived from receipts data from Form EIA‐5, “Quarterly Coal Consumption and Quality Report—Coke Plants”; beginning in July 2014, the average heat content of metallurgical coal is derived from receipts data from Form EIA‐3, “Quarterly Survey of Industrial, Commercial, and Institutional Coal Users” (formerly called “Quarterly Survey of Non‐Electric Sector Coal Data”). Data for export quantities are from U.S. Department of Commerce, U.S. Census Bureau, “Monthly Report EM 545.”
Coal Imports. • 1949–1963: Calculated annually by EIA by dividing the heat content of coal imported by the quantity imported. Data are from U.S. Department of Commerce, U.S. Census Bureau, “Monthly Report IM 145,” and predecessor forms. • 1964–2011: Assumed by EIA to be 25.000 million Btu per short ton. • 2012 forward: Calculated annually by EIA by dividing the heat content of coal imported (received) by the quantity imported (received). Data are from Form EIA‐3, “Quarterly Survey of Industrial, Commercial, and Institutional Coal Users” (formerly called “Quarterly Survey of Non‐Electric Sector Coal Data”); Form EIA‐5, “Quarterly Coal Consumption and Quality Report—Coke Plants” (data through June 2014); and Form EIA‐923, “Power Plant Operations Report.”
Coal Production. • 1949–2011: Calculated annually by EIA by dividing the heat content of domestic coal (excluding waste coal) received by the quantity received. Data are from Form EIA‐3, “Quarterly Coal Consumption and Quality Report—Manufacturing and Transformation/Processing Coal Plants and Commercial and Institutional Users”; Form EIA‐5, “Quarterly Coal Consumption and Quality Report—Coke Plants”; Form EIA‐923, “Power Plant Operations Report”; and predecessor forms. • 2012 forward: Calculated annually by EIA by dividing the heat content of domestic coal (excluding waste coal) received and exported by the quantity received and exported. Data are from Form EIA‐3, “Quarterly Survey of Industrial, Commercial, and Institutional Coal Users” (formerly called “Quarterly Survey of Non‐Electric Sector Coal Data”); Form EIA‐5, “Quarterly Coal Consumption and Quality Report—Coke Plants” (data through June 2014); Form EIA‐923, “Power Plant Operations Report”; U.S. Department of Commerce, U.S. Census Bureau, “Monthly Report EM 545”; and predecessor forms.
Waste Coal Supplied. • 1989–2000: Calculated annually by EIA by dividing the heat content of waste coal consumed by the quantity consumed. Data are from Form EIA‐860B, “Annual Electric Generator Report—Nonutility,” and predecessor form. • 2001 forward: Calculated by EIA by dividing the heat content of waste coal received (or consumed) by the quantity received (or consumed). Receipts data are from Form EIA‐3, “Quarterly Survey of Industrial, Commercial, and Institutional Coal Users” (formerly called “Quarterly Survey of Non‐Electric Sector Coal Data”), and predecessor forms. Consumption data are from Form EIA‐923, “Power Plant Operations Report,” and predecessor forms.
Approximate Heat Rates for Electricity Electricity Net Generation, Coal. • 2001 forward: Calculated annually by EIA by using fuel consumption and net generation data reported on Form EIA‐923, “Power Plant Operations Report,” and predecessor forms. The computation includes data for all electric utilities and electricity‐only independent power producers using anthracite, bituminous coal, subbituminous coal, lignite, and beginning in 2002, waste coal and coal synfuel.
Electricity Net Generation, Natural Gas. • 2001 forward: Calculated annually by EIA by using fuel consumption and net generation data reported on Form EIA‐923, “Power Plant Operations Report,” and predecessor forms. The computation includes data for all electric utilities and electricity‐only independent power producers using natural gas and supplemental gaseous fuels.
Electricity Net Generation, Noncombustible Renewable Energy. There is no generally accepted practice for measuring the thermal conversion rates for power plants that generate electricity from hydro, geothermal, solar thermal, photovoltaic, and wind energy sources. Therefore, EIA calculates a rate factor that is equal to the annual average heat rate factor for fossil‐fueled power plants in the United States (see “Electricity Net Generation, Total Fossil Fuels”). By using that factor it is possible to evaluate fossil fuel requirements for replacing those sources during periods of interruption, such as droughts. See Appendix E for more information.
Electricity Net Generation, Nuclear. • 1957–1984: Calculated annually by dividing the total heat content consumed in nuclear generating units by the total (net) electricity generated by nuclear generating units. The heat content and electricity generation were reported on Form FERC‐1, “Annual Report of Major Electric Utilities, Licensees, and Others”; Form EIA‐412, “Annual Report of Public Electric Utilities”; and predecessor forms. For 1982, the factors were published in EIA, Historical Plant Cost and Annual Production Expenses for Selected Electric Plants 1982, page 215. For 1983 and 1984,

230 U. S. Energy Information Administration / Monthly Energy Review March 2019
the factors were published in EIA, Electric Plant Cost and Power Production Expenses 1991, Table 13. • 1985 forward: Calculated annually by EIA by using the heat rate data reported on Form EIA‐860, “Annual Electric Generator Report,” and predecessor forms.
Electricity Net Generation, Petroleum. • 2001 forward: Calculated annually by EIA by using fuel consumption and net generation data reported on Form EIA‐923, “Power Plant Operations Report,” and predecessor forms. The computation includes data for all electric utilities and electricity‐only independent power producers using distillate fuel oil, residual fuel oil, jet fuel, kerosene, petroleum coke, and waste oil.
Electricity Net Generation, Total Fossil Fuels. • 1949–1955: The weighted annual average heat rate for fossil‐fueled steam‐electric power plants in the United States, as published by EIA in Thermal‐Electric Plant Construction Cost and Annual Production Expenses—1981 and Steam‐Electric Plant Construction Cost and Annual Production Expenses—1978. • 1956–1988: The weighted annual average heat rate for fossil‐fueled steam‐electric power plants in the United States, as published in EIA, Electric Plant Cost and Power Production Expenses 1991, Table 9. • 1989–2000: Calculated annually by EIA by using heat rate data reported on Form EIA‐860, “Annual Electric Generator Report,” and predecessor forms; and net generation data reported on Form EIA‐759, “Monthly Power Plant Report.” The computation includes data for all electric utility steam‐electric plants using fossil fuels. • 2001 forward: Calculated annually by EIA by using fuel consumption and net generation data reported on Form EIA‐923, “Power Plant Operations Report,” and predecessor forms. The computation includes data for all electric utilities and electricity‐only independent power producers using coal, petroleum, natural gas, and other gases (blast furnace gas, propane gas, and other manufactured and waste gases derived from fossil fuels).

U. S. Energy Information Administration / Monthly Energy Review March 2019 231
Appendix B: Metric Conversion Factors, Metric Prefixes, and Other Physical Conversion Factors
Data presented in the Monthly Energy Review and in other U.S. Energy Information Administration publications are
expressed predominately in units that historically have been used in the United States, such as British thermal units,
barrels, cubic feet, and short tons. The metric conversion factors presented in Table B1 can be used to calculate the
metric‐unit equivalents of values expressed in U.S. Customary units. For example, 500 short tons are the equivalent of
453.6 metric tons (500 short tons x 0.9071847 metric tons/short ton = 453.6 metric tons).
In the metric system of weights and measures, the names of multiples and subdivisions of any unit may be derived by
combining the name of the unit with prefixes, such as deka, hecto, and kilo, meaning, respectively, 10, 100, 1,000, and
deci, centi, and milli, meaning, respectively, one‐tenth, one‐hundredth, and one‐thousandth. Common metric prefixes
can be found in Table B2.
The conversion factors presented in Table B3 can be used to calculate equivalents in various physical units commonly
used in energy analyses. For example, 10 barrels are the equivalent of 420 U.S. gallons (10 barrels x 42 gallons/barrel =
420 gallons).

232 U. S. Energy Information Administration / Monthly Energy Review March 2019
Table B1. Metric Conversion Factors Type of Unit U.S. Unit Equivalent in Metric Units Mass 1 short ton (2,000 lb) = 0.907 184 7 metric tons (t)
1 long ton = 1.016 047 metric tons (t)
1 pound (lb) = 0.453 592 37a kilograms (kg)
1 pound uranium oxide (lb U3O8) = 0.384 647b kilograms uranium (kgU)
1 ounce, avoirdupois (avdp oz) = 28.349 52 grams (g)
Volume 1 barrel of oil (bbl) = 0.158 987 3 cubic meters (m3)
1 cubic yard (yd3) = 0.764 555 cubic meters (m3)
1 cubic foot (ft3) = 0.028 316 85 cubic meters (m3)
1 U.S. gallon (gal) = 3.785 412 liters (L)
1 ounce, fluid (fl oz) = 29.573 53 milliliters (mL)
1 cubic inch (in3) = 16.387 06 milliliters (mL)
Length 1 mile (mi) = 1.609 344a kilometers (km)
1 yard (yd) = 0.914 4a meters (m)
1 foot (ft) = 0.304 8a meters (m)
1 inch (in) = 2.54a centimeters (cm)
Area 1 acre = 0.404 69 hectares (ha)
1 square mile (mi2) = 2.589 988 square kilometers (km2)
1 square yard (yd2) = 0.836 127 4 square meters (m2)
1 square foot (ft2) = 0.092 903 04a square meters (m2)
1 square inch (in2) = 6.451 6a square centimeters (cm2)
Energy 1 British thermal unit (Btu)c = 1,055.055 852 62a joules (J)
1 calorie (cal) = 4.186 8a joules (J)
1 kilowatthour (kWh) = 3.6a megajoules (MJ)
Temperatured 32 degrees Fahrenheit (ºF) = 0a degrees Celsius (ºC)
212 degrees Fahrenheit (ºF) = 100a degrees Celsius (ºC)
[a] Exact conversion. [b] Calculated by the U.S. Energy Information Administration. [c] The Btu used in this table is the International Table Btu adopted by the Fifth International Conference on Properties of Steam, London, 1956. [d] To convert degrees Fahrenheit (ºF) to degrees Celsius (ºC) exactly, subtract 32, then multiply by 5/9. Notes: • Spaces have been inserted after every third digit to the right of the decimal for ease of reading. • Most metric units belong to the International System of Units (SI), and the liter, hectare, and metric ton are accepted for use with the SI units. For more information about the SI units, see http://physics.nist/gov/cuu/Units/index.html. Web Page: http://www.eia.gov/totalenergy/data/monthly/#appendices. Sources: • General Services Administration, Federal Standard 376B, Preferred Metric Units for General Use by the Federal Government (Washington, DC, January 1993), pp. 9–11, 13, and 16. • U.S. Department of Commerce, National Institute of Standards and Technology, Special Publications 330, 811, and 814. • American National Standards Institute/Institute of Electrical and Electronic Engineers, ANSI/IEEE Std268-1992, pp. 28 and 29.

U. S. Energy Information Administration / Monthly Energy Review March 2019 233
Table B2. Metric Prefixes
Unit Multiple
Prefix
Symbol
Unit Subdivision
Prefix
Symbol
101 deka da 10-1 deci d
102 hecto h 10-2 centi c
103 kilo k 10-3 milli m
106 mega M 10-6 micro 109 giga G 10-9 nano n
1012 tera T 10-12 pico p
1015 peta P 10-15 femto f
1018 exa E 10-18 atto a
1021 zetta Z 10-21 zepto z
1024 yotta Y 10-24 yocto y
Web Page: http://www.eia.gov/totalenergy/data/monthly/#appendices.
Source: U.S. Department of Commerce, National Institute of Standards and Technology, The International System of Units (SI), NIST Special Publication 330, 1991 Edition (Washington, DC, August 1991), p.10.
Table B3. Other Physical Conversion Factors Energy Source Original Unit Equivalent in Final Units Petroleum
1 barrel (bbl)
=
42a
U.S. gallons (gal)
Coal 1 short ton = 2,000a pounds (lb) 1 long ton = 2,240a pounds (lb) 1 metric ton (t) = 1,000a kilograms (kg) Wood 1 cord (cd) = 1.25b shorts tons 1 cord (cd) = 128a cubic feet (ft3)
[a] Exact conversion. [b] Calculated by the U.S. Energy Information Administration.
Web Page: http://www.eia.gov/totalenergy/data/monthly/#appendices. Source: U.S. Department of Commerce, National Institute of Standards and Technology, Specifications, Tolerances, and Other Technical Requirements for Weighing and Measuring Devices, NIST Handbook 44, 1994 Edition (Washington, DC, October 1993), pp. B-10, C-17, and C-21.

THIS PAGE INTENTIONALLY LEFT BLANK

U. S. Energy Information Administration / Monthly Energy Review March 2019 235
Appendix C: Population, U.S. Gross Domestic Product, and U.S. Gross
Output
Table C1. Population, U.S. Gross Domestic Product, and U.S. Gross Output
Population U.S. Gross Domestic Product U.S. Gross Outputa
United Statesb WorldUnited States
as Share of World BillionNominalDollarsd
BillionChained (2012)
Dollarse
Implicit PriceDeflatorc
(2012 = 1.00000)
BillionNominalDollarsdMillion People Percent
1950 .............. 152.3 2,557.6 6.0 299.8 2,289.5 0.13095 579.31955 .............. 165.9 2,782.1 6.0 425.5 2,871.2 .14819 804.61960 .............. 180.7 3,043.0 5.9 542.4 3,260.0 .16638 1,008.71965 .............. 194.3 3,350.8 5.8 742.3 4,170.8 .17798 1,359.81970 .............. 205.1 3,713.4 5.5 1,073.3 4,951.3 .21677 1,908.61975 .............. 216.0 4,089.0 5.3 1,684.9 5,644.8 .29849 3,063.71980 .............. 227.2 4,445.4 5.1 2,857.3 6,759.2 .42273 5,476.01981 .............. 229.5 4,526.7 5.1 3,207.0 6,930.7 .46273 6,048.21982 .............. 231.7 4,607.1 5.0 3,343.8 6,805.8 .49132 6,187.51983 .............. 233.8 4,688.4 5.0 3,634.0 7,117.7 .51056 6,645.81984 .............. 235.8 4,767.4 4.9 4,037.6 7,632.8 .52898 7,328.61985 .............. 237.9 4,849.6 4.9 4,339.0 7,951.1 .54571 7,796.91986 .............. 240.1 4,933.9 4.9 4,579.6 8,226.4 .55670 8,053.71987 .............. 242.3 5,020.6 4.8 4,855.2 8,511.0 .57046 8,731.61988 .............. 244.5 5,108.1 4.8 5,236.4 8,866.5 .59059 9,458.51989 .............. 246.8 5,198.4 4.8 5,641.6 9,192.1 .61374 10,092.11990 .............. 249.6 5,286.8 4.7 5,963.1 9,365.5 .63671 10,649.21991 .............. 253.0 5,370.1 4.7 6,158.1 9,355.4 .65825 10,830.41992 .............. 256.5 5,454.6 4.7 6,520.3 9,684.9 .67325 11,415.41993 .............. 259.9 5,536.5 4.7 6,858.6 9,951.5 .68920 12,033.01994 .............. 263.1 5,616.7 4.7 7,287.2 10,352.4 .70392 12,828.31995 .............. 266.3 5,695.3 4.7 7,639.7 10,630.3 .71868 13,649.21996 .............. 269.4 5,776.1 4.7 8,073.1 11,031.4 .73183 14,465.11997 .............. 272.6 5,854.9 4.7 8,577.6 11,521.9 .74445 15,393.31998 .............. 275.9 5,932.5 4.7 9,062.8 12,038.3 .75283 16,216.81999 .............. 279.0 6,009.6 4.6 9,630.7 12,610.5 .76370 17,272.32000 .............. 282.2 6,086.1 4.6 10,252.3 13,131.0 .78078 18,623.92001 .............. 285.0 6,162.8 4.6 10,581.8 13,262.1 .79790 18,888.32002 .............. 287.6 6,239.6 4.6 10,936.4 13,493.1 .81052 19,178.32003 .............. 290.1 6,316.8 4.6 11,458.2 13,879.1 .82557 20,141.22004 .............. 292.8 6,394.0 4.6 12,213.7 14,406.4 .84780 21,690.22005 .............. 295.5 6,471.4 4.6 13,036.6 14,912.5 .87421 23,512.92006 .............. 298.4 6,550.5 4.6 13,814.6 15,338.3 .90066 24,931.42007 .............. 301.2 6,631.0 4.5 14,451.9 15,626.0 .92486 26,238.52008 .............. 304.1 6,712.5 4.5 14,712.8 15,604.7 .94285 26,989.22009 .............. 306.8 6,793.5 4.5 14,448.9 15,208.8 .95004 24,919.52010 .............. 309.3 6,872.7 4.5 14,992.1 15,598.8 .96111 26,422.42011 .............. 311.6 6,951.2 4.5 15,542.6 15,840.7 .98118 27,999.52012 .............. 313.9 7,030.1 4.5 16,197.0 16,197.0 1.00000 29,186.82013 .............. 316.1 7,109.6 4.4 16,784.9 16,495.4 1.01755 30,291.32014 .............. 318.4 7,188.4 4.4 17,521.7 16,899.8 1.03680 31,705.32015 .............. 320.7 7,267.0 4.4 18,219.3 17,386.7 1.04789 32,086.12016 .............. 323.1 7,345.8 4.4 18,707.2 17,659.2 1.05935 32,776.42017 .............. 325.1 7,424.2 4.4 19,485.4 18,050.7 1.07948 34,445.62018 .............. 327.2 7,503.8 4.4 NA NA NA NA
a Gross output is the value of gross domestic product (GDP) plus the value ofintermediate inputs used to produce GDP.
b Resident population of the 50 states and the District of Columbia estimated forJuly 1 of each year.
c The gross domestic product implicit price deflator is used to convert nominaldollars to chained (2009) dollars.
d See "Nominal Dollars" in Glossary.e See "Chained Dollars" in Glossary.NA=Not available. Notes: • Data are estimates. • U.S. geographic coverage is the 50 states and
the District of Columbia.Web Page: See http://www.eia.gov/totalenergy/data/monthly/#appendices
(Excel and CSV files) for all available annual data beginning in 1949.Sources: • United States Population: 1949–1989—U.S. Department of
Commerce (DOC), U.S. Census Bureau, Current Population Reports Series P-25
(June 2000). 1990–1999—DOC, U.S. Census Bureau, "Time Series of IntercensalState Population Estimates" (April 2002). 2000–2009—DOC, U.S. Census Bureau,"Intercensal Estimates of the Resident Population for the United States, Regions,States, and Puerto Rico" (September 2011). 2010 forward—DOC, U.S. CensusBureau, "Annual Estimates of the Resident Population for the United States,Regions, States, and Puerto Rico" (December 2018). • World Population: 1950forward—DOC, U.S. Census Bureau, International Database (September 2018).• United States as Share of World Population: Calculated as U.S. populationdivided by world population. • U.S. Gross Domestic Product: 1949forward—DOC, Bureau of Economic Analysis (BEA), National Income and ProductAccounts (December 2018), Tables 1.1.5, 1.1.6, and 1.1.9. • U.S. Gross Output: 1949–1996—DOC, BEA, GDP by industry (Historical) data (November 2018); thesedata have been adjusted by EIA based on BEA’s 2012 comprehensive revision.1997 forward—DOC, BEA, GDP by Industry data (November 2018).

THIS PAGE INTENTIONALLY LEFT BLANK

U. S. Energy Information Administration / Monthly Energy Review March 2019 237
Appendix D: Estimated Primary Energy Consumption in the United States, Selected Years, 1635-1945
Table D1. Estimated Primary Energy Consumption in the United States, Selected Years, 1635–1945 (Quadrillion Btu)
Fossil Fuels Renewable Energy
ElectricityNet
Importsb TotalCoalNatural
Gas Petroleum Total
ConventionalHydroelectric
Power
Biomass
TotalWood a
1635 .............. NA – – – – NA – – (s) (s) – – (s)1645 .............. NA – – – – NA – – 0.001 0.001 – – 0.0011655 .............. NA – – – – NA – – .002 .002 – – .0021665 .............. NA – – – – NA – – .005 .005 – – .0051675 .............. NA – – – – NA – – .007 .007 – – .0071685 .............. NA – – – – NA – – .009 .009 – – .0091695 .............. NA – – – – NA – – .014 .014 – – .0141705 .............. NA – – – – NA – – .022 .022 – – .0221715 .............. NA – – – – NA – – .037 .037 – – .0371725 .............. NA – – – – NA – – .056 .056 – – .0561735 .............. NA – – – – NA – – .080 .080 – – .0801745 .............. NA – – – – NA – – .112 .112 – – .1121755 .............. NA – – – – NA – – .155 .155 – – .1551765 .............. NA – – – – NA – – .200 .200 – – .2001775 .............. NA – – – – NA – – .249 .249 – – .2491785 .............. NA – – – – NA – – .310 .310 – – .3101795 .............. NA – – – – NA – – .402 .402 – – .4021805 .............. NA – – – – NA – – .537 .537 – – .5371815 .............. NA – – – – NA – – .714 .714 – – .7141825 .............. NA – – – – NA – – .960 .960 – – .9601835 .............. NA – – – – NA – – 1.305 1.305 – – 1.3051845 .............. NA – – – – NA – – 1.757 1.757 – – 1.7571850 .............. 0.219 – – – – 0.219 – – 2.138 2.138 – – 2.3571855 .............. .421 – – – – .421 – – 2.389 2.389 – – 2.8101860 .............. .518 – – 0.003 .521 – – 2.641 2.641 – – 3.1621865 .............. .632 – – .010 .642 – – 2.767 2.767 – – 3.4091870 .............. 1.048 – – .011 1.059 – – 2.893 2.893 – – 3.9521875 .............. 1.440 – – .011 1.451 – – 2.872 2.872 – – 4.3231880 .............. 2.054 – – .096 2.150 – – 2.851 2.851 – – 5.0011885 .............. 2.840 0.082 .040 2.962 – – 2.683 2.683 – – 5.6451890 .............. 4.062 .257 .156 4.475 0.022 2.515 2.537 – – 7.0121895 .............. 4.950 .147 .168 5.265 .090 2.306 2.396 – – 7.6611900 .............. 6.841 .252 .229 7.322 .250 2.015 2.265 – – 9.5871905 .............. 10.001 .372 .610 10.983 .386 1.843 2.229 – – 13.2121910 .............. 12.714 .540 1.007 14.261 .539 1.765 2.304 – – 16.5651915 .............. 13.294 .673 1.418 15.385 .659 1.688 2.347 0.002 17.7341920 .............. 15.504 .813 2.676 18.993 .738 1.610 2.348 .003 21.3441925 .............. 14.706 1.191 4.280 20.177 .668 1.533 2.201 .004 22.3821930 .............. 13.639 1.932 5.897 21.468 .752 1.455 2.207 .005 23.6801935 .............. 10.634 1.919 5.675 18.228 .806 1.397 2.203 .005 20.4361940 .............. 12.535 2.665 7.760 22.960 .880 1.358 2.238 .007 25.2051945 .............. 15.972 3.871 10.110 29.953 1.442 a1.261 2.703 .009 32.665
a There is a discontinuity in the "Wood" time series between 1945 (in this table)and 1949 (in Table 10.1). Through 1945, data are for fuelwood only; beginning in1949, data are for wood and wood-derived fuels.
b Electricity transmitted across U.S. borders. Net imports equal imports minusexports.
NA=Not available. – – =Not applicable. (s)=Less than 0.5 trillion Btu. Notes: • For years not shown, data are not available. • See Tables 1.3 and
10.1 for continuation of these data series beginning in 1949. • See Note,"Geographic Coverage of Statistics for 1635–1945," at end of section.
Sources: • Fossil Fuels: Energy in the American Economy, 1850–1975, TableVII. • Conventional Hydroelectric Power: Energy in the American Economy,1850–1975, Table II. • Wood: 1635–1845—U.S. Department of Agriculture,
Circular No. 641, Fuel Wood Used in the United States 1630–1930, February 1942.This source estimates fuelwood consumption in cords per decade, which wereconverted to Btu using the conversion factor of 20 million Btu per cord. The annualaverage value for each decade was assigned to the fifth year of the decade on theassumption that annual use was likely to increase during any given decade and theaverage annual value was more likely to reflect mid-decade yearly consumptionthan use at either the beginning or end of the decade. Values thus begin in 1635and are plotted at 10-year intervals. 1850–1945—Energy in the AmericanEconomy, 1850–1975, Table VII. • Electricity Net Imports: Energy in theAmerican Economy, 1850–1975, Tables I and VI. Electricity net imports areassumed to equal hydroelectric consumption minus hydroelectric production (dataare converted to Btu by multiplying by 3,412 Btu per kilowatthour).

238 U. S. Energy Information Administration / Monthly Energy Review March 2019
Note. Geographic Coverage of Statistics for 1635–1945. Table D1 presents estimates of U.S. energy consumption by energy source for a period that begins a century and a half
before the original 13 colonies formed a political union and continues through the decades during which the United
States was still expanding territorially. The question thus arises, what exactly is meant by “U.S. consumption” of an
energy source for those years when the United States did not formally exist or consisted of less territory than is now
encompassed by the 50 states and the District of Columbia?
The documents used to assemble the estimates, and (as far as possible) the sources of those documents, were reviewed
carefully for clues to geographic coverage. For most energy sources, the extent of coverage expanded more rapidly than
the nation, defined as all the official states and the District of Columbia. Estimates or measurements of consumption of
each energy source generally appear to follow settlement patterns. That is, they were made for areas of the continent
that were settled enough to have economically significant consumption even though those areas were not to become
states for years. The wood data series, for example, begins in 1635 and includes 12 of the original colonies (excepting
Georgia), as well as Maine, Vermont, and the area that would become the District of Columbia. By the time the series
reaches 1810, the rest of the continental states are all included, although the last of the 48 states to achieve statehood
did not do so until 1912. Likewise, the coal data series begins in 1850 but includes consumption in areas, such as Utah
and Washington (state), which were significant coal producing regions but had not yet attained statehood. (Note: No
data were available on state‐level historical coal consumption. The coal data shown in Table D1 through 1945 describe
apparent consumption, i.e., production plus imports minus exports. The geographic coverage for coal was therefore
based on a tally of coal‐producing states listed in various historical issues of Minerals Yearbook. It is likely that coal was
consumed in states where it was not mined in significant quantities.)
By energy source, the extent of coverage can be summarized as follows: • Coal—35 coal‐producing states by 1885.
• Natural Gas—All 48 contiguous states, the District of Columbia, and Alaska by 1885. • Petroleum—All 48 contiguous
states, the District of Columbia, and Alaska by 1885. • Conventional Hydroelectric Power—Coverage for 1890 and 1895
is uncertain, but probably the 48 contiguous states and the District of Columbia. Coverage for 1900–1945 is the 48
contiguous states, and the District of Columbia. • Wood—All 48 contiguous states and the District of Columbia by 1810.

U. S. Energy Information Administration / Monthly Energy Review March 2019 239
Appendix E: Alternative Approaches for Deriving Energy Contents of Noncombustible Renewables
EIA compiles data on most energy sources in physical units, such as barrels and cubic feet, in order to calculate total
primary energy consumption. To sum data for different energy sources, EIA converts the data to the common unit of
British thermal units (Btu), a measure that is based on the thermal conversion of energy resources to heat and power.
Noncombustible renewables are resources from which energy is extracted without burning or combusting fuel. They
include hydroelectric, geothermal, solar, and wind energy. When noncombustible renewables are used to generate
electricity, there is no fuel combustion and, therefore, no set Btu conversion factors for the energy sources.1 However,
there are several possible approaches for converting that electricity to Btu. Three of these approaches are described
below.
Fossil Fuel Equivalency Approach In Sections 1, 2, and 10 of the Monthly Energy Review, EIA calculates total primary energy consumption for
noncombustible renewable electricity in Btu by applying a fossil fuel equivalency factor. Under that approach, the
primary energy consumption of noncombustible renewable electricity can be viewed as the sum of captured energy
“transformed into electricity” and an "adjustment for fossil fuel equivalency."
The adjustment for fossil fuel equivalency is equal to the difference between total primary consumption of
noncombustible renewables for electricity generation in Btu (calculated using the fossil fuels heat rate in Table A6) and
the captured energy of that electricity (calculated using the constant conversion factor of 3,412 Btu per kWh). The fossil
fuels heat rate is equal to the thermal efficiency across fossil fuel‐fired generating stations based on net generation. The
fossil fuel equivalency adjustment represents the energy that would have been consumed if electricity had been
generated by fossil fuels. By using that factor, it is possible, for example, to evaluate fossil fuel requirements for
replacing electricity generation during periods of interruptions, such as droughts.
Captured Energy Approach Captured energy (Tables E1a and E1b) reflects the primary energy captured for economic use and does not include
losses. Thus, it is the net energy available for direct consumption after transformation of a noncombustible renewable
into electricity. In other words, captured energy is the energy measured as the "output" of a generating unit, such as
electricity from a wind turbine or solar plant. The captured energy approach is often used to show the economically
significant energy transformations in the United States. There is no market for the resource‐specific energy apart from
its immediate, site‐specific energy conversion, and there is no substantive opportunity cost to its continued
exploitation.2
Incident Energy Approach Incident energy is the mechanical, radiation, or thermal energy that is measurable as the "input" of the device. EIA
defines "incident energy" for noncombustible renewables as the gross energy that first strikes an energy conversion
device:
For hydroelectric, the energy contained in the water passing through the penstock (a closed conduit for carrying water to the turbines)
For geothermal, the energy contained in the hot fluid at the surface of the wellbore
For wind, the energy contained in the wind that passes through the rotor disc
For solar, the energy contained in the sunlight that strikes the panel or collector mirror

240 U. S. Energy Information Administration / Monthly Energy Review March 2019
The incident energy approach to converting noncombustible renewable electricity to Btu could, in theory, be used to
account for “losses” that are due to the inability to convert 100% of incident energy to a useful form of energy. EIA does
not publish total primary energy consumption estimates based on the incident energy approach because it would be
difficult to obtain accurate estimates of input energy without creating undue burden on survey respondents. Few
renewable electricity power plants track cumulative input energy due to its lack of economic significance or other
purpose. In addition, estimated energy efficiencies of renewable conversion technologies vary significantly across
technologies, site‐specific configurations, and environmental factors.3
1Direct use of noncombustible renewables in the form of heat (e.g., solar thermal heating) is estimated separately and is measured in Btu. 2There is an initial opportunity cost when a facility is first built: water behind a dam might flood land that could have been used for other purposes, or a solar panel might shade an area that could have used the sunlight. But that is a “fixed” opportunity cost that does not change during the operation of the plant. 3Based on EIA research conducted in 2016, engineering estimates of conversion efficiencies for noncombustible renewables range from less than 20% for solar
photovoltaics and geothermal to 90% for large‐scale hydroelectricity plants. Those estimates are notional indications of the energy output as a percent of energy
input at each technology based on typical equipment operating within the normal operating range for that technology.

U. S. Energy Information Administration / Monthly Energy Review March 2019 241
Table E1a. Noncombustible Renewable Primary Energy Consumption: Conventional Hydroelectric Power, Geothermal, and Wind (Trillion Btu)
Conventional Hydroelectric Powera Geothermalb Windc
Trans-formed
IntoElectricityd,e
Adjustmentfor Fossil
FuelEquivalencef
TotalPrimaryEnergyg
DirectConsump-
tionh
Trans-formed
IntoElectricityd,i
Adjustmentfor Fossil
FuelEquivalencef
TotalPrimaryEnergyj
Trans-formed
IntoElectricityd,i
Adjustmentfor Fossil
FuelEquivalencef
TotalPrimaryEnergyg
1950 .................. 344 1,071 1,415 NA NA NA NA NA NA NA1955 .................. 397 963 1,360 NA NA NA NA NA NA NA1960 .................. 510 1,098 1,608 NA (s) (s) (s) NA NA NA1965 .................. 672 1,387 2,059 NA 1 1 2 NA NA NA1970 .................. 856 1,777 2,634 NA 2 4 6 NA NA NA1975 .................. 1,034 2,120 3,155 NA 11 23 34 NA NA NA1980 .................. 953 1,948 2,900 NA 17 35 53 NA NA NA1981 .................. 900 1,858 2,758 NA 19 40 59 NA NA NA1982 .................. 1,066 2,200 3,266 NA 17 34 51 NA NA NA1983 .................. 1,144 2,383 3,527 NA 21 43 64 (s) (s) (s)1984 .................. 1,107 2,279 3,386 NA 26 54 81 (s) (s) (s)1985 .................. 970 2,000 2,970 NA 32 66 97 (s) (s) (s)1986 .................. 1,003 2,068 3,071 NA 35 73 108 (s) (s) (s)1987 .................. 863 1,772 2,635 NA 37 76 112 (s) (s) (s)1988 .................. 771 1,563 2,334 NA 35 71 106 (s) (s) (s)1989 .................. e 928 1,909 2,837 9 i 50 102 162 i 7 15 221990 .................. 999 2,047 3,046 10 53 108 171 10 19 291991 .................. 986 2,030 3,016 11 54 112 178 10 21 311992 .................. 864 1,754 2,617 12 55 112 179 10 20 301993 .................. 957 1,935 2,892 13 57 116 186 10 21 311994 .................. 888 1,796 2,683 13 53 107 173 12 24 361995 .................. 1,061 2,145 3,205 14 46 92 152 11 22 331996 .................. 1,185 2,405 3,590 15 49 99 163 11 22 331997 .................. 1,216 2,424 3,640 16 50 100 167 11 22 341998 .................. 1,103 2,194 3,297 18 50 100 168 10 21 311999 .................. 1,090 2,177 3,268 19 51 101 171 15 31 462000 .................. 940 1,871 2,811 21 48 96 164 19 38 572001 .................. 740 1,502 2,242 22 47 95 164 23 47 702002 .................. 902 1,787 2,689 24 49 98 171 35 70 1052003 .................. 941 1,851 2,793 27 49 97 173 38 75 1132004 .................. 916 1,773 2,688 30 51 98 178 48 93 1422005 .................. 922 1,781 2,703 34 50 97 181 61 117 1782006 .................. 987 1,882 2,869 37 50 95 181 91 173 2642007 .................. 845 1,602 2,446 41 50 95 186 118 223 3412008 .................. 869 1,642 2,511 46 51 96 192 189 357 5462009 .................. 933 1,736 2,669 54 51 95 200 252 469 7212010 .................. 888 1,651 2,539 60 52 97 208 323 600 9232011 .................. 1,090 2,013 3,103 64 52 97 212 410 758 1,1682012 .................. 943 1,686 2,629 64 53 95 212 480 860 1,3402013 .................. 916 1,646 2,562 64 54 97 214 573 1,029 1,6012014 .................. 885 1,582 2,467 64 54 97 214 620 1,108 1,7282015 .................. 850 1,471 2,321 64 54 94 212 651 1,127 1,7772016 .................. 914 1,559 2,472 64 54 92 210 774 1,321 2,0962017 .................. 1,025 1,742 2,767 64 54 92 210 868 1,475 2,3432018 .................. 995 1,692 2,688 64 57 97 217 938 1,595 2,533
a Conventional hydroelectricity net generation. Through 1989, also includeshydroelectric pumped storage.
b Geothermal heat pump and direct use energy; and geothermal electricity netgeneration.
c Wind electricity net generation.d Electricity net generation in kilowatthours (kWh) multiplied by 3,412 Btu/kWh,
the heat content of electricity (see Table A6).e Through 1988, data are for electric utilities and industrial plants. Beginning in
1989, data are for electric utilities, independent power producers, commercialplants, and industrial plants.
f Equals the difference between the fossil-fuel equivalent value of electricity andthe captured energy consumed as electricity. The fossil-fuel equivalent value ofelectricity equals electricity net generation in kilowatthours multiplied by the totalfossil fuels heat rate factors (see Table A6). The captured energy consumed aselectricity equals electricity net generation in kilowatthours multiplied by 3,412Btu/kWh, the heat content of electricity (see Table A6).
g Electricity net generation in kilowatthours multiplied by the total fossil fuels
heat rate factors (see Table A6).h Geothermal heat pump and direct use energy.i Through 1988, data are for electric utilities only. Beginning in 1989, data are
for electric utilities, independent power producers, commercial plants, and industrialplants.
j Direct consumption of energy; and energy used to generate electricity,calculated as electricity net generation in kilowatthours multiplied by the total fossilfuels heat rate factors (see Table A6).
NA=Not available. (s)=Less than 0.5 trillion Btu.Notes: • Geothermal direct consumption data are estimates. • Totals may not
equal sum of components due to independent rounding. • Geographic coverage isthe 50 states and the District of Columbia.
Web Page: See http://www.eia.gov/totalenergy/data/monthly/#appendices(Excel and CSV files) for all available annual data beginning in 1949.
Sources: • Conventional Hydroelectric Power and Wind: Tables 7.2a, 10.1,and A6. • Geothermal: Tables 7.2a, 10.1, 10.2a, 10.2b, and A6.

242 U. S. Energy Information Administration / Monthly Energy Review March 2019
Table E1b. Noncombustible Renewable Primary Energy Consumption: Solar and Total (Trillion Btu)
Solara Totalb
Distributedc Utility-Scaled
TotalPrimaryEnergyi
CapturedEnergyj
Adjustmentfor Fossil
FuelEquivalenceg
TotalPrimaryEnergyi
DirectConsumptione
TransformedInto
Electricityf
Adjustmentfor Fossil
FuelEquivalenceg
TransformedInto
Electricityf,h
Adjustmentfor Fossil
FuelEquivalenceg
1950 .................. NA NA NA NA NA NA 344 1,071 1,4151955 .................. NA NA NA NA NA NA 397 963 1,3601960 .................. NA NA NA NA NA NA 510 1,098 1,6081965 .................. NA NA NA NA NA NA 673 1,388 2,0611970 .................. NA NA NA NA NA NA 858 1,781 2,6391975 .................. NA NA NA NA NA NA 1,045 2,143 3,1881980 .................. NA NA NA NA NA NA 970 1,983 2,9531981 .................. NA NA NA NA NA NA 920 1,898 2,8171982 .................. NA NA NA NA NA NA 1,082 2,234 3,3161983 .................. NA NA NA NA NA NA 1,165 2,426 3,5911984 .................. NA NA NA (s) (s) (s) 1,133 2,334 3,4671985 .................. NA NA NA (s) (s) (s) 1,002 2,066 3,0681986 .................. NA NA NA (s) (s) (s) 1,038 2,141 3,1791987 .................. NA NA NA (s) (s) (s) 900 1,847 2,7471988 .................. NA NA NA (s) (s) (s) 807 1,634 2,4411989 .................. 52 (s) (s) h 1 2 54 1,047 2,029 3,0751990 .................. 55 (s) (s) 1 3 59 1,128 2,177 3,3051991 .................. 56 (s) (s) 2 3 62 1,120 2,166 3,2861992 .................. 58 (s) (s) 1 3 63 1,000 1,889 2,8891993 .................. 60 (s) (s) 2 3 65 1,099 2,075 3,1731994 .................. 62 (s) (s) 2 3 67 1,029 1,931 2,9601995 .................. 63 (s) (s) 2 3 68 1,196 2,263 3,4581996 .................. 63 (s) (s) 2 4 69 1,325 2,531 3,8561997 .................. 62 (s) (s) 2 3 68 1,358 2,551 3,9091998 .................. 61 (s) 1 2 3 67 1,245 2,319 3,5641999 .................. 60 (s) 1 2 3 66 1,237 2,313 3,5502000 .................. 57 (s) 1 2 3 63 1,087 2,009 3,0962001 .................. 55 (s) 1 2 4 62 890 1,648 2,5382002 .................. 53 1 1 2 4 60 1,066 1,960 3,0252003 .................. 51 1 1 2 4 58 1,109 2,028 3,1382004 .................. 50 1 1 2 4 58 1,097 1,969 3,0672005 .................. 49 1 2 2 4 58 1,119 2,001 3,1202006 .................. 51 2 3 2 3 61 1,218 2,156 3,3752007 .................. 53 2 4 2 4 65 1,110 1,928 3,0382008 .................. 54 4 7 3 6 74 1,216 2,107 3,3232009 .................. 55 5 9 3 6 78 1,353 2,315 3,6682010 .................. 56 8 15 4 8 90 1,390 2,370 3,7602011 .................. 58 13 23 6 11 111 1,692 2,902 4,5942012 .................. 59 20 36 15 26 157 1,634 2,703 4,3372013 .................. 61 28 50 31 55 225 1,726 2,877 4,6022014 .................. 62 38 68 60 108 337 1,783 2,963 4,7462015 .................. 62 48 84 85 147 426 1,814 2,922 4,7362016 .................. 62 64 109 123 210 569 2,055 3,291 5,3462017 .................. 63 82 139 182 309 774 2,336 3,758 6,0952018 .................. 63 101 171 227 386 949 2,445 3,942 6,387
a Solar thermal direct use energy; and solar photovoltaic (PV) and solar thermalelectricity net generation.
b Conventional hydroelectricity net generation; geothermal heat pump and directuse energy; geothermal electricity net generation; wind electricity net generation;solar thermal direct use energy; and solar photovoltaic (PV) and solar thermalelectricity net generation.
c Distributed (small-scale) facilities (electric generators have a combinedgenerator nameplate capacity of less than 1 megawatt).
d Utility-scale facilities (combined generator nameplate capacity of 1 megawattor more).
e Solar thermal direct use energy.f Electricity net generation in kilowatthours (kWh) multiplied by 3,412 Btu/kWh,
the heat content of electricity (see Table A6).g Equals the difference between the fossil-fuel equivalent value of electricity and
the captured energy consumed as electricity. The fossil-fuel equivalent value ofelectricity equals electricity net generation in kilowatthours multiplied by the totalfossil fuels heat rate factors (see Table A6). The captured energy consumed aselectricity equals electricity net generation in kilowatthours multiplied by 3,412Btu/kWh, the heat content of electricity (see Table A6).
h Through 1988, data are for electric utilities only. Beginning in 1989, data arefor electric utilities, independent power producers, commercial plants, and industrialplants.
i Direct consumption of energy; and energy used to generate electricity,calculated as electricity net generation in kilowatthours multiplied by the total fossilfuels heat rate factors (see Table A6).
j Direct consumption of energy plus captured energy consumed as electricity,which is calculated as electricity net generation in kilowatthours (kWh) multiplied by3,412 Btu/kWh, the heat content of electricity (see Table A6).
NA=Not available. (s)=Less than 0.5 trillion Btu.Notes: • Beginning in 1989, data for distributed solar and total captured energy
are estimates. For the current year, data for utility-scale solar are estimates.• Totals may not equal sum of components due to independent rounding.• Geographic coverage is the 50 states and the District of Columbia.
Web Page: See http://www.eia.gov/totalenergy/data/monthly/#appendices(Excel and CSV files) for all available annual data beginning in 1949.
Sources: • Solar: Tables 10.5, 10.6, and A6. • Total: Tables 7.2a, 10.1,10.2a, 10.2b, 10.5, 10.6, and A6.

Glossary

244 U. S. Energy Information Administration / Monthly Energy Review March 2019
Alcohol: The family name of a group of organic chemical compounds composed of carbon, hydrogen, and oxygen. The series of molecules vary in chain length and are composed of a hydrocarbon plus a hydroxyl group; CH(3)‐(CH(2))n‐OH (e.g., methanol, ethanol, and tertiary butyl alcohol). See Fuel ethanol.
Alternative fuel: Alternative fuels, for transportation applications, include the following: methanol; denatured ethanol, and other alcohols; fuel mixtures containing 85 percent or more by volume of methanol, denatured ethanol, and other alcohols with motor gasoline or other fuels; natural gas; liquefied petroleum gas (propane); hydrogen; coal‐derived liquid fuels; fuels (other than alcohol) derived from biological materials (biofuels such as soy diesel fuel); electricity (including electricity from solar energy); and "... any other fuel the Secretary determines, by rule, is substantially not petroleum and would yield substantial energy security benefits and substantial environmental benefits." The term "alternative fuel" does not include alcohol or other blended portions of primarily petroleum‐based fuels used as oxygenates or extenders, i.e., MTBE, ETBE, other ethers, and the 10‐percent ethanol portion of gasohol.
Alternative‐fuel vehicle (AFV): A vehicle designed to operate on an alternative fuel (e.g., compressed natural gas, methane blend, or electricity). The vehicle could be either a dedicated vehicle designed to operate exclusively on alternative fuel or a nondedicated vehicle designed to operate on alternative fuel and/or a traditional fuel.
Anthracite: The highest rank of coal; used primarily for residential and commercial space heating. It is a hard, brittle, and black lustrous coal, often referred to as hard coal, containing a high percentage of fixed carbon and a low percentage of volatile matter. The moisture content of fresh‐mined anthracite generally is less than 15 percent. The heat content of anthracite ranges from 22 to 28 million Btu per short ton on a moist, mineral‐matter‐free basis. The heat content of anthracite coal consumed in the United States averages 25 million Btu per short ton, on the as‐received basis (i.e., containing both inherent moisture and mineral matter). Note: Since the 1980's, anthracite refuse or mine waste has been used for steam‐electric power generation. This fuel typically has a heat content of 15 million Btu per ton or less.
Anthropogenic: Made or generated by a human or caused by human activity. The term is used in the context of global climate change to refer to gaseous emissions that are the result of human activities, as well as other potentially climate‐ altering activities, such as deforestation.
Asphalt: A dark brown‐to‐black cement‐like material obtained by petroleum processing and containing bitumens as the predominant component; used primarily for road construction. It includes crude asphalt as well as the following finished products: cements, fluxes, the asphalt content of emulsions (exclusive of water), and petroleum distillates blended with asphalt to make cutback asphalts. Note: The conversion factor for asphalt is 5.5 barrels per short ton.
ASTM: The American Society for Testing and Materials.
Aviation gasoline blending components: Naphthas that will be used for blending or compounding into finished aviation gasoline (e.g., straight run gasoline, alkylate, reformate, benzene, toluene, and xylene). Excludes oxygenates (alcohols, ethers), butane, and natural gasoline. Oxygenates are reported as other hydrocarbons, hydrogen, and oxygenates. See Aviation gasoline, finished.
Aviation gasoline, finished: A complex mixture of relatively volatile hydrocarbons with or without small quantities of additives, blended to form a fuel suitable for use in aviation reciprocating engines. Fuel specifications are provided in ASTM Specification D 910 and Military Specification MIL‐G‐5572. Note: Data on blending components are not counted in data on finished aviation gasoline.
Barrel (petroleum): A unit of volume equal to 42 U.S. Gallons.
Base gas: The quantity of natural gas needed to maintain adequate reservoir pressures and deliverability rates throughout the withdrawal season. Base gas usually is not withdrawn and remains in the reservoir. All natural gas native to a depleted reservoir is included in the base gas volume.
Biodiesel: A fuel typically made from soybean, canola, or other vegetable oils; animal fats; and recycled grease. It can serve as a substitute for petroleum‐derived diesel fuel or distillate fuel oil. For U.S. Energy Information Administration

U. S. Energy Information Administration / Monthly Energy Review March 2019 245
reporting, it is a fuel composed of mono‐alkyl esters of long chain fatty acids derived from vegetable oils or animal fats, designated B100, and meeting the requirements of ASTM (American Society for Testing & Materials) D 6751.
Biofuels: Liquid fuels and blending components produced from biomass (plant) feedstocks, used primarily for transportation. See Biodiesel and Fuel ethanol.
Biogenic: Produced by biological processes of living organisms. Note: EIA uses the term “biogenic” to refer only to organic nonfossil material of biological origin.
Biomass: Organic nonfossil material of biological origin constituting a renewable energy source. See Biodiesel, Biofuels, Biomass waste, Densified biomass, Fuel ethanol, and Wood and wood‐derived fuels.
Biomass‐based diesel fuel: Biodiesel and other renewable diesel fuel or diesel fuel blending components derived from biomass, but excluding renewable diesel fuel coprocessed with petroleum feedstocks. See Renewable diesel fuel (other).
Biomass waste: Organic non‐fossil material of biological origin that is a byproduct or a discarded product. “Biomass waste” includes municipal solid waste from biogenic sources, landfill gas, sludge waste, agricultural crop byproducts, straw, and other biomass solids, liquids, and gases; but excludes wood and wood‐derived fuels (including black liquor), biofuels feedstock, biodiesel, and fuel ethanol. Note: EIA “biomass waste” data also include energy crops grown specifically for energy production, which would not normally constitute waste.
Bituminous coal: A dense coal, usually black, sometimes dark brown, often with well‐defined bands of bright and dull material, used primarily as fuel in steam‐electric power generation, with substantial quantities also used for heat and power applications in manufacturing and to make coke. Bituminous coal is the most abundant coal in active U.S. mining regions. Its moisture content usually is less than 20 percent. The heat content of bituminous coal ranges from 21 to 30 million Btu per short ton on a moist, mineral‐matter‐free basis. The heat content of bituminous coal consumed in the United States averages 24 million Btu per short ton, on the as‐received basis (i.e., containing both inherent moisture and mineral matter).
Black liquor: A byproduct of the paper production process, alkaline spent liquor that can be used as a source of energy. Alkaline spent liquor is removed from the digesters in the process of chemically pulping wood. After evaporation, the residual "black" liquor is burned as a fuel in a recovery furnace that permits the recovery of certain basic chemicals.
British thermal unit (Btu): The quantity of heat required to raise the temperature of 1 pound of liquid water by 1 degree Fahrenheit at the temperature at which water has its greatest density (approximately 39 degrees Fahrenheit). See Heat content.
Btu: See British thermal unit.
Btu conversion factor: A factor for converting energy data between one unit of measurement and British thermal units (Btu). Btu conversion factors are generally used to convert energy data from physical units of measure (such as barrels, cubic feet, or short tons) into the energy‐equivalent measure of Btu. (See http://www.eia.gov/totalenergy/data/monthly/#appendices for further information on Btu conversion factors.)
Butane (C4H10): A straight‐chain or branch‐chain hydrocarbon extracted from natural gas or refinery gas streams, which is gaseous at standard temperature and pressure. It includes isobutane and normal butane and is designated in ASTM Specification D1835 and Gas Processors Association specifications for commercial butane.
Isobutane (C4H10): A branch‐chain saturated (paraffinic) hydrocarbon extracted from both natural gas and refinery gas streams, which is gaseous at standard temperature and pressure. It is a colorless gas that boils at a temperature of 11 degrees Fahrenheit. See Paraffinic hydrocarbons.
Normal Butane (C4H10): A straight‐chain saturated (paraffinic) hydrocarbon extracted from both natural gas and refinery gas streams, which is gaseous at standard temperature and pressure. It is a colorless gas that boils at a temperature of 31 degrees Fahrenheit. See Paraffinic hydrocarbons.

246 U. S. Energy Information Administration / Monthly Energy Review March 2019
Butylene (C4H8): An olefinic hydrocarbon recovered from refinery or petrochemical processes, which is gaseous at standard temperature and pressure. Butylene is used in the production of gasoline and various petrochemical products. See Olefinic hydrocarbons (olefins).
Capacity factor: The ratio of the electrical energy produced by a generating unit for a given period of time to the electrical energy that could have been produced at continuous full‐power operation during the same period.
Carbon dioxide (CO2): A colorless, odorless, non‐poisonous gas that is a normal part of Earth's atmosphere. Carbon dioxide is a product of fossil‐fuel combustion as well as other processes. It is considered a greenhouse gas as it traps heat (infrared energy) radiated by the Earth into the atmosphere and thereby contributes to the potential for global warming. The global warming potential (GWP) of other greenhouse gases is measured in relation to that of carbon dioxide, which by international scientific convention is assigned a value of one (1).
Chained dollars: A measure used to express real prices. Real prices are those that have been adjusted to remove the effect of changes in the purchasing power of the dollar; they usually reflect buying power relative to a reference year. Prior to 1996, real prices were expressed in constant dollars, a measure based on the weights of goods and services in a single year, usually a recent year. In 1996, the U.S. Department of Commerce introduced the chained‐dollar measure. The new measure is based on the average weights of goods and services in successive pairs of years. It is “chained” because the second year in each pair, with its weights, becomes the first year of the next pair. The advantage of using the chained‐ dollar measure is that it is more closely related to any given period and is therefore subject to less distortion over time.
CIF: See Cost, insurance, freight.
Citygate: A point or measuring station at which a distribution gas utility receives gas from a natural gas pipeline company or transmission system.
Climate change: A term used to refer to all forms of climatic inconsistency, but especially to significant change from one prevailing climatic condition to another. In some cases, "climate change" has been used synonymously with the term "global warming"; scientists, however, tend to use the term in a wider sense inclusive of natural changes in climate, including climatic cooling.
Coal: A readily combustible black or brownish‐black rock whose composition, including inherent moisture, consists of more than 50 percent by weight and more than 70 percent by volume of carbonaceous material. It is formed from plant remains that have been compacted, hardened, chemically altered, and metamorphosed by heat and pressure over geologic time. See Anthracite, Bituminous coal, Lignite, Subbituminous coal, Waste coal, and Coal synfuel.
Coal coke: A solid carbonaceous residue derived from low‐ash, low‐sulfur bituminous coal from which the volatile constituents are driven off by baking in an oven at temperatures as high as 2,000 degrees Fahrenheit so that the fixed carbon and residual ash are fused together. Coke is used as a fuel and as a reducing agent in smelting iron ore in a blast furnace. Coke from coal is grey, hard, and porous and has a heating value of 24.8 million Btu per ton.
Coal stocks: Coal quantities that are held in storage for future use and disposition. Note: When coal data are collected for a particular reporting period (month, quarter, or year), coal stocks are commonly measured as of the last day of the period.
Coal synfuel: Coal‐based solid fuel that has been processed by a coal synfuel plant; and coal‐based fuels such as briquettes, pellets, or extrusions, which are formed from fresh or recycled coal and binding materials.
Coal synfuel plant: A plant engaged in the chemical transformation of coal into coal synfuel.
Coke: See Coal coke and Petroleum coke.
Coking coal: Bituminous coal suitable for making coke. See Coal coke.
Combined heat and power (CHP) plant: A plant designed to produce both heat and electricity from a single heat source. Note: This term is being used in place of the term "cogenerator" that was used by EIA in the past. CHP better

U. S. Energy Information Administration / Monthly Energy Review March 2019 247
describes the facilities because some of the plants included do not produce heat and power in a sequential fashion and, as a result, do not meet the legal definition of cogeneration specified in the Public Utility Regulatory Policies Act (PURPA).
Commercial sector: An energy‐consuming sector that consists of service‐providing facilities and equipment of: businesses; federal, state, and local governments; and other private and public organizations, such as religious, social, or fraternal groups. The commercial sector includes institutional living quarters. It also includes sewage treatment facilities. Common uses of energy associated with this sector include space heating, water heating, air conditioning, lighting, refrigeration, cooking, and running a wide variety of other equipment. Note: This sector includes generators that produce electricity and/or useful thermal output primarily to support the activities of the above‐ mentioned commercial establishments. See End‐use sectors and Energy‐use sectors.
Completion: The installation of permanent equipment for the production of oil or gas. If a well is equipped to produce only oil or gas from one zone or reservoir, the definition of a well (classified as an oil well or gas well) and the definition of a completion are identical. However, if a well is equipped to produce oil and/or gas separately from more than one reservoir, a well is not synonymous with a completion.
Conventional hydroelectric power: Hydroelectric power generated from flowing water that is not created by hydroelectric pumped storage.
Conventional motor gasoline: See Motor gasoline conventional.
Conversion factor: A factor for converting data between one unit of measurement and another (such as between short tons and British thermal units, or between barrels and gallons). (See http://www.eia.gov/totalenergy/data/monthly/#appendices. See Btu conversion factor and Thermal conversion factor.
Cost, insurance, freight (CIF): A sales transaction in which the seller pays for the transportation and insurance of the goods to the port of destination specified by the buyer.
Crude oil: A mixture of hydrocarbons that exists in liquid phase in natural underground reservoirs and remains liquid at atmospheric pressure after passing through surface separating facilities. Depending upon the characteristics of the crude stream, it may also include: (1) small amounts of hydrocarbons that exist in gaseous phase in natural underground reservoirs but are liquid at atmospheric pressure after being recovered from oil well (casing head) gas in lease separators and are subsequently commingled with the crude stream without being separately measured. Lease condensate recovered as a liquid from natural gas wells in lease or field separation facilities and later mixed into the crude stream is also included; (2) small amounts of nonhydrocarbons produced with the oil, such as sulfur and various metals; and (3) drip gases, and liquid hydrocarbons produced from tar sands, oil sands, gilsonite, and oil shale. Liquids produced at natural gas processing plants are excluded. Crude oil is refined to produce a wide array of petroleum products, including heating oils; gasoline, diesel and jet fuels; lubricants; asphalt; ethane, propane, and butane; and many other products used for their energy or chemical content.
Crude oil f.o.b. price: The crude oil price actually charged at the oil‐producing country’s port of loading. Includes deductions for any rebates and discounts or additions of premiums, where applicable. It is the actual price paid with no adjustment for credit terms.
Crude oil (including lease condensate): A mixture of hydrocarbons that exists in liquid phase in underground reservoirs and remains liquid at atmospheric pressure after passing through surface separating facilities. Included are lease condensate and liquid hydrocarbons produced from tar sands, gilsonite, and oil shale. Drip gases are also included, but topped crude oil (residual oil) and other unfinished oils are excluded. Where identifiable, liquids produced at natural gas processing plants and mixed with crude oil are likewise excluded.
Crude oil landed cost: The price of crude oil at the port of discharge, including charges associated with the purchase, transporting, and insuring of a cargo from the purchase point to the port of discharge. The cost does not include charges incurred at the discharge port (e.g., import tariffs or fees, wharfage charges, and demurrage).
Crude oil refinery input: The total crude oil put into processing units at refineries.

248 U. S. Energy Information Administration / Monthly Energy Review March 2019
Crude oil stocks: Stocks of crude oil and lease condensate held at refineries, in pipelines, at pipeline terminals, and on leases.
Crude oil used directly: Crude oil consumed as fuel by crude oil pipelines and on crude oil leases.
Crude oil well: A well completed for the production of crude oil from one or more oil zones or reservoirs. Wells producing both crude oil and natural gas are classified as oil wells.
Cubic foot (natural gas): The amount of natural gas contained at standard temperature and pressure (60 degrees Fahrenheit and 14.73 pounds standard per square inch) in a cube whose edges are one foot long.
Degree Day Normals: Simple arithmetic averages of monthly or annual degree days over a long period of time (usually the 30‐year period 1961–1990). The averages may be simple degree day normals or population‐weighted degree day normals.
Degree Days, Cooling (CDD): A measure of how warm a location is over a period of time relative to a base temperature, most commonly specified as 65 degrees Fahrenheit. The measure is computed for each day by subtracting the base temperature (65 degrees) from the average of the day’s high and low temperatures, with negative values set equal to zero. Each day’s cooling degree days are summed to create a cooling degree day measure for a specified reference period. Cooling degree days are used in energy analysis as an indicator of air conditioning energy requirements or use.
Degree Days, Heating (HDD): A measure of how cold a location is over a period of time relative to a base temperature, most commonly specified as 65 degrees Fahrenheit. The measure is computed for each day by subtracting the average of the day’s high and low temperatures from the base temperature (65 degrees), with negative values set equal to zero. Each day’s heating degree days are summed to create a heating degree day measure for a specified reference period. Heating degree days are used in energy analysis as an indicator of space heating energy requirements or use.
Degree Days, Population‐weighted: Heating or cooling degree days weighted by the population of the area in which the degree days are recorded. To compute state population‐weighted degree days, each state is divided into from one to nine climatically homogeneous divisions, which are assigned weights based on the ratio of the population of the division to the total population of the state. Degree day readings for each division are multiplied by the corresponding population weight for each division and those products are then summed to arrive at the state population‐weighted degree day figure. To compute national population‐weighted degree days, the nation is divided into nine Census regions, each comprising from three to eight states, which are assigned weights based on the ratio of the population of the region to the total population of the nation. Degree day readings for each region are multiplied by the corresponding population weight for each region and those products are then summed to arrive at the national population‐weighted degree day figure.
Denaturant: Petroleum, typically natural gasoline or conventional motor gasoline, added to fuel ethanol to make it unfit for human consumption. Fuel ethanol is denatured, usually prior to transport from the ethanol production facility, by adding 2 to 5 volume percent denaturant. See Fuel ethanol and Fuel ethanol minus denaturant.
Densified biomass fuel: Raw biomass, primarily wood, that has been condensed into a homogenously sized, energy‐ dense product, such as wood pellets, intended for use as fuel. It is mainly used for residential and commercial space heating and electricity generation.
Design electrical rating, net: The nominal net electrical output of a nuclear unit as specified by the electric utility for the purpose of plant design.
Development well: A well drilled within the proved area of an oil or gas reservoir to the depth of a stratigraphic horizon known to be productive.
Diesel fuel: A fuel composed of distillate fuel oils obtained in petroleum refining operation or blends of such distillate fuel oils with residual fuel oil used in motor vehicles. The boiling point and specific gravity are higher for diesel fuels than for gasoline.
Direct use: Use of electricity that (1) is self‐generated, (2) is produced by either the same entity that consumes the

U. S. Energy Information Administration / Monthly Energy Review March 2019 249
power or an affiliate, and (3) is used in direct support of a service or industrial process located within the same facility or group of facilities that house the generating equipment. Direct use is exclusive of station use.
Distillate fuel oil: A general classification for one of the petroleum fractions produced in conventional distillation operations. It includes diesel fuels and fuel oils. Products known as No. 1, No. 2, and No. 4 diesel fuel are used in on‐ highway diesel engines, such as those in trucks and automobiles, as well as off‐highway engines, such as those in railroad locomotives and agricultural machinery. Products known as No. 1, No. 2, and No. 4 fuel oils are used primarily for space heating and electricity generation.
Dry hole: An exploratory or development well found to be incapable of producing either oil or gas in sufficient quantities to justify completion as an oil or gas well.
Dry natural gas production: See Natural gas (dry) production.
E85: A fuel containing a mixture of 85 percent ethanol and 15 percent motor gasoline.
Electric power plant: A station containing prime movers, electric generators, and auxiliary equipment for converting mechanical, chemical, and/or fission energy into electric energy.
Electric power sector: An energy‐consuming sector that consists of electricity‐only and combined‐heat‐and‐power (CHP) plants whose primary business is to sell electricity, or electricity and heat, to the public‐i.e., North American Industry Classification System 22 plants. See also Combined heat and power (CHP) plant, Electricity‐only plant, Electric utility, and Independent power producer.
Electric utility: Any entity that generates, transmits, or distributes electricity and recovers the cost of its generation, transmission or distribution assets and operations, either directly or indirectly, through cost‐based rates set by a separate regulatory authority (e.g., State Public Service Commission), or is owned by a governmental unit or the consumers that the entity serves. Examples of these entities include: investor‐owned entities, public power districts, public utility districts, municipalities, rural electric cooperatives, and state and federal agencies. Electric utilities may have Federal Energy Regulatory Commission approval for interconnection agreements and wholesale trade tariffs covering either cost‐of‐service and/or market‐based rates under the authority of the Federal Power Act. See Electric power sector.
Electrical system energy losses: The amount of energy lost during generation, transmission, and distribution of electricity, including plant and unaccounted‐for uses.
Electricity: A form of energy characterized by the presence and motion of elementary charged particles generated by friction, induction, or chemical change.
Electricity generation: The process of producing electric energy, or the amount of electric energy produced by transforming other forms of energy, commonly expressed in kilowatthours (kWh) or megawatthours (MWh).
Electricity generation, gross: The total amount of electric energy produced by generating units and measured at the generating terminal in kilowatthours (kWh) or megawatthours (MWh).
Electricity generation, net: The amount of gross electricity generation less station use (the electric energy consumed at the generating station(s) for station service or auxiliaries). Note: Electricity required for pumping at hydroelectric pumped‐storage plants is regarded as electricity for station service and is deducted from gross generation.
Electricity only plant: A plant designed to produce electricity only. See also Combined heat and power (CHP) plant.
Electricity retail sales: The amount of electricity sold to customers purchasing electricity for their own use and not for resale.
End use sectors: The residential, commercial, industrial, and transportation sectors of the economy.
Energy: The capacity for doing work as measured by the capability of doing work (potential energy) or the conversion of this capability to motion (kinetic energy). Energy has several forms, some of which are easily convertible and can be changed to another form useful for work. Most of the world’s convertible energy comes from fossil fuels that are

250 U. S. Energy Information Administration / Monthly Energy Review March 2019
burned to produce heat that is then used as a transfer medium to mechanical or other means in order to accomplish tasks. Electrical energy is usually measured in kilowatthours, while heat energy is usually measured in British thermal units.
Energy consumption: The use of energy as a source of heat or power or as an input in the manufacturing process.
Energy service provider: An energy entity that provides service to a retail or end‐use customer.
Energy use sectors: A group of major energy‐consuming components of U.S. society developed to measure and analyze energy use. The sectors most commonly referred to in EIA are: residential, commercial, industrial, transportation, and electric power.
Ethane (C2H6): A straight‐chain saturated (paraffinic) hydrocarbon extracted predominantly from the natural gas stream, which is gaseous at standard temperature and pressure. It is a colorless gas that boils at a temperature of ‐127 degrees Fahrenheit. See Paraffinic hydrocarbons.
Ethanol (C2H5OH): A clear, colorless, flammable alcohol. Ethanol is typically produced biologically from biomass feedstocks such as agricultural crops and cellulosic residues from agricultural crops or wood. Ethanol can also be produced chemically from ethylene. See Biomass, Fuel ethanol, and Fuel ethanol minus denaturant.
Ether: A generic term applied to a group of organic chemical compounds composed of carbon, hydrogen, and oxygen, characterized by an oxygen atom attached to two carbon atoms (e.g., methyl tertiary butyl ether).
Ethylene (C2H4): An olefinic hydrocarbon recovered from refinery or petrochemical processes, which is gaseous at standard temperature and pressure. Ethylene is used as a petrochemical feedstock for many chemical applications and the production of consumer goods. See Olefinic hydrocarbons (olefins).
Exploratory well: A well drilled to find and produce oil or gas in an area previously considered an unproductive area, to find a new reservoir in a known field (i.e., one previously found to be producing oil or gas in another reservoir), or to extend the limit of a known oil or gas reservoir.
Exports: Shipments of goods from within the 50 states and the District of Columbia to U.S. possessions and territories or to foreign countries.
Federal Energy Administration (FEA): A predecessor of the U.S. Energy Information Administration.
Federal Energy Regulatory Commission (FERC): The Federal agency with jurisdiction over interstate electricity sales, wholesale electric rates, hydroelectric licensing, natural gas pricing, oil pipeline rates, and gas pipeline certification. FERC is an independent regulatory agency within the U.S. Department of Energy and is the successor to the Federal Power Commission.
Federal Power Commission (FPC): The predecessor agency of the Federal Energy Regulatory Commission. The Federal Power Commission was created by an Act of Congress under the Federal Water Power Act on June 10, 1920. It was charged originally with regulating the electric power and natural gas industries. It was abolished on September 30, 1977, when the U.S. Department of Energy was created. Its functions were divided between the U.S. Department of Energy and the Federal Energy Regulatory Commission, an independent regulatory agency.
First purchase price: The price for domestic crude oil reported by the company that owns the crude oil the first time it is removed from the lease boundary.
Flared natural gas: Natural gas burned in flares on the base site or at gas processing plants.
F.O.B. (free on board): A sales transaction in which the seller makes the product available for pick up at a specified port or terminal at a specified price and the buyer pays for the subsequent transportation and insurance.
Footage drilled: Total footage for wells in various categories, as reported for any specified period, includes (1) the deepest total depth (length of well bores) of all wells drilled from the surface, (2) the total of all bypassed footage drilled in connection with reported wells, and (3) all new footage drilled for directional sidetrack wells. Footage reported for directional sidetrack wells does not include footage in the common bore, which is reported as footage for

U. S. Energy Information Administration / Monthly Energy Review March 2019 251
the original well. In the case of old wells drilled deeper, the reported footage is that which was drilled below the total depth of the old well.
Former U.S.S.R.: See Union of Soviet Socialist Republics (U.S.S.R.).
Fossil fuel: An energy source formed in the Earth’s crust from decayed organic material, such as petroleum, coal, and natural gas.
Fossil fueled steam electric power plant: An electricity generation plant in which the prime mover is a turbine rotated by high‐pressure steam produced in a boiler by heat from burning fossil fuels.
Fuel ethanol: Ethanol intended for fuel use. Fuel ethanol in the United States must be anhydrous (less than 1 percent water). Fuel ethanol is denatured (made unfit for human consumption), usually prior to transport from the ethanol production facility, by adding 2 to 5 volume percent petroleum, typically natural gasoline or conventional motor gasoline. Fuel ethanol is used principally for blending in low concentrations with motor gasoline as an oxygenate or octane enhancer. In high concentrations, it is used to fuel alternative‐fuel vehicles specially designed for its use. See Alternative‐fuel vehicle, Denaturant, E85, Ethanol, Fuel ethanol minus denaturant, and Oxygenates.
Fuel ethanol minus denaturant: An unobserved quantity of anhydrous, biomass‐derived, undenatured ethanol for fuel use. The quantity is obtained by subtracting the estimated denaturant volume from fuel ethanol volume. Fuel ethanol minus denaturant is counted as renewable energy, while denaturant is counted as nonrenewable fuel. See Denaturant, Ethanol, Fuel ethanol, Nonrenewable fuels, Oxygenates, and Renewable energy.
Full power operation: Operation of a nuclear generating unit at 100 percent of its design capacity. Full‐power operation precedes commercial operation.
Gasohol: A blend of finished motor gasoline containing alcohol (generally ethanol but sometimes methanol) at a concentration between 5.7 percent and 10 percent by volume. See Motor gasoline, oxygenated.
Gas well: A well completed for production of natural gas from one or more gas zones or reservoirs. Such wells contain no completions for the production of crude oil.
Geothermal energy: Hot water or steam extracted from geothermal reservoirs in the earth’s crust and used for geothermal heat pumps, water heating, or electricity generation.
Global warming: An increase in the near‐surface temperature of the Earth. Global warming has occurred in the distant past as the result of natural influences, but the term is today most often used to refer to the warming some scientists predict will occur as a result of increased anthropogenic emissions of greenhouse gases. See Climate change.
Global warming potential (GWP): An index used to compare the relative radiative forcing of different gases without directly calculating the changes in atmospheric concentrations. GWPs are calculated as the ratio of the radiative forcing that would result from the emission of one kilogram of a greenhouse gas to that from the emission of one kilogram of carbon dioxide over a fixed period of time, such as 100 years.
Greenhouse gases: Those gases, such as water vapor, carbon dioxide, nitrous oxide, methane, hydrofluorocarbons (HFCs), perfluorocarbons (PFCs) and sulfur hexafluoride, that are transparent to solar (short‐wave) radiation but opaque to long‐wave (infrared) radiation, thus preventing long‐wave radiant energy from leaving Earth's atmosphere. The net effect is a trapping of absorbed radiation and a tendency to warm the planet's surface.
Gross domestic product (GDP): The total value of goods and services produced by labor and property located in the United States. As long as the labor and property are located in the United States, the supplier (that is, the workers and, for property, the owners) may be either U.S. residents or residents of foreign countries.
GT/IC: Gas turbine and internal combustion plants.
Heat content: The amount of heat energy available to be released by the transformation or use of a specified physical unit of an energy form (e.g., a ton of coal, a barrel of oil, a kilowatthour of electricity, a cubic foot of natural gas, or a
pound of steam). The amount of heat energy is commonly expressed in British thermal units (Btu). Note: Heat

252 U. S. Energy Information Administration / Monthly Energy Review March 2019
content of combustible energy forms can be expressed in terms of either gross heat content (higher or upper heating value) or net heat content (lower heating value), depending upon whether or not the available heat energy includes or excludes the energy used to vaporize water (contained in the original energy form or created during the combustion process). The U.S. Energy Information Administration typically uses gross heat content values.
Heat rate: A measure of generating station thermal efficiency commonly stated as Btu per kilowatthour. Note: Heat rates can be expressed as either gross or net heat rates, depending whether the electricity output is gross or net generation. Heat rates are typically expressed as net heat rates.
Hydrocarbon: An organic chemical compound of hydrogen and carbon in the gaseous, liquid, or solid phase. The molecular structure of hydrocarbon compounds varies from the simplest (methane, the primary constituent of natural gas) to the very heavy and very complex.
Hydrocarbon gas liquids (HGL): A group of hydrocarbons including ethane, propane, normal butane, isobutane, and natural gasoline, and their associated olefins, including ethylene, propylene, butylene, and isobutylene. As marketed products, HGL represents all natural gas liquids (NGL) and olefins. EIA reports production of HGL from refineries (liquefied refinery gases, or LRG) and natural gas plants (natural gas plant liquids, or NGPL). Excludes liquefied natural gas (LNG). See Olefinic hydrocarbons (olefins).
Hydroelectric power: The production of electricity from the kinetic energy of falling water.
Hydroelectric power plant: A plant in which the turbine generators are driven by falling water.
Hydroelectric pumped storage: Hydroelectricity that is generated during peak load periods by using water previously pumped into an elevated storage reservoir during off‐peak periods when excess generating capacity is available to do so. When additional generating capacity is needed, the water can be released from the reservoir through a conduit to turbine generators located in a power plant at a lower level.
Hydrogen (H): The lightest of all gases, hydrogen occurs chiefly in combination with oxygen in water. It also exists in acids, bases, alcohols, petroleum, and other hydrocarbons.
Imports: Receipts of goods into the 50 states and the District of Columbia from U.S. possessions and territories or from foreign countries.
Independent power producer: A corporation, person, agency, authority, or other legal entity or instrumentality that owns or operates facilities for the generation of electricity for use primarily by the public, and that is not an electric utility.
Industrial sector: An energy‐consuming sector that consists of all facilities and equipment used for producing, processing, or assembling goods. The industrial sector encompasses the following types of activity: manufacturing (NAICS codes 31‐33); agriculture, forestry, fishing and hunting (NAICS code 11); mining, including oil and gas extraction (NAICS code 21); and construction (NAICS code 23). Overall energy use in this sector is largely for process heat and cooling and powering machinery, with lesser amounts used for facility heating, air conditioning, and lighting. Fossil fuels are also used as raw material inputs to manufactured products. Note: This sector includes generators that produce electricity and/or useful thermal output primarily to support the above‐mentioned industrial activities. See End use sectors and Energy use sectors.
Injections (natural gas): Natural gas injected into storage reservoirs.
Isobutane (C4H10): A branch‐chain saturated (paraffinic) hydrocarbon extracted from both natural gas and refinery gas streams, which is gaseous at standard temperature and pressure. It is a colorless gas that boils at a temperature of 11 degrees Fahrenheit. See Paraffinic hydrocarbons.
Isobutylene (C4H8): A branch‐chain olefinic hydrocarbon recovered from refinery or petrochemical processes, which is gaseous at standard temperature and pressure. Isobutylene is used in the production of gasoline and various petrochemical products. See Olefinic hydrocarbons (olefins).
Isopentane (C5H12): A saturated branched‐chain hydrocarbon obtained by fractionation of natural gasoline or isomerization of normal pentane.

U. S. Energy Information Administration / Monthly Energy Review March 2019 253
Jet fuel: A refined petroleum product used in jet aircraft engines. See Jet fuel, Kerosene‐type, and Jet fuel, Naphtha‐ type.
Jet fuel, kerosene‐type: A kerosene‐based product having a maximum distillation temperature of 400 degrees Fahrenheit at the 10‐percent recovery point and a final maximum boiling point of 572 degrees Fahrenheit and meeting ASTM Specification D 1655 and Military Specifications MIL‐T‐5624P and MIL‐T‐83133D (Grades JP‐5 and JP‐8). It is used for commercial and military turbo jet and turbo prop aircraft engines.
Jet fuel, naphtha‐type: A fuel in the heavy naphtha boiling range having an average gravity of 52.8 degrees API, 20% to 90% distillation temperatures of 290 degrees to 470 degrees Fahrenheit, and meeting Military Specification MIL‐T‐5624L (Grade JP‐4). It is used primarily for military turbojet and turboprop aircraft engines because it has a lower freeze point than other aviation fuels and meets engine requirements at high altitudes and speeds.
Kerosene: A light petroleum distillate that is used in space heaters, cook stoves, and water heaters and is suitable for use as a light source when burned in wick‐fed lamps. Kerosene has a maximum distillation temperature of 400 degrees Fahrenheit at the 10‐percent recovery point, a final boiling point of 572 degrees Fahrenheit, and a minimum flash point of 100 degrees Fahrenheit. Included are No. 1‐K and No. 2‐K, the two grades recognized by ASTM Specification D 3699 as well as all other grades of kerosene called range or stove oil, which have properties similar to those of No. 1 fuel oil. See Jet fuel, kerosene‐type.
Kilowatt: A unit of electrical power equal to 1,000 watts.
Kilowatthour (kWh): A measure of electricity defined as a unit of work or energy, measured as 1 kilowatt (1,000 watts) of power expended for 1 hour. One kilowatthour is equivalent to 3,412 Btu. See Watthour.
Landed costs: The dollar‐per‐barrel price of crude oil at the port of discharge. Included are the charges associated with the purchase, transporting, and insuring of a cargo from the purchase point to the port of discharge. Not included are charges incurred at the discharge port (e.g., import tariffs or fees, wharfage charges, and demurrage charges).
Lease and plant fuel: Natural gas used in well, field, and lease operations (such as gas used in drilling operations, heaters, dehydrators, and field compressors) and used as fuel in natural gas processing plants.
Lease condensate: Light liquid hydrocarbons recovered from lease separators or field facilities at associated and non‐ associated natural gas wells. Mostly pentanes and heavier hydrocarbons. Normally enters the crude oil stream after production.
Lignite: The lowest rank of coal, often referred to as brown coal, used almost exclusively as fuel for steam‐electric power generation. It is brownish‐black and has a high inherent moisture content, sometimes as high as 45 percent. The heat content of lignite ranges from 9 to 17 million Btu per short ton on a moist, mineral‐matter‐free basis. The heat content of lignite consumed in the United States averages 13 million Btu per short ton, on the as‐received basis (i.e., containing both inherent moisture and mineral matter).
Liquefied natural gas (LNG): Natural gas (primarily methane) that has been liquefied by reducing its temperature to ‐260 degrees Fahrenheit at atmospheric pressure.
Liquefied petroleum gases (LPG): A group of hydrocarbon gases, primarily propane, normal butane, and isobutane, derived from crude oil refining or natural gas processing. These gases may be marketed individually or mixed. They can be liquefied through pressurization (without requiring cryogenic refrigeration) for convenience of transportation or storage. Excludes ethane and olefins. Note: In some EIA publications, LPG includes ethane and marketed refinery olefin streams, in accordance with definitions used prior to January 2014.
Liquefied refinery gases (LRG): Hydrocarbon gas liquids produced in refineries from processing of crude oil and unfinished oils. They are retained in the liquid state through pressurization and/or refrigeration. The reported categories include ethane, propane, normal butane, isobutane, and refinery olefins (ethylene, propylene, butylene, and isobutylene).
Low power testing: The period of time between a nuclear generating unit’s initial fuel loading date and the issuance of its operating (full‐power) license. The maximum level of operation during that period is 5 percent of the unit’s design thermal rating.

254 U. S. Energy Information Administration / Monthly Energy Review March 2019
Lubricants: Substances used to reduce friction between bearing surfaces or as process materials either incorporated into other materials used as processing aids in the manufacturing of other products or as carriers of other materials. Petroleum lubricants may be produced either from distillates or residues. Other substances may be added to impart or improve certain required properties. Excluded are byproducts of lubricating oil refining, such as aromatic extracts derived from solvent extraction or tars derived from deasphalting. Included are all grades of lubricating oils from spindle oil to cylinder oil and those used in greases. Lubricant categories are paraffinic and naphthenic.
Marketed production (natural gas): See Natural gas marketed production.
Methane (CH4): A colorless, flammable, odorless hydrocarbon gas which is the major component of natural gas. It is also an important source of hydrogen in various industrial processes. Methane is a greenhouse gas. See Greenhouse gases.
Methanol (CH3OH): A light, volatile alcohol eligible for gasoline blending. See Motor gasoline blending and Oxygenates.
Methyl tertiary butyl ether (MTBE) ((CH3)3COCH3): An ether intended for gasoline blending. See Motor gasoline blending and Oxygenates.
Miscellaneous petroleum products: All finished petroleum products not classified elsewhere—for example, petrolatum, lube refining byproducts (aromatic extracts and tars), absorption oils, ram‐jet fuel, petroleum rocket fuels, synthetic natural gas feedstocks, and specialty oils.
Motor gasoline blending components: Naphtha (e.g., straight‐run gasoline, alkylate, reformate, benzene, toluene, xylene) used for blending or compounding into finished motor gasoline. These components include reformulated gasoline blendstock (RBOB) but exclude oxygenates (alcohols, ethers), butane, and natural gasoline. Note: Oxygenates are reported as individual components and are included in the total for other hydrocarbons, hydrogens, and oxygenates.
Motor gasoline, conventional: Finished motor gasoline not included in the oxygenated or reformulated motor gasoline categories. Note: This category excludes reformulated gasoline blendstock for oxygenate blending (RBOB) as well as other blendstock. Conventional motor gasoline can be leaded or unleaded; regular, midgrade, or premium. See Motor gasoline grades.
Motor gasoline (finished): A complex mixture of relatively volatile hydrocarbons with or without small quantities of additives, blended to form a fuel suitable for use in spark‐ignition engines. Motor gasoline, as defined in ASTM Specification D 4814 or Federal Specification VV‐G‐1690C, is characterized as having a boiling range of 122 to 158 degrees Fahrenheit at the 10 percent recovery point to 365 to 374 degrees Fahrenheit at the 90 percent recovery point. Motor gasoline includes conventional gasoline; all types of oxygenated gasoline, including gasohol; and reformulated gasoline, but excludes aviation gasoline. Note: Volumetric data on blending components, such as oxygenates, are not counted in data on finished motor gasoline until the blending components are blended into the gasoline. See Motor gasoline, conventional; Motor gasoline, oxygenated; and Motor gasoline, reformulated.
Motor gasoline grades: The classification of gasoline by octane ratings. Each type of gasoline (conventional, oxygenated, and reformulated) is classified by three grades: regular, midgrade, and premium. Note: Gasoline sales are reported by grade in accordance with their classification at the time of sale. In general, automotive octane requirements are lower at high altitudes. Therefore, in some areas of the United States, such as the Rocky Mountain States, the octane ratings for the gasoline grades may be 2 or more octane points lower.
Regular Gasoline: Gasoline having an antiknock index, i.e., octane rating, greater than or equal to 85 and less than 88. Note: Octane requirements may vary by altitude. See Motor gasoline grades.
Midgrade Gasoline: Gasoline having an antiknock index, i.e., octane rating, greater than or equal to 88 and less than or equal to 90. Note: Octane requirements may vary by altitude. See Motor gasoline grades.
Premium Gasoline: Gasoline having an antiknock index, i.e., octane rating, greater than 90. Note: Octane requirements may vary by altitude. See Motor gasoline grades.
Motor gasoline, oxygenated: Finished motor gasoline, other than reformulated gasoline, having an oxygen content

U. S. Energy Information Administration / Monthly Energy Review March 2019 255
of 2.7 percent or higher by weight and required by the U.S. Environmental Protection Agency (EPA) to be sold in areas designated by EPA as carbon monoxide (CO) nonattainment areas. Note: Oxygenated gasoline excludes oxygenated fuels program reformulated gasoline (OPRG) and reformulated gasoline blendstock for oxygenate blending (RBOB). Data on gasohol that has at least 2.7 percent oxygen, by weight, and is intended for sale inside CO nonattainment areas are included in data on oxygenated gasoline. Other data on gasohol are included in data on conventional gasoline.
Motor gasoline, reformulated: Finished motor gasoline formulated for use in motor vehicles, the composition and properties of which meet the requirements of the reformulated gasoline regulations promulgated by the U.S. Environmental Protection Agency under Section 211(k) of the Clean Air Act. Note: This category includes oxygenated fuels program reformulated gasoline (OPRG) but excludes reformulated gasoline blendstock for oxygenate blending (RBOB).
Motor gasoline retail prices: Motor gasoline prices calculated each month by the Bureau of Labor Statistics (BLS) in conjunction with the construction of the Consumer Price Index (CPI). Those prices are collected in 85 urban areas selected to represent all urban consumers‐about 80 percent of the total U.S. population. The service stations are selected initially, and on a replacement basis, in such a way that they represent the purchasing habits of the CPI population. Service stations in the current sample include those providing all types of service (i.e., full‐, mini‐, and self‐ service).
Motor gasoline (total): For stock level data, a sum including finished motor gasoline stocks plus stocks of motor gasoline blending components but excluding stocks of oxygenates.
MTBE: See Methyl tertiary butyl ether.
NAICS (North American Industry Classification System): A coding system developed jointly by the United States, Canada, and Mexico to classify businesses and industries according to the type of economic activity in which they are engaged. NAICS replaces the Standard Industrial Classification (SIC) codes. For additional information on NAICS, go to http://www.census.gov/eos/www/naics/.
Naphtha: A generic term applied to a refined or partially refined petroleum fraction with an approximate boiling range between 122 degrees and 400 degrees Fahrenheit.
Natural Gas: A gaseous mixture of hydrocarbon compounds, primarily methane, used as a fuel for electricity generation and in a variety of ways in buildings, and as raw material input and fuel for industrial processes.
Natural gas, dry: Natural gas which remains after: (1) the liquefiable hydrocarbon portion has been removed from the gas stream (i.e., gas after lease, field, and/or plant separation); and (2) any volumes of nonhydrocarbon gases have been removed where they occur in sufficient quantity to render the gas unmarketable. Note: Dry natural gas is also known as consumer‐grade natural gas. The parameters for measurement are cubic feet at 60 degrees Fahrenheit and 14.73 pounds per square inch absolute.
Natural gas (dry) production: The process of producing consumer‐grade natural gas. Natural gas withdrawn from reservoirs is reduced by volumes used at the production (lease) site and by processing losses. Volumes used at the production site include (1) the volume returned to reservoirs in cycling, repressuring of oil reservoirs, and conservation operations; and (2) vented natural gas and flared natural gas. Processing losses include (1) nonhydrocarbon gases (e.g., water vapor, carbon dioxide, helium, hydrogen sulfide, and nitrogen) removed from the gas stream; and (2) gas converted to liquid form, such as lease condensate and natural gas plant liquids. Volumes of dry gas withdrawn from gas storage reservoirs are not considered part of production. Dry natural gas production equals natural gas marketed production less natural gas plant liquids production.
Natural gas liquids (NGL): A group of hydrocarbons including ethane, propane, normal butane, isobutane, and natural gasoline. Generally include natural gas plant liquids and all liquefied refinery gases except olefins. See Paraffinic hydrocarbons.
Natural gas marketed production: Gross withdrawals of natural gas from production reservoirs, less gas used for reservoir repressuring; nonhydrocarbon gases removed in treating and processing operations; and quantities of vented natural gas and flared natural gas.

256 U. S. Energy Information Administration / Monthly Energy Review March 2019
Natural gas plant liquids (NGPL): Those hydrocarbons in natural gas that are separated as liquids at natural gas processing, fractionating, and cycling plants. Products obtained include ethane, liquefied petroleum gases (propane, normal butane and isobutane), and natural gasoline. Component products may be fractionated or mixed. Lease condensate and plant condensate are excluded. Note: Some EIA publications categorize NGPL production as field production, in accordance with definitions used prior to January 2014.
Natural gas wellhead price: The wellhead price of natural gas is calculated by dividing the total reported value at the wellhead by the total quantity produced as reported by the appropriate agencies of individual producing states and the U.S. Minerals Management Service. The price includes all costs prior to shipment from the lease, including gathering and compression costs, in addition to state production, severance, and similar charges.
Natural gasoline: A commodity product commonly traded in natural gas liquids (NGL) markets that comprises liquid hydrocarbons (mostly pentanes and hexanes) and generally remains liquid at ambient temperatures and atmospheric pressure. Natural gasoline is equivalent to pentanes plus.
Net summer capacity: The maximum output, commonly expressed in kilowatts (kW) or megawatts (MW), that generating equipment can supply to system load, as demonstrated by a multi‐hour test, at the time of summer peak demand (period of June 1 through September 30). This output reflects a reduction in capacity due to electricity use for station service or auxiliaries.
Neutral zone: A 6,200 square‐mile area shared equally between Kuwait and Saudi Arabia under a 1992 agreement. The Neutral zone contains an estimated 5 billion barrels of oil and 8 trillion cubic feet of natural gas.
Nominal dollars: A measure used to express nominal price.
Nominal price: The price paid for a product or service at the time of the transaction. Nominal prices are those that have not been adjusted to remove the effect of changes in the purchasing power of the dollar; they reflect buying power in the year in which the transaction occurred.
Non‐biomass waste: Material of non‐biological origin that is a byproduct or a discarded product. “Non‐biomass waste” includes municipal solid waste from non‐biogenic sources, such as plastics, and tire‐derived fuels.
Non‐combustion use: Fossil fuels (coal, natural gas, and petroleum products) that are not burned to release energy and instead used directly as construction materials, chemical, feedstocks, lubricants, solvents, waxes, and other products.
Nonhydrocarbon gases: Typical nonhydrocarbon gases that may be present in reservoir natural gas are carbon dioxide, helium, hydrogen sulfide, and nitrogen.
Nonrenewable fuels: Fuels that cannot be easily made or "renewed," such as crude oil, natural gas, and coal.
Normal butane (C4H10): A straight‐chain saturated (paraffinic) hydrocarbon extracted from both natural gas and refinery gas streams, which is gaseous at standard temperature and pressure. It is a colorless gas that boils at a temperature of 31 degrees Fahrenheit. See Paraffinic hydrocarbons.
Nuclear electric power (nuclear power): Electricity generated by the use of the thermal energy released from the fission of nuclear fuel in a reactor.
Nuclear electric power plant: A single‐unit or multiunit facility in which heat produced in one or more reactors by the fissioning of nuclear fuel is used to drive one or more steam turbines.
Nuclear reactor: An apparatus in which a nuclear fission chain reaction can be initiated, controlled, and sustained at a specific rate. A reactor includes fuel (fissionable material), moderating material to control the rate of fission, a heavy‐ walled pressure vessel to house reactor components, shielding to protect personnel, a system to conduct heat away from the reactor, and instrumentation for monitoring and controlling the reactor's systems.
OECD: See Organization for Economic Cooperation and Development.
Offshore: That geographic area that lies seaward of the coastline. In general, the coastline is the line of ordinary low water along with that portion of the coast that is in direct contact with the open sea or the line marking the seaward limit of inland water.

U. S. Energy Information Administration / Monthly Energy Review March 2019 257
Oil: See Crude oil.
Olefinic hydrocarbons (olefins): Unsaturated hydrocarbon compounds with the general formula CnH2n containing at least one carbon‐to‐carbon double‐bond. Olefins are produced at crude oil refineries and petrochemical plants and are not naturally occurring constituents of oil and natural gas. Sometimes referred to as alkenes or unsaturated hydrocarbons. Excludes aromatics.
Olefins: See Olefinic hydrocarbons (olefins).
OPEC: See Organization of the Petroleum Exporting Countries.
Operable unit (nuclear): In the United States, a nuclear generating unit that has completed low‐power testing and been issued a full‐power operating license by the Nuclear Regulatory Commission, or equivalent permission to operate.
Organization for Economic Cooperation and Development (OECD): An international organization helping governments tackle the economic, social and governance challenges of a globalized economy. Its membership comprises about 30 member countries. With active relationships with some 70 other countries, non‐governmental organizations (NGOs) and civil society, it has a global reach. For details about the organization, see http://www.oecd.org.
Organization of the Petroleum Exporting Countries (OPEC): An intergovernmental organization whose stated objective is to "coordinate and unify the petroleum policies of member countries." It was created at the Baghdad Conference on September 10–14, 1960. Current and former members (with years of membership) include Algeria (1969 forward), Angola (2007 forward), Congo‐Brazzaville (2018 forward), Ecuador (1973–1992 and 2007 forward), Equatorial Guinea (2017 forward), Gabon (1974–1995 and 2016 forward), Indonesia (1962–2008 and 2016), Iran (1960 forward), Iraq (1960 forward), Kuwait (1960 forward), Libya (1962 forward), Nigeria (1971 forward), Qatar (1961–2018), Saudi Arabia (1960 forward), United Arab Emirates (1967 forward), and Venezuela (1960 forward).
Other hydrocarbons: Materials received by a refinery and consumed as a raw material. Includes hydrogen, coal tar derivatives, gilsonite. Excludes natural gas used for fuel or hydrogen feedstock.
Oxygenates: Substances which, when added to gasoline, increase the amount of oxygen in that gasoline blend. Ethanol, Methyl Tertiary Butyl Ether (MTBE), Ethyl Tertiary Butyl Ether (ETBE), and methanol are common oxygenates.
PAD Districts: Petroleum Administration for Defense Districts. Geographic aggregations of the 50 states and the District of Columbia into five districts for the Petroleum Administration for Defense in 1950. The districts were originally instituted for economic and geographic reasons as Petroleum Administration for War (PAW) Districts, which were established in 1942.
Paraffinic hydrocarbons: Saturated hydrocarbon compounds with the general formula CnH2n+2 containing only single bonds. Sometimes referred to as alkanes or natural gas liquids.
Pentanes plus: A mixture of liquid hydrocarbons, mostly pentanes and heavier, extracted from natural gas in a gas processing plant. Pentanes plus is equivalent to natural gasoline.
Petrochemical feedstocks: Chemical feedstocks derived from refined or partially refined petroleum fractions, principally for use in the manufacturing of chemicals, synthetic rubber, and a variety of plastics.
Petroleum: A broadly defined class of liquid hydrocarbon mixtures. Included are crude oil, lease condensate, unfinished oils, refined products obtained from the processing of crude oil, and natural gas plant liquids. Note: Volumes of finished petroleum products include nonhydrocarbon compounds, such as additives and detergents, after they have been blended into the products.
Petroleum coke: A residue high in carbon content and low in hydrogen that is the final product of thermal decomposition in the condensation process in cracking. This product is reported as marketable coke or catalyst coke. The conversion is 5 barrels (of 42 U.S. gallons each) per short ton. See Petroleum coke, Catalyst and Petroleum coke, marketable.

258 U. S. Energy Information Administration / Monthly Energy Review March 2019
Petroleum coke, catalyst: The carbonaceous residue that is deposited on the catalyst used in many catalytic operations (e.g., catalytic cracking). Carbon is deposited on the catalyst, thus deactivating the catalyst. The catalyst is reactivated by burning off the carbon producing heat and carbon dioxide (CO2). The carbonaceous residue is not recoverable as a product. See Petroleum coke.
Petroleum coke, marketable: Those grades of coke produced in delayed or fluid cokers that may be recovered as relatively pure carbon. Marketable petroleum coke may be sold as is or further purified by calcining. See Petroleum coke.
Petroleum consumption: See Products supplied (petroleum).
Petroleum imports: Imports of petroleum into the 50 states and the District of Columbia from foreign countries and from Puerto Rico, the Virgin Islands, and other U.S. territories and possessions. Included are imports for the Strategic Petroleum Reserve and withdrawals from bonded warehouses for onshore consumption, offshore bunker use, and military use. Excluded are receipts of foreign petroleum into bonded warehouses and into U.S. territories and U.S. Foreign Trade Zones.
Petroleum products: Products obtained from the processing of crude oil (including lease condensate), natural gas, and other hydrocarbon compounds. Petroleum products include unfinished oils, hydrocarbon gas liquids, aviation gasoline, motor gasoline, naphtha‐type jet fuel, kerosene‐type jet fuel, kerosene, distillate fuel oil, residual fuel oil, petrochemical feedstocks, special naphthas, lubricants, waxes, petroleum coke, asphalt, road oil, still gas, and miscellaneous products.
Petroleum stocks, primary: For individual products, quantities that are held at refineries, in pipelines, and at bulk terminals that have a capacity of 50,000 barrels or more, or that are in transit thereto. Stocks held by product retailers and resellers, as well as tertiary stocks held at the point of consumption, are excluded. Stocks of individual products held at gas processing plants are excluded from individual product estimates but are included in other oils estimates and total.
Pipeline fuel: Gas consumed in the operation of pipelines, primarily in compressors.
Plant condensate: Liquid hydrocarbons recovered at inlet separators or scrubbers in natural gas processing plants at atmospheric pressure and ambient temperatures. Mostly pentanes and heavier hydrocarbons.
Primary energy: Energy in the form that it is first accounted for in a statistical energy balance, before any transformation to secondary or tertiary forms of energy. For example, coal can be converted to synthetic gas, which can be converted to electricity; in this example, coal is primary energy, synthetic gas is secondary energy, and electricity is tertiary energy. See Primary energy production and Primary energy consumption.
Primary energy consumption: Consumption of primary energy. The U.S. Energy Information Administration includes the following in U.S. primary energy consumption: coal consumption; coal coke net imports; petroleum consumption (petroleum products supplied); dry natural gas—excluding supplemental gaseous fuels—consumption; nuclear electricity net generation (converted to Btu using the nuclear plants heat rate); conventional hydroelectricity net generation (converted to Btu using the average heat rate of fossil‐fuel fired plants); geothermal electricity net generation (converted to Btu using the average annual heat rate of fossil‐fueled fired plants ), geothermal heat pump energy and geothermal direct‐use energy; solar thermal and photovoltaic electricity net generation (converted to Btu using the average annual heat rate of fossil‐fueled fired plants), and solar thermal direct‐use energy; wind electricity net generation (converted to Btu using the average annual heat rate of fossil‐fueled fired plants); wood and wood‐derived fuels consumption; biomass waste consumption; fuel ethanol and biodiesel consumption; losses and co‐products from the production of fuel ethanol and biodiesel; and electricity net imports (converted to Btu using the electricity heat content of 3,412 Btu per kilowatthour). Primary energy consumption also includes all non‐combustion use of fossil fuels. See Total energy consumption. Energy sources produced from other energy sources—e.g. Coal coke from coal—are included in
primary energy consumption only if their energy content has not already been included as part of the original energy source. As a result, U.S. primary energy consumption does include net imports of coal coke, but it does not include the coal coke produced from domestic coal.
Primary energy production: Production of primary energy. The U.S. Energy Information Administration includes the following in U.S. primary energy production: coal production, waste coal supplied, and coal refuse recovery; crude oil

U. S. Energy Information Administration / Monthly Energy Review March 2019 259
and lease condensate production; natural gas plant liquids production; dry natural gas—excluding supplemental gaseous fuels— production; nuclear electricity net generation (converted to Btu using the nuclear plants heat rate); conventional hydroelectricity net generation (converted to Btu using the fossil‐fueled plants heat rate); geothermal electricity net generation (converted to Btu using the fossil‐fueled plants heat rate), and geothermal heat pump energy and geothermal direct use energy; solar thermal and photovoltaic electricity net generation (converted to Btu using the fossil‐fueled plants heat rate), and solar thermal direct use energy; wind electricity net generation (converted to Btu using the fossil‐fueled plants heat rate); wood and wood‐derived fuels production; biomass waste consumption; and biofuels feedstock.
Prime mover: The engine, turbine, water wheel, or similar machine that drives an electric generator; or, for reporting purposes, a device that converts energy to electricity directly.
Product supplied (petroleum): Approximately represents consumption of petroleum products because it measures the disappearance of these products from primary sources, i.e., refineries, natural gas‐processing plants, blending plants, pipelines, and bulk terminals. In general, product supplied of each product in any given period is computed as follows: field production, plus refinery production, plus imports, plus unaccounted‐for crude oil (plus net receipts when calculated on a PAD District basis) minus stock change, minus crude oil losses, minus refinery inputs, and minus exports.
Propane (C3H8): A straight‐chain saturated (paraffinic) hydrocarbon extracted from natural gas or refinery gas streams, which is gaseous at standard temperature and pressure. It is a colorless gas that boils at a temperature of ‐44 degrees Fahrenheit. It includes all products designated in ASTM Specification D1835 and Gas Processors Association specifications for commercial (HD‐5) propane. See Paraffinic hydrocarbons.
Propylene (C3H6): An olefinic hydrocarbon recovered from refinery or petrochemical processes, which is gaseous at standard temperature and pressure. Propylene is an important petrochemical feedstock. See Olefinic hydrocarbons (olefins).
Real dollars: These are dollars that have been adjusted for inflation.
Real price: A price that has been adjusted to remove the effect of changes in the purchasing power of the dollar. Real prices, which are expressed in constant dollars, usually reflect buying power relative to a base year.
Refiner acquisition cost of crude oil: The cost of crude oil to the refiner, including transportation and fees. The composite cost is the weighted average of domestic and imported crude oil costs.
Refinery and blender net inputs: Raw materials, unfinished oils, and blending components processed at refineries, or blended at refineries or petroleum storage terminals to produce finished petroleum products. Included are gross inputs of crude oil, natural gas liquids, other hydrocarbon raw materials, hydrogen, oxygenates (excluding fuel ethanol), and renewable fuels (including fuel ethanol). Also included are net inputs of unfinished oils, motor gasoline blending components, and aviation gasoline blending components. Net inputs are calculated as gross inputs minus gross production. Negative net inputs indicate gross inputs are less than gross production. Examples of negative net inputs include reformulated gasoline blendstock for oxygenate blending (RBOB) produced at refineries for shipment to blending terminals, and unfinished oils produced and added to inventory in advance of scheduled maintenance of a refinery crude oil distillation unit.
Refinery and blender net production: Liquefied refinery gases, and finished petroleum products produced at a refinery or petroleum storage terminal blending facility. Net production equals gross production minus gross inputs. Negative net production indicates gross production is less than gross inputs for a finished petroleum product. Examples of negative net production include reclassification of one finished product to another finished product, or reclassification of a finished product to unfinished oils or blending components.
Refinery gas: Still gas consumed as refinery fuel.
Refinery (petroleum): An installation that manufactures finished petroleum products from crude oil, unfinished oils, natural gas liquids, other hydrocarbons, and alcohol. Refuse mine: A surface site where coal is recovered from previously mined coal. It may also be known as a silt bank, culm bank, refuse bank, slurry dam, or dredge operation.

260 U. S. Energy Information Administration / Monthly Energy Review March 2019
Refuse recovery: The recapture of coal from a refuse mine or the coal recaptured by that process. The resulting product has been cleaned to reduce the concentration of noncombustible materials.
Renewable diesel fuel: See Biomass‐based diesel fuel and Renewable diesel fuel (other).
Renewable diesel fuel (other): Diesel fuel and diesel fuel blending components produced from renewable sources that are coprocessed with petroleum feedstocks and meet requirements of advanced biofuels. Note: This category "other" pertains to the petroleum supply data system. See Biomass‐based diesel fuel.
Renewable energy: Energy obtained from sources that are essentially inexhaustible (unlike, for example, the fossil fuels, of which there is a finite supply). Renewable sources of energy include conventional hydroelectric power, biomass, geothermal, solar, and wind.
Renewable fuels except fuel ethanol: See Biomass‐based diesel fuel, Renewable diesel fuel (other), and Renewable fuels (other).
Renewable fuels (other): Fuels and fuel blending components, except biomass‐based diesel fuel, renewable diesel fuel (other), and fuel ethanol, produced from renewable biomass. Note: This category "other" pertains to the petroleum supply data system.
Repressuring: The injection of a pressurized fluid (such as air, gas, or water) into oil and gas reservoir formations to effect greater ultimate recovery.
Residential sector: An energy‐consuming sector that consists of living quarters for private households. Common uses of energy associated with this sector include space heating, water heating, air conditioning, and lighting, refrigeration, cooking, and running a variety of other appliances. The residential sector excludes institutional living quarters. See End‐use sectors and Energy‐use sectors.
Residual fuel oil: A general classification for the heavier oils, known as No. 5 and No. 6 fuel oils, that remain after the distillate fuel oils and lighter hydrocarbons are distilled away in refinery operations. It conforms to ASTM Specifications D 396 and D 975 and Federal Specification VV‐F‐815C. No. 5, a residual fuel oil of medium viscosity, is also known as Navy Special and is defined in Military Specification MIL‐F‐859E, including Amendment 2 (NATO Symbol F‐770). It is used in steam‐powered vessels in government service and inshore power plants. No. 6 fuel oil includes Bunker C fuel oil and is used for the production of electric power, space heating, vessel bunkering, and various industrial purposes.
Road oil: Any heavy petroleum oil, including residual asphaltic oil used as a dust palliative and surface treatment on roads and highways. It is generally produced in six grades, from 0, the most liquid, to 5, the most viscous.
Rotary rig: A machine used for drilling wells that employs a rotating tube attached to a bit for boring holes through rock.
Short ton (coal): A unit of weight equal to 2,000 pounds.
SIC (Standard Industrial Classification): A set of codes developed by the U.S. Office of Management and Budget which categorizes industries into groups with similar economic activities. Replaced by NAICS (North American Industry Classification System).
Small‐scale: Generators at a site that has a total generating nameplate capacity of less than 1 megawatt (MW).
Solar energy: See Solar photovoltaic (PV) energy and Solar thermal energy.
Solar photovoltaic (PV) energy: Energy, radiated by the sun that is converted into direct‐current electricity by solar photovoltaic cells. Examples of solar PV technologies include solar panels on residential and commercial rooftops (generally small‐scale solar PV energy) and mirrors or dishes that concentrate solar rays onto solar PV panels (concentrating PV or CPV). Utility‐scale solar PV electric generation typically relies on installations of solar PV panels on or near the ground (solar farms).
Solar thermal energy: Energy, radiated by the sun that is converted into electricity or heat by means of solar

U. S. Energy Information Administration / Monthly Energy Review March 2019 261
concentrating collectors. Examples of solar thermal energy technologies include pool heaters, dark water bladders, or thermal panels (generally small‐scale solar thermal energy). Utility‐scale solar thermal electric generation typically relies on a large array of mirrors to heat fluids and turn a turbine, which generates electricity.
Special naphthas: All finished products within the naphtha boiling range that are used as paint thinners, cleaners, or solvents. These products are refined to a specified flash point. Special naphthas include all commercial hexane and cleaning solvents conforming to ASTM Specification D1836 and D484, respectively. Naphthas to be blended or marketed as motor gasoline or aviation gasoline, or that are to be used as petrochemical and synthetic natural gas (SNG) feedstocks are excluded.
Station use: Energy that is used to operate an electric power plant. It includes energy consumed for plant lighting, power, and auxiliary facilities, regardless of whether the energy is produced at the plant or comes from another source.
Steam coal: All nonmetallurgical coal.
Steam‐electric power plant: A plant in which the prime mover is a steam turbine. The steam used to drive the turbine is produced in a boiler where fossil fuels are burned.
Still gas: Any form or mixture of gases produced in refineries by distillation, cracking, reforming, and other processes. The principal constituents are methane and ethane. May contain hydrogen and small/trace amounts of other gases. Still gas is typically consumed as refinery fuel or used as petrochemical feedstock. Still gas burned for refinery fuel may differ in composition from marketed still gas sold to other users. See Refinery gas.
Stocks: See Coal stocks, Crude oil stocks, or Petroleum stocks, primary.
Strategic Petroleum Reserve (SPR): Petroleum stocks maintained by the federal Government for use during periods of major supply interruption.
Subbituminous coal: A coal whose properties range from those of lignite to those of bituminous coal and used primarily as fuel for steam‐electric power generation. It may be dull, dark brown to black, soft and crumbly, at the lower end of the range, to bright, jet black, hard, and relatively strong, at the upper end. Subbituminous coal contains 20 to 30 percent inherent moisture by weight. The heat content of subbituminous coal ranges from 17 to 24 million Btu per short ton on a moist, mineral‐matter‐free basis. The heat content of subbituminous coal consumed in the United States averages 17 to 18 million Btu per ton, on the as‐received basis (i.e., containing both inherent moisture and mineral matter).
Supplemental gaseous fuels: Synthetic natural gas, propane‐air, coke oven gas, still gas (refinery gas), biomass gas, air injected for Btu stabilization, and manufactured gas commingled and distributed with natural gas.
Synthetic natural gas (SNG): (Also referred to as substitute natural gas) A manufactured product, chemically similar in most respects to natural gas, resulting from the conversion or reforming of hydrocarbons that may easily be substituted for or interchanged with pipeline‐quality natural gas.
Thermal conversion factor: A factor for converting data between physical units of measure (such as barrels, cubic feet, or short tons) and thermal units of measure (such as British thermal units, calories, or joules); or for converting data between different thermal units of measure. See Btu conversion factor.
Total energy consumption: Primary energy consumption in the end‐use sectors, plus electricity retail sales and electrical system energy losses.
Transportation sector: An energy‐consuming sector that consists of all vehicles whose primary purpose is transporting people and/or goods from one physical location to another. Included are automobiles; trucks; buses; motorcycles; trains, subways, and other rail vehicles; aircraft; and ships, barges, and other waterborne vehicles. Vehicles whose primary purpose is not transportation (e.g., construction cranes and bulldozers, farming vehicles, and warehouse tractors and forklifts) are classified in the sector of their primary use. See End‐use sectors and Energy‐use sectors.
Underground storage: The storage of natural gas in underground reservoirs at a different location from which it was

262 U. S. Energy Information Administration / Monthly Energy Review March 2019
produced.
Unfinished oils: All oils requiring further processing, except those requiring only mechanical blending. Unfinished oils are produced by partial refining of crude oil and include naphthas and lighter oils, kerosene and light gas oils, heavy gas oils, and residuum.
Unfractionated streams: Mixtures of unsegregated natural gas liquids components, excluding those in plant condensate. This product is extracted from natural gas.
Union of Soviet Socialist Republics (U.S.S.R.): A political entity that consisted of 15 constituent republics: Armenia, Azerbaijan, Belarus, Estonia, Georgia, Kazakhstan, Kyrgyzstan, Latvia, Lithuania, Moldova, Russia, Tajikistan, Turkmenistan, Ukraine, and Uzbekistan. The U.S.S.R. ceased to exist as of December 31, 1991.
United States: The 50 states and the District of Columbia. Note: The United States has varying degrees of jurisdiction over a number of territories and other political entities outside the 50 states and the District of Columbia, including Puerto Rico, the U.S. Virgin Islands, Guam, American Samoa, Johnston Atoll, Midway Islands, Wake Island, and the Northern Mariana Islands. EIA data programs may include data from some or all of these areas in U.S. totals. For these programs, data products will contain notes explaining the extent of geographic coverage included under the term "United States."
Uranium: A heavy, naturally radioactive, metallic element (atomic number 92). Its two principally occurring isotopes are uranium‐235 and uranium‐238. Uranium‐235 is indispensable to the nuclear industry because it is the only isotope existing in nature, to any appreciable extent, that is fissionable by thermal neutrons. Uranium238 is also important because it absorbs neutrons to produce a radioactive isotope that subsequently decays to the isotope plutonium‐239, which also is fissionable by thermal neutrons.
Uranium concentrate: A yellow or brown powder obtained by the milling of uranium ore, processing of in situ leach mining solutions, or as a byproduct of phosphoric acid production. See Uranium oxide.
Uranium ore: Rock containing uranium mineralization in concentrations that can be mined economically, typically one to four pounds of uranium oxide (U3O8) per ton or 0.05 percent to 0.2 percent U3O8.
Uranium oxide (U3O8): Uranium concentrate or yellowcake.
Useful thermal output: The thermal energy made available in a combined‐heat‐and‐power system for use in any industrial or commercial process, heating or cooling application, or delivered to other end users, i.e., total thermal energy made available for processes and applications other than electrical generation.
U.S.S.R.: See Union of Soviet Socialist Republics (U.S.S.R.).
Utility‐scale: Generators at a site that has a total generating nameplate capacity of 1 megawatt (MW) or more.
Vented natural gas: Natural gas released into the air on the production site or at processing plants.
Vessel bunkering: Includes sales for the fueling of commercial or private boats, such as pleasure craft, fishing boats, tugboats, and ocean‐going vessels, including vessels operated by oil companies. Excluded are volumes sold to the U.S. Armed Forces.
Waste: See Biomass waste and Non‐biomass waste.
Waste coal: Usable material that is a byproduct of previous coal processing operations. Waste coal is usually composed of mixed coal, soil, and rock (mine waste). Most waste coal is burned as‐is in unconventional fluidized‐bed combustors. For some uses, waste coal may be partially cleaned by removing some extraneous noncombustible constituents. Examples of waste coal include fine coal, coal obtained from a refuse bank or slurry dam, anthracite culm, bituminous gob, and lignite waste.
Watt (W): The unit of electrical power equal to one ampere under a pressure of one volt. A watt is equal to 1/746

U. S. Energy Information Administration / Monthly Energy Review March 2019 263
horsepower.
Watthour (Wh): The electrical energy unit of measure equal to one watt of power supplied to, or taken from, an electric circuit steadily for one hour.
Wax: A solid or semi‐solid material consisting of a mixture of hydrocarbons obtained or derived from petroleum fractions, or through a Fischer‐Tropsch type process, in which the straight‐chained paraffin series predominates. This includes all marketable wax, whether crude or refined, with a congealing point (ASTM D 938) between 100 and 200 degrees Fahrenheit and a maximum oil content (ASTM D 3235) of 50 weight percent.
Wellhead price: The value of crude oil or natural gas at the mouth of the well.
Wind energy: Kinetic energy present in wind motion that can be converted to mechanical energy for driving pumps, mills, and electric power generators.
Wood and wood‐derived fuels: Wood and products derived from wood that are used as fuel, including round wood (cord wood), limb wood, wood chips, bark, sawdust, forest residues, charcoal, paper pellets, railroad ties, utility poles, black liquor, red liquor, sludge wood, spent sulfite liquor, densified biomass (including wood pellets), and other wood‐ based solids and liquids.
Working gas: The quantity of natural gas in the reservoir that is in addition to the cushion or base gas. It may or may not be completely withdrawn during any particular withdrawal season. Conditions permitting, the total working capacity could be used more than once during any season. Volumes of working gas are reported in thousand cubic feet at standard temperature and pressure.

THIS PAGE INTENTIONALLY LEFT BLANK