monthly dashboard: sample saas business
TRANSCRIPT
1 / © 2018 by Driven Insights LLC. All Rights Reserved. Confidential. DRIVENINSIGHTS.COM / 978.632.9800
GROW WITH CONFIDENCE
GROW WITH CONFIDENCE
MONTHLY DASHBOARD:
SAMPLE SAAS BUSINESS
Driven Insights:
Your Outsourced Finance Department
2 / © 2018 by Driven Insights LLC. All Rights Reserved. Confidential. DRIVENINSIGHTS.COM / 978.632.9800
GROW WITH CONFIDENCEIS YOUR DASHBOARD WORTHY?
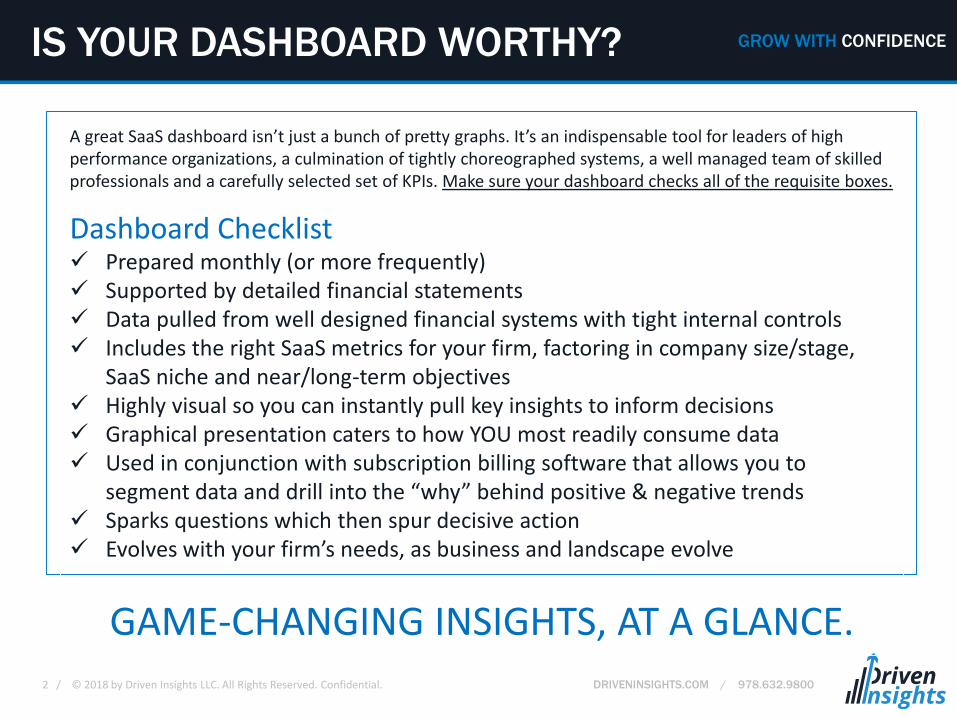
A great SaaS dashboard isn’t just a bunch of pretty graphs. It’s an indispensable tool for leaders of high performance organizations, a culmination of tightly choreographed systems, a well managed team of skilled professionals and a carefully selected set of KPIs. Make sure your dashboard checks all of the requisite boxes.
Dashboard Checklist✓ Prepared monthly (or more frequently)✓ Supported by detailed financial statements✓ Data pulled from well designed financial systems with tight internal controls✓ Includes the right SaaS metrics for your firm, factoring in company size/stage,
SaaS niche and near/long-term objectives✓ Highly visual so you can instantly pull key insights to inform decisions✓ Graphical presentation caters to how YOU most readily consume data✓ Used in conjunction with subscription billing software that allows you to
segment data and drill into the “why” behind positive & negative trends✓ Sparks questions which then spur decisive action✓ Evolves with your firm’s needs, as business and landscape evolve
GAME-CHANGING INSIGHTS, AT A GLANCE.
3 / © 2018 by Driven Insights LLC. All Rights Reserved. Confidential. DRIVENINSIGHTS.COM / 978.632.9800
GROW WITH CONFIDENCESAMPLE SAAS DASHBOARD INTRO
Many SaaS key performance indicators (KPIs) are growth stage-specific. This sample dashboard presents a representative KPI mix that applies
across the various growth stages to help bring this mission critical tool to life for a wider audience.
Moreover, each KPI is for a different fictitious business so they don’t all tie together.
If you get tripped up by an acronym at any point, refer to the glossary at the end.
As you review this sample dashboard, imagine the impact a dashboard made for your SaaS business would have on your decision making.
Slide Tip: On each slide of this sample SaaS dashboard, we’ll provide a brief narrative to highlight
the type of dialog a well designed dashboard triggers, month after month.
4 / © 2018 by Driven Insights LLC. All Rights Reserved. Confidential. DRIVENINSIGHTS.COM / 978.632.9800
GROW WITH CONFIDENCESAMPLE DASHBOARD CONTENTS
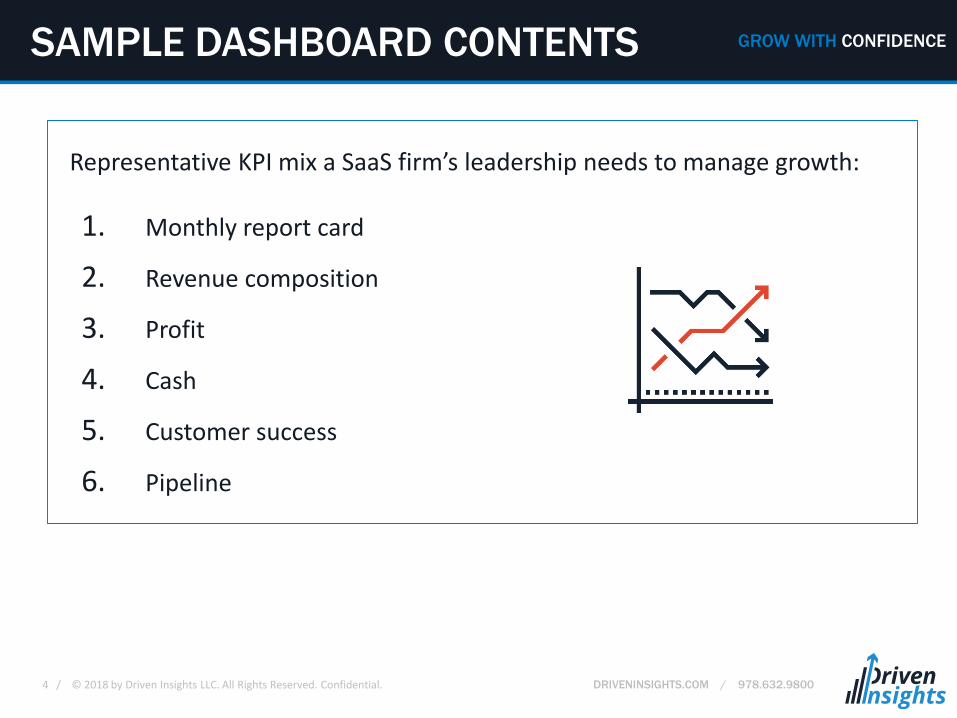
1. Monthly report card
2. Revenue composition
3. Profit
4. Cash
5. Customer success
6. Pipeline
Representative KPI mix a SaaS firm’s leadership needs to manage growth:
5 / © 2018 by Driven Insights LLC. All Rights Reserved. Confidential. DRIVENINSIGHTS.COM / 978.632.9800
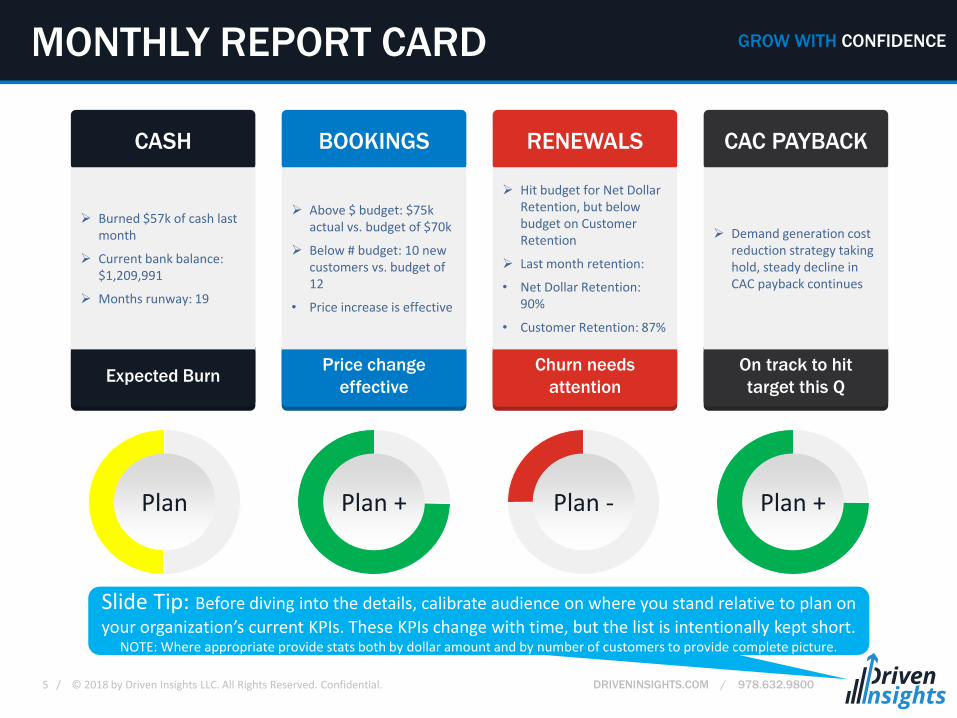
GROW WITH CONFIDENCEMONTHLY REPORT CARD
CASH
Expected Burn
➢ Burned $57k of cash last month
➢ Current bank balance: $1,209,991
➢ Months runway: 19
BOOKINGS
Price change
effective
➢ Above $ budget: $75k actual vs. budget of $70k
➢ Below # budget: 10 new customers vs. budget of 12
• Price increase is effective
RENEWALS
Churn needs
attention
➢ Hit budget for Net Dollar Retention, but below budget on Customer Retention
➢ Last month retention:
• Net Dollar Retention: 90%
• Customer Retention: 87%
CAC PAYBACK
On track to hit
target this Q
➢ Demand generation cost reduction strategy taking hold, steady decline in CAC payback continues
Plan + Plan -Plan Plan +
Slide Tip: Before diving into the details, calibrate audience on where you stand relative to plan on
your organization’s current KPIs. These KPIs change with time, but the list is intentionally kept short.NOTE: Where appropriate provide stats both by dollar amount and by number of customers to provide complete picture.
6 / © 2018 by Driven Insights LLC. All Rights Reserved. Confidential. DRIVENINSIGHTS.COM / 978.632.9800
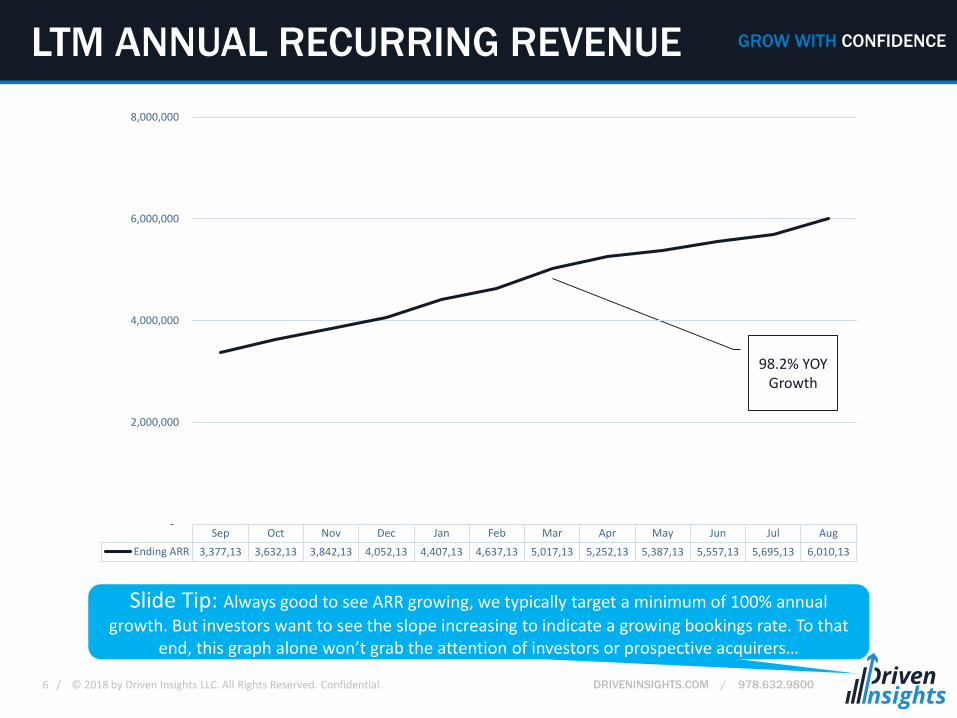
GROW WITH CONFIDENCELTM ANNUAL RECURRING REVENUE
Slide Tip: Always good to see ARR growing, we typically target a minimum of 100% annual
growth. But investors want to see the slope increasing to indicate a growing bookings rate. To that end, this graph alone won’t grab the attention of investors or prospective acquirers…
98.2% YOY Growth
Sep Oct Nov Dec Jan Feb Mar Apr May Jun Jul Aug
Ending ARR 3,377,13 3,632,13 3,842,13 4,052,13 4,407,13 4,637,13 5,017,13 5,252,13 5,387,13 5,557,13 5,695,13 6,010,13
-
2,000,000
4,000,000
6,000,000
8,000,000

7 / © 2018 by Driven Insights LLC. All Rights Reserved. Confidential. DRIVENINSIGHTS.COM / 978.632.9800
GROW WITH CONFIDENCENEW QUARTERLY BOOKINGS
Slide Tip: Investors want to see that you’ve developed a repeatable, scalable sales process. This graph strips out
existing ARR to focus exclusively on new bookings so you see highlight bookings growth (or lack thereof).
-
500,000
1,000,000
1,500,000
2,000,000
2,500,000
3,000,000
3,500,000
Q1-Yr 1 Q2-Yr 1 Q3-Yr 1 Q4-Yr 1 Q1-Yr 2 Q2-Yr 2 Q3-Yr 2 Q4-Yr 2 Q1-Yr 3 Q2-Yr 3 Q3-Yr 3 Q4-Yr 3
Recurring Revenue Non Recurring Revenue
8 / © 2018 by Driven Insights LLC. All Rights Reserved. Confidential. DRIVENINSIGHTS.COM / 978.632.9800
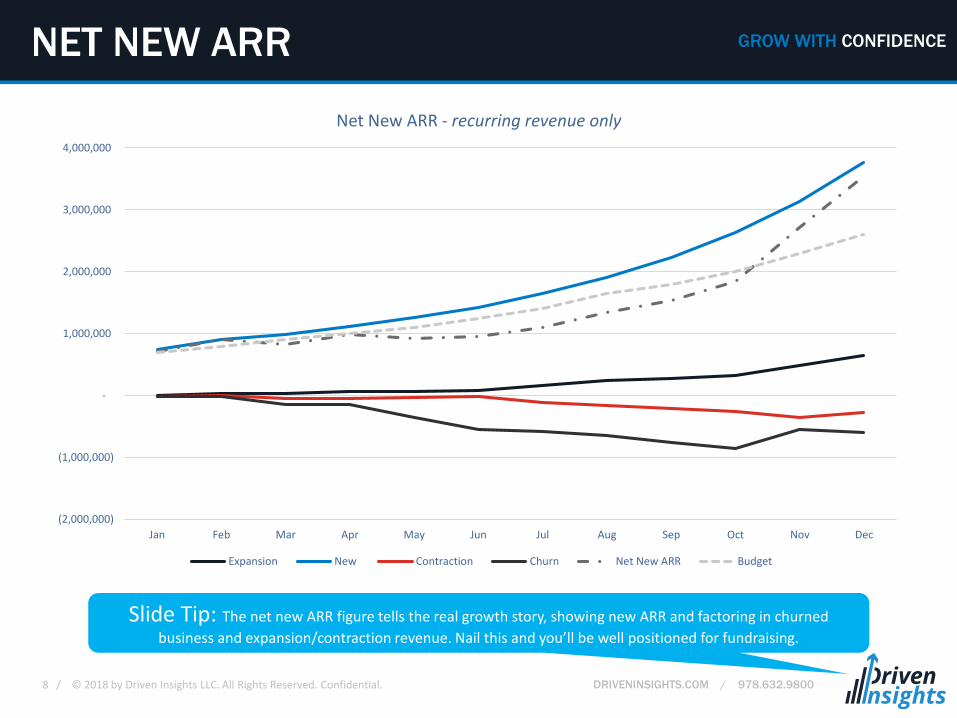
GROW WITH CONFIDENCENET NEW ARR
Slide Tip: The net new ARR figure tells the real growth story, showing new ARR and factoring in churned
business and expansion/contraction revenue. Nail this and you’ll be well positioned for fundraising.
(2,000,000)
(1,000,000)
-
1,000,000
2,000,000
3,000,000
4,000,000
Jan Feb Mar Apr May Jun Jul Aug Sep Oct Nov Dec
Net New ARR - recurring revenue only
Expansion New Contraction Churn Net New ARR Budget

9 / © 2018 by Driven Insights LLC. All Rights Reserved. Confidential. DRIVENINSIGHTS.COM / 978.632.9800
GROW WITH CONFIDENCECHURN AS % OF NET NEW ARR
Slide Tip: Churn analysis is a critical component of understanding the health of your SaaS firm.
Here we see a disturbing trend, worth drilling into by segment/cohort to identify root cause.
0%
1%
1%
2%
2%
3%
3%
4%
4%
5%
Jan Feb Mar Apr May Jun Jul Aug Sep Oct Nov Dec
Churn as %
10 / © 2018 by Driven Insights LLC. All Rights Reserved. Confidential. DRIVENINSIGHTS.COM / 978.632.9800
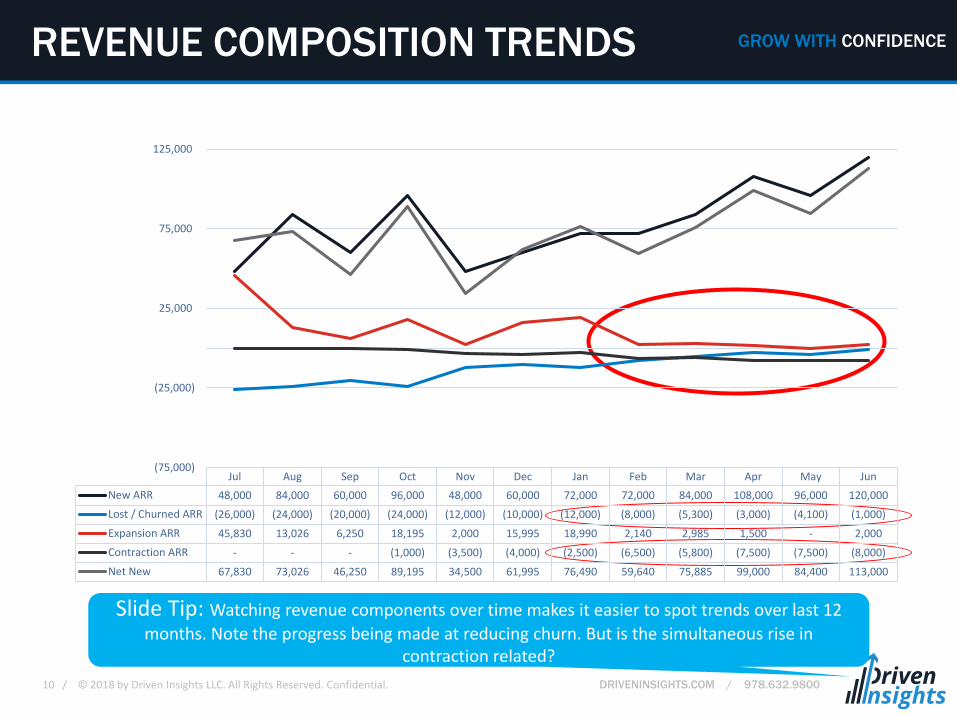
GROW WITH CONFIDENCEREVENUE COMPOSITION TRENDS
Slide Tip: Watching revenue components over time makes it easier to spot trends over last 12
months. Note the progress being made at reducing churn. But is the simultaneous rise in contraction related?
Jul Aug Sep Oct Nov Dec Jan Feb Mar Apr May Jun
New ARR 48,000 84,000 60,000 96,000 48,000 60,000 72,000 72,000 84,000 108,000 96,000 120,000
Lost / Churned ARR (26,000) (24,000) (20,000) (24,000) (12,000) (10,000) (12,000) (8,000) (5,300) (3,000) (4,100) (1,000)
Expansion ARR 45,830 13,026 6,250 18,195 2,000 15,995 18,990 2,140 2,985 1,500 - 2,000
Contraction ARR - - - (1,000) (3,500) (4,000) (2,500) (6,500) (5,800) (7,500) (7,500) (8,000)
Net New 67,830 73,026 46,250 89,195 34,500 61,995 76,490 59,640 75,885 99,000 84,400 113,000
(75,000)
(25,000)
25,000
75,000
125,000
11 / © 2018 by Driven Insights LLC. All Rights Reserved. Confidential. DRIVENINSIGHTS.COM / 978.632.9800
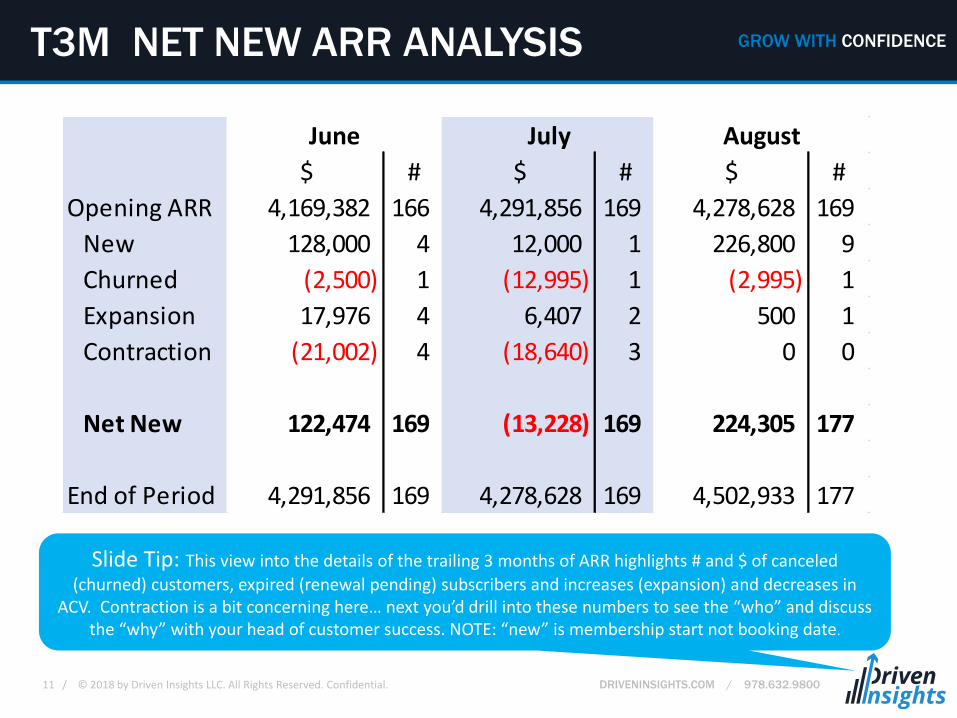
GROW WITH CONFIDENCET3M NET NEW ARR ANALYSIS
Slide Tip: This view into the details of the trailing 3 months of ARR highlights # and $ of canceled
(churned) customers, expired (renewal pending) subscribers and increases (expansion) and decreases in ACV. Contraction is a bit concerning here… next you’d drill into these numbers to see the “who” and discuss
the “why” with your head of customer success. NOTE: “new” is membership start not booking date.
$ # $ # $ #
Opening ARR 4,169,382 166 4,291,856 169 4,278,628 169
New 128,000 4 12,000 1 226,800 9
Churned (2,500) 1 (12,995) 1 (2,995) 1
Expansion 17,976 4 6,407 2 500 1
Contraction (21,002) 4 (18,640) 3 0 0
Net New 122,474 169 (13,228) 169 224,305 177
End of Period 4,291,856 169 4,278,628 169 4,502,933 177
June July August
12 / © 2018 by Driven Insights LLC. All Rights Reserved. Confidential. DRIVENINSIGHTS.COM / 978.632.9800
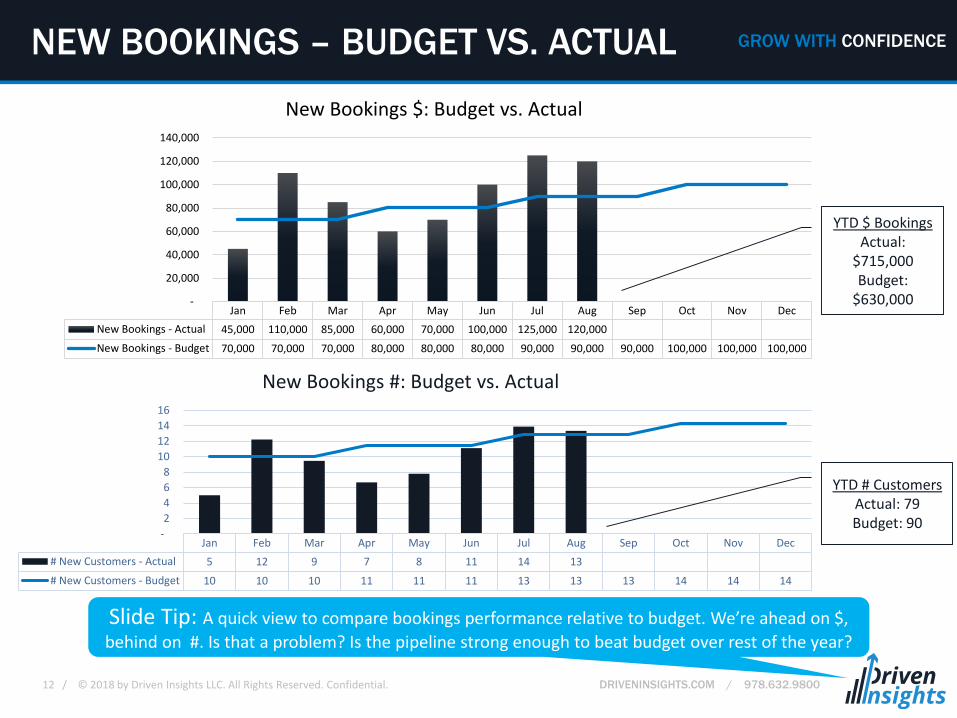
GROW WITH CONFIDENCENEW BOOKINGS – BUDGET VS. ACTUAL
Jan Feb Mar Apr May Jun Jul Aug Sep Oct Nov Dec
New Bookings - Actual 45,000 110,000 85,000 60,000 70,000 100,000 125,000 120,000
New Bookings - Budget 70,000 70,000 70,000 80,000 80,000 80,000 90,000 90,000 90,000 100,000 100,000 100,000
-
20,000
40,000
60,000
80,000
100,000
120,000
140,000
New Bookings $: Budget vs. Actual
Jan Feb Mar Apr May Jun Jul Aug Sep Oct Nov Dec
# New Customers - Actual 5 12 9 7 8 11 14 13
# New Customers - Budget 10 10 10 11 11 11 13 13 13 14 14 14
-
2
4
6
8
10
12
14
16
New Bookings #: Budget vs. Actual
Slide Tip: A quick view to compare bookings performance relative to budget. We’re ahead on $,
behind on #. Is that a problem? Is the pipeline strong enough to beat budget over rest of the year?
YTD $ BookingsActual:
$715,000Budget:
$630,000
YTD # CustomersActual: 79Budget: 90
13 / © 2018 by Driven Insights LLC. All Rights Reserved. Confidential. DRIVENINSIGHTS.COM / 978.632.9800
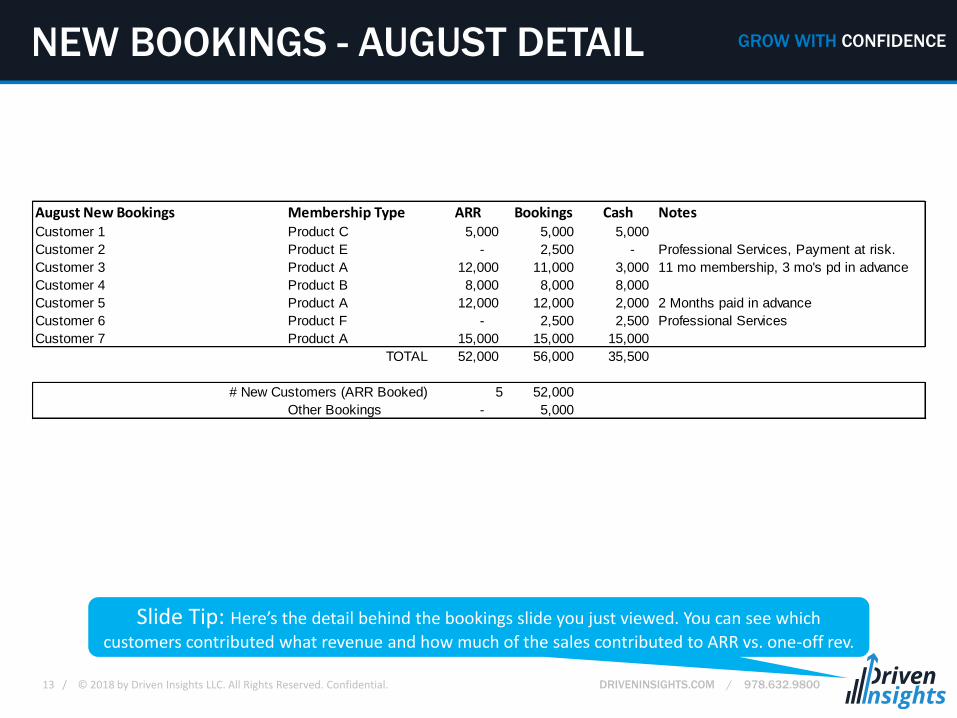
GROW WITH CONFIDENCENEW BOOKINGS - AUGUST DETAIL
Slide Tip: Here’s the detail behind the bookings slide you just viewed. You can see which
customers contributed what revenue and how much of the sales contributed to ARR vs. one-off rev.
August New Bookings Membership Type ARR Bookings Cash NotesCustomer 1 Product C 5,000 5,000 5,000
Customer 2 Product E - 2,500 - Professional Services, Payment at risk.
Customer 3 Product A 12,000 11,000 3,000 11 mo membership, 3 mo's pd in advance
Customer 4 Product B 8,000 8,000 8,000
Customer 5 Product A 12,000 12,000 2,000 2 Months paid in advance
Customer 6 Product F - 2,500 2,500 Professional Services
Customer 7 Product A 15,000 15,000 15,000
TOTAL 52,000 56,000 35,500
# New Customers (ARR Booked) 5 52,000
Other Bookings - 5,000

14 / © 2018 by Driven Insights LLC. All Rights Reserved. Confidential. DRIVENINSIGHTS.COM / 978.632.9800
GROW WITH CONFIDENCE
Jan Feb Mar Apr May Jun Jul Aug Sep Oct Nov Dec
Pending - - - - - - 15,000 30,000 - - - -
ACV $'s Renewed 67,500 85,000 66,000 80,000 80,000 80,000 40,000 64,000 - - - -
Prior Year $ 75,000 82,500 67,500 90,000 82,500 75,000 60,000 90,000 75,000 90,000 75,000 75,000
Renewals - Budget 67,500 74,250 60,750 81,000 74,250 67,500 54,000 81,000 67,500 81,000 67,500 67,500
- 10,000 20,000 30,000 40,000 50,000 60,000 70,000 80,000 90,000
100,000
$ Renewals Budget vs. Actual by Monthly Cohort
RENEWAL BOOKINGS (ANNUAL) - BUDGET VS. ACTUAL
Jan Feb Mar Apr May Jun Jul Aug Sep Oct Nov Dec
# Pending - - - - - - 2 4 - - - -
# Renewed 9 11 9 10 10 10 5 8 - - - -
# Customers Renewing 10 11 9 12 11 10 8 12 10 12 10 10
-
2
4
6
8
10
12
14
# Renewals Budget vs. Actual by Monthly Cohort
YTD $ BookingsActual:
$562,500Budget:
$560,250
YTD # CustomersActual: 72Budget: 75
Slide Tip: Now we turn our attention to renewal performance relative to budget by monthly cohort with
comparison to last year. With a goal of maximizing negative churn, a closer look at Feb and June is warranted.
15 / © 2018 by Driven Insights LLC. All Rights Reserved. Confidential. DRIVENINSIGHTS.COM / 978.632.9800
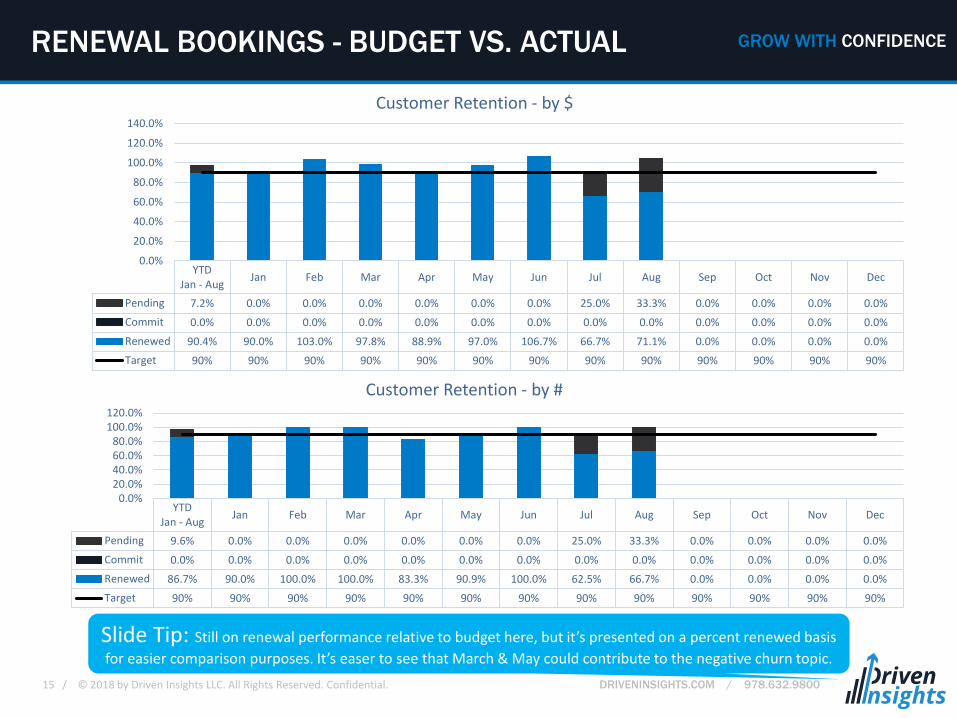
GROW WITH CONFIDENCERENEWAL BOOKINGS - BUDGET VS. ACTUAL
YTDJan - Aug
Jan Feb Mar Apr May Jun Jul Aug Sep Oct Nov Dec
Pending 7.2% 0.0% 0.0% 0.0% 0.0% 0.0% 0.0% 25.0% 33.3% 0.0% 0.0% 0.0% 0.0%
Commit 0.0% 0.0% 0.0% 0.0% 0.0% 0.0% 0.0% 0.0% 0.0% 0.0% 0.0% 0.0% 0.0%
Renewed 90.4% 90.0% 103.0% 97.8% 88.9% 97.0% 106.7% 66.7% 71.1% 0.0% 0.0% 0.0% 0.0%
Target 90% 90% 90% 90% 90% 90% 90% 90% 90% 90% 90% 90% 90%
0.0%
20.0%
40.0%
60.0%
80.0%
100.0%
120.0%
140.0%
Customer Retention - by $
YTDJan - Aug
Jan Feb Mar Apr May Jun Jul Aug Sep Oct Nov Dec
Pending 9.6% 0.0% 0.0% 0.0% 0.0% 0.0% 0.0% 25.0% 33.3% 0.0% 0.0% 0.0% 0.0%
Commit 0.0% 0.0% 0.0% 0.0% 0.0% 0.0% 0.0% 0.0% 0.0% 0.0% 0.0% 0.0% 0.0%
Renewed 86.7% 90.0% 100.0% 100.0% 83.3% 90.9% 100.0% 62.5% 66.7% 0.0% 0.0% 0.0% 0.0%
Target 90% 90% 90% 90% 90% 90% 90% 90% 90% 90% 90% 90% 90%
0.0%20.0%40.0%60.0%80.0%
100.0%120.0%
Customer Retention - by #
Slide Tip: Still on renewal performance relative to budget here, but it’s presented on a percent renewed basis
for easier comparison purposes. It’s easer to see that March & May could contribute to the negative churn topic.
16 / © 2018 by Driven Insights LLC. All Rights Reserved. Confidential. DRIVENINSIGHTS.COM / 978.632.9800
GROW WITH CONFIDENCE
Slide 16
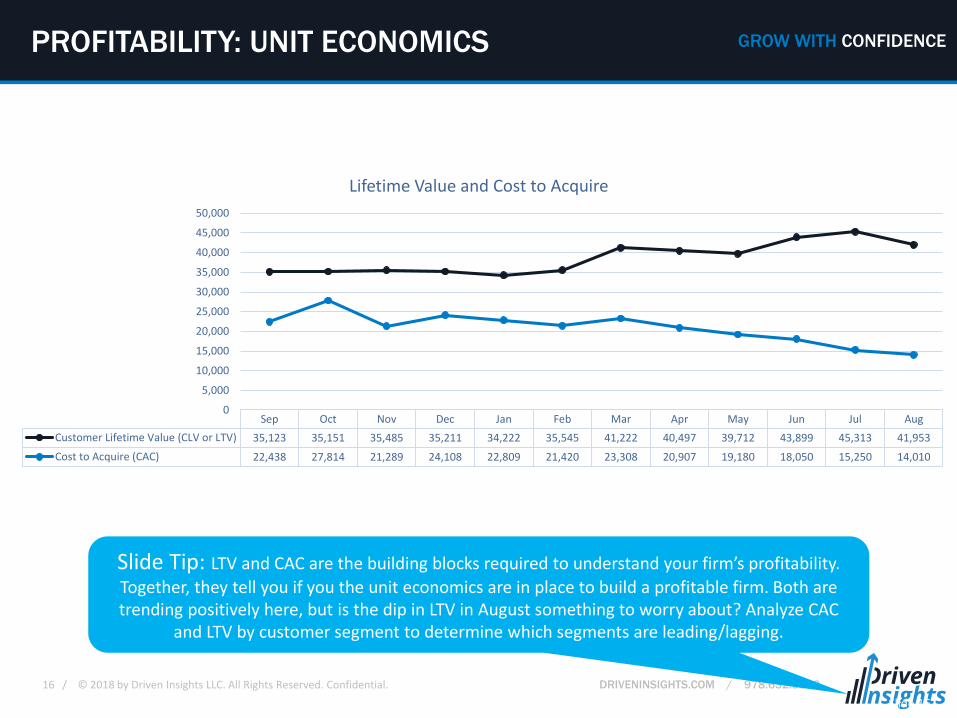
PROFITABILITY: UNIT ECONOMICS
Sep Oct Nov Dec Jan Feb Mar Apr May Jun Jul Aug
Customer Lifetime Value (CLV or LTV) 35,123 35,151 35,485 35,211 34,222 35,545 41,222 40,497 39,712 43,899 45,313 41,953
Cost to Acquire (CAC) 22,438 27,814 21,289 24,108 22,809 21,420 23,308 20,907 19,180 18,050 15,250 14,010
0
5,000
10,000
15,000
20,000
25,000
30,000
35,000
40,000
45,000
50,000
Lifetime Value and Cost to Acquire
Slide Tip: LTV and CAC are the building blocks required to understand your firm’s profitability.
Together, they tell you if you the unit economics are in place to build a profitable firm. Both are trending positively here, but is the dip in LTV in August something to worry about? Analyze CAC
and LTV by customer segment to determine which segments are leading/lagging.
17 / © 2018 by Driven Insights LLC. All Rights Reserved. Confidential. DRIVENINSIGHTS.COM / 978.632.9800
GROW WITH CONFIDENCE
Slide 17
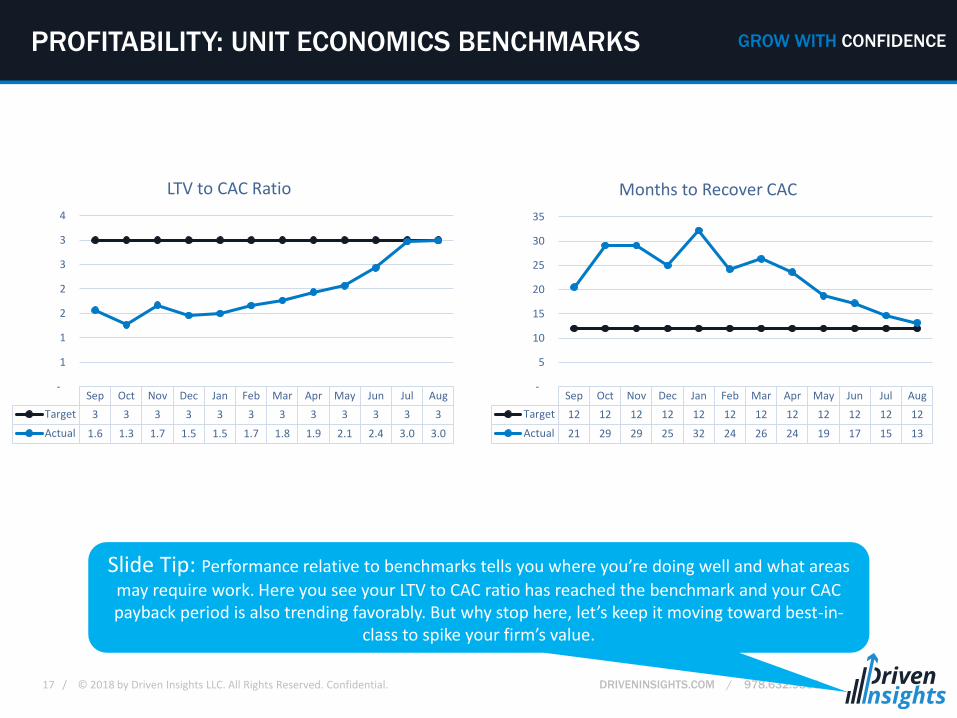
PROFITABILITY: UNIT ECONOMICS BENCHMARKS
Sep Oct Nov Dec Jan Feb Mar Apr May Jun Jul Aug
Target 3 3 3 3 3 3 3 3 3 3 3 3
Actual 1.6 1.3 1.7 1.5 1.5 1.7 1.8 1.9 2.1 2.4 3.0 3.0
-
1
1
2
2
3
3
4
LTV to CAC Ratio
Sep Oct Nov Dec Jan Feb Mar Apr May Jun Jul Aug
Target 12 12 12 12 12 12 12 12 12 12 12 12
Actual 21 29 29 25 32 24 26 24 19 17 15 13
-
5
10
15
20
25
30
35
Months to Recover CAC
Slide Tip: Performance relative to benchmarks tells you where you’re doing well and what areas
may require work. Here you see your LTV to CAC ratio has reached the benchmark and your CAC payback period is also trending favorably. But why stop here, let’s keep it moving toward best-in-
class to spike your firm’s value.
18 / © 2018 by Driven Insights LLC. All Rights Reserved. Confidential. DRIVENINSIGHTS.COM / 978.632.9800
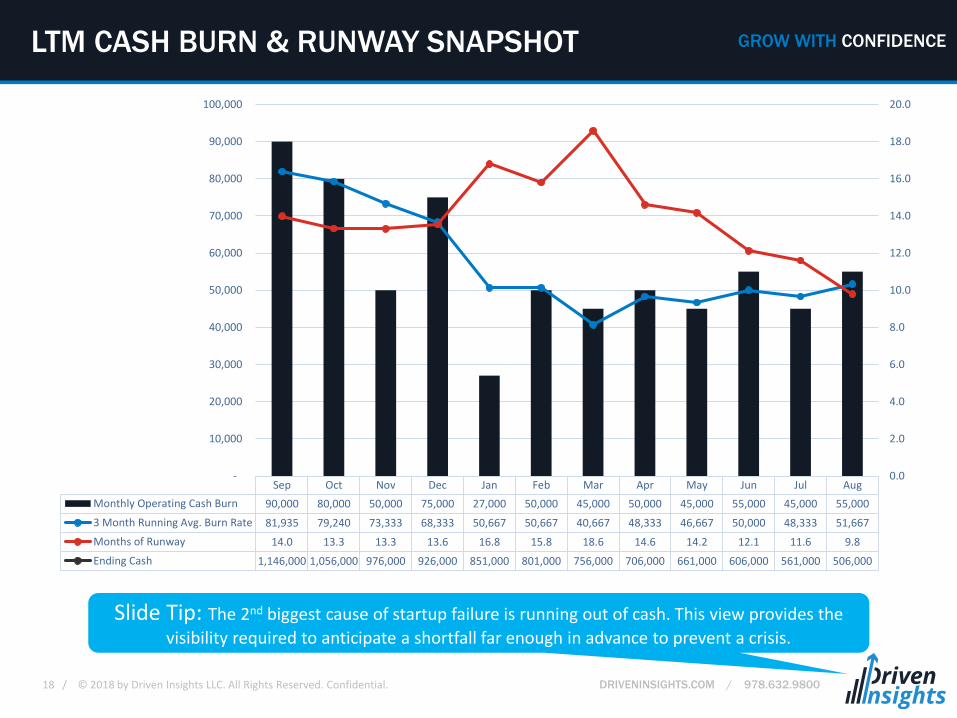
GROW WITH CONFIDENCELTM CASH BURN & RUNWAY SNAPSHOT
Slide Tip: The 2nd biggest cause of startup failure is running out of cash. This view provides the
visibility required to anticipate a shortfall far enough in advance to prevent a crisis.
Sep Oct Nov Dec Jan Feb Mar Apr May Jun Jul Aug
Monthly Operating Cash Burn 90,000 80,000 50,000 75,000 27,000 50,000 45,000 50,000 45,000 55,000 45,000 55,000
3 Month Running Avg. Burn Rate 81,935 79,240 73,333 68,333 50,667 50,667 40,667 48,333 46,667 50,000 48,333 51,667
Months of Runway 14.0 13.3 13.3 13.6 16.8 15.8 18.6 14.6 14.2 12.1 11.6 9.8
Ending Cash 1,146,000 1,056,000 976,000 926,000 851,000 801,000 756,000 706,000 661,000 606,000 561,000 506,000
0.0
2.0
4.0
6.0
8.0
10.0
12.0
14.0
16.0
18.0
20.0
-
10,000
20,000
30,000
40,000
50,000
60,000
70,000
80,000
90,000
100,000

19 / © 2018 by Driven Insights LLC. All Rights Reserved. Confidential. DRIVENINSIGHTS.COM / 978.632.9800
GROW WITH CONFIDENCEENGAGEMENT/CUSTOMER SUCCESS
Success Manager 1 Success Manager 2
Slide Tip: Behind the renewal data is client engagement. Customer success data can and should
also be captured and analyzed. Here’s a comparison of client health scores for two different success managers. What can manager 2 learn from 1?
20 / © 2018 by Driven Insights LLC. All Rights Reserved. Confidential. DRIVENINSIGHTS.COM / 978.632.9800
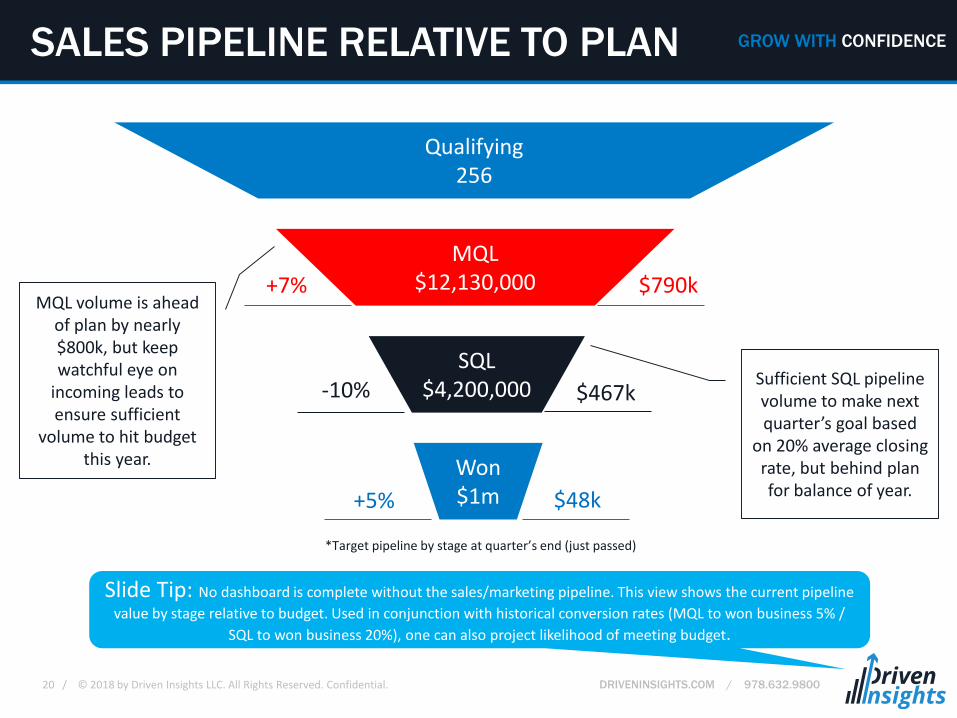
GROW WITH CONFIDENCESALES PIPELINE RELATIVE TO PLAN
Slide Tip: No dashboard is complete without the sales/marketing pipeline. This view shows the current pipeline
value by stage relative to budget. Used in conjunction with historical conversion rates (MQL to won business 5% /
SQL to won business 20%), one can also project likelihood of meeting budget.
Qualifying256
MQL$12,130,000
SQL$4,200,000
Won$1m
*Target pipeline by stage at quarter’s end (just passed)
+7% $790k
-10% $467k
+5% $48k
Sufficient SQL pipeline volume to make next quarter’s goal based
on 20% average closing rate, but behind plan for balance of year.
MQL volume is ahead of plan by nearly $800k, but keep watchful eye on
incoming leads to ensure sufficient
volume to hit budgetthis year.
21 / © 2018 by Driven Insights LLC. All Rights Reserved. Confidential. DRIVENINSIGHTS.COM / 978.632.9800
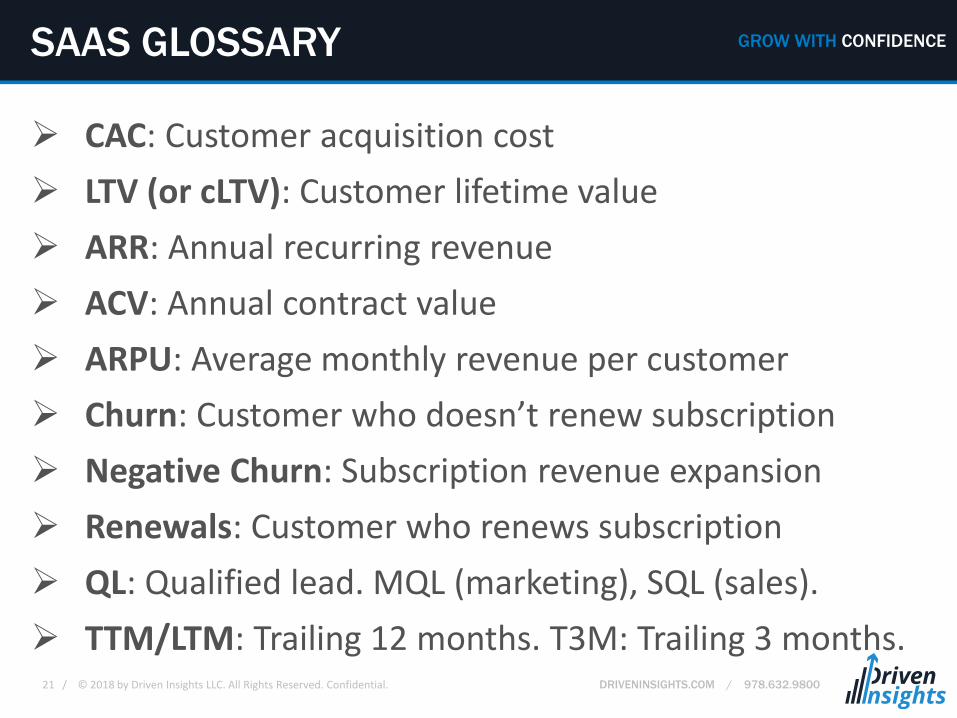
GROW WITH CONFIDENCESAAS GLOSSARY
➢ CAC: Customer acquisition cost
➢ LTV (or cLTV): Customer lifetime value
➢ ARR: Annual recurring revenue
➢ ACV: Annual contract value
➢ ARPU: Average monthly revenue per customer
➢ Churn: Customer who doesn’t renew subscription
➢ Negative Churn: Subscription revenue expansion
➢ Renewals: Customer who renews subscription
➢ QL: Qualified lead. MQL (marketing), SQL (sales).
➢ TTM/LTM: Trailing 12 months. T3M: Trailing 3 months.
22 / © 2018 by Driven Insights LLC. All Rights Reserved. Confidential. DRIVENINSIGHTS.COM / 978.632.9800
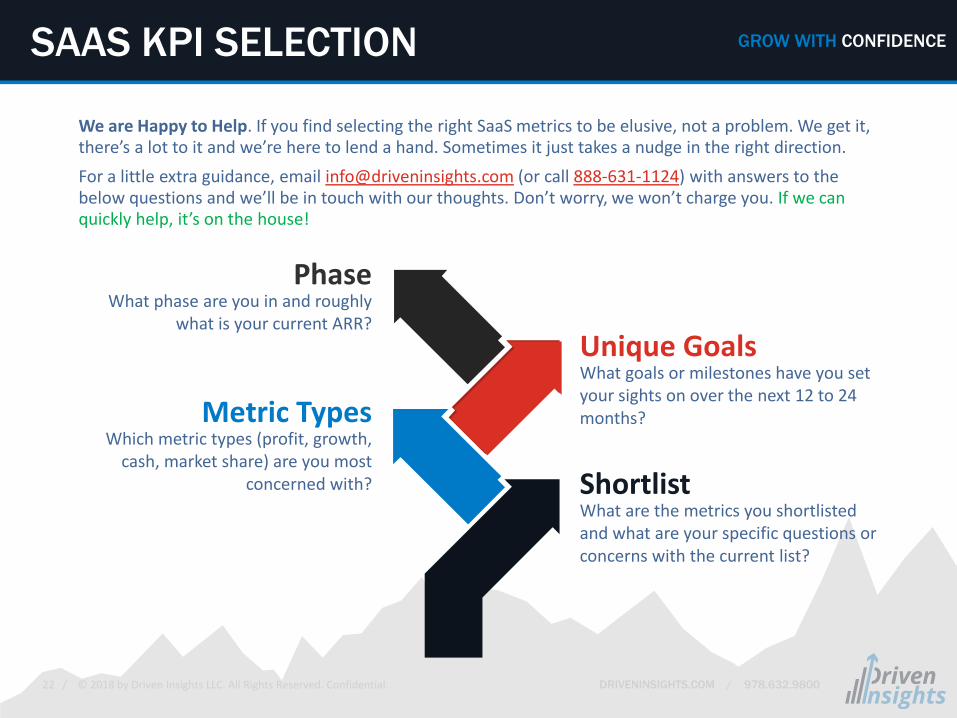
GROW WITH CONFIDENCESAAS KPI SELECTION
ShortlistWhat are the metrics you shortlistedand what are your specific questions orconcerns with the current list?
Unique GoalsWhat goals or milestones have you setyour sights on over the next 12 to 24months?Metric Types
Which metric types (profit, growth,cash, market share) are you most
concerned with?
PhaseWhat phase are you in and roughly
what is your current ARR?
We are Happy to Help. If you find selecting the right SaaS metrics to be elusive, not a problem. We get it, there’s a lot to it and we’re here to lend a hand. Sometimes it just takes a nudge in the right direction.
For a little extra guidance, email [email protected] (or call 888-631-1124) with answers to the below questions and we’ll be in touch with our thoughts. Don’t worry, we won’t charge you. If we can quickly help, it’s on the house!
23 / © 2018 by Driven Insights LLC. All Rights Reserved. Confidential. DRIVENINSIGHTS.COM / 978.632.9800
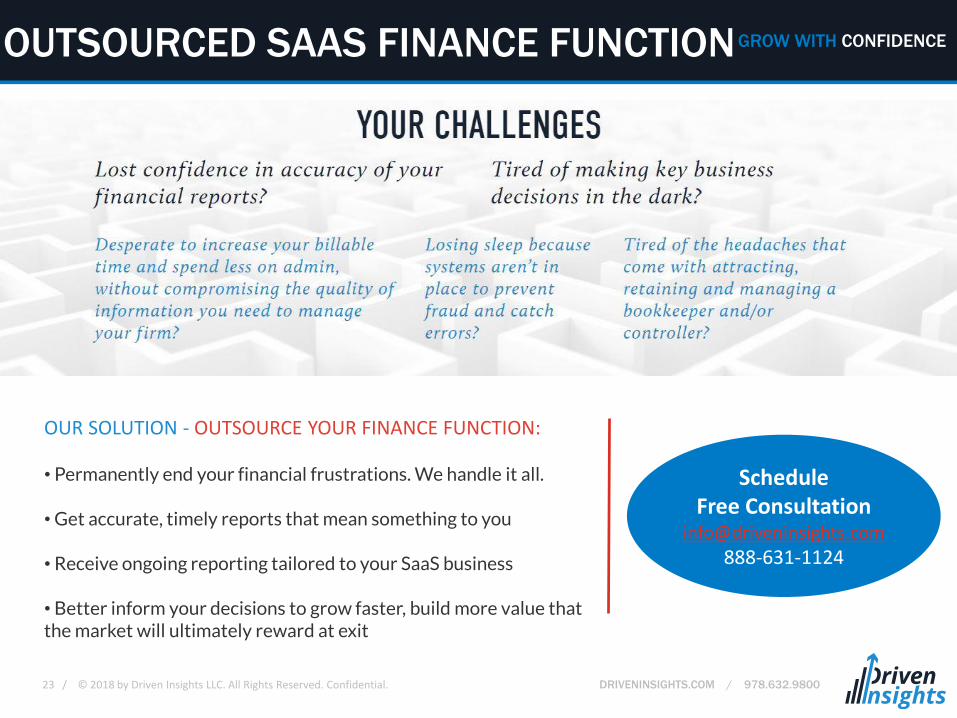
GROW WITH CONFIDENCEOUTSOURCED SAAS FINANCE FUNCTION
OUR SOLUTION - OUTSOURCE YOUR FINANCE FUNCTION:
• Permanently end your financial frustrations. We handle it all.
• Get accurate, timely reports that mean something to you
• Receive ongoing reporting tailored to your SaaS business
• Better inform your decisions to grow faster, build more value that the market will ultimately reward at exit
Schedule Free Consultation
888-631-1124
24 / © 2018 by Driven Insights LLC. All Rights Reserved. Confidential. DRIVENINSIGHTS.COM / 978.632.9800
GROW WITH CONFIDENCE
This confidential presentation has been prepared by Driven Insights for
illustrative purposes only. Any financial information contained herein is
fictitious and Driven Insights expressly disclaims any and all liability for
representations, contained in, or for omissions from, this data. Only those
particular representations and warranties which may be made in a definitive
written agreement, when and if one is executed, shall have any legal effect.
With acceptance of this presentation, the recipient acknowledges the
responsibility to maintain its confidentiality.
The information contained in this presentation may not be disclosed to others
who are not directly concerned with evaluating Driven Insights’ services.
This presentation may not be reproduced or provided to any other person
without the prior written consent of Driven Insights.
DISCLAIMER & CONFIDENTIALITY