monteagle funds semi annual report 2-17 print...
TRANSCRIPT

Monteagle Funds Fixed Income Fund Informed Investor Growth Fund Quality Growth Fund Select Value Fund Value Fund
The Texas Fund
Semi-Annual Report (Unaudited) February 28, 2017
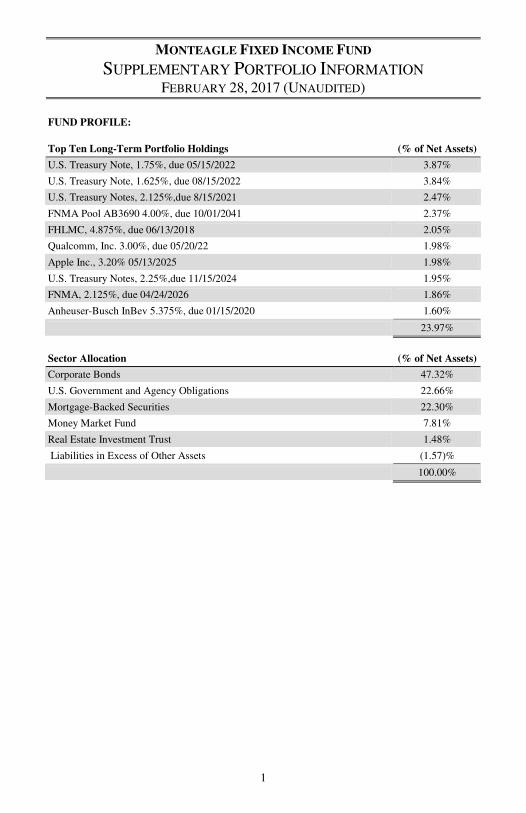
MONTEAGLE FIXED INCOME FUND
SUPPLEMENTARY PORTFOLIO INFORMATION FEBRUARY 28, 2017 (UNAUDITED)
1
FUND PROFILE:
Top Ten Long-Term Portfolio Holdings (% of Net Assets)
U.S. Treasury Note, 1.75%, due 05/15/2022 3.87%
U.S. Treasury Note, 1.625%, due 08/15/2022 3.84%
U.S. Treasury Notes, 2.125%,due 8/15/2021 2.47%
FNMA Pool AB3690 4.00%, due 10/01/2041 2.37%
FHLMC, 4.875%, due 06/13/2018 2.05%
Qualcomm, Inc. 3.00%, due 05/20/22 1.98%
Apple Inc., 3.20% 05/13/2025 1.98%
U.S. Treasury Notes, 2.25%,due 11/15/2024 1.95%
FNMA, 2.125%, due 04/24/2026 1.86%
Anheuser-Busch InBev 5.375%, due 01/15/2020 1.60%
23.97%
Sector Allocation (% of Net Assets)
Corporate Bonds 47.32%
U.S. Government and Agency Obligations 22.66%
Mortgage-Backed Securities 22.30%
Money Market Fund 7.81%
Real Estate Investment Trust 1.48%
Liabilities in Excess of Other Assets (1.57)%
100.00%

MONTEAGLE INFORMED INVESTOR GROWTH FUND
SUPPLEMENTARY PORTFOLIO INFORMATION FEBRUARY 28, 2017 (UNAUDITED)
2
FUND PROFILE:
Top Ten Long-Term Portfolio Holdings (% of Net Assets)
Thor Industries Inc. 6.83%
Citizens Financial Group 4.87%
Applied Materials, Inc 4.79%
Charles Schwab Corp. 4.48%
East West Bancorp, Inc. 4.06%
SVB Financial Group 3.24%
LAM Research Corp 2.96%
SPDR S&P 500 ETF Trust 2.96%
Powershares QQQ Trust Series 1 2.90%
Western Alliance Bancorp. 2.86%
39.95%
Top Ten Portfolio Industries (% of Net Assets)
Exchange Traded Funds 8.25%
Semiconductors 6.93%
Home Builders 6.83%
Commercial Banks 6.10%
Banks 4.87%
Diversified Financial Services 4.48%
State Commercial Banks 4.06%
Mining 3.60%
Special Industry Machinery, NEC 2.96%
Iron & Steel 2.77%
50.85%
Economic Sectors with Cash and Other Assets (% of Net Assets)
Financial Services 19.51%
Money Market Fund 17.97%
Technology 17.86%
Consumer Cyclical 8.52%
Exchange Traded Funds 8.25%
Basic Materials 6.37%
Industrials 3.02%
Healthcare 1.10%
Other Assets Less Liabilities 17.40%
100.00%

MONTEAGLE QUALITY GROWTH FUND
SUPPLEMENTARY PORTFOLIO INFORMATION FEBRUARY 28, 2017 (UNAUDITED)
3
FUND PROFILE:
Top Ten Long-Term Portfolio Holdings (% of Net Assets)
Apple, Inc. 5.22%
Home Depot, Inc. 3.86%
Microsoft Corp. 3.37%
Visa, Inc. Class A 2.80%
Comcast Corp. Class A 2.80%
Alphabet, Inc. Class A 2.70%
Walt Disney Co. 2.68%
Amazon.com, Inc. 2.64%
Johnson & Johnson 2.56%
UnitedHealth Group, Inc. 2.51%
31.14%
Top Ten Portfolio Industries (% of Net Assets)
Internet 10.32%
Retail 9.85%
Media 6.48%
Biotechnology 5.92%
Computers 5.80%
Money Market Fund 5.62%
Pharmaceuticals 5.02%
Aerospace & Defense 4.77%
Software 4.01%
Healthcare Services 3.69%
61.48%
Economic Sectors with Cash and Other Assets (% of Net Assets)
Technology 21.42%
Healthcare 17.45%
Consumer Cyclical 15.69%
Industrials 13.92%
Consumer Defensive 10.76%
Money Market Fund 5.62%
Financial Services 5.09%
Communication Services 4.84%
Basic Materials 3.05%
Real Estate Investment Trusts 1.68%
Energy 0.43%
Other Assets Less Liabilities 0.05%
100.00%

MONTEAGLE SELECT VALUE FUND
SUPPLEMENTARY PORTFOLIO INFORMATION FEBRUARY 28, 2017 (UNAUDITED)
4
FUND PROFILE:
Top Ten Long-Term Portfolio Holdings (% of Net Assets)
Western Digital Corp. 6.04%
Legg Mason, Inc. 4.74%
First Solar, Inc. 4.13%
Ralph Lauren Corp. 3.77%
Gilead Sciences, Inc. 3.77%
Cardinal Health Inc 3.67%
Caterpillar, Inc. 3.63%
CVS Caremark Corp. 3.49%
Pitney Bowes, Inc. 3.45%
Discovery Comm., Inc. 3.24%
39.93%
Top Ten Portfolio Industries (% of Net Assets)
Apparel 11.26%
Retail 9.52%
Pharmaceuticals 8.62%
Media 7.84%
Diversified Financial Services 6.88%
Computers 6.04%
Oil & Gas Services 5.84%
Energy-Alternative Sources 4.13%
Biotechnology 3.77%
Machinery-Construction & Mining 3.63%
67.53%
Economic Sectors with Cash and Other Assets (% of Net Assets)
Consumer Cyclical 26.17%
Healthcare 19.10%
Energy 11.94%
Industrials 11.60%
Technology 10.17%
Financial Services 8.35%
Basic Materials 5.50%
Money Market Fund 9.39%
Real Estate Investment Trust 1.72%
Liabilities In Excess Of Other Assets (3.94)%
100.00%
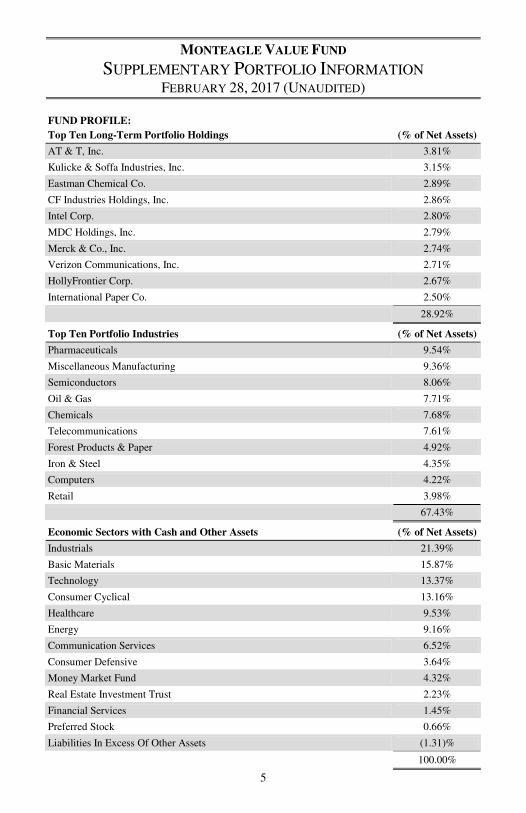
MONTEAGLE VALUE FUND
SUPPLEMENTARY PORTFOLIO INFORMATION FEBRUARY 28, 2017 (UNAUDITED)
5
FUND PROFILE:
Top Ten Long-Term Portfolio Holdings (% of Net Assets)
AT & T, Inc. 3.81%
Kulicke & Soffa Industries, Inc. 3.15%
Eastman Chemical Co. 2.89%
CF Industries Holdings, Inc. 2.86%
Intel Corp. 2.80%
MDC Holdings, Inc. 2.79%
Merck & Co., Inc. 2.74%
Verizon Communications, Inc. 2.71%
HollyFrontier Corp. 2.67%
International Paper Co. 2.50%
28.92%
Top Ten Portfolio Industries (% of Net Assets)
Pharmaceuticals 9.54%
Miscellaneous Manufacturing 9.36%
Semiconductors 8.06%
Oil & Gas 7.71%
Chemicals 7.68%
Telecommunications 7.61%
Forest Products & Paper 4.92%
Iron & Steel 4.35%
Computers 4.22%
Retail 3.98%
67.43%
Economic Sectors with Cash and Other Assets (% of Net Assets)
Industrials 21.39%
Basic Materials 15.87%
Technology 13.37%
Consumer Cyclical 13.16%
Healthcare 9.53%
Energy 9.16%
Communication Services 6.52%
Consumer Defensive 3.64%
Money Market Fund 4.32%
Real Estate Investment Trust 2.23%
Financial Services 1.45%
Preferred Stock 0.66%
Liabilities In Excess Of Other Assets (1.31)%
100.00%

THE TEXAS FUND
SUPPLEMENTARY PORTFOLIO INFORMATION FEBRUARY 28, 2017 (UNAUDITED)
6
FUND PROFILE:
Top Ten Long-Term Portfolio Holdings (% of Net Assets)
Rush Enterprises, Inc. 2.20%
Integer Holdings Corp. 2.08%
Eagle Materials, Inc. 1.84%
Texas Capital Bancshares Inc. 1.74%
Celanese Corp. 1.69%
Westlake Chemical Co. 1.69%
US Physical Therapy, Inc. 1.65%
Lennox International, Inc. 1.64%
Prosperity Bancshares, Inc. 1.58%
LegacyTexas Financial Group, Inc. 1.55%
17.66%
Top Ten Portfolio Industries (% of Net Assets)
Oil & Gas 12.41%
Banks 9.52%
Building Materials 6.65%
Retail 6.62%
Food 5.60%
Chemicals 5.06%
Oil & Gas Services 4.96%
Semiconductors 3.80%
Healthcare Products 3.29%
Healthcare Services 2.87%
60.78%
Economic Sectors with Cash and Other Assets (% of Net Assets)
Basic Materials 9.77%
Communication Services 0.87%
Consumer Cyclical 17.38%
Consumer Defensive 4.19%
Energy 17.98%
Financial Services 13.90%
Healthcare 6.16%
Industrials 17.67%
Money Market Fund 2.32%
Real Estate 1.41%
Technology 8.49%
Liabilities In Excess Of Other Assets (0.14)%
100.00%

MONTEAGLE FIXED INCOME FUND
SCHEDULE OF INVESTMENTS FEBRUARY 28, 2017 (UNAUDITED)
7
Par Value Fair Value
CORPORATE BONDS - 47.32% (a) Agriculture - 0.97% 500,000 Philip Morris International, 2.50%, 08/22/2022 $ 494,424 Auto Manufacturers - 0.98% 500,000 AmericanHonda Finance Corp., 2.90%, 02/16/2024 501,445 Banks - 9.02% 500,000 Goldman Sachs Group, 5.95%, 01/18/2018 518,944 500,000 JPMorgan Chase & Co., 6.00%, 01/15/2018 519,286 500,000 JPMorgan Chase & Co., 4.35%, 08/15/2021 536,296 500,000 Manufacturers & Trader Trust, 1.45%, 03/07/2018 499,696 500,000 Northern Trust Corp., 2.35%, 08/02/2022 495,895 500,000 PNC Funding Corp., 4.375%, 08/11/2020 534,070 500,000 Wells Fargo & Co., 1.15%, 06/02/2017 499,984 500,000 Wells Fargo & Co., 3.45%, 02/13/2023 507,028 500,000 Westpac Banking Corp., 2.00%, 08/14/2017 501,788
4,612,987 Beverages - 1.60% 750,000 Anheuser-Busch InBev, 5.375%, 01/15/2020 819,330 Biotechnology - 1.00% 500,000 Gilead Sciences, Inc., 3.25%, 09/01/2022 511,729 Computers - 3.15% 1,000,000 Apple, Inc., 3.20%, 05/13/2025 1,013,380 600,000 IBM Corp., 1.25%, 02/08/2018 600,399
1,613,779 Diversified Financial Services - 0.50% 250,000 CME Group, Inc., 3.00%, 09/15/2022 256,254 Electric - 2.64% 500,000 Duke Energy Florida LLC, 4.55%, 04/01/2020 532,872 770,000 Georgia Power Co., 4.25%, 12/01/2019 815,664
1,348,536 Electrical Component & Equipment - 1.20% 625,000 Honeywell International, 1.85%, 11/01/2021 613,717 Engineering & Construction - 0.70% 350,000 Fluor Corp., 3.50%, 12/15/2024 360,674
(a) Categorized in level 2 of the fair value hierarchy; for additional information and description of the levels, refer to the table included in Note 2 of the accompanying notes to the financial statements. The accompanying notes are an integral part of these financial statements.
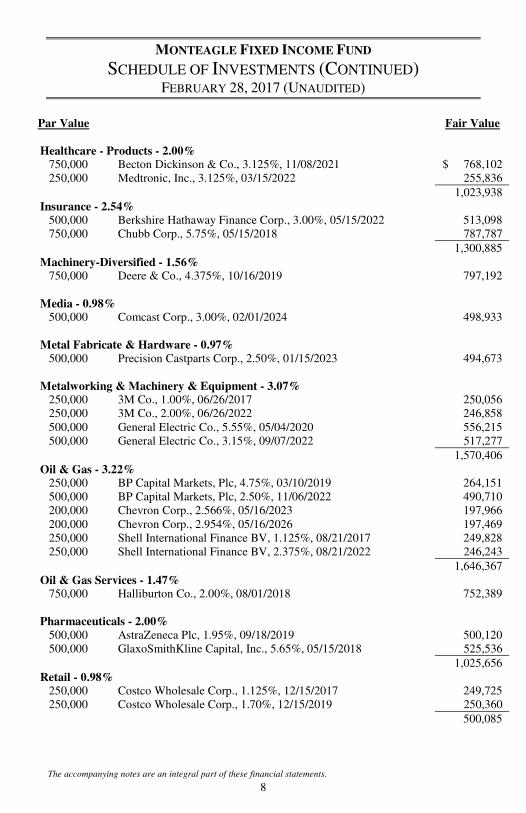
MONTEAGLE FIXED INCOME FUND
SCHEDULE OF INVESTMENTS (CONTINUED) FEBRUARY 28, 2017 (UNAUDITED)
8
Par Value Fair Value Healthcare - Products - 2.00% 750,000 Becton Dickinson & Co., 3.125%, 11/08/2021 $ 768,102 250,000 Medtronic, Inc., 3.125%, 03/15/2022 255,836
1,023,938 Insurance - 2.54% 500,000 Berkshire Hathaway Finance Corp., 3.00%, 05/15/2022 513,098 750,000 Chubb Corp., 5.75%, 05/15/2018 787,787
1,300,885 Machinery-Diversified - 1.56% 750,000 Deere & Co., 4.375%, 10/16/2019 797,192 Media - 0.98% 500,000 Comcast Corp., 3.00%, 02/01/2024 498,933 Metal Fabricate & Hardware - 0.97% 500,000 Precision Castparts Corp., 2.50%, 01/15/2023 494,673 Metalworking & Machinery & Equipment - 3.07% 250,000 3M Co., 1.00%, 06/26/2017 250,056 250,000 3M Co., 2.00%, 06/26/2022 246,858 500,000 General Electric Co., 5.55%, 05/04/2020 556,215 500,000 General Electric Co., 3.15%, 09/07/2022 517,277
1,570,406 Oil & Gas - 3.22% 250,000 BP Capital Markets, Plc, 4.75%, 03/10/2019 264,151 500,000 BP Capital Markets, Plc, 2.50%, 11/06/2022 490,710 200,000 Chevron Corp., 2.566%, 05/16/2023 197,966 200,000 Chevron Corp., 2.954%, 05/16/2026 197,469 250,000 Shell International Finance BV, 1.125%, 08/21/2017 249,828 250,000 Shell International Finance BV, 2.375%, 08/21/2022 246,243
1,646,367 Oil & Gas Services - 1.47% 750,000 Halliburton Co., 2.00%, 08/01/2018 752,389 Pharmaceuticals - 2.00% 500,000 AstraZeneca Plc, 1.95%, 09/18/2019 500,120 500,000 GlaxoSmithKline Capital, Inc., 5.65%, 05/15/2018 525,536
1,025,656 Retail - 0.98% 250,000 Costco Wholesale Corp., 1.125%, 12/15/2017 249,725 250,000 Costco Wholesale Corp., 1.70%, 12/15/2019 250,360
500,085
The accompanying notes are an integral part of these financial statements.

MONTEAGLE FIXED INCOME FUND
SCHEDULE OF INVESTMENTS (CONTINUED) FEBRUARY 28, 2017 (UNAUDITED)
9
Par Value Fair Value Semiconductors - 2.67% 350,000 Intel Corp., 1.35%, 12/15/2017 $ 350,343 1,000,000 Qualcomm, Inc., 3.00%, 05/20/2022 1,014,306
1,364,649 Software - 0.97% 500,000 Oracle Corp., 2.50%, 10/15/2022 498,875 Telecommunications - 3.13% 750,000 AT&T, Inc., 5.80%, 02/15/2019 805,546 750,000 Cisco Systems, Inc., 4.95%, 02/15/2019 798,377
1,603,923
TOTAL FOR CORPORATE BONDS (Cost $23,951,981) - 47.32% 24,210,846
REAL ESTATE INVESTMENT TRUST - 1.48%
750,000 Simon Property Group, 2.20%, 02/01/2019 756,074
TOTAL FOR REAL ESTATE INVESTMENT TRUST (Cost $752,197) - 1.48% 756,074
MORTGAGE-BACKED SECURITIES - 22.30% (a)
Federal Home Loans Banks - 0.39% 210,000 Federal Home Loans Banks 2.375%, 03/13/2026 203,653 Federal Home Loans Mortgage Corp. - 8.58% 500,000 Federal Home Loans Mortgage Corp., 1.75%, 05/30/2019 504,270 1,000,000 Federal Home Loans Mortgage Corp., 4.875%, 06/13/2018 1,048,480 175,000 Federal Home Loans Mortgage Corp., 5.00%, 12/14/2018 186,105 201,649 Federal Home Loans Mortgage Corp., Pool #A94289 4.00%, 10/01/2040 212,539 144,255 Federal Home Loans Mortgage Corp., Pool #A947184 4.50%, 02/01/2041 155,610 248,340 Federal Home Loans Mortgage Corp., Pool #G07163 3.50%, 10/01/2042 255,868
643,247 Federal Home Loans Mortgage Corp., Pool #G07961 3.50%, 03/01/2045
662,243 603,781 Federal Home Loans Mortgage Corp., Pool #G08618 4.00%, 12/01/2044 635,211 338,137 Federal Home Loans Mortgage Corp., Pool #J19285 2.50%, 06/01/2027 343,088 282,275 Federal Home Loans Mortgage Corp., Pool #Q15767 3.00%, 02/01/2043 282,006 38,383 Federal Home Loans Mortgage Corp., Series 15L 7.00%, 07/25/2023 42,161 61,286 Federal Home Loans Mortgage Corp., Series 2841 BY 5.00%, 08/15/2019 62,692
4,390,273 Federal National Mortgage Associations - 12.66% 500,000 Federal National Mortgage Association 1.875%, 09/18/2018 505,562 750,000 Federal National Mortgage Association 2.625%, 09/06/2024 762,686
(a) Categorized in level 2 of the fair value hierarchy; for additional information and description of the levels, refer to the table included in Note 2 of the accompanying notes to the financial statements. The accompanying notes are an integral part of these financial statements.

MONTEAGLE FIXED INCOME FUND
SCHEDULE OF INVESTMENTS (CONTINUED) FEBRUARY 28, 2017 (UNAUDITED)
10
Par Value Fair Value Federal National Mortgage Associations - (Continued) 1,000,000 Federal National Mortgage Association 2.125%, 04/24/2026 $ 953,212 52,931 Federal National Mortgage Association 2007-40, 5.50%, 05/25/2037 58,523 133 Federal National Mortgage Association Pool #725421 7.00%, 09/01/2017 134 319,194 Federal National Mortgage Association Pool #AL1869 3.00%, 06/01/2027 329,431 50,635 Federal National Mortgage Association Pool #545759 6.50%, 07/01/2032 58,855 25,870 Federal National Mortgage Association Pool #754289 6.00%, 11/01/2033 29,566 38,417 Federal National Mortgage Association Pool #882684 6.00%, 06/01/2036 43,577 1,147,653 Federal National Mortgage Association Pool #AB3690 4.00%, 10/01/2041 1,211,214 297,635 Federal National Mortgage Association Pool #AK3402 4.00%, 02/01/2042 314,145 195,153 Federal National Mortgage Association Pool #AO0763 4.00%, 04/01/2042 206,476 178,543 Federal National Mortgage Association Pool #AB8898 3.00%, 04/01/2043 177,857 346,596 Federal National Mortgage Association Pool #AB9238 3.00%, 05/01/2043 345,477 215,293 Federal National Mortgage Association Pool #AL7729 4.00%, 06/01/2043 227,180 236,795 Federal National Mortgage Association Pool #AU1619 3.50%, 07/01/2043 243,809 747,136 Federal National Mortgage Association Pool #AU3763 3.50%, 08/01/2043 769,115 222,128 Federal National Mortgage Association Pool #AL5097 4.50%, 09/01/2043 239,702
6,476,521 Government National Association - 0.67% 20,964 Government National Mortgage Association Pool #648337 5.00%, 10/15/2020 22,218 58,167 Government National Mortgage Association Pool #476998 6.50%, 07/15/2029 66,330 19,050 Government National Mortgage Association Pool #676516 6.00%, 02/15/2038 21,620 46,827 Government National Mortgage Association 2012-52 PM 3.50%, 12/20/2039 48,605 185,780 Government National Mortgage Association 2012-91 HQ 2.00%, 09/20/2041 182,174
340,947
TOTAL FOR MORTGAGE-BACKED SECURITIES (Cost $11,523,961) - 22.30% 11,411,394
U.S. GOVERNMENT AGENCIES & OBLIGATIONS - 22.66% (a)
U.S. Treasury Notes - 22.66% 250,000 United States Treasury Note Bond 4.75%, 08/15/2017 254,668 250,000 United States Treasury Note Bond 3.50%, 02/15/2018 256,084 250,000 United States Treasury Note Bond 1.50%, 08/31/2018 251,514 250,000 United States Treasury Note Bond 1.50%, 02/28/2019 251,318 250,000 United States Treasury Note Bond 1.75%, 09/30/2019 252,353 250,000 United States Treasury Note Bond 3.625%, 02/15/2020 265,576 750,000 United States Treasury Note Bond 2.625%, 08/15/2020 775,517 500,000 United States Treasury Note Bond 3.625%, 02/15/2021 536,543 250,000 United States Treasury Note Bond 2.25%, 03/31/2021 254,815 1,250,000 United States Treasury Note Bond 2.125%, 08/15/2021 1,265,087 750,000 United States Treasury Note Bond 2.00%, 11/15/2021 754,307
(a) Categorized in level 2 of the fair value hierarchy; for additional information and description of the levels, refer to the table included in Note 2 of the accompanying notes to the financial statements. The accompanying notes are an integral part of these financial statements.
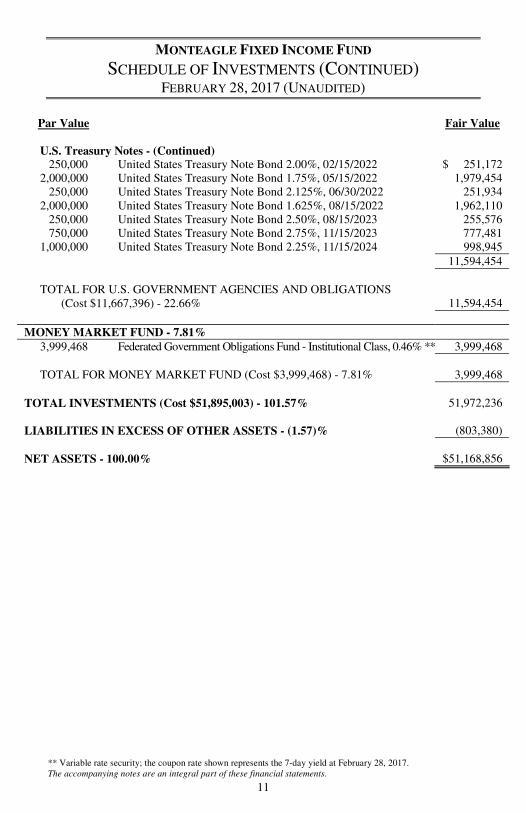
MONTEAGLE FIXED INCOME FUND
SCHEDULE OF INVESTMENTS (CONTINUED) FEBRUARY 28, 2017 (UNAUDITED)
11
Par Value Fair Value
U.S. Treasury Notes - (Continued) 250,000 United States Treasury Note Bond 2.00%, 02/15/2022 $ 251,172 2,000,000 United States Treasury Note Bond 1.75%, 05/15/2022 1,979,454 250,000 United States Treasury Note Bond 2.125%, 06/30/2022 251,934 2,000,000 United States Treasury Note Bond 1.625%, 08/15/2022 1,962,110 250,000 United States Treasury Note Bond 2.50%, 08/15/2023 255,576 750,000 United States Treasury Note Bond 2.75%, 11/15/2023 777,481 1,000,000 United States Treasury Note Bond 2.25%, 11/15/2024 998,945
11,594,454
TOTAL FOR U.S. GOVERNMENT AGENCIES AND OBLIGATIONS (Cost $11,667,396) - 22.66% 11,594,454
MONEY MARKET FUND - 7.81%
3,999,468 Federated Government Obligations Fund - Institutional Class, 0.46% ** 3,999,468
TOTAL FOR MONEY MARKET FUND (Cost $3,999,468) - 7.81% 3,999,468
TOTAL INVESTMENTS (Cost $51,895,003) - 101.57% 51,972,236
LIABILITIES IN EXCESS OF OTHER ASSETS - (1.57)% (803,380)
NET ASSETS - 100.00% $51,168,856
** Variable rate security; the coupon rate shown represents the 7-day yield at February 28, 2017. The accompanying notes are an integral part of these financial statements.

MONTEAGLE INFORMED INVESTOR GROWTH FUND
SCHEDULE OF INVESTMENTS FEBRUARY 28, 2017 (UNAUDITED)
12
Shares Fair Value
COMMON STOCKS - 56.38%
Banks - 4.87% 14,600 Citizens Financial Group, Inc. $ 545,602
Commercial Banks - 6.10% 1,900 SVB Financial Group * 362,691 6,200 Western Alliance Bancorp * 320,168
682,859 Diversified Financial Services - 4.48% 12,400 Charles Schwab Corp. 501,084
Electrical Component & Equipment - 1.92% 2,800 Cognex Corp. 215,068 Healthcare Products - 1.10%
1,200 Align Technology, Inc. * 123,312 Home Builders - 6.83% 6,900 Thor Industries, Inc. 764,658 Internet - 1.09% 900 Facebook, Inc. * 121,986 Instruments For Measure & Testing of Electricity & Electric Signals - 1.90% 7,500 Teradyne, Inc. 213,300 Iron & Steel - 2.77% 8,000 United States Steel Corp. 309,760 Machinery-Construction & Mining - 0.97% 1,600 Oshkosh Corp. 108,624 Machinery-Diversified - 2.05% 2,100 Deere & Co. 229,929 Mining - 3.60% 4,800 Agnico Eagle Mines Ltd. (Canada) 203,568 4,800 Rio Tinto Plc. ADR 199,296
402,864 Optical Instruments & Lenses - 2.09% 2,600 KLA Tencor Corp. 234,312
* Non-Income producing. ADR - American Depository Receipt The accompanying notes are an integral part of these financial statements.
MONTEAGLE INFORMED INVESTOR GROWTH FUND
SCHEDULE OF INVESTMENTS (CONTINUED) FEBRUARY 28, 2017 (UNAUDITED)
13
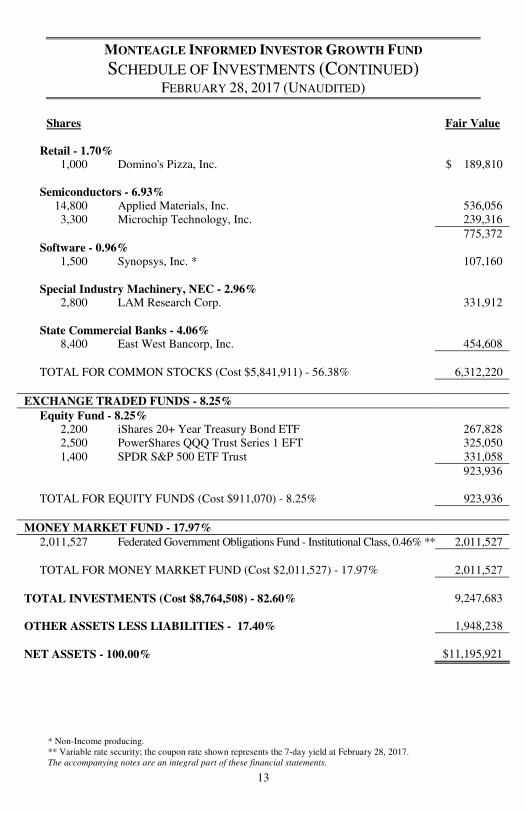
Shares Fair Value Retail - 1.70% 1,000 Domino's Pizza, Inc. $ 189,810 Semiconductors - 6.93% 14,800 Applied Materials, Inc. 536,056 3,300 Microchip Technology, Inc. 239,316
775,372 Software - 0.96% 1,500 Synopsys, Inc. * 107,160 Special Industry Machinery, NEC - 2.96% 2,800 LAM Research Corp. 331,912 State Commercial Banks - 4.06% 8,400 East West Bancorp, Inc. 454,608
TOTAL FOR COMMON STOCKS (Cost $5,841,911) - 56.38% 6,312,220
EXCHANGE TRADED FUNDS - 8.25%
Equity Fund - 8.25% 2,200 iShares 20+ Year Treasury Bond ETF 267,828 2,500 PowerShares QQQ Trust Series 1 EFT 325,050 1,400 SPDR S&P 500 ETF Trust 331,058
923,936 TOTAL FOR EQUITY FUNDS (Cost $911,070) - 8.25% 923,936
MONEY MARKET FUND - 17.97%
2,011,527 Federated Government Obligations Fund - Institutional Class, 0.46% ** 2,011,527
TOTAL FOR MONEY MARKET FUND (Cost $2,011,527) - 17.97% 2,011,527
TOTAL INVESTMENTS (Cost $8,764,508) - 82.60% 9,247,683
OTHER ASSETS LESS LIABILITIES - 17.40% 1,948,238
NET ASSETS - 100.00% $11,195,921
* Non-Income producing. ** Variable rate security; the coupon rate shown represents the 7-day yield at February 28, 2017. The accompanying notes are an integral part of these financial statements.
MONTEAGLE QUALITY GROWTH FUND
SCHEDULE OF INVESTMENTS FEBRUARY 28, 2017 (UNAUDITED)
14
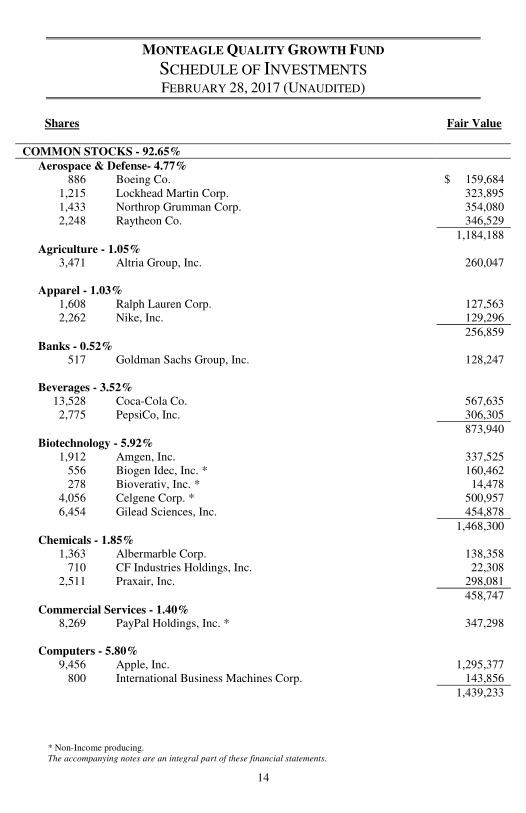
Shares Fair Value
COMMON STOCKS - 92.65% Aerospace & Defense- 4.77% 886 Boeing Co. $ 159,684 1,215 Lockhead Martin Corp. 323,895 1,433 Northrop Grumman Corp. 354,080 2,248 Raytheon Co. 346,529
1,184,188 Agriculture - 1.05% 3,471 Altria Group, Inc. 260,047 Apparel - 1.03% 1,608 Ralph Lauren Corp. 127,563 2,262 Nike, Inc. 129,296
256,859 Banks - 0.52% 517 Goldman Sachs Group, Inc. 128,247 Beverages - 3.52% 13,528 Coca-Cola Co. 567,635 2,775 PepsiCo, Inc. 306,305
873,940 Biotechnology - 5.92% 1,912 Amgen, Inc. 337,525 556 Biogen Idec, Inc. * 160,462 278 Bioverativ, Inc. * 14,478 4,056 Celgene Corp. * 500,957 6,454 Gilead Sciences, Inc. 454,878
1,468,300 Chemicals - 1.85% 1,363 Albermarble Corp. 138,358 710 CF Industries Holdings, Inc. 22,308 2,511 Praxair, Inc. 298,081
458,747 Commercial Services - 1.40% 8,269 PayPal Holdings, Inc. * 347,298 Computers - 5.80% 9,456 Apple, Inc. 1,295,377 800 International Business Machines Corp. 143,856
1,439,233 * Non-Income producing. The accompanying notes are an integral part of these financial statements.
MONTEAGLE QUALITY GROWTH FUND
SCHEDULE OF INVESTMENTS (CONTINUED) FEBRUARY 28, 2017 (UNAUDITED)
15
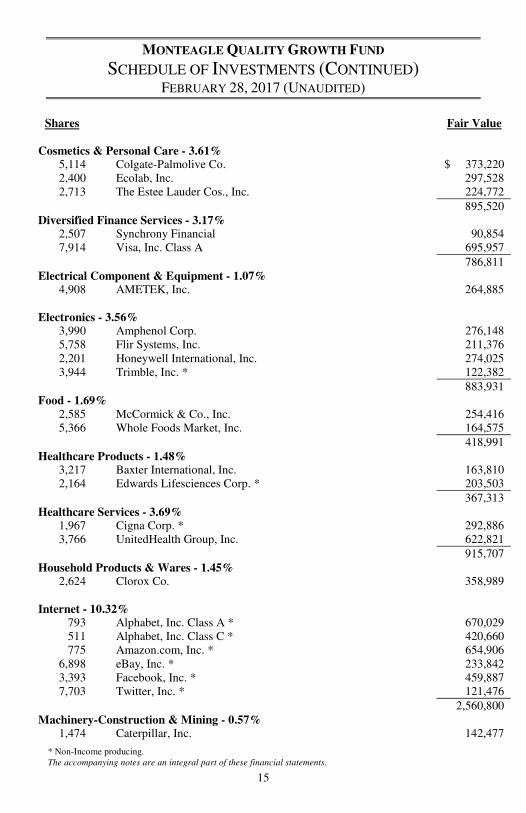
Shares Fair Value Cosmetics & Personal Care - 3.61% 5,114 Colgate-Palmolive Co. $ 373,220 2,400 Ecolab, Inc. 297,528 2,713 The Estee Lauder Cos., Inc. 224,772
895,520 Diversified Finance Services - 3.17% 2,507 Synchrony Financial 90,854 7,914 Visa, Inc. Class A 695,957
786,811 Electrical Component & Equipment - 1.07% 4,908 AMETEK, Inc. 264,885 Electronics - 3.56% 3,990 Amphenol Corp. 276,148 5,758 Flir Systems, Inc. 211,376 2,201 Honeywell International, Inc. 274,025 3,944 Trimble, Inc. * 122,382
883,931 Food - 1.69% 2,585 McCormick & Co., Inc. 254,416 5,366 Whole Foods Market, Inc. 164,575
418,991 Healthcare Products - 1.48% 3,217 Baxter International, Inc. 163,810 2,164 Edwards Lifesciences Corp. * 203,503
367,313 Healthcare Services - 3.69% 1,967 Cigna Corp. * 292,886 3,766 UnitedHealth Group, Inc. 622,821
915,707 Household Products & Wares - 1.45% 2,624 Clorox Co. 358,989 Internet - 10.32% 793 Alphabet, Inc. Class A * 670,029 511 Alphabet, Inc. Class C * 420,660 775 Amazon.com, Inc. * 654,906 6,898 eBay, Inc. * 233,842 3,393 Facebook, Inc. * 459,887 7,703 Twitter, Inc. * 121,476
2,560,800 Machinery-Construction & Mining - 0.57% 1,474 Caterpillar, Inc. 142,477
* Non-Income producing. The accompanying notes are an integral part of these financial statements.

MONTEAGLE QUALITY GROWTH FUND
SCHEDULE OF INVESTMENTS (CONTINUED) FEBRUARY 28, 2017 (UNAUDITED)
16
Shares Fair Value Machinery-Diversified - 1.33% 1,578 Roper Industries, Inc. $ 330,118 Media - 6.48% 18,572 Comcast Corp. Class A 694,964 3,991 Dish Network Corp. * 247,442 6,048 Walt Disney Co. 665,824
1,608,230 Metal Fabricate & Hardware - 0.52% 1,772 Ball Corp. 130,295 Miscellaneous Manufacturing - 2.28% 3,034 3M Co. 565,386 Oil & Gas - 0.43% 1,303 Exxon Mobil Corp. 105,960 Pharmaceuticals - 5.02% 4,690 Bristol-Myers Squibb Co. 265,970 3,153 Eli Lilly & Co. 261,100 1,189 Express Scripts Holding Co. * 84,003 5,203 Johnson & Johnson 635,859
1,246,932 Retail - 9.85% 893 Costco Wholesale Corp. 158,222 4,116 CVS Caremark Corp. 331,667 6,610 Home Depot, Inc. 957,855 1,843 McDonald's Corp. 235,259 4,250 TJX Cos., Inc. 333,413 6,560 Yum! Brands, Inc. 428,499
2,444,915 Semiconductors - 2.43% 2,231 NXP Semiconductors NV Co. * 229,369 6,608 Qualcomm, Inc. 373,220
602,589 Software - 4.01% 13,084 Microsoft Corp. 837,114 3,737 Oracle Corp. 159,159
996,273 Telecommunications - 1.04% 5,189 Verizon Communications, Inc. 257,530
* Non-Income producing. The accompanying notes are an integral part of these financial statements.

MONTEAGLE QUALITY GROWTH FUND
SCHEDULE OF INVESTMENTS (CONTINUED) FEBRUARY 28, 2017 (UNAUDITED)
17
Shares Fair Value Transportation - 2.79% 1,483 FedEx Corp. $ 286,189 961 Kansas City Southern 85,173 2,988 Union Pacific Corp. 322,525
693,887
TOTAL FOR COMMON STOCKS (Cost $17,223,114) - 92.65% 22,994,398
REAL ESTATE INVESTMENT TRUSTS - 1.68%
854 American Tower Corp. 98,031 4,551 Welltower, Inc. 320,299
418,330
TOTAL FOR REAL ESTATE INVESTMENT TRUSTS (Cost $340,737) - 1.68% 418,330
MONEY MARKET FUND - 5.62%
1,393,853 Federated Government Obligations Fund - Institutional Class, 0.46% ** 1,393,853
TOTAL FOR MONEY MARKET FUND (Cost $1,393,853) - 5.62% 1,393,853
TOTAL INVESTMENTS (Cost $18,957,704) - 99.95% 24,806,581
OTHER ASSETS LESS LIABILITIES - 0.05% 13,376
NET ASSETS - 100.00% $24,819,957
** Variable rate security; the coupon rate shown represents the 7-day yield at February 28, 2017. The accompanying notes are an integral part of these financial statements.

MONTEAGLE SELECT VALUE FUND
SCHEDULE OF INVESTMENTS FEBRUARY 28, 2017 (UNAUDITED)
18
Shares Fair Value
COMMON STOCKS - 92.83% Apparel - 11.26% 4,875 L Brands, Inc. $ 256,523 10,200 Michael Kors Holdings, Ltd. * 372,300 5,900 Ralph Lauren Corp. 468,047 5,720 VF Corp. 300,014
1,396,884 Banks - 1.47% 7,400 Bank of America Corp. 182,632 Biotechnology - 3.77% 6,630 Gilead Sciences, Inc. 467,282 Chemicals - 2.56% 10,160 Mosaic Co. 316,890 Computers - 6.04% 9,750 Western Digital Corp. 749,580 Distribution & Wholesale - 1.05% 6,884 Fossil Group, Inc. * 130,176 Diversified Financial Services - 6.88% 2,180 CME Group, Inc. 264,783 15,600 Legg Mason, Inc. 588,432
853,215 Energy-Alternative Sources - 4.13% 14,150 First Solar, Inc. (a) * 512,089 Healthcare Services - 3.22% 2,426 Anthem, Inc. 399,853 Machinery-Construction & Mining - 3.63% 4,653 Caterpillar, Inc. 449,759 Machinery-Diversified - 2.76% 2,305 Cummins, Inc. 342,269
* Non-Income producing. (a) Security, or a portion of the security is out on loan at February 28, 2017. Total loaned securities had a fair value of $491,790 at February 28, 2017. The accompanying notes are an integral part of these financial statements.

MONTEAGLE SELECT VALUE FUND
SCHEDULE OF INVESTMENTS (CONTINUED) FEBRUARY 28, 2017 (UNAUDITED)
19
Shares Fair Value Media - 7.84% 13,971 Discovery Comm., Inc. * $ 401,806 5,000 Viacom, Inc. Class B 217,250 13,800 Tegna, Inc. 353,694
972,750 Mining - 2.93% 27,163 Freeport-McMoRan Copper & Gold, Inc. * 363,984 Miscellaneous Manufacturing - 1.76% 7,300 General Electric Co. 217,613 Office & Business Equipment - 3.45% 31,328 Pitney Bowes, Inc. 427,314 Oil & Gas - 3.08% 2,200 ConocoPhillips 104,654 20,100 Transocean Ltd. * 277,782
382,436 Oil & Gas Services - 5.84% 6,513 Baker Hughes, Inc. 392,604 8,200 National Oilwell Varco, Inc. 331,444
724,048 Petroleum Refining - 3.02% 5,513 Valero Energy Corp. 374,608 Pharmaceuticals - 8.62% 5,600 Cardinal Health, Inc. 455,672 5,518 Mallinckrodt Plc. * 289,254 7,732 Mylan NV * 323,584
1,068,510 Retail - 9.52% 4,275 AutoNation, Inc. * 196,223 5,375 CVS Caremark Corp. 433,117 5,200 Gap, Inc. 129,064 3,385 Kohl's Corp. 144,269 4,375 Signet Jewelers Ltd. 278,206
1,180,879 TOTAL FOR COMMON STOCKS (Cost $11,511,404) - 92.83% 11,512,771
* Non-Income producing. The accompanying notes are an integral part of these financial statements.

MONTEAGLE SELECT VALUE FUND
SCHEDULE OF INVESTMENTS (CONTINUED) FEBRUARY 28, 2017 (UNAUDITED)
20
Shares Fair Value
REAL ESTATE INVESTMENT TRUST - 1.72%
6,520 HCP, Inc. $ 213,791
TOTAL FOR REAL ESTATE INVESTMENT TRUST (Cost $227,385) - 1.72% 213,791
MONEY MARKET FUND - 9.39%
1,164,849 Federated Government Obligations Fund - Institutional Class, 0.46% (b) ** 1,164,849
TOTAL FOR MONEY MARKET FUND (Cost $1,164,849) - 9.39% 1,164,849
TOTAL INVESTMENTS (Cost $12,903,638) - 103.94% 12,891,411
LIABILITIES IN EXCESS OF OTHER ASSETS - (3.94)% (488,931)
NET ASSETS - 100.00% $12,402,480
** Variable rate security; the coupon rate shown represents the 7-day yield at February 28, 2017. (b) A portion of this security is segregated as collateral for securities on loan at February 28, 2017. Total collateral had a fair value of $502,554 at February 28, 2017. The accompanying notes are an integral part of these financial statements.

MONTEAGLE VALUE FUND
SCHEDULE OF INVESTMENTS FEBRUARY 28, 2017 (UNAUDITED)
21
Shares Fair Value
COMMON STOCKS - 94.10% Aerospace & Defense- 0.05% 400 Triumph Group, Inc. $ 11,120 Apparel - 1.67% 7,000 VF Corp. 367,150 Auto Parts & Equipment - 2.21% 12,000 Cooper Tire & Rubber Co. 485,400 Chemicals - 7.68% 20,000 CF Industries Holdings, Inc. 628,400 7,900 Eastman Chemical Co. 633,975 18,800 Huntsman Corp. 424,880
1,687,255 Computers - 4.22% 2,900 International Business Machines Corp. 521,478 8,400 Seagate Technology Plc. 404,796
926,274 Distribution & Wholesale - 2.21% 79,558 Wolseley Plc. Jersey ADR 484,508 Diversified Financial Services - 1.45% 4,813 Macquarie Group, Ltd. ADR 319,463 Electrical Component & Equipment - 3.48% 5,000 Eaton Corp. Plc. 359,900 30,000 Schneider Electric SA ADR * 404,850
764,750 Engineering & Construction - 2.32% 9,200 Fluor Corp. 509,588 Food - 3.64% 7,600 Cal-Maine Foods, Inc. * 288,420 28,000 Dean Foods Co. 510,720
799,140 Forest Products & Paper - 4.93% 10,400 International Paper Co. 548,080 13,000 Schweitzer-Mauduit International, Inc. 533,390
1,081,470 Home Builders - 2.79% 21,000 MDC Holdings, Inc. 612,990
* Non-Income producing. ADR - American Depository Receipt The accompanying notes are an integral part of these financial statements.
MONTEAGLE VALUE FUND
SCHEDULE OF INVESTMENTS (CONTINUED) FEBRUARY 28, 2017 (UNAUDITED)
22
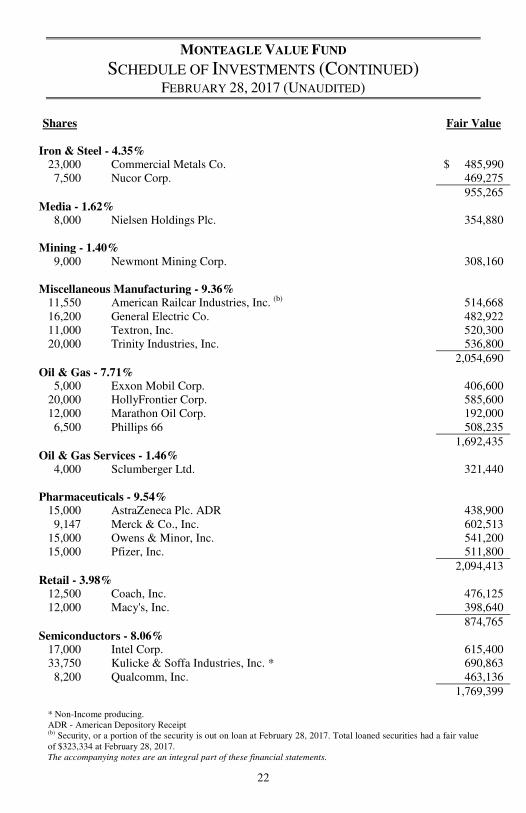
Shares Fair Value Iron & Steel - 4.35% 23,000 Commercial Metals Co. $ 485,990 7,500 Nucor Corp. 469,275
955,265 Media - 1.62% 8,000 Nielsen Holdings Plc. 354,880 Mining - 1.40% 9,000 Newmont Mining Corp. 308,160 Miscellaneous Manufacturing - 9.36% 11,550 American Railcar Industries, Inc. (b) 514,668 16,200 General Electric Co. 482,922 11,000 Textron, Inc. 520,300 20,000 Trinity Industries, Inc. 536,800
2,054,690 Oil & Gas - 7.71% 5,000 Exxon Mobil Corp. 406,600 20,000 HollyFrontier Corp. 585,600 12,000 Marathon Oil Corp. 192,000 6,500 Phillips 66 508,235
1,692,435 Oil & Gas Services - 1.46% 4,000 Sclumberger Ltd. 321,440 Pharmaceuticals - 9.54% 15,000 AstraZeneca Plc. ADR 438,900 9,147 Merck & Co., Inc. 602,513 15,000 Owens & Minor, Inc. 541,200 15,000 Pfizer, Inc. 511,800
2,094,413 Retail - 3.98% 12,500 Coach, Inc. 476,125 12,000 Macy's, Inc. 398,640
874,765 Semiconductors - 8.06% 17,000 Intel Corp. 615,400 33,750 Kulicke & Soffa Industries, Inc. * 690,863 8,200 Qualcomm, Inc. 463,136
1,769,399 * Non-Income producing. ADR - American Depository Receipt (b) Security, or a portion of the security is out on loan at February 28, 2017. Total loaned securities had a fair value of $323,334 at February 28, 2017. The accompanying notes are an integral part of these financial statements.

MONTEAGLE VALUE FUND
SCHEDULE OF INVESTMENTS (CONTINUED) FEBRUARY 28, 2017 (UNAUDITED)
23
Shares Fair Value Telecommunications - 7.61% 20,000 AT&T, Inc. $ 835,800 31,000 FIH Mobile, Ltd. ADR * (a) 240,414 12,000 Verizon Communications, Inc. 595,560
1,671,774 Transportation - 2.36% 6,800 Ryder System, Inc. 517,820
TOTAL FOR COMMON STOCKS (Cost $16,989,418) - 94.10% 20,664,149
PREFERRED STOCK - 0.66%
Limited Partnerships - 0.66% 6,408 Steel Partners Holdings L.P., 6.00%, 02/07/2026 144,180
TOTAL FOR PREFERRED STOCK (Cost $289,951) - 0.66% 144,180
REAL ESTATE INVESTMENT TRUST - 2.23%
17,100 Rayonier, Inc. 489,744
TOTAL FOR REAL ESTATE INVESTMENT TRUST (Cost $447,916) - 2.23% 489,744
MONEY MARKET FUND - 4.32%
949,450 Federated Government Obligations Fund - Institutional Class, 0.46% (c) ** 949,450
TOTAL FOR MONEY MARKET FUND (Cost $949,450) - 4.32% 949,450
TOTAL INVESTMENTS (Cost $18,676,735) - 101.31% 22,247,523
LIABILITIES IN EXCESS OF OTHER ASSETS - (1.31)% (287,285)
NET ASSETS - 100.00% $21,960,238
* Non-Income producing. ** Variable rate security; the coupon rate shown represents the 7-day yield at February 28, 2017. ADR - American Depository Receipt (a) Categorized in level 2 of the fair value hierarchy; for additional information and description of the levels, notes to the financial statements. Refer to the table included in Note 2 of the accompanying notes to the financial statements. (c) A portion of this security is segregated as collateral for securities on loan at February 28, 2017. Total collateral had a fair value of $342,047 at February 28, 2017. The accompanying notes are an integral part of these financial statements.

THE TEXAS FUND
SCHEDULE OF INVESTMENTS FEBRUARY 28, 2017 (UNAUDITED)
24
Shares Fair Value
COMMON STOCKS - 97.82% Agriculture - 0.63% 879 Alamo Group, Inc. $ 66,057
Airlines- 2.08% 1,468 American Airlines Group, Inc. 68,056 2,625 Southwest Airlines Co. 151,725
219,781 Apparel - 0.56% 2,579 Tailored Brands, Inc. 59,601
Auto Manufacturers - 1.45% 1,356 Toyota Motor Corp. ADR 153,431
Banks - 9.52% 1,249 Cullen/Frost Bankers, Inc. 115,495 2,536 First Financial Bankshares, Inc. (a) 111,584 2,797 International Bancshares Corp. 106,426 3,854 LegacyTexas Financial Group, Inc. 164,142 2,243 Prosperity Bancshares, Inc. 167,193 4,500 Southside Bancshares, Inc. 158,535 2,061 Texas Capital Bancshares, Inc. * 183,738
1,007,113 Beverages - 1.37% 1,552 Dr Pepper Snapple Group, Inc. 145,019
Building Materials - 6.65% 11,795 Builders Firstsource, Inc. * 152,627 1,874 Eagle Materials, Inc. 194,353 1,054 Lennox International, Inc. 173,509 5,100 NCI Building Systems, Inc. * 81,600 1,600 US Concrete, Inc. 100,800
702,889 Capital Goods - 0.70% 1,970 Quanta Services, Inc. * 73,520
Chemicals - 5.06% 2,010 Celanese Corp. 179,232 1,816 CSW Industrials, Inc. * 67,374 4,047 Kronos Worldwide, Inc. 56,091 5,795 Nexeo Solutions, Inc. * 53,662 2,824 Westlake Chemical Co. 179,126
535,485 * Non-Income producing. ADR - American Depository Receipt (a) Security, or a portion of the security is out on loan at February 28, 2017. Total loaned securities had a fair value of $141,545 at February 28, 2017. The accompanying notes are an integral part of these financial statements.

THE TEXAS FUND
SCHEDULE OF INVESTMENTS (CONTINUED) FEBRUARY 28, 2017 (UNAUDITED)
25
Shares Fair Value Commercial Services - 1.43% 1,819 Insperity, Inc. $ 151,432 Computers - 2.69% 1,266 Cardtronics, Plc. * 55,805 1,599 Cognizant Technology Solutions Corp. * 94,773 7,165 HMS Holdings Corp. 133,484
284,062 Distribution & Wholesale - 1.14% 1,811 DXP Enterprises, Inc. * 63,385 3,047 Fossill Group, Inc. * 57,619
121,004 Diversified Financial Services - 1.30% 567 Alliance Data Systems Corp. 137,770 Electric - 1.42% 3,930 Comfort Systems USA, Inc. * 149,929 Electronics - 1.81% 2,920 Benchmark Electronic, Inc. * 90,812 3,118 National Instruments Corp. 100,524
191,336 Energy - 0.43% 2,900 Bristow Group, Inc. 45,559 Engineering & Construction - 1.29% 1,275 Fluor Corp. 70,622 1,164 Jacobs Engineering Group, Inc. 65,661
136,283 Entertainment - 2.05% 2,632 Cinemark Holdings, Inc. 110,202 1,759 Six Flags Entertainment Corp. 106,613
216,815 Environmental Control - 1.43% 870 Waste Connections, Inc. 76,029 1,019 Waste Management, Inc. 74,713
150,742 Food - 5.60% 1,118 Brinker International, Inc. 47,224 2,700 Chuy's Holdings, Inc. * 76,950 5,567 Darling Ingredients, Inc. * 72,427
* Non-Income producing. The accompanying notes are an integral part of these financial statements.
THE TEXAS FUND
SCHEDULE OF INVESTMENTS (CONTINUED) FEBRUARY 28, 2017 (UNAUDITED)
26
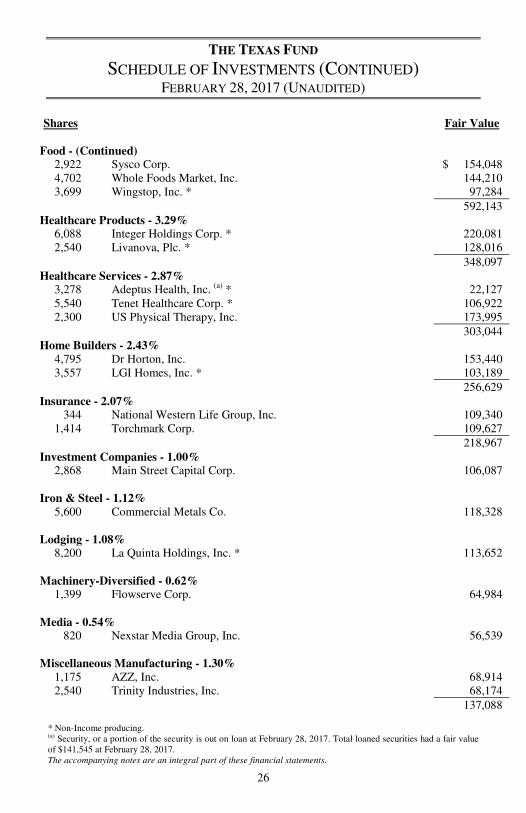
Shares Fair Value Food - (Continued) 2,922 Sysco Corp. $ 154,048 4,702 Whole Foods Market, Inc. 144,210 3,699 Wingstop, Inc. * 97,284
592,143 Healthcare Products - 3.29% 6,088 Integer Holdings Corp. * 220,081 2,540 Livanova, Plc. * 128,016
348,097 Healthcare Services - 2.87% 3,278 Adeptus Health, Inc. (a) * 22,127 5,540 Tenet Healthcare Corp. * 106,922 2,300 US Physical Therapy, Inc. 173,995
303,044 Home Builders - 2.43% 4,795 Dr Horton, Inc. 153,440 3,557 LGI Homes, Inc. * 103,189
256,629 Insurance - 2.07% 344 National Western Life Group, Inc. 109,340 1,414 Torchmark Corp. 109,627
218,967 Investment Companies - 1.00% 2,868 Main Street Capital Corp. 106,087 Iron & Steel - 1.12% 5,600 Commercial Metals Co. 118,328 Lodging - 1.08% 8,200 La Quinta Holdings, Inc. * 113,652 Machinery-Diversified - 0.62% 1,399 Flowserve Corp. 64,984 Media - 0.54% 820 Nexstar Media Group, Inc. 56,539 Miscellaneous Manufacturing - 1.30% 1,175 AZZ, Inc. 68,914 2,540 Trinity Industries, Inc. 68,174
137,088 * Non-Income producing. (a) Security, or a portion of the security is out on loan at February 28, 2017. Total loaned securities had a fair value of $141,545 at February 28, 2017. The accompanying notes are an integral part of these financial statements.

THE TEXAS FUND
SCHEDULE OF INVESTMENTS (CONTINUED) FEBRUARY 28, 2017 (UNAUDITED)
27
Shares Fair Value Oil & Gas - 12.41% 1,056 Anadarko Petroleum Corp. $ 68,270 1,317 Apache Corp. 69,261 3,290 Atwood Oceanics, Inc. * 34,578 2,483 Cabot Oil & Gas Corp. 54,378 1,620 Carrizo Oil & Gas, Inc. * 52,731 602 Cheniere Energy, Inc. * 28,926 860 Concho Resources, Inc. * 113,907 4,880 Denbury Resources, Inc. * 13,225 418 Diamonback Energy, Inc. * 42,159 622 EOG Resources, Inc. 60,328 673 Exxon Mobil Corp. 54,728 1,770 HollyFrontier Corp. 51,826 1,528 Marathon Oil Corp. 24,448 2,444 Matador Resources Co. * 58,827 5,114 Oasis Petroleum, Inc. * 72,414 2,049 Patterson-UTI Energy, Inc. 56,593 273 Pioneer Natural Resources Co. 50,770 2,270 Range Resources Corp. 62,697 1,499 RSP Permian, Inc. * 59,196 11,400 Southwestern Energy Co. * 85,614 562 Tesoro Corp. 47,877 500 Texas Pacific Land Trust * 149,255
1,312,008 Oil & Gas Services - 4.96% 500 Baker Hughes, Inc. 30,140 1,030 Dril-Quip, Inc. * 63,191 969 Flotek Industries, Inc. (a) * 13,101 4,871 Forum Energy Technologies, Inc. * 105,701 600 Halliburton Co. 32,076 6,400 Helix Energy Solutions Group, Inc. * 52,864 1,638 National Oilwell Varco, Inc. 66,208 1,443 Oceaneering International, Inc. 40,866 750 Schlumberger Ltd. 60,270 1,846 TechnipFMC Plc. * 59,663
524,080 Pipelines - 1.59% 2,444 Enbridge, Inc. 102,292 3,086 Kinder Morgan, Inc. 65,763
168,055 * Non-Income producing. (a) Security, or a portion of the security is out on loan at February 28, 2017. Total loaned securities had a fair value of $141,545 at February 28, 2017. The accompanying notes are an integral part of these financial statements.

THE TEXAS FUND
SCHEDULE OF INVESTMENTS (CONTINUED) FEBRUARY 28, 2017 (UNAUDITED)
28
Shares Fair Value Retail - 6.62% 1,700 Copart, Inc. $ 100,538 13 Dave & Busters Entertainment, Inc. * 743 1,859 Fiesta Restaurant Group, Inc. * 36,901 4,850 GameStop Corp. Class A 118,534 675 Group 1 Automotive, Inc. 52,441 3,400 Michaels Cos., Inc. * 68,306 6,742 Rush Enterprises, Inc. Class A * 232,464 4,135 Sally Beauty Holding, Inc. * 90,432
700,359 Semiconductors - 3.80% 2,598 Cirrus Logic, Inc. * 140,500 5,246 Diodes, Inc. * 125,222 1,782 Texas Instruments, Inc. 136,537
402,259 Software - 1.98% 3,170 Realpage, Inc. * 106,988 677 Tyler Technologies, Inc. * 102,667
209,655 Telecommunications - 0.87% 2,200 AT&T, Inc. 91,938 Transportation - 0.68% 1,041 Kirby Corp. * 72,037
TOTAL FOR COMMON STOCKS (Cost $9,971,775) - 97.82% 10,343,777
MONEY MARKET FUND - 2.32%
245,718 Federated Government Obligations Fund - Institutional Class, 0.46% (b) ** 245,718
TOTAL FOR MONEY MARKET FUND (Cost $245,718) - 2.32% 245,718
TOTAL INVESTMENTS (Cost $10,217,493) - 100.14% 10,589,495 LIABILITIES IN EXCESS OF OTHER ASSETS - (0.14)% (14,742)
NET ASSETS - 100.00% $10,574,753
* Non-Income producing. ** Variable rate security; the coupon rate shown represents the 7-day yield at February 28, 2017. (b) A portion of this security is segregated as collateral for securities on loan at February 28, 2017. Total collateral had a fair value of $141,074 at February 28, 2017. The accompanying notes are an integral part of these financial statements.
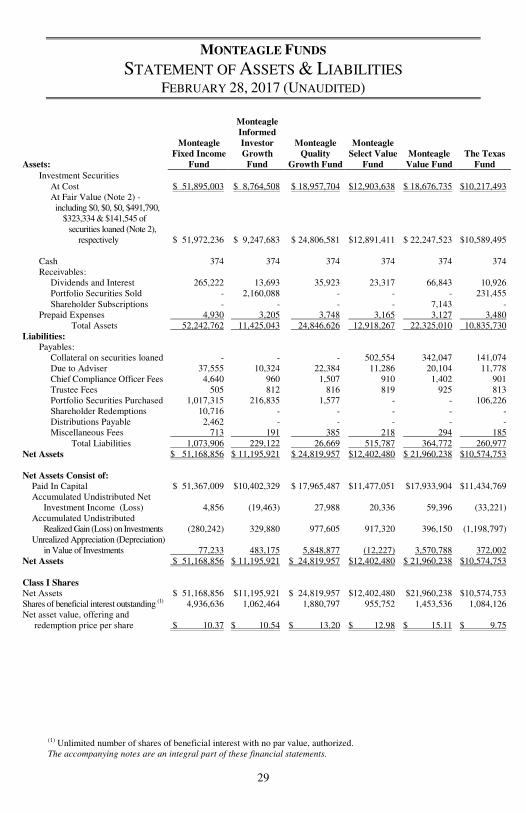
MONTEAGLE FUNDS
STATEMENT OF ASSETS & LIABILITIES FEBRUARY 28, 2017 (UNAUDITED)
29
Assets:
Monteagle Fixed Income
Fund
Monteagle Informed Investor Growth
Fund
Monteagle Quality
Growth Fund
Monteagle Select Value
Fund Monteagle
Value Fund The Texas
Fund
Investment Securities At Cost $ 51,895,003 $ 8,764,508 $ 18,957,704 $12,903,638 $ 18,676,735 $10,217,493
At Fair Value (Note 2) - including $0, $0, $0, $491,790, $323,334 & $141,545 of securities loaned (Note 2), respectively $ 51,972,236 $ 9,247,683 $ 24,806,581
$12,891,411 $ 22,247,523
$10,589,495
Cash 374 374 374 374 374 374 Receivables: Dividends and Interest 265,222 13,693 35,923 23,317 66,843 10,926 Portfolio Securities Sold - 2,160,088 - - - 231,455 Shareholder Subscriptions - - - - 7,143 - Prepaid Expenses 4,930 3,205 3,748 3,165 3,127 3,480 Total Assets 52,242,762 11,425,043 24,846,626 12,918,267 22,325,010 10,835,730 Liabilities: Payables: Collateral on securities loaned - - - 502,554 342,047 141,074 Due to Adviser 37,555 10,324 22,384 11,286 20,104 11,778 Chief Compliance Officer Fees 4,640 960 1,507 910 1,402 901 Trustee Fees 505 812 816 819 925 813 Portfolio Securities Purchased 1,017,315 216,835 1,577 - - 106,226 Shareholder Redemptions 10,716 - - - - - Distributions Payable 2,462 - - - - - Miscellaneous Fees 713 191 385 218 294 185 Total Liabilities 1,073,906 229,122 26,669 515,787 364,772 260,977 Net Assets $ 51,168,856 $ 11,195,921 $ 24,819,957 $12,402,480 $ 21,960,238 $10,574,753 Net Assets Consist of: Paid In Capital $ 51,367,009 $10,402,329 $ 17,965,487 $11,477,051 $17,933,904 $11,434,769 Accumulated Undistributed Net Investment Income (Loss) 4,856 (19,463) 27,988 20,336 59,396 (33,221) Accumulated Undistributed Realized Gain (Loss) on Investments (280,242) 329,880 977,605 917,320 396,150 (1,198,797) Unrealized Appreciation (Depreciation) in Value of Investments 77,233
483,175
5,848,877
(12,227)
3,570,788
372,002
Net Assets $ 51,168,856 $ 11,195,921 $ 24,819,957 $12,402,480 $ 21,960,238 $10,574,753
Class I Shares Net Assets $ 51,168,856 $11,195,921 $ 24,819,957 $12,402,480 $21,960,238 $10,574,753 Shares of beneficial interest outstanding (1) 4,936,636 1,062,464 1,880,797 955,752 1,453,536 1,084,126 Net asset value, offering and redemption price per share $ 10.37 $ 10.54 $ 13.20 $ 12.98 $ 15.11 $ 9.75
(1) Unlimited number of shares of beneficial interest with no par value, authorized. The accompanying notes are an integral part of these financial statements.

MONTEAGLE FUNDS STATEMENT OF OPERATIONS
FOR THE SIX MONTHS ENDED FEBRUARY 28, 2017 (UNAUDITED)
30
Monteagle Fixed
Income Fund
Monteagle Informed Investor Growth
Fund
Monteagle Quality Growth
Fund
Monteagle Select
Value Fund
Monteagle Value Fund
The Texas Fund
Investment Income: Dividends $ - $ 54,928 $ 196,468 $ 114,396 $ 293,803 $ 61,849 Interest 573,105 4,932 2,200 2,407 1,936 411 Securities Lending - 6,302 - 1,052 10,829 2,441 Total Investment Income 573,105 66,162 198,668 117,855 306,568 64,701 Expenses: Advisory Fees 246,093 67,208 144,758 68,431 124,538 72,065 Chief Compliance Officer Fees 18,304 5,583 9,038 5,544 8,135 5,216 Trustee Fees 3,025 3,326 3,330 3,333 3,439 3,328 Legal Fees 2,620 2,620 2,620 2,620 2,920 2,620 ICI Membership Fees 468 135 240 128 120 188 Miscellaneous Fees 1,419 389 771 443 586 451 Total Expenses 271,929 79,261 160,757 80,499 139,738 83,868 Net Investment Income (Loss) 301,176 (13,099) 37,911 37,356 166,830 (19,167) REALIZED AND UNREALIZED GAIN (LOSS) ON INVESTMENTS AND OPTIONS: Net Realized Gain (Loss) from Investments (48,353) 406,939 991,145
1,178,698
1,450,290
259,128
Net Realized Loss from Options Purchased and Written - - - - - (39,973) Net Change in Unrealized Appreciation (Depreciation) on Investments (1,142,042) 29,891 662,788 101,990 538,618 750,375 Net Realized and Unrealized Gain (Loss) on Investments (1,190,395) 436,830 1,653,933 1,280,688 1,988,908 969,530 Net Increase (Decrease) in Net Assets Resulting from Operations $ (889,219) $ 423,731
$1,691,844 $ 1,318,044
$2,155,738 $ 950,363
The accompanying notes are an integral part of these financial statements.

MONTEAGLE FIXED INCOME FUND STATEMENTS OF CHANGES IN NET ASSETS
31
(Unaudited) Six Months For the Ended Year Ended 2/28/2017 8/31/2016 Increase (Decrease) in Net Assets From Operations:
Net Investment Income $ 301,176 $ 571,208 Net Realized Gain (Loss) on Investment Transactions (48,353) 132,483 Net Change in Unrealized Appreciation (Depreciation) on Investments (1,142,042) 1,086,338 Net Increase (Decrease) in Net Assets Resulting from Operations (889,219) 1,790,029 Distributions to Shareholders from: Net Investment Income: Class I (298,883) (647,559) Realized Gains: Class I - - Net Change in Net Assets from Distributions (298,883) (647,559) Capital Share Transactions: Proceeds from Sale of Shares: Class I 2,496,226 1,615,881 Shares Issued on Reinvestment of Dividends Class I 287,665 628,695 Cost of Shares Redeemed: Class I (2,663,960) (1,000,966) Net Increase from Shareholder Activity 119,931 1,243,610 Net Assets: Net Increase (Decrease) in Net Assets (1,068,171) 2,386,080 Beginning of Period 52,237,027 79,850,947 End of Period (Including Accumulated Undistributed Net Investment Income of $4,856 and $2,563, respectively) $ 51,168,856 $52,237,027
The accompanying notes are an integral part of these financial statements.

MONTEAGLE INFORMED INVESTOR GROWTH FUND STATEMENTS OF CHANGES IN NET ASSETS
32
(Unaudited) Six Months For the Ended Year Ended 2/28/2017 8/31/2016 Increase (Decrease) in Net Assets From Operations:
Net Investment Loss $ (13,099) $ (29,214) Net Realized Gain on Investment Transactions 406,939 603,684 Net Change in Unrealized Appreciation (Depreciation) on Investments 29,891 213,167 Net Increase in Net Assets Resulting from Operations 423,731 787,637 Distributions to Shareholders from: Net Investment Income: Class I - - Realized Gains: Class I (482,610) (975,365) Net Change in Net Assets from Distributions (482,610) (975,365) Capital Share Transactions: Proceeds from Sale of Shares: Class I 54,317 176,893 Shares Issued on Reinvestment of Dividends Class I 24,367 75,161 Cost of Shares Redeemed: Class I (365,106) (498,457) Net Decrease from Shareholder Activity (286,422) (246,403) Net Assets: Net Decrease in Net Assets (345,301) (434,131)
Beginning of Period 11,541,222 11,975,353 End of Period (Including Accumulated Net Investment
Loss of $(19,463) and $(6,364), respectively) $ 11,195,921 $ 11,541,222 The accompanying notes are an integral part of these financial statements.

MONTEAGLE QUALITY GROWTH FUND STATEMENTS OF CHANGES IN NET ASSETS
33
(Unaudited) Six Months For the Ended Year Ended 2/28/2017 8/31/2016 Increase (Decrease) in Net Assets From Operations:
Net Investment Income $ 37,911 $ 87,276 Net Realized Gain on Investment Transactions 991,145 1,959,572 Net Change in Unrealized Appreciation (Depreciation) on Investments 662,788 (277,830) Net Increase in Net Assets Resulting from Operations 1,691,844 1,769,018 Distributions to Shareholders from: Net Investment Income: Class I (45,678) (102,638) Realized Gains: Class I (1,664,116) (1,580,560) Net Change in Net Assets from Distributions (1,709,794) (1,683,198) Capital Share Transactions: Proceeds from Sale of Shares: Class I 74,027 163,931 Shares Issued on Reinvestment of Dividends Class I 106,793 106,311 Cost of Shares Redeemed: Class I (124,138) (337,662) Net Increase (Decrease) from Shareholder Activity 56,682 (67,420) Net Assets: Net Increase in Net Assets 38,732 18,400
Beginning of Period 24,781,225 24,762,825 End of Period (Including Accumulated Undistributed Net
Investment Income of $27,988 and $35,754, respectively) $ 24,819,957 $ 24,781,225 The accompanying notes are an integral part of these financial statements.

MONTEAGLE SELECT VALUE FUND STATEMENTS OF CHANGES IN NET ASSETS
34
(Unaudited) Six Months For the Ended Year Ended 2/28/2017 8/31/2016 Increase (Decrease) in Net Assets From Operations:
Net Investment Income $ 37,356 $ 92,579 Net Realized Gain on Investment Transactions 1,178,698 75,018 Net Change in Unrealized Appreciation (Depreciation) on Investments 101,990 129,108 Net Increase in Net Assets Resulting from Operations 1,318,044 296,705 Distributions to Shareholders from: Net Investment Income: Class I (17,780) (113,401) Realized Gains: Class I (255,748) (3,404,267) Net Change in Net Assets from Distributions (273,528) (3,517,668) Capital Share Transactions: Proceeds from Sale of Shares: Class I 1,110,793 2,027,114 Shares Issued on Reinvestment of Dividends Class I 238,446 3,430,579 Cost of Shares Redeemed: Class I (309,588) (5,607,796) Net Increase (Decrease) from Shareholder Activity 1,039,651 (150,103) Net Assets: Net Increase (Decrease) in Net Assets 2,084,167 (3,371,066) Beginning of Period 10,318,313 13,689,379 End of Period (Including Accumulated Undistributed Net Investment Income of $20,336 and $760, respectively) $ 12,402,480 $10,318,313
The accompanying notes are an integral part of these financial statements.

MONTEAGLE VALUE FUND STATEMENTS OF CHANGES IN NET ASSETS
35
(Unaudited) Six Months For the Ended Year Ended 2/28/2017 8/31/2016 Increase (Decrease) in Net Assets From Operations:
Net Investment Income $ 166,830 $ 283,054 Net Realized Gain (Loss) on Investment Transactions 1,450,290 (51,614) Net Change in Unrealized Appreciation on Investments 538,618 2,670,664 Net Increase in Net Assets Resulting from Operations 2,155,738 2,902,104 Distributions to Shareholders from: Net Investment Income: Class I (147,863) (276,102) Realized Gains: Class I (1,008,633) (1,138,794) Net Change in Net Assets from Distributions (1,156,496) (1,414,896) Capital Share Transactions: Proceeds from Sale of Shares: Class I 1,168,913 698,123 Shares Issued on Reinvestment of Dividends Class I 5,154 6,045 Cost of Shares Redeemed: Class I (25,686) (381,403) Net Increase from Shareholder Activity 1,148,381 322,765 Net Assets: Net Increase in Net Assets 2,147,623 1,809,973 Beginning of Period 19,812,615 18,002,642 End of Period (Including Accumulated Undistributed Net Investment Income of $59,396 and $40,429, respectively) $ 21,960,238 $ 19,812,615
The accompanying notes are an integral part of these financial statements.

THE TEXAS FUND STATEMENTS OF CHANGES IN NET ASSETS
36
(Unaudited) Six Months For the Ended Year Ended 2/28/2017 8/31/2016 Increase (Decrease) in Net Assets From Operations:
Net Investment Loss $ (19,167) $ (35,657) Net Realized Gain (Loss) on Investment and Options Transactions 219,155 (314,546) Net Change in Unrealized Appreciation on Investments 750,375 176,686 Net Increase (Decrease) in Net Assets Resulting from Operations 950,363 (173,517) Capital Share Transactions: Proceeds from Sale of Shares: Class I 697,079 1,035,366 Class C - - Cost of Shares Redeemed: Class I (564,381) (2,385,446) Class C - (18,824) Net Increase (Decrease) from Shareholder Activity 132,698 (1,368,904) Net Assets: Net Increase (Decrease) in Net Assets 1,083,061 (1,542,421) Beginning of Period 9,491,692 11,034,113 End of Period (Including Accumulated Net Investment Loss of $(33,221) and $(14,054), respectively) $ 10,574,753 $ 9,491,692
The accompanying notes are an integral part of these financial statements.

MONTEAGLE FIXED INCOME FUND FINANCIAL HIGHLIGHTS
SELECTED DATA FOR A SHARE OUTSTANDING THROUGHOUT THE PERIOD.
37
(Unaudited) Six Months Ended Fiscal Years Ended
Class I Shares 2/28/2017 8/31/2016 8/31/2015 8/31/2014 8/31/2013 8/31/2012
Net Asset Value, at Beginning of Period $ 10.61 $ 10.38 $ 10.44 $ 10.25 $ 10.80 $ 10.70 Income From Investment Operations: Net Investment Income 0.06 * 0.13 0.14 0.14 0.19 0.27 Net Gain (Loss) on Securities (Realized and Unrealized) (0.24) 0.23 (0.06) 0.19 (0.55) 0.10 Total from Investment Operations (0.18) 0.36 0.08 0.33 (0.36) 0.37 Distributions: From Net Investment Income (0.06) (0.13) (0.14) (0.14) (0.19) (0.27) From Net Realized Gain - - - - - - Total from Distributions (0.06) (0.13) (0.14) (0.14) (0.19) (0.27) Net Asset Value, at End of Period $ 10.37 $ 10.61 $ 10.38 $ 10.44 $ 10.25 $ 10.80 Total Return ** (1.69)% (b) 3.51% 0.72% 3.23% (3.41)% 3.48% Ratios/Supplemental Data: Net Assets at End of Period (Thousands) $ 51,169 $ 52,237 $ 49,851 $ 42,601 $ 39,387 $ 35,896 Ratio of Expenses to Average Net Assets 1.06% (a) 1.07% 1.05% 1.05% 1.06% 1.09% Ratio of Net Investment Income to Average Net Assets 1.18% (a) 1.12% 1.23% 1.32% 1.68% 2.46% Portfolio Turnover 4% (b) 12% 15% 13% 22% 23%
* Per share net investment income has been determined on the basis of average shares outstanding during the period. ** Total return in the above table represents the rate that the investor would have earned or lost on an investment in the Fund assuming reinvestment of dividends, and is not annualized for periods of less than one year. Returns do not reflect the deduction of taxes a shareholder would pay on Fund distributions or in redemption of Fund shares. (a) Annualized (b) Not Annualized The accompanying notes are an integral part of these financial statements.
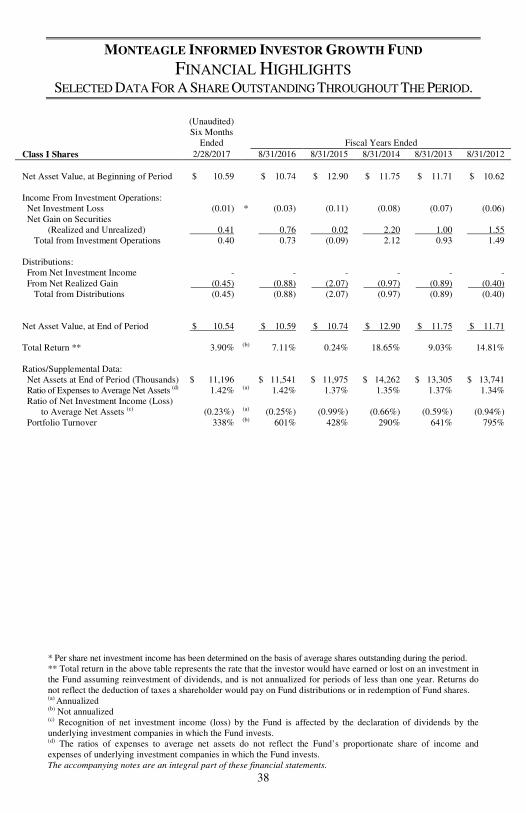
MONTEAGLE INFORMED INVESTOR GROWTH FUND FINANCIAL HIGHLIGHTS
SELECTED DATA FOR A SHARE OUTSTANDING THROUGHOUT THE PERIOD.
38
(Unaudited) Six Months Ended Fiscal Years Ended
Class I Shares 2/28/2017 8/31/2016 8/31/2015 8/31/2014 8/31/2013 8/31/2012
Net Asset Value, at Beginning of Period $ 10.59 $ 10.74 $ 12.90 $ 11.75 $ 11.71 $ 10.62 Income From Investment Operations: Net Investment Loss (0.01) * (0.03) (0.11) (0.08) (0.07) (0.06) Net Gain on Securities (Realized and Unrealized) 0.41 0.76 0.02 2.20 1.00 1.55 Total from Investment Operations 0.40 0.73 (0.09) 2.12 0.93 1.49 Distributions: From Net Investment Income - - - - - - From Net Realized Gain (0.45) (0.88) (2.07) (0.97) (0.89) (0.40) Total from Distributions (0.45) (0.88) (2.07) (0.97) (0.89) (0.40) Net Asset Value, at End of Period $ 10.54 $ 10.59 $ 10.74 $ 12.90 $ 11.75 $ 11.71 Total Return ** 3.90% (b) 7.11% 0.24% 18.65% 9.03% 14.81% Ratios/Supplemental Data: Net Assets at End of Period (Thousands) $ 11,196 $ 11,541 $ 11,975 $ 14,262 $ 13,305 $ 13,741 Ratio of Expenses to Average Net Assets (d) 1.42% (a) 1.42% 1.37% 1.35% 1.37% 1.34% Ratio of Net Investment Income (Loss) to Average Net Assets (c) (0.23%) (a) (0.25%) (0.99%) (0.66%) (0.59%) (0.94%) Portfolio Turnover 338% (b) 601% 428% 290% 641% 795%
* Per share net investment income has been determined on the basis of average shares outstanding during the period. ** Total return in the above table represents the rate that the investor would have earned or lost on an investment in the Fund assuming reinvestment of dividends, and is not annualized for periods of less than one year. Returns do not reflect the deduction of taxes a shareholder would pay on Fund distributions or in redemption of Fund shares. (a) Annualized (b) Not annualized (c) Recognition of net investment income (loss) by the Fund is affected by the declaration of dividends by the underlying investment companies in which the Fund invests. (d) The ratios of expenses to average net assets do not reflect the Fund’s proportionate share of income and expenses of underlying investment companies in which the Fund invests. The accompanying notes are an integral part of these financial statements.

MONTEAGLE QUALITY GROWTH FUND FINANCIAL HIGHLIGHTS
SELECTED DATA FOR A SHARE OUTSTANDING THROUGHOUT THE PERIOD.
39
(Unaudited) Six Months Ended Fiscal Years Ended
Class I Shares 2/28/2017 8/31/2016 8/31/2015 8/31/2014 8/31/2013 8/31/2012
Net Asset Value, at Beginning of Period $ 13.21 $ 13.16 $ 12.99 $ 10.65 $ 9.95 $ 8.71 Income From Investment Operations: Net Investment Income 0.02 * 0.04 0.05 - *** 0.04 0.02 Net Gain (Loss) on Securities (Realized and Unrealized) 0.88 0.90 0.26 2.35 0.72 1.22 Total from Investment Operations 0.90 0.94 0.31 2.35 0.76 1.24 Distributions: From Net Investment Income (0.02) (0.05) (0.02) (0.01) (0.06) - (a) From Net Realized Gain (0.89) (0.84) (0.12) - - - Total from Distributions (0.91) (0.89) (0.14) (0.01) (0.06) - Net Asset Value, at End of Period $ 13.20 $ 13.21 $ 13.16 $ 12.99 $ 10.65 $ 9.95 Total Return ** 7.19% (c) 7.52% 2.43% 22.05% 7.62% 14.26% Ratios/Supplemental Data: Net Assets at End of Period (Thousands) $ 24,820 $ 24,781 $ 24,763 $ 24,057 $ 25,553 $ 28,225 Ratio of Expenses to Average Net Assets 1.33% (b) 1.34% 1.31% 1.31% 1.30% 1.33% Ratio of Net Investment Income to Average Net Assets 0.31% (b) 0.36% 0.36% 0.03% 0.34% 0.26% Portfolio Turnover 19% (c) 34% 25% 27% 50% 54%
* Per share net investment income has been determined on the basis of average shares outstanding during the period. ** Total return in the above table represents the rate that the investor would have earned or lost on an investment in the Fund assuming reinvestment of dividends, and is not annualized for periods of less than one year. Returns do not reflect the deduction of taxes a shareholder would pay on Fund distributions or in redemption of Fund shares. *** The amount is less than $0.005 per share. (a) Distributions per share were $(0.0016) for the year ended August 31, 2012. (b) Annualized (c) Not Annualized The accompanying notes are an integral part of these financial statements.

MONTEAGLE SELECT VALUE FUND FINANCIAL HIGHLIGHTS
SELECTED DATA FOR A SHARE OUTSTANDING THROUGHOUT THE PERIOD.
40
(Unaudited) Six Months Ended Fiscal Years Ended
Class I Shares 2/28/2017 8/31/2016 8/31/2015 8/31/2014 8/31/2013 8/31/2012
Net Asset Value, at Beginning of Period $ 11.83 $ 15.86 $ 18.66 $ 15.07 $ 10.95 $ 10.16 Income From Investment Operations: Net Investment Income 0.04 * 0.09 0.15 0.15 0.14 0.13 Net Gain (Loss) on Securities (Realized and Unrealized) 1.41 0.22 (0.87) 3.90 4.13 0.78 Total from Investment Operations 1.45 0.31 (0.72) 4.05 4.27 0.91 Distributions: From Net Investment Income (0.02) (0.13) (0.15) (0.13) (0.15) (0.12) From Net Realized Gain (0.28) (4.21) (1.93) (0.33) - - Total from Distributions (0.30) (4.34) (2.08) (0.46) (0.15) (0.12) Net Asset Value, at End of Period $ 12.98 $ 11.83 $ 15.86 $ 18.66 $ 15.07 $ 10.95 Total Return ** 12.26% (b) 4.75% (4.10)% 27.29% 39.26% 9.01% Ratios/Supplemental Data: Net Assets at End of Period (Thousands) $ 12,402 $ 10,318 $ 13,689 $ 16,314 $ 14,339 $ 10,177 Ratio of Expenses to Average Net Assets 1.41% (a) 1.43% 1.35% 1.35% 1.37% 1.43% Ratio of Net Investment Income to Average Net Assets 0.65% (a) 0.87% 0.87% 0.86% 1.06% 1.23% Portfolio Turnover 42% (b) 25% 62% 29% 36% 8%
* Per share net investment income has been determined on the basis of average shares outstanding during the period. ** Total return in the above table represents the rate that the investor would have earned or lost on an investment in the Fund assuming reinvestment of dividends, and is not annualized for periods of less than one year. Returns do not reflect the deduction of taxes a shareholder would pay on Fund distributions or in redemption of Fund shares. (a) Annualized (b) Not Annualized The accompanying notes are an integral part of these financial statements.
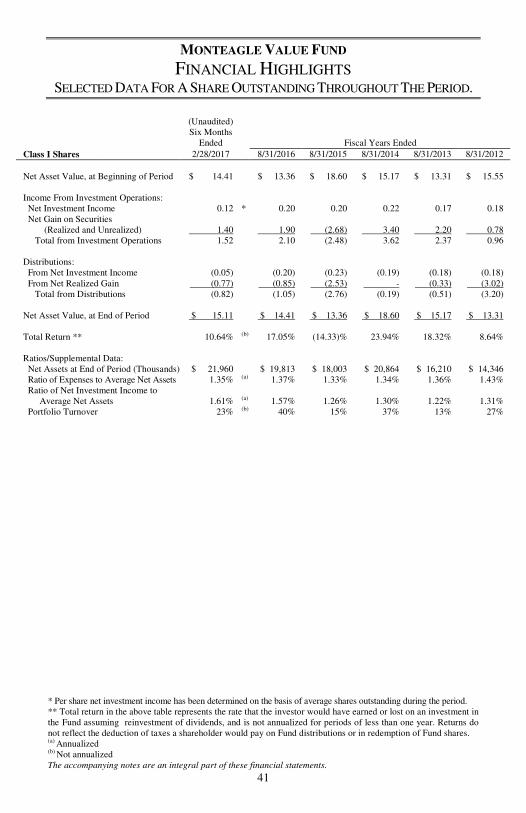
MONTEAGLE VALUE FUND FINANCIAL HIGHLIGHTS
SELECTED DATA FOR A SHARE OUTSTANDING THROUGHOUT THE PERIOD.
41
(Unaudited) Six Months Ended Fiscal Years Ended
Class I Shares 2/28/2017 8/31/2016 8/31/2015 8/31/2014 8/31/2013 8/31/2012
Net Asset Value, at Beginning of Period $ 14.41 $ 13.36 $ 18.60 $ 15.17 $ 13.31 $ 15.55 Income From Investment Operations: Net Investment Income 0.12 * 0.20 0.20 0.22 0.17 0.18 Net Gain on Securities (Realized and Unrealized) 1.40 1.90 (2.68) 3.40 2.20 0.78 Total from Investment Operations 1.52 2.10 (2.48) 3.62 2.37 0.96 Distributions: From Net Investment Income (0.05) (0.20) (0.23) (0.19) (0.18) (0.18) From Net Realized Gain (0.77) (0.85) (2.53) - (0.33) (3.02) Total from Distributions (0.82) (1.05) (2.76) (0.19) (0.51) (3.20) Net Asset Value, at End of Period $ 15.11 $ 14.41 $ 13.36 $ 18.60 $ 15.17 $ 13.31 Total Return ** 10.64% (b) 17.05% (14.33)% 23.94% 18.32% 8.64% Ratios/Supplemental Data: Net Assets at End of Period (Thousands) $ 21,960 $ 19,813 $ 18,003 $ 20,864 $ 16,210 $ 14,346 Ratio of Expenses to Average Net Assets 1.35% (a) 1.37% 1.33% 1.34% 1.36% 1.43% Ratio of Net Investment Income to Average Net Assets 1.61% (a) 1.57% 1.26% 1.30% 1.22% 1.31% Portfolio Turnover 23% (b) 40% 15% 37% 13% 27%
* Per share net investment income has been determined on the basis of average shares outstanding during the period. ** Total return in the above table represents the rate that the investor would have earned or lost on an investment in the Fund assuming reinvestment of dividends, and is not annualized for periods of less than one year. Returns do not reflect the deduction of taxes a shareholder would pay on Fund distributions or in redemption of Fund shares. (a) Annualized (b) Not annualized The accompanying notes are an integral part of these financial statements.

THE TEXAS FUND FINANCIAL HIGHLIGHTS
SELECTED DATA FOR A SHARE OUTSTANDING THROUGHOUT THE PERIOD.
42
(Unaudited) Six Months Period Ended Fiscal Years Ended Ended (c)
Class I Shares 2/28/2017 8/31/2016 8/31/2015 8/31/2014
Net Asset Value, at Beginning of Period $ 8.88 $ 8.92 $ 10.91 $ 10.00 Income From Investment Operations: Net Investment Loss (0.02) * (0.03) (0.03) (0.03) Net Gain on Securities (Realized and Unrealized) (d) 0.89 (0.01) (1.65) 0.94 Total from Investment Operations 0.87 (0.04) (1.68) 0.91 Distributions: From Net Investment Income - - - - From Net Realized Gain - - (0.31) - Total from Distributions - - (0.31) - Net Asset Value, at End of Period $ 9.75 $ 8.88 $ 8.92 $ 10.91 Total Return ** 9.80% (b) (0.45)% (15.53)% 9.10% (b) Ratios/Supplemental Data: Net Assets at End of Period (Thousands) $ 10,575 $ 9,492 $ 11,014 $ 11,995 Ratio of Expenses to Average Net Assets 1.68% (a) 1.71% 1.60% 1.64% (a) Ratio of Net Investment Loss to Average Net Assets (0.38%) (a) (0.37)% (0.33)% (0.41)% (a) Portfolio Turnover 24% (b) 48% 59% 38% (b)
* Per share net investment income has been determined on the basis of average shares outstanding during the period. ** Total return in the above table represents the rate that the investor would have earned or lost on an investment in the Fund assuming reinvestment of dividends, and is not annualized for periods of less than one year. Returns do not reflect the deduction of taxes a shareholder would pay on Fund distributions or in redemption of Fund shares. (a) Annualized (b) Not annualized (c) Represents the period from the initial public offering (September 17, 2013) through August 31, 2014. (d) Realized and unrealized gains and losses per share in this caption are balancing amounts necessary to reconcile the change in net asset value per share for the period, and may not reconcile with the aggregate gains and losses in the Statements of Operations due to share transactions for the period. The accompanying notes are an integral part of these financial statements.

MONTEAGLE FUNDS
NOTES TO FINANCIAL STATEMENTS FEBRUARY 28, 2017 (UNAUDITED)
43
1. ORGANIZATION Monteagle Funds (“the Trust”) was organized as a business trust under the laws of the State of Delaware on November 26, 1997 as Memorial Funds. The Trust changed its name to Monteagle Funds in July, 2006. The Trust is registered with the Securities and Exchange Commission (“SEC”) as an open-end, management investment company under the Investment Company Act of 1940. The Trust is authorized by its Declaration of Trust to issue an unlimited number of shares of beneficial interest in each series. The Trust currently consists of the following series (each a “Fund” and collectively the “Funds”):
Monteagle Fixed Income Fund Monteagle Informed Investor Growth Fund Monteagle Quality Growth Fund Monteagle Select Value Fund Monteagle Value Fund The Texas Fund
The Monteagle Fixed Income Fund (“Fixed Income Fund”), Monteagle Quality Growth Fund (“Quality Growth Fund”), Monteagle Select Value Fund (“Select Value Fund”), Monteagle Value Fund (“Value Fund”) and The Texas Fund (“Texas Fund”) are each a diversified series of Monteagle Funds. The Monteagle Informed Investor Growth Fund (“Informed Investor Growth Fund”) is a non-diversified series of Monteagle Funds. The principal investment objective of the Fixed Income Fund is total return. The principal investment objective of each of Informed Investor Growth Fund, Quality Growth Fund, Select Value Fund, Value Fund and Texas Fund (collectively the “Equity Funds”) is long-term capital appreciation. The Fixed Income Fund, Informed Investor Growth Fund, Quality Growth Fund, Select Value Fund, Value Fund and Texas Fund are authorized to offer one class of shares, Class I. The Funds follow the investment company accounting and reporting guidance of the Financial Accounting Standards Board (“FASB”) Accounting Standards Codification Topic 946 Financial Services - Investment Companies. 2. SIGNIFICANT ACCOUNTING POLICIES The following is a summary of the Funds’ significant accounting policies: Securities Valuation — Equity securities, including common stocks and exchange-traded funds, held by the Funds for which market quotations are readily available are valued using the last reported sales price or the official closing price provided by independent pricing services as of the close of trading on the New York Stock Exchange (normally 4:00 p.m. Eastern time) on each Fund’s business day. If no sales are reported, the average of the last bid and ask price is used. If no average price is available, the last

MONTEAGLE FUNDS
NOTES TO FINANCIAL STATEMENTS (CONTINUED) FEBRUARY 28, 2017 (UNAUDITED)
44
bid price is used. To the extent these securities are actively traded and valuation adjustments are not applied, they are categorized in level 1 of the fair value hierarchy described below. When an equity security is valued by the independent pricing service using factors other than market quotations or the market is considered inactive, they will be categorized in level 2. Fixed income securities such as corporate bonds, municipal bonds, and U.S. government and agency obligations, are valued using an independent pricing service that considers market observable data such as reported sales of similar securities, broker quotes, yields, bids, offers, and other reference data. These securities are categorized as level 2 securities. The fair value of mortgage-backed securities is estimated by an independent pricing service which uses models that consider interest rate movements, new issue information and other security pertinent data. Evaluations of tranches (non-volatile, volatile, or credit sensitive) are based on interpretations of accepted Wall Street modeling and pricing conventions. Mortgage-backed securities are categorized in level 2 of the fair value hierarchy described below to the extent the inputs are observable and timely. In the absence of readily available market quotations, or other observable inputs, securities are valued at fair value pursuant to procedures adopted by the Board of Trustees and would be categorized as level 3. Options contracts that are actively traded are valued based on quoted prices from the exchange and categorized in level 1 of the fair value hierarchy. Options held by the Funds for which no current quotations are readily available and which are not traded on the valuation date are valued at the average of the last bid and ask price and are categorized within level 2 of the fair value hierarchy. Depending on the product and terms of the transaction, the fair value of options can be modeled taking into account the counterparties’ creditworthiness and using a series of techniques, including simulation models. Many pricing models do not entail material subjectivity because the methodologies employed do not necessitate significant judgments, and the pricing inputs are observed from actively quoted markets, as is the case of options contracts. Options contracts valued using pricing models are categorized within level 2 of the fair value hierarchy. Money market funds are valued at their net asset value of $1.00 per share and are categorized as level 1. Securities with maturities of 60 days or less may be valued at amortized cost, which approximates fair value and would be categorized as level 2. Various inputs are used in determining the value of each of the Fund’s investments. These inputs are summarized in the three broad levels listed below: ● Level 1 – quoted prices in active markets for identical securities ● Level 2 – other significant observable inputs ● Level 3 – significant unobservable inputs The inputs or methodology used for valuing securities are not necessarily an indication of the risk associated with investing in those securities.
MONTEAGLE FUNDS
NOTES TO FINANCIAL STATEMENTS (CONTINUED) FEBRUARY 28, 2017 (UNAUDITED)
45
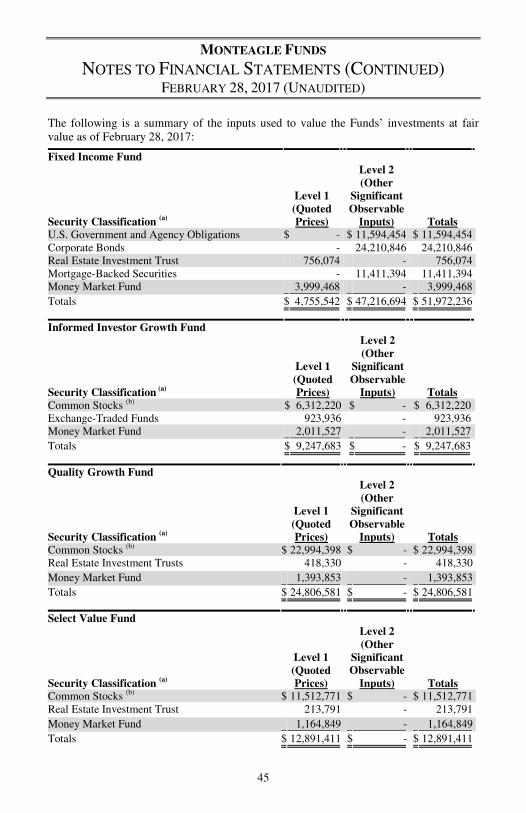
The following is a summary of the inputs used to value the Funds’ investments at fair value as of February 28, 2017:
Fixed Income Fund
Security Classification (a)
Level 1 (Quoted Prices)
Level 2 (Other
Significant Observable
Inputs) Totals U.S. Government and Agency Obligations $ - $ 11,594,454 $ 11,594,454 Corporate Bonds - 24,210,846 24,210,846 Real Estate Investment Trust 756,074 - 756,074 Mortgage-Backed Securities - 11,411,394 11,411,394 Money Market Fund 3,999,468 - 3,999,468
Totals $ 4,755,542 $ 47,216,694 $ 51,972,236
Informed Investor Growth Fund
Security Classification (a)
Level 1 (Quoted Prices)
Level 2 (Other
Significant Observable
Inputs) Totals Common Stocks (b) $ 6,312,220 $ - $ 6,312,220 Exchange-Traded Funds 923,936 - 923,936 Money Market Fund 2,011,527 - 2,011,527
Totals $ 9,247,683 $ - $ 9,247,683
Quality Growth Fund
Security Classification (a)
Level 1 (Quoted Prices)
Level 2 (Other
Significant Observable
Inputs) Totals Common Stocks (b) $ 22,994,398 $ - $ 22,994,398 Real Estate Investment Trusts 418,330 - 418,330
Money Market Fund 1,393,853 - 1,393,853
Totals $ 24,806,581 $ - $ 24,806,581
Select Value Fund
Security Classification (a)
Level 1 (Quoted Prices)
Level 2 (Other
Significant Observable
Inputs) Totals Common Stocks (b) $ 11,512,771 $ - $ 11,512,771 Real Estate Investment Trust 213,791 - 213,791
Money Market Fund 1,164,849 - 1,164,849
Totals $ 12,891,411 $ - $ 12,891,411

MONTEAGLE FUNDS
NOTES TO FINANCIAL STATEMENTS (CONTINUED) FEBRUARY 28, 2017 (UNAUDITED)
46
Value Fund
Security Classification (a)
Level 1 (Quoted Prices)
Level 2 (Other
Significant Observable
Inputs) Totals Common Stocks (b) $ 20,423,735 $ 240,414 $ 20,664,149 Preferred Stock 144,180 - 144,180
Real Estate Investment Trust 489,744 - 489,744
Money Market Fund 949,450 - 949,450
Totals $ 22,007,109 $ 240,414 $ 22,247,523
Texas Fund
Security Classification (a)
Level 1 (Quoted Prices)
Level 2 (Other
Significant Observable
Inputs) Totals Common Stocks (b) $ 10,343,777 $ - $ 10,343,777 Money Market Fund 245,718 - 245,718
Totals $ 10,589,495 $ - $ 10,589,495
(a) As of and during the six months ended February 28, 2017, the Funds held no securities that were considered
to be “Level 3” securities (those valued using significant unobservable inputs). Therefore, a reconciliation of assets in which significant unobservable inputs (Level 3) were used in determining fair value is not applicable.
(b) All common stocks held in the Funds, except those noted in the Value Fund’s Schedule of Investments, are
Level 1 securities. For a detailed break-out of common stocks by major industry classification, please refer to the Schedules of Investments.
It is the Funds’ policy to recognize transfers between Levels at the end of the reporting period. There were no transfers into and out of any Level during the six months ended February 28, 2017. Options transactions — The Texas Fund (the “Fund”) may purchase put and call options written by others and sell put and call options covering specified individual securities, securities or financial indices or currencies. A put option (sometimes called a “standby commitment”) gives the buyer of the option, upon payment of a premium, the right to deliver a specified amount of a security, index or currency to the writer of the option on or before a fixed date at a predetermined price. A call option (sometimes called a “reverse standby commitment”) gives the purchaser of the option, upon payment of a premium, the right to call upon the writer to deliver a specified amount of a security, index or currency on or before a fixed date, at a predetermined price. The predetermined prices may be higher or lower than the market value of the underlying security, index or currency. The Fund may buy or sell both exchange-traded and over-the-counter (“OTC”) options. The Fund will purchase or write an option only if that option is traded on a recognized U.S. options exchange or if the Adviser or Sub-adviser believes that a liquid

MONTEAGLE FUNDS
NOTES TO FINANCIAL STATEMENTS (CONTINUED) FEBRUARY 28, 2017 (UNAUDITED)
47
secondary market for the option exists. When the Fund purchases an OTC option, it relies on the dealer from whom it has purchased the OTC option to make or take delivery of the security, index or currency underlying the option. Failure by the dealer to do so would result in the loss of the premium paid by the Fund as well as the loss of the expected benefit of the transaction. OTC options and the securities underlying these options currently are treated as illiquid securities by the Fund. Upon selling an option, the Fund receives a premium from the purchaser of the option. Upon purchasing an option, the Fund pays a premium to the seller of the option. The amount of premium received or paid by the Fund is based upon certain factors, including the market price of the underlying securities, index or currency, the relationship of the exercise price to the market price, the historical price volatility of the underlying assets, the option period, supply and demand and interest rates. The Fund may purchase call options on debt securities that the Fund’s Adviser or Sub-adviser intends to include in the Fund’s portfolio in order to fix the cost of a future purchase. Call options may also be purchased to participate in an anticipated price increase of a security on a more limited risk basis than would be possible if the security itself were purchased. If the price of the underlying security declines, this strategy would serve to limit the potential loss to the Fund to the option premium paid. Conversely, if the market price of the underlying security increases above the exercise price and the Fund either sells or exercises the option, any profit eventually realized will be reduced by the premium paid. The Fund may similarly purchase put options in order to hedge against a decline in market value of securities held in its portfolio. The put enables the Fund to sell the underlying security at the predetermined exercise price; thus the potential for loss to the Fund is limited to the option premium paid. If the market price of the underlying security is lower than the exercise price of the put, any profit the Fund realizes on the sale of the security would be reduced by the premium paid for the put option less any amount for which the put may be sold. The Adviser or Sub-adviser may write call options when it believes that the market value of the underlying security will not rise to a value greater than the exercise price plus the premium received. Call options may also be written to provide limited protection against a decrease in the market price of a security, in an amount equal to the call premium received less any transaction costs. The Fund may purchase and write put and call options on fixed income or equity security indexes in much the same manner as the options discussed above, except that index options may serve as a hedge against overall fluctuations in the fixed income or equity securities markets (or market sectors) or as a means of participating in an anticipated price increase in those markets. The effectiveness of hedging techniques using index options will depend on the extent to which price movements in the index selected correlate with price movements of the securities, which are being hedged. Index options are settled exclusively in cash. See note 10 for additional risks associated with options transactions.
MONTEAGLE FUNDS
NOTES TO FINANCIAL STATEMENTS (CONTINUED) FEBRUARY 28, 2017 (UNAUDITED)
48
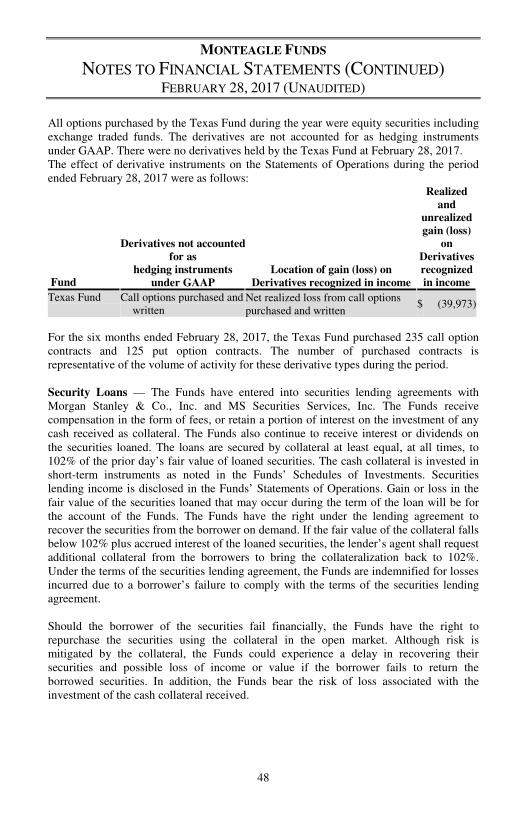
All options purchased by the Texas Fund during the year were equity securities including exchange traded funds. The derivatives are not accounted for as hedging instruments under GAAP. There were no derivatives held by the Texas Fund at February 28, 2017. The effect of derivative instruments on the Statements of Operations during the period ended February 28, 2017 were as follows:
Fund
Derivatives not accounted for as
hedging instruments under GAAP
Location of gain (loss) on Derivatives recognized in income
Realized and
unrealized gain (loss)
on Derivatives recognized in income
Texas Fund Call options purchased and written
Net realized loss from call options purchased and written
$ (39,973)
For the six months ended February 28, 2017, the Texas Fund purchased 235 call option contracts and 125 put option contracts. The number of purchased contracts is representative of the volume of activity for these derivative types during the period. Security Loans — The Funds have entered into securities lending agreements with Morgan Stanley & Co., Inc. and MS Securities Services, Inc. The Funds receive compensation in the form of fees, or retain a portion of interest on the investment of any cash received as collateral. The Funds also continue to receive interest or dividends on the securities loaned. The loans are secured by collateral at least equal, at all times, to 102% of the prior day’s fair value of loaned securities. The cash collateral is invested in short-term instruments as noted in the Funds’ Schedules of Investments. Securities lending income is disclosed in the Funds’ Statements of Operations. Gain or loss in the fair value of the securities loaned that may occur during the term of the loan will be for the account of the Funds. The Funds have the right under the lending agreement to recover the securities from the borrower on demand. If the fair value of the collateral falls below 102% plus accrued interest of the loaned securities, the lender’s agent shall request additional collateral from the borrowers to bring the collateralization back to 102%. Under the terms of the securities lending agreement, the Funds are indemnified for losses incurred due to a borrower’s failure to comply with the terms of the securities lending agreement. Should the borrower of the securities fail financially, the Funds have the right to repurchase the securities using the collateral in the open market. Although risk is mitigated by the collateral, the Funds could experience a delay in recovering their securities and possible loss of income or value if the borrower fails to return the borrowed securities. In addition, the Funds bear the risk of loss associated with the investment of the cash collateral received.
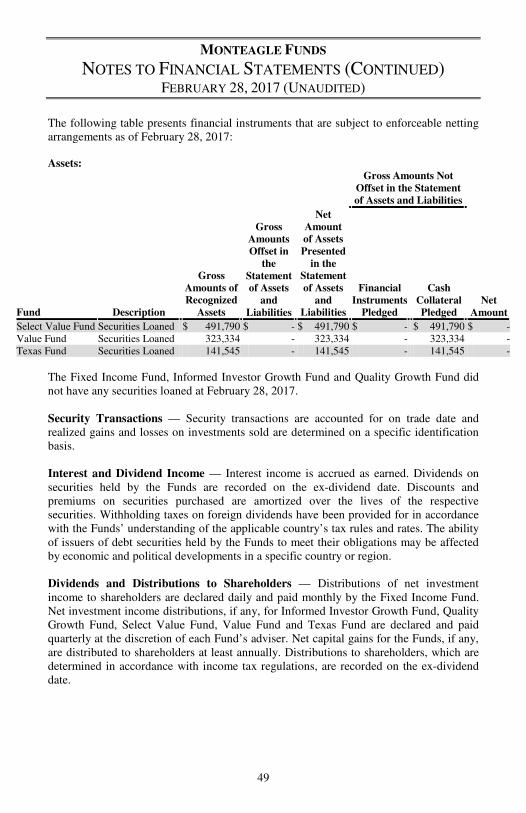
MONTEAGLE FUNDS
NOTES TO FINANCIAL STATEMENTS (CONTINUED) FEBRUARY 28, 2017 (UNAUDITED)
49
The following table presents financial instruments that are subject to enforceable netting arrangements as of February 28, 2017: Assets:
Gross Amounts Not Offset in the Statement of Assets and Liabilities
Fund Description
Gross Amounts of Recognized
Assets
Gross Amounts Offset in
the Statement of Assets
and Liabilities
Net Amount of Assets Presented
in the Statement of Assets
and Liabilities
Financial Instruments
Pledged
Cash Collateral Pledged
Net Amount
Select Value Fund Securities Loaned $ 491,790 $ - $ 491,790 $ - $ 491,790 $ -Value Fund Securities Loaned 323,334 - 323,334 - 323,334 -Texas Fund Securities Loaned 141,545 - 141,545 - 141,545 -
The Fixed Income Fund, Informed Investor Growth Fund and Quality Growth Fund did not have any securities loaned at February 28, 2017. Security Transactions — Security transactions are accounted for on trade date and realized gains and losses on investments sold are determined on a specific identification basis. Interest and Dividend Income — Interest income is accrued as earned. Dividends on securities held by the Funds are recorded on the ex-dividend date. Discounts and premiums on securities purchased are amortized over the lives of the respective securities. Withholding taxes on foreign dividends have been provided for in accordance with the Funds’ understanding of the applicable country’s tax rules and rates. The ability of issuers of debt securities held by the Funds to meet their obligations may be affected by economic and political developments in a specific country or region. Dividends and Distributions to Shareholders — Distributions of net investment income to shareholders are declared daily and paid monthly by the Fixed Income Fund. Net investment income distributions, if any, for Informed Investor Growth Fund, Quality Growth Fund, Select Value Fund, Value Fund and Texas Fund are declared and paid quarterly at the discretion of each Fund’s adviser. Net capital gains for the Funds, if any, are distributed to shareholders at least annually. Distributions to shareholders, which are determined in accordance with income tax regulations, are recorded on the ex-dividend date.

MONTEAGLE FUNDS
NOTES TO FINANCIAL STATEMENTS (CONTINUED) FEBRUARY 28, 2017 (UNAUDITED)
50
The tax character of distributions paid during the six months ended February 28, 2017 and for the year ended August 31, 2016 were as follows: Fund Ordinary Income Long-Term Capital Gain
2017 2016 2017 2016
Fixed Income Fund $ 298,883 $ 647,559 $ - $ -Informed Investor Growth Fund - 826,557 482,610 148,808Quality Growth Fund 45,678 102,638 1,664,116 1,580,560Select Value Fund 17,780 113,401 255,748 3,404,267Value Fund 147,863 273,437 1,008,633 1,141,459Texas Fund - - - -
Estimates — These financial statements are prepared in accordance with accounting principles generally accepted in the United States of America (“GAAP”), which requires management to make certain estimates and assumptions that affect the reported amounts of assets and liabilities, disclosure of contingent assets and liabilities at the date of the financial statements and the reported amounts of increases and decreases in net assets from operations during the reporting period. Actual results could differ from those estimates. Common Expenses — Common expenses of the Trust are allocated among the Funds within the Trust based on relative net assets of each Fund or the nature of the services performed and the relative applicability to each Fund. Other allocations may also be approved from time to time by the Trustees. Multiple Class Allocations — Income, expenses and realized/unrealized gains or losses are allocated to each class based on relative share balances. Distribution fees are charged to each respective share class in accordance with the distribution plan. 3. ADVISORY, SERVICING FEES AND OTHER TRANSACTIONS WITH AFFILIATES Investment Advisory Agreement Nashville Capital Corporation (“Nashville Capital” or the “Adviser”) serves as the investment adviser to the Funds. Subject to the general oversight of the Board of Trustees, the Adviser is responsible for, among other things, developing a continuing investment program for the Funds in accordance with their investment objectives, reviewing the investment strategies and policies of the Funds and advising the Board of Trustees on the selection of sub-advisers. Each Fund is authorized to pay the Adviser a fee based on average daily net assets at the following annual rates:
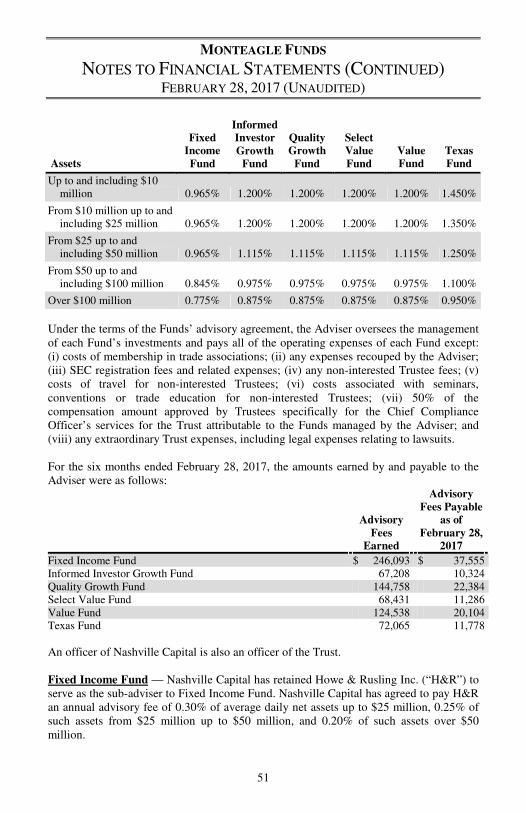
MONTEAGLE FUNDS
NOTES TO FINANCIAL STATEMENTS (CONTINUED) FEBRUARY 28, 2017 (UNAUDITED)
51
Assets
Fixed Income Fund
Informed Investor Growth
Fund
Quality Growth
Fund
Select Value Fund
Value Fund
Texas Fund
Up to and including $10 million 0.965% 1.200% 1.200% 1.200% 1.200% 1.450%
From $10 million up to and including $25 million 0.965% 1.200% 1.200% 1.200% 1.200% 1.350%
From $25 up to and including $50 million 0.965% 1.115% 1.115% 1.115% 1.115% 1.250%
From $50 up to and including $100 million 0.845% 0.975% 0.975% 0.975% 0.975% 1.100%
Over $100 million 0.775% 0.875% 0.875% 0.875% 0.875% 0.950%
Under the terms of the Funds’ advisory agreement, the Adviser oversees the management of each Fund’s investments and pays all of the operating expenses of each Fund except: (i) costs of membership in trade associations; (ii) any expenses recouped by the Adviser; (iii) SEC registration fees and related expenses; (iv) any non-interested Trustee fees; (v) costs of travel for non-interested Trustees; (vi) costs associated with seminars, conventions or trade education for non-interested Trustees; (vii) 50% of the compensation amount approved by Trustees specifically for the Chief Compliance Officer’s services for the Trust attributable to the Funds managed by the Adviser; and (viii) any extraordinary Trust expenses, including legal expenses relating to lawsuits. For the six months ended February 28, 2017, the amounts earned by and payable to the Adviser were as follows:
Advisory Fees
Earned
Advisory Fees Payable
as of February 28,
2017
Fixed Income Fund $ 246,093 $ 37,555 Informed Investor Growth Fund 67,208 10,324 Quality Growth Fund 144,758 22,384 Select Value Fund 68,431 11,286 Value Fund 124,538 20,104 Texas Fund 72,065 11,778
An officer of Nashville Capital is also an officer of the Trust. Fixed Income Fund — Nashville Capital has retained Howe & Rusling Inc. (“H&R”) to serve as the sub-adviser to Fixed Income Fund. Nashville Capital has agreed to pay H&R an annual advisory fee of 0.30% of average daily net assets up to $25 million, 0.25% of such assets from $25 million up to $50 million, and 0.20% of such assets over $50 million.
MONTEAGLE FUNDS
NOTES TO FINANCIAL STATEMENTS (CONTINUED) FEBRUARY 28, 2017 (UNAUDITED)
52
Informed Investor Growth Fund — Nashville Capital has retained T.H. Fitzgerald & Co. (“T.H. Fitzgerald”) to serve as the sub-adviser to Informed Investor Growth Fund. Nashville Capital has agreed to pay T.H. Fitzgerald an annual advisory fee of 0.50% of average daily net assets up to $25 million, 0.60% of such assets from $25 million up to $50 million, 0.50% of such assets from $50 million up to $100 million, and 0.40% of such assets over $100 million. Quality Growth Fund — Nashville Capital has retained Garcia Hamilton & Associates (“GHA”) to serve as the sub-adviser to Quality Growth Fund. Nashville Capital has agreed to pay GHA an annual advisory fee of 0.30% of average daily net assets. Select Value Fund — Nashville Capital has retained Parkway Advisors, L.P. (“Parkway”) to serve as the sub-adviser to Select Value Fund. Nashville Capital has agreed to pay Parkway an annual advisory fee of 0.50% of average daily net assets. Value Fund — Nashville Capital has retained Robinson Investment Group, Inc. (“Robinson”) to serve as the sub-adviser to Value Fund. Nashville Capital has agreed to pay Robinson an annual advisory fee of 0.50% of average daily net assets up to $25 million, 0.45% of such assets from $25 million up to $50 million, 0.35% of such assets from $50 million up to $100 million, and 0.30% of such assets over $100 million. Texas Fund — Nashville Capital has retained J. Team Financial, Inc. d/b/a Team Financial Strategies (“Team”), to serve as the sub-adviser to Texas Fund. Nashville Capital has agreed to pay Team an annual advisory fee of 0.25% of average daily net assets up to $10 million and 0.60% of such assets over $10 million. Investment Company Services Agreement Pursuant to an Investment Company Services Agreement between the Trust and M3Sixty Administration, LLC (“M3Sixty”), M3Sixty provides administrative, fund accounting and pricing, and transfer agent and shareholder services to the Funds. M3Sixty receives fees for these services, which are paid by the Adviser (not the Funds). Effective December, 2016, Mutual Shareholders Services, LLC (“MSS”) began to provide fund accounting, administration and transfer agency services to each Fund. Pursuant to services agreements, the Adviser will pay MSS customary fees for its services from the advisory fee it receives from the Funds. MSS will also provide certain shareholder report production, and EDGAR conversion and filing services. Officers of MSS are also officers of the Trust. Distribution Agreement Effective December, 2016, Arbor Court Capital began to serve as each Fund’s distributor (the “Distributor”). The Distributor is not affiliated with the Adviser but is an affiliate of MSS. Pursuant to the agreement, the Adviser will pay Arbor Court Capital customary fees for its services from the advisory fee it receives from the Funds.

MONTEAGLE FUNDS
NOTES TO FINANCIAL STATEMENTS (CONTINUED) FEBRUARY 28, 2017 (UNAUDITED)
53
Compliance Services An affiliated Contractor (the “Contractor”) serves as the CCO of the Trust. The Funds pay $99,000 annually to the Contractor for providing CCO services. Each Fund pays $5,000 with the remaining $69,000 allocated to the Funds based on aggregate average daily net assets. 4. SECURITIES TRANSACTIONS During the six months ended February 28, 2017, cost of purchases and proceeds from sales and maturities of investment securities, excluding short-term investments and U.S. government securities, were as follows: Fund Purchases Sales
Fixed Income Fund $ 4,161,176 $ 1,718,164 Informed Investor Growth Fund 56,728,903 58,844,914 Quality Growth Fund 7,803,651 9,789,269 Select Value Fund 2,540,536 6,595,740 Value Fund 6,974,246 7,528,476 Texas Fund 7,305,067 3,768,084
The cost of purchases and proceeds from sales of U.S. government securities by the Fixed Income Fund were $1,535,041 and $0, respectively. There were no purchases or sales of U.S. government securities made by the Informed Investor Growth Fund, Quality Growth Fund, Select Value Fund, Value Fund or Texas Fund.
5. TAX MATTERS It is each Fund’s policy to comply with the special provisions of Subchapter M of the Internal Revenue Code applicable to regulated investment companies. As provided therein, in any fiscal year in which a Fund so qualifies and distributes at least 90% of its taxable income, such Fund (but not the shareholders) will be relieved of federal income tax on the income distributed. Accordingly, no provision for income taxes has been made. In order to avoid imposition of the excise tax applicable to regulated investment companies, it is also each Fund’s intention to declare as dividends in each calendar year at least 98% of its net investment income and 98.2% of its net realized capital gains plus undistributed amounts from prior years. The Funds’ tax basis distributable earnings are determined only at the end of each fiscal year. The tax character of distributable earnings (deficit) at August 31, 2016, the Funds’ most recent fiscal year end, was as follows:

MONTEAGLE FUNDS
NOTES TO FINANCIAL STATEMENTS (CONTINUED) FEBRUARY 28, 2017 (UNAUDITED)
54
Fund
Unrealized Appreciation (Depreciation)
Undistributed Ordinary Income
Undistributed Capital Gains
Capital Loss
Carryforward
Post-December Ordinary
Loss
Post- October Capital
Loss
Total Distributable
Earnings
Fixed Income Fund $ 1,219,275 $ 2,563 $ - $ (203,159) $ - $ (28,730) $ 989,949 Informed Investor Growth Fund 413,373 245,320 200,142 - (6,364 ) - 852,471 Quality Growth Fund 5,172,552 98,440 1,601,427 - - - 6,872,419 Select Value Fund (117,617) 760 - - - (2,230) (119,087) Value Fund 3,032,170 40,429 3,442 - - (48,949) 3,027,092 Texas Fund (424,903) - - (1,082,514) (14,054 ) (288,908) (1,810,379)
The undistributed ordinary income, capital gains, carryforward losses and post-October losses shown above differ from corresponding accumulated net investment income and accumulated net realized gain (loss) figures reported in the statements of assets and liabilities due to differing book/tax treatment of short-term capital gains, and certain temporary book/tax differences due to the tax deferral of losses on wash sales, REIT adjustments and reclassifications of paydown losses.
Under current tax law, net capital losses realized after October 31st and net ordinary losses incurred after December 31st may be deferred and treated as occurring on the first day of the following fiscal year. The Funds’ carryforward losses, post-October losses and post-December losses are determined only at the end of each fiscal year. As of August 31, 2016, the Funds’ most recent fiscal year end, the Funds elected to defer net capital losses and ordinary losses as indicated in the chart below.
Post-October Losses Post-December Losses
Fund Deferred Utilized Deferred Utilized
Fixed Income Fund $ 28,730 $ - $ - $ - Informed Investor Growth Fund - - 6,364 85,957 Quality Growth Fund - - - - Select Value Fund 2,230 - - - Value Fund 48,949 - - - Texas Fund 288,908 1,024,599 14,054 24,303
As of August 31, 2016, the following Funds had the following capital loss carryforwards for federal income tax purposes. These capital loss carryforwards may be utilized in future years to offset net realized capital gains, if any, prior to distributing such gains to shareholders.
Fund 2017 2018
Non-Expiring
Long-Term
Non-Expiring
Short-Term Total Utilized
Fixed Income Fund $ 180,638 $ 22,521 $ - $ - $ 203,159 $ 88,081 Informed Investor
Growth Fund - - - - - - Quality Growth Fund - - - - - - Select Value Fund - - - - - - Value Fund - - - - - - Texas Fund - - 600,067 482,447 1,082,514 -

MONTEAGLE FUNDS
NOTES TO FINANCIAL STATEMENTS (CONTINUED) FEBRUARY 28, 2017 (UNAUDITED)
55
Under the Regulated Investment Company Modernization Act of 2010 (the “Act”), net capital losses recognized after December 31, 2010, may be carried forward indefinitely, and their character is retained as short-term and/or long-term. Under the law in effect prior to the Act, pre-enactment net capital losses were carried forward for eight years and treated as short-term losses. As a transition rule, the Act requires that post-enactment net capital losses be utilized before pre-enactment net capital losses. There were no post-enactment capital losses incurred by the Fixed Income Fund, Informed Investor Growth Fund, Quality Growth Fund, Select Value Fund or Value Fund during the year ended August 31, 2016. The following information is based upon the federal income tax cost of the investment securities as of February 28, 2017:
Fund Cost
Gross Unrealized
Appreciation
Gross Unrealized
Depreciation
Net Unrealized Appreciation
(Depreciation)
Fixed Income Fund $ 51,895,003 $ 373,927 $ (296,694) $ 77,233 Informed Investor Growth Fund 8,764,508 547,295 (64,120) 483,175 Quality Growth Fund 18,957,704 6,201,573 (352,696) 5,848,877 Select Value Fund 12,903,638 1,351,404 (1,363,631) (12,227)Value Fund 18,676,735 4,120,405 (549,617) 3,570,788 Texas Fund 10,217,493 1,317,295 (945,293) 372,002
The difference between the federal income tax cost of portfolio investments and the financial statement cost for Informed Investor Growth Fund, Quality Growth Fund, Select Value Fund and Texas Fund is due to certain timing differences in the recognition of capital losses under income tax regulations and GAAP. These “book/tax” differences are temporary in nature and are due to the tax deferral of losses on wash sales. The Funds recognize the tax benefits of uncertain tax positions only when the position is “more likely than not” to be sustained assuming examination by tax authorities. Management has reviewed the tax positions in all open tax years and has concluded that no liability for unrecognized tax benefits should be recorded related to uncertain tax positions taken in open tax years. The Funds identify their major tax jurisdictions as U.S. Federal and Delaware. The Funds recognize interest and penalties, if any, related to unrecognized tax benefits as income tax expense in the Statements of Operations. During the six months ended February 28, 2017, the Funds did not incur any interest or penalties. The Funds are not subject to examination by U.S. Federal tax authorities for tax years before 2013. 6. CONTROL OWNERSHIP The beneficial ownership, either directly or indirectly, of more than 25% of the voting securities of a fund creates presumption of control of the fund under Section 2(a)(9) of the Investment Company Act of 1940. As of February 28, 2017, the shareholders listed in the table immediately below held, for the benefit of their customers, the following percentages of the outstanding shares of each Fund.

MONTEAGLE FUNDS
NOTES TO FINANCIAL STATEMENTS (CONTINUED) FEBRUARY 28, 2017 (UNAUDITED)
56
Fund Shareholder Percent Owned as of February 28, 2017
Fixed Income Fund Mitra & Co. 92%
Informed Investor Growth Fund Maril & Co. 95%
Quality Growth Fund Maril & Co. 93%
Select Value Fund Charles Schwab & Co. 75%
Value Fund Maril & Co. 99%
Texas Fund NFS, LLC 74%
7. CAPITAL SHARE TRANSACTIONS Fixed Income Fund
Sold Redeemed Reinvested Ending Shares
For the six months ended: February 28, 2017
Class I Shares 238,868 (253,143) 27,587 4,936,636 Value $ 2,496,226 $ (2,663,960) $ 287,665
For the fiscal year ended: August 31, 2016
Class I Shares 155,135 (95,383) 59,813 4,923,324 Value $ 1,615,881 $ (1,000,966) $ 628,695
Informed Investor Growth Fund
Sold Redeemed Reinvested Ending Shares
For the six months ended: February 28, 2017
Class I Shares 5,287 (34,738) 2,377 1,062,464 Value $ 54,317 $ (365,106) $ 24,367
For the fiscal year ended: August 31, 2016
Class I Shares 17,322 (49,764) 7,405 1,089,538 Value $ 176,893 $ (498,457) $ 75,161
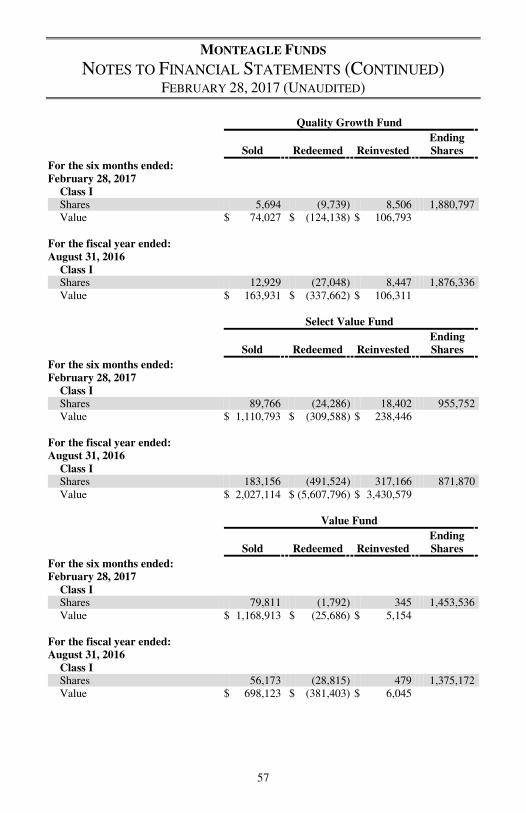
MONTEAGLE FUNDS
NOTES TO FINANCIAL STATEMENTS (CONTINUED) FEBRUARY 28, 2017 (UNAUDITED)
57
Quality Growth Fund
Sold Redeemed Reinvested Ending Shares
For the six months ended: February 28, 2017
Class I Shares 5,694 (9,739) 8,506 1,880,797 Value $ 74,027 $ (124,138) $ 106,793
For the fiscal year ended: August 31, 2016
Class I Shares 12,929 (27,048) 8,447 1,876,336 Value $ 163,931 $ (337,662) $ 106,311
Select Value Fund
Sold Redeemed Reinvested Ending Shares
For the six months ended: February 28, 2017
Class I Shares 89,766 (24,286) 18,402 955,752 Value $ 1,110,793 $ (309,588) $ 238,446
For the fiscal year ended: August 31, 2016
Class I Shares 183,156 (491,524) 317,166 871,870 Value $ 2,027,114 $ (5,607,796) $ 3,430,579
Value Fund
Sold Redeemed Reinvested Ending Shares
For the six months ended: February 28, 2017
Class I Shares 79,811 (1,792) 345 1,453,536 Value $ 1,168,913 $ (25,686) $ 5,154
For the fiscal year ended: August 31, 2016
Class I Shares 56,173 (28,815) 479 1,375,172 Value $ 698,123 $ (381,403) $ 6,045
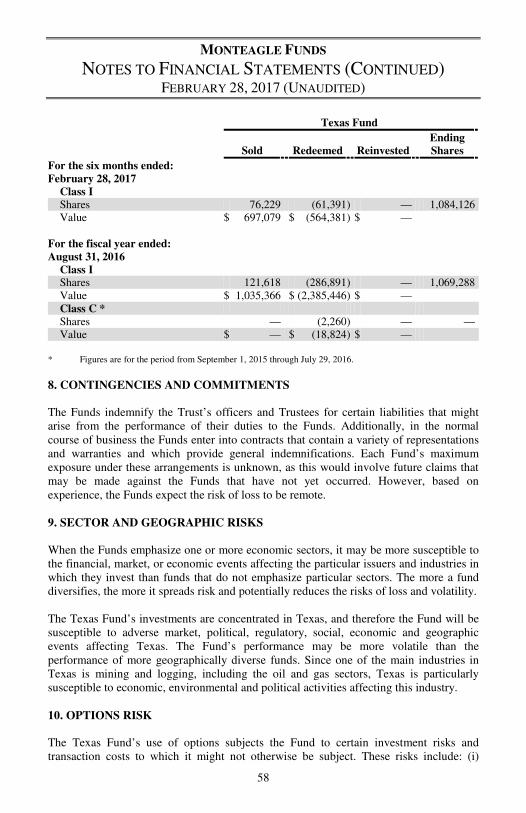
MONTEAGLE FUNDS
NOTES TO FINANCIAL STATEMENTS (CONTINUED) FEBRUARY 28, 2017 (UNAUDITED)
58
Texas Fund
Sold Redeemed Reinvested Ending Shares
For the six months ended: February 28, 2017
Class I Shares 76,229 (61,391) — 1,084,126 Value $ 697,079 $ (564,381) $ —
For the fiscal year ended: August 31, 2016
Class I Shares 121,618 (286,891) — 1,069,288 Value $ 1,035,366 $ (2,385,446) $ — Class C * Shares — (2,260) — — Value $ — $ (18,824) $ —
* Figures are for the period from September 1, 2015 through July 29, 2016.
8. CONTINGENCIES AND COMMITMENTS The Funds indemnify the Trust’s officers and Trustees for certain liabilities that might arise from the performance of their duties to the Funds. Additionally, in the normal course of business the Funds enter into contracts that contain a variety of representations and warranties and which provide general indemnifications. Each Fund’s maximum exposure under these arrangements is unknown, as this would involve future claims that may be made against the Funds that have not yet occurred. However, based on experience, the Funds expect the risk of loss to be remote. 9. SECTOR AND GEOGRAPHIC RISKS When the Funds emphasize one or more economic sectors, it may be more susceptible to the financial, market, or economic events affecting the particular issuers and industries in which they invest than funds that do not emphasize particular sectors. The more a fund diversifies, the more it spreads risk and potentially reduces the risks of loss and volatility. The Texas Fund’s investments are concentrated in Texas, and therefore the Fund will be susceptible to adverse market, political, regulatory, social, economic and geographic events affecting Texas. The Fund’s performance may be more volatile than the performance of more geographically diverse funds. Since one of the main industries in Texas is mining and logging, including the oil and gas sectors, Texas is particularly susceptible to economic, environmental and political activities affecting this industry.
10. OPTIONS RISK The Texas Fund’s use of options subjects the Fund to certain investment risks and transaction costs to which it might not otherwise be subject. These risks include: (i)

MONTEAGLE FUNDS
NOTES TO FINANCIAL STATEMENTS (CONTINUED) FEBRUARY 28, 2017 (UNAUDITED)
59
dependence on the Adviser or Sub-adviser’s ability to predict movements in the prices of individual securities and fluctuations in the general securities markets; (ii) imperfect correlations between movements in the prices of options and movements in the price of the securities (or indices) hedged or used for cover, which may cause a given hedge not to achieve its objective; (iii) the fact that the skills and techniques needed to trade these instruments are different from those needed to select the securities in which the Texas Fund invests; (iv) lack of assurance that a liquid secondary market will exist for any particular instrument at any particular time, which, among other things, may hinder the Texas Fund’s ability to limit exposures by closing its positions; and, (v) the possible need to defer closing out of certain options to avoid adverse tax consequences. Other risks include the inability of the Texas Fund, as the writer of covered call options, to benefit from any appreciation of the underlying securities above the exercise price, and the possible loss of the entire premium paid for options purchased by the Texas Fund. See note 2 for additional disclosures related to options transactions.
11. RECENT ACCOUNTING PRONOUNCEMENTS In May 2015, the FASB issued ASU No. 2015-07 Disclosure for Investments in Certain Entities that Calculate Net Asset Value per Share (or Its Equivalent). The amendments in ASU No. 2015-07 remove the requirement to categorize within the fair value hierarchy investments measured using the net asset value per share (“NAV”) practical expedient. The ASU also removes certain disclosure requirements for investments that qualify, but do not utilize, the NAV practical expedient. The amendments in the ASU are effective for fiscal years beginning after December 15, 2015, and interim periods within those fiscal years. Management is currently evaluating the impact these changes will have on the Funds’ financial statements and related disclosures.
12. SUBSEQUENT EVENTS On March 15, 2017, the Quality Growth Fund declared a dividend from net investment income of $28,461, which was payable on March 15, 2017. On March 15, 2017, the Select Value Fund declared a dividend from net investment income of $18,628, which was payable on March 15, 2017. On March 15, 2017, the Value Fund declared a dividend from net investment income of $74,155, which was payable on March 15, 2017. On March 31, 2017, the Fixed Income Fund declared a dividend from net investment income of $55,429, which was payable on March 31, 2017. On April 28, 2017, the Fixed Income Fund declared a dividend from net investment income of $57,001, which was payable on April 28, 2017. Management has evaluated subsequent events through the issuance of the financial statements and, other than those already disclosed in the notes to the financial statements, has noted no other such events that would require disclosure.

MONTEAGLE FUNDS
NOTES TO FINANCIAL STATEMENTS (CONTINUED) FEBRUARY 28, 2017 (UNAUDITED)
60
13. LEGAL PROCEEDINGS On December 7, 2010, an amended complaint was filed in the United States Bankruptcy Court for the District of Delaware (Adversary Proceeding No. 10-54010) by The Official Committee of Unsecured Creditors of Tribune Company (“Committee”) on behalf of Tribune Company (“Tribune”), a U.S. news and media organization. Among the thousands of defendants in the Amended Complaint is the Monteagle Funds with respect to holdings by the Monteagle Value Fund (the “Fund”). The Fund, along with numerous other mutual funds, institutional investors and others, owned shares of Tribune in 2007 when it went private in a leveraged buyout transaction (“LBO”). In the LBO, shareholders such as the Fund sold their shares back to Tribune for $34/share. The lawsuit alleges, among other things, that the payment for the shares by Tribune was a fraudulent transfer and seeks to have the cash paid to shareholders returned to the Tribune bankruptcy estate. The Amended Complaint seeks to create a class of Defendants - the former shareholders of Tribune - and seeks return of over $8 billion in proceeds from the LBO. On April 5, 2012, the Committee’s lawsuit was transferred by the Judicial Panel on Multidistrict Litigation to the United States District Court for the Southern District of New York for discovery and pretrial motions with numerous other related actions. (In re Tribune Company Fraudulent Conveyance Litigation, 1:12-mc-02296-WHP). On July 23, 2012, the Delaware Bankruptcy Judge confirmed a plan of reorganization that, among other things, replaced the Committee as Plaintiff with a Litigation Trustee. On September 7, 2012, Judge Pauley of the Southern District of New York entered a Master Case Order. Among other things, the Master Case Order creates liaison counsel and an Executive Committee for the defendants in the Litigation Trustee’s lawsuit, including those defendants, like the Fund, that were only shareholders of Tribune. The Executive Committee Members for mutual funds are Michael S. Doluisio, an attorney with Dechert LLP in Philadelphia, and Steven R. Schoenfeld, an attorney with Dorsey & Whitney LLP in New York. The Executive Committee is directed to take reasonable steps to streamline case management and to eliminate duplication of efforts and redundant filings. However, the Master Case Order does not certify a class of Defendants, and does not prevent any individual Defendant from retaining its own counsel or being heard by the Court. Discovery in the Litigation Trustee’s lawsuit is stayed pending resolution of certain motions to dismiss in the related litigation. On September 23, 2013, the Court rejected the defendants’ arguments under section 546(e) of the Bankruptcy Code (the so-called public-securities-market exemption), but still dismissed the so-called Individual Creditors Actions (the individual creditor, constructive fraudulent-conveyance actions) on the ground that the Individual Creditors lack standing to seek avoidance of the same transactions that the Litigation Trustee is simultaneously suing to avoid. On May 23, 2014, the Executive Committee, on behalf of all Exhibit A shareholder defendants, including the Fund, filed a motion to dismiss Count One of the Litigation

MONTEAGLE FUNDS
NOTES TO FINANCIAL STATEMENTS (CONTINUED) FEBRUARY 28, 2017 (UNAUDITED)
61
Trustee’s Fifth Amended Complaint on grounds, among other things, that complaint fails to allege facts from which a strong inference can be drawn that the Tribune Board acted with the actual intent to hinder, delay or defraud creditors when it approved the LBO. The Litigation Trustee has responded and the motion is fully briefed and pending before Judge Pauley. The Litigation Trustee has requested that the Judge rule on these motions and allow the Litigation Trustee to proceed with discovery. The Individual Creditors appealed the dismissal for lack of standing to the Second Circuit, and the Executive Committee cross-appealed the failure to dismiss under 546(e). On March 29, 2016, the Second Circuit Court of Appeals issued its opinion. The Court ruled that the noteholder creditors had standing to sue, but that, on the merits, their claims were preempted by the safe harbor in Section 546(e) of the Bankruptcy Code. Assuming this result is not reversed by the United States Supreme Court, then this would leave only the Litigation Trustee’s claims for intentional fraudulent conveyance. On September 9, 2016, the Individual Creditors filed their petition for certiorari to the Supreme Court. The Supreme Court has not yet acted on the request to review the Second Circuit’s decision. On January 9, 2017 the District Judge issued an Opinion granting the shareholder defendants’ motion to dismiss the Trustee’s intentional fraudulent conveyance claims. This will likely be appealed to the Second Circuit. We are waiting for the Supreme Court to decide whether to take the appeal of the Second Circuit’s prior decision dismissing the constructive fraudulent conveyance claims. It is not expected that the cases discussed above will have a material adverse impact on the Fund’s financial position, results of operation, or cash flows; however, these litigation matters are subject to inherent uncertainties and the views of these matters with respect to any impact to the Fund may change in the future.
MONTEAGLE FUNDS ABOUT YOUR FUNDS' EXPENSES
FEBRUARY 28, 2017 (UNAUDITED)
62
We believe it is important for you to understand the impact of costs on your investment. As a shareholder of the Funds, you incur two types of costs: (1) transaction costs, including redemption fees; and (2) ongoing costs, including management fees, distribution and service (12b-1) fees; and other Fund expenses. The following examples are intended to help you understand your ongoing costs (in dollars) of investing in the Funds and to compare these costs with the ongoing costs of investing in other mutual funds. A mutual fund’s ongoing costs are expressed as a percentage of its average net assets. This figure is known as the expense ratio. The expenses in the tables below are based on an investment of $1,000 made at the beginning of the most recent semi-annual period September 1, 2016 and held until the end of the period February 28, 2017. The tables that follow illustrate each Fund’s costs in two ways: Actual fund return – This section helps you to estimate the actual expenses that you paid over the period. The “Ending Account Value” shown is derived from each Fund’s actual return, and the third column shows the dollar amount of operating expenses that would have been paid by an investor who started with $1,000 in the Funds. You may use the information here, together with the amount you invested, to estimate the expenses that you paid over the period. To do so, simply divide your account value by $1,000 (for example, an $8,600 account value divided by $1,000 = 8.6), then multiply the result by the number given for the Funds under the heading “Expenses Paid During Period.” Hypothetical 5% return – This section is intended to help you compare the Funds’ costs with those of other mutual funds. It assumes that each Fund had an annual return of 5% before expenses during the period shown, but that the expense ratio is unchanged. In this case, because the return used is not the Funds’ actual returns, the results do not apply to your investment. The example is useful in making comparisons because the Securities and Exchange Commission requires all mutual funds to calculate expenses based on a 5% return. You can assess each Fund’s costs by comparing this hypothetical example with the hypothetical examples that appear in shareholder reports of other funds. Note that expenses shown in the table are meant to highlight and help you compare ongoing costs only. The calculations assume no shares were bought or sold during the period. Your actual costs may have been higher or lower, depending on the amount of your investment and the timing of any purchases or redemptions. More information about the Funds’ expenses, including historical annual expense ratios, can be found in this report. For additional information on operating expenses and other shareholder costs, please refer to each Fund’s Prospectus.
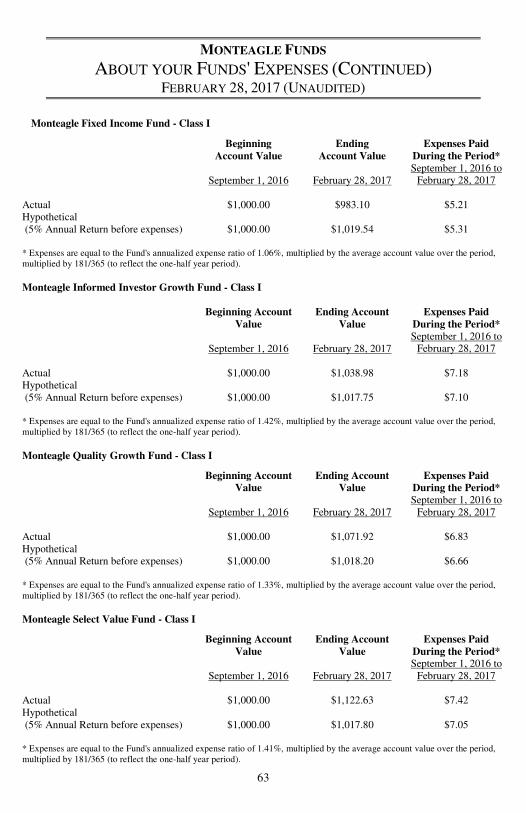
MONTEAGLE FUNDS ABOUT YOUR FUNDS' EXPENSES (CONTINUED)
FEBRUARY 28, 2017 (UNAUDITED)
63
Monteagle Fixed Income Fund - Class I
Beginning
Account Value Ending
Account Value Expenses Paid
During the Period*
September 1, 2016 February 28, 2017 September 1, 2016 to
February 28, 2017 Actual $1,000.00 $983.10 $5.21 Hypothetical (5% Annual Return before expenses) $1,000.00 $1,019.54 $5.31 * Expenses are equal to the Fund's annualized expense ratio of 1.06%, multiplied by the average account value over the period, multiplied by 181/365 (to reflect the one-half year period).
Monteagle Informed Investor Growth Fund - Class I
Beginning Account
Value Ending Account
Value Expenses Paid
During the Period*
September 1, 2016 February 28, 2017 September 1, 2016 to
February 28, 2017 Actual $1,000.00 $1,038.98 $7.18 Hypothetical (5% Annual Return before expenses) $1,000.00 $1,017.75 $7.10 * Expenses are equal to the Fund's annualized expense ratio of 1.42%, multiplied by the average account value over the period, multiplied by 181/365 (to reflect the one-half year period).
Monteagle Quality Growth Fund - Class I
Beginning Account
Value Ending Account
Value Expenses Paid
During the Period*
September 1, 2016 February 28, 2017 September 1, 2016 to
February 28, 2017 Actual $1,000.00 $1,071.92 $6.83 Hypothetical (5% Annual Return before expenses) $1,000.00 $1,018.20 $6.66 * Expenses are equal to the Fund's annualized expense ratio of 1.33%, multiplied by the average account value over the period, multiplied by 181/365 (to reflect the one-half year period).
Monteagle Select Value Fund - Class I
Beginning Account
Value Ending Account
Value Expenses Paid
During the Period*
September 1, 2016 February 28, 2017 September 1, 2016 to
February 28, 2017 Actual $1,000.00 $1,122.63 $7.42 Hypothetical (5% Annual Return before expenses) $1,000.00 $1,017.80 $7.05 * Expenses are equal to the Fund's annualized expense ratio of 1.41%, multiplied by the average account value over the period, multiplied by 181/365 (to reflect the one-half year period).

MONTEAGLE FUNDS ABOUT YOUR FUNDS' EXPENSES (CONTINUED)
FEBRUARY 28, 2017 (UNAUDITED)
64
Monteagle Value Fund - Class I
Beginning Account
Value Ending Account
Value Expenses Paid
During the Period*
September 1, 2016 February 28, 2017 September 1, 2016 to
February 28, 2017 Actual $1,000.00 $1,106.40 $7.05 Hypothetical (5% Annual Return before expenses) $1,000.00 $1,018.10 $6.76 * Expenses are equal to the Fund's annualized expense ratio of 1.35%, multiplied by the average account value over the period, multiplied by 181/365 (to reflect the one-half year period).
The Texas Fund - Class I
Beginning Account
Value Ending Account
Value Expenses Paid
During the Period*
September 1, 2016 February 28, 2017 September 1, 2016 to
February 28, 2017 Actual $1,000.00 $1,097.97 $8.74 Hypothetical (5% Annual Return before expenses) $1,000.00 $1,016.46 $8.40 * Expenses are equal to the Fund's annualized expense ratio of 1.68%, multiplied by the average account value over the period, multiplied by 181/365 (to reflect the one-half year period).
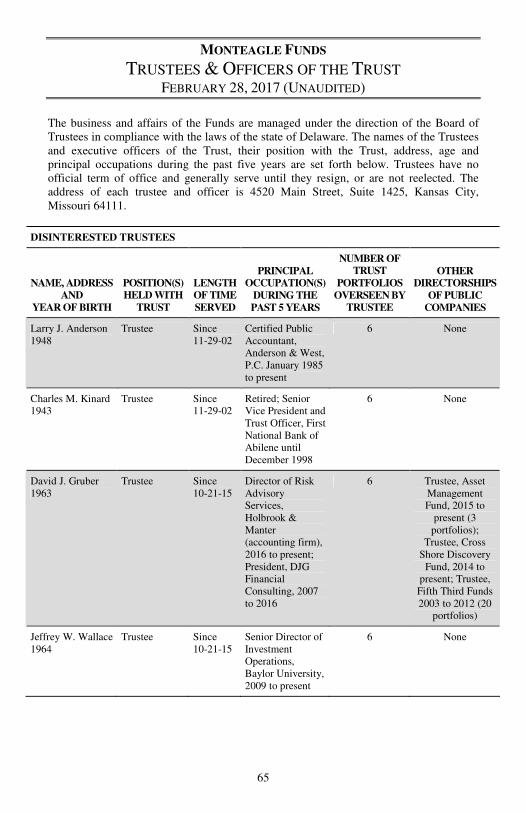
MONTEAGLE FUNDS TRUSTEES & OFFICERS OF THE TRUST
FEBRUARY 28, 2017 (UNAUDITED)
65
The business and affairs of the Funds are managed under the direction of the Board of Trustees in compliance with the laws of the state of Delaware. The names of the Trustees and executive officers of the Trust, their position with the Trust, address, age and principal occupations during the past five years are set forth below. Trustees have no official term of office and generally serve until they resign, or are not reelected. The address of each trustee and officer is 4520 Main Street, Suite 1425, Kansas City, Missouri 64111.
DISINTERESTED TRUSTEES
NAME, ADDRESS AND
YEAR OF BIRTH
POSITION(S) HELD WITH
TRUST
LENGTH OF TIME SERVED
PRINCIPAL OCCUPATION(S)
DURING THE PAST 5 YEARS
NUMBER OF TRUST
PORTFOLIOS OVERSEEN BY
TRUSTEE
OTHER DIRECTORSHIPS
OF PUBLIC COMPANIES
Larry J. Anderson 1948
Trustee Since 11-29-02
Certified Public Accountant, Anderson & West, P.C. January 1985 to present
6 None
Charles M. Kinard 1943
Trustee Since 11-29-02
Retired; Senior Vice President and Trust Officer, First National Bank of Abilene until December 1998
6 None
David J. Gruber 1963
Trustee Since 10-21-15
Director of Risk Advisory Services, Holbrook & Manter (accounting firm), 2016 to present; President, DJG Financial Consulting, 2007 to 2016
6 Trustee, Asset Management Fund, 2015 to
present (3 portfolios);
Trustee, Cross Shore Discovery
Fund, 2014 to present; Trustee, Fifth Third Funds 2003 to 2012 (20
portfolios)
Jeffrey W. Wallace 1964
Trustee Since 10-21-15
Senior Director of Investment Operations, Baylor University, 2009 to present
6 None

MONTEAGLE FUNDS TRUSTEES & OFFICERS OF THE TRUST (CONTINUED)
FEBRUARY 28, 2017 (UNAUDITED)
66
EXECUTIVE OFFICERS
NAME, ADDRESS AND YEAR OF BIRTH
POSITION(S) HELD WITH THE TRUST
PRINCIPAL OCCUPATION(S) DURING THE PAST 5 YEARS
Paul B. Ordonio, JD 1967
President, CCO Monteagle Funds, President/CCO from 11/02 to present; Nashville Capital Corporation, VP of Development, 05/09 to present; Matrix Capital Group, Representative 05/09 to present; P.O. Properties, Inc., Vice President from 06/99 to present; WordWise Document Services, LLC, President from 08/97 to present; Ordonio & Assoc., President from 11/97 to present; Blue Horse Financial Advisors, Secretary from 07/15 to present; PJO Holdings, LLC from 07/15 to present.
Brandon M. Pokersnik 1978
Secretary, AML Officer
Accountant, Mutual Shareholder Services, LLC, since 2008; Attorney Mutual Shareholder Services, LLC, since June 2016; Owner/President, Empirical Administration, LLC, since September 2012.
Umberto Anastasi 1974
Treasurer, CFO From 1999 to present, Vice President, Mutual Shareholder Services, LLC.
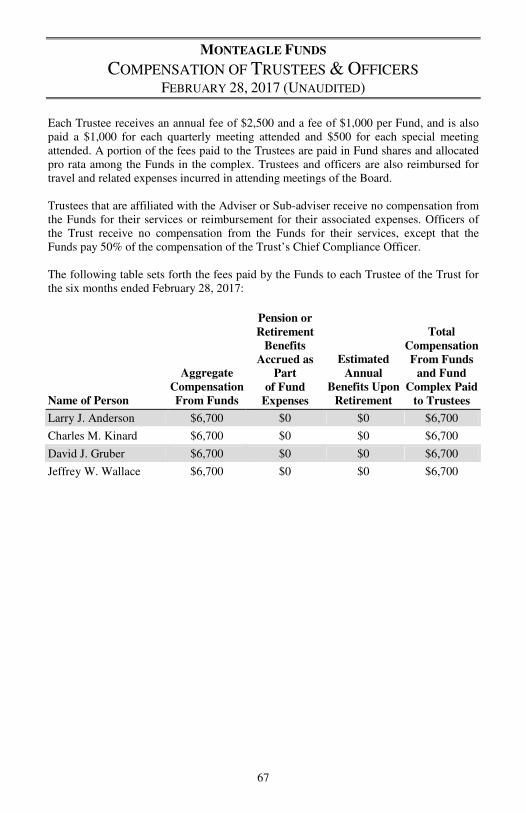
MONTEAGLE FUNDS COMPENSATION OF TRUSTEES & OFFICERS
FEBRUARY 28, 2017 (UNAUDITED)
67
Each Trustee receives an annual fee of $2,500 and a fee of $1,000 per Fund, and is also paid a $1,000 for each quarterly meeting attended and $500 for each special meeting attended. A portion of the fees paid to the Trustees are paid in Fund shares and allocated pro rata among the Funds in the complex. Trustees and officers are also reimbursed for travel and related expenses incurred in attending meetings of the Board. Trustees that are affiliated with the Adviser or Sub-adviser receive no compensation from the Funds for their services or reimbursement for their associated expenses. Officers of the Trust receive no compensation from the Funds for their services, except that the Funds pay 50% of the compensation of the Trust’s Chief Compliance Officer. The following table sets forth the fees paid by the Funds to each Trustee of the Trust for the six months ended February 28, 2017:
Name of Person
Aggregate Compensation From Funds
Pension or Retirement
Benefits Accrued as
Part of Fund
Expenses
Estimated Annual
Benefits Upon Retirement
Total Compensation From Funds
and Fund Complex Paid
to Trustees
Larry J. Anderson $6,700 $0 $0 $6,700
Charles M. Kinard $6,700 $0 $0 $6,700
David J. Gruber $6,700 $0 $0 $6,700
Jeffrey W. Wallace $6,700 $0 $0 $6,700
MONTEAGLE FUNDS ADDITIONAL INFORMATION FEBRUARY 28, 2017 (UNAUDITED)
68
Proxy Policies — The Trust has adopted Proxy Voting Policies and Procedures under which the Funds vote proxies related to securities held by the Funds. A description of the Funds’ policies and procedures is available without charge, upon request, by calling the Funds toll free at 1-888-263-5593, on the Funds’ website at http://www.monteaglefunds.com or on the SEC website at http://www.sec.gov. In addition, the Funds are required to file Form N-PX, with their complete voting record for the 12 months ended June 30th, no later than August 31st of each year. The Funds’ Form N-PX is available without charge, upon request, by calling the Funds toll free at 1-888-263-5593, on the Funds’ website at http://www.monteaglefunds.com or on the SEC’s website at http://www.sec.gov. N-Q Filing — The SEC has adopted the requirement that all mutual funds file a complete schedule of investments with the SEC for their first and third fiscal quarters on Form N-Q. For the Monteagle Funds, this would be for the fiscal quarters ending November 30 and May 31. The Form N-Q filing must be made within 60 days of the end of the quarter. The Funds’ Forms N-Q are available on the SEC’s website at http://www.sec.gov., or they may be reviewed and copied at the SEC’s Public Reference Room in Washington, DC (call 1-800-732-0330 for information on the operation of the Public Reference Room). Renewal Advisory Agreement - The next item on the agenda was the annual renewal of the Management Agreement between the Trust and Nashville Capital Corporation (the “Adviser”) with respect to each of the Funds, and the respective Sub-Advisers, with respect to the Funds.
Counsel directed the Trustees’ attention to the memorandum from Counsel (the “Counsel Memo”), provided along with the Board Materials. Counsel reviewed with them the duties of the Trustees in conjunction with the renewals, the standards applicable to their determinations and the factors that the Trustees should and should not take into consideration in making their decision. He referenced key aspects of the Counsel Memo, including, among other things, that the Trustees should evaluate each agreement individually and make a decision whether to renew each on its own merits even if the discussion about the agreements covers all the related items together.
Counsel also reiterated for the Trustees the basic standard under Section 36(b) of the Investment Company Act of 1940 (the “1940 Act”) that the Trustees should keep in mind when deciding whether to renew a contract and the standards the Trustees should apply as a matter of state fiduciary law. He pointed out the types of information and factors that should be considered by the Board in order to make an informed decision regarding renewal, including the factors listed in the Counsel Memo, as well as anything else the Trustees may consider relevant in their reasonable business judgment.
Counsel also directed the Trustees’ attention to the Board Materials provided by the Adviser, each sub-adviser and the Distributor in response to requests from Counsel made on behalf of the Trustees in advance of the meeting. He noted that when making their determination of whether to approve renewal of the agreements, the Board may take

MONTEAGLE FUNDS ADDITIONAL INFORMATION (CONTINUED)
FEBRUARY 28, 2017 (UNAUDITED)
69
into consideration any of that information, as well as information furnished for the Board’s review and consideration throughout the year at other meetings or information that came to their attention through any other appropriate means. Accordingly, in their assessment of the renewals, the Trustees took into consideration such information as they felt was relevant from available materials that included, among others:
(i) Reports regarding the services and support provided to the Funds and their shareholders by the Adviser, and respective Sub-Advisers;
(ii) Performance assessments of the investment performance of the Funds by
personnel of the Adviser and respective Sub-Advisers; (iii) Performance commentary on the reasons for the performance;
(iv) Presentations by the Funds’ portfolio managers addressing the Adviser’s
and the respective Sub-Advisers’ investment philosophy, investment strategy and operations;
(v) Compliance reports, audits and review reports concerning the Funds, the
Adviser, and respective Sub-Advisers;
(vi) Disclosure information contained in the registration statement of the Trust and the Form ADVs of the Adviser and respective Sub-Advisers;
(vii) Information on relevant developments in the mutual fund industry and
how the Funds and/or the service providers are responding to them;
(viii) Financial information about the Adviser, respective Sub-Advisers;
(ix) A description of the personnel at the Adviser, respective Sub-Advisers, including their background, professional skills and accomplishments;
(x) Information on investment advice, performance, summaries of Fund
expenses, compliance program, current legal matters, and other general information about the Adviser, each respective sub-adviser;
(xi) Comparative expense and performance information for other mutual funds
that are similar to the Funds;
(xii) Where available, information about performance and fees relative to other accounts managed by the sub-advisers that might be considered comparable to the Funds in terms of investment style; and
(xiii) Any soft-dollar or other “fall-out” or similar benefits to be realized by the
Adviser or the sub-advisers from their relationship with the Funds.
MONTEAGLE FUNDS ADDITIONAL INFORMATION (CONTINUED)
FEBRUARY 28, 2017 (UNAUDITED)
70
Management Agreement with Nashville Capital Corporation Sub Advisory Agreements i. Parkway Advisors, L.P. ii. Garcia Hamilton & Associates, L.P. iii. Howe and Rusling, Inc. iv. Robinson Investment Group, Inc. v. T.H. Fitzgerald & Company vi. J. Team Financial (each, a “Sub-Adviser,” and, collectively, the “Sub-Advisers”)
In deciding whether to approve the Management Agreement and each of the
Subadvisory Agreements, the Trustees considered numerous factors, including: The Nature, Extent, and Quality of the Services Provided by the Adviser and Sub-
Advisers.
The Trustees considered various aspects of the nature, extent and quality of the services provided by the Adviser and the Sub-Advisers to the Funds. They noted that the responsibilities of the Adviser and Sub-Advisers under each Agreement had not changed since the last renewal and were not proposed to change. They also considered the following:
• the quality of the investment advisory services (including research and recommendations with respect to portfolio securities), noting that they are not proposed to change;
• the background, experience and professional ability and skill of the portfolio management personnel assigned to the Funds, noting the commitment to hire and retain qualified personnel to work on behalf of the Funds and their shareholders;
• the processes used for formulating investment recommendations and assuring compliance with each Fund’s investment objectives and limitations, as well as for assuring compliance with regulatory requirements, specifically noting that none of the Adviser or Sub-Advisers reported any material compliance matter over the last year;
• the manner in which the Sub-Advisers seek to satisfy their obligation to assure “best execution” in connection with securities transactions placed for the Funds, noting that each of the Sub-advisers has provided its policies and procedures related to trading and brokerage, as well as information about average brokerage commissions paid;

MONTEAGLE FUNDS ADDITIONAL INFORMATION (CONTINUED)
FEBRUARY 28, 2017 (UNAUDITED)
71
• the investment strategies and sources of information upon which the Sub-Advisers rely in making investment decisions for the Funds;
• where applicable, the fees charged to and the performance of other accounts managed by the Sub-Advisers similar to the Funds;
• the oversight of the Funds’ portfolios by the Sub-Advisers and the Adviser and the oversight of the Sub-Advisers by the Adviser;
• the Sub-advisers’ succession plans and business continuity plans; and
• the coordination of services for the Funds among the service providers, Trust management and the Trustees.
Counsel noted that T.H. Fitzgerald & Company (“Fitzgerald”), investment sub-
adviser to the Monteagle Informed Investor Growth Fund, does not maintain separate insurance coverage and that such lack of coverage may place Fitzgerald at risk of not being able to service the Trust and the Monteagle Informed Investor Growth Fund. Counsel and the CCO agreed that Fitzgerald is under no legal obligation to retain separate insurance coverage.
After reviewing and considering the foregoing information and further information in the Board Materials provided by the Adviser and Sub-Advisers (such as their respective Form ADV), the Board concluded, in light of all the facts and circumstances, that the nature, extent and quality of the services provided by the Adviser and each of the Sub-Advisers were satisfactory and adequate for their respective Funds. Counsel did express concern that the Adviser does not have liability insurance for its Directors, executives, and officers; however, the CCO stated that the Adviser does maintain general liability insurance. Investment Performance of the Funds, the Adviser and the Sub-Advisers.
In considering the investment performance of the Funds, the Adviser and the Sub-Advisers, it was noted that the Adviser has delegated day-to-day portfolio management to the Sub-Adviser for each respective Fund and that the Adviser’s role in regard to investment performance was largely one of oversight. The Trustees also noted the information about the Adviser personnel fulfilling that role, as well as the information about each Sub-Adviser’s portfolio managers managing each of the Funds’ portfolios day-to-day.
In their evaluation of performance, the Trustees compared the short- and long-term performance of each Fund with the performance of its benchmark, groups of funds with similar objectives managed by other investment advisers, and aggregated data by category. It was noted that each of the Fund’s performance had already been discussed under the Report of Management item, and the Trustees therefore took into consideration in their evaluation of contract renewals the information discussed during that portion of the meeting. Counsel, CCO, and the Trustees discussed each Fund’s performance in light of their stated objectives/restrictions, succession planning of the Monteagle Informed Investor Growth Fund and also reviewed the financial statements of each Sub-Adviser.

MONTEAGLE FUNDS ADDITIONAL INFORMATION (CONTINUED)
FEBRUARY 28, 2017 (UNAUDITED)
72
After considering and discussing the performance of the Funds further, the Adviser’s and each Sub-Adviser’s experience and performance in their roles with respect to the Funds, the historical and comparative performance data provided, and other relevant information, the Board concluded, in light of all the facts and circumstances, that the investment performance of each of the Funds, the Adviser and the Sub-Advisers was satisfactory. The Costs of the Services Provided and Profits Realized by the Adviser and the Sub-
Advisers from their Relationships with the Funds.
In considering these factors, the Trustees noted the overall expenses of each Fund, including the nature and frequency of advisory and sub-advisory fee payments. In addition, the Trustees noted the asset levels of each Fund and the gross and net expenses of each Fund as compared to gross and net expenses of a group of funds that may be considered similar, noting that the expenses of each of the Funds was within the range of expenses incurred by the other funds in its group.
The Trustees considered the financial condition and profitability information provided by the Adviser and Sub-Advisers in the Board Materials and the level of commitment to the Funds by the principals of the Adviser and Sub-Advisers to their roles for the Funds.
The Trustees also considered information provided on fees charged by Sub-advisers to accounts that might be considered comparable — such as separately managed accounts — being managed in a similar style, noting that typically fees charged to the Funds were among the lowest, if not lower than, the fees charged to other accounts by the Sub-advisers. The Trustees used this information as a potential gauge for what fees might be considered reasonable for similar investment services, although they also considered that accounts identified as similar for this purpose may also have material differences that impact their overall comparability, such as differences in the range of the investor base served by the account; the average account size; the customization of fees, services and reporting available; the daily liquidity, redemptions and turnover that might occur in a mutual fund that might not be the case in other accounts; the regulatory requirements applicable to a fund that do not apply to many non-fund accounts; and the Board oversight applicable to funds that does not apply to most other types of accounts; to name a few. The Trustees took into consideration these potential differences when assessing both performance and fee information with respect to comparable accounts.
After further consideration of these elements, the Board concluded, in light of all the facts and circumstances, that the costs of the services provided to the Funds and the profits realized by the Adviser and the Sub-Advisers from their relationships with the Funds were satisfactory. Other Benefits Derived by the Adviser or Sub-Advisers from their Relationships with the
Funds and Conflicts of Interest.

MONTEAGLE FUNDS ADDITIONAL INFORMATION (CONTINUED)
FEBRUARY 28, 2017 (UNAUDITED)
73
The Trustees also considered other benefits that the Adviser or Sub-Advisers derive from their relationship with the Funds (sometimes referred to as “fall-out” benefits) and conflicts of interest. After reviewing and considering these items and other information they deemed relevant with regard to these matters, the Board concluded, in light of all the facts and circumstances, that the other benefits derived by the Adviser or Sub-Advisers from their relationships with the Funds were satisfactory. Economies of Scale. The Trustees next considered the extent to which economies of scale would be realized if the Funds grow and whether the advisory fee levels reflect those economies of scale for the benefit of the Funds’ shareholders. In this regard, the Trustees considered the breakpoints in effect on the advisory fee schedule for each of the Funds at various asset levels, which are aimed at sharing with shareholders any economies of scale that are realized from Fund growth. The Trustees also noted that certain of the Sub-Advisory fee schedules also have breakpoints at various asset levels.
After considering these factors, the Board concluded, in light of all the facts and circumstances, that the fee levels and breakpoints were satisfactory and adequate to reflect economies of scale for the benefit of the Funds’ shareholders if the Funds grow.
Counsel also reminded the Trustees that when evaluating an advisory or sub-advisory contract or fees, the Trustees should not take into consideration or make any adjustment for expenditures made by the Adviser, Sub-Advisers or their affiliates for Fund distribution, since Fund assets may be used for the payment of distribution only under a properly adopted 12b-1 plan. He noted that while information about promotional expenditures can be considered for other purposes – such as determining whether the Funds’ distribution arrangements are appropriate – the Trustees should not take them into account when approving the advisory or sub-advisory arrangements or fees. The CCO then indicated that the Adviser is recommending to the Board that each of the Sub-Advisory Agreements be renewed as proposed, as well as the Management Agreement.
After further review, discussion and a determination made in accordance with the foregoing that the best interests of the Funds and their shareholders was served by the renewal of the Management Agreement and each of the Sub-Advisory Agreements.

74
This Page Was Left Blank Intentionally

THE MONTEAGLE FUNDS
Investment Adviser Nashville Capital Corporation
2506 Winford Ave. Nashville, TN 37211
Distributor
Arbor Court Capital, LLC. 8000 Town Centre Drive, Suite 400
Broadview Heights, OH 44147
Transfer Agent, Administrator & Shareholder Servicing Agent
Mutual Shareholder Services, LLC. 8000 Town Centre Drive, Suite 400
Broadview Heights, OH 44147
(888) 263-5593 www.monteaglefunds.com
This report is submitted for the general information of the shareholders of the Funds. It is not authorized for distribution to prospective investors in the Funds unless preceded or accompanied by a current prospectus, which includes information regarding the Fund’s objectives and policies, experience of its management, marketability of shares, and other information.