monte carlo simulation and visualization as advanced research and teaching tools for microeconomics...
TRANSCRIPT
Monte Carlo simulation and visualization as advanced research and teaching tools for
microeconomicsCase study: bundling of financial services
Tomasz Kopczewski
DEE 2015

Goals
… to present my philosophy/methodology of economic education ( engineering of economic education)
… to introduce new teaching scheme and tools using bundling of financial services as a case study.

My philosophy of economic education
Getting to know the economy through experiments
….. through the various types of experiments

Type 1 experiment First type of experiments (behavioural, game theory and market classroom experiments) are well known. They are used by me and my team as part of blended learning or m-learning. We are using gamification techniques to enhance students' motivation.
First step: on-line experiment before lecture (a sort of flipped classroom technic)
Students motivated with the credits becomehomo oeconomicus at the experiment
Second step: The lecture is a confrontation of experimental results with the theory of economics
What about ethics?-> Winning strategy is cooperation and trust -> Experiment design include tools to create social capital

Type 1 experiment Together with my colleague dr Robert Borowski, we developed the software for conducting experiments using different media in different environments ( m-learnig, e-learning, …)
Moodle + BigBlueButton
LabSEE.comReady for MOOC (capacity now: max ~ 2000 participants at one experiment)

Type 2 experiment„Models are experiments, and experiments are models” Mäki (2005) The economic models are a tool to experiment if we use symbolic computation programs (CAS) – clue of Felix Klein ideas (1905) His postulates of mathematic reform were: i) model thinking ii) solution of the problem should be presented as a function iii) visualization of the results
EXAMPLEWe have the simple model of supply and demand with tax t and N firms (parameters). The solution - tax revenue T as a function of t
and N is not nice. But …
Maxima (CAS) as a scientific calculator

Type 2 experiment
Visualization
… by visualization tools of MAXIMA we obtain nice 3D Leffer surface
Maxima (CAS) as a visualization tool

Type 3 experiment The economy is never at the equilibrium. However, we describe the economy using partial or general equilibrium models. On the basis of real data we can conduct the calibrated Monte Carlo simulation, and find an area where the equilibrium can be found (Leibenstein, 1976), (McCloskey, 1998) Why should we look for an area not a point? The point solution can be misleading. EQULIBRIUM FOOLS US !!!!!
The solution to this system of equations can be unstable even for small values of error term ε. For example: the error ε = 0.19 x1 = 50the error ε = 0.21 x1 = - 50
Example: A very simple system of linear equations may contain an element of instability. One of the parameters can be biased with measurement error ε.

How we can incorporate the type 3 of experiment
to our teaching work
We can prepare an ad hock research in which: - in the first stage student are acting as subjects of the
research or experiment- in next stage students are acting as researchers
which are examining real word problems using calibrated Monte Carlo simulation

Schema of the work
Lecturer :1. should answer the questions: i) what storytelling lying behind
the model; ii) what are the connections between the model and reality
2. should find a real problem which is important for the students3. prepare the ad hock research to examine the problem with
students (a sort of flipped classroom technic)4. at lecture present a theory based on research using the data
from ad hock research 5. crate a tool to conduct „calibrated simulation” to work with
students

Step 1: What storytelling lies behind the model ? What is the connection between the model and
reality ?
Why lectures should answer the questions above in the first step? When starting with this question then can change the bad practice*
*bad practice: - on the lecture theory is presented (mainly)- there is no time to deal with real problems „…but after next level of education you will be able to use the model in you research” it means NEVER because on the next stage students will hear: „…but after next level of education you will be able to use the model in you research”

Step 1 Why storytelling?Philosophical view
We (economists) describe our reality using mathematical notation.
But… all economic models are storytelling (Gibbard and Varian, 1978).
We should have the reason to do it or it is only rhetoric (McCloskey, 1998).
What we are going to say about bundling?

Storytelling about bundling?
Bundling is a monopolistic price strategy to sell two or more goods together as one product.
Economists by constructing this model are trying to answer the question: It is good or bad practice for economy? Is this practice hurting consumers?
Should we stop this practice ???

A bit of history of economic thought
Example 1: Cournot effect. Should cupper and zinc be produced separately in two smelters or only in one smelter should produce this two metals and their mixture - brass.
Pros: The scope economics – monopolist is able to produce cheaper these two metal in one factory Cons: Monopolist can create price strategy which can hurt consumers
Example 2: Stigler examined the antitrust law in which the is no possibility to sell films as a bundle (Block-Booking)

15
Bundling of films (textbook example of films distributed in 1977)
The Other Side of Midnight Star Wars
Question: Which film was the „Blockbuster” for 20th Century Fox?

16
Bundling of films
„Blockbuster” „Little movie” Bundle
Cinema A 70 35 90
Cinema B 40 65 90
(2*40)=80 (2*35) =70 150/180
If the cinema owners’ valuation of the films are negatively correlated then cinemas and film distributors are gaining.
Expected value of films for the cinema owners.

17
Adams and Yellen (1976) presented more formal analysis of the problem
Monopolistic firm• produces two goods x1, x2
• marginal cost of production is c1 = c2, • no economies of scale and scope /cost of bundle equals sum of
separate costs cb = c1 + c2 Consumers• want to buy only one unit of good x1 and x2, marginal utility of a
second unit of each good = 0• goods x1, x2 are neither substitutes or complements to each
other / reservation price of bundle equals sum of separate reservation prices rb = r1 + r2
Formal model of bundling (1)

The firm can apply three pricing strategies sale of these two goods:
Formal model of bundling (2)
Pure BundleFirm sells only the bundle at a price pb
r1
r2
pb
Bundle is purchasedrb = r1 + r2 >= pb
pb
Nothing is purchased

Pure ComponentsFirm sells goods separately at their separate prices
r1
r2
p1*
x2 is purchased
r2 >= p2 and
r1 < p1
x1 and x2 are purchased
r1 >= p1
and
r1 >= p1p2
x1 is purchased
r1 >= p1 and r2 < p2
Nothing is purchased
Formal model of bundling (3)
20
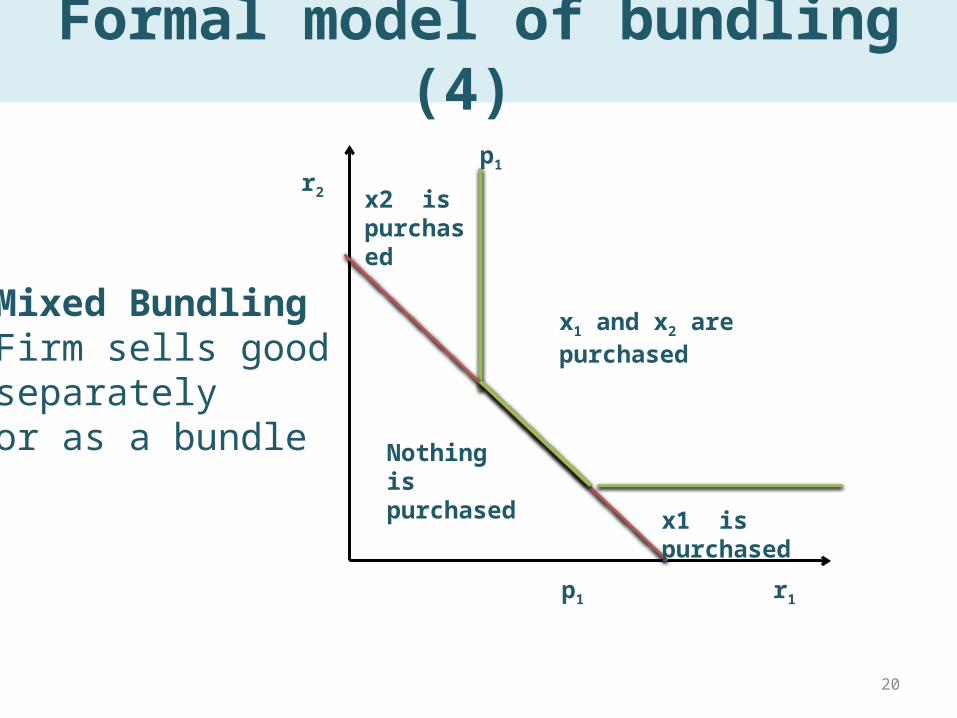
Formal model of bundling (4)
Mixed BundlingFirm sells good separately or as a bundle
r1
r2
p1
x2 is purchased
x1 and x2 are purchased
p1
x1 is purchased
Nothing is purchased
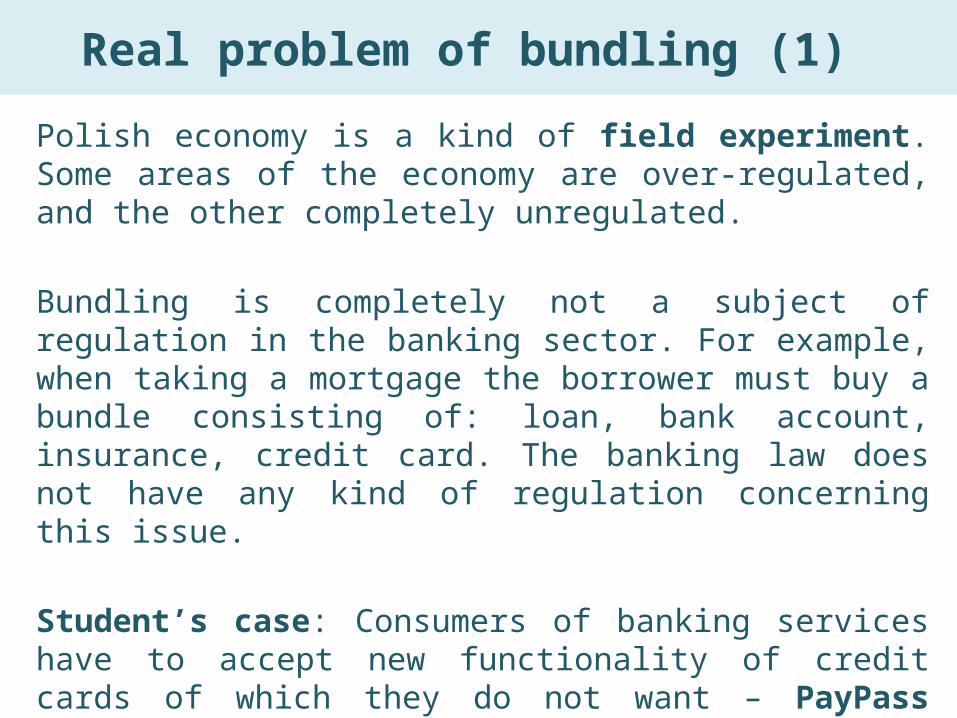
Real problem of bundling (1) Polish economy is a kind of field experiment. Some areas of the economy are over-regulated, and the other completely unregulated.
Bundling is completely not a subject of regulation in the banking sector. For example, when taking a mortgage the borrower must buy a bundle consisting of: loan, bank account, insurance, credit card. The banking law does not have any kind of regulation concerning this issue.
Student’s case: Consumers of banking services have to accept new functionality of credit cards of which they do not want – PayPass function. The lack of regulation of bundling in banking sector has affected the students themselves.

Real problem of bundling (2) Pay Pass payments raised concern at the beginning of its implementation and those fears were justified:
- If the card is stolen there was no way to verify it- NTC device (Near Field Communication) could serve as a tool for hacking credit cards in public transport-banks did not bear any liability in case of theft of funds from client accounts
This problem that more drastic that banks did not provide for the possibility of purchasing these services separately and in the initial phase of the introduction of new payment cards there was no technical possibility of deactivating the service by PayPass providers.
Sales package in the form of a credit card with PayPass function was a good pretext to create an ad hoc survey:

Ad hock research (1)The survey was conducted on the labSEE.com platform. A few weeks before the lecture, students had to answer only two questions:
1) What is your highest price that you are willing to pay for the annual use of a credit card with a limit of 10’000 zl per month (ca. 1’700 ₤) in which you have 54 days to repay the debt without interest, after this time the interest rate is 10%. This card is protected with chip. You can not use this card with Pay Pass contactless technology.
2) What is your highest price that you are willing to pay for annual additional functionality of payment card, through which you can pay in stores by applying contactless payment card to the reader? The transactions will be limited to 50 zl (ca. 10 ₤), and above this amount the PIN or signature will be required.
It was possible to have a negative valuation - which was an approximation of the discomfort of having this type of service.
Ad hock research (2)
The results from questionnaire provided the basis for the presentation of theories about bundling during lectures. They were also a pretext to discuss whether it is possible to introduce negative valuation in bundling model.
* Full presentation of models and theories will be included in the paper.

-100 0 100 200 300
-20
0-1
00
01
00
20
0
r. price of credit card
r. p
rice
of
Pa
yPa
ss
Results: Some people considered as undesirable both to have a credit card or PayPass service (negative reservation prices) There is no significant correlation (0.14) between reservation prices of payment cards and PayPass service
Ad hock research (3)

Ad hock research (4)
0 50 100 150
-10
00
10
02
00
30
0
de
ma
nd
.1Demend for Credit CardDemend for PayPass
These data can be used to construct the demand functions.
Q – How can we interpret this kind of „real” demand function?

Ad hock research (5)
The results are the basis for determining optimal pricing strategies for the monopolistic firm, assuming zero cost
Max profit Consumer Surplus
Price of bundle
Price of Credit Card
Price of Pay Pass
Pure Bundle
4560 6972 120 - -
Pure Components
5314 10296 - 60 59
Mixed Bundling
5251 10296 118 59 59
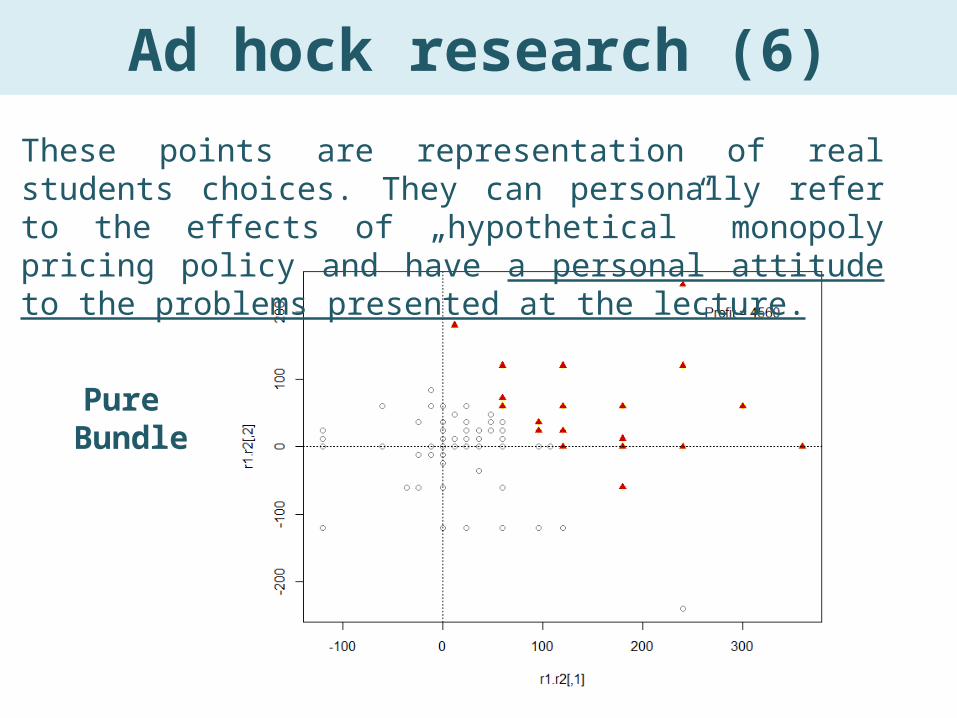
Ad hock research (6)
Pure Bundle
These points are representation of real students choices. They can personally refer to the effects of „hypothetical” monopoly pricing policy and have a personal attitude to the problems presented at the lecture.

Ad hock research (7)Pure Components
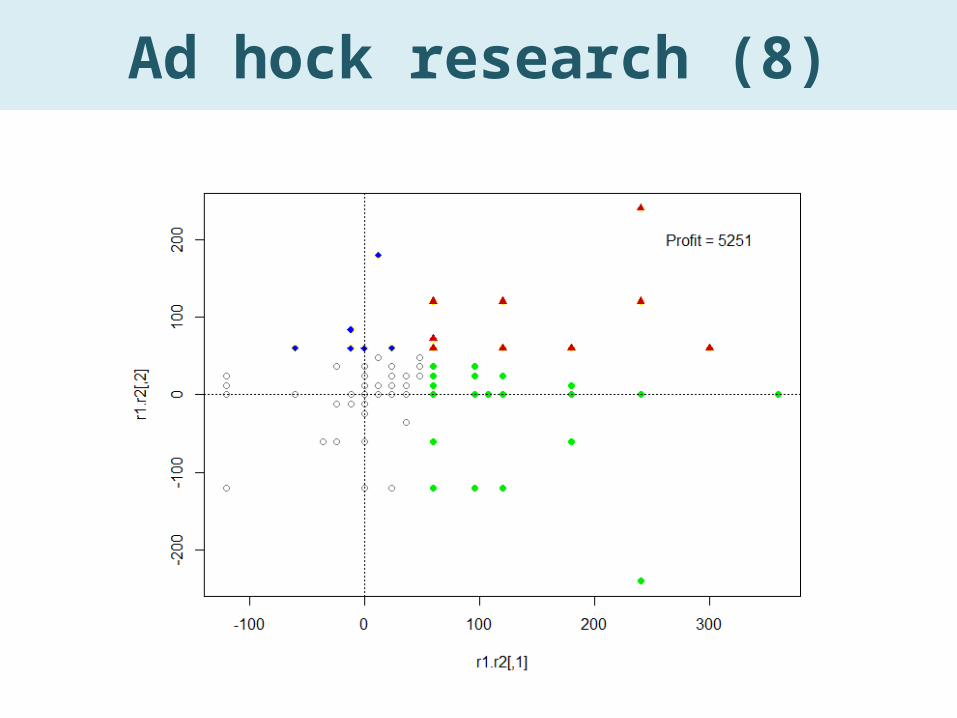
Ad hock research (8)

Calibrated simulation (1)These test results are only a rough approximation of real student’s valuations, as:
1) The students do not ask themselves these questions, and most of their purchases are the result of impulsive behaviour.
2) Method of testing and sampling did not meet the criteria of scientific study
However, these results represent a kind of benchmark to run MC simulation, through which you can specify the area of pricing strategies acceptable to the company and the impact of these strategies on social welfare.
From the educational point of view, it is desirable to carry out this type of calibrated simulation, because students no longer see the outcome as single point, and start to have an overall picture of the issue.
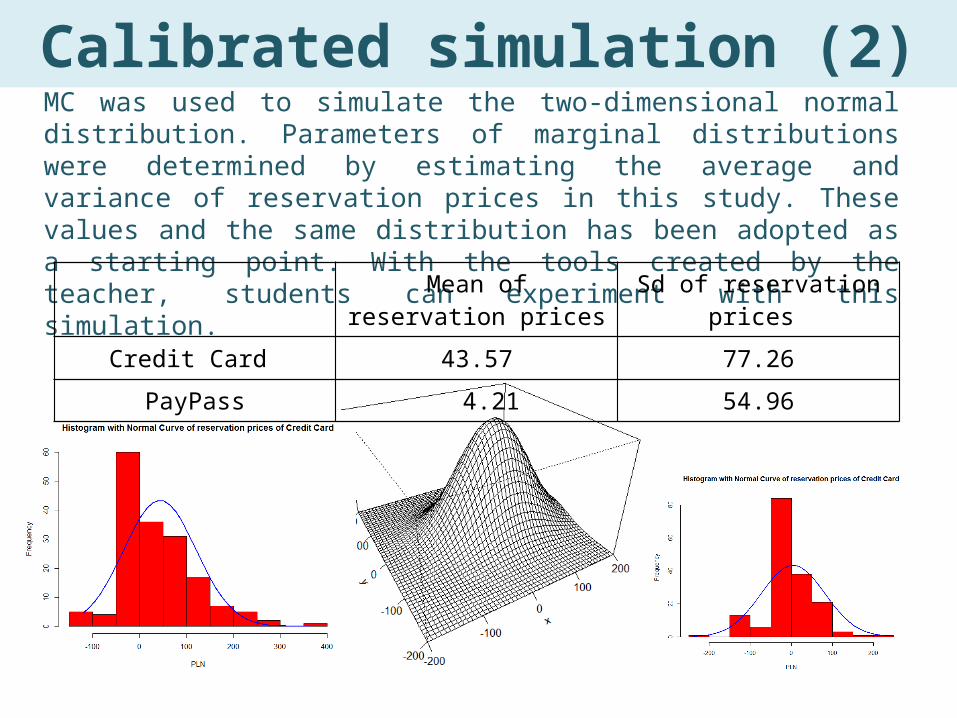
Calibrated simulation (2)MC was used to simulate the two-dimensional normal distribution. Parameters of marginal distributions were determined by estimating the average and variance of reservation prices in this study. These values and the same distribution has been adopted as a starting point. With the tools created by the teacher, students can experiment with this simulation.
Mean of reservation prices Sd of reservation prices Credit Card 43.57 77.26
PayPass 4.21 54.96

Calibrated simulation (3)
Codes prepared by the teacher allow for very different simulation.
Students can themselves create and check how "robust" are the monopoly pricing strategies on changes in distributions of reservation prices by binding parameters of these distributions.
In the case of two-dimensional normal distribution it can be examined both by the influence of changes in mean and variance of marginal distributions, as well as the correlation between the offering price.

Calibrated simulation (4)Below are the results of one experiment with the marginal distribution of reservation price It is an attempt to answer the question, what happens if consumers will be afraid to use this technology and its valuation will decrease even more. Translating this to changes in simulation parameters, it means the decrease in the average reservation price of PayPass.
Mean

Calibrated simulation (5)In order to better understand the mechanics of the model, there was prepared an animation with in which the average drop of 2 in each frame of the animation.
As can be seen, change of average in the distribution of reservation price does not affect drastically the profit maximizing pricing strategies, and only changes the number of buyers.

Calibrated simulation (6)Changing the number of buyers least affected the Mixed Bundling (MB) strategy, although the optimal strategy is Pure Components (PC) because it gives the highest profits regardless of the average. The impact of changes in average on consumer surplus is similar.

ToolsAlpha version of the R package bundling to simulate pricing strategies will come soon. It will be available at (Authors: Tomasz Kopczewski, Ireneusz Miernik, Maciej Sobolewski): https://github.com/tomvar/bundling/ This package allows for analysing social welfare with Monte Carlo pricing strategies (PB, MB, PC) depending on:
- marginal distribution of reservation prices- copula function- complementarity and substitutability of goods- economic scale and scope of production
Software for creating and carrying out economic experiments on-line along with many examples of experiments is already available at: www.labsee.com
Teaching materials for the advanced microeconomics based on symbolic computation software (CAS) (MAXIMA) and Monte Carlo simulations in R-CRAN (forthcoming in spring 2016)

Thank you for attention !
Tomasz [email protected]
University of Warsaw, Faculty of Economic Scienceswww.wne.uw.edu.pl