monte carlo sensitivity analysis of cf2 and cf radical
TRANSCRIPT
I ‘ i
r
A Monte Carlo sensitivity analysis of CF2 and CF radical densities in a C - C ~ F ~ plasma
Deepak Bose ELORET Corporation, NASA Ames Research Center, Moffett Field, CA 94035
ShahidRauf . Advanced Products Research & Development Laboratory, Semiconductor Products Sector, Motorola Inc., Austin, TX 78721
D. B. Hash, T. R Govindan and M. Meyyappan NASA Ames Research Center, Moffett Field, CA 94035
Abstract
A Monte Carlo sensitivity analysis is used to build a plasma chemistry model for octacyclofluorobutane (c- c4F8) which is commonly used in dielectric etch. Experimental data are used both quantitatively and quahtatively to analyze the gas phase and gas surface reactions for neutral radlcal chemistry. The sensitivity data of the resulting model identifies a few critical gas phase and surface aided reactions that account for most of the uncertainty in the CF2 and CF radlcal densities. Electron impact dissociation of small radicals (CF2 and CF) and their surface recombination reactions are found to be the rate-limiting steps in the neutral radical chemistry. The relative rates for these electron impact dissociation and surface recombination reactions are also suggested. The resulting m e c h s m is able to explain the measurements of CF2 and CF densities available in the literature and also their hollow spatial density profiles.
I. Introduction
Octacyclofluorobutane (c-CPe) is a commonly used dielectric etch gas with rich polymerizing properties. The differences in deposited GF, film characteristics and their deposition rates on different materials enables the etch process to proceed at disparate rates offering the much needed etch selectivity. In order to meet the stringent requirements of the next generation semiconductor integration techniques, it is critical that we gain enough quantitative insight into these processes to be able to build models with sufficient fidelity. It is believed that the precursors of the polymer film formation are the neutral radicals produced in the plasma via electron impact dissociation of feedstock gas molecules and their fiagments. It has also been suggested that low energy ion bombardment aids in the formation of polymer film whereas high energy ion bombardment at a biased electrode adversely affects the tilm formation due to sputtering.’ Therefore, a better quantitative understanding of the plasma chemistry that forms these radicals and ions is an essential step toward understanding these surface mechanisms.
Due to the large size of the c-C& molecule, it forms a wide variety of ions and neutrals due to electron impact ionization and dissociation.’ These fragments then undergo further ionization and dissociation into smaller ions and neutral radicals due to electron impact. Negative ions are also formed due to attachment and dissociative attachment reactions. As ions and neutrals collide, they alter the relative populations of ions by charge exchange. In addition, all species interact with the chamber walls. Most ions are neutralized at the surfaces. However, a neutral radical may also be adsorbed on a surface and recombine or react with other surface species and may be released as a radical or a stable species. The rates at which these gas- phase and gas-surface reactions occur are very =cult to measure. Currently, only the rates of electron impact ionization reactions of stable species (e.g. : c-Cz8, CF4, CHF3, etc.) are known with good certainty.”
Electron impact ionization rates of only a handful of neutral radicals (CF,, CF2, and CF) have ever been measured.’ Among the gas-phase reactions, the biggest roadblock toward building a quantitative model is the lack of credible measurements of electron impact dissociation of stable species and radicals into smaller neutral radicals. This is difficult to measure due to difficulties in tracking neutral radical products. As a
4
I . t
result, neutral dissociations reaction rates are scarce in the literature and it is not uncommon for the rates obtained by different groups to differ fiom each other by orders of magnitude.
Clearly, our chemical kinetics database needs are vast and it is unllkely to be fulfilled in the near future. Therefore, we must rely on alternative means to reduce the uncertainties in our model calculations. One such way is to perform a sensitive analysis of the plasma system and identify a few key processes that are responsible for the majority of the uncertainty in the model. Once these major sources of uncertainty are identified, comparisons with a variety of plasma diagnostic data can help reduce some of the uncertainty. Also, an uncertainty analysis identifies critical rate-limiting and dominant reaction mechanisms which can be the focus of future investigations, essentially narrowing the database needs. In the past, we performed uncertainty analysis for a CHF3 plasma system. 6
In th~ paper we analyze c-C4Fs chemistry in a hgh density plasma reactor. There have been a few multidimensional reactor modeling studies of c - C ~ F ~ . ~ - ~ Due to its extensive use in dielectric etch, some experimental diagnostics data are also available in the literature. Hebner and Abraham” and Hebner” present plasma densities and some neutral radical densities in an inductively coupled Gaseous Electronics Conference (GEC) cell. They also presented some radial profiles of CF2 radicals, the dominant neutral species in the high density chamber. Waters” also measures CF2 and CF radicals and electron densities in a GEC cell during oxide and photoresist etch. There have also been some measurements of neutral radical profiles in ECR discharges.‘3314 Almost all neutral density profiles measured by variety of experimental groups show a hollow profile for CF2 density, i.e. CF2 is larger near the chamber walls as compared to the center of the discharge. This essentially means that there is a net production of CF2 at the chamber walls and a net destruction in the bulk plasma. Thls has also been observed in plasma beam measurements for other fluorocarbon CF, profile measurements made in low density capacitively coupled CF4 discharges also show a net production of CF2 radicals at the In t h ~ s work, we will show that by comprehensively comparing our data to these experimental measurements and with the help of sensitivity analysis we can build a CF2 formation and consumption model by isolating the rate-limiting and dominant steps. The relative magnitudes of the rates of these steps, if not the rates themselves, may be deduced !?om this analysis.
The rest of the paper is organized as follows. In Sec. I1 we discuss the c-C4F8 plasma chemistry and the sources of the rate constants. Section 111 outlines the details of the plasma simulation and comparisons with experimental data. The sensitivity analysis technique is discussed in Sec. Iv and in Sec. V we discuss the results of the sensitivity analysis and discuss their implications. Finally we make some concluding remarks in Sec. VI.
II. c-C4Fs Plasma Chemistry Model
Christophorou and Olthoff? present a comprehensive review of the electron collision data for c-C4Fg. In this section we present a discussion of the available data that is used in this work. Also, since in high density plasmas most of the feedstock c-C4F8 is dissociated into smaller radicals, the electron collisions with these smaller radicals are more important.
Electron impact dissociative ionization: The electron impact of c-C4F8 produces a variety of ions; C3F5+, C2F;, CF3+, CF;, CF’, etc. There have been a few measurements of electron impact ionization cross sections.19920 In ths work we use the data presented by Jiao et The reactions considered are listed in Table 1. Although the data obtained by Jiao et al. are not in very good agreement with the data obtained by Toyoda et al.,” these reactions are not expected to strongly influence the neutral radical composition of the plasma as long as the total ionization cross sections are consistent. Also, most of the ionization in a hgh density plasma occurs via electron impact of dominant neutral radicals, in this case CF2 and CF, for which we use the fast neutral beam data of Tarnovsky et ai? We also include atomic ionization reactions as shown in Table 1 .
Electron impact dissociation into neutrals.
It is generally believed that Since c-c38 is a dimer of c2F4, it primarily dissociates into two C2F4 molecules. Bauschlicher and Ricca21 using ab initio bond energy computations have confirmed that c-CPs is much more Mcely to dissociate by breakmg two opposite C-C bonds forming C2F4 (1.95 ev) rather than two adjacent C-C bonds (3.26 eV) and forming C3F6+CF2. The breaking of a C-F bond and forming C&+F is even more unfavorable (4.7 eV). This is has been experimentally seen in shock tubes where thermal dissociation of c-Cps mostly produces c2F4 with only small amounts of c3F6.zz” Also, the activation energy of dissociation computed from the ab initio study agrees well with the experimental estimate,= lending further credibdity to the computations. Bauschlicher and R i ~ c a ~ ~ further show via ab initio heat of formation computations that for GF,. (x>l) radicals, pulling a CF2 group out is easier than other dissociation pathways. This implies that c2F4 and cp6 will also most likely dissociate by releasing a CF2 group. Therefore CF, is readily formed in a plasma. The CFz radicals are also further dissociated into CF, C, and F radicals by electron impact. The reactions considered in this work are shown in Table 1. A few authors have estimated the total dissociation rates of c-C4Fg by electron impact at specific electron temperatures.z*26 In this work we use the Arrhenius expression of Font et al.’ which is estimated fiom swarm measurements. We divide the total dissociation rate into two major dissociation pathways with a 9: 1 branching ratio.
e + C4F8 -+ 2C2F4 +e
e+C4F8+C3F6+CF2+e
This ratio is chosen based on mole fraction ratios of C2F4 and ( 2 8 6 seen in thermal decomposition of c- C4F8.U As we will find later, the neutral radical densities (CF2, CF, etc.) are not very sensitive to h s choice. The dissociation rate of c2F4 is taken fiom Font et.al.’ as well. However, this rate has not been estimated experimentally and is likely to be somewhat uncertain. The dissociation rates of remaining radicals haven been estimated fiom other systems, as tabulated in Table 1. More on dissociation cross sections will be discussed later.
Ion-molecule charge transfer: Ion-molecule charge transfer reactions alter the relative densities of various ions. However, since the densities of dominant radicals are orders of magnitude larger than that of the ions, they are not significantly affected by these reactions. We include a variety of charge transfer reactions outlined by Font et.al.’ The rates of these reactions are mostly detennined by the Langenvin formula. The uncertainties in these rates will directly affect the relative densities of various ions, whereas the neutral radicals which are the focus of this article are unlikely to be affected very much. In very hgh density plasmas (ne > 10l2 cm-’), the ion composition of the plasma can affect the neutral composition as the wall recombination of ions becomes a sigmficant contriiutor to the neutral species mass balance. This is unlikely to be the case in the parameter space that we explore and wdl also be evident from the sensitivity data.
Attachment, detachment, and ion-ion recombination: At low electron energies ( < 1 ev) the c-C& negative ion has been observed in electron beam ~tudies.~’ In a strongly dissociated high density discharge negative ions are most likely to form via dissociative attachment of CF, radicals. The rates of these dissociative attachment reactions tend to be uncertain since there are no direct measurements of these individual reactions. Attachment reactions have indirect influence on neutral radical densities via changes in plasma properties, such as plasma potential, density and temperature. In this work we adjust the rates of CF, dissociative attachment reactions to get good agreement with experimental data presented in the next section. A few ion-ion recombination reactions listed by Font et al.9 have also been included. Their influence on the neutral radical densities is expected to be minimal.
Gas-su$ace reactions: The current state of knowledge of gas-surface reactions in fluorocarbon plasmas is much more limited than the gas-phase reactions. In most fluorocarbon plasmas, etching and deposition processes proceed simultaneously via a variety of surface reaction mechanisms, such as physical and chemical absorption, surface diffkiion, desorption, ion impact processes. A complete modeling based on first principles is
currently not feasible due to the lack of understanding of the fundamental processes. Therefore, in this paper we rely on phenomenological modeling of gas surface reactions.
In many fluorocarbon plasmas radical density profiles have been measured using L E and W Based on these measured profile gradients we can assess whether chamber walls act as a
source or a s l n k for a particular neutral species. For CF2 radicals, a dominant species in c-C4Fs plasmas, the density profiles shows a hollow shape, i.e. a larger density at the chamber walls as compared to the one in the bulk plasma. A part of this density gralent may also be due to the gas temperature profile, but it is unlkely that a gas temperature gradient can be large enough to cause such large CF2 density gradients as were measured. Therefore, it was reasonably concluded by many authors that there is a net production of CFz at the chamber walls. For CF, however, there appears to be a density gradient directed away fiom the chamber walls, indicating a possible consumption at the walls. The measured CF density profiles of Nakamura et and Suzulu et al.14 also show a hollow profile, but unlike the CF2 density, the CF density gradient changes direction near the chamber walls. It remains unclear what mechanisms are responsible for CF2 production at the chamber walls. It has been speculated that larger polymeric neutrals may deposit on the chamber walls forming the amorphous film which are then desorbed as CF2.18 However, later measurements have shown that the density of large polymeric neutrals is too low in hgh density plasmas to justify a large CF2 flux fiom the walls.28 It has also been suggested by observations in plasma beam studies that CF2 radicals may be produced at the walls by CF+F re~ombination.’~,’~ Based on the above observations, we believe that it is highly ldcely that CF radicals recombine on the fluorinated surfaces of the chamber forming CF2 which is readily desorbed. The film formation occurs at a much slower time scale than the production of CF2. Therefore, it is not unreasonable to assume that the slow process of sticking of radicals leading to the fluorocarbon film formation is only a subset of the variety of dissociation, exchange, and recombination processes that may be occurring on these surfaces. The details of these processes is obviously unknown, but in h s work we start by assuming that following processes occur at all surfaces
absorption. 11p13,14117
CF + F -+ CF2 C + F + C F
It is possibIe that further recombination reactions forming CF3 and CF4 also occur at these surfaces, but since these species are not found with appreciable densities in c-C4Fg plasmas, we will ignore this possibility. The rates of surface aided recombinations shown in (2) are obviously unknown, but in th~s work we attempt to estimate them via sensitivity analysis and comparisons with experiments.
In addition to the above recombination reactions, we assume that all ions recombine at the walls with a unit probability. The complete list of all gas-phase and surface aided reactions are shown in Table 1.
LII. Volumetric Plasma Simulations and Comparisons with Experiments
In this section we briefly describe the plasma reactor scale simulations. We use the SAMPR code3’ to solve volume averaged conservation equations for each neutral and ionic species with surface reaction boundary conditions as shown in (2) along with ion neutralization reactions. In addition we solve for electron and gas temperatures. All ions are assumed to exit the bulk with individual Bohm speeds. The reactions shown in Table 1 are included. In order to establish a baseline plasma chemistry model we begin by comparing and calibrating our model results with two sets of experimental measurements of plasma and neutral radical densities in pure c-C4Fs plasma in an inductively coupled GEC cell. The first set of data we consider is by Waters” who used d a r e d lode.laser absorption spectroscopy to measure CF2 and CF densities at a variety of pressures, source powers and bias powers. The data were condensed by Waters in the form of - fitted expressions which are used in this paper to validate the results of our parametric study. Waters also presented Langmuir probe measurements of electron density and plasma potential. The second set of data is by Hebner” and Hebner and Abraham” who presented CF2 density on a relative scale using LIF in a GEC cell. They also presented electron and F- ion densities.
Comparisons with the experiments of Waters:
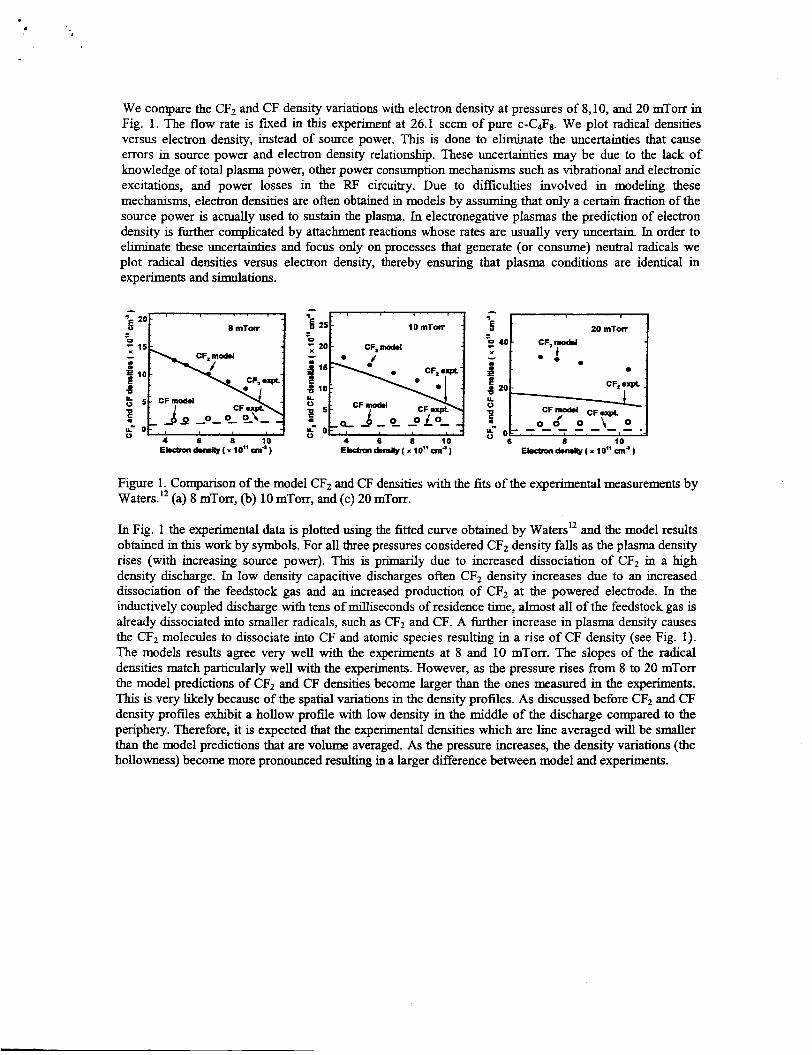
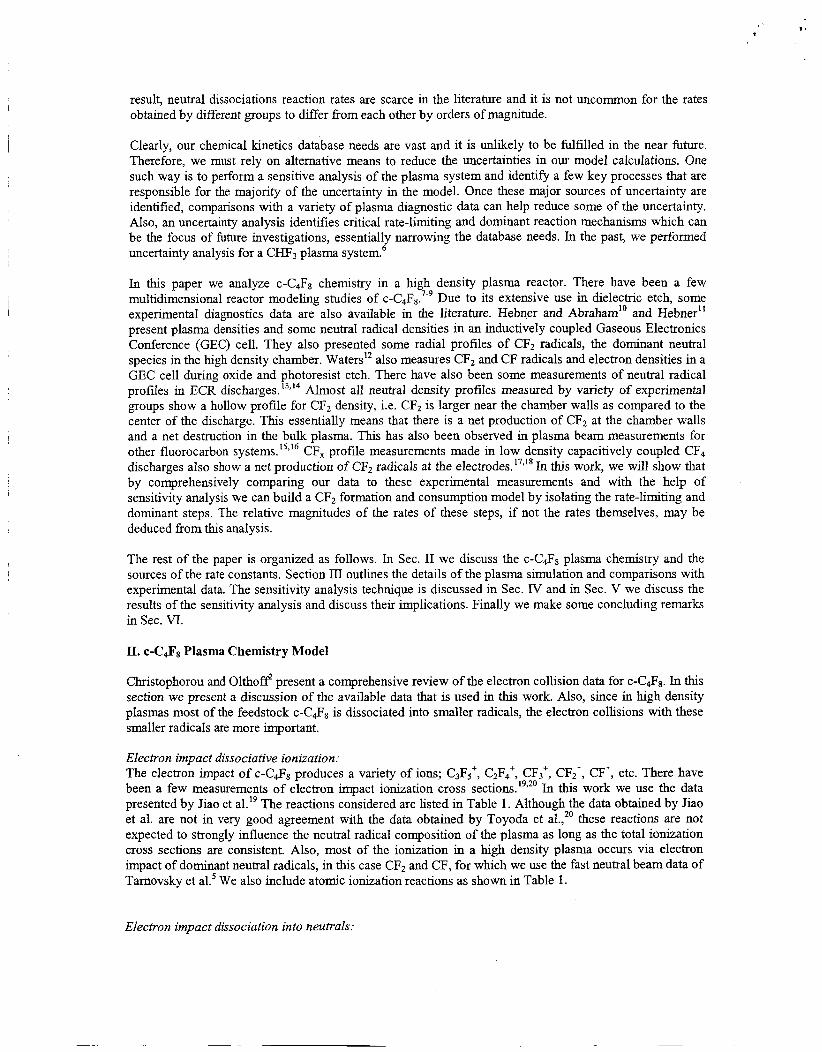
We compare the CF2 and CF density variations with electron density at pressures of 8,10, and 20 mTorr in Fig. 1. The flow rate is fixed in thu experiment at 26.1 sccm of pure c-Cfi8. We plot radical densities versus electron density, instead of source power. This is done to eliminate the uncertainties that cause errors in source power and electron density relationshlp. These uncertainties may be due to the lack of knowledge of total plasma power, other power consumption mechanisms such as Vibrational and electronic excitations, and power losses in the RF circuitry. Due to dficulties involved in modehg these mechanisms, electron densities are often obtained in models by assuming that only a certain fraction of the source power is actually used to sustain the plasma. In electronegative plasmas the prediction of electron density is further complicated by attachment reactions whose rates are usually very uncertain. In order to eliminate these uncertainties and focus only on processes that generate (or consume) neutral radicals we plot radical densities versus electron density, thereby ensuring that plasma conditions are identical in experiments and simulations.
Figure 1. Comparison of the model CF2 and CF densities with the fits of the experimental measurements by Waters." (a) 8 mTorr, (b) 10 mTorr, and (c) 20 mTorr.
In Fig. 1 the experimental data is plotted using the fitted curve obtained by Waters" and the model results obtained in this work by symbols. For all three pressures considered CF2 density falls as the plasma density rises (with increasing source power). This is primarily due to increased dissociation of CF2 in a high density discharge. In low density capacitive discharges often CF2 density increases due to an increased dissociation of the feedstock gas and an increased production of CF2 at the powered electrode. In the inductively coupled discharge with tens of milliseconds of residence time, almost all of the feedstock gas is already dissociated into smaller radicals, such as CF2 and CF. A further increase in plasma density causes the CF2 molecules to dissociate into CF and atomic species resulting in a rise of CF density (see Fig. 1). The models results agree very well with the experiments at 8 and 10 mTorr. The slopes of the radical densities match particularly well with the experiments. However, as the pressure rises from 8 to 20 mTorr the model predictions of CF2 and CF densities become larger than the ones measured in the experiments. This is very likely because of the spatial variations in the density profiles. As discussed before CF2 and CF density profiles exhibit a hollow profile with low density in the middle of the discharge compared to the periphery. Therefore, it is expected that the experimental densities which are line averaged will be smaller than the model predictions that are volume averaged. As the pressure increases, the density variations (the hollowness) become more pronounced resulting in a larger difference between model and experiments.

1
5 f ," 1.8- X Y
.- 0 E 0 '13
L 0 -1.5
I I
A 10 rnTorr, 10 sccm
8
-
e Model -
\ O O {
e 0 0 0
r' Expt -
e
Model
O J 0
0 6
rm Expt.
I t I I
4 5 6 Electron density ( x I O " crnJ )
I I
10 rnTorr, 10 sccm
1 , , . , 1 , , , , I . .
4 5 6 Electron density ( x I O " crn" )
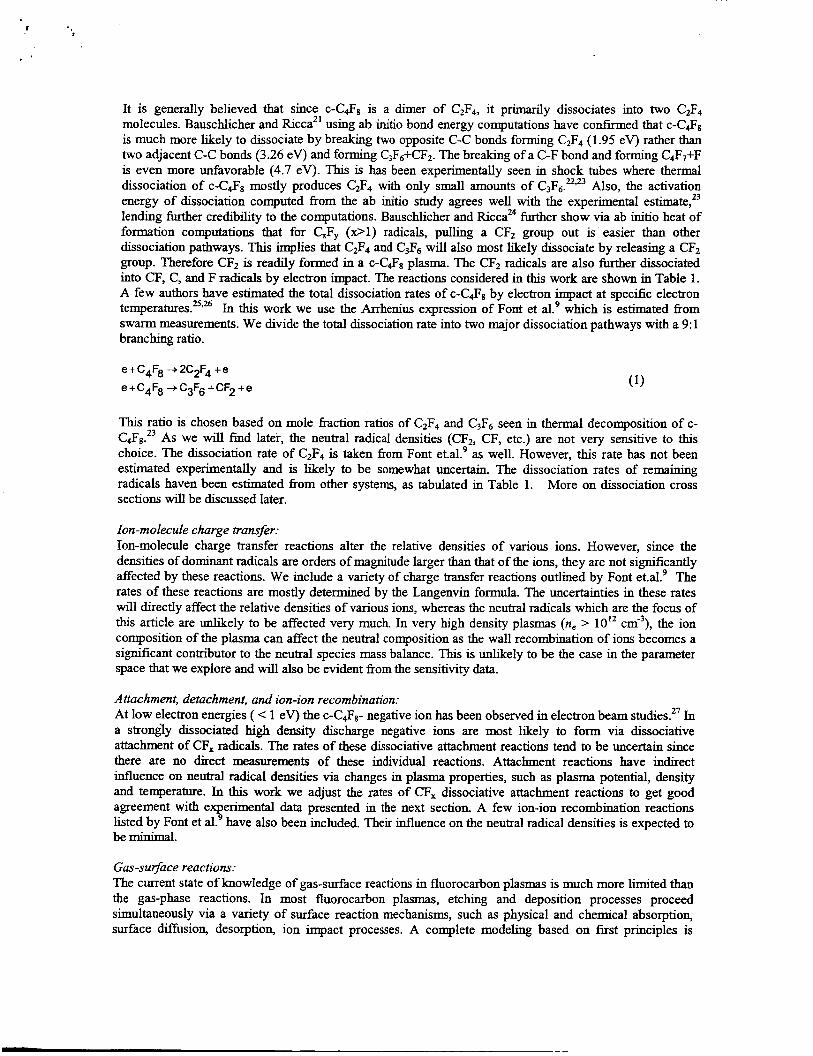
Figure 2. Comparison of the model (a) CF2 density and (b) F- ion density with the values measured by Hebnerl'and Hebner and Abraham."
Comparisons with the experiments of Hebner and Abraham:
Hebner" gives CF2 density measurements on a relative scale in c-CqF8 plasma. The data for varying power is given only for 10 mTorr. In order to plot the CF2 density against the electron density we use corresponding values given by Hebner and Abraham." Our model data agrees very well with the CF2 density variation with increasing electron density w i t h the experimental scatter as shown in Fig. 2(a). We normalize the experimental CF2 data with the model CF2 density at the lowest electron density point. Again, the slope of the CF2 density, which is the only relevant quantity in this case, is predicted by the model well.
Hebner and Abraham" also presented F- negative ion density data which is found to be the dominant negative ion. We find that F- is critically dependent on the dissociative attachment reactions involving CF2 and CF radicals. The rates of these reactions are adjusted to attain the best possible match with the experiments as shown in Fig. 2(b).
IV. Sensitivity Analysis Technique
The goal of this sensitivity analysis is to isolate the most sensitive gas phase and surface reactions that determine the CF2 and CF radical densities in a high density c-C4F8 discharge. Since we obtained very good agreement with the available experimental data in the previous section using our baseline model, the sensitivity analysis will allow us to place confidence levels on some of the critical reaction rates. Ideally, this methodology could be used to reduce uncertainties in our reactions rates or at least establish relative rates of certain critical reactions.
Since a plasma chemical system is inherently non-linear, we use a Monte Carlo technique where the reaction rate for each reaction is varied simultaneously and independently based on a probability distribution function centered at the baseline rate coefficient or the reaction probability for that reaction. The baseline rate coefficients and probabilities are shown in Table 1. A Gaussian probability distribution of loglok is chosen for each reaction with a half width of half-order of magnitude (Aloglo k = 0.5). The width of the Gaussian is chosen based on the uncertainties of most of the reaction rates. An infinitesimally small Gaussian width would reduce the techmque to a local sensitivity analysis, which is frequently undertaken. However, the large variability in reaction rate coefficients makes the non-linear effects more important.
.
The steps involved in this methodology are as follows. (1) Random numbers are used to generate rate coefficients based on the probability distribution. (2) The plasma model S M R is run using these rate coefficients and species, and plasma densities are collected. (3) In this work steps (1) and (2) are repeated tens of thousands of times to gather a large enough sample to drawn meaningful correlations. (4) Correlation coefficients are obtained for each input-output pair. (5) Rate limiting steps are identified. For details on these steps the reader is referred to Ref. 33 and our earlier work on CHF3 sensitivity analysis.6
V. Sensitivity Results and Discussion
In this section we discuss the sensitivity analysis data obtained for pure c-C4Fg plasma in a GEC cell at 10 mTorr with 26.1 sccm of flow rate and 500 W of plasma power. The bias power is set to zero. The data are obtained in the form of scatter correlation plots. In this work we ran 10,000 runs which are found to be sufficient to describe the statistics. We use linear regression analysis to obtain correlation coefficients and sensitivity rankings.
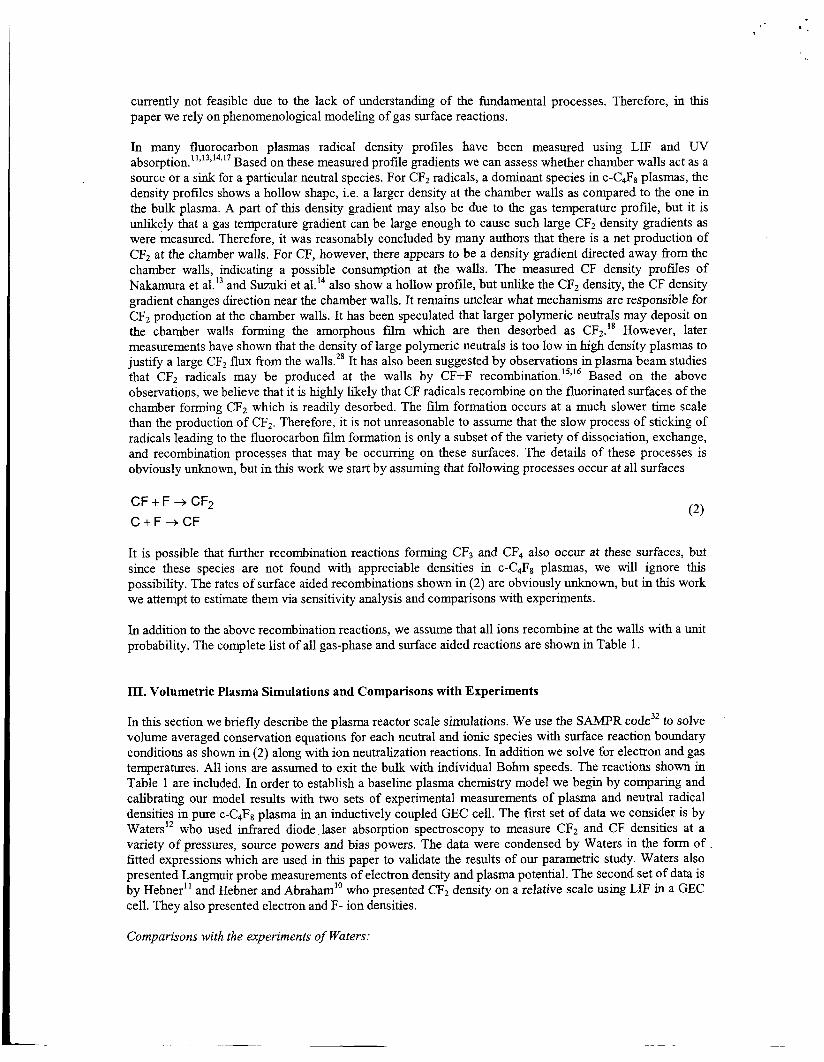
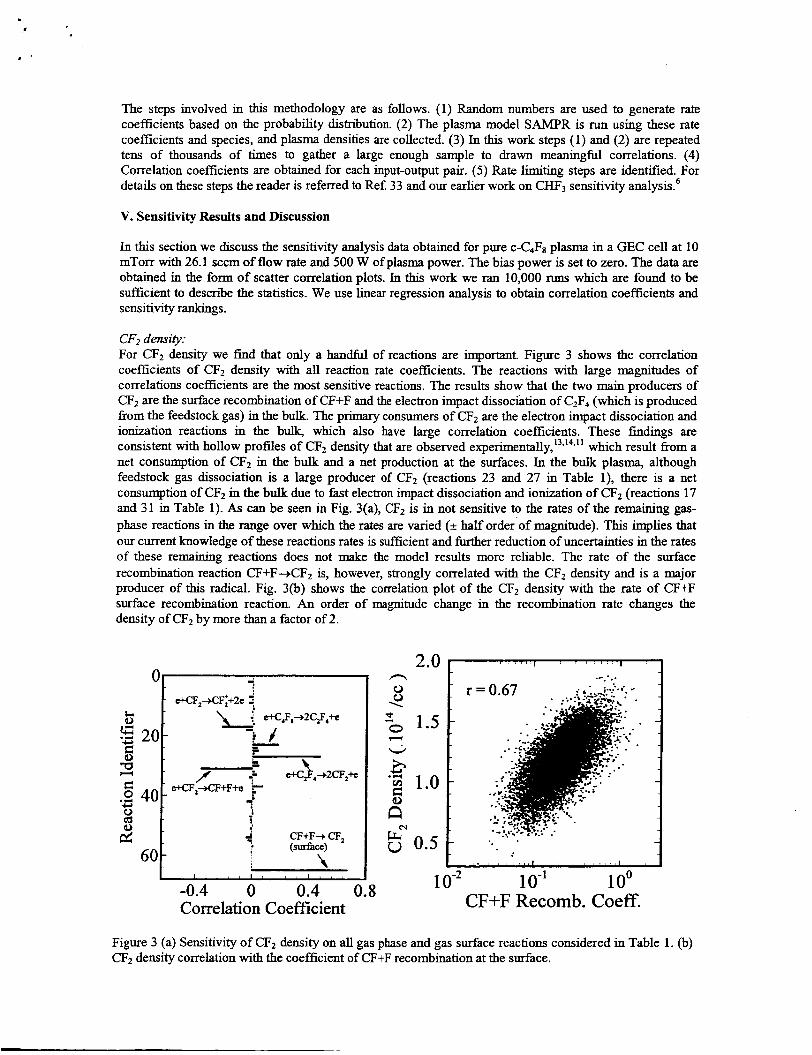
CFt density: For CF2 density we find that only a handful of reactions are Important. Figure 3 shows the correlation coefficients of CF2 density with all reaction rate coefficients. The reactions with large magnitudes of correlations coefficients are the most sensitive reactions. The results show that the two main producers of CF2 are the surface recombination of CF+F and the electron impact dissociation of C2F4 (which is produced f?om the feedstock gas) in the bulk. The primary consumers of CF2 are the electron impact dissociation and ionization reactions in the bulk, which also have large correlation coefficients. These findings are consistent with hollow profiles of C F 2 density that are observed e~pe"mentally,'~,'~*'' which result fiom a net consumption of CF2 in the bulk and a net production at the surfaces. In the bulk plasma, although feedstock gas dissociation is a large producer of CF2 (reactions 23 and 27 in Table l), there is a net consumption of CF2 in the bulk due to fast electron impact dissociation and ionization of CF2 (reactions 17 and 31 in Table 1). As can be seen in Fig. 3(a), CF2 is in not sensitive to the rates of the remaining gas- phase reactions in the range over which the rates are varied (* half order'of magnitude). This implies that our current knowledge of these reactions rates is sufficient and M e r reduction of uncertainties in the rates of these remaining reactions does not make the model results more reliable. The rate of the surface recombination reaction CF+F+CF2 is, however, strongly correlated with the CF2 density and is a major producer of this radical. Fig. 3(b) shows the correlation plot of the C F 2 density with the rate of CF+F surface recombination reaction. An order of magnitude change in the recombination rate changes the density of CF2 by more than a factor of 2.
h t 1
I I I I 1 o-2 lo-' 1 oo
CF+F Recomb. Coeff. B
Figure 3 (a) Sensitivity of CF2 density on all gas phase and gas surface reactions considered in Table 1. (b) CF2 density correlation with the coefficient of CF+F recombination at the surface.
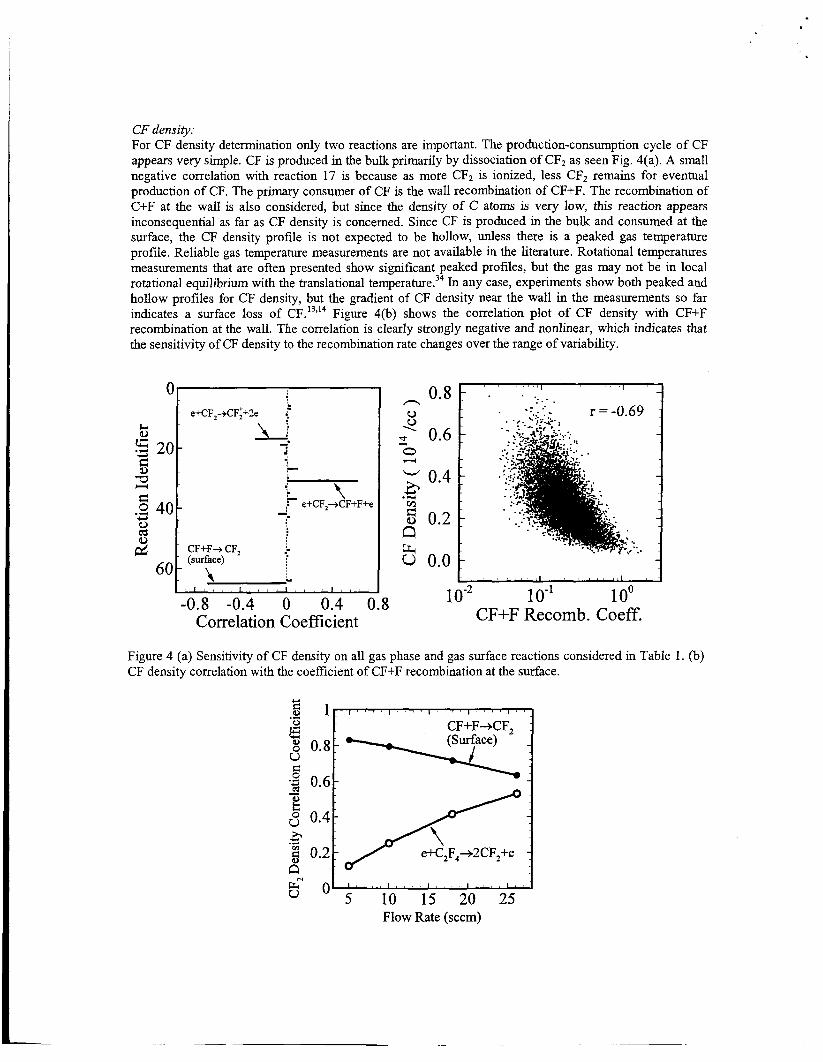
CF density: For CF density determination only two reactions are important. The production-consumption cycle of CF appears very simple. CF is produced in the bulk primarily by dissociation of CFz as seen Fig. 4(a). A small negative correlation with reaction 17 is because as more CF2 is ionized, less CF2 remains for eventual production of CF. The primary consumer of CF is the wall recombination of CF+F. The recombination of C+F at the wall is also considered, but since the density of C atoms is very low, this reaction appears inconsequential as far as CF density is concerned. Since CF is produced in the bulk and consumed at the surface, the CF density profile is not expected to be hollow, unless there is a peaked gas temperature profile. Reliable gas temperature measurements are not available in the literature. Rotational temperatures measurements that are often presented show significant peaked profiles, but the gas may not be in local rotational equilibrium with the translational temperature.34 In any case, experiments show both peaked and hollow profiles for CF density, but the gradient of CF density near the wall in the measurements so far indicates a surface loss of CF.13,14 Figure 4(b) shows the correlation plot of CF density with CF+F recombination at the wall. The correlation is clearly strongly negative and nonlinear, whlch indicates that the sensitivity of CF density to the recombination rate changes over the range of variability.
- eHSF,+CF;+2e
-0.8 -0.4 0 0.4 0.8 Correlation Coefficient
, .
. . . . 0 . 8 1 ' . " . . ' " ' I ' "
t I I ,
CF+F Recomb. Coeff. 1 o-2 10-l 1 oo
Figure 4 (a) Sensitivity of CF density on all gas phase and gas surface reactions considered in Table 1. (b) CF density correlation with the coefficient of CF+F recombination at the surface.
Y
.e 1 - ' I " ' I I " ' I " ' I
0 CF+F+CF, :
u d -2 cd 0.61 -
10 15 20 25 Flow Rate (sccm)
.
Figure 5. Effect of flow rate on the sensitivity of CF2 density on major gas phase and gas surface production reactions.
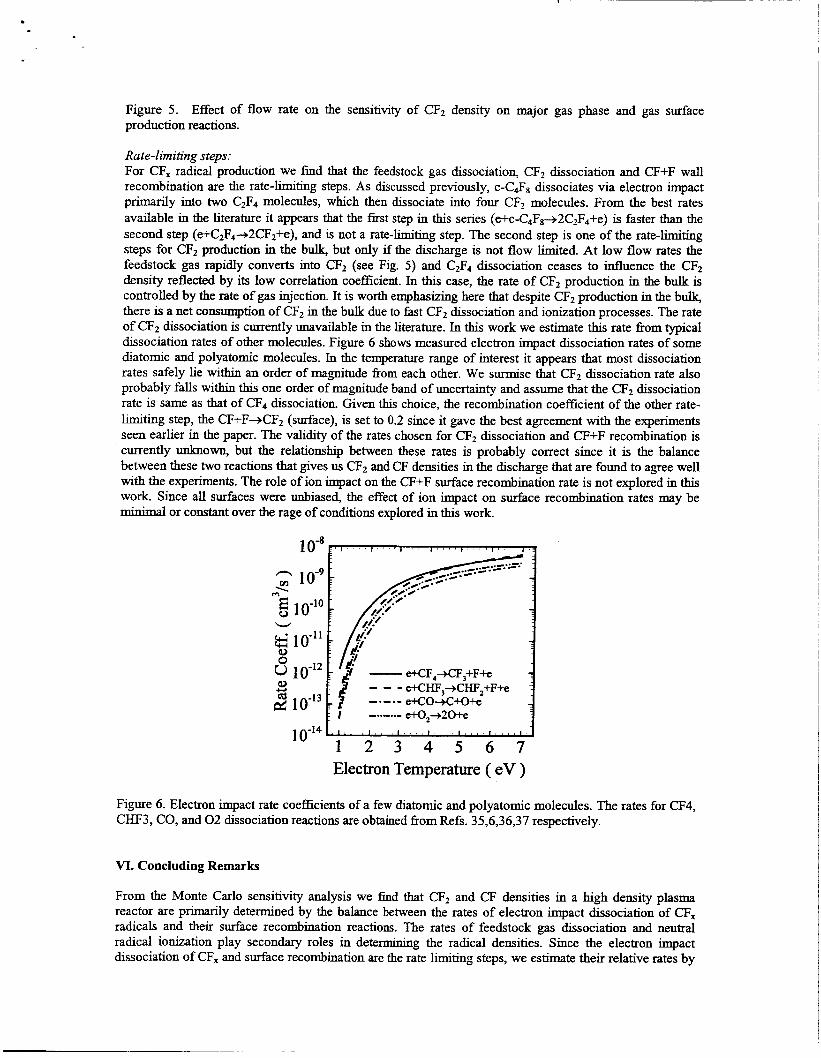
Rate-limiting steps: For CF, radxal production we find that the feedstock gas dissociation, CF2 dissociation and CF+F wall recombination are the rate-hiting steps. As discussed previously, c-cZ8 dissociates via electron impact primarily into two C2F4 molecules, which then dissociate into four CF2 molecules. From the best rates available in the literature it appears that the first step in this series ( e + ~ - C ~ ~ + 2 C ~ F 4 + e ) is faster than the second step (e+C2F4+2CF2+e), and is not a rate-limiting step. The second step is one of the rate-limiting steps for CF2 production in the bulk, but only if the discharge is not flow limited. At low flow rates the feedstock gas rapidly converts into CF, (see Fig. 5) and C2F4 dissociation ceases to influence the CF2 density reflected by its low correlation coefficient. In this case, the rate of CF2 production in the bulk is controlled by the rate of gas injection. It is worth emphasizing here that despite CF, production in the b a there is a net consumption of CF2 in the bulk due to fast CF2 dissociation and ionization processes. The rate of CF2 dissociation is currently unavailable in the literature. In this work we estimate &us rate fiom typical dissociation rates of other molecules. Figure 6 shows measured electron impact dissociation rates of some diatomic and polyatomic molecules. In the temperature range of interest it appears that most dissociation rates safely lie within an order of magnitude fiom each other. We surmise that CF2 dissociation rate also probably falls within this one order of magnitude band of uncertainty and assume that the CF2 dissociation rate is same as that of CF4 dissociation. Given t h ~ s choice, the recombination coefficient of the other rate- h t i n g step, the CF+F+CF2 (surface), is set to 0.2 since it gave the best agreement with the experiments seen earlier in the paper. The validity of the rates chosen for CF2 dissociation and CF+F recombination is currently unknown, but the relationship between these rates is probably correct since it is the balance between these two reactions that gives us CFZ and CF densities in the discharge that are found to agree well with the experiments. The role of ion impact on the CF+F surface recombination rate is not explored in this work. Since all surfaces were unbiased, the effect of ion impact on surface recombination rates may be minimal or constant over the rage of conditions explored in this work.
10-14 M 1 2 3 4 5 6 7 Electron Temperature ( eV )
Figure 6. Electron impact rate coefficients of a few diatomic and polyatomic molecules. The rates for CF4, -3, CO, and 0 2 dissociation reactions are obtained fiom Refs. 35,6,36,37 respectively.
VI. Concluding Remarks
From the Monte Carlo sensitivity analysis we find that CF, and CF densities in a high density plasma reactor are primarily determined by the balance between the rates of electron impact dissociation of CF, radicals and their surface recombination reactions. The rates of feedstock gas dissociation and neutral radical ionization play secondary roles in determining the radical densities. Since the electron impact dissociation of CF, and surface recombination are the rate limiting steps, we estimate their relative rates by
comparing the radical densities with the experimental data. Using the estimated rates and the rates obtained fiom the literature we are able to obtain excellent agreement with the radical density measurements of Waters" and Hebner." The surface recombination reactions for neutral radicals are also able to explain the hollow profiles of CF2 obtained by various author^.""^"^ The neutral chemistry model can be further refined if experimental measurements of spatial profiles of gas temperature and atomic species densities become available in the future.
Acknowledgments:
We thank Mark Kushner, David Graves, and Alan Garscadden for supplying their unpublished papers and reaction cross sections. We also acknowledge useful discussions with Helen Hwang, Peter Ventzek, and Brett Cruden during the course of this work. The work of D. Bose was supported under a prime contract NAS2-99092 to ELORET.
References
'G. S. Oehrlein, Y. Zhang, D. Vender, and M. Haverlag, J. Vac. Sci. Technol. A 12,323 (1994). 'L. G. Christophorou and J. K. Olthoff, J. Phys. Chem. Ref. Data. 30,449 (2001). 3L. G. Christophorou and J. K. Olthoff, J. Phys. Chem. Ref. Data. 28, 967 (1999). 4L. G. Christophorou, J. K. Olthoff, andM. V. V. S. Rao, J. Phys. Chem. Ref. Data. 25, 1341 (1996). 'V. Tamovsky and K. Becker, J. Chem. Phys. 98,7868 (1993). 6D. Bose, M. V. V. S. Rao, T. R. Govindan, and M. Meyyappan, Plasma Sources Sci. Technol. 12, 225 (2003). 'S. Rauf and P. L. G. Ventzek, , J. Vac. Sci. Technol. A 20,14 (2002). 'A. V. Vasenkov and M. J. Kushner, J. Appl. Phys. 95, 834 (2004). 'G. I. Font, W. L. Morgan, and G. Mennenga, J. Appl. Phys. 91,3530 (2002). 'OG. A. Hebner and I. C. Abraham, J. Appl. Phys. 90,4929 (2001). "G. A. Hebner, J. Appl. Phys. 89,900 (2001). "K. Waters, MS Thesis, University of New Mexico, 2000.
14C. Suzuki, K. Sasaki, and K. Kadota, J. Vac. Sci. Technol. A 16,2222 (1998). 15C. I. Butoi, N. M. Mackie, K. L. Williams, N. E. Capps, and E. R. Fisher, J. Vac. Sci. Technol. A 18, 2685 (2000). %. E. Capps, N. M. Maclue, and E. R. Fisher, J. Appl. Phys. 84,4763 (1998).
18G. Cunge and J. P. Booth, J. Appl. Phys. 85,3952 (1999).
M. Nakamura, M. Hori, T. Goto, M. Ito, and N. Ishii, J. Vac. Sci. Technol. A 19,2134 (2001). 13
1
17 J. P. Booth, G. Cunge, P. Chabert, and N. Sadeghi, J. Appl. Phys. 85,3097 (1999).
C. Q. Jiao, A. Garscadden, and P. D. Haaland, Chem. Phys. Lett. 297, 121 (1998). 19
Toyoda, M. Iio, and H. Sugai, Jpn. J. Appl. Phys. 36,3730 (1997). 'lP. Haaland and C. Q. Jiao, Air Force Research Laboratory Report, AFRL-PR-WP-TR-2001-2061. "C. W. Bauschlicher and A. Ricca, J. Phys. Chem. A 104,9026 (2000). 23S. H. Bauer and S. Javanovic, Int. J. Chem. Kinet. 30, 171 (1998).
"C. W. Bauschlicher and A. Ricca, J. Phys. Chem. A 104,4581 (2000).
J. Vac. Sci. Technol. A 17,2557 (1999).
J. M. Simmie, W. J. Quiring, andE. Tschuikow-Roux, J. Phys. Chem. 73,3830, (1969).
H. Hayashi, S. Morishita, T. Tatsumi, Y. Hikosaka, S. Noda, H. Nakagawa, S. Kobayashi, and M. Inoue,
M. T. Radtke, J. W. Coburn, and D. B. Graves, J. Vac. Sci. Technol. A 21,1038 (2003). S. M. Spyrou, S. R. Hunter, andL. G. Christophorou, J. Chem. Phys. 83,641 (1985). K. Teii, M: Hori, T. Goto, and N. Ishi, J. Appl. Phys. 87, 7185 (2000). E. Brook, M. F. A. Hamson, and A. C. H. Smith, J. Phys. B: At. Mol. Phys. 11,3115 (1978).
M. Meyyappan, and T. R. Govindan, NASA Ref. Pub. 1402 (1997). A. Saltelli, K. Chan, and E. M. Scott, Sensitivity Analysis, New York Wiley (2001). H. Abada, P. Chabert, J. P. Booth, J. Robiche, and G. Cartry, J. Appl. Phys. 92,4223 (2002). Mark Kushner, private communication.
24
26
27
28
29
30
31P. Ho, J. E. Johannes, and R. J. Buss, J. Vac. Sci. Technol. A 19,2344 (2001). 32
33
34
35
36P. C. Cosby, J. Chem. Phys. 98,7804 (1993).
P. C. Cosby, J. Chem. Phys. 98,9560 (1993). 37
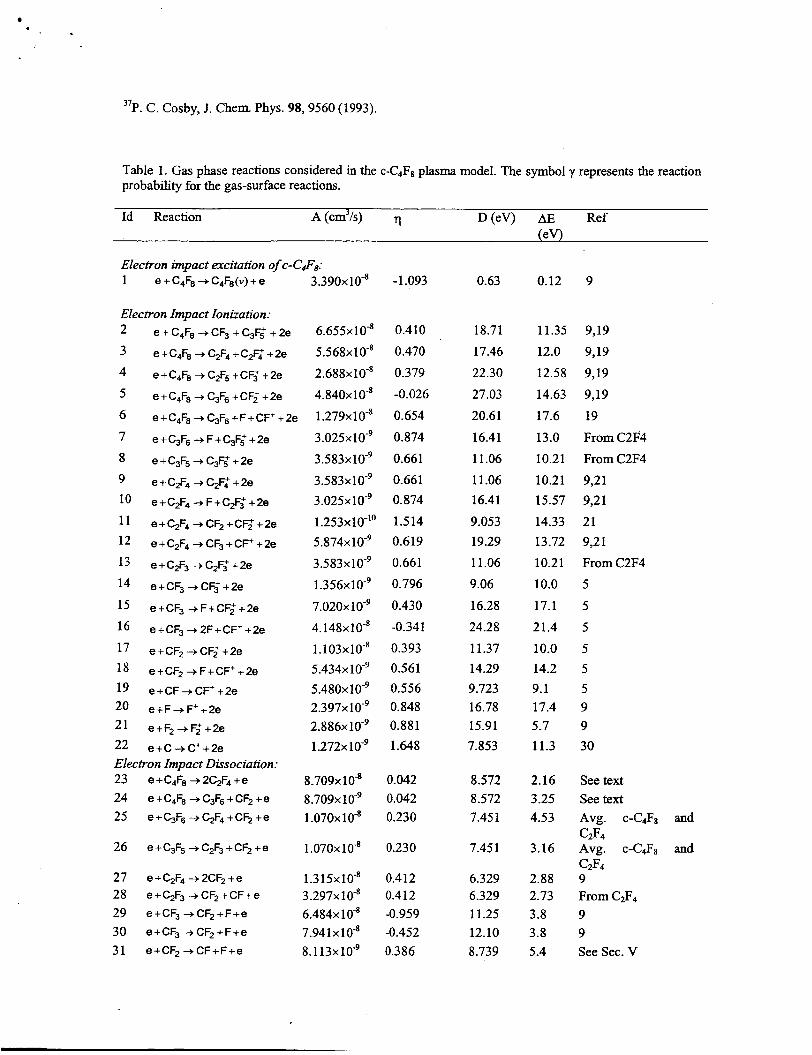
Table 1. Gas phase reactions considered in the c-C4F8 plasma model. The symbol y represents the reaction probability for the gas-surface reactions.
Id Reaction A (cm3/s) D(eV) AE Ref
Electron impact excitation of c-Cpa: 1 e + C4F8 -+ C4F8(v) + e 3.390~10“ -1.093
Electron Impact Ionization: 2 e + C4F8 -+ CF, + C,F,’ + 2e 6 . 6 5 5 ~ 1 0 ~ 0.410
3 e+C4F8 -+C2F4+C,G+2e 5.568~10-~ 0.470
4 e+C4F8 + C25 +CFZ +2e 2.688~10” 0.379
5 e+C,F8 +&F6+CF2++2e 4.840~10-~ -0.026 6 e+C4F, -+&F6+F+CF++2e 1.279~10-~ 0.654
7 e+C3F6-+F+&F,’+2e
8 e+C3F5+C3F,’+2e
9 e+C2F4 -+C2G+2e
10 e+C2F4 + F+C,G +2e
11 e+C2F4-+CF2+Ce+2e
12 e+C2F4 -+ CF, + CF+ +2e
13 e+C2F3+C,F~+2e
14 e+CF3 -+CF3++2e
15 e+CF, +F+CF2++2e
l 6 e+CF3 -+2F+CFf+2e
l7 e+CF, + CF; +2e
l8 e+CF2 + F+CF++2e
19 e+CF+CF++2e
20 e+F+F++2e
21 e+F2 -+ G + 2 e
22 e +C -+ C+ +2e Electron Impact Dissociation: 23 e+C4Fe+2Cg4+e
24 e+C4F8+&F6+CF2+e
25 e+&F6 -+C2F4+CF2+e
26 e+&F5 -+ C2F3 +CF2 +e
27 e+C2F4 -+2CF2+e 28 e+C,F3+CF2+CF+e
29 e+CF, -+ CF2 +F+e
30 e+CF3 -+CF2+F+e
31 e+CF,+CF+F+e
3.025xlO-’
3.5 83x 1 0-’ 3.583xlO-’ 3 .025~ 1 O-’ 1.253~10-‘~ 5.874~ 1 0-’ 3.5 83 x 1 O-’ 1.356xlO-’
7.020~10‘~
4 .148~ 1 0-’ 1.103~ lo-’ 5 .434~ 5.480~10‘~ 2 .397~ lo-’ 2.886x10-’ 1 .272~ lo-’
0.874
0.661
0.661 0.874
1.5 14 0.619
0.661
0.796
0.430
-0.341
0.393 0.561 0.556 0.848 0.881 1.648
8 . 7 0 9 ~ 1 0 ~ 0.042 8.709~10‘~ 0.042 1.070~ 0.230
1.070~10-~ 0.230
1.3 15x lo-’ 0.412 3.297~10-~ 0.412 6.484~10‘~ -0.959 7.941~10-~ -0.452 8.113x10-’ 0.386
0.63
18.71
17.46
22.30
27.03
20.6 1
16.41
11.06
1 1.06 16.4 1
9.053 19.29
11.06
9.06
16.28
24.28
11.37 14.29 9.723 16.78 15.91 7.853
8.572 8.572 7.45 1
7.45 1
6.329 6.329 1 1.25 12.10 8.739
0.12 9
11.35
12.0
12.58
14.63
17.6
13.0
10.21
10.21 15.57
14.33 13.72
10.21
10.0
17.1
21.4
10.0 14.2 9.1 17.4 5.7 11.3
2.16 3.25 4.53
3.16
2.88 2.73 3.8 3.8 5.4
9,19
9,19
9,19
9,19
19
From C2F4
From C2F4
9,2 1 9,21
21 9,2 1
From C2F4
5
5 5 5 5 5 9 9 30
See text See text Avg. C-CqFg and c2F4 Avg. c - C ~ F ~ and c2F4 9 From C2F4 9 9 See Sec. V

32 e+CF2 -+Ct2F+e
33 e+CF+C+F+e 34 e+F2+2F+e
Dissociative Attachment: 35 e+C4F, +&F6+CF+F-
36 e+CF3 -+CF2+F-
37 e+CF2 +CF+F-
38 e+CF+C+F-
39 e+F2 + F+F-
Ion-Molecule Reaction: 40 C4FB + CFZ + C2F4 + F + C3Fl
41 CF,+CF,I+CF2+CF2
42 CF+CF; -+C+CF3f
43 C+CF; +CF+CF+ 44
45
46 CF+C++C+CF+ 47
48 49
CF, + CF+ -+ CF+CF3f
CF3 + C+ -+ CF + CF;
CF3 + F+ + F2 + CF;
CF2 + F+ + F2 + CF+
CF + F+ + F2 + C+
50 c+F++F+c+
Ion-Ion Recombination: 51 C2F2+F-+CF2+CF+F2
52 C3F; + F- -+ C2F4 + CF,
53 CF; + F- -+ CF2 + F2
54 CF; + F- + CF +F2
55 CF++F--+CF+F
56 C++F-+C+F
57 F++F-+F+F 58 F; +F- + F2 +F
Detachment: 59 e+F--+F+2e
Electronic Excitation: 60 e+C-+C('D)+e
61 e+C-+C('S)+e
62 e+F+F(4P)+e
63 e+F-+F(2P)+e
Su$ace Recombination: 64 C+F+CF
65 CF+F+CF?
1.390~10-~ 1.634~ 1 0-8 1.080~10-~
2.789~10-~
3.000~ IO-" 3 .000~ lo-" 3 .000~ lo-" 5 .768~10-~
2.1 oox lo-'' 1 .480~ 1 0-9
2.060~ 1 0-9
1.040~10-~ 1.7 1 Ox 1 0-9
2.480~ 1 0-9
3.180~ 1 0-9 2.090~10-~
2.280~ 2.7 lox 1.170~
8.200~ lo8 8 .ooox 1 o-8
9.1 oox 1 o-8
1.200~10-~ 1.100~
8.700~ 1 0-8
9.800~10-~
9.400~10-~
1.6 153 x lo-'
4.3 57x 1 0-8
6 .199~ 3.544~1 0-9
3.6 1 8x 1 0-9
-1.164 -0.002 -0.296
-1.277
0.0 0.0 0.0 -1.465
0.0 0.0 0.0 0.0 0.0
0.0
0.0 0.0
0.0 0.0 0.0
0.0 0.0
0.0 0.0 0.0 0.0 0.0 0.0
-0.436
-0.504 -0.504 -0.650 -0.053
Recomb. Coeff. 2yl(2-y)=0.2 Recomb. Coeff. 2yl(2-y)=0.2
49.87 13.05 4.464
5.392
0.0
0.0 0.0 0.539
0.0
0.0
0.0
0.0 0.0
0.0
0.0 0.0
0.0 0.0 0.0
0.0 0.0
0.0
0.0 0.0 0.0 0.0 0.0
12.87
2.12 3.59 14.33 13.83
11.0 5.6 1.71
0.0
0.0
0.0 0.0 0.0
0.0
0.0
0.0
0.0 0.0
0.0
0.0 0.0
0.0 0.0 0.0
0.0 0.0 0.0 0.0 0.0 0.0 0.0 0.0
3 .O
1.264 2.68 12.70 12.99
6 6, From CO 9
9 See text
See text See text 9
9
9
9
9 9
9
9 9
9 9 9
9 9
9
9 9 9 9 9
6
31 31 31 31
See Sec. V See Sec. V