montana comprehensive assessment system … files/statewide testing/crt...montana comprehensive...
TRANSCRIPT
Montana Comprehensive Assessment System
Criterion-Referenced Test Alternate Assessment
(CRT-Alternate)
2015–16 Technical Report
100 EDUCATION WAY, DOVER, NH 03820 (800) 431-8901 WWW.MEASUREDPROGRESS.ORG

TABLE OF CONTENTS CHAPTER 1 OVERVIEW ............................................................................................................................1
1.1 OVERVIEW AND PURPOSE OF THE ASSESSMENT SYSTEM ......................................................................1
1.2 PURPOSE OF THIS REPORT ..................................................................................................................2
1.3 CURRENT YEAR UPDATES ...................................................................................................................2
CHAPTER 2 THE STUDENTS ....................................................................................................................3
2.1 IDENTIFICATION OF STUDENTS FOR PARTICIPATION ...............................................................................3
2.2 SUMMARY OF PARTICIPATION RATES ....................................................................................................3
CHAPTER 3 TEST CONTENT ....................................................................................................................5
3.1 ASSESSMENT DESIGN ..........................................................................................................................5
3.1.1 CRT-Alternate Items ..................................................................................................................6
3.2 SCAFFOLDING AS SCORING ..................................................................................................................7
3.3 BLUEPRINTS ........................................................................................................................................8
3.3.1 Science Assessment Blueprint ..................................................................................................8
CHAPTER 4 TEST DEVELOPMENT ....................................................................................................... 10
4.1 ITEM AND ACTIVITY DEVELOPMENT .................................................................................................... 10
4.2 DEVELOPMENT OF THE SCIENCE EXPANDED BENCHMARKS ................................................................ 10
4.3 LAYOUT OF EVIDENCE FORMS AND ITEMS .......................................................................................... 13
CHAPTER 5 ADMINISTRATION AND TRAINING .................................................................................. 15
5.1 ADMINISTRATION GUIDELINES ........................................................................................................... 15
5.2 PROCEDURES .................................................................................................................................. 15
5.3 PROFESSIONAL DEVELOPMENT AND TRAINING PROGRAMS ................................................................. 16
CHAPTER 6 SCORING............................................................................................................................ 18
6.1 SCORING THE ASSESSMENT .............................................................................................................. 18
6.2 USING SCAFFOLDING TO GATHER STUDENT PERFORMANCE INFORMATION ......................................... 18
6.3 SCORING RUBRIC ............................................................................................................................. 20
6.4 SCORING RULES .............................................................................................................................. 20
CHAPTER 7 CLASSICAL ITEM ANALYSIS ............................................................................................ 21
7.1 ITEM DIFFICULTY AND DISCRIMINATION .............................................................................................. 21
7.2 BIAS/FAIRNESS ................................................................................................................................ 23
CHAPTER 8 CHARACTERIZING ERRORS ASSOCIATED WITH TEST SCORES............................... 25
8.1 RELIABILITY ...................................................................................................................................... 25
8.2 DECISION ACCURACY AND CONSISTENCY .......................................................................................... 27
8.3 GENERALIZABILITY ............................................................................................................................ 29
CHAPTER 9 COMPARABILITY ............................................................................................................... 30
9.1 COMPARABILITY OF SCORES ACROSS YEARS .................................................................................... 30
9.2 LINKAGES ACROSS GRADES ............................................................................................................. 30
Table of Contents i 2015–16 Montana CRT-Alternate Technical Report
CHAPTER 10 REPORTING ....................................................................................................................... 31
10.1 SUMMARY REPORT ........................................................................................................................... 31
10.1.1 Distribution of Scores .............................................................................................................. 32 10.1.2 Subtest Results ....................................................................................................................... 32 10.1.3 Results for Subgroups of Students .......................................................................................... 32
10.2 ROSTER AND ITEM-LEVEL REPORT .................................................................................................... 33
10.3 DECISION RULES .............................................................................................................................. 33
10.4 QUALITY ASSURANCE ........................................................................................................................ 34
CHAPTER 11 VALIDITY ............................................................................................................................. 36
11.1 EVIDENCE BASED ON TEST DEVELOPMENT AND STRUCTURE .............................................................. 36
11.2 OTHER EVIDENCE ............................................................................................................................. 37
11.3 FUTURE DIRECTIONS......................................................................................................................... 37
REFERENCES .................................................................................................................................................. 38
APPENDICES ................................................................................................................................................... 39
APPENDIX A TECHNICAL ADVISORY COMMITTEE MEMBERS
APPENDIX B PARTICIPATION SUMMARY BY DEMOGRAPHIC CATEGORY
APPENDIX C SAMPLE TASKLET
APPENDIX D INTERRATER RELIABILITY REPORT
APPENDIX E RELEASED PERFORMANCE LEVEL INDICATORS
APPENDIX F ITEM-LEVEL CLASSICAL STATISTICS
APPENDIX G ITEM-LEVEL SCORE DISTRIBUTIONS
APPENDIX H DIFFERENTIAL ITEM FUNCTIONING RESULTS
APPENDIX I SUBGROUP RELIABILITIES
APPENDIX J REPORTING CATEGORY RELIABILITIES
APPENDIX K DECISION ACCURACY AND CONSISTENCY RESULTS
APPENDIX L SCALED SCORE CUMULATIVE DISTRIBUTIONS
APPENDIX M PERFORMANCE LEVEL DISTRIBUTIONS
APPENDIX N PERFORMANCE LEVEL DESCRIPTORS
APPENDIX O DECISION RULES
APPENDIX P REPORT SHELLS
Table of Contents ii 2015–16 Montana CRT-Alternate Technical Report
CHAPTER 1 OVERVIEW
1.1 OVERVIEW AND PURPOSE OF THE ASSESSMENT SYSTEM
The Montana Criterion-Referenced Test (CRT) was developed in accordance with the following
federal laws: Title 1 of the Elementary and Secondary Education Act (ESEA) of 1994, P. L. 103–382, and the
No Child Left Behind Act (NCLB) of 2001.
Montana grade and content CRT instruments are based on and aligned to Montana’s content
standards, benchmarks, and grade-level expectations in reading, mathematics, and science. Montana educators
worked with the Montana Office of Public Instruction (OPI) and Measured Progress to develop test items that
assess how well students have met Montana grade-level expectations for each content area. In addition,
Northwest Regional Educational Laboratory (NWREL) performed an independent alignment study for
reading and mathematics in 2006, and for science in 2007. NWREL’s alignment studies can be found on the
OPI’s Web site at opi.mt.gov/curriculum/MontCAS/. Montana CRT scores are intended to be useful
indicators of the extent to which students have mastered material outlined in Montana reading, mathematics,
and science content standards, benchmarks, and grade-level expectations. Each student’s Montana CRT score
should be used as part of a body of evidence regarding mastery and should not be used in isolation to make
high-stakes decisions. Montana CRT scores are more reliable indicators of program success when aggregated
to school, system, or state levels, particularly when monitored over the course of several years.
The primary purpose of the Montana Comprehensive Assessment System Criterion-Referenced Test-
Alternate Assessment (CRT-Alternate) is to measure student achievement against alternate standards. The
Individuals with Disabilities Education Act (IDEA) requires that students with disabilities be included in each
state’s system of accountability and that students with disabilities have access to the general curriculum.
NCLB speaks to the inclusion of all children in a state’s accountability system by requiring states to report
student achievement for all students, as well as for groups of students on a disaggregated basis. These federal
laws reflect an ongoing concern about equity: all students should be academically challenged and taught to
high standards, and all students must be involved in the educational accountability system.
To ensure the participation of all students in the state’s accountability system, Montana has developed
the CRT-Alternate. The CRT-Alternate is a point-in-time, direct measure of a student’s performance based on
alternate achievement standards aligned with Montana’s Content Standards and Expanded Benchmarks. Only
those IDEA-eligible students with the most significant cognitive disabilities are expected to participate in the
CRT-Alternate.
Chapter 1—Overview 1 2015–16 Montana CRT-Alternate Technical Report
1.2 PURPOSE OF THIS REPORT
The purpose of this report is to document the technical aspects of the 2016 CRT-Alternate. In the
spring of 2016, students in grades 4, 8, and 10 participated in the administration of the CRT-Alternate in
science (CRT-Alternate Science).
Historically, the intended audience of a technical report has been experts in psychometrics and
educational research. This edition of the CRT-Alternate technical report is intended to be more accessible and
useful to educators and other stakeholders by providing rich descriptions of general categories of information.
In making some of the information more accessible, we have purposefully preserved the depth of technical
information provided in our past technical reports. Some of the discussion and tables require the reader to
have a working knowledge of measurement concepts such as “reliability” and “validity” and statistical
concepts such as “correlation” and “central tendency.” To fully understand some data, the reader must also be
familiar with advanced topics in measurement and statistics.
1.3 CURRENT YEAR UPDATES
The 2016 CRT-Alternate assessment had few changes from the previous year’s administration. For
2016, students were assessed only in science using the CRT-Alternate.
Chapter 1—Overview 2 2015–16 Montana CRT-Alternate Technical Report
CHAPTER 2 THE STUDENTS
2.1 IDENTIFICATION OF STUDENTS FOR PARTICIPATION
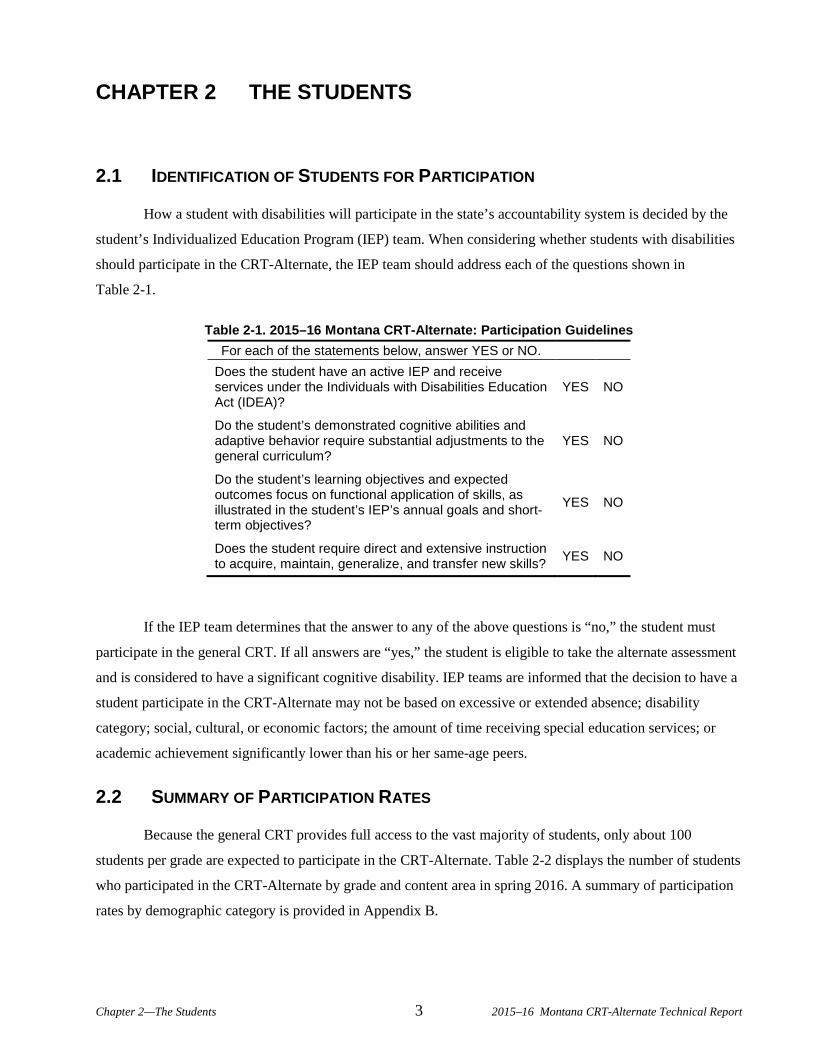
How a student with disabilities will participate in the state’s accountability system is decided by the
student’s Individualized Education Program (IEP) team. When considering whether students with disabilities
should participate in the CRT-Alternate, the IEP team should address each of the questions shown in
Table 2-1.
Table 2-1. 2015–16 Montana CRT-Alternate: Participation Guidelines For each of the statements below, answer YES or NO.
Does the student have an active IEP and receive services under the Individuals with Disabilities Education Act (IDEA)?
YES NO
Do the student’s demonstrated cognitive abilities and adaptive behavior require substantial adjustments to the general curriculum?
YES NO
Do the student’s learning objectives and expected outcomes focus on functional application of skills, as illustrated in the student’s IEP’s annual goals and short-term objectives?
YES NO
Does the student require direct and extensive instruction to acquire, maintain, generalize, and transfer new skills? YES NO
If the IEP team determines that the answer to any of the above questions is “no,” the student must
participate in the general CRT. If all answers are “yes,” the student is eligible to take the alternate assessment
and is considered to have a significant cognitive disability. IEP teams are informed that the decision to have a
student participate in the CRT-Alternate may not be based on excessive or extended absence; disability
category; social, cultural, or economic factors; the amount of time receiving special education services; or
academic achievement significantly lower than his or her same-age peers.
2.2 SUMMARY OF PARTICIPATION RATES
Because the general CRT provides full access to the vast majority of students, only about 100
students per grade are expected to participate in the CRT-Alternate. Table 2-2 displays the number of students
who participated in the CRT-Alternate by grade and content area in spring 2016. A summary of participation
rates by demographic category is provided in Appendix B.
Chapter 2—The Students 3 2015–16 Montana CRT-Alternate Technical Report
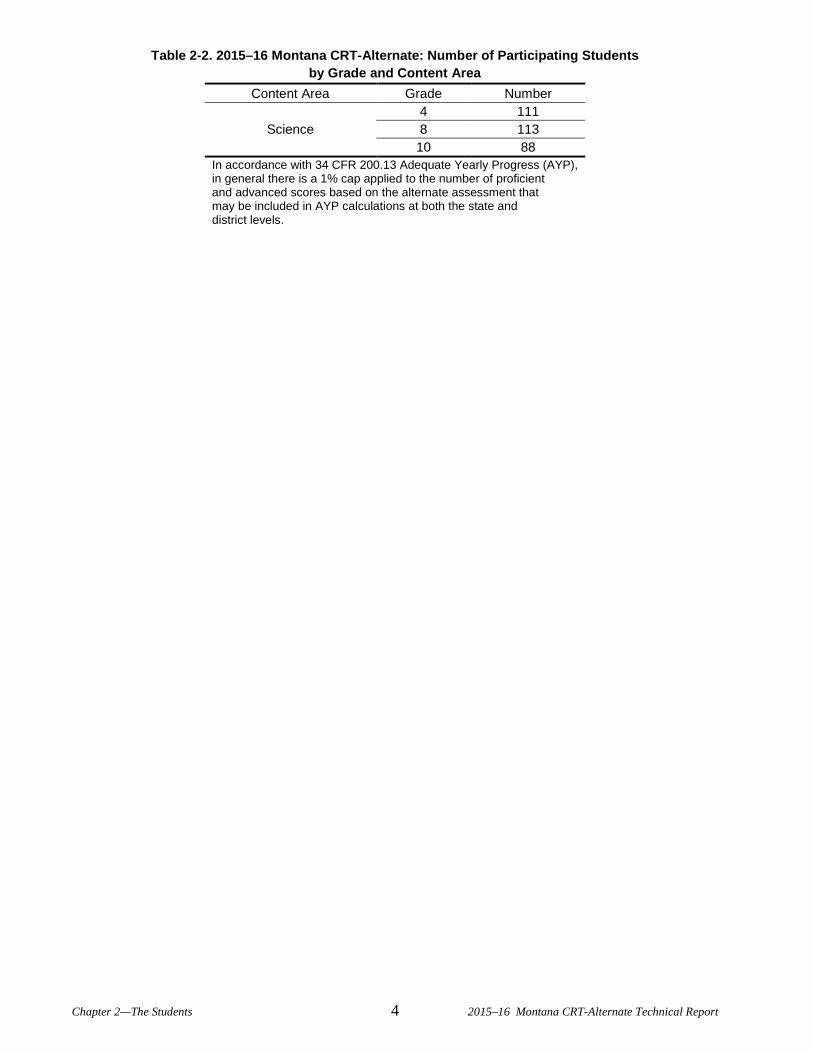
Table 2-2. 2015–16 Montana CRT-Alternate: Number of Participating Students by Grade and Content Area
Content Area Grade Number
Science 4 111 8 113 10 88
In accordance with 34 CFR 200.13 Adequate Yearly Progress (AYP), in general there is a 1% cap applied to the number of proficient and advanced scores based on the alternate assessment that may be included in AYP calculations at both the state and district levels.
Chapter 2—The Students 4 2015–16 Montana CRT-Alternate Technical Report
CHAPTER 3 TEST CONTENT
3.1 ASSESSMENT DESIGN
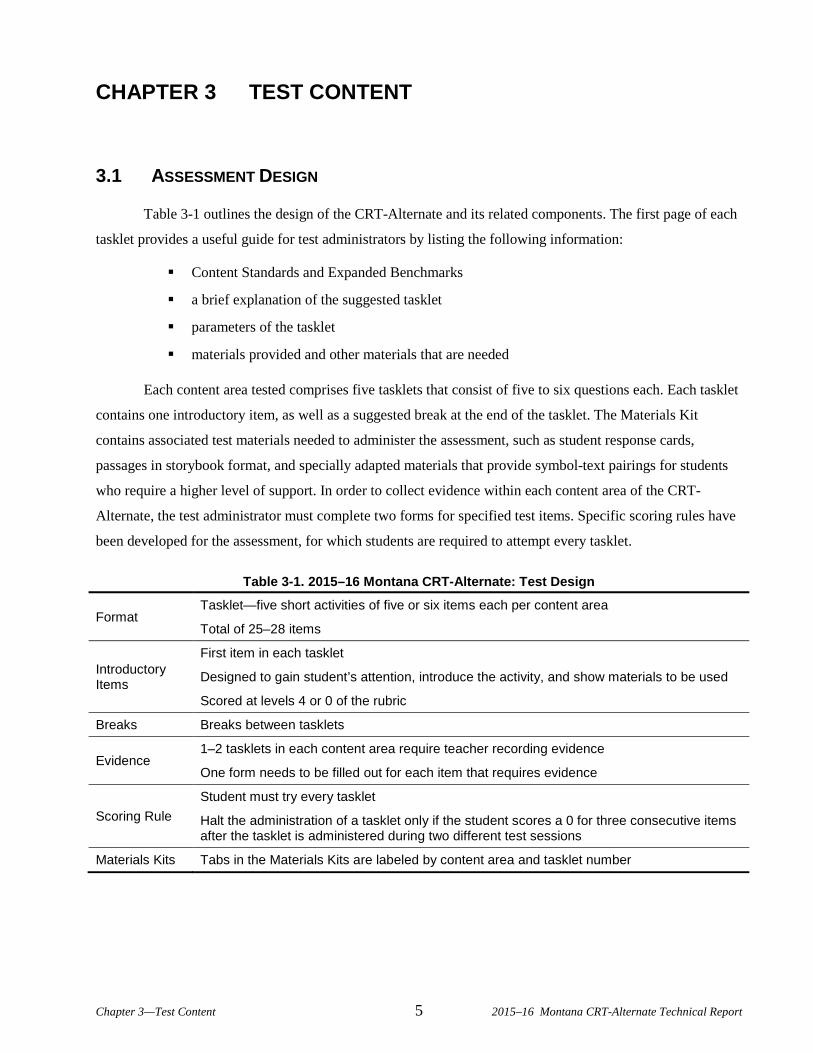
Table 3-1 outlines the design of the CRT-Alternate and its related components. The first page of each
tasklet provides a useful guide for test administrators by listing the following information:
Content Standards and Expanded Benchmarks
a brief explanation of the suggested tasklet
parameters of the tasklet
materials provided and other materials that are needed
Each content area tested comprises five tasklets that consist of five to six questions each. Each tasklet
contains one introductory item, as well as a suggested break at the end of the tasklet. The Materials Kit
contains associated test materials needed to administer the assessment, such as student response cards,
passages in storybook format, and specially adapted materials that provide symbol-text pairings for students
who require a higher level of support. In order to collect evidence within each content area of the CRT-
Alternate, the test administrator must complete two forms for specified test items. Specific scoring rules have
been developed for the assessment, for which students are required to attempt every tasklet.
Table 3-1. 2015–16 Montana CRT-Alternate: Test Design
Format Tasklet—five short activities of five or six items each per content area
Total of 25–28 items
Introductory Items
First item in each tasklet
Designed to gain student’s attention, introduce the activity, and show materials to be used
Scored at levels 4 or 0 of the rubric
Breaks Breaks between tasklets
Evidence 1–2 tasklets in each content area require teacher recording evidence
One form needs to be filled out for each item that requires evidence
Scoring Rule Student must try every tasklet
Halt the administration of a tasklet only if the student scores a 0 for three consecutive items after the tasklet is administered during two different test sessions
Materials Kits Tabs in the Materials Kits are labeled by content area and tasklet number
Chapter 3—Test Content 5 2015–16 Montana CRT-Alternate Technical Report
3.1.1 CRT-Alternate Items
Each item of the CRT-Alternate consists of the following:
materials needed to administer the item
communication support strategies the teacher may use to administer the item
setup instructions and script for the teacher to follow
scaffolding script for the suggested test activity
the correct student response
the performance indicator (a description of what the question is measuring derived from the Montana Content Standards and Expanded Benchmarks)
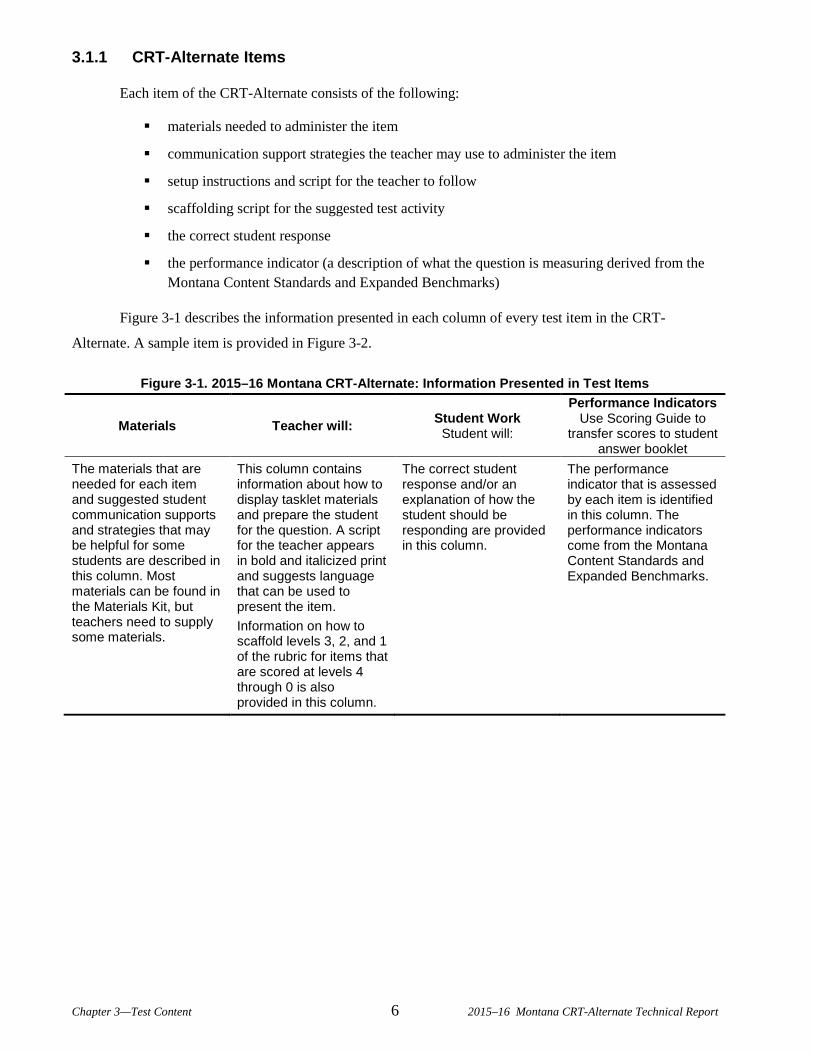
Figure 3-1 describes the information presented in each column of every test item in the CRT-
Alternate. A sample item is provided in Figure 3-2.
Figure 3-1. 2015–16 Montana CRT-Alternate: Information Presented in Test Items
Materials Teacher will: Student Work Student will:
Performance Indicators Use Scoring Guide to
transfer scores to student answer booklet
The materials that are needed for each item and suggested student communication supports and strategies that may be helpful for some students are described in this column. Most materials can be found in the Materials Kit, but teachers need to supply some materials.
This column contains information about how to display tasklet materials and prepare the student for the question. A script for the teacher appears in bold and italicized print and suggests language that can be used to present the item. Information on how to scaffold levels 3, 2, and 1 of the rubric for items that are scored at levels 4 through 0 is also provided in this column.
The correct student response and/or an explanation of how the student should be responding are provided in this column.
The performance indicator that is assessed by each item is identified in this column. The performance indicators come from the Montana Content Standards and Expanded Benchmarks.
Chapter 3—Test Content 6 2015–16 Montana CRT-Alternate Technical Report
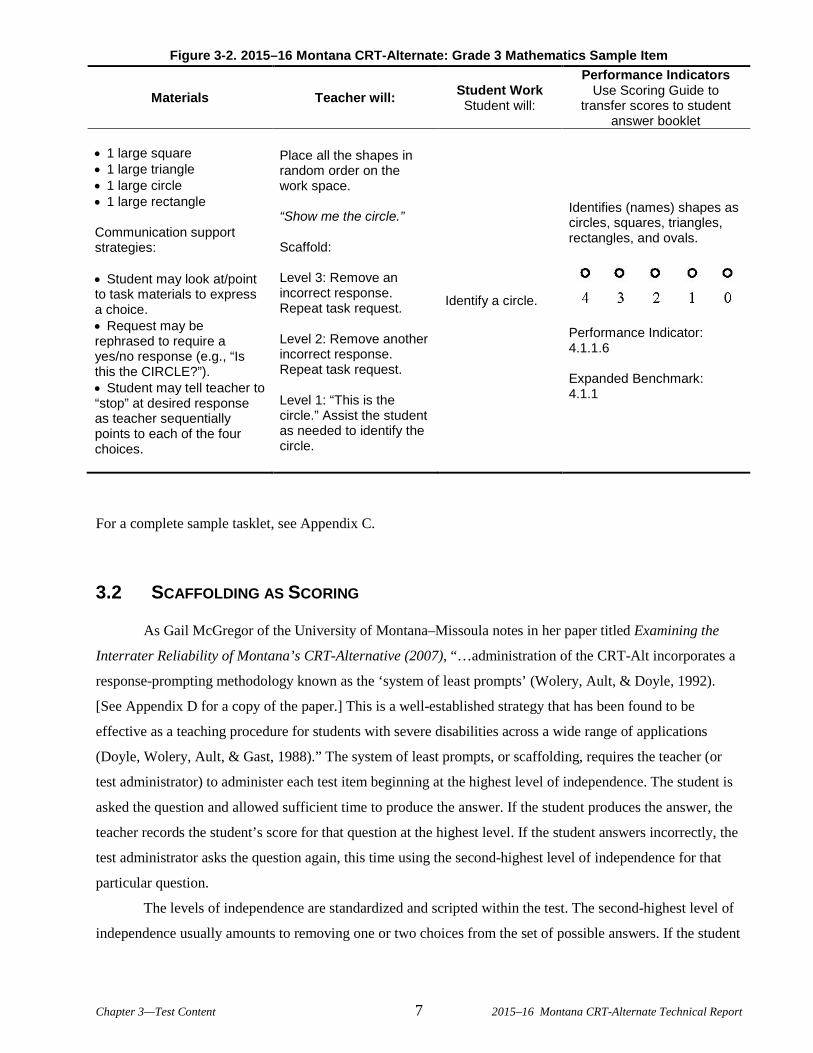
Figure 3-2. 2015–16 Montana CRT-Alternate: Grade 3 Mathematics Sample Item
Materials Teacher will: Student Work Student will:
Performance Indicators Use Scoring Guide to
transfer scores to student answer booklet
• 1 large square • 1 large triangle • 1 large circle • 1 large rectangle Communication support strategies: • Student may look at/point to task materials to express a choice. • Request may be rephrased to require a yes/no response (e.g., “Is this the CIRCLE?”). • Student may tell teacher to “stop” at desired response as teacher sequentially points to each of the four choices.
Place all the shapes in random order on the work space. “Show me the circle.” Scaffold: Level 3: Remove an incorrect response. Repeat task request. Level 2: Remove another incorrect response. Repeat task request. Level 1: “This is the circle.” Assist the student as needed to identify the circle.
Identify a circle.
Identifies (names) shapes as circles, squares, triangles, rectangles, and ovals.
Performance Indicator: 4.1.1.6 Expanded Benchmark: 4.1.1
For a complete sample tasklet, see Appendix C.
3.2 SCAFFOLDING AS SCORING
As Gail McGregor of the University of Montana–Missoula notes in her paper titled Examining the
Interrater Reliability of Montana’s CRT-Alternative (2007), “…administration of the CRT-Alt incorporates a
response-prompting methodology known as the ‘system of least prompts’ (Wolery, Ault, & Doyle, 1992).
[See Appendix D for a copy of the paper.] This is a well-established strategy that has been found to be
effective as a teaching procedure for students with severe disabilities across a wide range of applications
(Doyle, Wolery, Ault, & Gast, 1988).” The system of least prompts, or scaffolding, requires the teacher (or
test administrator) to administer each test item beginning at the highest level of independence. The student is
asked the question and allowed sufficient time to produce the answer. If the student produces the answer, the
teacher records the student’s score for that question at the highest level. If the student answers incorrectly, the
test administrator asks the question again, this time using the second-highest level of independence for that
particular question.
The levels of independence are standardized and scripted within the test. The second-highest level of
independence usually amounts to removing one or two choices from the set of possible answers. If the student
Chapter 3—Test Content 7 2015–16 Montana CRT-Alternate Technical Report
provides the correct answer, the test administrator will record the score at the second-highest level of
independence. If the student cannot provide the correct answer, the test administrator moves on to the next-
highest level of independence, and so on, until the student is guided (hand-over-hand) to the correct answer,
and the student’s score for that particular item is recorded at the lowest level of independence. More
information regarding the research base of this method and a discussion regarding the selection of this method
can be found in Appendix D: Interrater Reliability Report.
3.3 BLUEPRINTS
3.3.1 Science Assessment Blueprint
The science framework was based on Montana’s science Content Standards and Expanded
Benchmarks, which identify six content standards, as shown below:
Science Standard 1: Students design, conduct, evaluate, and communicate processes and results of scientific investigations, and demonstrate the thinking skills associated with this procedural knowledge.
Science Standard 2: Students demonstrate knowledge of properties, forms, changes, and interactions of physical and chemical systems, and demonstrate the thinking skills associated with this knowledge.
Science Standard 3: Students demonstrate knowledge of characteristics, structures, and function of living things, the process and diversity of life, and how living organisms interact with each other and their environments, and demonstrate the thinking skills associated with this knowledge.
Science Standard 4: Students demonstrate knowledge of the composition, structures, processes, and interactions of Earth’s systems and other objects in space, and demonstrate the thinking skills associated with this knowledge.
Science Standard 5: Students understand how scientific knowledge and technological developments impact today’s societies and cultures.
Science Standard 6: Students understand historical developments in science and technology.
The science test blueprint for the CRT-Alternate was created to mirror the same level of emphasis on
concepts across all grades that are represented in the general CRT. The CRT-Alternate is designed so that
students with significant cognitive disabilities are working on similar concepts and skills as the general
education students who participate in the CRT, but those concepts and skills have been expanded toward the
foundational level. Table 3-2 shows the standards measured at each grade level. For a complete list of
performance-level indicators for science test items (and the correlating standards assessed through each item),
see Appendix E.
Chapter 3—Test Content 8 2015–16 Montana CRT-Alternate Technical Report
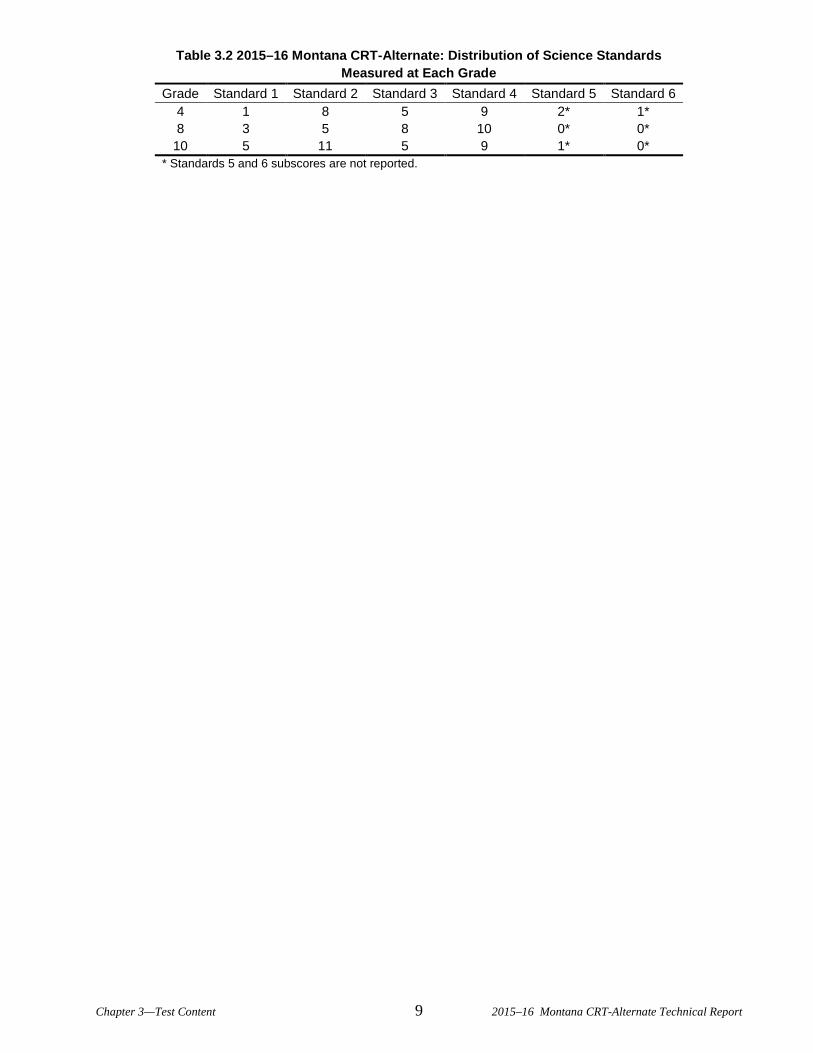
Table 3.2 2015–16 Montana CRT-Alternate: Distribution of Science Standards Measured at Each Grade
Grade Standard 1 Standard 2 Standard 3 Standard 4 Standard 5 Standard 6 4 1 8 5 9 2* 1* 8 3 5 8 10 0* 0*
10 5 11 5 9 1* 0* * Standards 5 and 6 subscores are not reported.
Chapter 3—Test Content 9 2015–16 Montana CRT-Alternate Technical Report
CHAPTER 4 TEST DEVELOPMENT
4.1 ITEM AND ACTIVITY DEVELOPMENT
Designing the test around a series of short activities, or “tasklets,” allows the teacher and student to
break the administration into smaller time segments with less concern about disruption in continuity. All
content areas and grades now use the tasklet model. This consistency across every grade and content area
provides ease and fluidity for test administration. Teachers are given a script, written directions, and
scaffolding levels for each test item within the tasklets. (See Section 3.2 for more information on scaffolding.)
The tasklets are developed from the expanded benchmarks, follow the scaffolding rubric, and are
designed to show a student’s performance in relation to the Montana science standards and benchmarks.
Students are encouraged to engage in the tasklet and show performance on the items through appropriate
prompting by the test administrator. The teacher who administers the tasklet scores the student on each item
through observation using a five-point scoring rubric. Every student takes the same form of the test. Test
items are kept secure, but the performance indicators, which come from the Montana science Content
Standards and Expanded Benchmarks, are released every year on the OPI and Measured Progress Web sites.
4.2 DEVELOPMENT OF THE SCIENCE EXPANDED BENCHMARKS
Alternate assessments, ranging from checklists to portfolios and performance-based tests, have been
in place nationally since 2000 due to federal requirements. The 2015–16 administration of the CRT-Alternate
was the 11th year of implementation. After the first year, extensive revisions were made based on feedback
from teachers who administered these assessments. Montana educators worked with the OPI and Measured
Progress in the development and review (content and bias) of these tests to assess how well students have
learned the Montana Content Standards and Expanded Benchmarks for their grade span. The underlying
principle of the assessment is that all students should be taught using Montana’s Content Standards and
Expanded Benchmarks in science. The tests are intended to measure how a student is performing in relation to
those content standards. Results should be used to inform future instruction in the Montana content standards.
Expanded benchmarks were developed for students with significant cognitive disabilities who are not
working at the same level as their age-level counterparts. The benchmarks correspond to the standards for (a)
end of grade 4, (b) end of grade 8, and (c) upon graduation—end of grade 12. Expansion is toward
foundational skills and is keyed to grade-span rather than grade-level expectations, due to the wide diversity
of students in this population.
Chapter 4—Test Development 10 2015–16 Montana CRT-Alternate Technical Report

The expanded benchmarks were developed using Montana’s Content Standards and Benchmarks for
science. Curriculum and special education specialists from Measured Progress, the OPI’s contractor,
developed a draft of the expanded benchmarks. The OPI, beta test teachers, advisory committee, and
development and revision workshop participants all provided input and recommendations for changes to the
original draft. Measured Progress revised the expanded benchmarks using these recommendations, and the
document was further revised to include grade-span expectations in accordance with new federal legislation.
This document was then used as the basis for developing the assessment performance indicators. Table 4-1
shows how the document is organized and gives an example. The full Montana Content Standards and
Expanded Benchmarks for the content areas are not included in this report because of their length. They are
located on the OPI Web site at www.opi.mt.gov and the Measured Progress Web site
at www.measuredprogress.org.
Chapter 4—Test Development 11 2015–16 Montana CRT-Alternate Technical Report
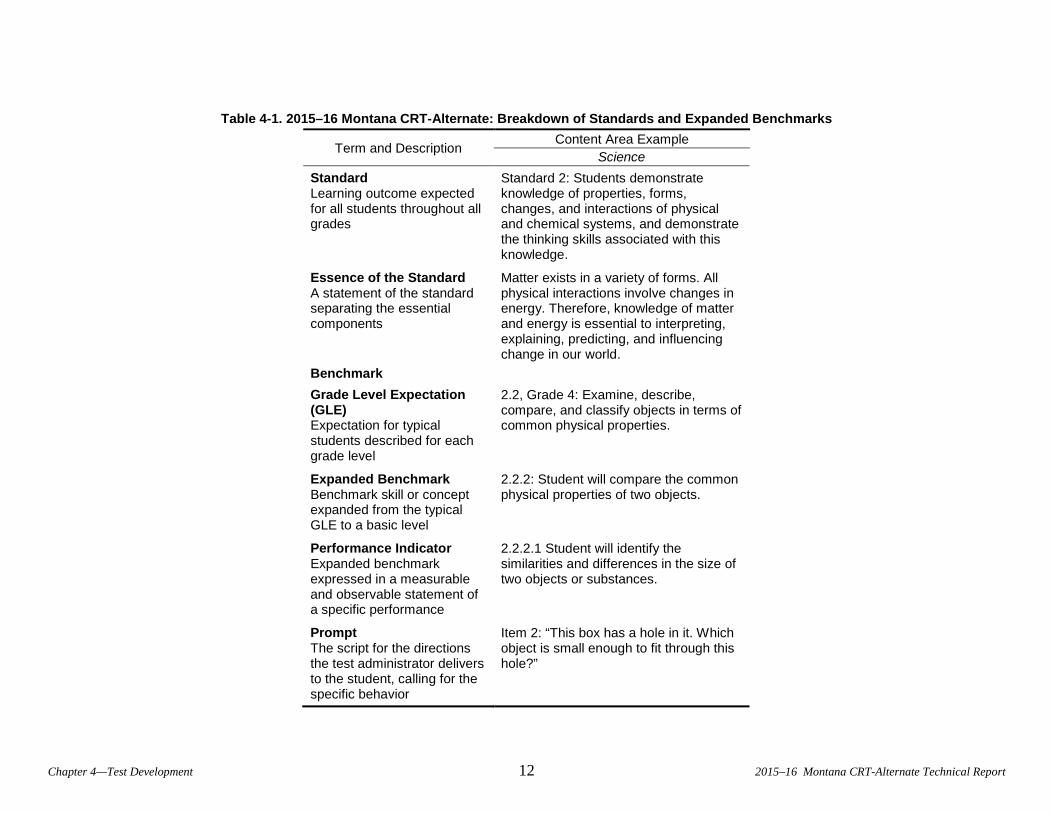
Table 4-1. 2015–16 Montana CRT-Alternate: Breakdown of Standards and Expanded Benchmarks
Term and Description Content Area Example
Science Standard Learning outcome expected for all students throughout all grades
Standard 2: Students demonstrate knowledge of properties, forms, changes, and interactions of physical and chemical systems, and demonstrate the thinking skills associated with this knowledge.
Essence of the Standard A statement of the standard separating the essential components
Matter exists in a variety of forms. All physical interactions involve changes in energy. Therefore, knowledge of matter and energy is essential to interpreting, explaining, predicting, and influencing change in our world.
Benchmark Grade Level Expectation (GLE) Expectation for typical students described for each grade level
2.2, Grade 4: Examine, describe, compare, and classify objects in terms of common physical properties.
Expanded Benchmark Benchmark skill or concept expanded from the typical GLE to a basic level
2.2.2: Student will compare the common physical properties of two objects.
Performance Indicator Expanded benchmark expressed in a measurable and observable statement of a specific performance
2.2.2.1 Student will identify the similarities and differences in the size of two objects or substances.
Prompt The script for the directions the test administrator delivers to the student, calling for the specific behavior
Item 2: “This box has a hole in it. Which object is small enough to fit through this hole?”
Chapter 4—Test Development 12 2015–16 Montana CRT-Alternate Technical Report
4.3 LAYOUT OF EVIDENCE FORMS AND ITEMS
Evidence Templates and Evidence Template Teacher Recording Sheets have been integrated into one
form, the Teacher Recording Evidence Form. The form should be completed by test administrators, not
students, and should be used directly from the CRT-Alternate Test Booklet. The Teacher Recording Evidence
Form provides a format to document the entire sequence of responses made by the student to the test item. As
the test item is presented to the student, the test administrator documents the modality used by the student to
communicate a response, as well as the accuracy of the response at each step of the scaffolding process. (See
the sample Teacher Recording Evidence Form in Figure 4-1.)
Chapter 4—Test Development 13 2015–16 Montana CRT-Alternate Technical Report
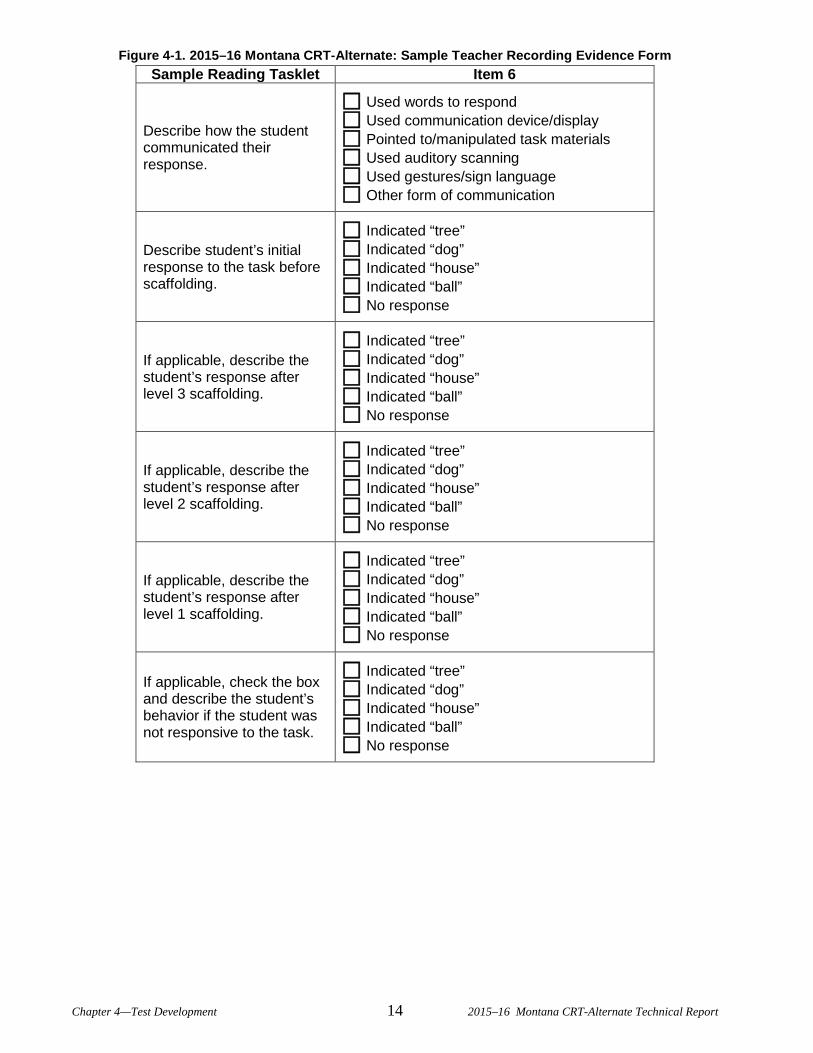
Figure 4-1. 2015–16 Montana CRT-Alternate: Sample Teacher Recording Evidence Form Sample Reading Tasklet Item 6
Describe how the student communicated their response.
Used words to respond Used communication device/display Pointed to/manipulated task materials Used auditory scanning Used gestures/sign language Other form of communication
Describe student’s initial response to the task before scaffolding.
Indicated “tree” Indicated “dog” Indicated “house” Indicated “ball” No response
If applicable, describe the student’s response after level 3 scaffolding.
Indicated “tree” Indicated “dog” Indicated “house” Indicated “ball” No response
If applicable, describe the student’s response after level 2 scaffolding.
Indicated “tree” Indicated “dog” Indicated “house” Indicated “ball” No response
If applicable, describe the student’s response after level 1 scaffolding.
Indicated “tree” Indicated “dog” Indicated “house” Indicated “ball” No response
If applicable, check the box and describe the student’s behavior if the student was not responsive to the task.
Indicated “tree” Indicated “dog” Indicated “house” Indicated “ball” No response
Chapter 4—Test Development 14 2015–16 Montana CRT-Alternate Technical Report
CHAPTER 5 ADMINISTRATION AND TRAINING
5.1 ADMINISTRATION GUIDELINES
The CRT-Alternate is administered by a special education teacher or another certified individual who
has worked extensively with the student and is trained in the assessment procedures. Because this is an on-
demand performance assessment, the administrator is also the scorer. This becomes a consideration with
regard to reliability, where values tend to be inflated due to administrator effects.
The test administrator may find it helpful to ask another person in the school to assist with the
administration. The additional persons who assist in administration may include, but are not limited to, the
following:
parent or guardian
general education teacher
paraprofessional
special service provider (speech/language therapist, psychologist, occupational or physical therapist, etc.)
school counselor
principal
other education professional
5.2 PROCEDURES
An audio PowerPoint presentation was sent to teachers who would be administering the CRT-
Alternate. Test administrators were instructed to follow the steps below to prepare for the assessment:
View training and participate in question/answer sessions.
Receive the secure CRT-Alternate Test Booklet from the test coordinator.
Receive hard copies of the test materials, and download the CRT-Alternate Administration Manual and scoring rubric from the OPI or Measured Progress Web site.
Read the CRT-Alternate Administration Manual to become familiar with the administration and scoring directions.
Read the CRT-Alternate Test Booklet to become familiar with the tasklets and performance indicators.
Chapter 5—Administration and Training 15 2015–16 Montana CRT-Alternate Technical Report
Consider how the student will access and respond to the test and determine the adaptations and supports the student will need.
Check to ensure all materials and resources needed are available to complete the tasklets. For example, a tasklet may ask the student to use a ruler. The test administrator needs to locate the ruler the student is most familiar with in order to administer the test item.
Provide the assistive technologies the student needs to access the materials and respond to the test items.
Schedule the assessment administration session for a time and place that is optimal for student effort and focus.
5.3 PROFESSIONAL DEVELOPMENT AND TRAINING PROGRAMS
System and school test coordinators were instructed to read the Test Coordinator’s Manual before
testing and become familiar with the instructions provided in the CRT-Alternate Administration Manual. The
Test Coordinator’s Manual and the CRT-Alternate Administration Manual provided each school with
checklists to help prepare for testing. The checklists outlined tasks to be performed before, during, and after
test administration. Along with providing these checklists, the manuals outlined the nature of the testing
material being sent to each school, how to inventory the material, how to track it during administration, and
how to return the material once testing was complete. It also contained information about including or
excluding students. Test administrators received copies of the Test Coordinator’s Manual, the CRT-Alternate
Administration Manual, and the test administrator training materials. Training materials and the PowerPoint
presentations were posted on the OPI Web site. Below is a summary of the information presented in the
training:
Important Dates
CRT-Alternate Overview
Week 1 of Testing
Eligibility for the CRT-Alternate
Who Should Administer the CRT-Alternate
Materials Needed for the Presentation and for Testing
About the Tests
Test Booklet Organization
Assessment Format
Introductory Item
Test Administration Strategies
Scaffolding
Chapter 5—Administration and Training 16 2015–16 Montana CRT-Alternate Technical Report
Scoring and Scoring Rules
Dealing with Resistance
Student Evidence
Test Materials
Answer Booklet
Student Barcode Labels
Returning Student Materials
Final Administration Hints
Questions and Answers
To answer any questions not addressed in the training, contact information for the OPI, Measured
Progress, and the University of Montana–Missoula was provided to teachers, test administrators, and test
coordinators. The contact information was provided in the manual and on the memo sent out with the test
materials.
Chapter 5—Administration and Training 17 2015–16 Montana CRT-Alternate Technical Report
CHAPTER 6 SCORING
6.1 SCORING THE ASSESSMENT
The CRT-Alternate is administered to a student one-on-one, possibly with the help of another
administrator. The teacher scores every item as it is administered using the rubric and a process called
scaffolding.
6.2 USING SCAFFOLDING TO GATHER STUDENT PERFORMANCE INFORMATION
Scaffolding is a process of providing the student with the support needed to respond to the questions
in the test. It is similar to support during daily instruction, in which many strategies are used frequently to
ensure that students experience success. For example, if a student is unable to make a correct choice from a
display of four pictures, the teacher reduces the complexity by removing one of the choices. Scaffolding
serves this same function and is provided so that students will experience success in completing the test items.
An important result of scaffolding is that it helps students demonstrate their knowledge and skills. These
skills can be described and measured, resulting in an accurate picture of what students can do.
The scoring system in the CRT-Alternate allows for increasing amounts of scaffolding, which is
provided only when the student does not respond at all or responds incorrectly. This approach is sometimes
described as a “least to most” prompt hierarchy (see Section 3.2 for a description of the scaffolding-as-scoring
paradigm). Each tasklet begins with an item that introduces the subject and materials that will be used in the
test activity. These items are scored as either a 4 (student responds accurately and with no assistance) or a 0
(student does not respond or actively resists). Items scored this way (at a level 4 or 0) may also be found
further into the tasklet when new materials are being introduced.
After the introductory items are scored, each subsequent item within the tasklet is scored on a five-
point descending scale from 4 through 0, where 4 represents a correct, independent response; 1, a correct
response that has been completely guided by the teacher; and 0, when the student does not respond or actively
resists participation in the test activity. (The scoring rubric is presented in Section 6.3.)
The scores from all items, including the introductory items and the subsequent items within each
tasklet, are added together to produce a raw score (i.e., total score) for the test. The raw score is then scaled
and a performance level assigned for the content area. (See Chapter 9 for details on scaling.)
A script is provided for scaffolding each of the test items. It describes the prompts to scaffold the
student to level 3, level 2, and level 1. It may be used verbatim or modified by the teacher to meet the needs
of the student. For each test item, level 1 prompting is full support from the teacher, guiding the student to the
Chapter 6—Scoring 18 2015–16 Montana CRT-Alternate Technical Report
correct response. Depending on the student and the test item, this may involve physically guiding the student
to the correct response or some other form of support that ensures that the student responds correctly.
It is critical that the test administrator deliver each item in a way that allows the student the
opportunity to score at level 4. That is, it is first assumed that the student can respond independently to each
item, even if that is not the usual instructional practice. The following are directions given to test
administrators to standardize scaffolding procedures across the state:
Follow the guidelines to observe the student demonstrating the performance required and allow adequate wait time for the student to process the information and respond without assistance. Do not repeat the question multiple times.
If the student does not respond or responds incorrectly, scaffold the student to level 3—“Student responds accurately when teacher clarifies, highlights important information, or reduces the range of options to three.” Again, give the student adequate wait time.
If the student does not respond or responds incorrectly, scaffold to level 2—“Student responds accurately when teacher provides basic yes/no questions or forced choices between two options.”
If the student still does not respond with the desired behavior, scaffold to level 1—“Student is guided to correct response by teacher (e.g., modeling the correct response or providing full physical assistance).”
If the student resists participation for an item, the test administrator will indicate a 0—“Student does not respond or actively resists.”
Scaffolding, in other words, is the process for determining the amount of information the student
needs to reach the correct response. If the student can respond independently (level 4), the student needs no
further information. If the student does not respond accurately or independently, more information is given
about the item (in accordance with a script in the CRT-Alternate Test Booklet) and/or the choices are reduced
(level 3). This funneling toward the correct response continues (according to the script) as the student needs
more assistance, by providing specific information about the item and/or a forced choice between two options
(level 2) and finally by guiding the student to the correct response (level 1). In this way, the student is not
expected to either “get it” or “not get it” as in most on-demand assessments. The CRT-Alternate considers the
level of assistance that students require to demonstrate their knowledge and skills and thus provides more
precise information about student performance and achievement. This system is designed to be sensitive to
small increments of change in student performance, an important consideration in describing the learning
outcomes of students with severe disabilities.
This process must be used systematically with every item identified for scoring within each tasklet.
The intent is to give the student every opportunity to perform independently on each item. Scaffolding
examples are provided in the CRT-Alternate Administration Manual. The consistent use of required levels of
assistance during administration/scoring will increase item intercorrelations and overall test reliability.
Chapter 6—Scoring 19 2015–16 Montana CRT-Alternate Technical Report
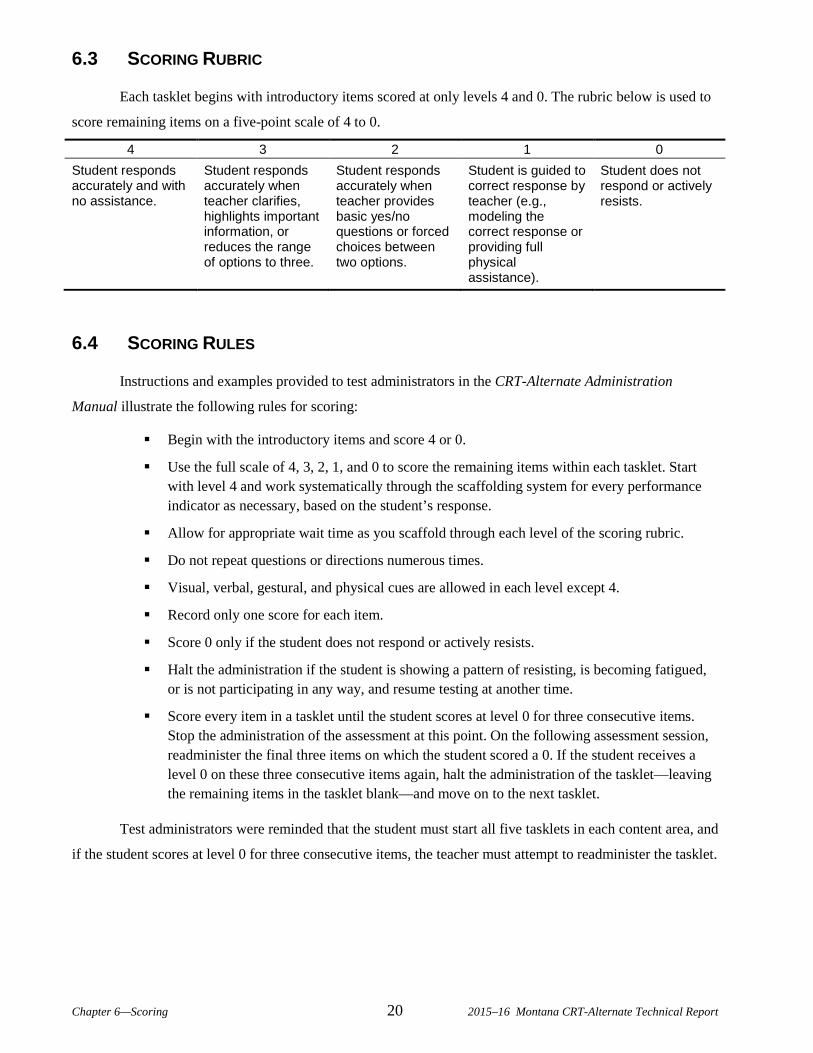
6.3 SCORING RUBRIC
Each tasklet begins with introductory items scored at only levels 4 and 0. The rubric below is used to
score remaining items on a five-point scale of 4 to 0.
4 3 2 1 0 Student responds accurately and with no assistance.
Student responds accurately when teacher clarifies, highlights important information, or reduces the range of options to three.
Student responds accurately when teacher provides basic yes/no questions or forced choices between two options.
Student is guided to correct response by teacher (e.g., modeling the correct response or providing full physical assistance).
Student does not respond or actively resists.
6.4 SCORING RULES
Instructions and examples provided to test administrators in the CRT-Alternate Administration
Manual illustrate the following rules for scoring:
Begin with the introductory items and score 4 or 0.
Use the full scale of 4, 3, 2, 1, and 0 to score the remaining items within each tasklet. Start with level 4 and work systematically through the scaffolding system for every performance indicator as necessary, based on the student’s response.
Allow for appropriate wait time as you scaffold through each level of the scoring rubric.
Do not repeat questions or directions numerous times.
Visual, verbal, gestural, and physical cues are allowed in each level except 4.
Record only one score for each item.
Score 0 only if the student does not respond or actively resists.
Halt the administration if the student is showing a pattern of resisting, is becoming fatigued, or is not participating in any way, and resume testing at another time.
Score every item in a tasklet until the student scores at level 0 for three consecutive items. Stop the administration of the assessment at this point. On the following assessment session, readminister the final three items on which the student scored a 0. If the student receives a level 0 on these three consecutive items again, halt the administration of the tasklet—leaving the remaining items in the tasklet blank—and move on to the next tasklet.
Test administrators were reminded that the student must start all five tasklets in each content area, and
if the student scores at level 0 for three consecutive items, the teacher must attempt to readminister the tasklet.
Chapter 6—Scoring 20 2015–16 Montana CRT-Alternate Technical Report
CHAPTER 7 CLASSICAL ITEM ANALYSIS
As noted in Brown (1983), “A test is only as good as the items it contains.” A complete evaluation of
a test’s quality must include an evaluation of each item. Both Standards for Educational and Psychological
Testing (AERA, APA, & NCME, 2014) and Code of Fair Testing Practices in Education (Joint Committee
on Testing Practices, 2004) include standards for identifying quality items. While the specific statistical
criteria identified in these publications were developed primarily for general—not alternate—assessment, the
principles and some of the techniques apply within the alternate assessment framework as well.
Both qualitative and quantitative analyses were conducted to ensure that CRT-Alternate items met
these standards. Qualitative analyses are described in earlier sections of this report; this section focuses on the
quantitative evaluations. The statistical evaluations discussed are difficulty indices and discrimination (item-
test correlations) as well as differential item functioning (DIF), which is used to evaluate potential item bias.
The item analyses presented here are based on the statewide administration of the CRT-Alternate in spring
2016. Note that dimensionality analyses, which can provide additional information about how items function,
could not be conducted for the CRT-Alternate because of the small population of students who take the test.
7.1 ITEM DIFFICULTY AND DISCRIMINATION
All tasks were evaluated in terms of item difficulty according to standard classical test theory
practices. “Difficulty” was defined as the average proportion of points achieved on an item and was measured
by obtaining the average score on an item and dividing by the maximum score for the item. CRT-Alternate
items are scored polytomously, such that a student can achieve a score of 0, 1, 2, 3, or 4 for an item (with the
exception of the introductory items for each tasklet, which are scored 0 or 4). By computing the difficulty
index as the average proportion of points achieved, the items are placed on a scale that ranges from 0.0 to 1.0.
Although this index is traditionally described as a measure of difficulty, it is properly interpreted as an
easiness index, because larger values indicate easier items.
An index of 0.0 indicates that all students received no credit for the item, and an index of 1.0
indicates that all students received full credit for the item. Items that have either a very high or very low
difficulty index are considered to be potentially problematic, because they are either so difficult that few
students get them right or so easy that nearly all students get them right. In either case, such items should be
reviewed for appropriateness for inclusion on the assessment. If an assessment were composed entirely of
very easy or very hard items, all students would receive nearly the same scores, and the assessment would not
be able to differentiate high-ability students from low-ability students.
It is worth mentioning that using a norm-referenced criterion such as p-values to evaluate test items is
somewhat contradictory to the purpose of a criterion-referenced assessment like the CRT-Alternate. Criterion-
referenced assessments are primarily intended to provide evidence on student progress relative to a standard
Chapter 7—Classical Item Analysis 21 2015–16 Montana CRT-Alternate Technical Report
rather than to differentiate among students. Thus, the generally accepted criteria regarding classical item
statistics are only cautiously applicable to the CRT-Alternate. Difficulty indices (i.e., item-level classical
statistics) for each item are provided in Appendix F.
A desirable feature of an item is that the higher-ability students perform better on the item than lower-
ability students. The correlation between student performance on a single item and total test score is a
commonly used measure of this characteristic of an item. Within classical test theory, this item-test
correlation is referred to as the item’s “discrimination,” because it indicates the extent to which successful
performance on an item discriminates between high and low scores on the test. The discrimination index used
to evaluate CRT-Alternate tasks was the Pearson product-moment correlation. The theoretical range of this
statistic is -1.0 to 1.0. The discrimination index cannot be calculated for items for which all the students
received full credit for the item, as can be seen for some items in Appendix F.
Discrimination indices can be thought of as measures of how closely an item assesses the same
knowledge and skills assessed by other items contributing to the criterion total score. That is, the
discrimination index can be thought of as a measure of construct consistency. In light of this interpretation,
the selection of an appropriate criterion total score is crucial to the interpretation of the discrimination index.
For the CRT-Alternate, the total test score, excluding the item being evaluated, was used as the criterion
score.
A summary of the item difficulty and item discrimination statistics for each grade is presented in
Table 7-1. The mean difficulty values shown in the table indicate that, overall, students performed well on the
items on the CRT-Alternate. In interpreting these values, it is important to note that item scores lower than 2
are fairly rare on the CRT-Alternate, and a score of 0 is awarded only if the student refuses to respond. These
aspects of the item score scale should be considered when evaluating the difficulty values presented in Table
7-1. In contrast to alternate assessments, the difficulty values for assessments designed for the general
population tend to be in the 0.4 to 0.7 range for the majority of items. Because the nature and purpose of
alternate assessments are different from those of general assessments, and because very few guidelines exist
as to criteria for interpreting these values for alternate assessments, the values presented in Table 7-1 should
not be interpreted to mean that the students performed better on the CRT-Alternate than the students who took
general assessments did on those tests.
Also shown in Table 7-1 are the mean discrimination values. A few factors should be considered
when interpreting these values. First, aside from the introductory item for each tasklet—which is scored either
0 or 4—all items on the CRT-Alternate are polytomously scored. In general, polytomous items will tend to
have higher discrimination values than dichotomous items (e.g., multiple-choice items) because the former
are less affected by a restriction of range. Second, the CRT-Alternate item score scale awards points based on
the extent to which students require assistance to complete the tasklet. Because students who require
assistance with one tasklet are more likely to require assistance with other tasklets, discrimination values will
be higher for items scored in this way.
Chapter 7—Classical Item Analysis 22 2015–16 Montana CRT-Alternate Technical Report
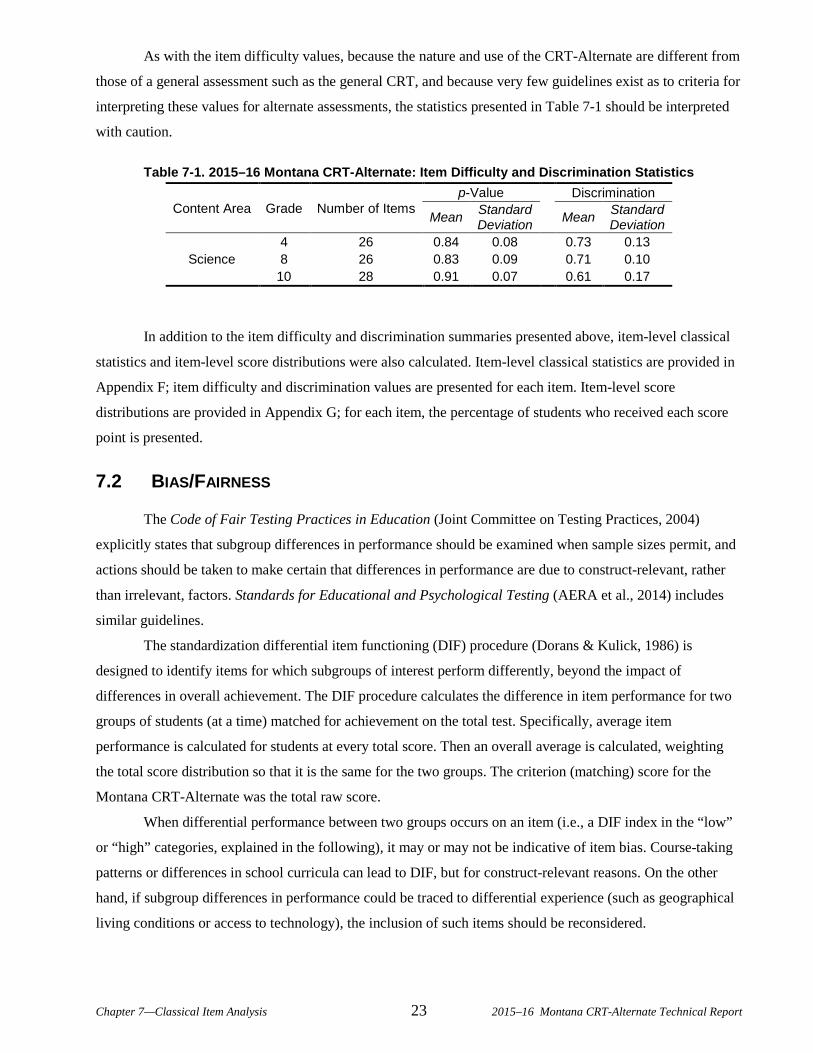
As with the item difficulty values, because the nature and use of the CRT-Alternate are different from
those of a general assessment such as the general CRT, and because very few guidelines exist as to criteria for
interpreting these values for alternate assessments, the statistics presented in Table 7-1 should be interpreted
with caution.
Table 7-1. 2015–16 Montana CRT-Alternate: Item Difficulty and Discrimination Statistics
Content Area Grade Number of Items p-Value
Discrimination
Mean Standard Deviation Mean Standard
Deviation
Science 4 26 0.84 0.08 0.73 0.13 8 26 0.83 0.09 0.71 0.10
10 28 0.91 0.07 0.61 0.17
In addition to the item difficulty and discrimination summaries presented above, item-level classical
statistics and item-level score distributions were also calculated. Item-level classical statistics are provided in
Appendix F; item difficulty and discrimination values are presented for each item. Item-level score
distributions are provided in Appendix G; for each item, the percentage of students who received each score
point is presented.
7.2 BIAS/FAIRNESS
The Code of Fair Testing Practices in Education (Joint Committee on Testing Practices, 2004)
explicitly states that subgroup differences in performance should be examined when sample sizes permit, and
actions should be taken to make certain that differences in performance are due to construct-relevant, rather
than irrelevant, factors. Standards for Educational and Psychological Testing (AERA et al., 2014) includes
similar guidelines.
The standardization differential item functioning (DIF) procedure (Dorans & Kulick, 1986) is
designed to identify items for which subgroups of interest perform differently, beyond the impact of
differences in overall achievement. The DIF procedure calculates the difference in item performance for two
groups of students (at a time) matched for achievement on the total test. Specifically, average item
performance is calculated for students at every total score. Then an overall average is calculated, weighting
the total score distribution so that it is the same for the two groups. The criterion (matching) score for the
Montana CRT-Alternate was the total raw score.
When differential performance between two groups occurs on an item (i.e., a DIF index in the “low”
or “high” categories, explained in the following), it may or may not be indicative of item bias. Course-taking
patterns or differences in school curricula can lead to DIF, but for construct-relevant reasons. On the other
hand, if subgroup differences in performance could be traced to differential experience (such as geographical
living conditions or access to technology), the inclusion of such items should be reconsidered.
Chapter 7—Classical Item Analysis 23 2015–16 Montana CRT-Alternate Technical Report
Computed DIF indices range from -1.0 to 1.0. Dorans and Holland (1993) suggested that index values
between -0.05 and 0.05 should be considered negligible. Dorans and Holland further stated that items with
values between -0.10 and -0.05 and between 0.05 and 0.10 (i.e., “low” DIF) should be inspected to ensure that
no possible effect is overlooked, and that items with values outside the [-0.10, 0.10] range (i.e., “high” DIF)
are more unusual and should be examined very carefully.
For the 2015–16 Montana CRT-Alternate tests, six subgroup comparisons were evaluated for DIF:
Male versus Female
White versus Hispanic
White versus Native American
Disability versus No Disability
Low Income versus Not Low Income
Limited English Proficient versus Not Limited English Proficient.
Other comparisons (e.g., other ethnic groups) were not analyzed using DIF procedures, because
limited sample sizes would have inflated type I error rates. Appendix H presents the number of items
classified as either “low” or “high” DIF, overall and by group favored. As can be seen in Appendix H, the
preponderance of CRT-Alternate items fell within the “negligible DIF” range (-0.05 to 0.05).
Chapter 7—Classical Item Analysis 24 2015–16 Montana CRT-Alternate Technical Report
CHAPTER 8 CHARACTERIZING ERRORS ASSOCIATED WITH TEST SCORES
The Montana CRT-Alternate scores are used mainly for school, district, and state-level accountability
in the federal NCLB and Montana state accountability systems. The students are classified as proficient or not
proficient and these classifications are included in the state’s adequate yearly progress (AYP) calculation. In
this case, the reliability of individual students’ scores, albeit not ignorable, becomes much less important. The
scores have been translated into a yes/no decision for each student and then aggregated across students.
Several different methods of evaluating test reliability are discussed below.
8.1 RELIABILITY
In the previous chapter, individual item characteristics of the 2015–16 Montana CRT-Alternate were
presented. Although individual item performance is an important focus for evaluation, a complete evaluation
of an assessment must also address the way in which items function together and complement one another.
Any measurement includes some amount of measurement error. No academic assessment can measure student
performance with perfect accuracy; some students will receive scores that underestimate their true ability, and
other students will receive scores that overestimate their true ability. Items that function well together produce
assessments that have less measurement error (i.e., the error is small on average). Such assessments are
described as “reliable.”
There are a number of ways to estimate an assessment’s reliability. One approach is to split all test
items into two groups and then correlate students’ scores on the two half-tests. This is known as a split-half
estimate of reliability. If the two half-test scores correlate highly, the items on them are likely measuring very
similar knowledge or skills. It suggests that measurement error will be minimal.
The split-half method requires psychometricians to select items that contribute to each half-test score.
This decision may have an impact on the resulting correlation, since each different possible split of the test
into halves will result in a different correlation. Another problem with the split-half method of calculating
reliability is that it underestimates reliability, because test length is cut in half. All else being equal, a shorter
test is less reliable than a longer test. Cronbach (1951) provided a statistic, alpha (α), that avoids the
shortcomings of the split-half method by comparing individual item variances to total test variance.
Cronbach’s α was used to assess the reliability of the 2015–16 Montana CRT-Alternate tests. The formula is
as follows:
Chapter 8—Characterizing Errors Associated with Test 25 2015–16 Montana CRT-Alternate Technical Report Scores
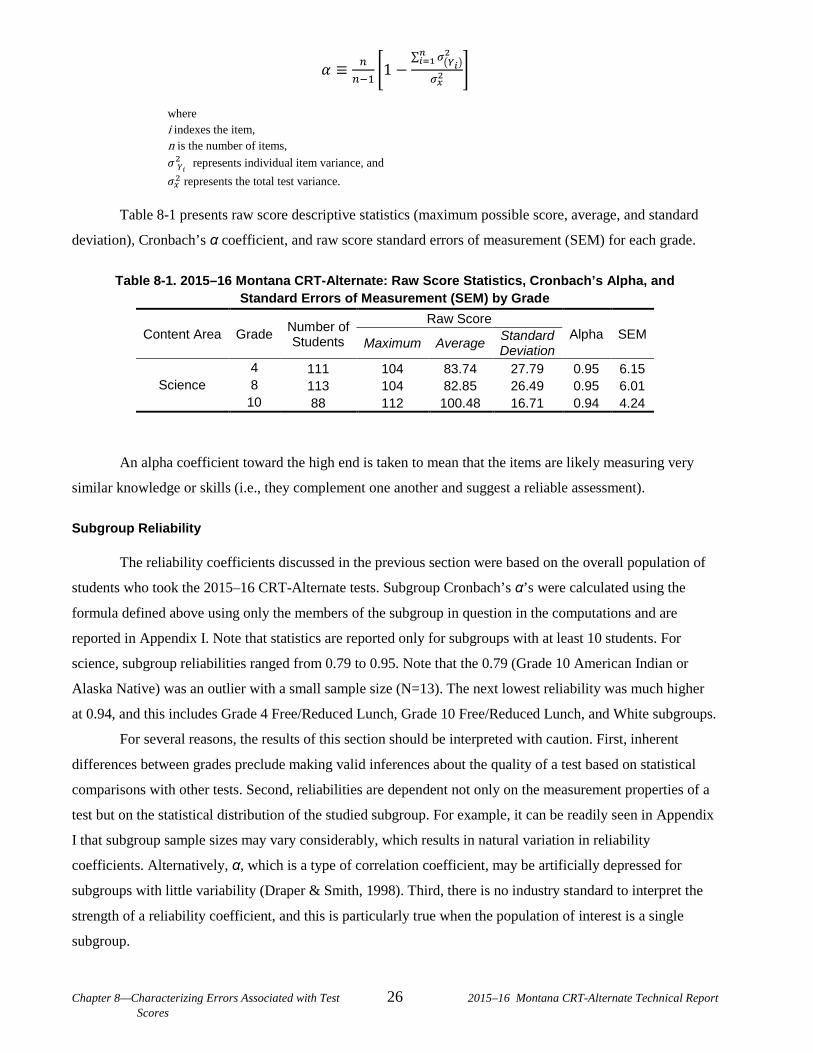
𝛼𝛼 ≡ 𝑛𝑛𝑛𝑛−1
�1 −∑ 𝜎𝜎�𝑌𝑌𝑖𝑖�
2𝑛𝑛𝑖𝑖=1
𝜎𝜎𝑥𝑥2�
where i indexes the item, n is the number of items,
𝜎𝜎(𝑌𝑌𝑖𝑖)2 represents individual item variance, and
𝜎𝜎𝑥𝑥2 represents the total test variance.
Table 8-1 presents raw score descriptive statistics (maximum possible score, average, and standard
deviation), Cronbach’s α coefficient, and raw score standard errors of measurement (SEM) for each grade.
Table 8-1. 2015–16 Montana CRT-Alternate: Raw Score Statistics, Cronbach’s Alpha, and Standard Errors of Measurement (SEM) by Grade
Content Area Grade Number of Students
Raw Score Alpha SEM
Maximum Average Standard Deviation
Science 4 111 104 83.74 27.79 0.95 6.15 8 113 104 82.85 26.49 0.95 6.01
10 88 112 100.48 16.71 0.94 4.24
An alpha coefficient toward the high end is taken to mean that the items are likely measuring very
similar knowledge or skills (i.e., they complement one another and suggest a reliable assessment).
Subgroup Reliability
The reliability coefficients discussed in the previous section were based on the overall population of
students who took the 2015–16 CRT-Alternate tests. Subgroup Cronbach’s α’s were calculated using the
formula defined above using only the members of the subgroup in question in the computations and are
reported in Appendix I. Note that statistics are reported only for subgroups with at least 10 students. For
science, subgroup reliabilities ranged from 0.79 to 0.95. Note that the 0.79 (Grade 10 American Indian or
Alaska Native) was an outlier with a small sample size (N=13). The next lowest reliability was much higher
at 0.94, and this includes Grade 4 Free/Reduced Lunch, Grade 10 Free/Reduced Lunch, and White subgroups.
For several reasons, the results of this section should be interpreted with caution. First, inherent
differences between grades preclude making valid inferences about the quality of a test based on statistical
comparisons with other tests. Second, reliabilities are dependent not only on the measurement properties of a
test but on the statistical distribution of the studied subgroup. For example, it can be readily seen in Appendix
I that subgroup sample sizes may vary considerably, which results in natural variation in reliability
coefficients. Alternatively, α, which is a type of correlation coefficient, may be artificially depressed for
subgroups with little variability (Draper & Smith, 1998). Third, there is no industry standard to interpret the
strength of a reliability coefficient, and this is particularly true when the population of interest is a single
subgroup.
Chapter 8—Characterizing Errors Associated with Test 26 2015–16 Montana CRT-Alternate Technical Report Scores
Reporting Categories Reliability
In addition to the subgroup reliabilities presented in the previous section, reliabilities for the CRT-
Alternate reporting categories were also calculated. For the CRT-Alternate, the reporting categories are
simply the standards being measured for the content area. Cronbach’s α coefficients for reporting categories
were calculated via the same alpha formula defined at the beginning of Chapter 8 using just the items of a
given reporting category in the computations. These results are presented in Appendix J. Once again, as
expected, because they are based on a subset of items rather than the full test, computed reporting category
reliabilities were lower (sometimes substantially so) than were overall test reliabilities, and interpretations
should take this into account.
For science, reporting category reliabilities ranged from 0.54 to 0.91. In general, the reporting
category reliabilities were lower than those based on the total test and approximately to the degree one would
expect based on Classical Test Theory (CTT). Qualitative differences between grades once again preclude
valid inferences about the quality of the full test, based on statistical comparisons among subtests.
8.2 DECISION ACCURACY AND CONSISTENCY
While related to reliability, the accuracy and consistency of classifying students into performance
categories is an even more important issue in a standards-based reporting framework (Livingston & Lewis,
1995). Unlike generalizability coefficients, decision accuracy and consistency can usually be computed with
the data currently available for most alternate assessments. For every 2015–16 CRT-Alternate grade, each
student was classified into one of the following performance levels: Novice, Nearing Proficiency, Proficient,
and Advanced. This section of the report explains the methodologies used to assess the reliability of
classification decisions and presents the results.
Accuracy refers to the extent to which decisions based on test scores match decisions that would have
been made if the scores did not contain any measurement error. Accuracy must be estimated, because
errorless test scores do not exist. Consistency measures the extent to which classification decisions based on
test scores match the decisions based on scores from a second, parallel form of the same test. Consistency can
be evaluated directly from actual responses to test items if two complete and parallel forms of the test are
given to the same group of students. In operational test programs, however, such a design is usually
impractical. Instead, techniques have been developed to estimate both the accuracy and consistency of
classification decisions based on a single administration of a test. The Livingston and Lewis (1995) technique
was used for the 2015–16 CRT-Alternate because it is easily adaptable to all types of testing formats,
including mixed-format tests.
The accuracy and consistency estimates reported in Appendix K make use of “true scores” in the
classical test theory sense. A true score is the score that would be obtained if a test had no measurement error.
Chapter 8—Characterizing Errors Associated with Test 27 2015–16 Montana CRT-Alternate Technical Report Scores
Of course, true scores cannot be observed and so must be estimated. In the Livingston and Lewis method,
estimated true scores are used to categorize students into their “true” classifications.
For the 2015–16 CRT-Alternate, after various technical adjustments (described in Livingston &
Lewis, 1995), a four-by-four contingency table of accuracy was created for each grade, where cell [i, j]
represented the estimated proportion of students whose true score fell into classification i (where i = 1 to 4)
and observed score into classification j (where j = 1 to 4). The sum of the diagonal entries (i.e., the proportion
of students whose true and observed classifications matched) signified overall accuracy.
To calculate consistency, true scores were used to estimate the joint distribution of classifications on
two independent, parallel test forms. Following statistical adjustments per Livingston and Lewis (1995), a
new four-by-four contingency table was created for each grade and populated by the proportion of students
who would be categorized into each combination of classifications according to the two (hypothetical)
parallel test forms. Cell [i, j] of this table represented the estimated proportion of students whose observed
score on the first form would fall into classification i (where i = 1 to 4) and whose observed score on the
second form would fall into classification j (where j = 1 to 4). The sum of the diagonal entries (i.e., the
proportion of students categorized by the two forms into exactly the same classification) signified overall
consistency.
Another way to measure consistency is to use Cohen’s (1960) coefficient 𝜅𝜅 (kappa), which assesses
the proportion of consistent classifications after removing the proportion of consistent classifications that
would be expected by chance. It is calculated using the following formula:
𝜅𝜅 = (Observed agreement)−(Chance agreement)1−(Chance agreement)
= ∑ 𝐶𝐶𝑖𝑖𝑖𝑖𝑖𝑖 −∑ 𝐶𝐶𝑖𝑖.𝐶𝐶.𝑖𝑖𝑖𝑖1−∑ 𝐶𝐶𝑖𝑖.𝐶𝐶.𝑖𝑖𝑖𝑖
where
𝐶𝐶𝑖𝑖. is the proportion of students whose observed achievement level would be Level i (where i = 1 to 4) on the first hypothetical parallel form of the test;
𝐶𝐶.𝑖𝑖 is the proportion of students whose observed achievement level would be Level i (where i = 1 to 4) on the second hypothetical parallel form of the test; and
𝐶𝐶𝑖𝑖𝑖𝑖 is the proportion of students whose observed achievement level would be Level i (where i = 1 to 4) on both hypothetical parallel forms of the test.
Because 𝜅𝜅 is corrected for chance, its values are lower than other consistency estimates.
The accuracy and consistency analyses described above are provided in Table K-1 of Appendix K.
The table includes overall accuracy and consistency indices, including kappa. Accuracy and consistency
values conditional upon performance level are also given. For these calculations, the denominator is the
proportion of students associated with a given performance level. For example, the conditional accuracy value
is 0.92 for Novice for grade 4 science. This figure indicates that among the students whose true scores placed
them in this classification, 92% would be expected to be in this classification when categorized according to
their observed scores. Similarly, a consistency value of 0.76 indicates that 76% of students with observed
Chapter 8—Characterizing Errors Associated with Test 28 2015–16 Montana CRT-Alternate Technical Report Scores
scores in the Novice level would be expected to score in this classification again if a second, parallel test form
were used.
For some testing situations, the greatest concern may be decisions around level thresholds. For
example, in testing done for NCLB accountability purposes, the primary concern is distinguishing between
students who are Proficient and those who are Not Yet Proficient. For the 2015–16 CRT-Alternate, Table K-2
in Appendix K provides accuracy and consistency estimates at each cutpoint as well as false positive and false
negative decision rates. (A false positive is the proportion of students whose observed scores were above the
cut and whose true scores were below the cut. A false negative is the proportion of students whose observed
scores were below the cut and whose true scores were above the cut.)
The above indices are derived from Livingston and Lewis’s (1995) method of estimating the accuracy
and consistency of classifications. It should be noted that Livingston and Lewis discuss two versions of the
accuracy and consistency tables. A standard version performs calculations for forms parallel to the form
taken. An “adjusted” version adjusts the results of one form to match the observed score distribution obtained
in the data. Table K-1 uses the standard version for two reasons: (1) this “unadjusted” version can be
considered a smoothing of the data, thereby decreasing the variability of the results; and (2) for results dealing
with the consistency of two parallel forms, the unadjusted tables are symmetrical, indicating that the two
parallel forms have the same statistical properties. This second reason is consistent with the notion of forms
that are parallel; that is, it is more intuitive and interpretable for two parallel forms to have the same statistical
distribution.
Descriptive statistics relating to the decision accuracy and consistency (DAC) of the 2015–16
Montana CRT-Alternate tests can be derived from Table K-1. For science, overall accuracy ranged from 0.80
to 0.89, overall consistency ranged from 0.76 to 0.91, and the kappa statistic ranged from 0.64 to 0.71. Note
that, as with other methods of evaluating reliability, DAC statistics calculated based on small groups can be
expected to be lower than those calculated based on larger groups. For this reason, the values presented in
Appendix K should be interpreted with caution. In addition, it is important to remember that it is
inappropriate to compare DAC statistics between grades.
8.3 GENERALIZABILITY
For further evidence, the OPI might consider conducting generalizability studies for each grade.
Because the Montana CRT-Alternate is administered by individual teachers, in addition to the usual sources
of error associated with regular assessments, there is always the question of how well student performance
generalizes across occasions. A generalizability study of alternate assessments could include occasion as a
facet, in addition to rater/administrator and task.
Chapter 8—Characterizing Errors Associated with Test 29 2015–16 Montana CRT-Alternate Technical Report Scores
CHAPTER 9 COMPARABILITY
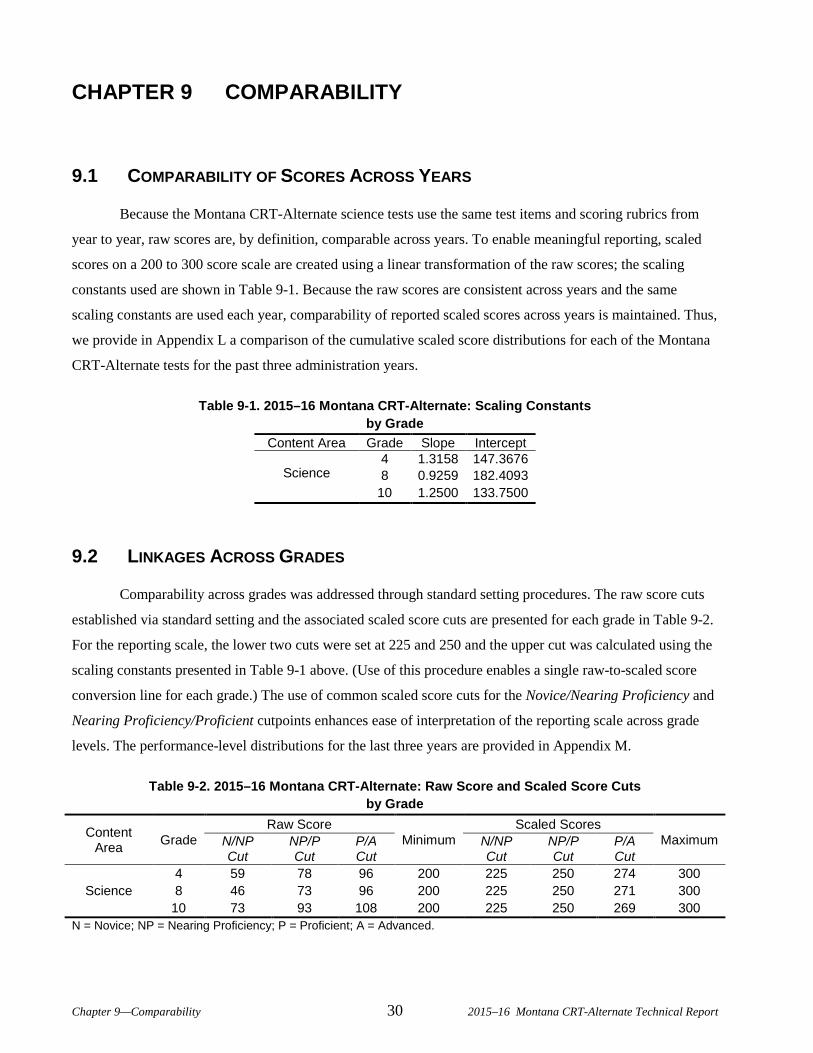
9.1 COMPARABILITY OF SCORES ACROSS YEARS
Because the Montana CRT-Alternate science tests use the same test items and scoring rubrics from
year to year, raw scores are, by definition, comparable across years. To enable meaningful reporting, scaled
scores on a 200 to 300 score scale are created using a linear transformation of the raw scores; the scaling
constants used are shown in Table 9-1. Because the raw scores are consistent across years and the same
scaling constants are used each year, comparability of reported scaled scores across years is maintained. Thus,
we provide in Appendix L a comparison of the cumulative scaled score distributions for each of the Montana
CRT-Alternate tests for the past three administration years.
Table 9-1. 2015–16 Montana CRT-Alternate: Scaling Constants by Grade
Content Area Grade Slope Intercept
Science 4 1.3158 147.3676 8 0.9259 182.4093
10 1.2500 133.7500
9.2 LINKAGES ACROSS GRADES
Comparability across grades was addressed through standard setting procedures. The raw score cuts
established via standard setting and the associated scaled score cuts are presented for each grade in Table 9-2.
For the reporting scale, the lower two cuts were set at 225 and 250 and the upper cut was calculated using the
scaling constants presented in Table 9-1 above. (Use of this procedure enables a single raw-to-scaled score
conversion line for each grade.) The use of common scaled score cuts for the Novice/Nearing Proficiency and
Nearing Proficiency/Proficient cutpoints enhances ease of interpretation of the reporting scale across grade
levels. The performance-level distributions for the last three years are provided in Appendix M.
Table 9-2. 2015–16 Montana CRT-Alternate: Raw Score and Scaled Score Cuts by Grade
Content Area Grade
Raw Score Minimum
Scaled Scores Maximum N/NP
Cut NP/P Cut
P/A Cut
N/NP Cut
NP/P Cut
P/A Cut
Science 4 59 78 96 200 225 250 274 300 8 46 73 96 200 225 250 271 300
10 73 93 108 200 225 250 269 300 N = Novice; NP = Nearing Proficiency; P = Proficient; A = Advanced.
Chapter 9—Comparability 30 2015–16 Montana CRT-Alternate Technical Report
CHAPTER 10 REPORTING
The CRT-Alternate assessment was designed to measure student performance against Montana’s
Content Standards and Expanded Benchmarks. Consistent with this purpose, results from the CRT-Alternate
were reported in terms of performance levels that describe student performance in relation to the established
state standards. There are four performance levels: Advanced, Proficient, Nearing Proficiency, and Novice.
(CRT-Alternate performance-level descriptors and the performance level cuts on both the raw and scaled
score scales are presented in Appendix N.) Students receive a separate performance-level classification in
each content area.
School- and system-level results are reported as the number and percentage of students attaining each
performance level at each grade level tested. Disaggregations by student subgroups are also reported at the
school and system levels. The CRT-Alternate reports are:
Student Reports
Class Roster and Item-Level Reports
School Summary Reports
System Summary Reports
State Summary Reports
To establish protocols for handling data discrepancies and data cleanup processes, the OPI and
Measured Progress collaborated to formulate decision rules in early 2016. A copy of these decision rules is
included as Appendix O.
State summary results were provided to the OPI via a secure Web site. The report formats are
included in Appendix P. All reports were made available to system and school administrators via Montana’s
online reporting system, the Montana Analysis and Reporting System (MARS). Student reports were shipped
to system test coordinators in September 2016 for distribution to schools within their respective
systems/districts. Student reports were also posted online for access by schools. System test coordinators and
teachers were also provided with copies of the Guide to the 2016 Criterion-Referenced Test and CRT-
Alternate Assessment Reports to assist them in understanding the connection between the assessment and the
classroom. The guide provides information about the assessment and the use of assessment results.
10.1 SUMMARY REPORT
The summary report is produced at the school, system, and state levels. The report is produced for
each grade level: grades 4, 8, and 10 science. The report consists of the following sections:
Distribution of Scores
Chapter 10—Reporting 31 2015–16 Montana CRT-Alternate Technical Report
Subtest Results
Results for Subgroups of Students
10.1.1 Distribution of Scores
The Distribution of Scores section of the report contains a breakdown of the performance of included
students (as described in the decision rules document) into different scaled score intervals. The number and
percentage of students that fall into each scaled score interval are shown. There is an overall percentage
reported for students that fall into any one of the four performance levels (Advanced, Proficient, Nearing
Proficiency, and Novice). In the School Summary Report, the calculations are done at the school, system, and
state levels. The System Summary Report contains results at the system and state levels. The State Summary
Report contains only state-level results.
10.1.2 Subtest Results
The Subtest Results section of the report summarizes the average points earned in the different
content standards, by included students (as described in the decision rules document) in the school, system,
and state. The average points earned are compared to the total possible points for each content standard.
10.1.3 Results for Subgroups of Students
The Results for Subgroups of Students section of the report summarizes the performance of included
students (as described in the decision rules document) broken down by various reporting categories. For each
reporting category, the number of tested (included) students is reported, as well as the percentage of students
in each of the four performance levels. In the School Summary Report, this is reported at the school, system,
and state levels. In the System Summary Report, the data are reported at the system and state levels. In the
State Summary Report, the data are reported at state level only.
The list of subgroup reporting categories is as follows:
All Students
Gender (Male/Female)
Ethnicity (American Indian or Alaska native; Asian; Hispanic; Black or African American; Native Hawaiian or Other Pacific Islander; White)
Special Education
Students with a 504 Plan
Title I (optional)
Migrant
Gifted/Talented
LEP/ELL
Chapter 10—Reporting 32 2015–16 Montana CRT-Alternate Technical Report
Former LEP Student
LEP Student Enrolled for First Time in a U.S. School (the percentage of students in each of the four performance levels is not reported for this subgroup of students)
Free/Reduced Lunch
The data for the reporting categories were provided by information coded on the students’ answer
booklets by teachers and/or data supplied by the state through an Achievement in Montana (AIM) export. Due
to relatively low numbers of students in certain reporting categories, school personnel are advised, under
Family Educational Rights and Privacy Act (FERPA) guidelines, to treat these pages confidentially.
10.2 ROSTER AND ITEM-LEVEL REPORT
The Montana CRT-Alternate Roster and Item-Level Report provides a list of all students in a
school/class and provides performance on the items. The students’ names and identification numbers are
listed as row headers down the left side of the report. The items are listed as column headers. For each item,
the following are shown:
Content standard
Tasklet number
Total possible points
For each student, the score for each item is reported. The columns on the right side of the report show
the total test results, broken into several categories. Subcategory Points Earned columns show points earned
by the student in each content area subcategory relative to total possible points. A Total Points Earned column
is a summary of all points earned and total possible points in the content area. The last two columns show
each student’s scaled score and performance level.
The Montana CRT-Alternate Roster and Item-Level Report is confidential and should be kept secure
within the school and district. FERPA requires that access to individual student results be restricted to the
student, the student’s parents/guardians, and authorized school personnel.
10.3 DECISION RULES
To ensure that reported results for the 2015–16 Montana CRT-Alternate are accurate relative to
collected data and other pertinent information, a document that delineates analysis and reporting rules was
created. These decision rules were observed in the analyses of Montana CRT-Alternate test data and in
reporting the test results. Moreover, these rules are the main reference for quality assurance checks.
The decision rules document used for reporting the results of the 2015–16 administration of the
Montana CRT-Alternate is found in Appendix O.
Chapter 10—Reporting 33 2015–16 Montana CRT-Alternate Technical Report
The rules primarily describe the inclusion/exclusion of students at the school, system, and state levels
of aggregation. The document also describes rules as they pertain to individual reports, the classification of
students based on their school type, or other information provided by the state through the student
demographic file (AIM) or collected on the student’s answer booklet.
10.4 QUALITY ASSURANCE
Quality-assurance measures are embedded throughout the entire process of analysis and reporting.
The data processor, data analyst, and psychometrician assigned to work on the Montana CRT-Alternate
implement quality-control checks of their respective computer programs and intermediate products.
Moreover, when data are handed off to different functions within the Data and Reporting Services (DRS) and
Psychometrics and Research (P&R) departments, the sending functions verify that the data are accurate before
handoff. Additionally, when a function receives a data set, the first step is to verify the data for accuracy.
Another type of quality-assurance measure is parallel processing. Different exclusions that determine
whether each student receives scaled scores and/or is included in different levels of aggregation are parallel
processed. Using the decision rules document, two data analysts independently write a computer program that
assigns students’ exclusions. For each grade, the exclusions assigned by each data analyst are compared
across all students. Only when 100% agreement is achieved can the rest of the data analysis be completed.
Another level of quality assurance involves the procedures implemented by the quality-assurance
group to check the accuracy of reported data. Using a sample of schools and systems, the quality-assurance
group verifies that reported information is correct. The step is conducted in two parts: (1) verify that the
computed information was obtained correctly through the appropriate application of different decision rules,
and (2) verify that the correct data points populate each cell in the Montana CRT-Alternate reports. The
selection of sample schools and systems for this purpose is very specific and can affect the success of the
quality-control efforts. There are two sets of samples selected that may not be mutually exclusive. The first set
includes those that satisfy the following criteria:
One-school system
Two-school system
Multi-school system
The second set of samples includes systems or schools that have unique reporting situations as
indicated by the decision rules. This second set is necessary to ensure that each rule is applied correctly. The
second set includes the following criteria:
Private school
School with excluded (not tested) students
Chapter 10—Reporting 34 2015–16 Montana CRT-Alternate Technical Report

The quality-assurance group uses a checklist to implement its procedures. After the checklist is
completed, sample reports are circulated for psychometric checks and program management review.
Chapter 10—Reporting 35 2015–16 Montana CRT-Alternate Technical Report
CHAPTER 11 VALIDITY
The purpose of this report is to describe several technical aspects of the CRT-Alternate in an effort to
contribute to the accumulation of validity evidence to support CRT-Alternate score interpretations. Because it
is a combination of a test and its scores that are evaluated for validity, not just the test itself, this report
presents documentation to substantiate intended interpretations (AERA et al., 2014). Each of the chapters in
this report contributes important information to the validity argument by addressing one or more of the
following aspects of the CRT-Alternate: test development, test administration, scoring, item analyses,
reliability, performance levels, and reporting.
The CRT-Alternate assessments are based on, and aligned to, Montana’s Content Standards and
Expanded Benchmarks in science. The CRT-Alternate results are intended to provide inferences about student
achievement on Montana’s science Content Standards and Expanded Benchmarks, and these achievement
inferences are meant to be useful for program and instructional improvement and as a component of school
accountability.
Standards for Educational and Psychological Testing (AERA et al., 2014) provides a framework for
describing sources of evidence that should be considered when constructing a validity argument. These
sources include evidence based on the following five general areas: test content, response processes, internal
structure, relationship to other variables, and consequences of testing. Although each of these sources may
speak to a different aspect of validity, they are not distinct types of validity. Instead, each contributes to a
body of evidence about the comprehensive validity of score interpretations.
11.1 EVIDENCE BASED ON TEST DEVELOPMENT AND STRUCTURE
A measure of test content validity is to determine how well the assessment tasks represent the
curriculum and standards for each grade level. This is informed by the item development process, including
how the test blueprints and test items align to the curriculum and standards. Viewed through this lens
provided by the content standards, evidence based on test content was extensively described in Chapters 3 and
4. Item alignment with Montana content standards; item bias, sensitivity, and content appropriateness review
processes; and adherence to the test blueprint are all components of validity evidence based on test content.
As discussed earlier, all CRT-Alternate test questions are aligned by Montana educators to specific Montana
content standards and undergo several rounds of review for content fidelity and appropriateness.
Evidence based on internal structure is presented in the discussions of item analyses and reliability in
Chapters 7 and 8. Technical characteristics of the internal structure of the assessments are presented in terms
of classical item statistics (item difficulty, item-test correlation) and reliability coefficients. In general, indices
were within the ranges expected.
Chapter 11—Validity 36 2015–16 Montana CRT-Alternate Technical Report
11.2 OTHER EVIDENCE
The training and administration information in Chapters 5 and 6 describes the steps taken to train the
teachers/test administrators on administration and scoring procedures. Tests are administered according to
state-mandated standardized procedures, and all test administrators are required to review the training CD.
These efforts to provide thorough training opportunities and materials help maximize consistency of
administration and scoring across teachers, which enhances the quality of test scores and, in turn, contributes
to validity.
Evidence on the consequences of testing is addressed in the reporting information provided in
Chapter 10. This chapter speaks to efforts undertaken to provide the public with accurate and clear test score
information. Performance levels give reference points for mastery at each grade level, a useful and simple
way to interpret scores. Several different standard reports were provided to stakeholders.
11.3 FUTURE DIRECTIONS
To further support the validity argument, additional studies to provide evidence regarding the
relationship of CRT-Alternate results to other variables might include the extent to which scores from the
CRT-Alternate assessments converge with other measures of similar constructs, and the extent to which they
diverge from measures of different constructs. Relationships among measures of the same or similar
constructs can sharpen the meaning of scores and appropriate interpretations by refining the definition of the
construct.
The evidence presented in this report supports inferences of student achievement on the content
represented in the Montana content standards for science for the purposes of program and instructional
improvement and as a component of school accountability.
Chapter 11—Validity 37 2015–16 Montana CRT-Alternate Technical Report
REFERENCES American Educational Research Association, American Psychological Association, & National Council on
Measurement in Education. (2014). Standards for Educational and Psychological Testing. Washington, DC: American Educational Research Association.
Brown, F. G. (1983). Principles of Educational and Psychological Testing (3rd ed.). Fort Worth, TX: Holt, Rinehart and Winston.
Cohen, J. (1960). A coefficient of agreement for nominal scales. Educational and Psychological Measurement, 20, 37–46.
Cronbach, L. J. (1951). Coefficient alpha and the internal structure of tests. Psychometrika, 16, 297–334.
Dorans, N. J., & Holland, P. W. (1993). DIF detection and description. In P. W. Holland & H. Wainer (Eds.), Differential Item Functioning (pp. 35–66). Hillsdale, NJ: Lawrence Erlbaum Associates.
Dorans, N. J., & Kulick, E. (1986). Demonstrating the utility of the standardization approach to assessing unexpected differential item performance on the Scholastic Aptitude Test. Journal of Educational Measurement, 23, 355–368.
Doyle, P. M., Wolery, M., Ault, M. J., & Gast, D. L. (1988). System of least prompts: A literature review of procedural parameters. Journal of the Association for the Severely Handicapped, 13(1), 28–40.
Draper, N. R., & Smith, H. (1998). Applied Regression Analysis (3rd ed.). New York: Wiley.
Joint Committee on Testing Practices. (2004). Code of Fair Testing Practices in Education. Washington, DC: National Council on Measurement in Education. Available for download at www.apa.org/science/fairtestcode.html.
Livingston, S. A., & Lewis, C. (1995). Estimating the consistency and accuracy of classifications based on test scores. Journal of Educational Measurement, 32, 179–197.
Wolery, M., Ault, M. J., & Doyle, P. M. (1992). Teaching Students with Moderate to Severe Disabilities. New York: Longman.
References 38 2015–16 Montana CRT-Alternate Technical Report

APPENDICES
Appendices 39 2015–16 Montana CRT-Alternate Technical Report

APPENDIX A—TECHNICAL ADVISORY COMMITTEE MEMBERS
Appendix A—Technical Advisory Committee Members 1 2015–16 Montana CRT-Alternate Technical Report

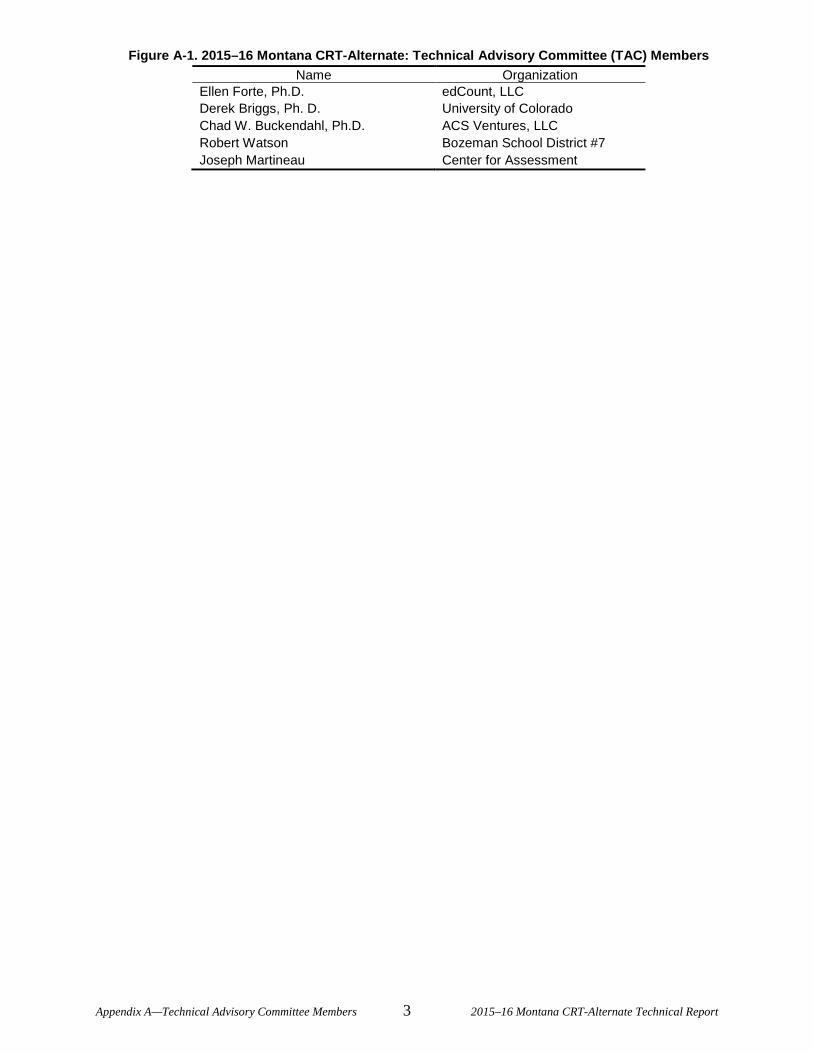
Figure A-1. 2015–16 Montana CRT-Alternate: Technical Advisory Committee (TAC) Members Name Organization
Ellen Forte, Ph.D. edCount, LLC Derek Briggs, Ph. D. University of Colorado Chad W. Buckendahl, Ph.D. ACS Ventures, LLC Robert Watson Bozeman School District #7 Joseph Martineau Center for Assessment
Appendix A—Technical Advisory Committee Members 3 2015–16 Montana CRT-Alternate Technical Report

APPENDIX B—PARTICIPATION SUMMARY BY DEMOGRAPHIC CATEGORY
Appendix B—Participation Summary by Demographic 1 2015–16 Montana CRT-Alternate Technical Report Category

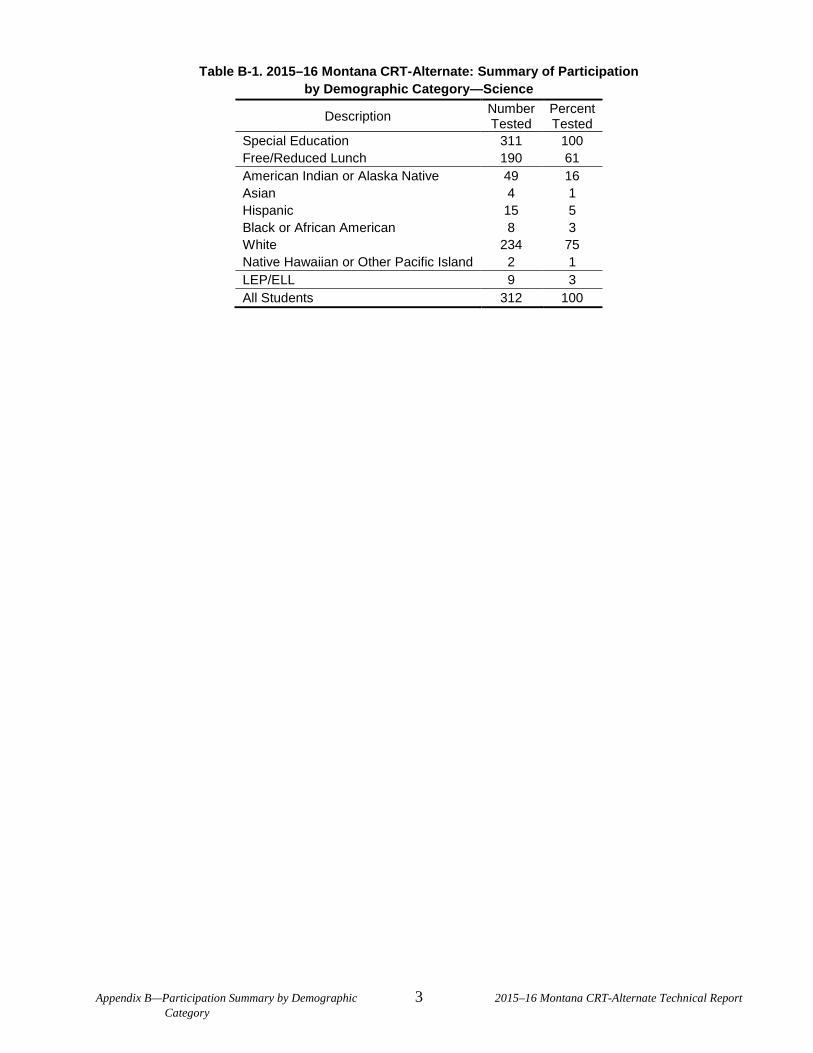
Table B-1. 2015–16 Montana CRT-Alternate: Summary of Participation by Demographic Category—Science
Description Number Tested
Percent Tested
Special Education 311 100 Free/Reduced Lunch 190 61 American Indian or Alaska Native 49 16 Asian 4 1 Hispanic 15 5 Black or African American 8 3 White 234 75 Native Hawaiian or Other Pacific Island 2 1 LEP/ELL 9 3 All Students 312 100
Appendix B—Participation Summary by Demographic 3 2015–16 Montana CRT-Alternate Technical Report Category

APPENDIX C—SAMPLE TASKLET
Appendix C—Sample Tasklet 1 2015–16 Montana CRT-Alternate Technical Report

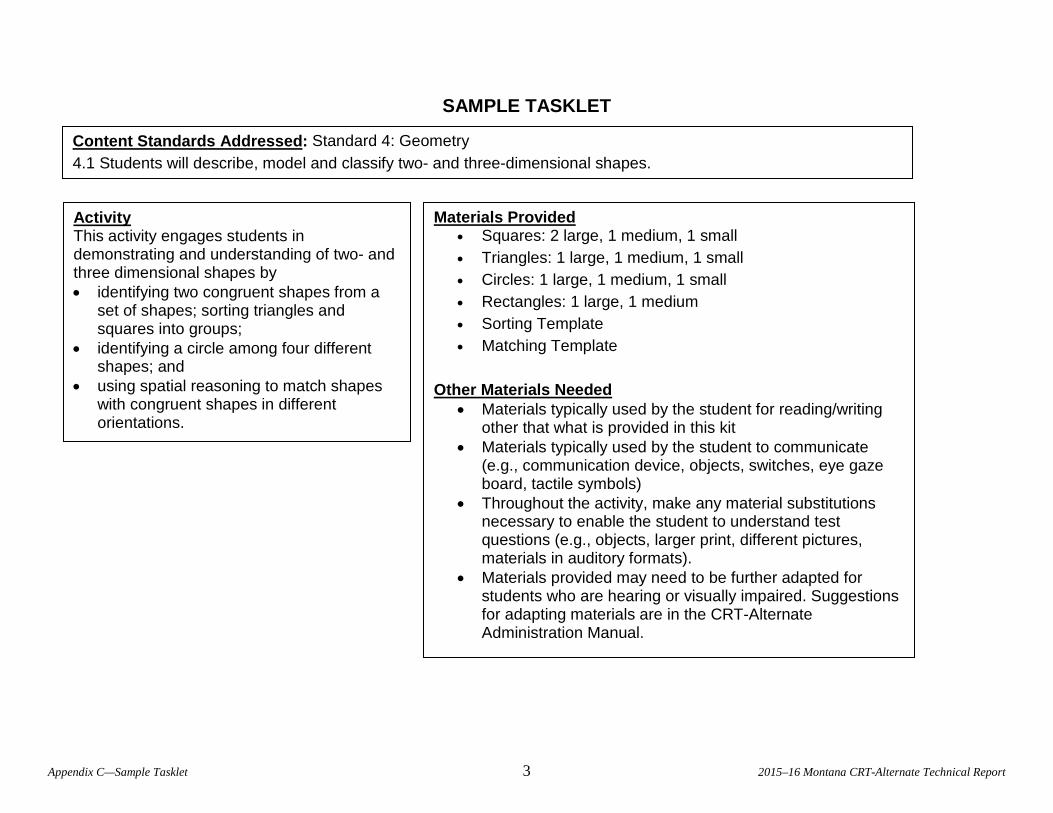
SAMPLE TASKLET
Content Standards Addressed: Standard 4: Geometry 4.1 Students will describe, model and classify two- and three-dimensional shapes.
Activity This activity engages students in demonstrating and understanding of two- and three dimensional shapes by • identifying two congruent shapes from a
set of shapes; sorting triangles and squares into groups;
• identifying a circle among four different shapes; and
• using spatial reasoning to match shapes with congruent shapes in different orientations.
Materials Provided • Squares: 2 large, 1 medium, 1 small • Triangles: 1 large, 1 medium, 1 small • Circles: 1 large, 1 medium, 1 small • Rectangles: 1 large, 1 medium • Sorting Template • Matching Template
Other Materials Needed • Materials typically used by the student for reading/writing
other that what is provided in this kit • Materials typically used by the student to communicate
(e.g., communication device, objects, switches, eye gaze board, tactile symbols)
• Throughout the activity, make any material substitutions necessary to enable the student to understand test questions (e.g., objects, larger print, different pictures, materials in auditory formats).
• Materials provided may need to be further adapted for students who are hearing or visually impaired. Suggestions for adapting materials are in the CRT-Alternate Administration Manual.
Appendix C—Sample Tasklet 3 2015–16 Montana CRT-Alternate Technical Report
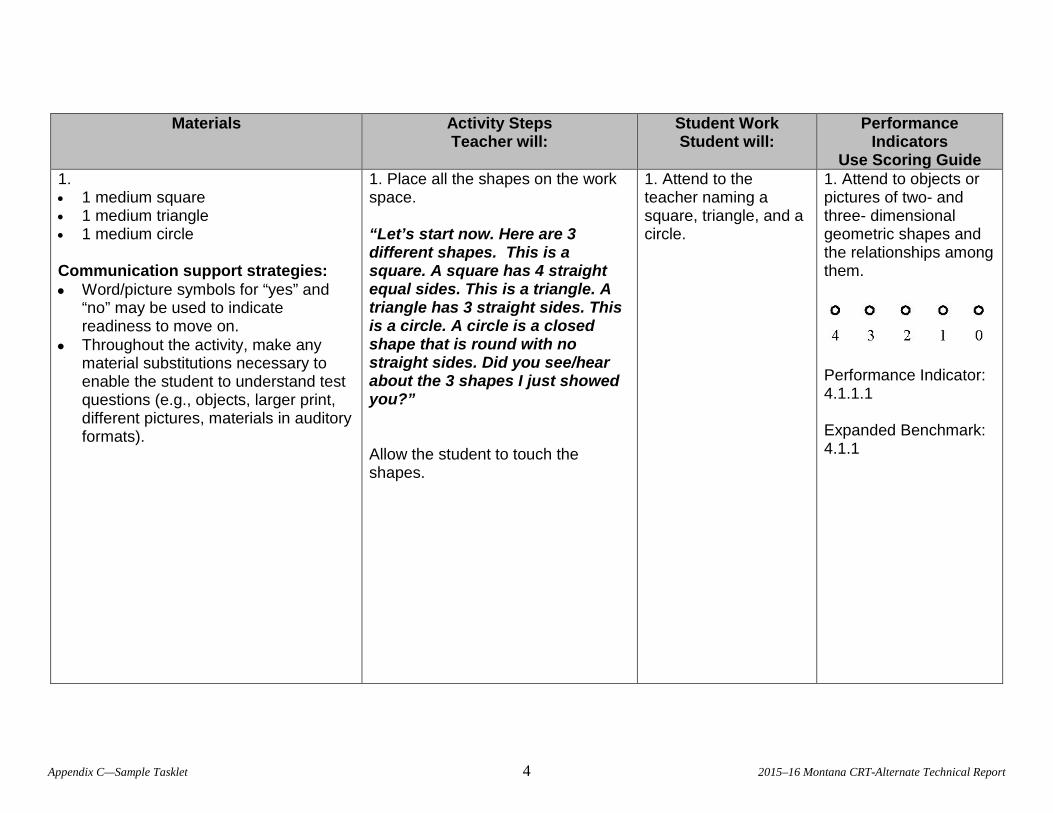
Materials Activity Steps
Teacher will: Student Work Student will:
Performance Indicators
Use Scoring Guide 1. • 1 medium square • 1 medium triangle • 1 medium circle Communication support strategies: • Word/picture symbols for “yes” and
“no” may be used to indicate readiness to move on.
• Throughout the activity, make any material substitutions necessary to enable the student to understand test questions (e.g., objects, larger print, different pictures, materials in auditory formats).
1. Place all the shapes on the work space. “Let’s start now. Here are 3 different shapes. This is a square. A square has 4 straight equal sides. This is a triangle. A triangle has 3 straight sides. This is a circle. A circle is a closed shape that is round with no straight sides. Did you see/hear about the 3 shapes I just showed you?” Allow the student to touch the shapes.
1. Attend to the teacher naming a square, triangle, and a circle.
1. Attend to objects or pictures of two- and three- dimensional geometric shapes and the relationships among them.
Performance Indicator: 4.1.1.1
Expanded Benchmark: 4.1.1
Appendix C—Sample Tasklet 4 2015–16 Montana CRT-Alternate Technical Report
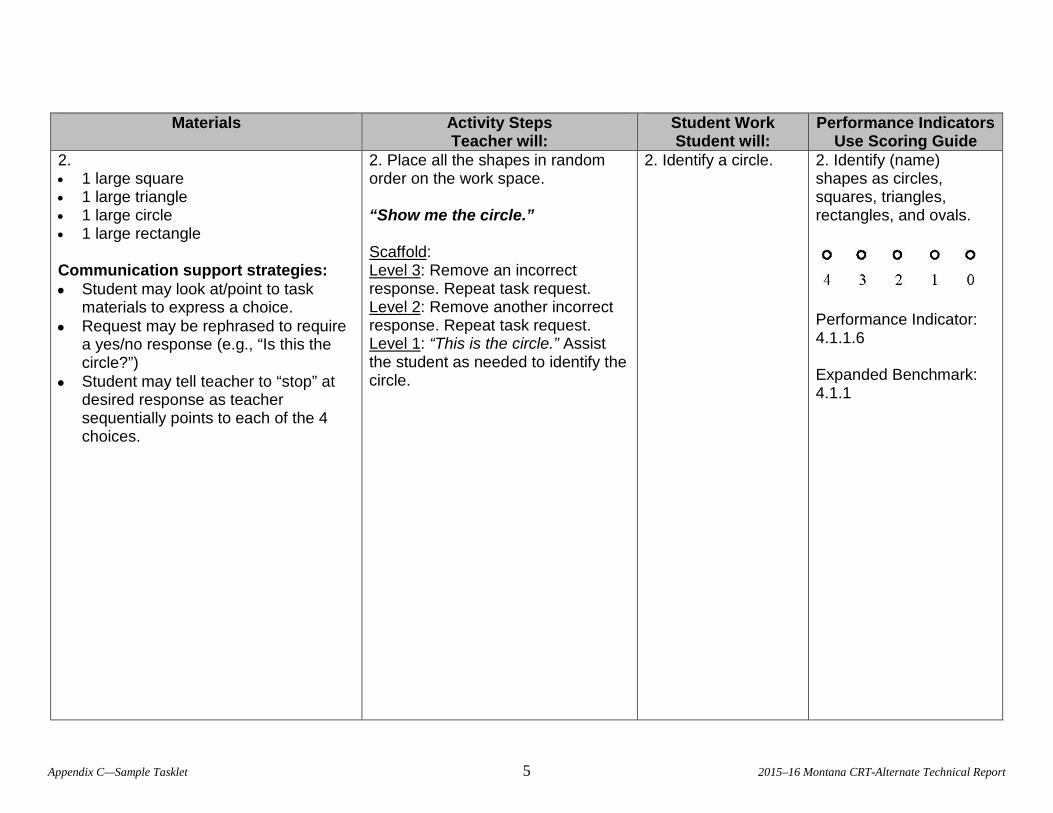
Materials Activity Steps
Teacher will: Student Work Student will:
Performance Indicators Use Scoring Guide
2. • 1 large square • 1 large triangle • 1 large circle • 1 large rectangle Communication support strategies: • Student may look at/point to task
materials to express a choice. • Request may be rephrased to require
a yes/no response (e.g., “Is this the circle?”)
• Student may tell teacher to “stop” at desired response as teacher sequentially points to each of the 4 choices.
2. Place all the shapes in random order on the work space. “Show me the circle.” Scaffold: Level 3: Remove an incorrect response. Repeat task request. Level 2: Remove another incorrect response. Repeat task request. Level 1: “This is the circle.” Assist the student as needed to identify the circle.
2. Identify a circle.
2. Identify (name) shapes as circles, squares, triangles, rectangles, and ovals.
Performance Indicator: 4.1.1.6 Expanded Benchmark: 4.1.1
Appendix C—Sample Tasklet 5 2015–16 Montana CRT-Alternate Technical Report
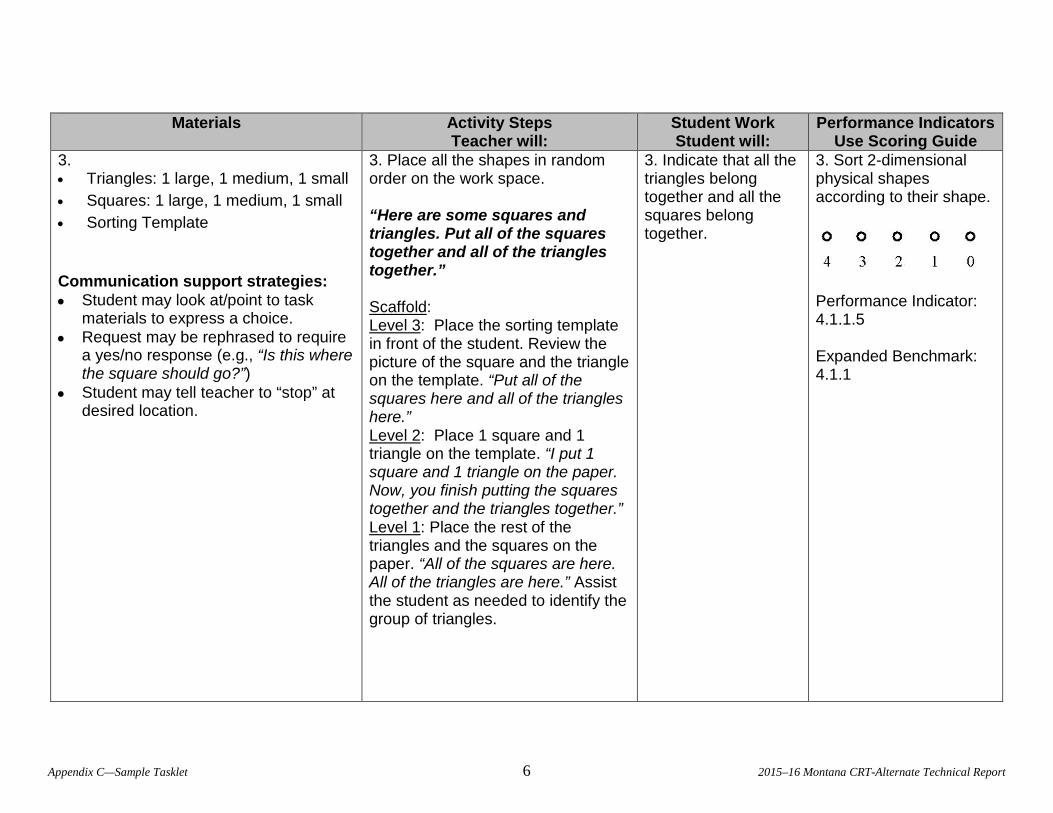
Materials Activity Steps
Teacher will: Student Work Student will:
Performance Indicators Use Scoring Guide
3. • Triangles: 1 large, 1 medium, 1 small • Squares: 1 large, 1 medium, 1 small • Sorting Template
Communication support strategies: • Student may look at/point to task
materials to express a choice. • Request may be rephrased to require
a yes/no response (e.g., “Is this where the square should go?”)
• Student may tell teacher to “stop” at desired location.
3. Place all the shapes in random order on the work space. “Here are some squares and triangles. Put all of the squares together and all of the triangles together.” Scaffold: Level 3: Place the sorting template in front of the student. Review the picture of the square and the triangle on the template. “Put all of the squares here and all of the triangles here.” Level 2: Place 1 square and 1 triangle on the template. “I put 1 square and 1 triangle on the paper. Now, you finish putting the squares together and the triangles together.” Level 1: Place the rest of the triangles and the squares on the paper. “All of the squares are here. All of the triangles are here.” Assist the student as needed to identify the group of triangles.
3. Indicate that all the triangles belong together and all the squares belong together.
3. Sort 2-dimensional physical shapes according to their shape.
Performance Indicator: 4.1.1.5 Expanded Benchmark: 4.1.1
Appendix C—Sample Tasklet 6 2015–16 Montana CRT-Alternate Technical Report
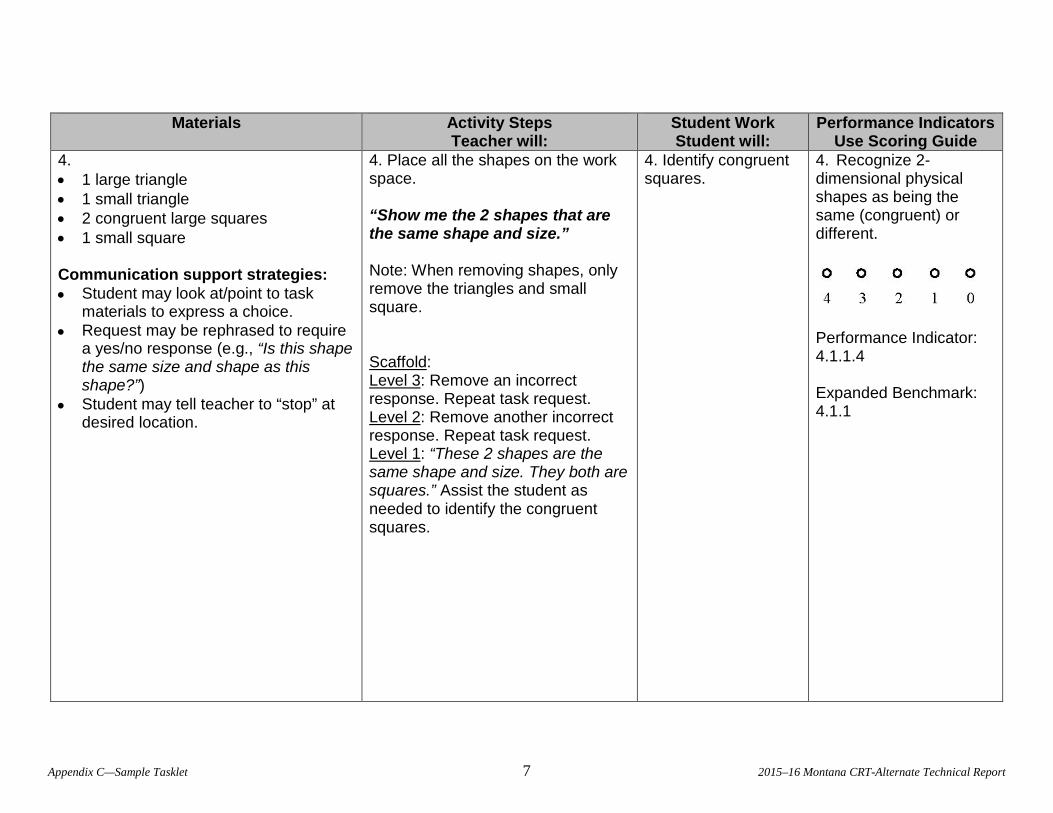
Materials Activity Steps
Teacher will: Student Work Student will:
Performance Indicators Use Scoring Guide
4. • 1 large triangle • 1 small triangle • 2 congruent large squares • 1 small square
Communication support strategies: • Student may look at/point to task
materials to express a choice. • Request may be rephrased to require
a yes/no response (e.g., “Is this shape the same size and shape as this shape?”)
• Student may tell teacher to “stop” at desired location.
4. Place all the shapes on the work space. “Show me the 2 shapes that are the same shape and size.” Note: When removing shapes, only remove the triangles and small square. Scaffold: Level 3: Remove an incorrect response. Repeat task request. Level 2: Remove another incorrect response. Repeat task request. Level 1: “These 2 shapes are the same shape and size. They both are squares.” Assist the student as needed to identify the congruent squares.
4. Identify congruent squares.
4. Recognize 2-dimensional physical shapes as being the same (congruent) or different.
Performance Indicator: 4.1.1.4 Expanded Benchmark: 4.1.1
Appendix C—Sample Tasklet 7 2015–16 Montana CRT-Alternate Technical Report
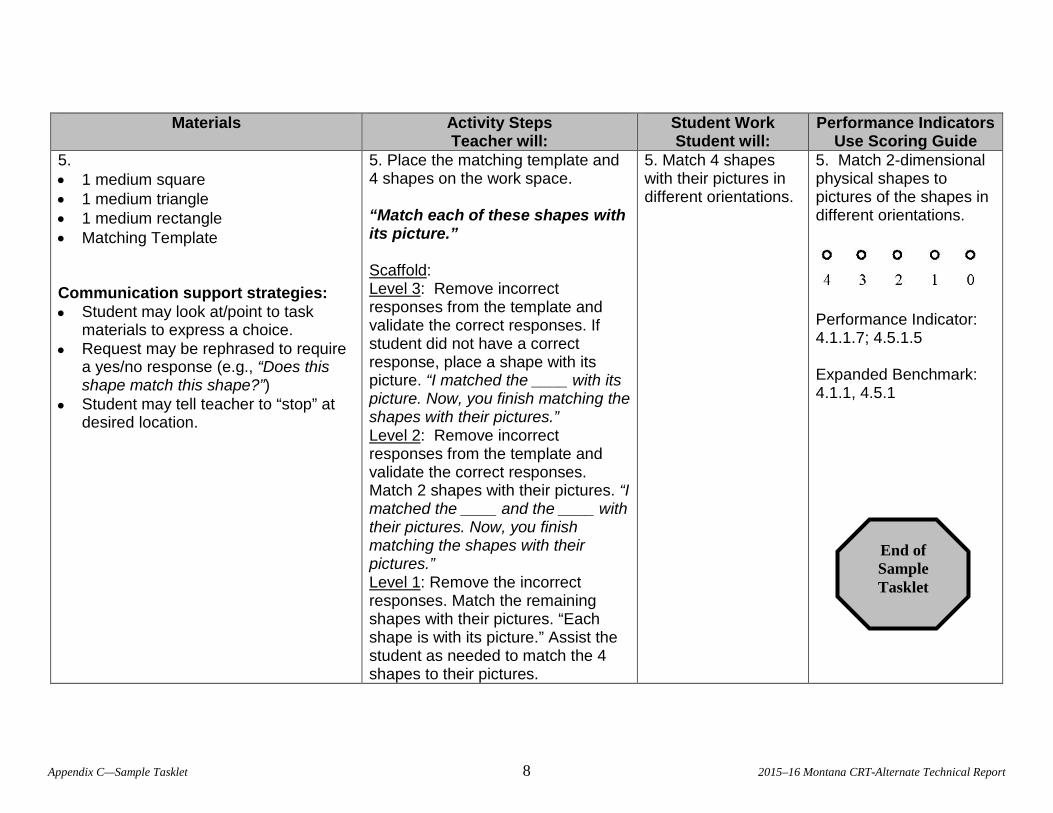
Materials Activity Steps
Teacher will: Student Work Student will:
Performance Indicators Use Scoring Guide
5. • 1 medium square • 1 medium triangle • 1 medium rectangle • Matching Template Communication support strategies: • Student may look at/point to task
materials to express a choice. • Request may be rephrased to require
a yes/no response (e.g., “Does this shape match this shape?”)
• Student may tell teacher to “stop” at desired location.
5. Place the matching template and 4 shapes on the work space. “Match each of these shapes with its picture.” Scaffold: Level 3: Remove incorrect responses from the template and validate the correct responses. If student did not have a correct response, place a shape with its picture. “I matched the ____ with its picture. Now, you finish matching the shapes with their pictures.” Level 2: Remove incorrect responses from the template and validate the correct responses. Match 2 shapes with their pictures. “I matched the ____ and the ____ with their pictures. Now, you finish matching the shapes with their pictures.” Level 1: Remove the incorrect responses. Match the remaining shapes with their pictures. “Each shape is with its picture.” Assist the student as needed to match the 4 shapes to their pictures.
5. Match 4 shapes with their pictures in different orientations.
5. Match 2-dimensional physical shapes to pictures of the shapes in different orientations.
Performance Indicator: 4.1.1.7; 4.5.1.5 Expanded Benchmark: 4.1.1, 4.5.1
End of Sample Tasklet
Appendix C—Sample Tasklet 8 2015–16 Montana CRT-Alternate Technical Report
APPENDIX D—INTERRATER RELIABILITY REPORT
Appendix D—Interrater Reliability Report 1 2015–16 Montana CRT-Alternate Technical Report

OFFICE OF PUBLIC INSTRUCTION PO BOX 202501 Linda McCulloch HELENA MT 59620-2501 Superintendent www.opi.mt.gov (406) 444-3095 (888) 231-9393 (406) 444-0169 (TTY)
Examining the Interrater Reliability
of Montana’s CRT-Alternate
Gail McGregor, Ed.D.
University of Montana-Missoula
Submitted
by The Montana Office of Public Instruction
to The United States Department of Education
for Peer Review
by Judy Snow
State Assessment Director
As an outcome of the U.S. Department of Education’s review of Montana’s assessment system, the state was asked to submit evidence of the interrater reliability of its alternate
assessment, the CRT-Alt. Dr. Stanley Rabinowitz, a consultant made available to Montana’s Office of Public Instruction by the U.S. Department of Education because of his role with the
Assessment and Accountability Comprehensive Center, provided guidance that led to the design of a study to respond to this requirement. This design was shared with Montana’s Technical Advisory Committee at its January, 2007 meeting. With their endorsement, the study was
implemented during the spring, 2007 testing window. This report summarizes the results of this effort.
Design of the Study As suggested by Dr. Rabinowitz, this study was designed to gather multiple sources of data that, collectively, would produce a “preponderance of evidence” supporting the overall integrity as well as the interrater reliability of the CRT-Alt. This broader view is based on the belief that scoring will not be meaningful if the assessment is not administered as required. This approach is responsive to the unique characteristics of Montana, and the small number of students with disabilities who take this form of the test. During the March, 2007 assessment period, a total of 698 students were tested using the CRT-Alt across grades 3, 4, 5, 6, 7, 8, and 10. The number of students tested per grade ranged from a low of 84 students in Grade 5 to a high of 133 students in Grade 6.
The study encompassed plans to gather data relative to five test characteristics. These focus areas, and the data sources used to evaluate them, are summarized in Table 1 below.
Examining the Interrater Reliability of Montana’s CRT-Alternate Prepared by Gail McGregor for the Office of Public Instruction, Linda McCulloch, Superintendent
September 2007
Table 1: Test Characteristics and Sources of Evidence for CRT-Alt Interrater Reliability Study
Test Characteristic Source of Data
1. Evidence-Base for Practices used in Test Design
• Review of professional literature addressing pedagogical practices for students with severe cognitive disabilities.
• Examination of reliability indices in published
research using presentation and prompting methodology adopted for the CRT-Alt.
2. Accessibility of Training for Test Administrators
• Test administrator training survey. • Test administrator questions included in the Student
Response Booklet.
3. Test Administrator Knowledge and Understanding of Testing Procedures
• Test administrator training survey. • Independent observer ratings of fidelity of test
administration.
4. Fidelity of Test Administration
• Independent observer ratings of fidelity of test administration.
5. Level of Agreement: Item Scoring
• Comparison of scores of test administrator with those of a trained independent observer present during test administration.
• Sample of Evidence Templates submitted with Student
Test Booklet, reviewed and scored by independent reviewer.
In the remainder of this report, the activities that have been undertaken in each of these
areas, and the results, are summarized. Use of Evidence-Based Practices in Test Design The CRT-Alt is a performance based assessment, measuring a student’s response to a series of test items that are presented in the format of short instructional tasks. Given the heterogeneity of the students who are eligible to be assessed with this instrument in terms of their motor, sensory, language, and cognitive skills, the test builds in considerable flexibility in regard to the materials used to present test items, and the response modalities used by students to communicate and interact throughout the assessment. For example, real objects may be substituted for the pictures provided in the test materials kit to accommodate students with visual limitations. In sharp contrast to this flexibility, all other aspects of the administration and scoring of this assessment are tightly controlled.
Examining the Interrater Reliability of Montana’s CRT-Alternate Prepared by Gail McGregor for the Office of Public Instruction, Linda McCulloch, Superintendent
September 2007
Administration of the CRT-Alt incorporates a response prompting methodology known as the “system of least prompts” (Wolery, Ault & Doyle, 1992). This is a well-established strategy that has been found to be effective as a teaching procedure for students with severe disabilities across a wide range of applications (Doyle, Wolery, Ault & Gast, 1988). The rationale for its use in this testing context is based on the information summarized below.
• Students with severe disabilities often demonstrate skill gains in small increments that would be lost if performance was scored with a dichotomous correct/incorrect response system. For this population of students, learning is typically measured in terms of the amount of support required to produce a correct response. When responses do not occur independently, a structured sequence of prompts allows teachers to consistently present and systematically control the amount of external support provided in a teaching situation. Student learning is measured in terms of increasing levels of independence (i.e., decreased reliance upon external prompts).
The CRT-Alt uses a “least to most” prompt hierarchy. As described by Wolery et al. (1992), the system of least prompts consists of a hierarchy of at least three levels. The first level is the opportunity for a student to respond independently, without external prompts. If that does not occur, a planned sequence of prompts, arranged from the least intrusive to the most intrusive in terms of amount of assistance, is implemented. The final level of the prompt sequence results in an assisted, correct response. For the CRT-Alt, a four level hierarchy has been developed for each test item.
With origins in an applied behavior analysis model of teaching that dates back to the late 1960's and 70's, the prevalence and value of this methodology for students with severe disabilities is unquestioned in the research and practice literature (e.g., Alberto & Troutman, 1995; Demchak, 1990; Falvey, 1986). While much has been learned about effective instruction for students who experience significant challenges to learning since that time, the value of systematic instructional procedures continues to be recognized. The sixth edition of one of the most popular textbooks on teaching students with severe disabilities (Snell & Janney, 2006) continues to emphasize the importance of these very procedures in working with students with severe disabilities.
• Since prompt response systems are a common teaching approach for students with severe
disabilities, teachers are familiar with this methodology and use it on a regular basis. University coursework focused on the needs of students with severe disabilities emphasizes systematic instructional procedures that are grounded in the science of applied behavior analysis. A national review of preservice programs (Ryndak, Clark, Conroy & Stuart, 2001) verifies the importance of this skill set in teacher preparation programs focused on the needs of students with severe disabilities. Because this is an effective and common teaching methodology, the approach to test administration is relatively easy to understand and implement for those experienced in teaching students with severe cognitive disabilities. Most recent data available from the Office of Public Instruction indicate that for the 2005-06 school year, 98.5% of the state’s 750 special educators were reported to be Highly Qualified, suggesting their familiarity with this methodology.
• In the extensive research base about response prompting systems, acceptable levels of
Examining the Interrater Reliability of Montana’s CRT-Alternate Prepared by Gail McGregor for the Office of Public Instruction, Linda McCulloch, Superintendent
September 2007
interrater reliability have been achieved. The use of this and other response prompting methods has been a strategy used in special education research for over thirty-five years. This body of research utilizes single subject research methods (Tawney & Gast, 1984) due to the low incidence and unique characteristics of the participants in these studies. Direct observational data are collected, requiring the use of independent observers to verify the reliability of the observational data. A standard rule of thumb in this type of research is that an average reliability index of 80% is acceptable. Results typically are reporting in the 85-95% range (e.g., Colyer & Collins, 1996; McDonnell, 1987; West & Billingsley, 2005), as the prompting procedures are clearly spelled out, easy to implement, and readily observable. This evidence provides a strong foundation for the selection of this methodology for this assessment context, especially under conditions of tight controls for the training and administration of the measure, as is the case in Montana.
The administration of the CRT-Alt is based upon systematic procedures that are time-tested and evidence-based with the population of students for whom this test is designed. In this application, scaffolding is the term used to describe the least to most prompting process that is consistently and predictably used in the administration of each item. Each test item is carefully scripted, eliminating the need for teachers to determine how to present a question or what should be said. The scaffolding sequence is also scripted, guiding the teacher in a step-by-step manner through the administration of each test item. This same predictable and consistent structure is applied to the scoring of each item. The scaffolding sequence is directly aligned with the scoring rubric for each test item. Finally, there is a requirement that test administrators submit selected pieces of evidence for each student in all subject areas tested. Submission of concrete evidence of student’s performance relative to a specifically designated test item provides a means of checking whether information recorded on evidence templates are consistent with item scores entered on student scoring forms. Collectively, these design features create a standardized structure intended to provide teachers with sufficient support to implement the CRT-Alt with integrity. Other components of OPI’s implementation approach, described in the next section, further support this goal.
Accessibility of Training
For the 2006-07 test administration, the OPI implemented a training plan designed to
address the limitations of large group training formats, conducted over the state’s compressed video system and the internet, used in previous years. There was a general consensus that this training did not reach the intended audience – the actual test administrators. To address this concern, a training package was prepared and included in the Test Materials Kit provided to every test administrator. An Implementation Checklist (see Appendix A) was included in this Kit, indicating that reviewing the test training CD was the first thing that was to be done in preparing for test administration. System Test Coordinators were also alerted to the expectation that test administrators access these training materials prior to test administration.
In order to measure the success of this approach, two questions were included in the
teacher-only section at the end of the test administration booklet. Additional questions were asked in a separate survey document distributed with the test materials, designed to gather
Examining the Interrater Reliability of Montana’s CRT-Alternate Prepared by Gail McGregor for the Office of Public Instruction, Linda McCulloch, Superintendent
September 2007
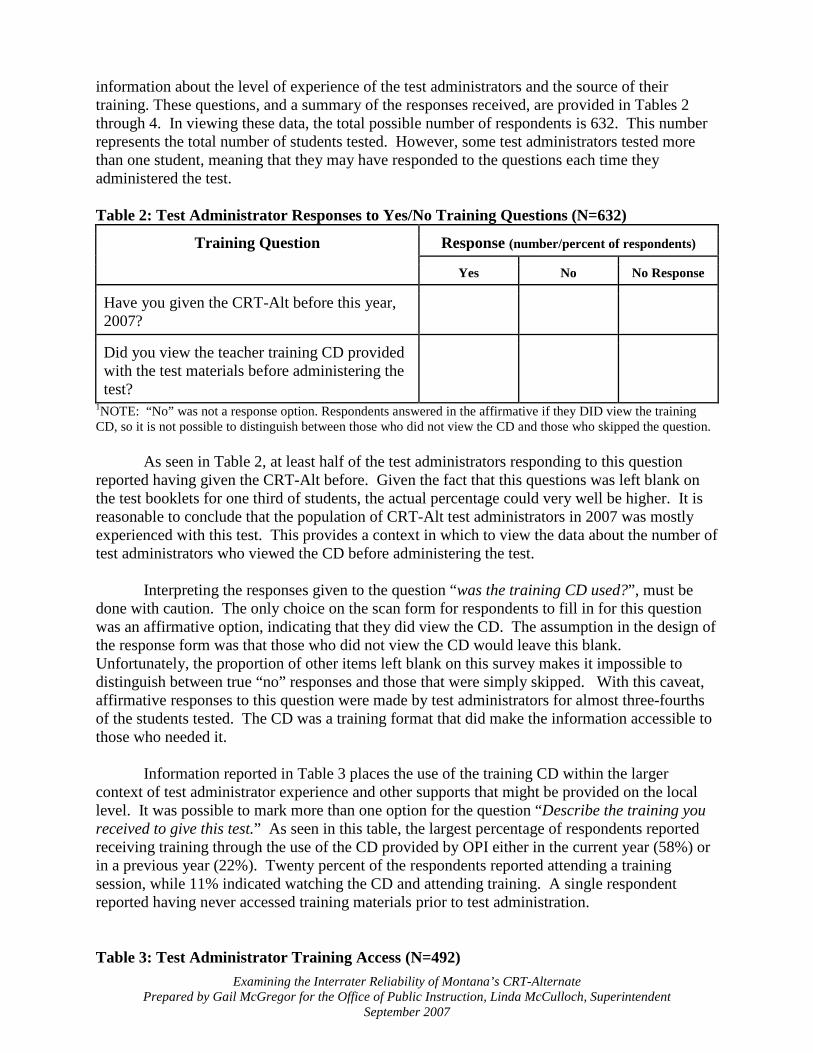
information about the level of experience of the test administrators and the source of their training. These questions, and a summary of the responses received, are provided in Tables 2 through 4. In viewing these data, the total possible number of respondents is 632. This number represents the total number of students tested. However, some test administrators tested more than one student, meaning that they may have responded to the questions each time they administered the test.
Table 2: Test Administrator Responses to Yes/No Training Questions (N=632)
Training Question
Response (number/percent of respondents)
Yes No No Response
Have you given the CRT-Alt before this year, 2007?
Did you view the teacher training CD provided with the test materials before administering the test?
1NOTE: “No” was not a response option. Respondents answered in the affirmative if they DID view the training CD, so it is not possible to distinguish between those who did not view the CD and those who skipped the question.
As seen in Table 2, at least half of the test administrators responding to this question reported having given the CRT-Alt before. Given the fact that this questions was left blank on the test booklets for one third of students, the actual percentage could very well be higher. It is reasonable to conclude that the population of CRT-Alt test administrators in 2007 was mostly experienced with this test. This provides a context in which to view the data about the number of test administrators who viewed the CD before administering the test.
Interpreting the responses given to the question “was the training CD used?”, must be
done with caution. The only choice on the scan form for respondents to fill in for this question was an affirmative option, indicating that they did view the CD. The assumption in the design of the response form was that those who did not view the CD would leave this blank. Unfortunately, the proportion of other items left blank on this survey makes it impossible to distinguish between true “no” responses and those that were simply skipped. With this caveat, affirmative responses to this question were made by test administrators for almost three-fourths of the students tested. The CD was a training format that did make the information accessible to those who needed it.
Information reported in Table 3 places the use of the training CD within the larger
context of test administrator experience and other supports that might be provided on the local level. It was possible to mark more than one option for the question “Describe the training you received to give this test.” As seen in this table, the largest percentage of respondents reported receiving training through the use of the CD provided by OPI either in the current year (58%) or in a previous year (22%). Twenty percent of the respondents reported attending a training session, while 11% indicated watching the CD and attending training. A single respondent reported having never accessed training materials prior to test administration.
Table 3: Test Administrator Training Access (N=492)
Examining the Interrater Reliability of Montana’s CRT-Alternate Prepared by Gail McGregor for the Office of Public Instruction, Linda McCulloch, Superintendent
September 2007
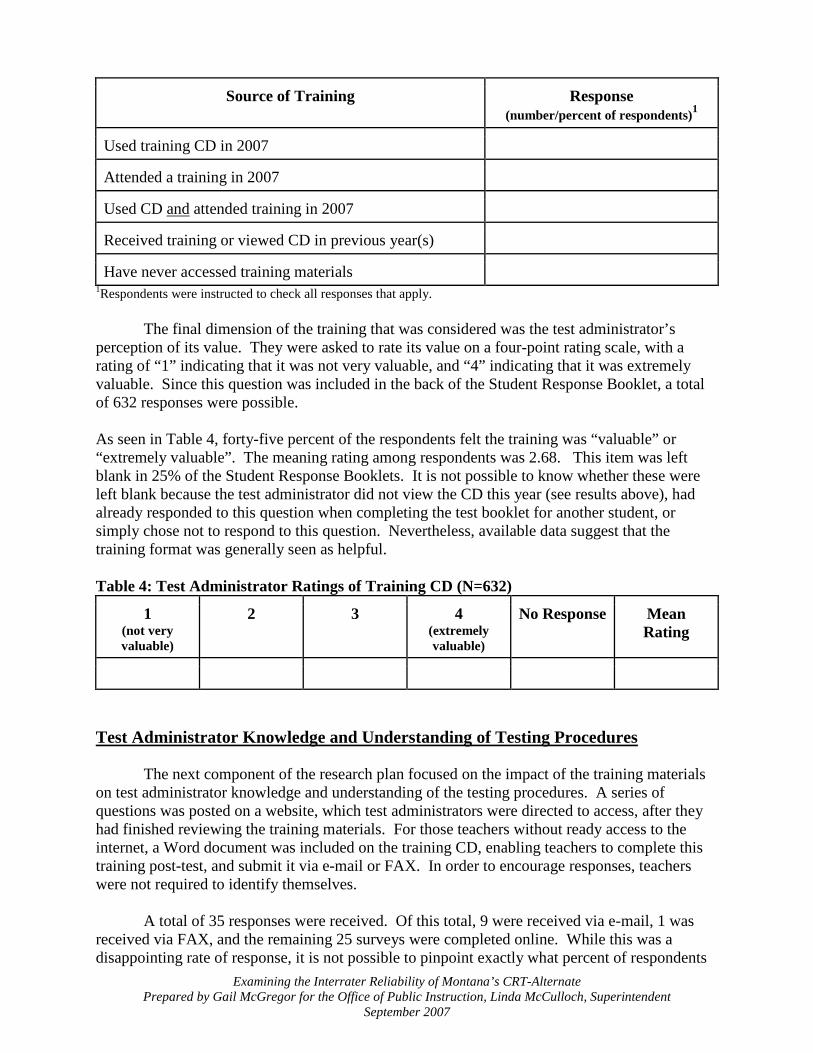
Source of Training Response (number/percent of respondents)1
Used training CD in 2007
Attended a training in 2007
Used CD and attended training in 2007
Received training or viewed CD in previous year(s)
Have never accessed training materials 1Respondents were instructed to check all responses that apply. The final dimension of the training that was considered was the test administrator’s perception of its value. They were asked to rate its value on a four-point rating scale, with a rating of “1” indicating that it was not very valuable, and “4” indicating that it was extremely valuable. Since this question was included in the back of the Student Response Booklet, a total of 632 responses were possible. As seen in Table 4, forty-five percent of the respondents felt the training was “valuable” or “extremely valuable”. The meaning rating among respondents was 2.68. This item was left blank in 25% of the Student Response Booklets. It is not possible to know whether these were left blank because the test administrator did not view the CD this year (see results above), had already responded to this question when completing the test booklet for another student, or simply chose not to respond to this question. Nevertheless, available data suggest that the training format was generally seen as helpful. Table 4: Test Administrator Ratings of Training CD (N=632)
1 (not very valuable)
2 3 4 (extremely valuable)
No Response Mean Rating
Test Administrator Knowledge and Understanding of Testing Procedures
The next component of the research plan focused on the impact of the training materials on test administrator knowledge and understanding of the testing procedures. A series of questions was posted on a website, which test administrators were directed to access, after they had finished reviewing the training materials. For those teachers without ready access to the internet, a Word document was included on the training CD, enabling teachers to complete this training post-test, and submit it via e-mail or FAX. In order to encourage responses, teachers were not required to identify themselves.
A total of 35 responses were received. Of this total, 9 were received via e-mail, 1 was
received via FAX, and the remaining 25 surveys were completed online. While this was a disappointing rate of response, it is not possible to pinpoint exactly what percent of respondents
Examining the Interrater Reliability of Montana’s CRT-Alternate Prepared by Gail McGregor for the Office of Public Instruction, Linda McCulloch, Superintendent
September 2007
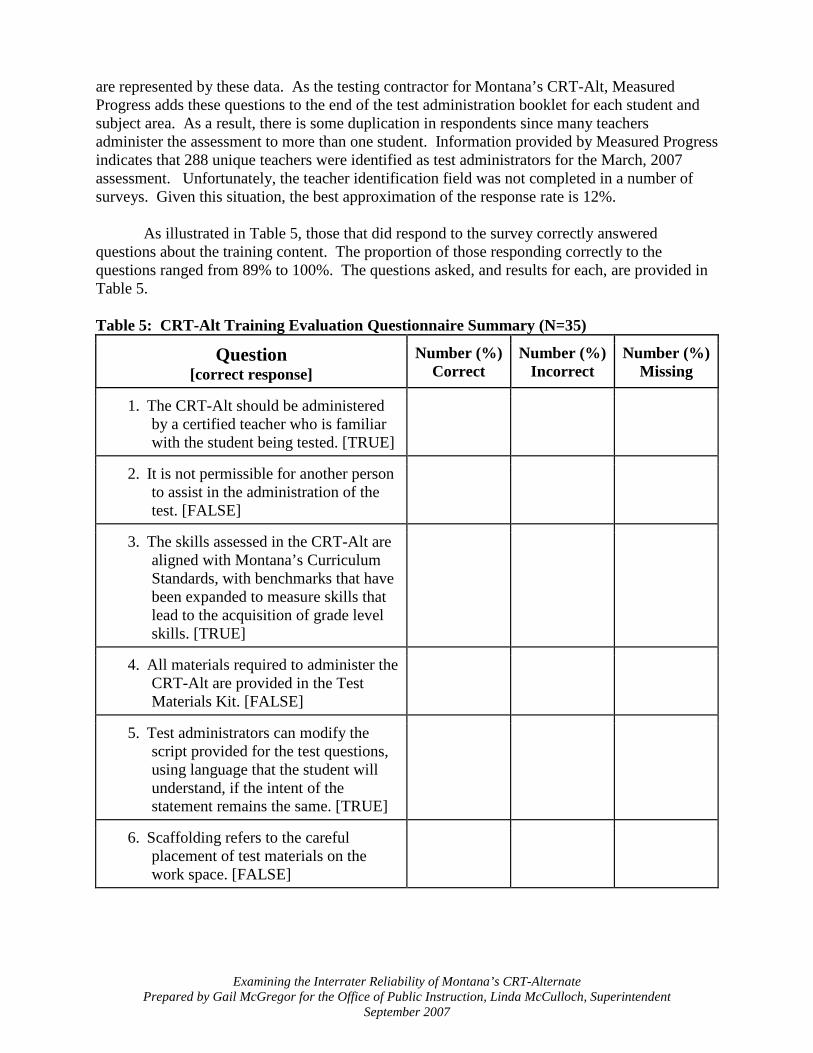
are represented by these data. As the testing contractor for Montana’s CRT-Alt, Measured Progress adds these questions to the end of the test administration booklet for each student and subject area. As a result, there is some duplication in respondents since many teachers administer the assessment to more than one student. Information provided by Measured Progress indicates that 288 unique teachers were identified as test administrators for the March, 2007 assessment. Unfortunately, the teacher identification field was not completed in a number of surveys. Given this situation, the best approximation of the response rate is 12%.
As illustrated in Table 5, those that did respond to the survey correctly answered
questions about the training content. The proportion of those responding correctly to the questions ranged from 89% to 100%. The questions asked, and results for each, are provided in Table 5. Table 5: CRT-Alt Training Evaluation Questionnaire Summary (N=35)
Question [correct response]
Number (%) Correct
Number (%) Incorrect
Number (%) Missing
1. The CRT-Alt should be administered by a certified teacher who is familiar with the student being tested. [TRUE]
2. It is not permissible for another person to assist in the administration of the test. [FALSE]
3. The skills assessed in the CRT-Alt are aligned with Montana’s Curriculum Standards, with benchmarks that have been expanded to measure skills that lead to the acquisition of grade level skills. [TRUE]
4. All materials required to administer the CRT-Alt are provided in the Test Materials Kit. [FALSE]
5. Test administrators can modify the script provided for the test questions, using language that the student will understand, if the intent of the statement remains the same. [TRUE]
6. Scaffolding refers to the careful placement of test materials on the work space. [FALSE]
Examining the Interrater Reliability of Montana’s CRT-Alternate Prepared by Gail McGregor for the Office of Public Instruction, Linda McCulloch, Superintendent
September 2007
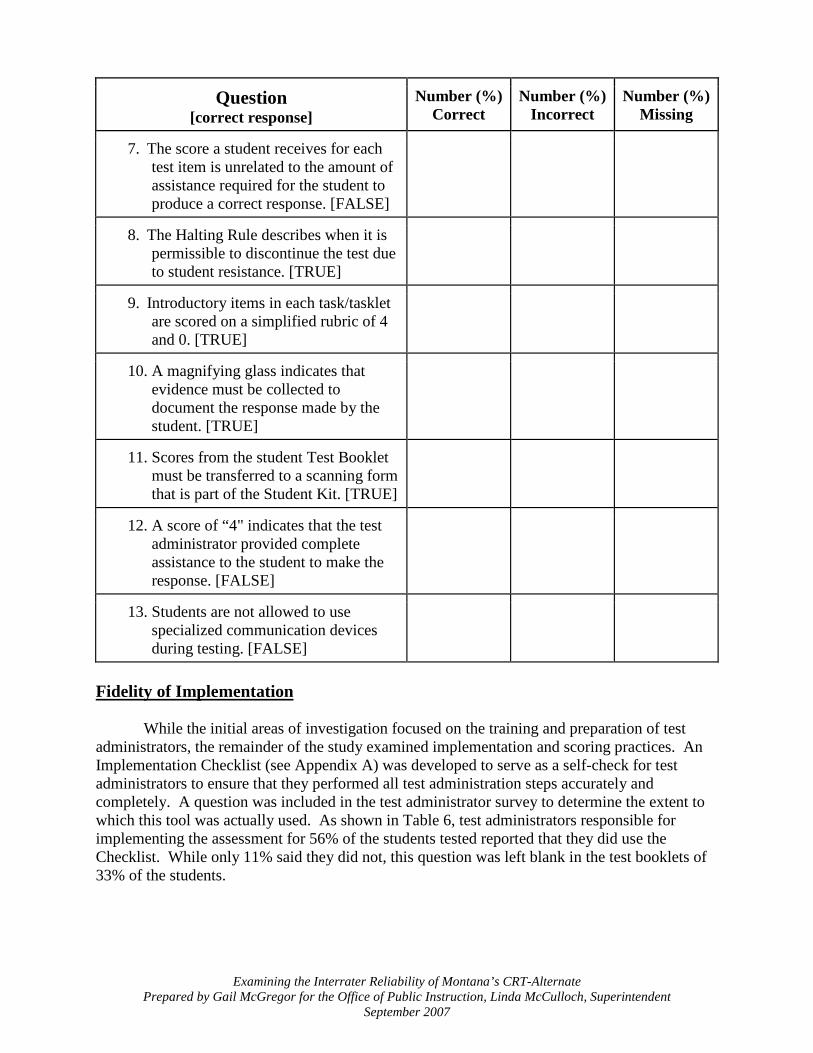
Question [correct response]
Number (%) Correct
Number (%) Incorrect
Number (%) Missing
7. The score a student receives for each test item is unrelated to the amount of assistance required for the student to produce a correct response. [FALSE]
8. The Halting Rule describes when it is permissible to discontinue the test due to student resistance. [TRUE]
9. Introductory items in each task/tasklet are scored on a simplified rubric of 4 and 0. [TRUE]
10. A magnifying glass indicates that evidence must be collected to document the response made by the student. [TRUE]
11. Scores from the student Test Booklet must be transferred to a scanning form that is part of the Student Kit. [TRUE]
12. A score of “4" indicates that the test administrator provided complete assistance to the student to make the response. [FALSE]
13. Students are not allowed to use specialized communication devices during testing. [FALSE]
Fidelity of Implementation While the initial areas of investigation focused on the training and preparation of test administrators, the remainder of the study examined implementation and scoring practices. An Implementation Checklist (see Appendix A) was developed to serve as a self-check for test administrators to ensure that they performed all test administration steps accurately and completely. A question was included in the test administrator survey to determine the extent to which this tool was actually used. As shown in Table 6, test administrators responsible for implementing the assessment for 56% of the students tested reported that they did use the Checklist. While only 11% said they did not, this question was left blank in the test booklets of 33% of the students.
Examining the Interrater Reliability of Montana’s CRT-Alternate Prepared by Gail McGregor for the Office of Public Instruction, Linda McCulloch, Superintendent
September 2007
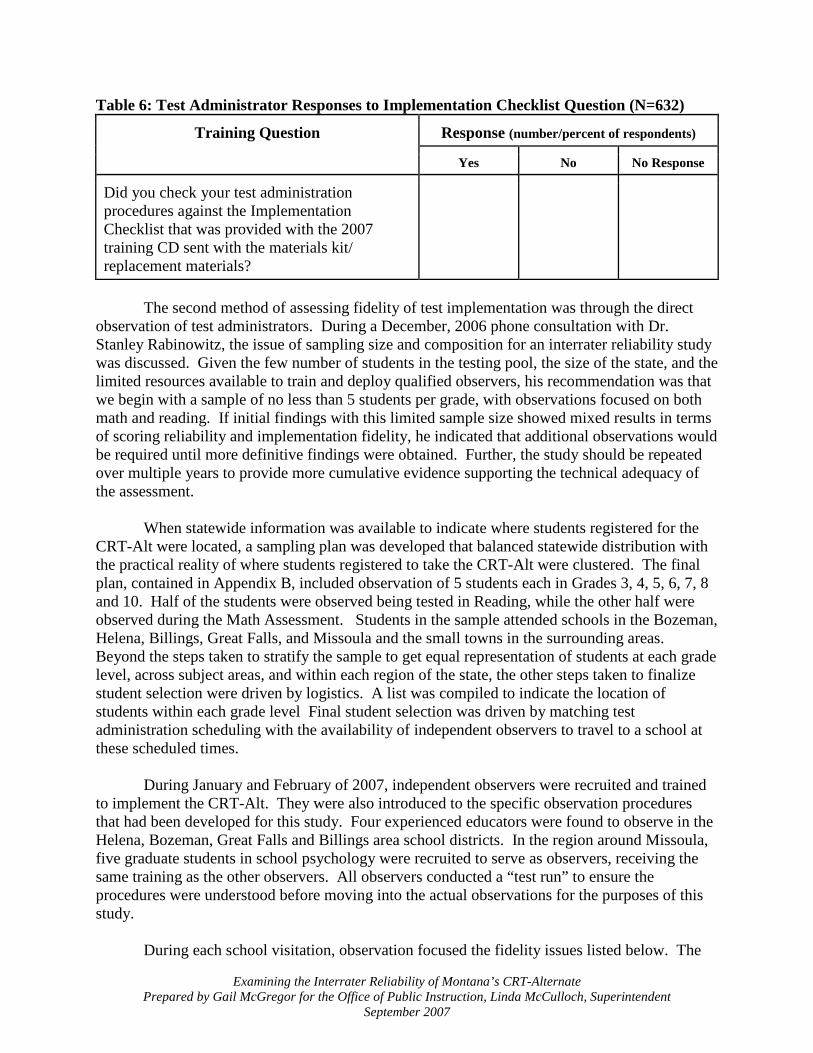
Table 6: Test Administrator Responses to Implementation Checklist Question (N=632)
Training Question
Response (number/percent of respondents)
Yes No No Response
Did you check your test administration procedures against the Implementation Checklist that was provided with the 2007 training CD sent with the materials kit/ replacement materials?
The second method of assessing fidelity of test implementation was through the direct
observation of test administrators. During a December, 2006 phone consultation with Dr. Stanley Rabinowitz, the issue of sampling size and composition for an interrater reliability study was discussed. Given the few number of students in the testing pool, the size of the state, and the limited resources available to train and deploy qualified observers, his recommendation was that we begin with a sample of no less than 5 students per grade, with observations focused on both math and reading. If initial findings with this limited sample size showed mixed results in terms of scoring reliability and implementation fidelity, he indicated that additional observations would be required until more definitive findings were obtained. Further, the study should be repeated over multiple years to provide more cumulative evidence supporting the technical adequacy of the assessment. When statewide information was available to indicate where students registered for the CRT-Alt were located, a sampling plan was developed that balanced statewide distribution with the practical reality of where students registered to take the CRT-Alt were clustered. The final plan, contained in Appendix B, included observation of 5 students each in Grades 3, 4, 5, 6, 7, 8 and 10. Half of the students were observed being tested in Reading, while the other half were observed during the Math Assessment. Students in the sample attended schools in the Bozeman, Helena, Billings, Great Falls, and Missoula and the small towns in the surrounding areas. Beyond the steps taken to stratify the sample to get equal representation of students at each grade level, across subject areas, and within each region of the state, the other steps taken to finalize student selection were driven by logistics. A list was compiled to indicate the location of students within each grade level Final student selection was driven by matching test administration scheduling with the availability of independent observers to travel to a school at these scheduled times. During January and February of 2007, independent observers were recruited and trained to implement the CRT-Alt. They were also introduced to the specific observation procedures that had been developed for this study. Four experienced educators were found to observe in the Helena, Bozeman, Great Falls and Billings area school districts. In the region around Missoula, five graduate students in school psychology were recruited to serve as observers, receiving the same training as the other observers. All observers conducted a “test run” to ensure the procedures were understood before moving into the actual observations for the purposes of this study. During each school visitation, observation focused the fidelity issues listed below. The
Examining the Interrater Reliability of Montana’s CRT-Alternate Prepared by Gail McGregor for the Office of Public Instruction, Linda McCulloch, Superintendent
September 2007
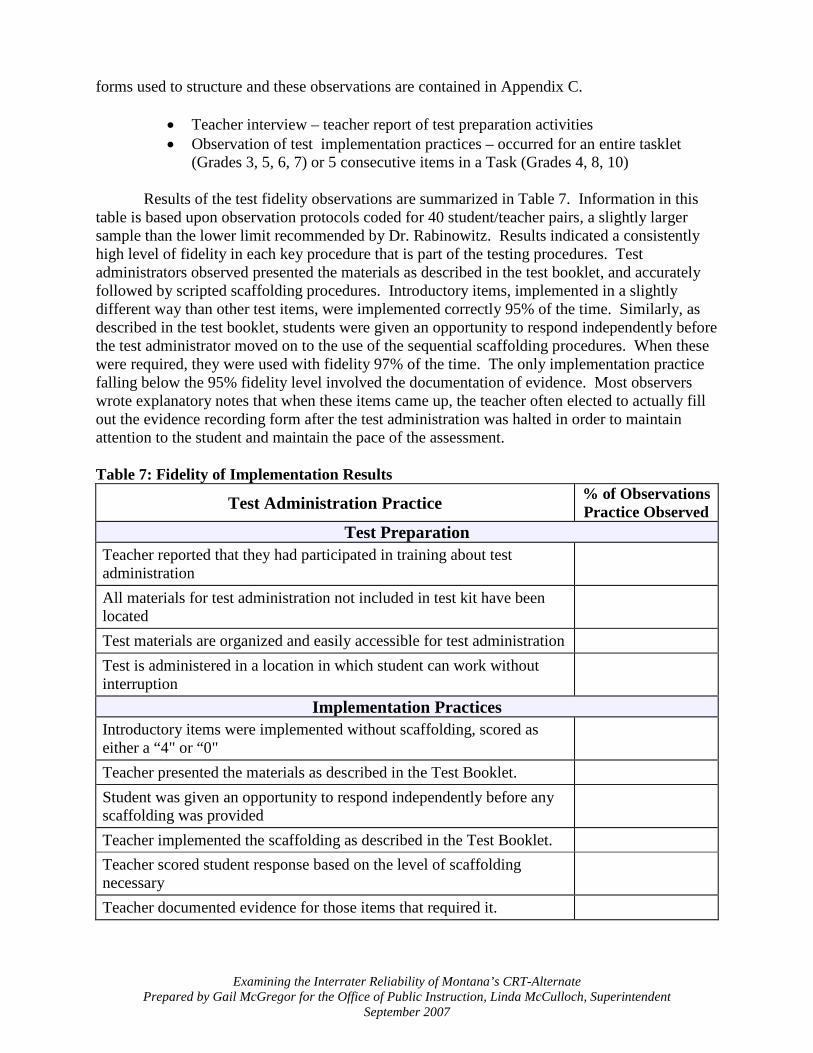
forms used to structure and these observations are contained in Appendix C.
• Teacher interview – teacher report of test preparation activities • Observation of test implementation practices – occurred for an entire tasklet
(Grades 3, 5, 6, 7) or 5 consecutive items in a Task (Grades 4, 8, 10)
Results of the test fidelity observations are summarized in Table 7. Information in this table is based upon observation protocols coded for 40 student/teacher pairs, a slightly larger sample than the lower limit recommended by Dr. Rabinowitz. Results indicated a consistently high level of fidelity in each key procedure that is part of the testing procedures. Test administrators observed presented the materials as described in the test booklet, and accurately followed by scripted scaffolding procedures. Introductory items, implemented in a slightly different way than other test items, were implemented correctly 95% of the time. Similarly, as described in the test booklet, students were given an opportunity to respond independently before the test administrator moved on to the use of the sequential scaffolding procedures. When these were required, they were used with fidelity 97% of the time. The only implementation practice falling below the 95% fidelity level involved the documentation of evidence. Most observers wrote explanatory notes that when these items came up, the teacher often elected to actually fill out the evidence recording form after the test administration was halted in order to maintain attention to the student and maintain the pace of the assessment. Table 7: Fidelity of Implementation Results
Test Administration Practice % of Observations Practice Observed
Test Preparation Teacher reported that they had participated in training about test administration
All materials for test administration not included in test kit have been located
Test materials are organized and easily accessible for test administration
Test is administered in a location in which student can work without interruption
Implementation Practices Introductory items were implemented without scaffolding, scored as either a “4" or “0"
Teacher presented the materials as described in the Test Booklet.
Student was given an opportunity to respond independently before any scaffolding was provided
Teacher implemented the scaffolding as described in the Test Booklet.
Teacher scored student response based on the level of scaffolding necessary
Teacher documented evidence for those items that required it.
Examining the Interrater Reliability of Montana’s CRT-Alternate Prepared by Gail McGregor for the Office of Public Instruction, Linda McCulloch, Superintendent
September 2007
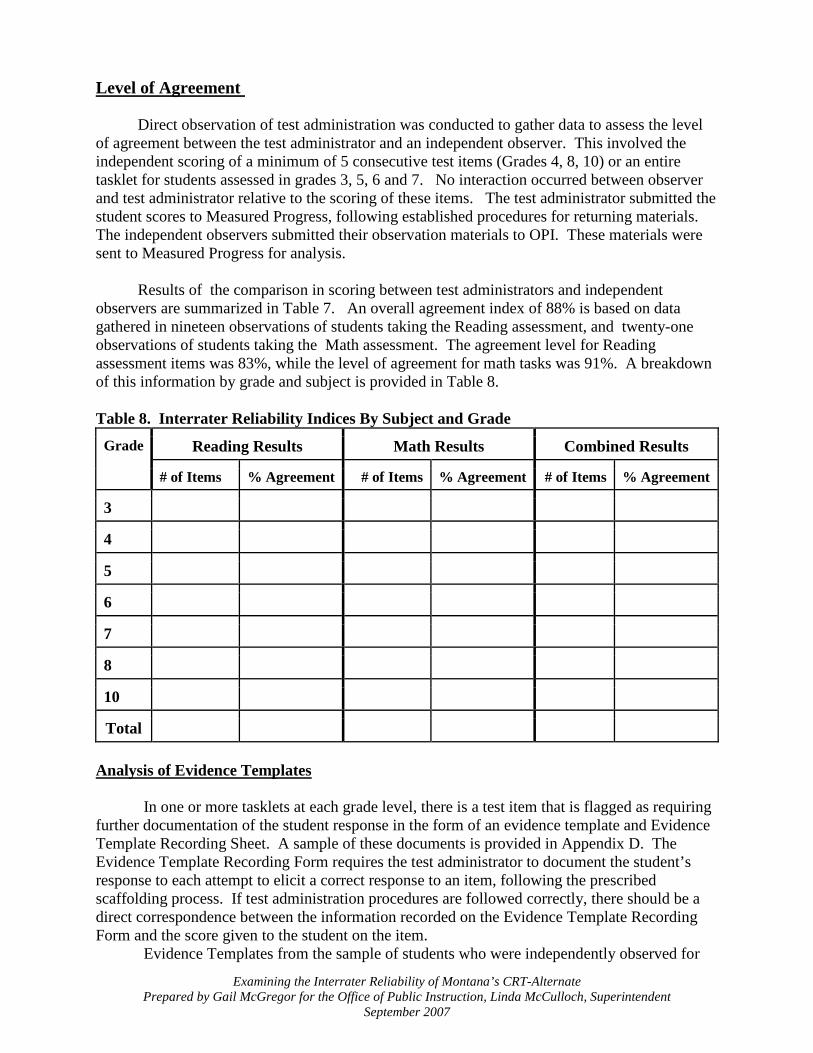
Level of Agreement
Direct observation of test administration was conducted to gather data to assess the level of agreement between the test administrator and an independent observer. This involved the independent scoring of a minimum of 5 consecutive test items (Grades 4, 8, 10) or an entire tasklet for students assessed in grades 3, 5, 6 and 7. No interaction occurred between observer and test administrator relative to the scoring of these items. The test administrator submitted the student scores to Measured Progress, following established procedures for returning materials. The independent observers submitted their observation materials to OPI. These materials were sent to Measured Progress for analysis.
Results of the comparison in scoring between test administrators and independent
observers are summarized in Table 7. An overall agreement index of 88% is based on data gathered in nineteen observations of students taking the Reading assessment, and twenty-one observations of students taking the Math assessment. The agreement level for Reading assessment items was 83%, while the level of agreement for math tasks was 91%. A breakdown of this information by grade and subject is provided in Table 8. Table 8. Interrater Reliability Indices By Subject and Grade
Grade
Reading Results Math Results Combined Results
# of Items % Agreement # of Items % Agreement # of Items % Agreement
3
4
5
6
7
8
10
Total
Analysis of Evidence Templates In one or more tasklets at each grade level, there is a test item that is flagged as requiring further documentation of the student response in the form of an evidence template and Evidence Template Recording Sheet. A sample of these documents is provided in Appendix D. The Evidence Template Recording Form requires the test administrator to document the student’s response to each attempt to elicit a correct response to an item, following the prescribed scaffolding process. If test administration procedures are followed correctly, there should be a direct correspondence between the information recorded on the Evidence Template Recording Form and the score given to the student on the item. Evidence Templates from the sample of students who were independently observed for
Examining the Interrater Reliability of Montana’s CRT-Alternate Prepared by Gail McGregor for the Office of Public Instruction, Linda McCulloch, Superintendent
September 2007
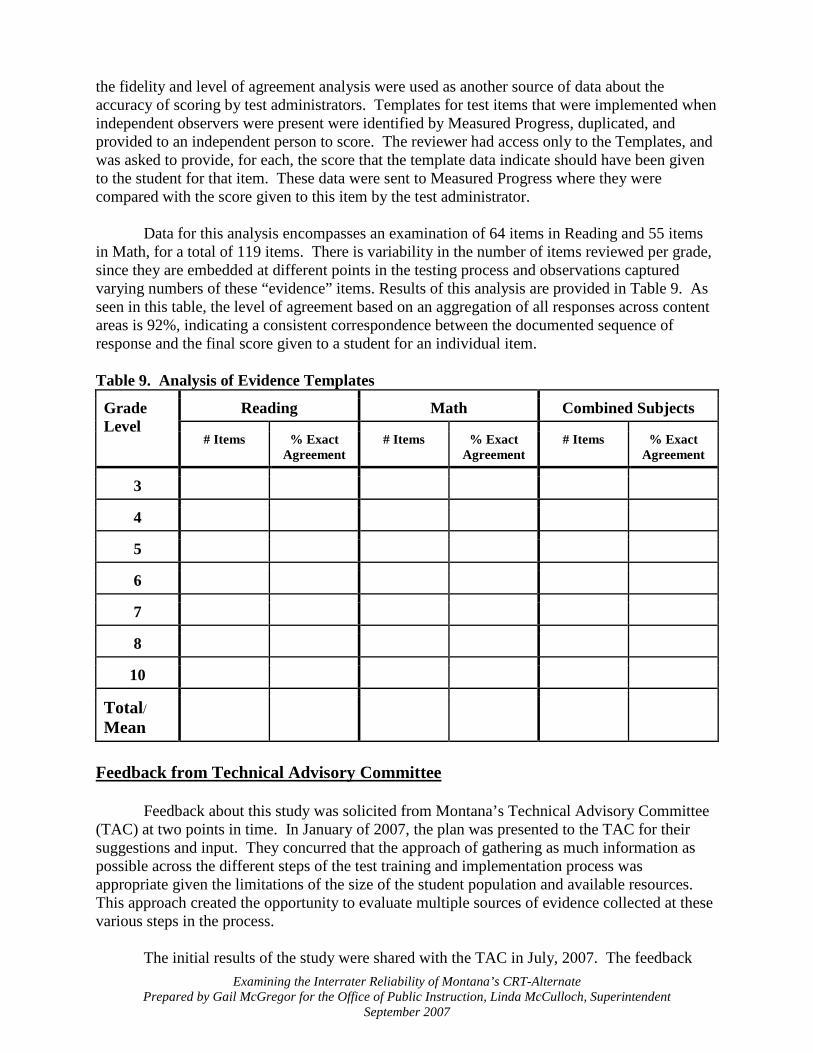
the fidelity and level of agreement analysis were used as another source of data about the accuracy of scoring by test administrators. Templates for test items that were implemented when independent observers were present were identified by Measured Progress, duplicated, and provided to an independent person to score. The reviewer had access only to the Templates, and was asked to provide, for each, the score that the template data indicate should have been given to the student for that item. These data were sent to Measured Progress where they were compared with the score given to this item by the test administrator. Data for this analysis encompasses an examination of 64 items in Reading and 55 items in Math, for a total of 119 items. There is variability in the number of items reviewed per grade, since they are embedded at different points in the testing process and observations captured varying numbers of these “evidence” items. Results of this analysis are provided in Table 9. As seen in this table, the level of agreement based on an aggregation of all responses across content areas is 92%, indicating a consistent correspondence between the documented sequence of response and the final score given to a student for an individual item. Table 9. Analysis of Evidence Templates
Grade Level
Reading Math Combined Subjects
# Items % Exact Agreement
# Items % Exact Agreement
# Items % Exact Agreement
3
4
5
6
7
8
10
Total/ Mean
Feedback from Technical Advisory Committee Feedback about this study was solicited from Montana’s Technical Advisory Committee (TAC) at two points in time. In January of 2007, the plan was presented to the TAC for their suggestions and input. They concurred that the approach of gathering as much information as possible across the different steps of the test training and implementation process was appropriate given the limitations of the size of the student population and available resources. This approach created the opportunity to evaluate multiple sources of evidence collected at these various steps in the process. The initial results of the study were shared with the TAC in July, 2007. The feedback
Examining the Interrater Reliability of Montana’s CRT-Alternate Prepared by Gail McGregor for the Office of Public Instruction, Linda McCulloch, Superintendent
September 2007
received at that time was that the process implemented was sound, representing more than a study of the CRT-Alt’s inter-rater reliability. The picture that emerges from putting together all of the information gathered during this study is that the process and procedures used for Montana’s CRT-Alt appear sound. Comments suggested that the level of scripting provided for the item implementation and scaffolding was very good, likely contributing to the positive results in relation to both implementation fidelity and scoring reliability of the CRT-Alt. Summary and Conclusions This study examined the entire process involved in the implementation of the CRT-Alt by test administrators in Montana. From the point at which materials are received and reviewed by the test administrators through the actual implementation and scoring of the test, data were gathered to evaluate current procedures and associated outcomes. Concluding remarks, including recommendations for future evaluation, are provided relative to each area examined in this study.
• The test design incorporates evidence-based implementation approaches that are appropriate for the group of students who are eligible for an alternate assessment under NCLB guidelines. The format achieves a good and necessary balance between the flexibility needed to address the individual needs of students and the structured, scripted method used to guide the test administrator through the item presentation, scaffolding, and scoring processes.
• The current format of the training, available on a CD that can used by a test
administrator at his/her convenience, appears to be a viable method of getting the basic information about test administration out to the people who need it. While the static nature of this form of training is not ideal, test administrator ratings indicate that it is seen an efficient way of imparting necessary information. Since the data indicate that only a small proportion of test administrators receive training in any other form, additional opportunities for training that is more interactive merits consideration as a supplement to the Training CD approach, demonstrated to be effective in reaching test administrators.
• There are some mechanical issues about the way in which the training and teacher
survey data are collected that need to be examined for future administrations. Given the number of test administrators that give the test to multiple students, it would be beneficial to identify a way to collect survey data so that these test administrators see and/or respond to the questions only once. This would help to reduce the loss of information when a sizeable proportion of questions are left blank.
• Self-check tools such as the Implementation Checklist appear to be beneficial. They
do not have much of an associated “cost” in terms of time or materials, and provide a comprehensive list of the entire process in a single place. Continuation of this practice is recommended.
• The results of the direct observation of a sample of test administrators were very
positive. They suggest that the supports built into the current test administration protocols are sufficient to yield consistent implementation practices and scoring. As
Examining the Interrater Reliability of Montana’s CRT-Alternate Prepared by Gail McGregor for the Office of Public Instruction, Linda McCulloch, Superintendent
September 2007
resources are available, repeating this approach in other parts of the state or with larger samples may be warranted. The next issue to consider is the generalization and maintenance of this level of fidelity across time, as Science assessments are introduced in the next testing cycle. Given the utility of the observation methodology used this year, it is worth considering the use of this methodology to conduct “spot checks” to evaluate maintenance of implementation fidelity and scoring reliability in future years.
• The evaluation of Evidence Templates provides another opportunity for period “spot
checks” in a manner that is not too costly in terms of additional time and resources. Conducting this type of analysis on a random sample of students across time is suggested, given the fact that the data are readily available.
In conclusion, the preponderance of evidence gathered in this study confirms the integrity of the CRT-Alt procedures currently in use in Montana. An appropriate “next step” is to determine how to fine tune the collection of the range of data considered in this study to address the identified data collection limitations, and to develop an implementation plan that allows for periodic maintenance probes to verify that these results continue over time.
Examining the Interrater Reliability of Montana’s CRT-Alternate Prepared by Gail McGregor for the Office of Public Instruction, Linda McCulloch, Superintendent
September 2007
References Alberto, P., & Troutman, A. C. (1995). Applied behavior analysis for teachers (4th ed.). Upper
Saddle River, NJ: Merrill/Prentice Hall. Colyer, S., & Collins, B. (1996). Using natural cues within prompt levels to teach the next dollar
strategy to students with disabilities. The Journal of Special Education, 30(3), 305-318. Demchak, M. (1990). Response prompting and fading methods: A review. American Journal on
Mental Retardation, 94, 603-615. Doyle, P. M., Wolery, M., Ault, M. J., & Gast, D. L. (1988). System of least prompts: A
literature review of procedural parameters. Journal of the Association for the Severely Handicapped, 13(1), 28-40.
Falvey, M. (1986). Community-based curriculum. Instructional strategies for students with
severe handicaps. Baltimore: Paul H. Brookes Publishing. McDonnell, J. (1987). The effects of time delay and increasing prompt hierarchy strategies on
the acquisition of purchasing skills by students with severe handicaps. Journal of the Association for the Severely Handicapped, 12(3), 227-236.
Ryndak, D. L., Clark, D., Conroy, M., & Stuart, C. H. (2001). Preparing teachers to meet the
needs of students with severe disabilities: Program configuration and expertise. Journal of the Association for Persons with Severe Handicaps, 26(2), 96-105.
Snell, M. E., & Brown, F. (2006). Instruction of students with severe disabilities (5th ed.).
Upper Saddle River, NJ: Merrill. Tawney, J. W., & Gast, D. L. (1984). Single subject research in special education. Columbus,
OH: Charles E. Merrill Publishing Company. West, E.A., & Billingsley, F. (2005). Improving the system of least prompts: A comparison of
procedural variations. Education and Training in Developmental Disabilities, 40(2), 131-144. Wolery, M., Ault, M. J., & Doyle, P. M. (1992). Teaching students with moderate to severe
disabilities. New York: Longman.
Examining the Interrater Reliability of Montana’s CRT-Alternate Prepared by Gail McGregor for the Office of Public Instruction, Linda McCulloch, Superintendent
September 2007
APPENDIX E—RELEASED PERFORMANCE LEVEL INDICATORS
Appendix E—Released Performance Level
Indicators 1 2015–16 Montana CRT-Alternate Technical Report

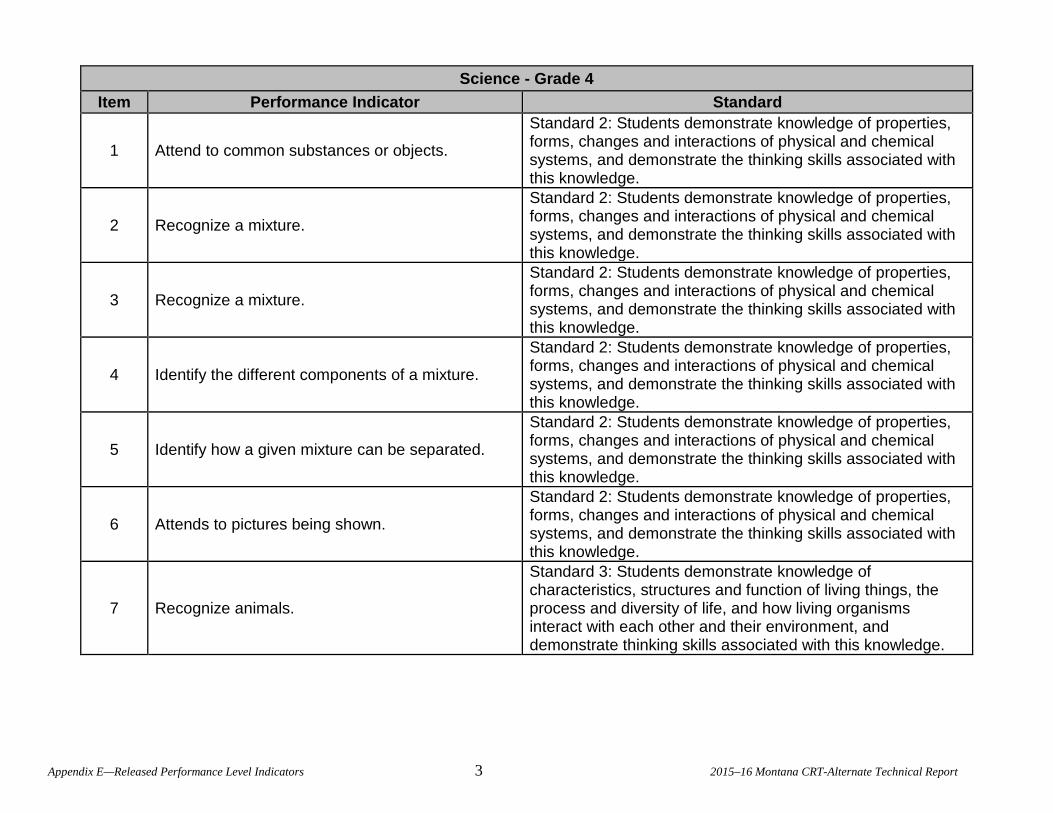
Science - Grade 4 Item Performance Indicator Standard
1 Attend to common substances or objects.
Standard 2: Students demonstrate knowledge of properties, forms, changes and interactions of physical and chemical systems, and demonstrate the thinking skills associated with this knowledge.
2 Recognize a mixture.
Standard 2: Students demonstrate knowledge of properties, forms, changes and interactions of physical and chemical systems, and demonstrate the thinking skills associated with this knowledge.
3 Recognize a mixture.
Standard 2: Students demonstrate knowledge of properties, forms, changes and interactions of physical and chemical systems, and demonstrate the thinking skills associated with this knowledge.
4 Identify the different components of a mixture.
Standard 2: Students demonstrate knowledge of properties, forms, changes and interactions of physical and chemical systems, and demonstrate the thinking skills associated with this knowledge.
5 Identify how a given mixture can be separated.
Standard 2: Students demonstrate knowledge of properties, forms, changes and interactions of physical and chemical systems, and demonstrate the thinking skills associated with this knowledge.
6 Attends to pictures being shown.
Standard 2: Students demonstrate knowledge of properties, forms, changes and interactions of physical and chemical systems, and demonstrate the thinking skills associated with this knowledge.
7 Recognize animals.
Standard 3: Students demonstrate knowledge of characteristics, structures and function of living things, the process and diversity of life, and how living organisms interact with each other and their environment, and demonstrate thinking skills associated with this knowledge.
Appendix E—Released Performance Level Indicators 3 2015–16 Montana CRT-Alternate Technical Report
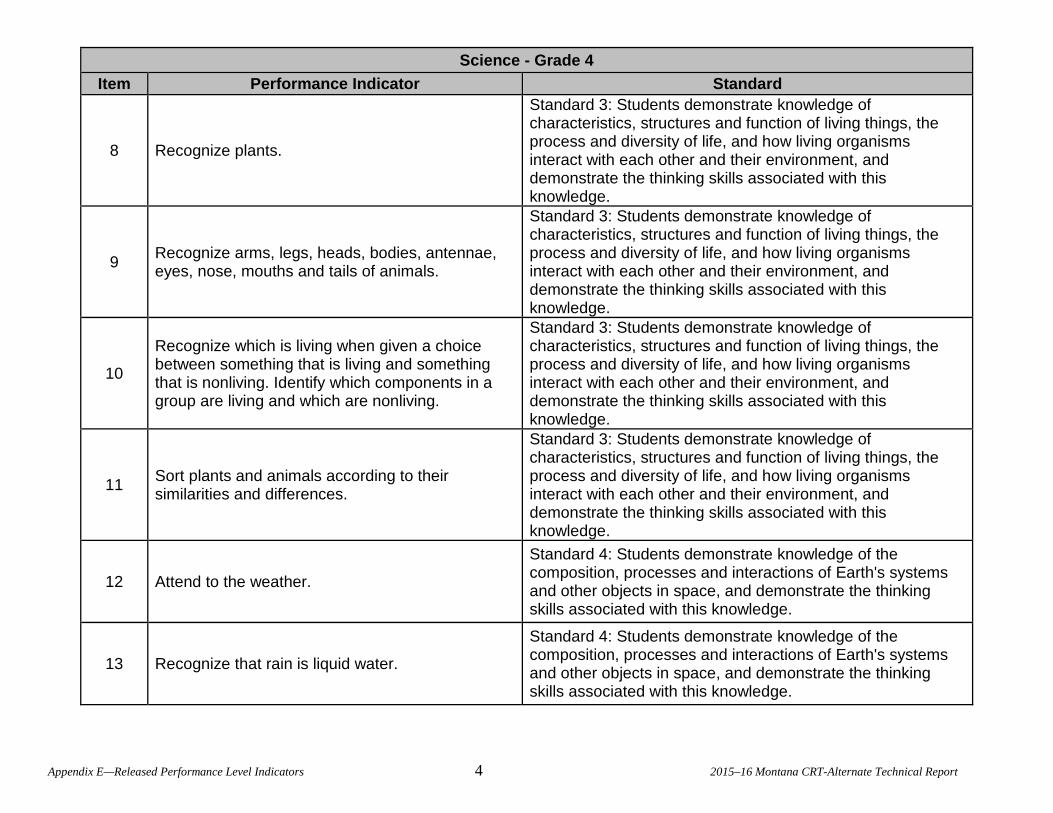
Science - Grade 4 Item Performance Indicator Standard
8 Recognize plants.
Standard 3: Students demonstrate knowledge of characteristics, structures and function of living things, the process and diversity of life, and how living organisms interact with each other and their environment, and demonstrate the thinking skills associated with this knowledge.
9 Recognize arms, legs, heads, bodies, antennae, eyes, nose, mouths and tails of animals.
Standard 3: Students demonstrate knowledge of characteristics, structures and function of living things, the process and diversity of life, and how living organisms interact with each other and their environment, and demonstrate the thinking skills associated with this knowledge.
10
Recognize which is living when given a choice between something that is living and something that is nonliving. Identify which components in a group are living and which are nonliving.
Standard 3: Students demonstrate knowledge of characteristics, structures and function of living things, the process and diversity of life, and how living organisms interact with each other and their environment, and demonstrate the thinking skills associated with this knowledge.
11 Sort plants and animals according to their similarities and differences.
Standard 3: Students demonstrate knowledge of characteristics, structures and function of living things, the process and diversity of life, and how living organisms interact with each other and their environment, and demonstrate the thinking skills associated with this knowledge.
12 Attend to the weather.
Standard 4: Students demonstrate knowledge of the composition, processes and interactions of Earth's systems and other objects in space, and demonstrate the thinking skills associated with this knowledge.
13 Recognize that rain is liquid water.
Standard 4: Students demonstrate knowledge of the composition, processes and interactions of Earth's systems and other objects in space, and demonstrate the thinking skills associated with this knowledge.
Appendix E—Released Performance Level Indicators 4 2015–16 Montana CRT-Alternate Technical Report
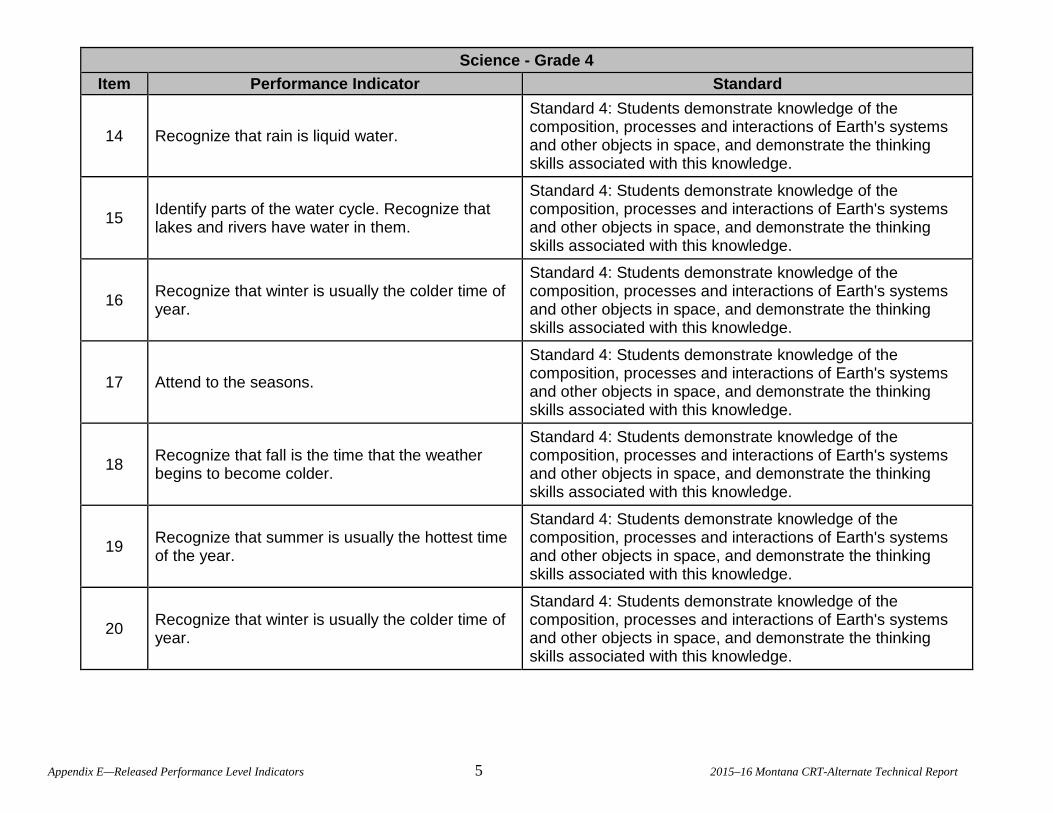
Science - Grade 4 Item Performance Indicator Standard
14 Recognize that rain is liquid water.
Standard 4: Students demonstrate knowledge of the composition, processes and interactions of Earth's systems and other objects in space, and demonstrate the thinking skills associated with this knowledge.
15 Identify parts of the water cycle. Recognize that lakes and rivers have water in them.
Standard 4: Students demonstrate knowledge of the composition, processes and interactions of Earth's systems and other objects in space, and demonstrate the thinking skills associated with this knowledge.
16 Recognize that winter is usually the colder time of year.
Standard 4: Students demonstrate knowledge of the composition, processes and interactions of Earth's systems and other objects in space, and demonstrate the thinking skills associated with this knowledge.
17 Attend to the seasons.
Standard 4: Students demonstrate knowledge of the composition, processes and interactions of Earth's systems and other objects in space, and demonstrate the thinking skills associated with this knowledge.
18 Recognize that fall is the time that the weather begins to become colder.
Standard 4: Students demonstrate knowledge of the composition, processes and interactions of Earth's systems and other objects in space, and demonstrate the thinking skills associated with this knowledge.
19 Recognize that summer is usually the hottest time of the year.
Standard 4: Students demonstrate knowledge of the composition, processes and interactions of Earth's systems and other objects in space, and demonstrate the thinking skills associated with this knowledge.
20 Recognize that winter is usually the colder time of year.
Standard 4: Students demonstrate knowledge of the composition, processes and interactions of Earth's systems and other objects in space, and demonstrate the thinking skills associated with this knowledge.
Appendix E—Released Performance Level Indicators 5 2015–16 Montana CRT-Alternate Technical Report
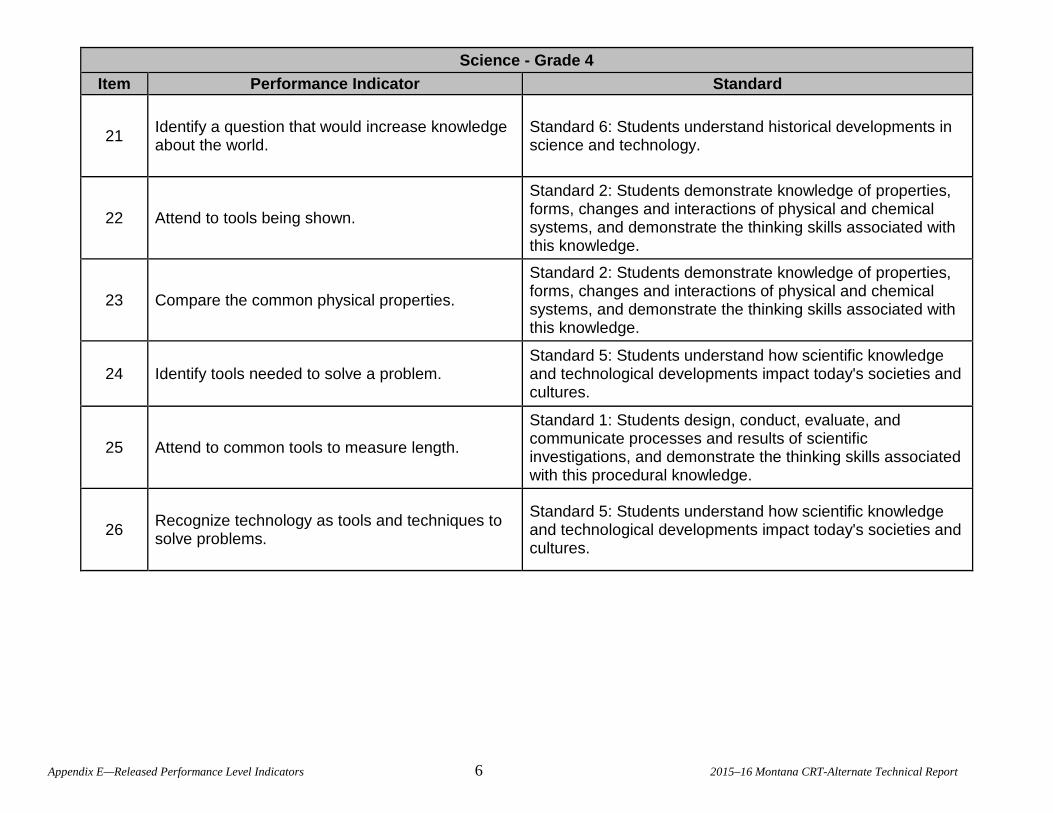
Science - Grade 4 Item Performance Indicator Standard
21 Identify a question that would increase knowledge about the world.
Standard 6: Students understand historical developments in science and technology.
22 Attend to tools being shown.
Standard 2: Students demonstrate knowledge of properties, forms, changes and interactions of physical and chemical systems, and demonstrate the thinking skills associated with this knowledge.
23 Compare the common physical properties.
Standard 2: Students demonstrate knowledge of properties, forms, changes and interactions of physical and chemical systems, and demonstrate the thinking skills associated with this knowledge.
24 Identify tools needed to solve a problem. Standard 5: Students understand how scientific knowledge and technological developments impact today's societies and cultures.
25 Attend to common tools to measure length.
Standard 1: Students design, conduct, evaluate, and communicate processes and results of scientific investigations, and demonstrate the thinking skills associated with this procedural knowledge.
26 Recognize technology as tools and techniques to solve problems.
Standard 5: Students understand how scientific knowledge and technological developments impact today's societies and cultures.
Appendix E—Released Performance Level Indicators 6 2015–16 Montana CRT-Alternate Technical Report
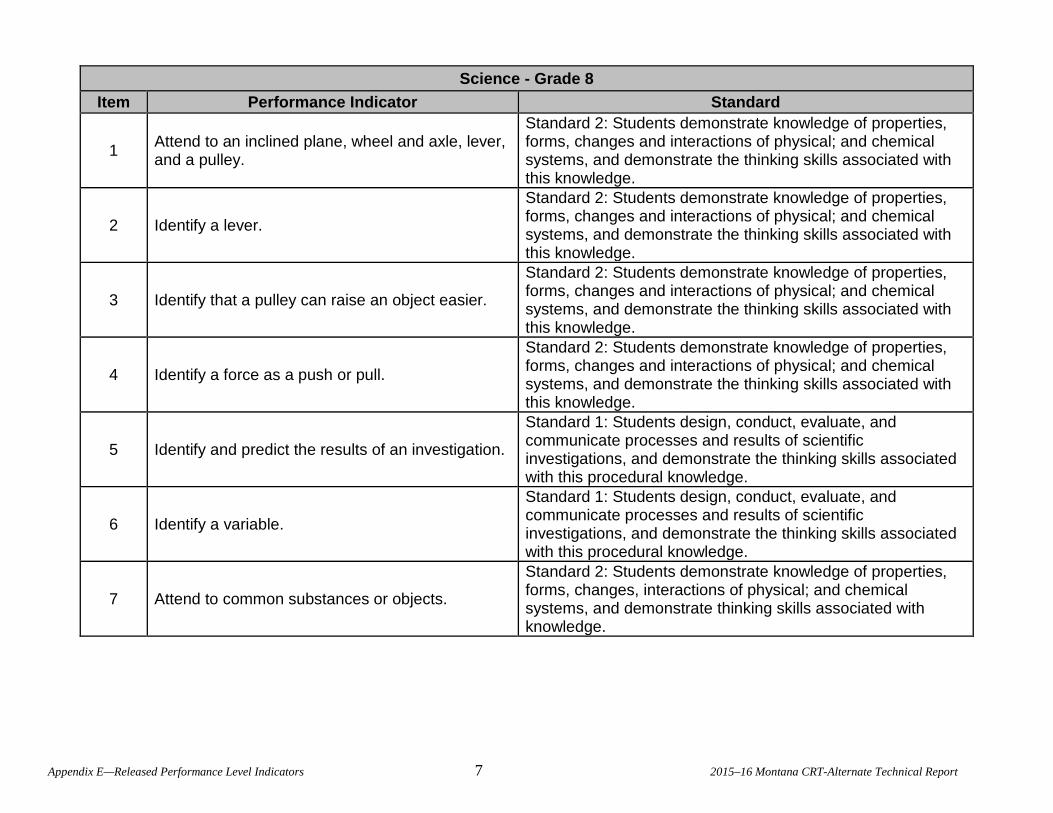
Science - Grade 8 Item Performance Indicator Standard
1 Attend to an inclined plane, wheel and axle, lever, and a pulley.
Standard 2: Students demonstrate knowledge of properties, forms, changes and interactions of physical; and chemical systems, and demonstrate the thinking skills associated with this knowledge.
2 Identify a lever.
Standard 2: Students demonstrate knowledge of properties, forms, changes and interactions of physical; and chemical systems, and demonstrate the thinking skills associated with this knowledge.
3 Identify that a pulley can raise an object easier.
Standard 2: Students demonstrate knowledge of properties, forms, changes and interactions of physical; and chemical systems, and demonstrate the thinking skills associated with this knowledge.
4 Identify a force as a push or pull.
Standard 2: Students demonstrate knowledge of properties, forms, changes and interactions of physical; and chemical systems, and demonstrate the thinking skills associated with this knowledge.
5 Identify and predict the results of an investigation.
Standard 1: Students design, conduct, evaluate, and communicate processes and results of scientific investigations, and demonstrate the thinking skills associated with this procedural knowledge.
6 Identify a variable.
Standard 1: Students design, conduct, evaluate, and communicate processes and results of scientific investigations, and demonstrate the thinking skills associated with this procedural knowledge.
7 Attend to common substances or objects.
Standard 2: Students demonstrate knowledge of properties, forms, changes, interactions of physical; and chemical systems, and demonstrate thinking skills associated with knowledge.
Appendix E—Released Performance Level Indicators 7 2015–16 Montana CRT-Alternate Technical Report
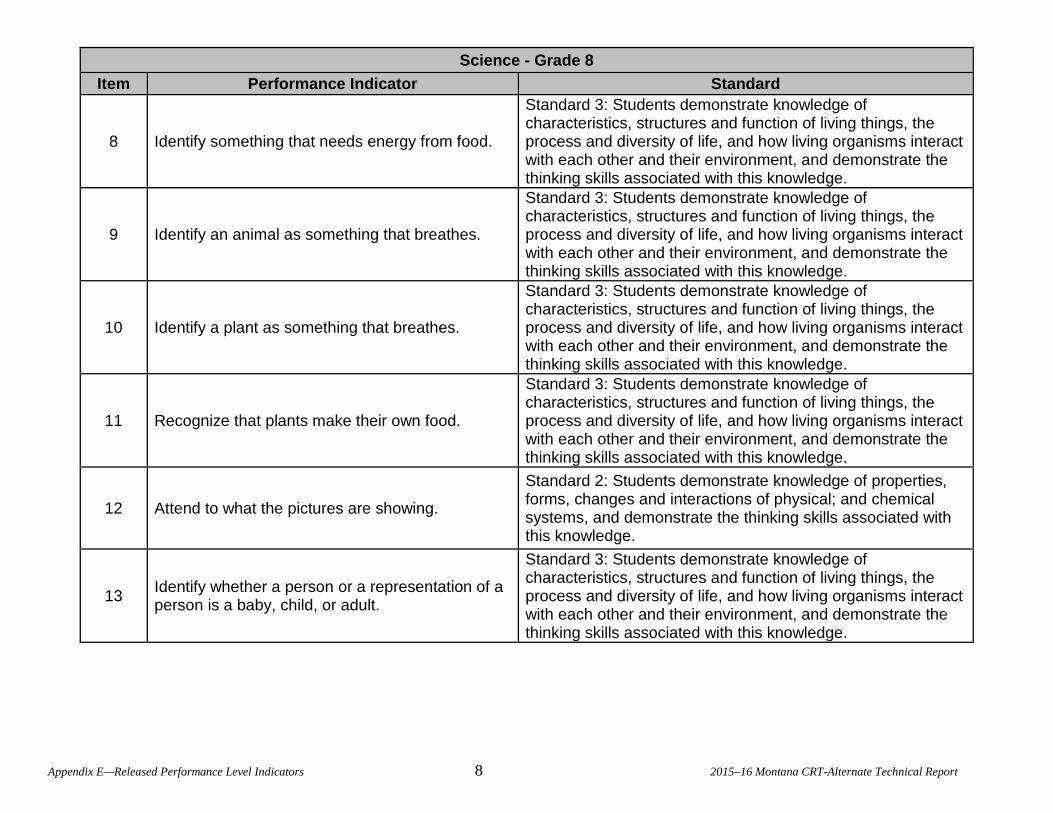
Science - Grade 8 Item Performance Indicator Standard
8 Identify something that needs energy from food.
Standard 3: Students demonstrate knowledge of characteristics, structures and function of living things, the process and diversity of life, and how living organisms interact with each other and their environment, and demonstrate the thinking skills associated with this knowledge.
9 Identify an animal as something that breathes.
Standard 3: Students demonstrate knowledge of characteristics, structures and function of living things, the process and diversity of life, and how living organisms interact with each other and their environment, and demonstrate the thinking skills associated with this knowledge.
10 Identify a plant as something that breathes.
Standard 3: Students demonstrate knowledge of characteristics, structures and function of living things, the process and diversity of life, and how living organisms interact with each other and their environment, and demonstrate the thinking skills associated with this knowledge.
11 Recognize that plants make their own food.
Standard 3: Students demonstrate knowledge of characteristics, structures and function of living things, the process and diversity of life, and how living organisms interact with each other and their environment, and demonstrate the thinking skills associated with this knowledge.
12 Attend to what the pictures are showing.
Standard 2: Students demonstrate knowledge of properties, forms, changes and interactions of physical; and chemical systems, and demonstrate the thinking skills associated with this knowledge.
13 Identify whether a person or a representation of a person is a baby, child, or adult.
Standard 3: Students demonstrate knowledge of characteristics, structures and function of living things, the process and diversity of life, and how living organisms interact with each other and their environment, and demonstrate the thinking skills associated with this knowledge.
Appendix E—Released Performance Level Indicators 8 2015–16 Montana CRT-Alternate Technical Report
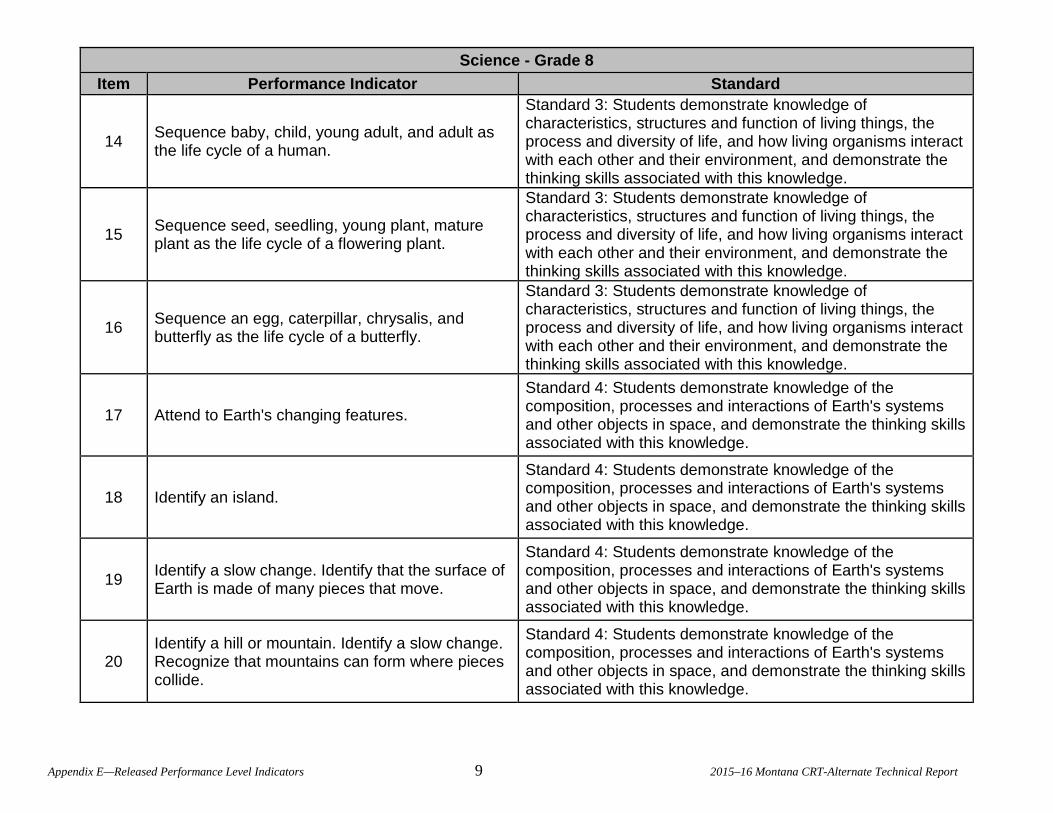
Science - Grade 8 Item Performance Indicator Standard
14 Sequence baby, child, young adult, and adult as the life cycle of a human.
Standard 3: Students demonstrate knowledge of characteristics, structures and function of living things, the process and diversity of life, and how living organisms interact with each other and their environment, and demonstrate the thinking skills associated with this knowledge.
15 Sequence seed, seedling, young plant, mature plant as the life cycle of a flowering plant.
Standard 3: Students demonstrate knowledge of characteristics, structures and function of living things, the process and diversity of life, and how living organisms interact with each other and their environment, and demonstrate the thinking skills associated with this knowledge.
16 Sequence an egg, caterpillar, chrysalis, and butterfly as the life cycle of a butterfly.
Standard 3: Students demonstrate knowledge of characteristics, structures and function of living things, the process and diversity of life, and how living organisms interact with each other and their environment, and demonstrate the thinking skills associated with this knowledge.
17 Attend to Earth's changing features.
Standard 4: Students demonstrate knowledge of the composition, processes and interactions of Earth's systems and other objects in space, and demonstrate the thinking skills associated with this knowledge.
18 Identify an island.
Standard 4: Students demonstrate knowledge of the composition, processes and interactions of Earth's systems and other objects in space, and demonstrate the thinking skills associated with this knowledge.
19 Identify a slow change. Identify that the surface of Earth is made of many pieces that move.
Standard 4: Students demonstrate knowledge of the composition, processes and interactions of Earth's systems and other objects in space, and demonstrate the thinking skills associated with this knowledge.
20 Identify a hill or mountain. Identify a slow change. Recognize that mountains can form where pieces collide.
Standard 4: Students demonstrate knowledge of the composition, processes and interactions of Earth's systems and other objects in space, and demonstrate the thinking skills associated with this knowledge.
Appendix E—Released Performance Level Indicators 9 2015–16 Montana CRT-Alternate Technical Report
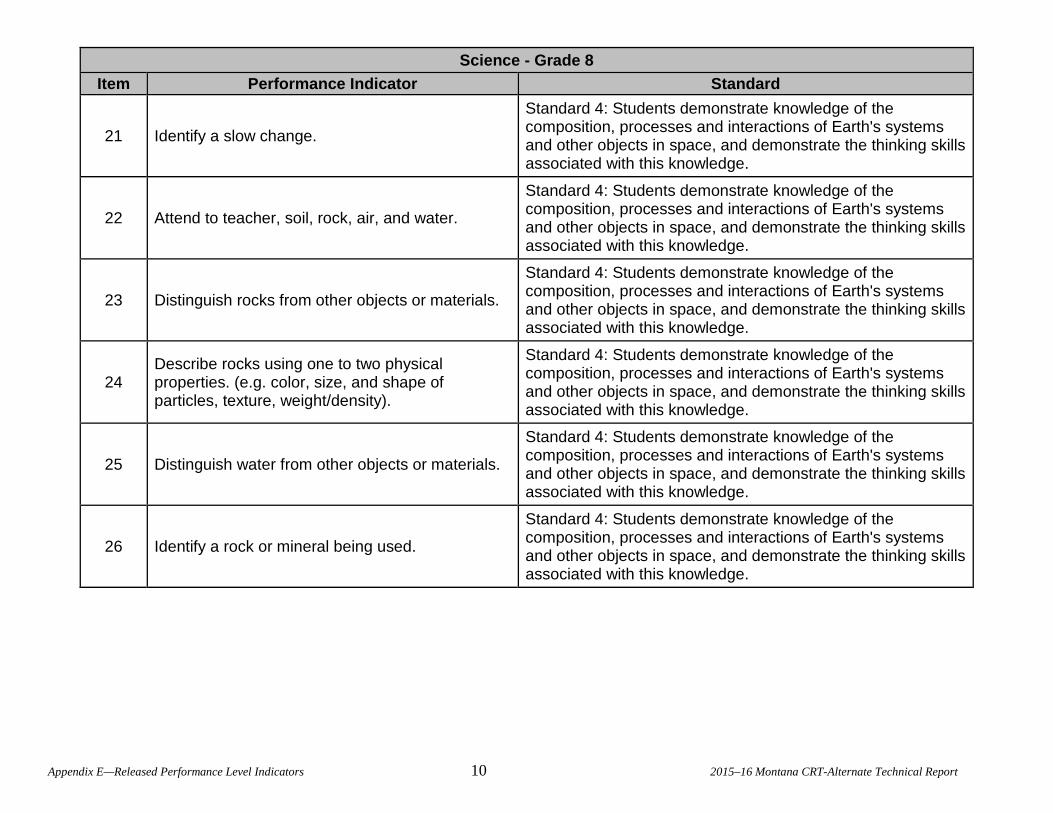
Science - Grade 8 Item Performance Indicator Standard
21 Identify a slow change.
Standard 4: Students demonstrate knowledge of the composition, processes and interactions of Earth's systems and other objects in space, and demonstrate the thinking skills associated with this knowledge.
22 Attend to teacher, soil, rock, air, and water.
Standard 4: Students demonstrate knowledge of the composition, processes and interactions of Earth's systems and other objects in space, and demonstrate the thinking skills associated with this knowledge.
23 Distinguish rocks from other objects or materials.
Standard 4: Students demonstrate knowledge of the composition, processes and interactions of Earth's systems and other objects in space, and demonstrate the thinking skills associated with this knowledge.
24 Describe rocks using one to two physical properties. (e.g. color, size, and shape of particles, texture, weight/density).
Standard 4: Students demonstrate knowledge of the composition, processes and interactions of Earth's systems and other objects in space, and demonstrate the thinking skills associated with this knowledge.
25 Distinguish water from other objects or materials.
Standard 4: Students demonstrate knowledge of the composition, processes and interactions of Earth's systems and other objects in space, and demonstrate the thinking skills associated with this knowledge.
26 Identify a rock or mineral being used.
Standard 4: Students demonstrate knowledge of the composition, processes and interactions of Earth's systems and other objects in space, and demonstrate the thinking skills associated with this knowledge.
Appendix E—Released Performance Level Indicators 10 2015–16 Montana CRT-Alternate Technical Report
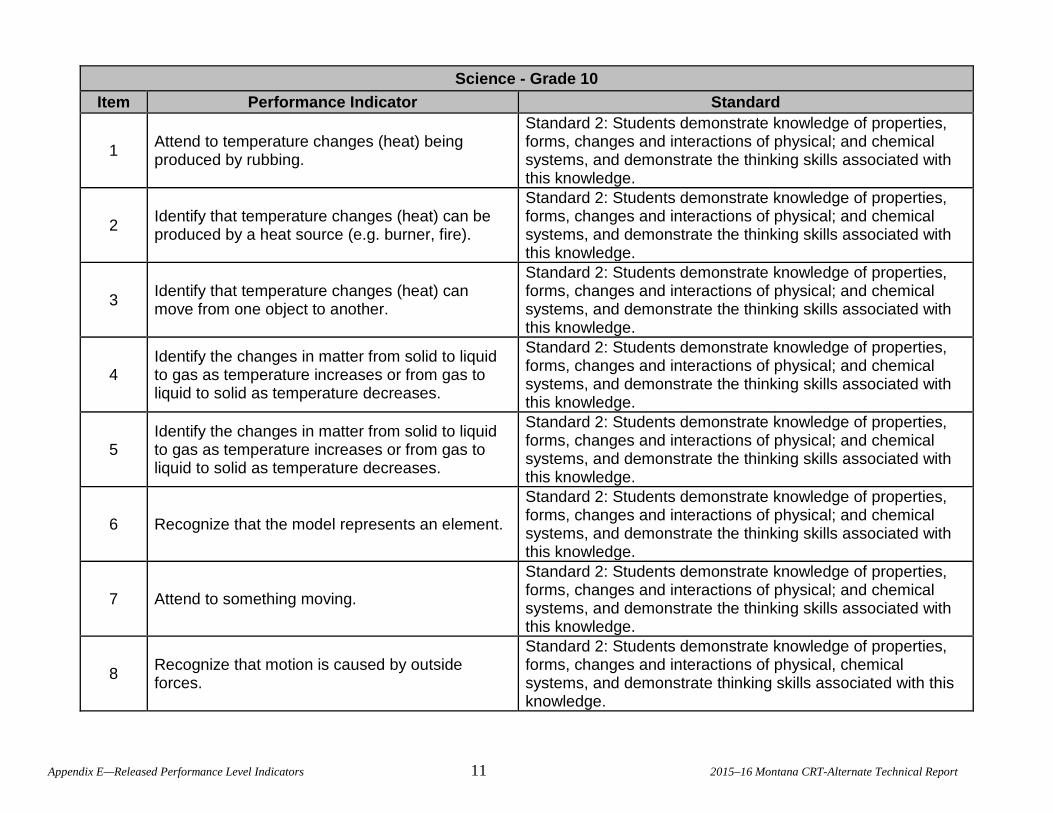
Science - Grade 10 Item Performance Indicator Standard
1 Attend to temperature changes (heat) being produced by rubbing.
Standard 2: Students demonstrate knowledge of properties, forms, changes and interactions of physical; and chemical systems, and demonstrate the thinking skills associated with this knowledge.
2 Identify that temperature changes (heat) can be produced by a heat source (e.g. burner, fire).
Standard 2: Students demonstrate knowledge of properties, forms, changes and interactions of physical; and chemical systems, and demonstrate the thinking skills associated with this knowledge.
3 Identify that temperature changes (heat) can move from one object to another.
Standard 2: Students demonstrate knowledge of properties, forms, changes and interactions of physical; and chemical systems, and demonstrate the thinking skills associated with this knowledge.
4 Identify the changes in matter from solid to liquid to gas as temperature increases or from gas to liquid to solid as temperature decreases.
Standard 2: Students demonstrate knowledge of properties, forms, changes and interactions of physical; and chemical systems, and demonstrate the thinking skills associated with this knowledge.
5 Identify the changes in matter from solid to liquid to gas as temperature increases or from gas to liquid to solid as temperature decreases.
Standard 2: Students demonstrate knowledge of properties, forms, changes and interactions of physical; and chemical systems, and demonstrate the thinking skills associated with this knowledge.
6 Recognize that the model represents an element.
Standard 2: Students demonstrate knowledge of properties, forms, changes and interactions of physical; and chemical systems, and demonstrate the thinking skills associated with this knowledge.
7 Attend to something moving.
Standard 2: Students demonstrate knowledge of properties, forms, changes and interactions of physical; and chemical systems, and demonstrate the thinking skills associated with this knowledge.
8 Recognize that motion is caused by outside forces.
Standard 2: Students demonstrate knowledge of properties, forms, changes and interactions of physical, chemical systems, and demonstrate thinking skills associated with this knowledge.
Appendix E—Released Performance Level Indicators 11 2015–16 Montana CRT-Alternate Technical Report

Science - Grade 10 Item Performance Indicator Standard
9 Recognize that motion is caused by outside forces. (e.g. a push causes something to move)
Standard 2: Students demonstrate knowledge of properties, forms, changes and interactions of physical; and chemical systems, and demonstrate the thinking skills associated with this knowledge.
10 Demonstrate that some objects are attracted or repelled by magnets, and some objects are not affected by magnets.
Standard 2: Students demonstrate knowledge of properties, forms, changes and interactions of physical; and chemical systems, and demonstrate the thinking skills associated with this knowledge.
11 Recognize that motion is caused by outside forces. (e.g. a push causes something to move).
Standard 2: Students demonstrate knowledge of properties, forms, changes and interactions of physical; and chemical systems, and demonstrate the thinking skills associated with this knowledge.
12 Attend to cells.
Standard 3: Students demonstrate knowledge of characteristics, structures and function of living things, the process and diversity of life, and how living organisms interact with each other and their environment, and demonstrate the thinking skills associated with this knowledge.
13 Recognize bacteria/germs.
Standard 3: Students demonstrate knowledge of characteristics, structures and function of living things, the process and diversity of life, and how living organisms interact with each other and their environment, and demonstrate the thinking skills associated with this knowledge.
14 Identify a microscope.
Standard 3: Students demonstrate knowledge of characteristics, structures and function of living things, the process and diversity of life, and how living organisms interact with each other and their environment, and demonstrate the thinking skills associated with this knowledge.
15 Identify one or two places where bacteria/germs might be found.
Standard 3: Students demonstrate knowledge of characteristics, structures and function of living things, the process and diversity of life, and how living organisms interact with each other and their environment, and demonstrate the thinking skills associated with this knowledge.
Appendix E—Released Performance Level Indicators 12 2015–16 Montana CRT-Alternate Technical Report
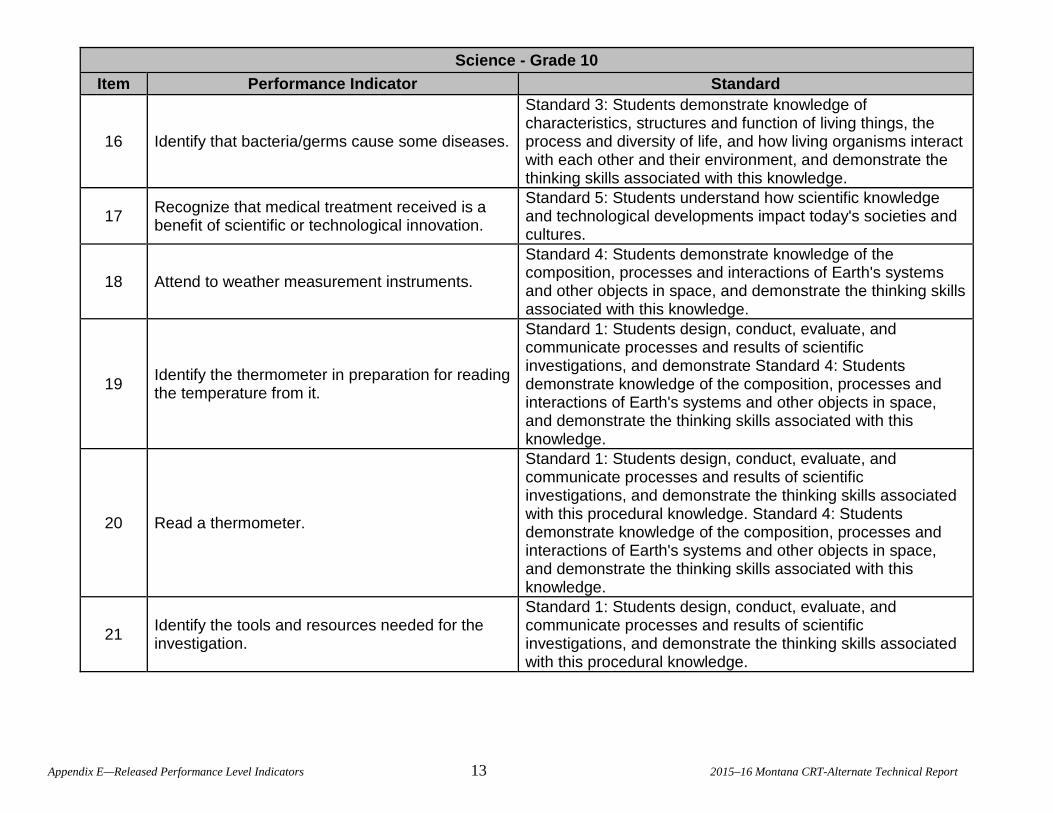
Science - Grade 10 Item Performance Indicator Standard
16 Identify that bacteria/germs cause some diseases.
Standard 3: Students demonstrate knowledge of characteristics, structures and function of living things, the process and diversity of life, and how living organisms interact with each other and their environment, and demonstrate the thinking skills associated with this knowledge.
17 Recognize that medical treatment received is a benefit of scientific or technological innovation.
Standard 5: Students understand how scientific knowledge and technological developments impact today's societies and cultures.
18 Attend to weather measurement instruments.
Standard 4: Students demonstrate knowledge of the composition, processes and interactions of Earth's systems and other objects in space, and demonstrate the thinking skills associated with this knowledge.
19 Identify the thermometer in preparation for reading the temperature from it.
Standard 1: Students design, conduct, evaluate, and communicate processes and results of scientific investigations, and demonstrate Standard 4: Students demonstrate knowledge of the composition, processes and interactions of Earth's systems and other objects in space, and demonstrate the thinking skills associated with this knowledge.
20 Read a thermometer.
Standard 1: Students design, conduct, evaluate, and communicate processes and results of scientific investigations, and demonstrate the thinking skills associated with this procedural knowledge. Standard 4: Students demonstrate knowledge of the composition, processes and interactions of Earth's systems and other objects in space, and demonstrate the thinking skills associated with this knowledge.
21 Identify the tools and resources needed for the investigation.
Standard 1: Students design, conduct, evaluate, and communicate processes and results of scientific investigations, and demonstrate the thinking skills associated with this procedural knowledge.
Appendix E—Released Performance Level Indicators 13 2015–16 Montana CRT-Alternate Technical Report
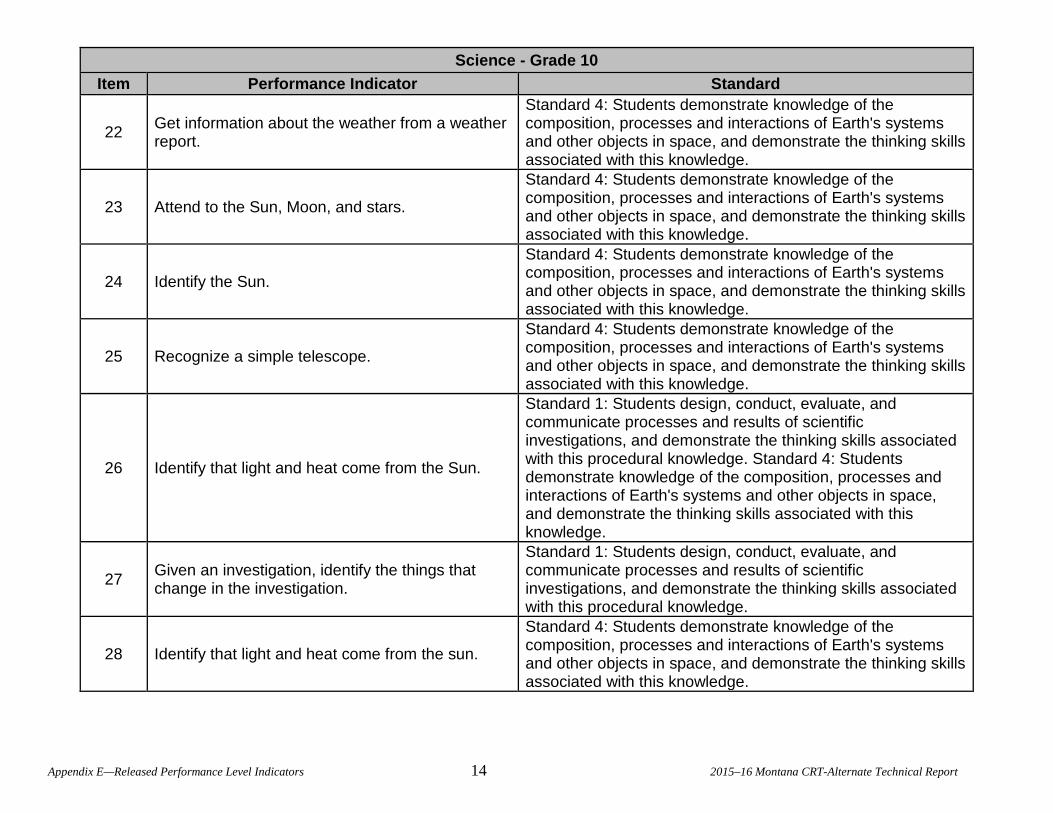
Science - Grade 10 Item Performance Indicator Standard
22 Get information about the weather from a weather report.
Standard 4: Students demonstrate knowledge of the composition, processes and interactions of Earth's systems and other objects in space, and demonstrate the thinking skills associated with this knowledge.
23 Attend to the Sun, Moon, and stars.
Standard 4: Students demonstrate knowledge of the composition, processes and interactions of Earth's systems and other objects in space, and demonstrate the thinking skills associated with this knowledge.
24 Identify the Sun.
Standard 4: Students demonstrate knowledge of the composition, processes and interactions of Earth's systems and other objects in space, and demonstrate the thinking skills associated with this knowledge.
25 Recognize a simple telescope.
Standard 4: Students demonstrate knowledge of the composition, processes and interactions of Earth's systems and other objects in space, and demonstrate the thinking skills associated with this knowledge.
26 Identify that light and heat come from the Sun.
Standard 1: Students design, conduct, evaluate, and communicate processes and results of scientific investigations, and demonstrate the thinking skills associated with this procedural knowledge. Standard 4: Students demonstrate knowledge of the composition, processes and interactions of Earth's systems and other objects in space, and demonstrate the thinking skills associated with this knowledge.
27 Given an investigation, identify the things that change in the investigation.
Standard 1: Students design, conduct, evaluate, and communicate processes and results of scientific investigations, and demonstrate the thinking skills associated with this procedural knowledge.
28 Identify that light and heat come from the sun.
Standard 4: Students demonstrate knowledge of the composition, processes and interactions of Earth's systems and other objects in space, and demonstrate the thinking skills associated with this knowledge.
Appendix E—Released Performance Level Indicators 14 2015–16 Montana CRT-Alternate Technical Report
APPENDIX F—ITEM-LEVEL CLASSICAL STATISTICS
Appendix F—Item-Level Classical Statistics 1 2015–16 Montana CRT-Alternate Technical Report

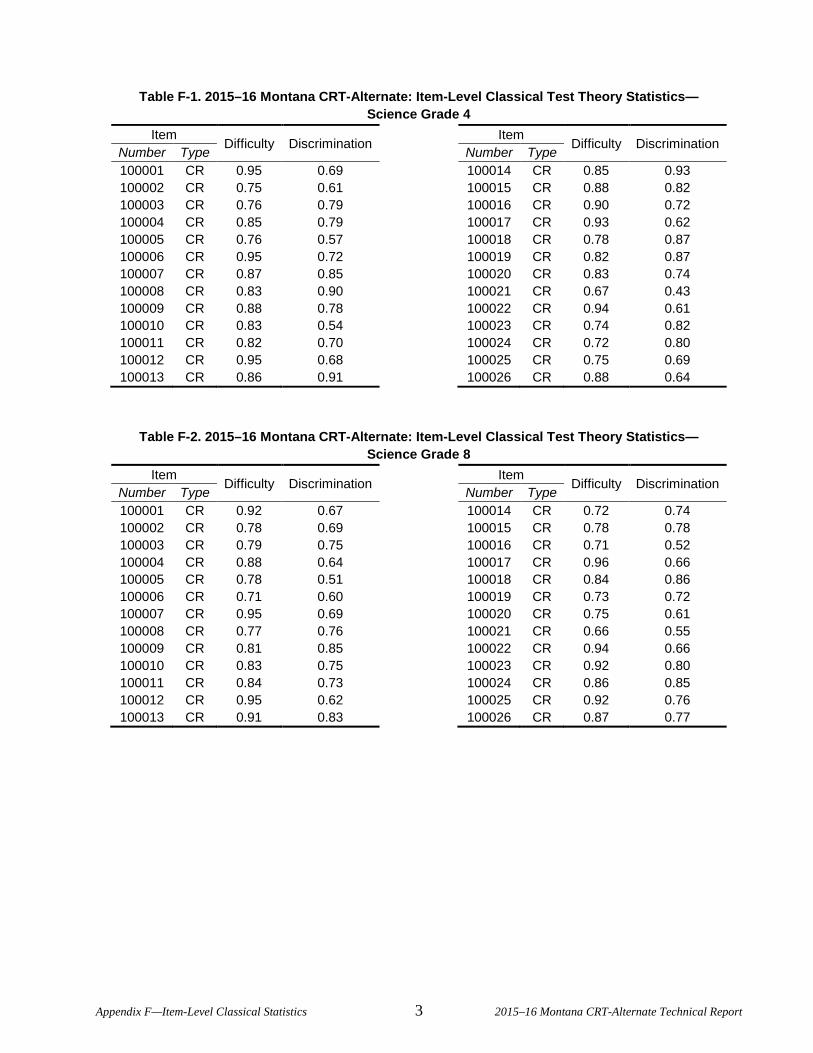
Table F-1. 2015–16 Montana CRT-Alternate: Item-Level Classical Test Theory Statistics— Science Grade 4
Item Difficulty Discrimination
Number Type 100001 CR 0.95 0.69 100002 CR 0.75 0.61 100003 CR 0.76 0.79 100004 CR 0.85 0.79 100005 CR 0.76 0.57 100006 CR 0.95 0.72 100007 CR 0.87 0.85 100008 CR 0.83 0.90 100009 CR 0.88 0.78 100010 CR 0.83 0.54 100011 CR 0.82 0.70 100012 CR 0.95 0.68 100013 CR 0.86 0.91
Item Difficulty Discrimination
Number Type 100014 CR 0.85 0.93 100015 CR 0.88 0.82 100016 CR 0.90 0.72 100017 CR 0.93 0.62 100018 CR 0.78 0.87 100019 CR 0.82 0.87 100020 CR 0.83 0.74 100021 CR 0.67 0.43 100022 CR 0.94 0.61 100023 CR 0.74 0.82 100024 CR 0.72 0.80 100025 CR 0.75 0.69 100026 CR 0.88 0.64
Table F-2. 2015–16 Montana CRT-Alternate: Item-Level Classical Test Theory Statistics— Science Grade 8
Item Difficulty Discrimination
Number Type 100001 CR 0.92 0.67 100002 CR 0.78 0.69 100003 CR 0.79 0.75 100004 CR 0.88 0.64 100005 CR 0.78 0.51 100006 CR 0.71 0.60 100007 CR 0.95 0.69 100008 CR 0.77 0.76 100009 CR 0.81 0.85 100010 CR 0.83 0.75 100011 CR 0.84 0.73 100012 CR 0.95 0.62 100013 CR 0.91 0.83
Item Difficulty Discrimination
Number Type 100014 CR 0.72 0.74 100015 CR 0.78 0.78 100016 CR 0.71 0.52 100017 CR 0.96 0.66 100018 CR 0.84 0.86 100019 CR 0.73 0.72 100020 CR 0.75 0.61 100021 CR 0.66 0.55 100022 CR 0.94 0.66 100023 CR 0.92 0.80 100024 CR 0.86 0.85 100025 CR 0.92 0.76 100026 CR 0.87 0.77
Appendix F—Item-Level Classical Statistics 3 2015–16 Montana CRT-Alternate Technical Report
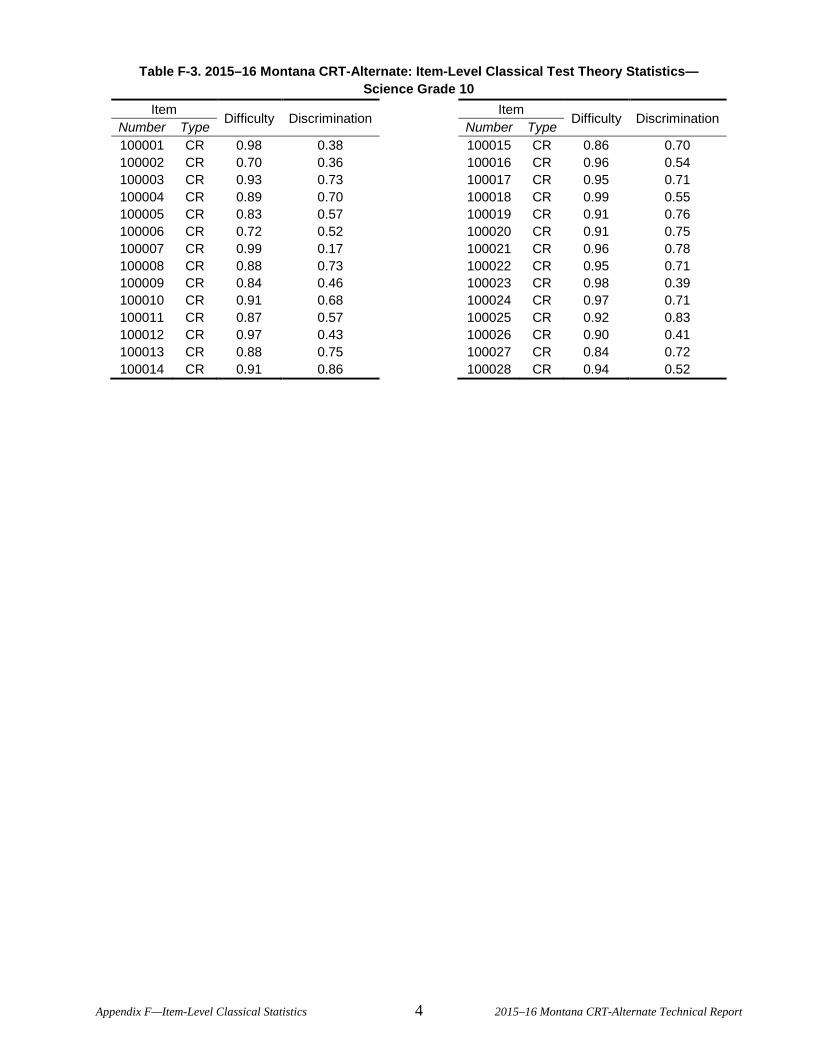
Table F-3. 2015–16 Montana CRT-Alternate: Item-Level Classical Test Theory Statistics— Science Grade 10
Item Difficulty Discrimination
Number Type 100001 CR 0.98 0.38 100002 CR 0.70 0.36 100003 CR 0.93 0.73 100004 CR 0.89 0.70 100005 CR 0.83 0.57 100006 CR 0.72 0.52 100007 CR 0.99 0.17 100008 CR 0.88 0.73 100009 CR 0.84 0.46 100010 CR 0.91 0.68 100011 CR 0.87 0.57 100012 CR 0.97 0.43 100013 CR 0.88 0.75 100014 CR 0.91 0.86
Item Difficulty Discrimination
Number Type 100015 CR 0.86 0.70 100016 CR 0.96 0.54 100017 CR 0.95 0.71 100018 CR 0.99 0.55 100019 CR 0.91 0.76 100020 CR 0.91 0.75 100021 CR 0.96 0.78 100022 CR 0.95 0.71 100023 CR 0.98 0.39 100024 CR 0.97 0.71 100025 CR 0.92 0.83 100026 CR 0.90 0.41 100027 CR 0.84 0.72 100028 CR 0.94 0.52
Appendix F—Item-Level Classical Statistics 4 2015–16 Montana CRT-Alternate Technical Report
APPENDIX G—ITEM-LEVEL SCORE DISTRIBUTIONS
Appendix G—Item-Level Score Distributions 1 2015–16 Montana CRT-Alternate Technical Report

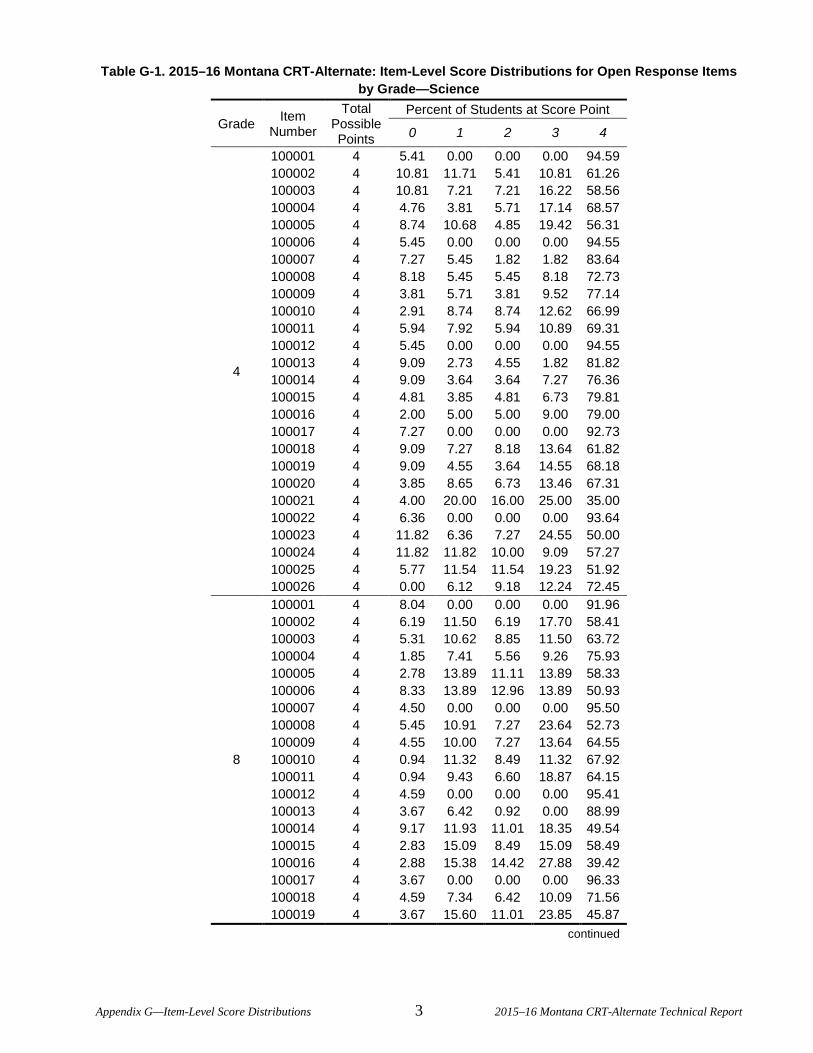
Table G-1. 2015–16 Montana CRT-Alternate: Item-Level Score Distributions for Open Response Items by Grade—Science
Grade Item Number
Total Possible Points
Percent of Students at Score Point
0 1 2 3 4
4
100001 4 5.41 0.00 0.00 0.00 94.59 100002 4 10.81 11.71 5.41 10.81 61.26 100003 4 10.81 7.21 7.21 16.22 58.56 100004 4 4.76 3.81 5.71 17.14 68.57 100005 4 8.74 10.68 4.85 19.42 56.31 100006 4 5.45 0.00 0.00 0.00 94.55 100007 4 7.27 5.45 1.82 1.82 83.64 100008 4 8.18 5.45 5.45 8.18 72.73 100009 4 3.81 5.71 3.81 9.52 77.14 100010 4 2.91 8.74 8.74 12.62 66.99 100011 4 5.94 7.92 5.94 10.89 69.31 100012 4 5.45 0.00 0.00 0.00 94.55 100013 4 9.09 2.73 4.55 1.82 81.82 100014 4 9.09 3.64 3.64 7.27 76.36 100015 4 4.81 3.85 4.81 6.73 79.81 100016 4 2.00 5.00 5.00 9.00 79.00 100017 4 7.27 0.00 0.00 0.00 92.73 100018 4 9.09 7.27 8.18 13.64 61.82 100019 4 9.09 4.55 3.64 14.55 68.18 100020 4 3.85 8.65 6.73 13.46 67.31 100021 4 4.00 20.00 16.00 25.00 35.00 100022 4 6.36 0.00 0.00 0.00 93.64 100023 4 11.82 6.36 7.27 24.55 50.00 100024 4 11.82 11.82 10.00 9.09 57.27 100025 4 5.77 11.54 11.54 19.23 51.92 100026 4 0.00 6.12 9.18 12.24 72.45
8
100001 4 8.04 0.00 0.00 0.00 91.96 100002 4 6.19 11.50 6.19 17.70 58.41 100003 4 5.31 10.62 8.85 11.50 63.72 100004 4 1.85 7.41 5.56 9.26 75.93 100005 4 2.78 13.89 11.11 13.89 58.33 100006 4 8.33 13.89 12.96 13.89 50.93 100007 4 4.50 0.00 0.00 0.00 95.50 100008 4 5.45 10.91 7.27 23.64 52.73 100009 4 4.55 10.00 7.27 13.64 64.55 100010 4 0.94 11.32 8.49 11.32 67.92 100011 4 0.94 9.43 6.60 18.87 64.15 100012 4 4.59 0.00 0.00 0.00 95.41 100013 4 3.67 6.42 0.92 0.00 88.99 100014 4 9.17 11.93 11.01 18.35 49.54 100015 4 2.83 15.09 8.49 15.09 58.49 100016 4 2.88 15.38 14.42 27.88 39.42 100017 4 3.67 0.00 0.00 0.00 96.33 100018 4 4.59 7.34 6.42 10.09 71.56 100019 4 3.67 15.60 11.01 23.85 45.87
continued
Appendix G—Item-Level Score Distributions 3 2015–16 Montana CRT-Alternate Technical Report
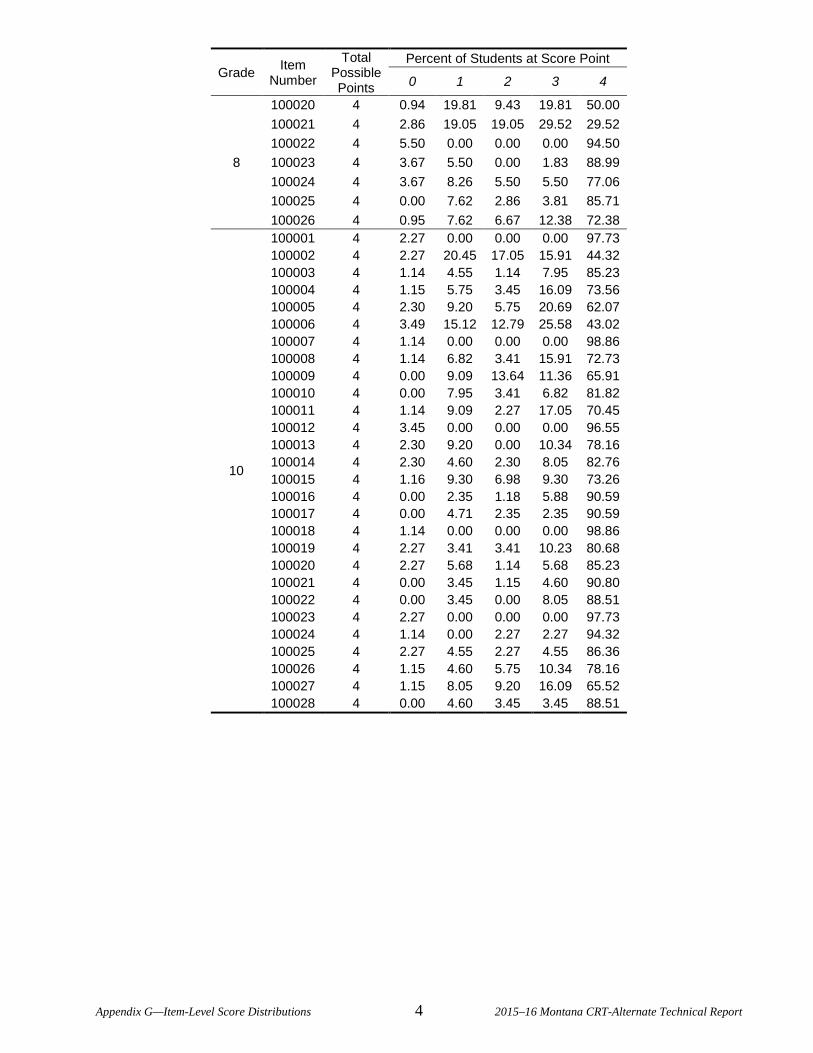
Grade Item Number
Total Possible Points
Percent of Students at Score Point
0 1 2 3 4
8
100020 4 0.94 19.81 9.43 19.81 50.00 100021 4 2.86 19.05 19.05 29.52 29.52 100022 4 5.50 0.00 0.00 0.00 94.50 100023 4 3.67 5.50 0.00 1.83 88.99 100024 4 3.67 8.26 5.50 5.50 77.06 100025 4 0.00 7.62 2.86 3.81 85.71 100026 4 0.95 7.62 6.67 12.38 72.38
10
100001 4 2.27 0.00 0.00 0.00 97.73 100002 4 2.27 20.45 17.05 15.91 44.32 100003 4 1.14 4.55 1.14 7.95 85.23 100004 4 1.15 5.75 3.45 16.09 73.56 100005 4 2.30 9.20 5.75 20.69 62.07 100006 4 3.49 15.12 12.79 25.58 43.02 100007 4 1.14 0.00 0.00 0.00 98.86 100008 4 1.14 6.82 3.41 15.91 72.73 100009 4 0.00 9.09 13.64 11.36 65.91 100010 4 0.00 7.95 3.41 6.82 81.82 100011 4 1.14 9.09 2.27 17.05 70.45 100012 4 3.45 0.00 0.00 0.00 96.55 100013 4 2.30 9.20 0.00 10.34 78.16 100014 4 2.30 4.60 2.30 8.05 82.76 100015 4 1.16 9.30 6.98 9.30 73.26 100016 4 0.00 2.35 1.18 5.88 90.59 100017 4 0.00 4.71 2.35 2.35 90.59 100018 4 1.14 0.00 0.00 0.00 98.86 100019 4 2.27 3.41 3.41 10.23 80.68 100020 4 2.27 5.68 1.14 5.68 85.23 100021 4 0.00 3.45 1.15 4.60 90.80 100022 4 0.00 3.45 0.00 8.05 88.51 100023 4 2.27 0.00 0.00 0.00 97.73 100024 4 1.14 0.00 2.27 2.27 94.32 100025 4 2.27 4.55 2.27 4.55 86.36 100026 4 1.15 4.60 5.75 10.34 78.16 100027 4 1.15 8.05 9.20 16.09 65.52 100028 4 0.00 4.60 3.45 3.45 88.51
Appendix G—Item-Level Score Distributions 4 2015–16 Montana CRT-Alternate Technical Report
APPENDIX H—DIFFERENTIAL ITEM FUNCTIONING RESULTS
Appendix H—Differential Item Functioning Results 1 2015–16 Montana CRT-Alternate Technical Report

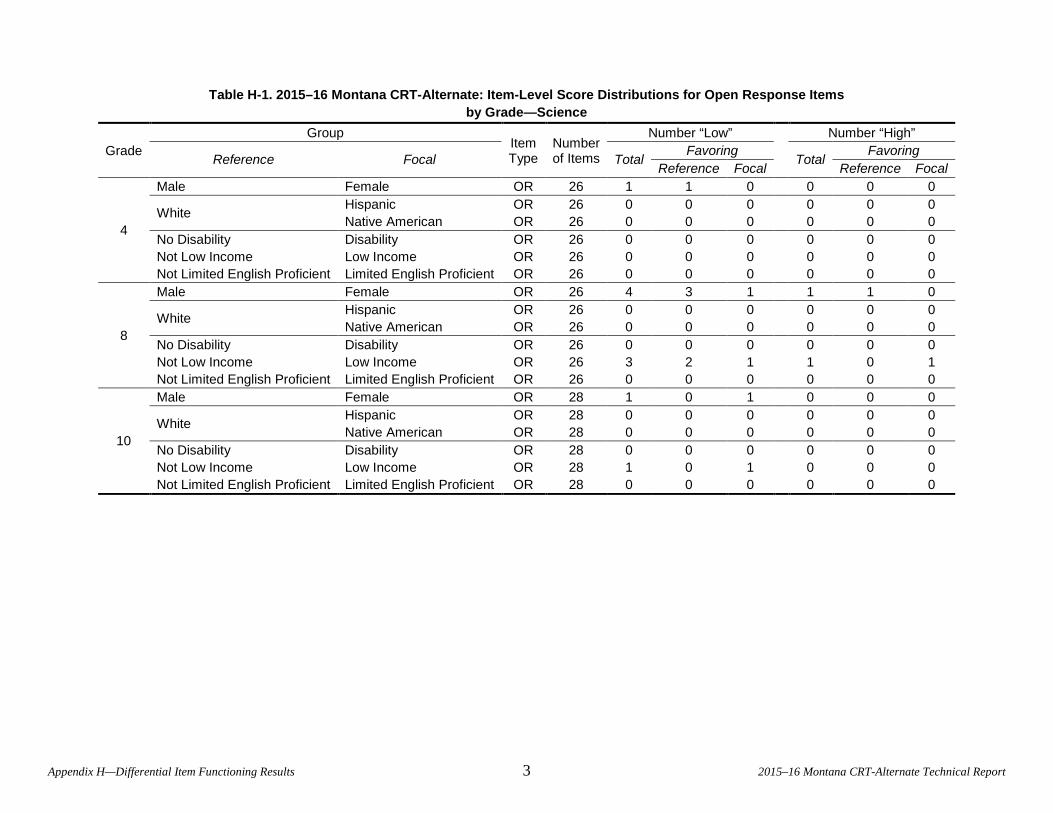
Table H-1. 2015–16 Montana CRT-Alternate: Item-Level Score Distributions for Open Response Items by Grade—Science
Grade Group
Item Type
Number of Items
Number “Low”
Number “High”
Reference Focal Total Favoring
Total Favoring
Reference Focal Reference Focal
4
Male Female OR 26 1 1 0 0 0 0
White Hispanic OR 26 0 0 0 0 0 0 Native American OR 26 0 0 0 0 0 0
No Disability Disability OR 26 0 0 0 0 0 0 Not Low Income Low Income OR 26 0 0 0 0 0 0 Not Limited English Proficient Limited English Proficient OR 26 0 0 0 0 0 0
8
Male Female OR 26 4 3 1 1 1 0
White Hispanic OR 26 0 0 0 0 0 0 Native American OR 26 0 0 0 0 0 0
No Disability Disability OR 26 0 0 0 0 0 0 Not Low Income Low Income OR 26 3 2 1 1 0 1 Not Limited English Proficient Limited English Proficient OR 26 0 0 0 0 0 0
10
Male Female OR 28 1 0 1 0 0 0
White Hispanic OR 28 0 0 0 0 0 0 Native American OR 28 0 0 0 0 0 0
No Disability Disability OR 28 0 0 0 0 0 0 Not Low Income Low Income OR 28 1 0 1 0 0 0 Not Limited English Proficient Limited English Proficient OR 28 0 0 0 0 0 0
Appendix H—Differential Item Functioning Results 3 2015–16 Montana CRT-Alternate Technical Report

APPENDIX I—SUBGROUP RELIABILITIES
Appendix I—Subgroup Reliabilities 1 2015–16 Montana CRT-Alternate Technical Report

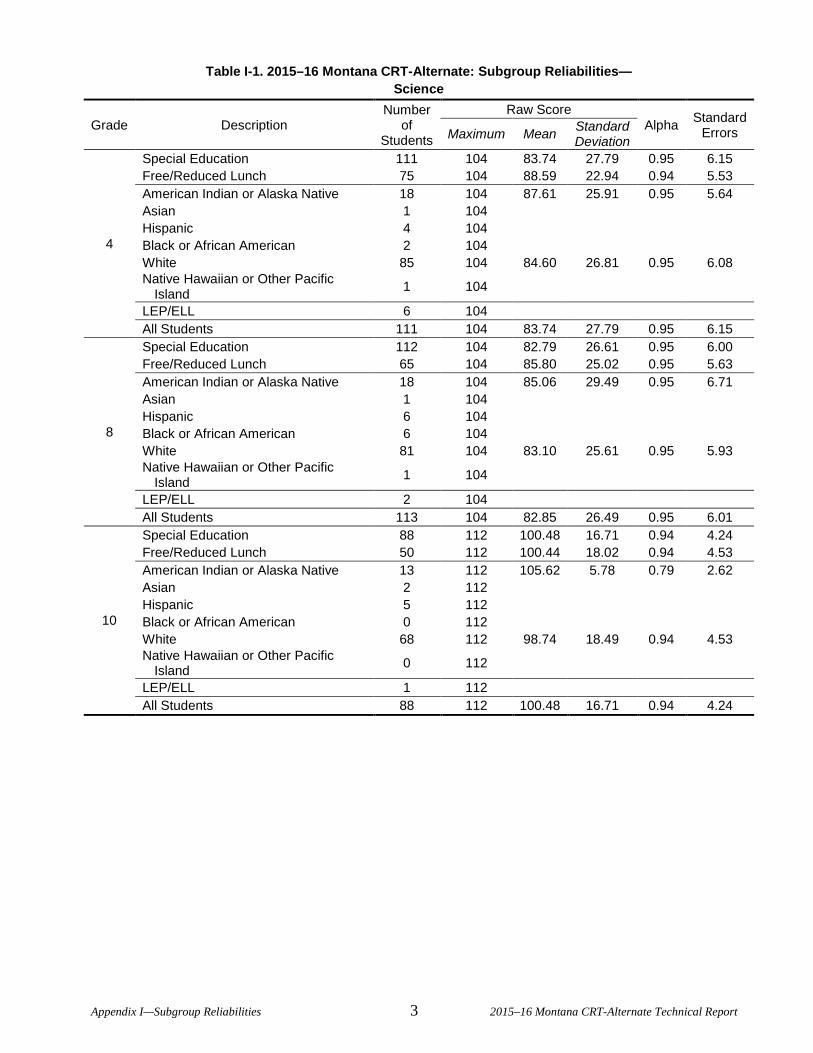
Table I-1. 2015–16 Montana CRT-Alternate: Subgroup Reliabilities— Science
Grade Description Number
of Students
Raw Score Alpha Standard
Errors Maximum Mean Standard Deviation
4
Special Education 111 104 83.74 27.79 0.95 6.15 Free/Reduced Lunch 75 104 88.59 22.94 0.94 5.53 American Indian or Alaska Native 18 104 87.61 25.91 0.95 5.64 Asian 1 104 Hispanic 4 104 Black or African American 2 104 White 85 104 84.60 26.81 0.95 6.08 Native Hawaiian or Other Pacific
Island 1 104
LEP/ELL 6 104 All Students 111 104 83.74 27.79 0.95 6.15
8
Special Education 112 104 82.79 26.61 0.95 6.00 Free/Reduced Lunch 65 104 85.80 25.02 0.95 5.63 American Indian or Alaska Native 18 104 85.06 29.49 0.95 6.71 Asian 1 104 Hispanic 6 104 Black or African American 6 104 White 81 104 83.10 25.61 0.95 5.93 Native Hawaiian or Other Pacific
Island 1 104
LEP/ELL 2 104 All Students 113 104 82.85 26.49 0.95 6.01
10
Special Education 88 112 100.48 16.71 0.94 4.24 Free/Reduced Lunch 50 112 100.44 18.02 0.94 4.53 American Indian or Alaska Native 13 112 105.62 5.78 0.79 2.62 Asian 2 112 Hispanic 5 112 Black or African American 0 112 White 68 112 98.74 18.49 0.94 4.53 Native Hawaiian or Other Pacific
Island 0 112
LEP/ELL 1 112 All Students 88 112 100.48 16.71 0.94 4.24
Appendix I—Subgroup Reliabilities 3 2015–16 Montana CRT-Alternate Technical Report
APPENDIX J—REPORTING CATEGORY RELIABILITIES
Appendix J—Reporting Category Reliabilities 1 2015–16 Montana CRT-Alternate Technical Report

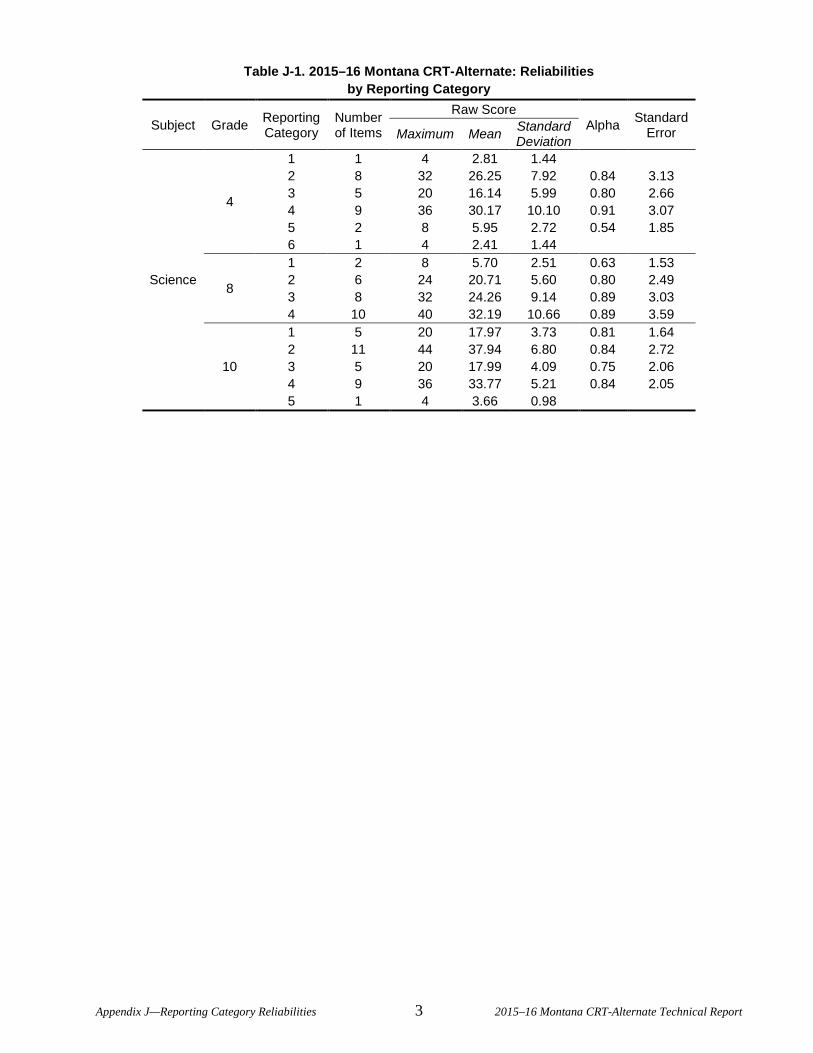
Table J-1. 2015–16 Montana CRT-Alternate: Reliabilities by Reporting Category
Subject Grade Reporting Category
Number of Items
Raw Score Alpha Standard
Error Maximum Mean Standard Deviation
Science
4
1 1 4 2.81 1.44 2 8 32 26.25 7.92 0.84 3.13 3 5 20 16.14 5.99 0.80 2.66 4 9 36 30.17 10.10 0.91 3.07 5 2 8 5.95 2.72 0.54 1.85 6 1 4 2.41 1.44
8
1 2 8 5.70 2.51 0.63 1.53 2 6 24 20.71 5.60 0.80 2.49 3 8 32 24.26 9.14 0.89 3.03 4 10 40 32.19 10.66 0.89 3.59
10
1 5 20 17.97 3.73 0.81 1.64 2 11 44 37.94 6.80 0.84 2.72 3 5 20 17.99 4.09 0.75 2.06 4 9 36 33.77 5.21 0.84 2.05 5 1 4 3.66 0.98
Appendix J—Reporting Category Reliabilities 3 2015–16 Montana CRT-Alternate Technical Report
APPENDIX K—DECISION ACCURACY AND CONSISTENCY RESULTS
Appendix K—Decision Accuracy and Consistency Results 1 2015–16 Montana CRT-Alternate Technical Report

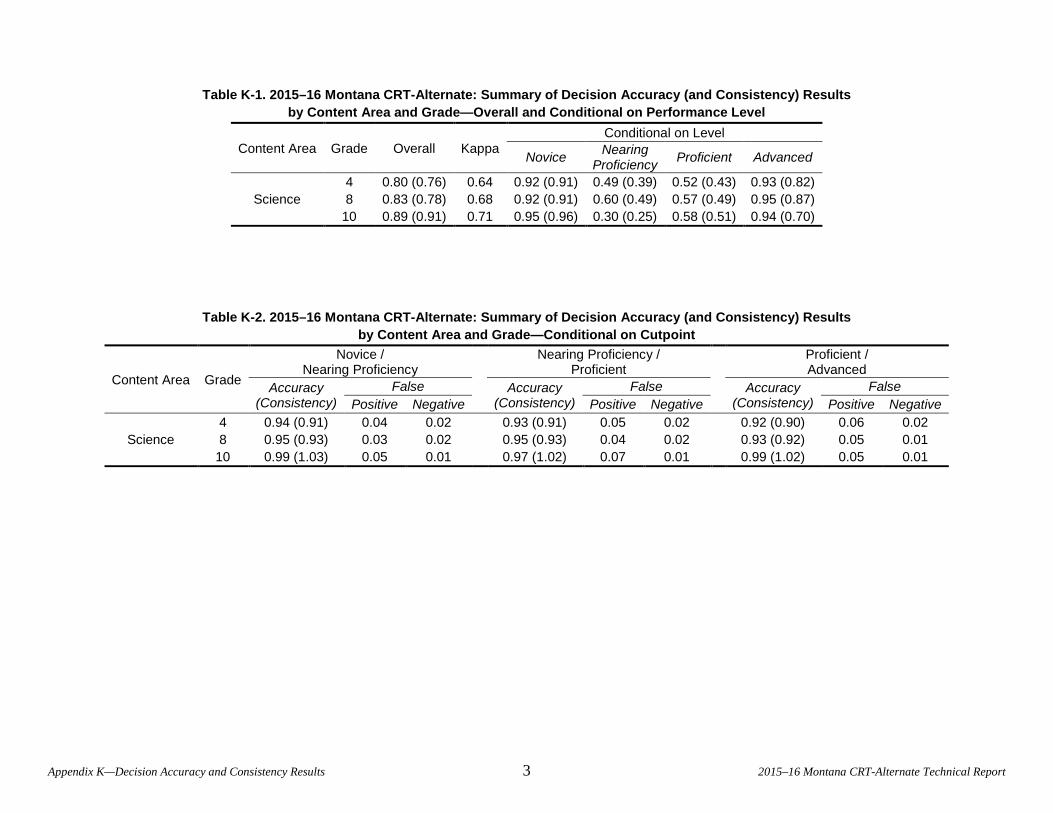
Table K-1. 2015–16 Montana CRT-Alternate: Summary of Decision Accuracy (and Consistency) Results by Content Area and Grade—Overall and Conditional on Performance Level
Content Area Grade Overall Kappa Conditional on Level
Novice Nearing Proficiency Proficient Advanced
Science 4 0.80 (0.76) 0.64 0.92 (0.91) 0.49 (0.39) 0.52 (0.43) 0.93 (0.82) 8 0.83 (0.78) 0.68 0.92 (0.91) 0.60 (0.49) 0.57 (0.49) 0.95 (0.87)
10 0.89 (0.91) 0.71 0.95 (0.96) 0.30 (0.25) 0.58 (0.51) 0.94 (0.70)
Table K-2. 2015–16 Montana CRT-Alternate: Summary of Decision Accuracy (and Consistency) Results by Content Area and Grade—Conditional on Cutpoint
Content Area Grade
Novice / Nearing Proficiency
Nearing Proficiency / Proficient
Proficient / Advanced
Accuracy (Consistency)
False Accuracy (Consistency)
False Accuracy (Consistency)
False Positive Negative Positive Negative Positive Negative
Science 4 0.94 (0.91) 0.04 0.02 0.93 (0.91) 0.05 0.02 0.92 (0.90) 0.06 0.02 8 0.95 (0.93) 0.03 0.02 0.95 (0.93) 0.04 0.02 0.93 (0.92) 0.05 0.01
10 0.99 (1.03) 0.05 0.01 0.97 (1.02) 0.07 0.01 0.99 (1.02) 0.05 0.01
Appendix K—Decision Accuracy and Consistency Results 3 2015–16 Montana CRT-Alternate Technical Report
APPENDIX L—SCALED SCORE CUMULATIVE DISTRIBUTIONS
Appendix L—Scaled Score Cumulative Distributions 1 2015–16 Montana CRT-Alternate Technical Report

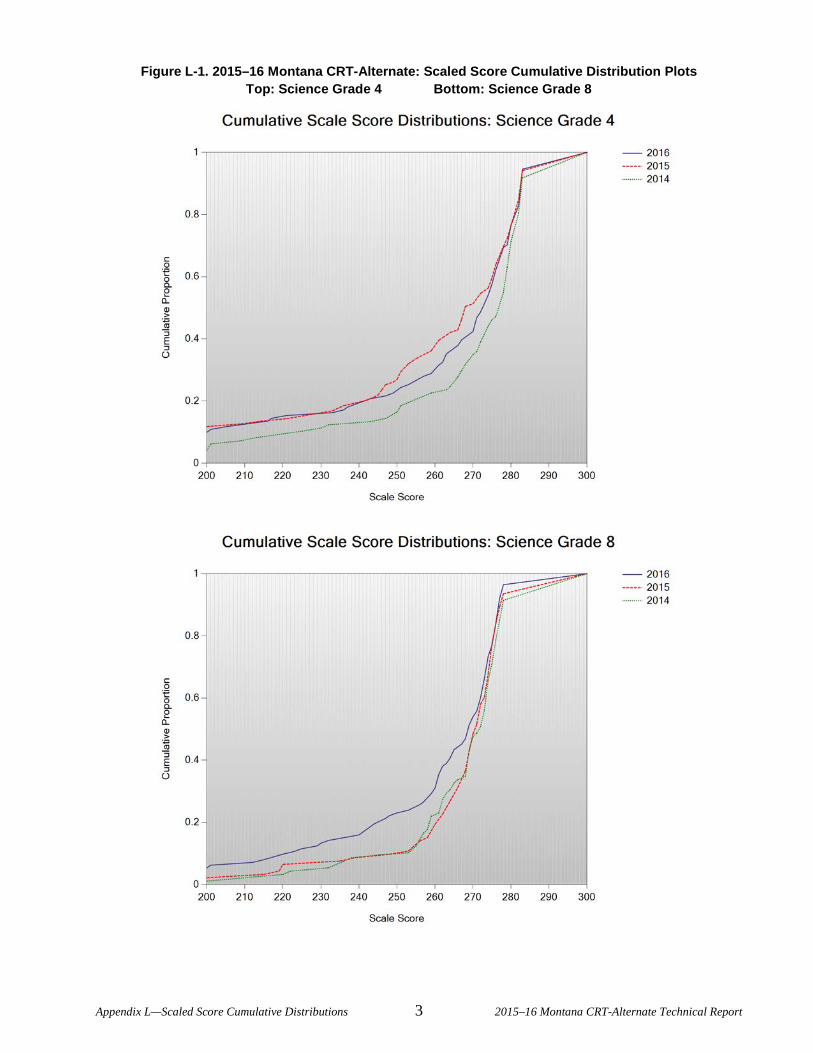
Figure L-1. 2015–16 Montana CRT-Alternate: Scaled Score Cumulative Distribution Plots Top: Science Grade 4 Bottom: Science Grade 8
Appendix L—Scaled Score Cumulative Distributions 3 2015–16 Montana CRT-Alternate Technical Report
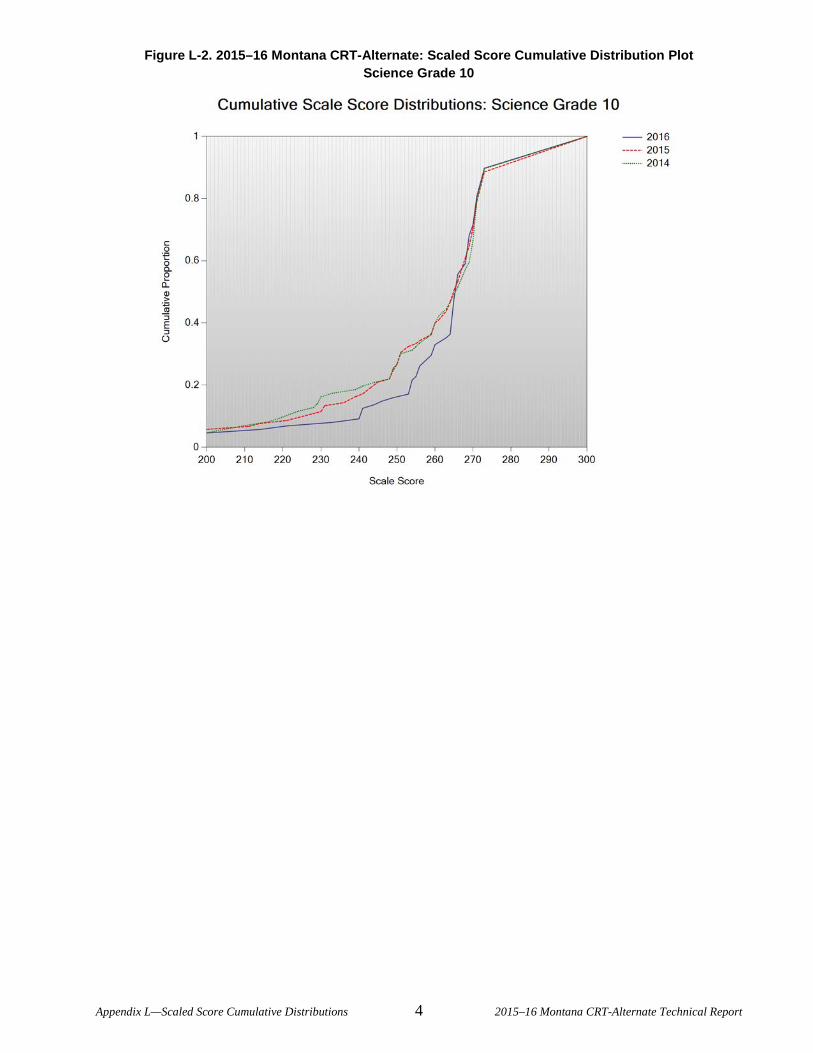
Figure L-2. 2015–16 Montana CRT-Alternate: Scaled Score Cumulative Distribution Plot Science Grade 10
Appendix L—Scaled Score Cumulative Distributions 4 2015–16 Montana CRT-Alternate Technical Report
APPENDIX M—PERFORMANCE LEVEL DISTRIBUTIONS
Appendix M—Performance Level Distributions 1 2015–16 Montana CRT-Alternate Technical Report

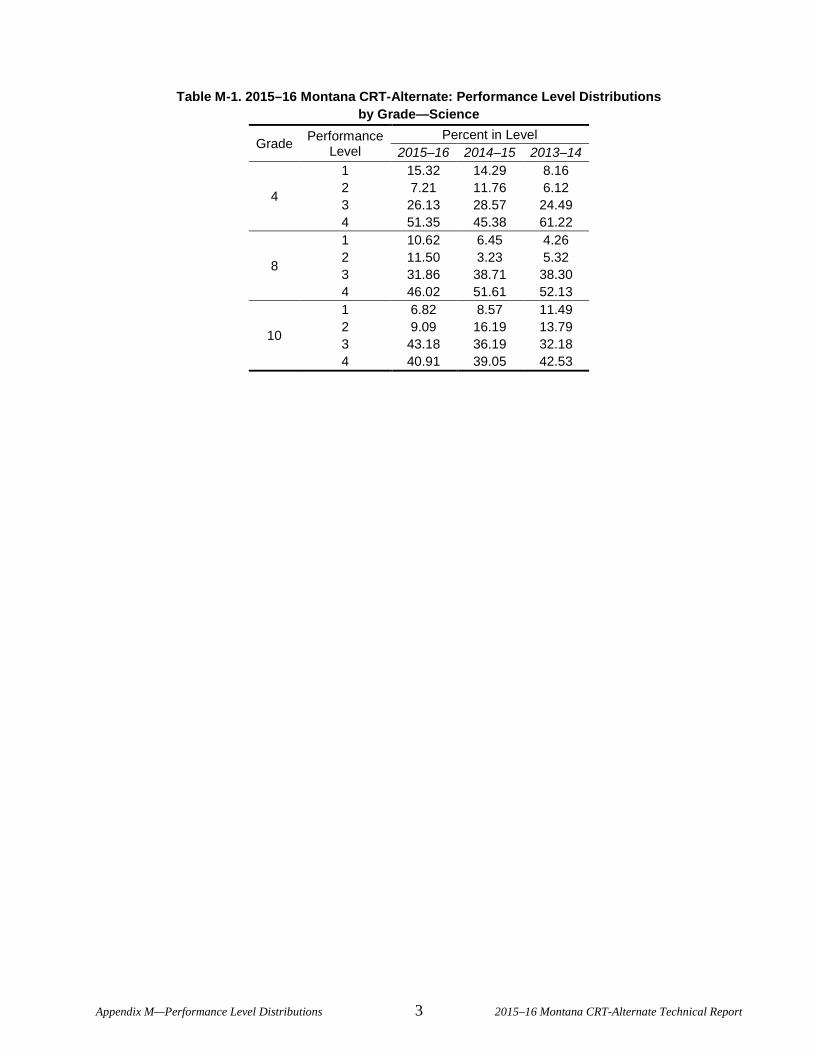
Table M-1. 2015–16 Montana CRT-Alternate: Performance Level Distributions by Grade—Science
Grade Performance Level
Percent in Level 2015–16 2014–15 2013–14
4
1 15.32 14.29 8.16 2 7.21 11.76 6.12 3 26.13 28.57 24.49 4 51.35 45.38 61.22
8
1 10.62 6.45 4.26 2 11.50 3.23 5.32 3 31.86 38.71 38.30 4 46.02 51.61 52.13
10
1 6.82 8.57 11.49 2 9.09 16.19 13.79 3 43.18 36.19 32.18 4 40.91 39.05 42.53
Appendix M—Performance Level Distributions 3 2015–16 Montana CRT-Alternate Technical Report
Appendix N—Performance Level Descriptors 1 2015–16 Montana CRT-Alternate Technical Report
APPENDIX N—PERFORMANCE LEVEL
DESCRIPTORS

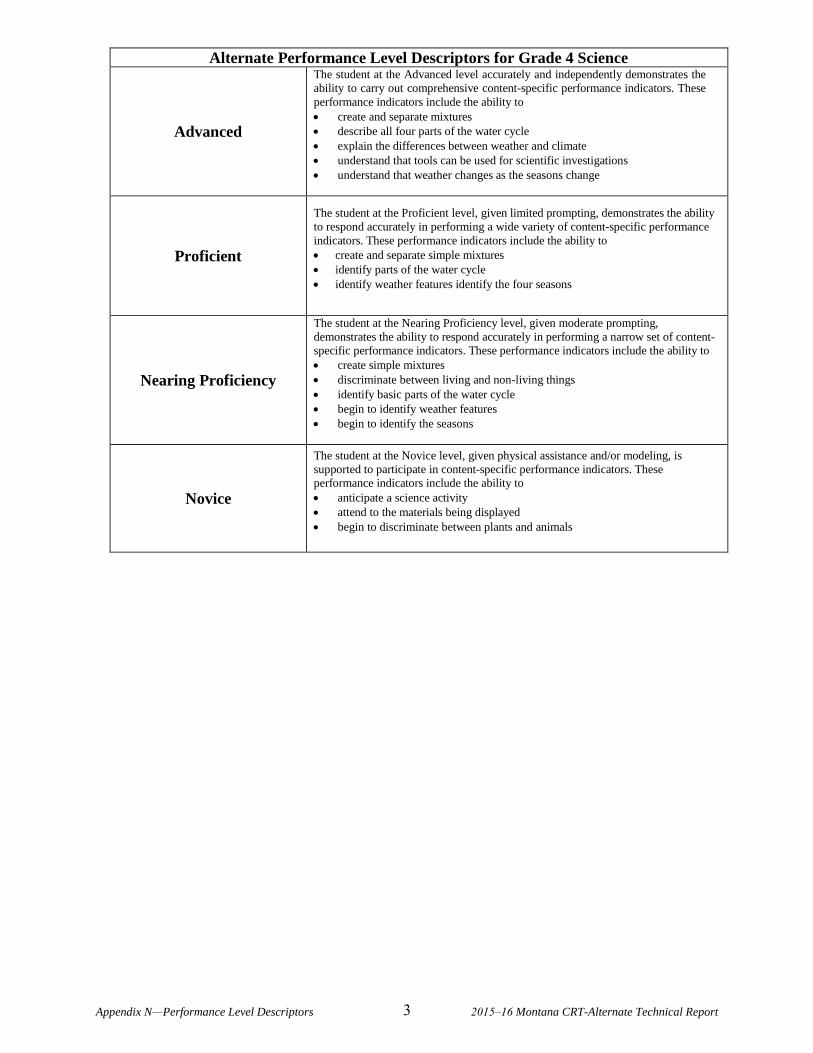
Appendix N—Performance Level Descriptors 3 2015–16 Montana CRT-Alternate Technical Report
Alternate Performance Level Descriptors for Grade 4 Science
Advanced
The student at the Advanced level accurately and independently demonstrates the
ability to carry out comprehensive content-specific performance indicators. These
performance indicators include the ability to
create and separate mixtures
describe all four parts of the water cycle
explain the differences between weather and climate
understand that tools can be used for scientific investigations
understand that weather changes as the seasons change
Proficient
The student at the Proficient level, given limited prompting, demonstrates the ability
to respond accurately in performing a wide variety of content-specific performance
indicators. These performance indicators include the ability to
create and separate simple mixtures
identify parts of the water cycle
identify weather features identify the four seasons
Nearing Proficiency
The student at the Nearing Proficiency level, given moderate prompting,
demonstrates the ability to respond accurately in performing a narrow set of content-
specific performance indicators. These performance indicators include the ability to
create simple mixtures
discriminate between living and non-living things
identify basic parts of the water cycle
begin to identify weather features
begin to identify the seasons
Novice
The student at the Novice level, given physical assistance and/or modeling, is
supported to participate in content-specific performance indicators. These
performance indicators include the ability to
anticipate a science activity
attend to the materials being displayed
begin to discriminate between plants and animals
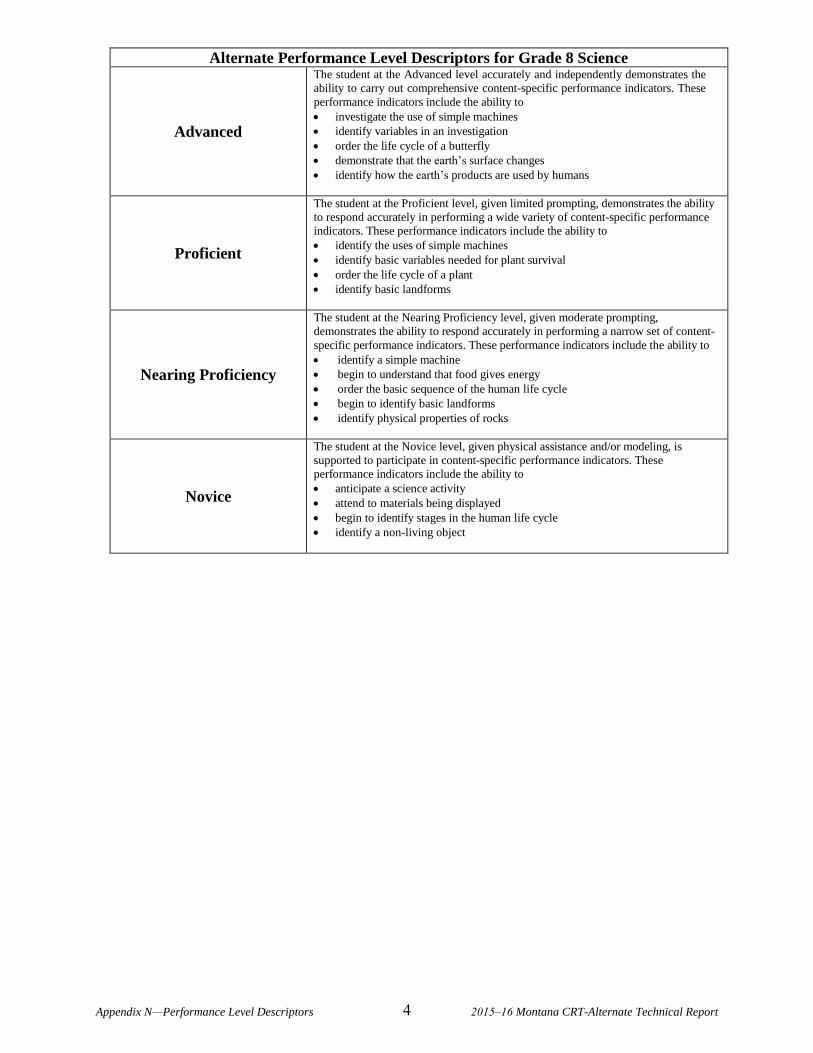
Appendix N—Performance Level Descriptors 4 2015–16 Montana CRT-Alternate Technical Report
Alternate Performance Level Descriptors for Grade 8 Science
Advanced
The student at the Advanced level accurately and independently demonstrates the
ability to carry out comprehensive content-specific performance indicators. These
performance indicators include the ability to
investigate the use of simple machines
identify variables in an investigation
order the life cycle of a butterfly
demonstrate that the earth’s surface changes
identify how the earth’s products are used by humans
Proficient
The student at the Proficient level, given limited prompting, demonstrates the ability
to respond accurately in performing a wide variety of content-specific performance
indicators. These performance indicators include the ability to
identify the uses of simple machines
identify basic variables needed for plant survival
order the life cycle of a plant
identify basic landforms
Nearing Proficiency
The student at the Nearing Proficiency level, given moderate prompting,
demonstrates the ability to respond accurately in performing a narrow set of content-
specific performance indicators. These performance indicators include the ability to
identify a simple machine
begin to understand that food gives energy
order the basic sequence of the human life cycle
begin to identify basic landforms
identify physical properties of rocks
Novice
The student at the Novice level, given physical assistance and/or modeling, is
supported to participate in content-specific performance indicators. These
performance indicators include the ability to
anticipate a science activity
attend to materials being displayed
begin to identify stages in the human life cycle
identify a non-living object
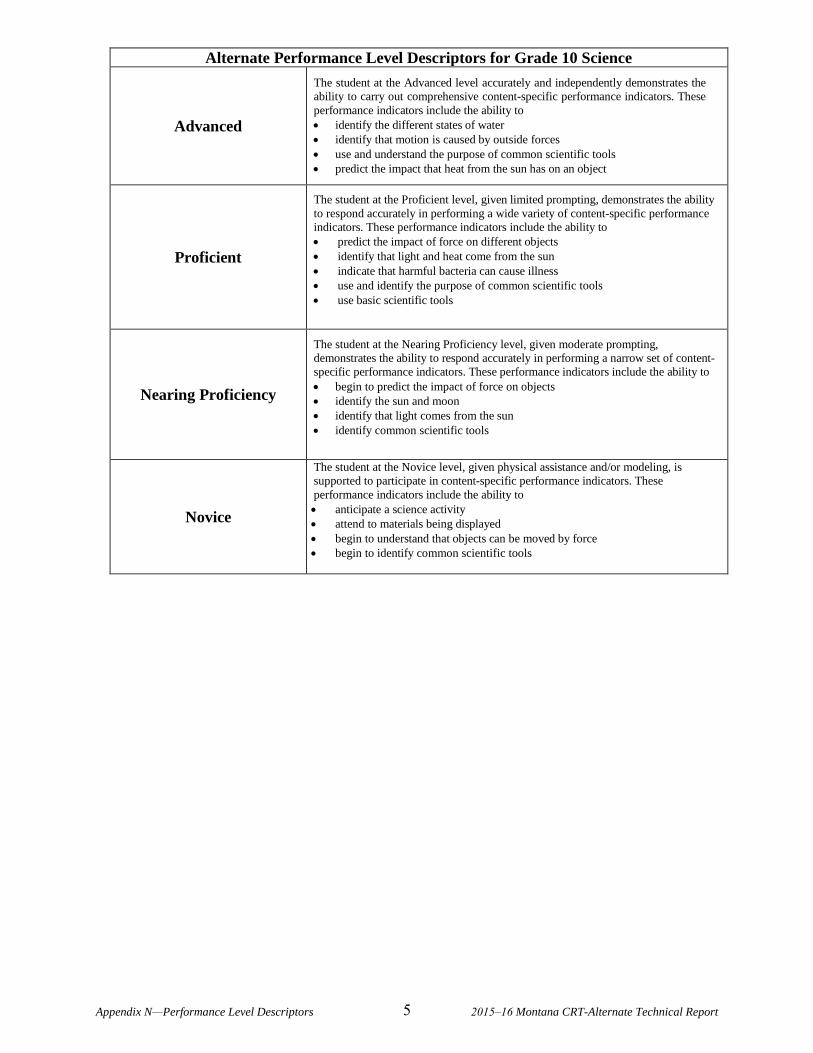
Appendix N—Performance Level Descriptors 5 2015–16 Montana CRT-Alternate Technical Report
Alternate Performance Level Descriptors for Grade 10 Science
Advanced
The student at the Advanced level accurately and independently demonstrates the
ability to carry out comprehensive content-specific performance indicators. These
performance indicators include the ability to
identify the different states of water
identify that motion is caused by outside forces
use and understand the purpose of common scientific tools
predict the impact that heat from the sun has on an object
Proficient
The student at the Proficient level, given limited prompting, demonstrates the ability
to respond accurately in performing a wide variety of content-specific performance
indicators. These performance indicators include the ability to
predict the impact of force on different objects
identify that light and heat come from the sun
indicate that harmful bacteria can cause illness
use and identify the purpose of common scientific tools
use basic scientific tools
Nearing Proficiency
The student at the Nearing Proficiency level, given moderate prompting,
demonstrates the ability to respond accurately in performing a narrow set of content-
specific performance indicators. These performance indicators include the ability to
begin to predict the impact of force on objects
identify the sun and moon
identify that light comes from the sun
identify common scientific tools
Novice
The student at the Novice level, given physical assistance and/or modeling, is
supported to participate in content-specific performance indicators. These
performance indicators include the ability to
anticipate a science activity
attend to materials being displayed
begin to understand that objects can be moved by force
begin to identify common scientific tools

Appendix O—Decision Rules 1 2015–16 Montana CRT-Alternate Technical Report
APPENDIX O—DECISION RULES

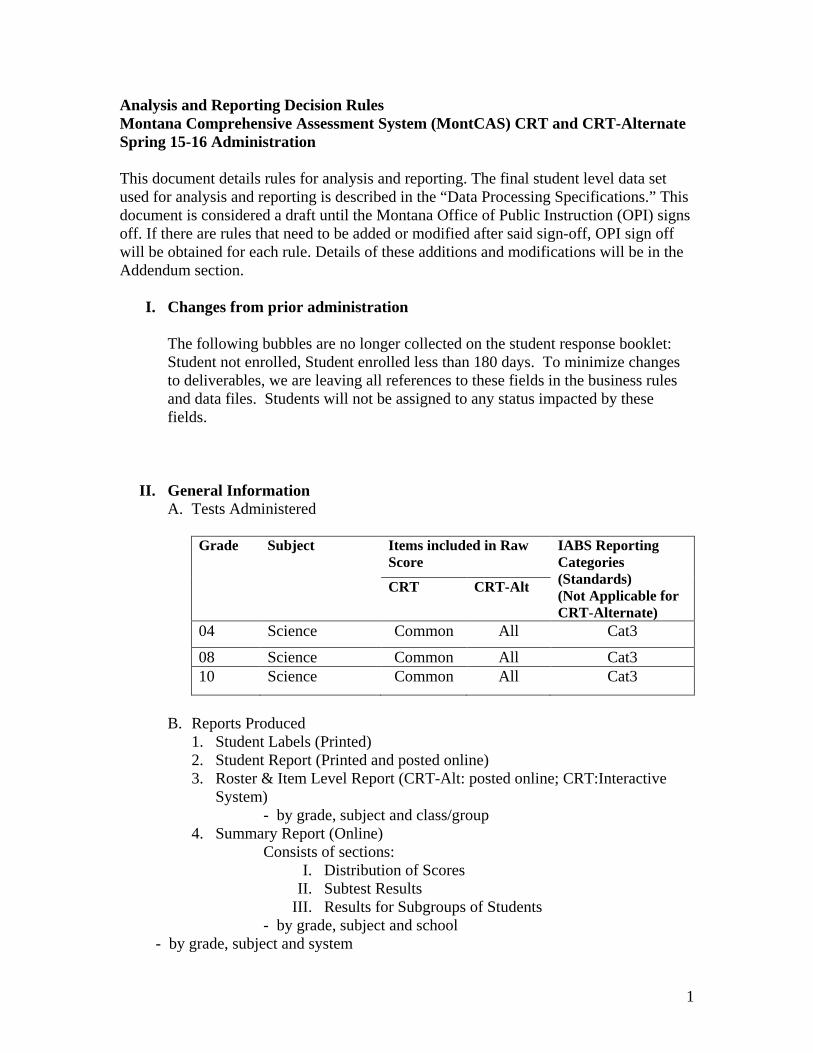
1
Analysis and Reporting Decision Rules Montana Comprehensive Assessment System (MontCAS) CRT and CRT-Alternate Spring 15-16 Administration This document details rules for analysis and reporting. The final student level data set used for analysis and reporting is described in the “Data Processing Specifications.” This document is considered a draft until the Montana Office of Public Instruction (OPI) signs off. If there are rules that need to be added or modified after said sign-off, OPI sign off will be obtained for each rule. Details of these additions and modifications will be in the Addendum section.
I. Changes from prior administration The following bubbles are no longer collected on the student response booklet: Student not enrolled, Student enrolled less than 180 days. To minimize changes to deliverables, we are leaving all references to these fields in the business rules and data files. Students will not be assigned to any status impacted by these fields.
II. General Information
A. Tests Administered Grade Subject Items included in Raw
Score IABS Reporting Categories (Standards) (Not Applicable for CRT-Alternate)
CRT CRT-Alt
04 Science Common All Cat3
08 Science Common All Cat3 10 Science Common All Cat3
B. Reports Produced
1. Student Labels (Printed) 2. Student Report (Printed and posted online) 3. Roster & Item Level Report (CRT-Alt: posted online; CRT:Interactive
System) - by grade, subject and class/group
4. Summary Report (Online) Consists of sections:
I. Distribution of Scores II. Subtest Results
III. Results for Subgroups of Students - by grade, subject and school
- by grade, subject and system
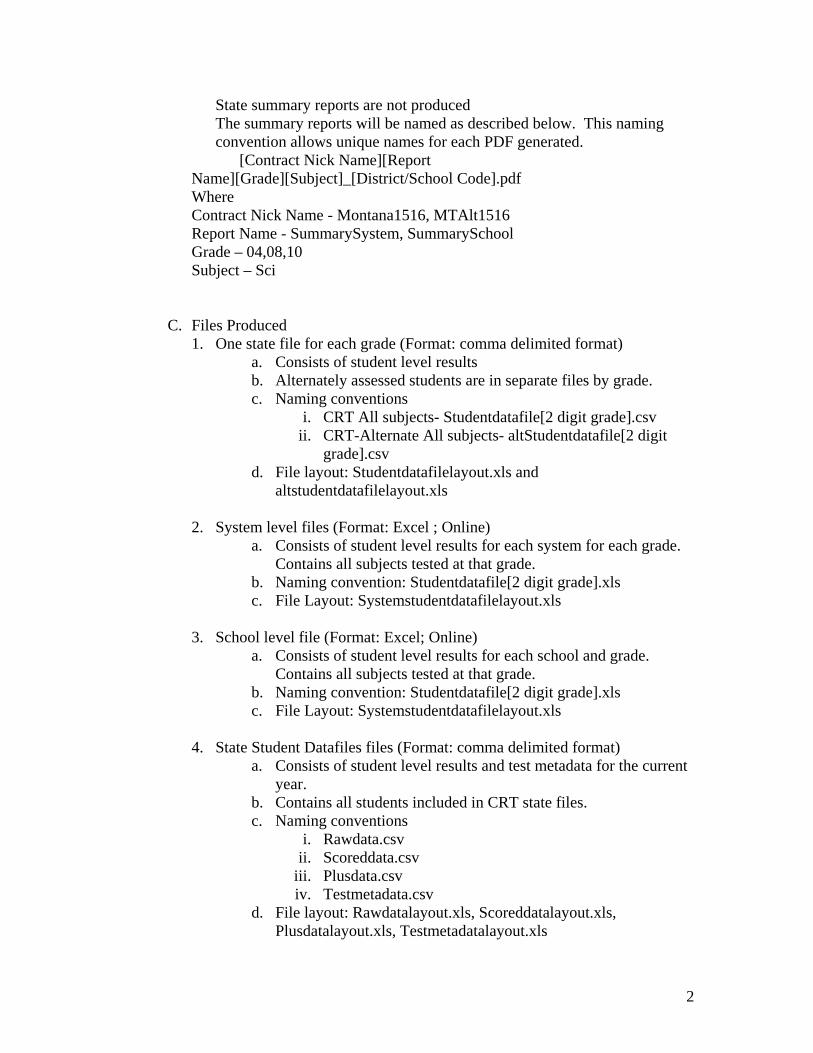
2
State summary reports are not produced The summary reports will be named as described below. This naming convention allows unique names for each PDF generated.
[Contract Nick Name][Report Name][Grade][Subject]_[District/School Code].pdf Where Contract Nick Name - Montana1516, MTAlt1516 Report Name - SummarySystem, SummarySchool Grade – 04,08,10 Subject – Sci
C. Files Produced 1. One state file for each grade (Format: comma delimited format)
a. Consists of student level results b. Alternately assessed students are in separate files by grade. c. Naming conventions
i. CRT All subjects- Studentdatafile[2 digit grade].csv ii. CRT-Alternate All subjects- altStudentdatafile[2 digit
grade].csv d. File layout: Studentdatafilelayout.xls and
altstudentdatafilelayout.xls
2. System level files (Format: Excel ; Online) a. Consists of student level results for each system for each grade.
Contains all subjects tested at that grade. b. Naming convention: Studentdatafile[2 digit grade].xls c. File Layout: Systemstudentdatafilelayout.xls
3. School level file (Format: Excel; Online)
a. Consists of student level results for each school and grade. Contains all subjects tested at that grade.
b. Naming convention: Studentdatafile[2 digit grade].xls c. File Layout: Systemstudentdatafilelayout.xls
4. State Student Datafiles files (Format: comma delimited format)
a. Consists of student level results and test metadata for the current year.
b. Contains all students included in CRT state files. c. Naming conventions
i. Rawdata.csv ii. Scoreddata.csv
iii. Plusdata.csv iv. Testmetadata.csv
d. File layout: Rawdatalayout.xls, Scoreddatalayout.xls, Plusdatalayout.xls, Testmetadatalayout.xls
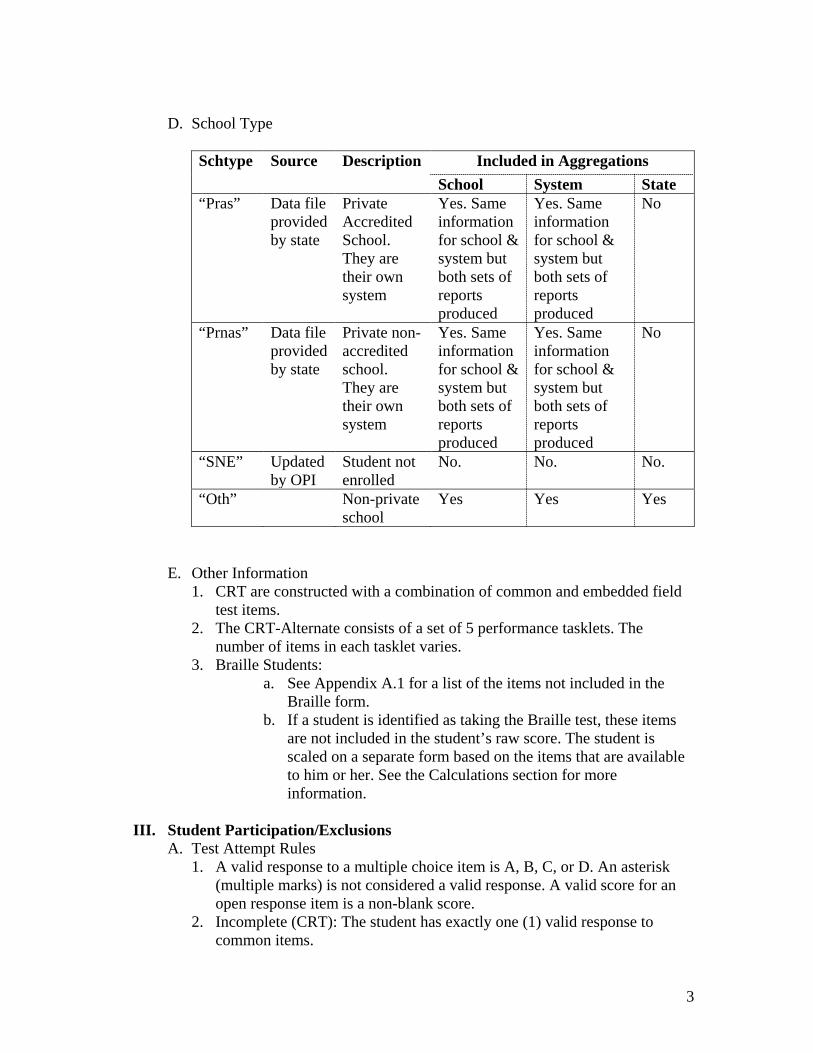
3
D. School Type
Schtype Source Description Included in Aggregations
School System State “Pras” Data file
provided by state
Private Accredited School. They are their own system
Yes. Same information for school & system but both sets of reports produced
Yes. Same information for school & system but both sets of reports produced
No
“Prnas” Data file provided by state
Private non-accredited school. They are their own system
Yes. Same information for school & system but both sets of reports produced
Yes. Same information for school & system but both sets of reports produced
No
“SNE” Updated by OPI
Student not enrolled
No. No. No.
“Oth” Non-private school
Yes Yes Yes
E. Other Information 1. CRT are constructed with a combination of common and embedded field
test items. 2. The CRT-Alternate consists of a set of 5 performance tasklets. The
number of items in each tasklet varies. 3. Braille Students:
a. See Appendix A.1 for a list of the items not included in the Braille form.
b. If a student is identified as taking the Braille test, these items are not included in the student’s raw score. The student is scaled on a separate form based on the items that are available to him or her. See the Calculations section for more information.
III. Student Participation/Exclusions
A. Test Attempt Rules 1. A valid response to a multiple choice item is A, B, C, or D. An asterisk
(multiple marks) is not considered a valid response. A valid score for an open response item is a non-blank score.
2. Incomplete (CRT): The student has exactly one (1) valid response to common items.
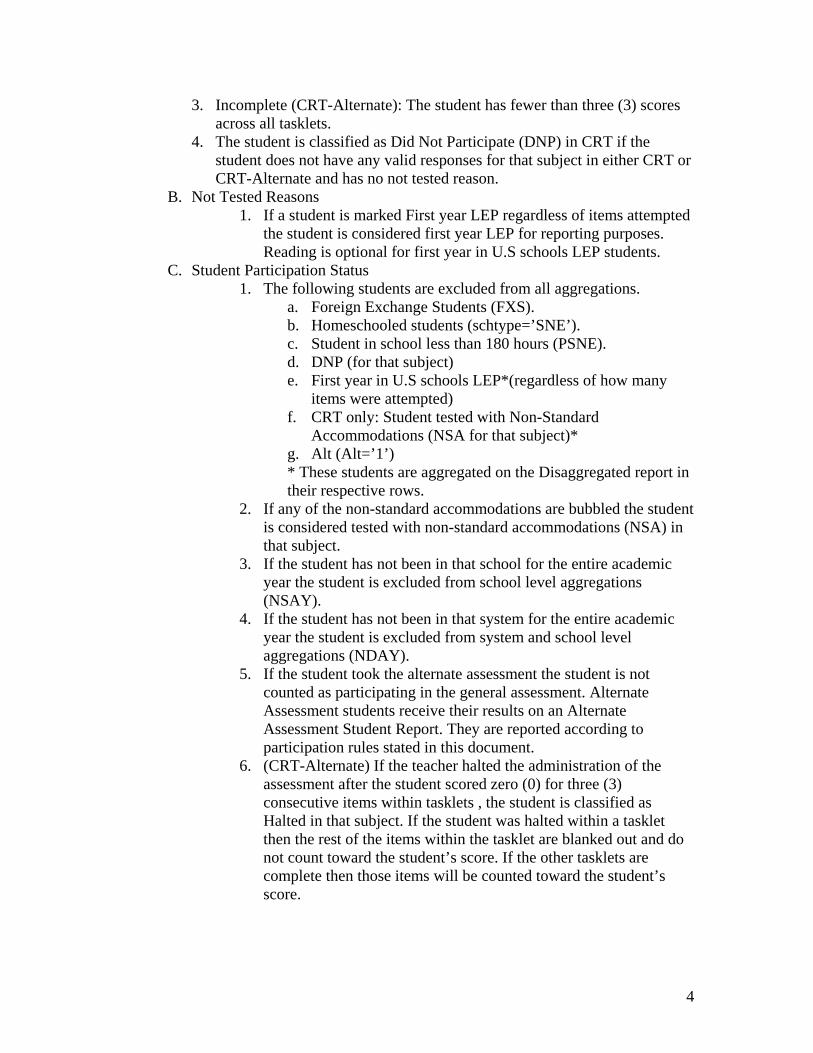
4
3. Incomplete (CRT-Alternate): The student has fewer than three (3) scores across all tasklets.
4. The student is classified as Did Not Participate (DNP) in CRT if the student does not have any valid responses for that subject in either CRT or CRT-Alternate and has no not tested reason.
B. Not Tested Reasons 1. If a student is marked First year LEP regardless of items attempted
the student is considered first year LEP for reporting purposes. Reading is optional for first year in U.S schools LEP students.
C. Student Participation Status 1. The following students are excluded from all aggregations.
a. Foreign Exchange Students (FXS). b. Homeschooled students (schtype=’SNE’). c. Student in school less than 180 hours (PSNE). d. DNP (for that subject) e. First year in U.S schools LEP*(regardless of how many
items were attempted) f. CRT only: Student tested with Non-Standard
Accommodations (NSA for that subject)* g. Alt (Alt=’1’) * These students are aggregated on the Disaggregated report in their respective rows.
2. If any of the non-standard accommodations are bubbled the student is considered tested with non-standard accommodations (NSA) in that subject.
3. If the student has not been in that school for the entire academic year the student is excluded from school level aggregations (NSAY).
4. If the student has not been in that system for the entire academic year the student is excluded from system and school level aggregations (NDAY).
5. If the student took the alternate assessment the student is not counted as participating in the general assessment. Alternate Assessment students receive their results on an Alternate Assessment Student Report. They are reported according to participation rules stated in this document.
6. (CRT-Alternate) If the teacher halted the administration of the assessment after the student scored zero (0) for three (3) consecutive items within tasklets , the student is classified as Halted in that subject. If the student was halted within a tasklet then the rest of the items within the tasklet are blanked out and do not count toward the student’s score. If the other tasklets are complete then those items will be counted toward the student’s score.
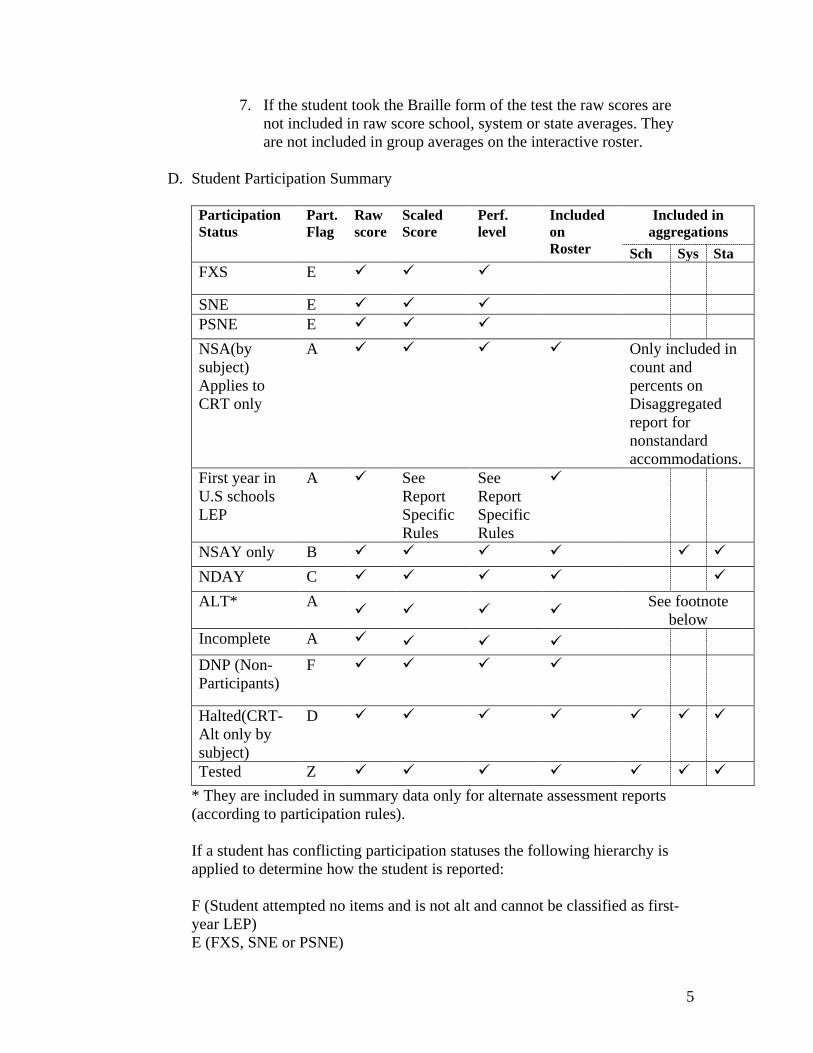
5
7. If the student took the Braille form of the test the raw scores are not included in raw score school, system or state averages. They are not included in group averages on the interactive roster.
D. Student Participation Summary
Participation Status
Part. Flag
Raw score
Scaled Score
Perf. level
Included on Roster
Included in aggregations
Sch Sys Sta FXS E
SNE E PSNE E
NSA(by subject) Applies to CRT only
A Only included in count and percents on Disaggregated report for nonstandard accommodations.
First year in U.S schools LEP
A See Report Specific Rules
See Report Specific Rules
NSAY only B
NDAY C
ALT* A
See footnote below
Incomplete A
DNP (Non-Participants)
F
Halted(CRT-Alt only by subject)
D
Tested Z
* They are included in summary data only for alternate assessment reports (according to participation rules). If a student has conflicting participation statuses the following hierarchy is applied to determine how the student is reported: F (Student attempted no items and is not alt and cannot be classified as first-year LEP) E (FXS, SNE or PSNE)
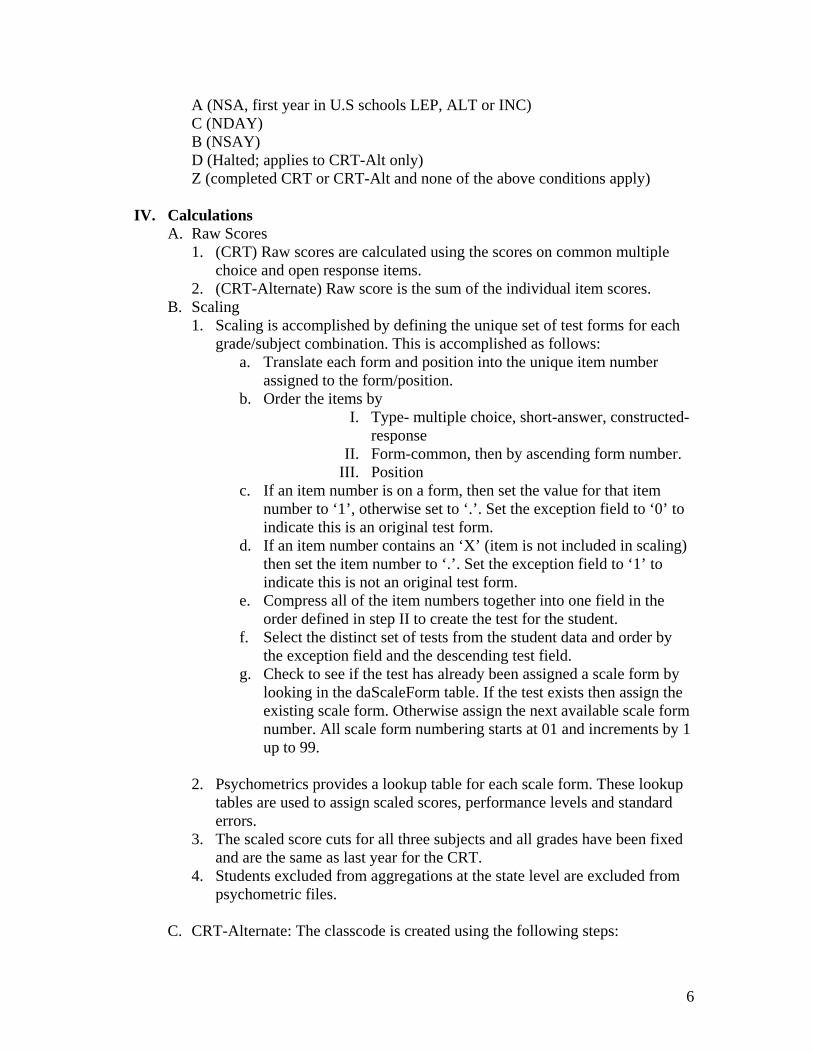
6
A (NSA, first year in U.S schools LEP, ALT or INC) C (NDAY) B (NSAY) D (Halted; applies to CRT-Alt only) Z (completed CRT or CRT-Alt and none of the above conditions apply)
IV. Calculations A. Raw Scores
1. (CRT) Raw scores are calculated using the scores on common multiple choice and open response items.
2. (CRT-Alternate) Raw score is the sum of the individual item scores. B. Scaling
1. Scaling is accomplished by defining the unique set of test forms for each grade/subject combination. This is accomplished as follows:
a. Translate each form and position into the unique item number assigned to the form/position.
b. Order the items by I. Type- multiple choice, short-answer, constructed-
response II. Form-common, then by ascending form number.
III. Position c. If an item number is on a form, then set the value for that item
number to ‘1’, otherwise set to ‘.’. Set the exception field to ‘0’ to indicate this is an original test form.
d. If an item number contains an ‘X’ (item is not included in scaling) then set the item number to ‘.’. Set the exception field to ‘1’ to indicate this is not an original test form.
e. Compress all of the item numbers together into one field in the order defined in step II to create the test for the student.
f. Select the distinct set of tests from the student data and order by the exception field and the descending test field.
g. Check to see if the test has already been assigned a scale form by looking in the daScaleForm table. If the test exists then assign the existing scale form. Otherwise assign the next available scale form number. All scale form numbering starts at 01 and increments by 1 up to 99.
2. Psychometrics provides a lookup table for each scale form. These lookup
tables are used to assign scaled scores, performance levels and standard errors.
3. The scaled score cuts for all three subjects and all grades have been fixed and are the same as last year for the CRT.
4. Students excluded from aggregations at the state level are excluded from psychometric files.
C. CRT-Alternate: The classcode is created using the following steps:
7
1. The following students are not included when creating the class codes. • SNE • FXS • PSNE
2. The dataset (by grade) is sorted by schcode and class/group name 3. The records are then numbered consecutively starting at 1. This number is then padded with zeros (in front) to create a 3 digit number.
D. Performance Level coding:
Numeric Performance Level
Performance level Name
Abbreviation
1(lowest) Novice N
2 Nearing Proficiency
NP
3 Proficient P 4(highest) Advanced A
E. Rounding Table
Calculation Rounded (to the nearest)
Static Reports: Percents and averages
Whole number
Item averages : Multiple choice items
The average is multiplied by 100 and rounded to the nearest whole number.
Item averages: Open response items
Open-response item averages are rounded to the nearest tenth.
F. Minimum N size
1. The number of included students (N) in a subject is the number of students in the school/system/state minus FXS minus PRAS minus PRNAS minus PSNE minus SNE minus First year LEP minus Incomplete minus NSA minus DNP.
2. Minimum N size is 10. 3. School/system reports are produced regardless of N-size, except no reports
are generated if N=0.
G. The common items are used in reporting the average number of points for each standard.
H. Assignment of rperflevel
8
1. If the student is marked as taking the CRT-Alt then rperflevel=’A’, otherwise
2. If the student is classified as did not participate (DNP) then rperflevel=’D’, otherwise
3. If the student is Incomplete in a subject and not marked first year LEP rperflevel=’I’, otherwise
4. If the student is incomplete in Reading or has not attempted any items in Reading and is marked first year LEP rperflevel=’L’ for all subjects, otherwise
5. If the student does not meet any of the above conditions then rperflevel=perflevel.
V. Report Specific Rules
A. Student Label 1. If a student is First year LEP and incomplete in Reading, the Reading
performance level is ‘LEP’. The reading scaled score is blank. 2. If a student is First year LEP, the math and science performance levels are
the name of the earned performance level and the scaled scores are the student’s earned score.
3. If the student is not first year LEP, the performance level name corresponding to the student’s earned score is displayed.
4. If the student is First year LEP but is not incomplete in Reading then the student receives his earned scaled score and performance level.
5. If the student is DNP the student receives a student label. The student receives scaled score =200 and performance level=Novice.
6. The student’s name is formatted as Lname, Fname. 7. The student’s name is uppercase. 8. The school and system names are title case. 9. The labels are sorted alphabetically by Lname, Fname within school and
grade. 10. Test date is 2016. 11. Performance level name from section III.D above is shown on the label if
the student receives a performance level.
B. Student Report 1. State performance will always appear on the student report, regardless of
the student’s status. a. A bar on the student report will indicate the percentage of students
who appear in each performance level for each subject. 2. If a student is First year LEP and incomplete in Reading, the student will
receive the note “Student is Limited English Proficient (LEP). Your student is in his or her first year in a United States school. For further information please contact your school principal or testing director."
3. If the student is First year LEP but is not incomplete in Reading then the student receives his earned scaled score and performance level.
9
4. If a student is First year LEP, the math and science performance levels are the name of the earned performance level and the scaled score is the student’s earned score.
5. If the student is not first year LEP, the performance level name corresponding to the student’s earned score is displayed.
6. If the student is incomplete the student receives the scores with the note “Your student did not complete the 2016 CRT. For further information please contact your school principal or testing director.”
7. If the student is NSA the student receives his scores with the note “Your student was administered the 2016 CRT with a non-standard testing accommodation. For further information please contact your school principal or testing director.”
8. If there is no last name or first name for the student, the name displayed is “Name Not Provided”.
9. Alt students who are halted receive their scores and performance level and the note “Teacher halted the administration of one or more of the five tasklets after the student scored a 0 for three consecutive items within a tasklet on two different test administrations. Any completed tasklets have been scored and are reflected in the student's scaled score.”
10. If the student is DNP the student receives a Student Report. The student receives scaled score =200 and performance level =Novice. The standards will not be reported. The student receives the note “Student did not participate.”
11. If the student had a testing irregularity the student receives the note “A test administration irregularity has affected your student’s results. For further information please contact your school principal or testing director.”
12. Total Points Possible, Student percent of points earned, and Average state percent are suppressed for students who took Braille test (Braille=’1’) or who used JAWS (JAWS=’1’). This suppression is applied only to the standards which contain the items not on the student’s form.
13. For each scored subject, the student report will show a bar with the subject scaled score, as well as an error bar showing the low and high scaled scores, adjusted so these scores are equidistant from the scaled score.
14. Only content standards that apply to the student are printed. 15. The following standards are not reported for either CRT or CRT-Alt:
a. Reading standard 3 b. Mathematics standard 1 c. Science standards 5 and 6
16. (Alt only) Do not suppress standard data regardless of the number of total possible points.
17. (Alt only) Given aggregate data are at the state level only, data are not suppressed based on total number of students.
C. Roster & Item Level Report-Alternate Assessment only 1. If a student is First year LEP and the student is not incomplete in Reading:
10
a. The math (and science) performance level is the abbreviation of the earned performance level and the scaled score is the student’s earned score.
b. The reading performance level is the abbreviation of the earned performance level and the scaled score is the student’s earned score.
c. The student is excluded from Reading, Math and Science aggregations.
2. If the student is First year LEP and incomplete in Reading a. The student’s Reading, Math (and Science) performance levels
are ‘LEP’ b. The student’s math (and science) scaled score is the student’s
earned scaled score and the reading scaled score is blank. c. The student’s responses for all subjects are displayed. d. The student is excluded from Math, Reading (and Science)
aggregations. 3. If the student is not first year LEP, the performance level abbreviation
corresponding to the student’s earned score is displayed. 4. If the student is incomplete the student receives the scores with a footnote
(†) “Student did not complete the assessment.” 5. There is no last name or first name for the student, the name displayed is
“Name Not Provided”. These students appear at the bottom of the roster. 6. If class/group information is missing the roster is done at the school level. 7. Results for Alternate Assessment students are reported only on their
class/group/school’s alternate Roster & Item Level Report. 8. Within each demonstration school the class is ‘DEM’. 9. Only the standards reported on the Summary report are reported on the
roster. 10. The students are sorted by lname, fname 11. Student names are formatted Lname, Fname. 12. Student names are uppercase. 13. Performance level abbreviation from section III.D is placed the
performance level column if the student receives are performance level. 14. If the student is NSAY=’1’ or NDAY=’1’ then the appropriate footnote is
placed beside the first name. ¥ “Not in school and/or system for full academic year.”
15. If [subject]halted=’1’ for any subject then the appropriate footnote is placed beside the first name. § “Teacher halted the administration of one or more of the five tasklets after the student scored a 0 for three consecutive items within a tasklet on two different test administrations. Any completed tasklets have been scored and are reflected in the student’s scaled score.”
16. Data are not suppressed regardless of the number of students included. 17. Standard data are not suppressed regardless of the number of total possible
points.
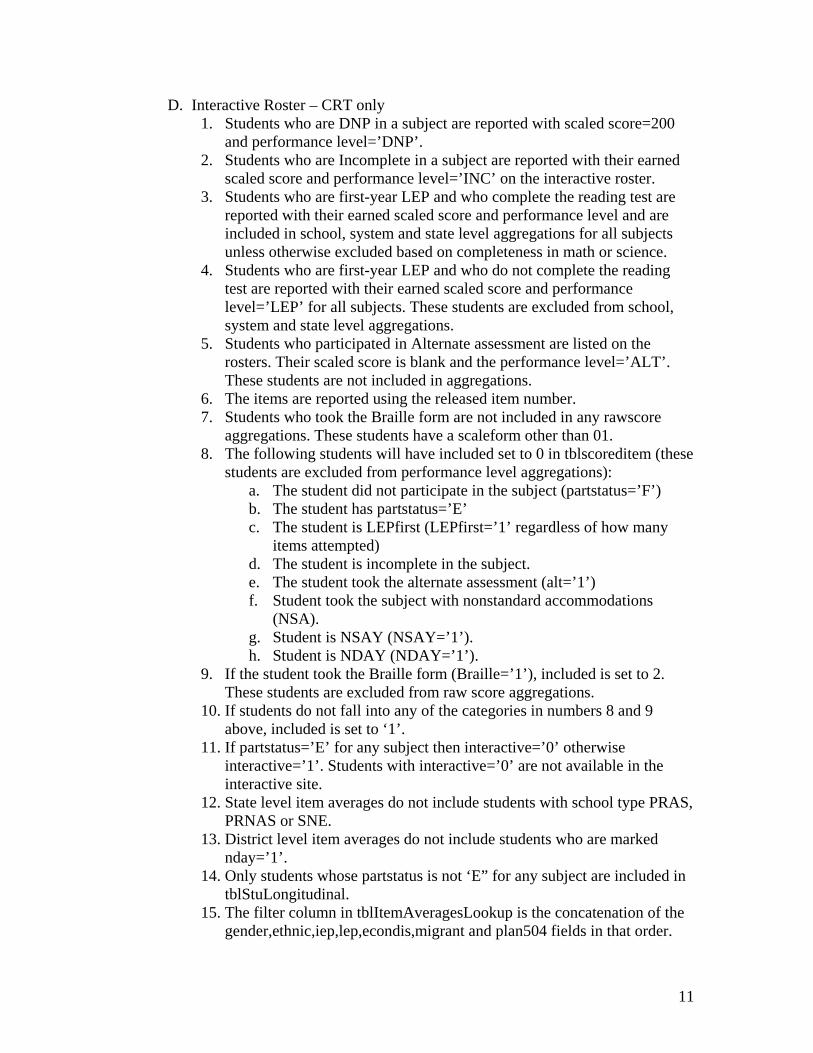
11
D. Interactive Roster – CRT only 1. Students who are DNP in a subject are reported with scaled score=200
and performance level=’DNP’. 2. Students who are Incomplete in a subject are reported with their earned
scaled score and performance level=’INC’ on the interactive roster. 3. Students who are first-year LEP and who complete the reading test are
reported with their earned scaled score and performance level and are included in school, system and state level aggregations for all subjects unless otherwise excluded based on completeness in math or science.
4. Students who are first-year LEP and who do not complete the reading test are reported with their earned scaled score and performance level=’LEP’ for all subjects. These students are excluded from school, system and state level aggregations.
5. Students who participated in Alternate assessment are listed on the rosters. Their scaled score is blank and the performance level=’ALT’. These students are not included in aggregations.
6. The items are reported using the released item number. 7. Students who took the Braille form are not included in any rawscore
aggregations. These students have a scaleform other than 01. 8. The following students will have included set to 0 in tblscoreditem (these
students are excluded from performance level aggregations): a. The student did not participate in the subject (partstatus=’F’) b. The student has partstatus=’E’ c. The student is LEPfirst (LEPfirst=’1’ regardless of how many
items attempted) d. The student is incomplete in the subject. e. The student took the alternate assessment (alt=’1’) f. Student took the subject with nonstandard accommodations
(NSA). g. Student is NSAY (NSAY=’1’). h. Student is NDAY (NDAY=’1’).
9. If the student took the Braille form (Braille=’1’), included is set to 2. These students are excluded from raw score aggregations.
10. If students do not fall into any of the categories in numbers 8 and 9 above, included is set to ‘1’.
11. If partstatus=’E’ for any subject then interactive=’0’ otherwise interactive=’1’. Students with interactive=’0’ are not available in the interactive site.
12. State level item averages do not include students with school type PRAS, PRNAS or SNE.
13. District level item averages do not include students who are marked nday=’1’.
14. Only students whose partstatus is not ‘E” for any subject are included in tblStuLongitudinal.
15. The filter column in tblItemAveragesLookup is the concatenation of the gender,ethnic,iep,lep,econdis,migrant and plan504 fields in that order.

12
16. RepType=’0’ for all records in tblItemAverages.
E. Summary Report 1. Section I (Distribution of Scores)
a. Distribution of Scores will be suppressed and left blank for systems/schools with N less than 10.
2. Section II (Subtest Results) Students with scaleform other than 01 are not included in Subtest Results.
a. Subtest Results will be suppressed and left blank for systems/schools with N less than 10.
b. A footnote reading “Results are suppressed when less than ten (10) students were assessed.” will appear at the bottom of the first page of the report.
c. (Alt only) If the number of total possible points is less than 5 for any Standard, place a dash (“--“) in the school, system, and state cells for that standard. A footnote will appear below this section reading “--There were too few score points to report on this standard, or no items on the test measured this standard.”
3. Section III (Results for Subgroups of Students) a. Performance level results for subgroups with N less than 10 are
suppressed, and the footnote “* Less than 10 students were assessed.” will appear. N is always reported.
b. CRT only: Count of students who are considered NSA for that subject excluding those students who are incomplete, nsay (at school level), nday (at school and system level) or FXS or SNE or PSNE or First year LEP or alt (general assessment report).
c. Count of First year LEP students excludes those students who are nsay (at school level), nday (at school or system level) or incomplete or FXS or SNE or PSNE or NSA or alt (general assessment).
VI. Data File Rules
1. The following students are not included in the state file: a. Alternate Assessment students (in CRT) b. Homeschooled students (SNE) c. Student is in school less than 180 hours (PSNE)
2. If the student receives a performance level ‘LEP’ on the student report in Reading, the student receives LEP for the Reading performance level in the state files.
3. Alt students who are halted are marked ‘1’ in the halted field for that subject.
4. Students who take the Braille form of the test are flagged Braille=’1’ in the state and system level files.
5. In the system and school level files only the released scored items are included.
6. The following students are not included in the system level files:
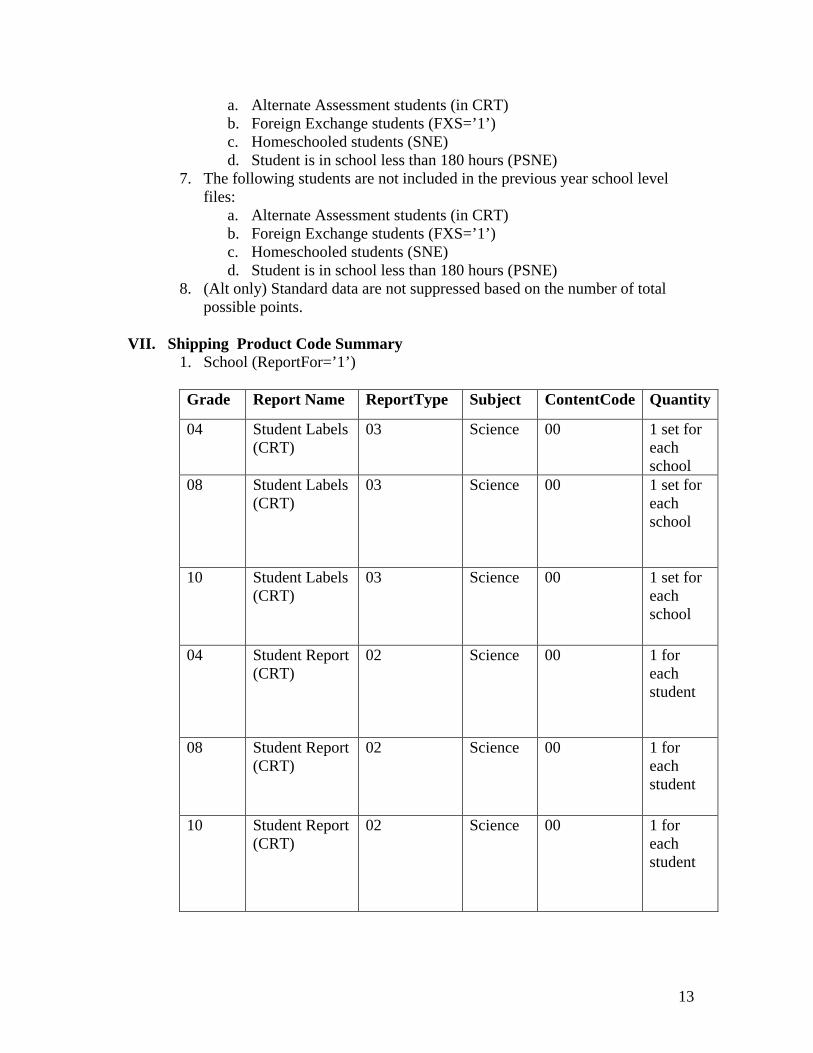
13
a. Alternate Assessment students (in CRT) b. Foreign Exchange students (FXS=’1’) c. Homeschooled students (SNE) d. Student is in school less than 180 hours (PSNE)
7. The following students are not included in the previous year school level files:
a. Alternate Assessment students (in CRT) b. Foreign Exchange students (FXS=’1’) c. Homeschooled students (SNE) d. Student is in school less than 180 hours (PSNE)
8. (Alt only) Standard data are not suppressed based on the number of total possible points.
VII. Shipping Product Code Summary
1. School (ReportFor=’1’)
Grade Report Name ReportType Subject ContentCode Quantity
04 Student Labels (CRT)
03 Science 00 1 set for each school
08
Student Labels (CRT)
03 Science 00 1 set for each school
10
Student Labels (CRT)
03 Science 00 1 set for each school
04
Student Report (CRT)
02 Science 00 1 for each student
08
Student Report (CRT)
02 Science 00 1 for each student
10
Student Report (CRT)
02 Science 00 1 for each student
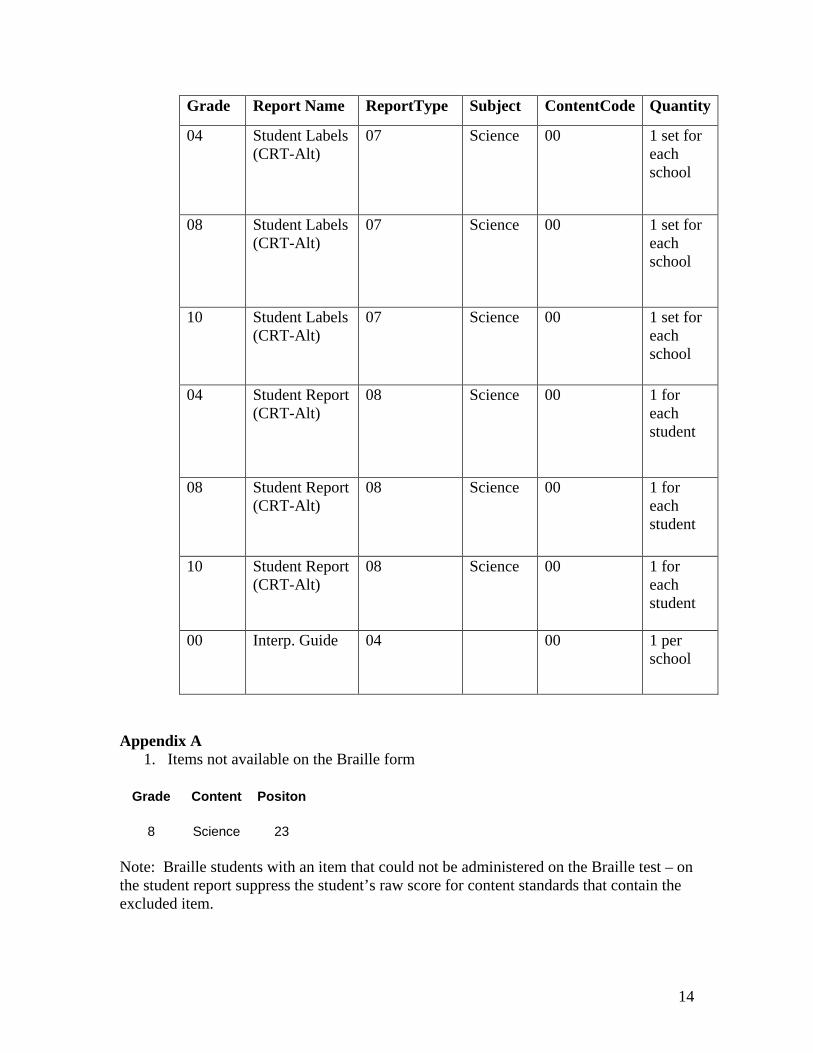
14
Grade Report Name ReportType Subject ContentCode Quantity
04 Student Labels (CRT-Alt)
07 Science 00 1 set for each school
08
Student Labels (CRT-Alt)
07 Science 00 1 set for each school
10
Student Labels (CRT-Alt)
07 Science 00 1 set for each school
04
Student Report (CRT-Alt)
08 Science 00 1 for each student
08
Student Report (CRT-Alt)
08 Science 00 1 for each student
10
Student Report (CRT-Alt)
08 Science 00 1 for each student
00
Interp. Guide 04 00 1 per school
Appendix A
1. Items not available on the Braille form
Grade Content Positon 8 Science 23
Note: Braille students with an item that could not be administered on the Braille test – on the student report suppress the student’s raw score for content standards that contain the excluded item.
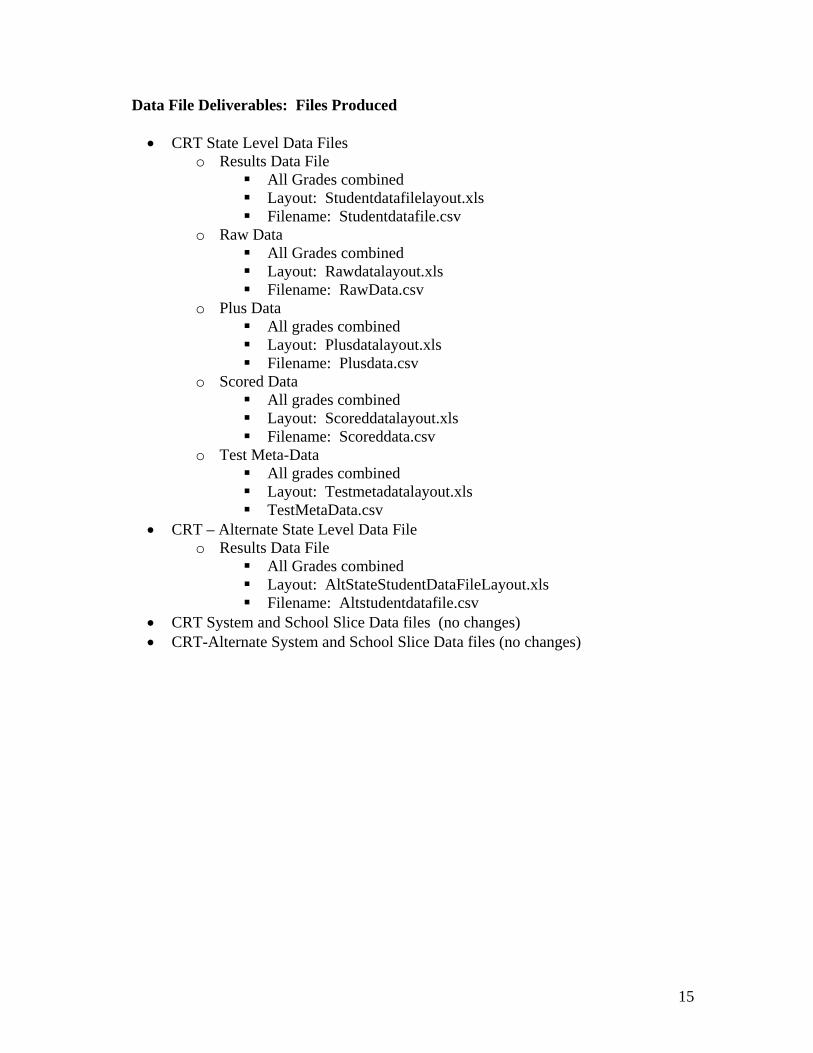
15
Data File Deliverables: Files Produced
• CRT State Level Data Files o Results Data File
All Grades combined Layout: Studentdatafilelayout.xls Filename: Studentdatafile.csv
o Raw Data All Grades combined Layout: Rawdatalayout.xls Filename: RawData.csv
o Plus Data All grades combined Layout: Plusdatalayout.xls Filename: Plusdata.csv
o Scored Data All grades combined Layout: Scoreddatalayout.xls Filename: Scoreddata.csv
o Test Meta-Data All grades combined Layout: Testmetadatalayout.xls TestMetaData.csv
• CRT – Alternate State Level Data File o Results Data File
All Grades combined Layout: AltStateStudentDataFileLayout.xls Filename: Altstudentdatafile.csv
• CRT System and School Slice Data files (no changes) • CRT-Alternate System and School Slice Data files (no changes)

Appendix P—Report Shells 1 2015–16 Montana CRT-Alternate Technical Report
APPENDIX P—REPORT SHELLS

MontCASCriterion-Referenced Test-Alternate (CRT-Alt)Student Report • 2016
What can you do to help your student?
It is important to support your student in his or her studies now and throughout his or her future education.
Here are some tips for supporting your student in the completion of his or her schoolwork:• Have regular discussions with your student's teacher(s) to see what you
can do at home to support your student's work in school, such as making sure homework is done.
• Discuss with your student the subjects in which he or she needs improve- ment. Talk about whether there has been a noticeable improvement. If not, find out why.
• Ask your student to explain what he or she is studying. These conversa- tions help you to follow your student's progress and help your student to remember what he or she has learned.
• Make sure your student gets enough rest, eats properly, and arrives at school on time every day. Send your student to school prepared to learn.
How a student with disabilities will participate in the state’s accountability system is decided by the student’s Individualized Education Program (IEP) team. Only students considered to have a significant cognitive disability are eligible to take the alternate assessment. IEP teams are informed that the decision to have a student participate in the CRT-Alt may not be based on excessive or extended absence; disability category; social, cultural, or economic factors; the amount of time receiving special education services; or academic achievement significantly lower than his or her same-age peers.
Science Grades 4, 8, and 10
• Multiple-choice questions: Students choose the correct answer from four options. A student’s score is determined by the level of support, or scaffolding, required to choose a correct response. Each student has an opportunity to first answer without assistance to assure the opportunity to get the highest score possible.
• Other questions may ask the students to categorize items, place items on charts, etc.
• All choices are in the form of pictures, words, numbers, or a combination of these. The test administrator can adapt these materials, such as enlarg- ing the text, to help a student access the content on the test.
MontCAS CRT-Alt test results are used for the following purposes:• to assist educators in planning improvements to curriculum and instruction.• to determine whether schools are helping their students meet the state
content standards.
Website: https://data.opi.mt.gov/opireportingcenterMontana requirements for the participation of students with disabilities on the CRT:http://www.opi.mt.gov/Curriculum/MontCAS
OPI contact: Judy Snow, State Assessment Director, 406-444-3656,[email protected]
Who takes the CRT-Alt?
What subjects were tested in spring 2016?
What types of questions are on the CRT-Alt?
How are the CRT-Alt results used?
Where can you find more information?
What is the MontCAS Criterion-Referenced Test-Alternate (CRT-Alt)?
The Montana Comprehensive Assessment System (MontCAS) Criterion- Referenced Test-Alternate (CRT-Alt) is the state’s measure of student performance on the state content standards, which establish goals for what all students should know and be able to do.
Students in grades 4, 8, and 10 in Science take the CRT or the CRT-Alt each year. Your student participated in the CRT-Alt. The CRT-Alt measures your student’s performance based on alternate achievement standards.
The CRT-Alt is aligned with the Montana state standards for Science. Test results are based on teacher observations of your student’s performance on specifically designed test items.
Letter from Superintendent
Dear Parents/Guardians:The Montana Comprehensive Assessment System (MontCAS)
Science Criterion-Referenced Test (CRT) and Science Criterion Referenced Test-Alternate (Alt) in grades 4, 8, and 10 measure student achievement on the state science content standards which establish goals for what all students should know and be able to do.
Your student participated in the CRT-Alternate Science assessment. The CRT-Alternate measures your student's perform- ance based on alternate achievement standards. The CRT- Alternate is aligned with the Montana state standards for Science. Test results are based on teacher observations of your student's performance on specifically designated test items.
This report shows how your student performed on the March 2016 CRT-Alternate. The results of this standards-based assess- ment are reported in four performance levels: Advanced, Proficient, Nearing Proficiency, and Novice. While some students may not yet meet the standards, keep in mind that the standards are rigorous and challenging. Our long term goal is for all students to achieve these high standards so that Montana youth will be among the best educated in the world. The staff at your school will be able to provide further information about your student’s performance on the CRT-Alternate.
The CRT-Alternate is only one measure of student performance and should be viewed in the context of the student’s local programs and other measures. The CRT-Alternate is required by the No Child Left Behind Act and is part of an ongoing statewide educational improvement process. I encourage you to contact your student’s school to begin a conversation that will support your student’s success.
Sincerely,
Denise Juneau
Montana Superintendent of Public InstructionMontana office of Public InstructionPO Box 202501Helena, Montana 59620-2501http://www.opi.mt.gov
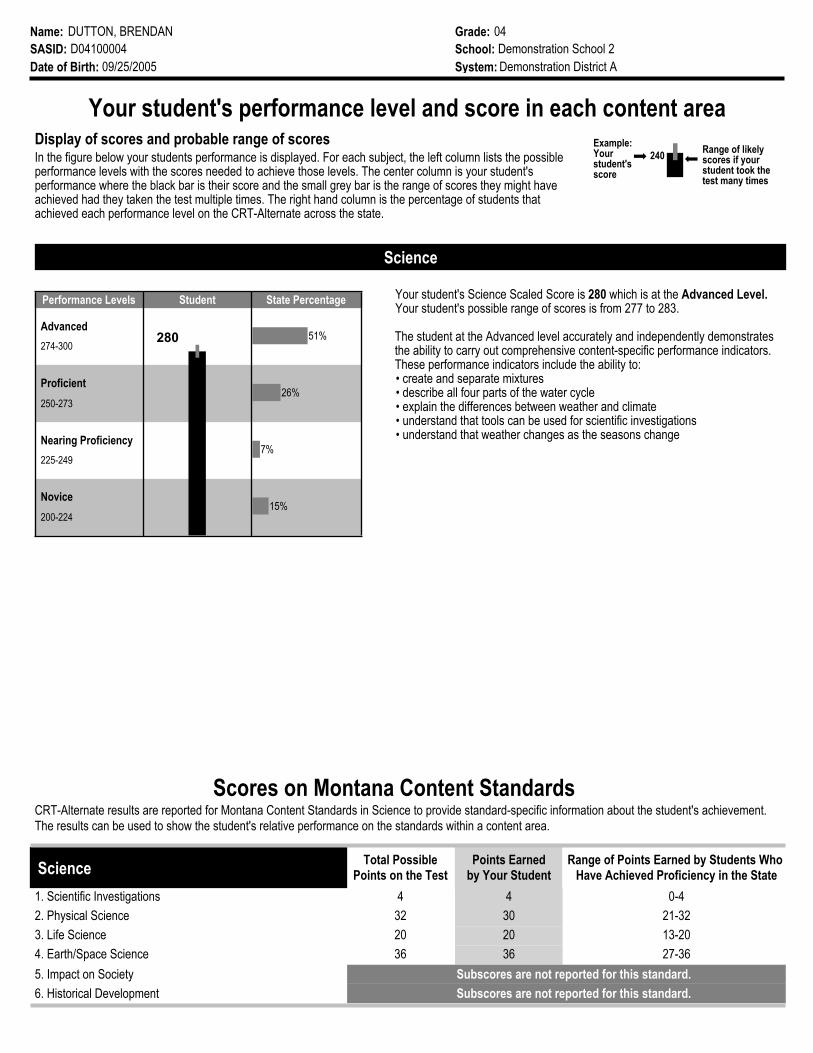
In the figure below your students performance is displayed. For each subject, the left column lists the possible performance levels with the scores needed to achieve those levels. The center column is your student's performance where the black bar is their score and the small grey bar is the range of scores they might have achieved had they taken the test multiple times. The right hand column is the percentage of students that achieved each performance level on the CRT-Alternate across the state.
Your student's performance level and score in each content areaDisplay of scores and probable range of scores
Scores on Montana Content StandardsCRT-Alternate results are reported for Montana Content Standards in Science to provide standard-specific information about the student's achievement. The results can be used to show the student's relative performance on the standards within a content area.
Your student's Science Scaled Score is 280 which is at the Advanced Level. Your student's possible range of scores is from 277 to 283.
The student at the Advanced level accurately and independently demonstrates the ability to carry out comprehensive content-specific performance indicators. These performance indicators include the ability to:• create and separate mixtures• describe all four parts of the water cycle• explain the differences between weather and climate• understand that tools can be used for scientific investigations• understand that weather changes as the seasons change
Example:Your student'sscore
° «Range of likely scores if your student took the test many times
240
Name:
SASID:
Date of Birth:
Grade:
School:
System:
DUTTON, BRENDAN
D04100004
09/25/2005
04
Demonstration School 2
Demonstration District A
Science
Performance Levels Student State Percentage
Advanced
Proficient
Nearing Proficiency
Novice
274-300
250-273
225-249
200-224
51%
26%
7%
15%
280
ScienceRange of Points Earned by Students Who
Have Achieved Proficiency in the StatePoints Earned
by Your StudentTotal Possible
Points on the Test
1. Scientific Investigations 4 4 0-4
2. Physical Science 32 30 21-32
3. Life Science 20 20 13-20
4. Earth/Space Science 36 36 27-36
5. Impact on Society Subscores are not reported for this standard.
6. Historical Development Subscores are not reported for this standard.
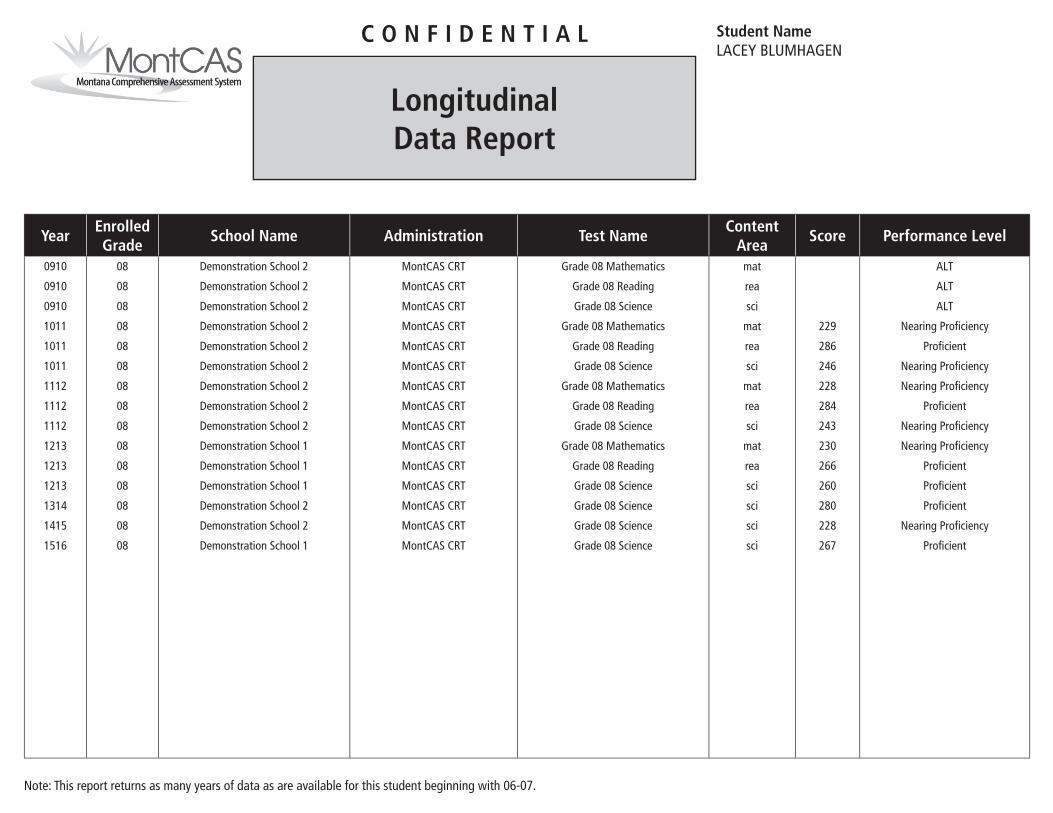
Student NameLACEY BLUMHAGEN
Longitudinal Data Report
C O N F I D E N T I A L
Note: This report returns as many years of data as are available for this student beginning with 06-07.
YearEnrolled Grade
School Name Administration Test NameContent
AreaScore Performance Level
0910
0910
0910
1011
1011
1011
1112
1112
1112
1213
1213
1213
1314
1415
1516
08
08
08
08
08
08
08
08
08
08
08
08
08
08
08
Demonstration School 2
Demonstration School 2
Demonstration School 2
Demonstration School 2
Demonstration School 2
Demonstration School 2
Demonstration School 2
Demonstration School 2
Demonstration School 2
Demonstration School 1
Demonstration School 1
Demonstration School 1
Demonstration School 2
Demonstration School 2
Demonstration School 1
MontCAS CRT
MontCAS CRT
MontCAS CRT
MontCAS CRT
MontCAS CRT
MontCAS CRT
MontCAS CRT
MontCAS CRT
MontCAS CRT
MontCAS CRT
MontCAS CRT
MontCAS CRT
MontCAS CRT
MontCAS CRT
MontCAS CRT
Grade 08 Mathematics
Grade 08 Reading
Grade 08 Science
Grade 08 Mathematics
Grade 08 Reading
Grade 08 Science
Grade 08 Mathematics
Grade 08 Reading
Grade 08 Science
Grade 08 Mathematics
Grade 08 Reading
Grade 08 Science
Grade 08 Science
Grade 08 Science
Grade 08 Science
mat
rea
sci
mat
rea
sci
mat
rea
sci
mat
rea
sci
sci
sci
sci
229
286
246
228
284
243
230
266
260
280
228
267
ALT
ALT
ALT
Nearing Proficiency
Proficient
Nearing Proficiency
Nearing Proficiency
Proficient
Nearing Proficiency
Nearing Proficiency
Proficient
Proficient
Proficient
Nearing Proficiency
Proficient
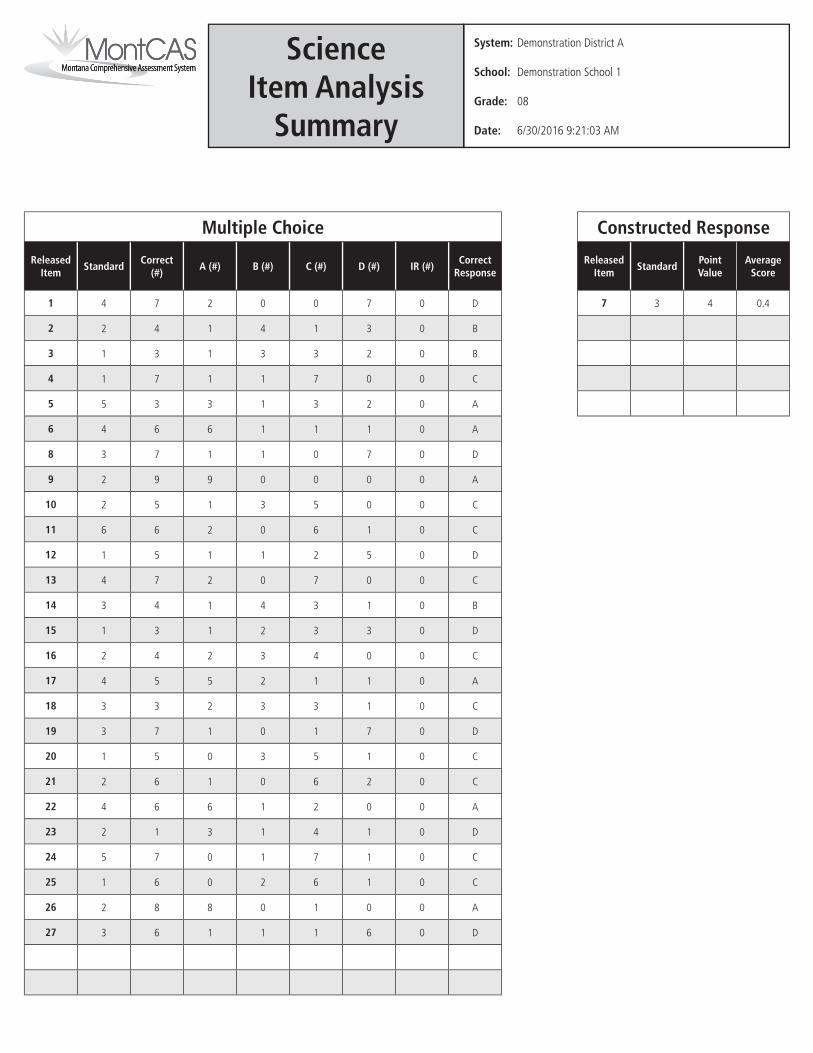
System: Demonstration District A
School: Demonstration School 1
Grade: 08
Date: 6/30/2016 9:21:03 AM
ScienceItem Analysis
Summary
Multiple Choice
ReleasedItem
StandardCorrect
(#)A (#) B (#) C (#) D (#) IR (#)
Correct Response
1
2
3
4
5
6
8
9
10
11
12
13
14
15
16
17
18
19
20
21
22
23
24
25
26
27
4
2
1
1
5
4
3
2
2
6
1
4
3
1
2
4
3
3
1
2
4
2
5
1
2
3
7
4
3
7
3
6
7
9
5
6
5
7
4
3
4
5
3
7
5
6
6
1
7
6
8
6
2
1
1
1
3
6
1
9
1
2
1
2
1
1
2
5
2
1
0
1
6
3
0
0
8
1
0
4
3
1
1
1
1
0
3
0
1
0
4
2
3
2
3
0
3
0
1
1
1
2
0
1
0
1
3
7
3
1
0
0
5
6
2
7
3
3
4
1
3
1
5
6
2
4
7
6
1
1
7
3
2
0
2
1
7
0
0
1
5
0
1
3
0
1
1
7
1
2
0
1
1
1
0
6
0
0
0
0
0
0
0
0
0
0
0
0
0
0
0
0
0
0
0
0
0
0
0
0
0
0
D
B
B
C
A
A
D
A
C
C
D
C
B
D
C
A
C
D
C
C
A
D
C
C
A
D
Constructed Response
Released Item
StandardPoint Value
Average Score
7 3 4 0.4
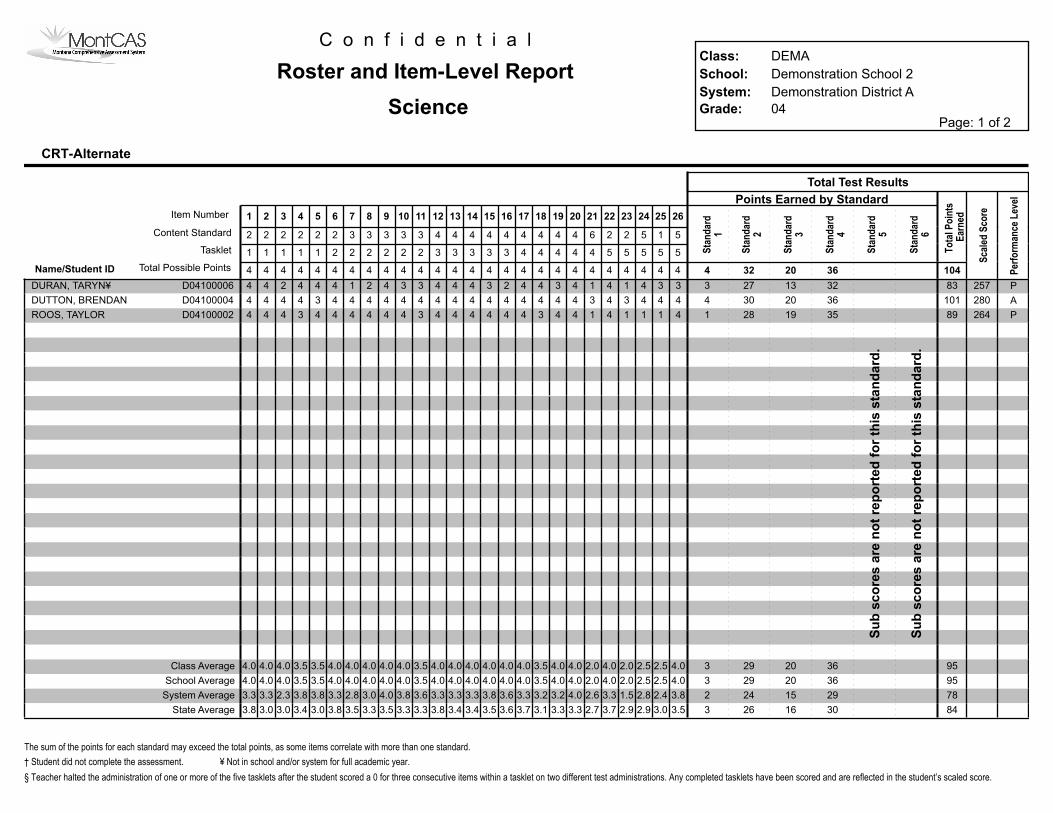
#Split_Tag::\\measuredprogress.org\deliverables\Montana 15-16 AA\Release1\Web\DEMA\DEMADEM2\MTAlt1516RosterStudent04Sci_DEMADEM2.pdf#
C o n f i d e n t i a l
Roster and Item-Level Report School: Demonstration School 2
Class: DEMA
System: Demonstration District A
Grade: 04Page: 1 of 2
Science
CRT-Alternate
Name/Student ID Total Possible Points
Tasklet
Content Standard
Item Number
To
tal P
oin
ts
Ear
ned
Sca
led
Sco
re
Per
form
ance
Lev
el
65432 2322212019181716151413121110987 2524
Points Earned by Standard
Sta
nd
ard
4
Sta
nd
ard
5
Sta
nd
ard
1
Sta
nd
ard
2
Sta
nd
ard
3
Sta
nd
ard
6
261
Total Test Results
Su
b s
co
res a
re n
ot
rep
ort
ed
fo
r th
is s
tan
dard
.
Su
b s
co
res a
re n
ot
rep
ort
ed
fo
r th
is s
tan
dard
.
2 5152264444444443333322222
1 5555544444333332222221111
4 4444444444444444444444444 4 32 20 36 8 4 104
DURAN, TARYN¥ 4 3341414344234443342144424 3 27 13 32D04100006 257 P83
DUTTON, BRENDAN 4 4443434444444444444443444 4 30 20 36D04100004 280 A101
ROOS, TAYLOR 4 4111414434444443444444344 1 28 19 35D04100002 264 P89
4.0 4.02.52.52.04.02.04.04.03.54.04.04.04.04.04.03.54.04.04.04.04.03.53.54.04.0 3 29 20 36 95Class Average
4.0 4.02.52.52.04.02.04.04.03.54.04.04.04.04.04.03.54.04.04.04.04.03.53.54.04.0 3 29 20 36 95School Average
3.3 3.82.42.81.53.32.64.03.23.23.33.63.83.33.33.33.63.84.03.02.83.33.83.82.33.3 2 24 15 29 78System Average
3.8 3.53.02.92.93.72.73.33.33.13.73.63.53.43.43.83.33.33.53.33.53.83.03.43.03.0 3 26 16 30 84State Average
The sum of the points for each standard may exceed the total points, as some items correlate with more than one standard.
† Student did not complete the assessment. ¥ Not in school and/or system for full academic year.
§ Teacher halted the administration of one or more of the five tasklets after the student scored a 0 for three consecutive items within a tasklet on two different test administrations. Any completed tasklets have been scored and are reflected in the student’s scaled score.
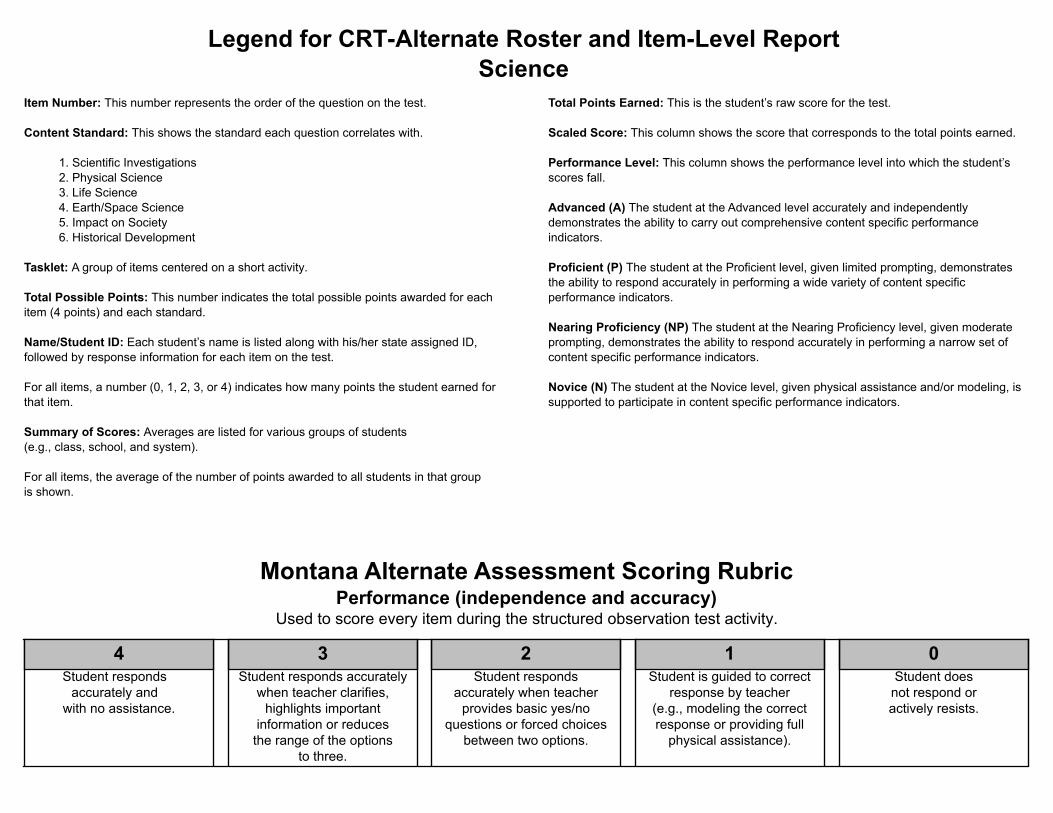
Legend for CRT-Alternate Roster and Item-Level ReportScience
Total Points Earned: This is the student’s raw score for the test.
Scaled Score: This column shows the score that corresponds to the total points earned.
Performance Level: This column shows the performance level into which the student’s scores fall.
Advanced (A) The student at the Advanced level accurately and independently demonstrates the ability to carry out comprehensive content specific performance indicators.
Proficient (P) The student at the Proficient level, given limited prompting, demonstrates the ability to respond accurately in performing a wide variety of content specific performance indicators.
Nearing Proficiency (NP) The student at the Nearing Proficiency level, given moderate prompting, demonstrates the ability to respond accurately in performing a narrow set of content specific performance indicators.
Novice (N) The student at the Novice level, given physical assistance and/or modeling, is supported to participate in content specific performance indicators.
Student respondsaccurately and
with no assistance.
4 3Student responds accurately
when teacher clarifies,highlights important
information or reducesthe range of the options
to three.
2 1Student is guided to correct
response by teacher(e.g., modeling the correctresponse or providing full
physical assistance).
Student respondsaccurately when teacher
provides basic yes/noquestions or forced choices
between two options.
0Student does
not respond oractively resists.
Item Number: This number represents the order of the question on the test.
Content Standard: This shows the standard each question correlates with.
1. Scientific Investigations2. Physical Science3. Life Science4. Earth/Space Science5. Impact on Society 6. Historical Development
Tasklet: A group of items centered on a short activity.
Total Possible Points: This number indicates the total possible points awarded for each item (4 points) and each standard.
Name/Student ID: Each student’s name is listed along with his/her state assigned ID, followed by response information for each item on the test.
For all items, a number (0, 1, 2, 3, or 4) indicates how many points the student earned for that item.
Summary of Scores: Averages are listed for various groups of students(e.g., class, school, and system).
For all items, the average of the number of points awarded to all students in that group is shown.
Montana Alternate Assessment Scoring RubricPerformance (independence and accuracy)
Used to score every item during the structured observation test activity.
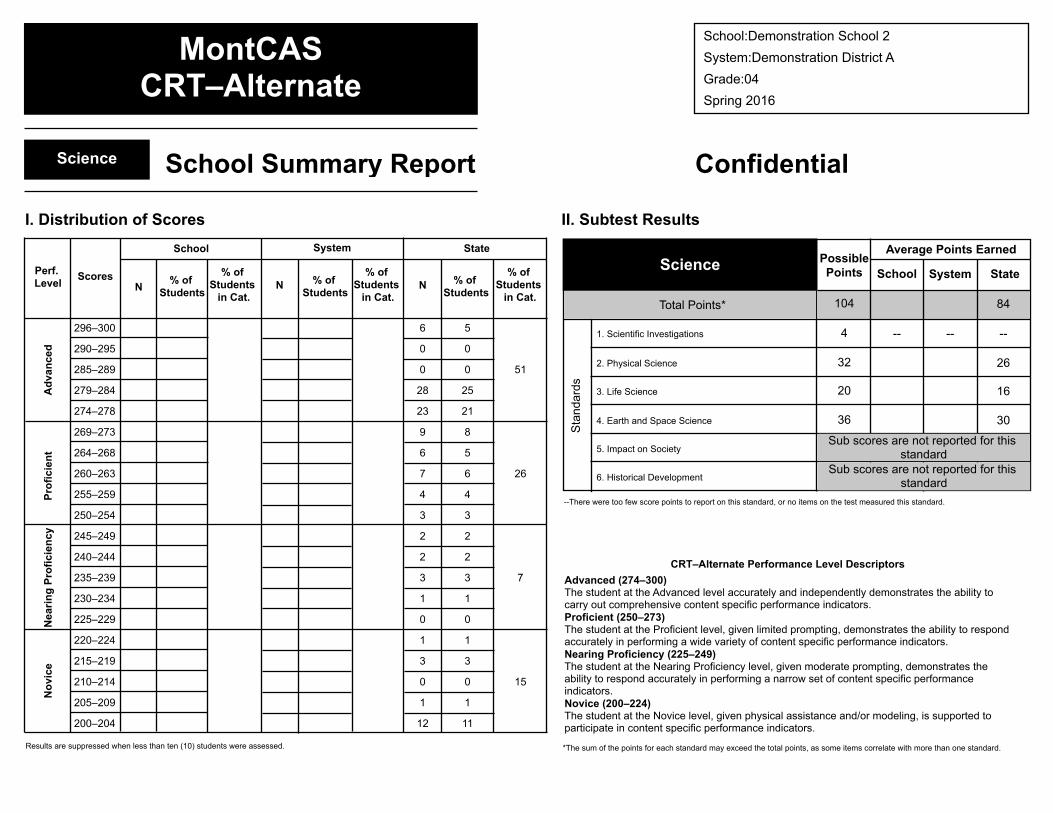
#Split_Tag::\\measuredprogress.org\deliverables\Montana 15-16 AA\Release1\Web\DEMA\DEMADEM2\MTAlt1516SummarySchool04Sci_DEMADEM2.pdf#
1. Scientific Investigations
2. Physical Science
3. Life Science
4. Earth and Space Science
5. Impact on Society
6. Historical Development
Total Points
Science PossiblePoints
Average Points Earned
StateSystemSchool
Sta
ndard
s
4
20
36
84
26
16
30
104
32
-- ----
--There were too few score points to report on this standard, or no items on the test measured this standard.
Sub scores are not reported for this standard
Sub scores are not reported for this standard
*
Advanced (274–300)The student at the Advanced level accurately and independently demonstrates the ability to carry out comprehensive content specific performance indicators.Proficient (250–273)The student at the Proficient level, given limited prompting, demonstrates the ability to respond accurately in performing a wide variety of content specific performance indicators.Nearing Proficiency (225–249)The student at the Nearing Proficiency level, given moderate prompting, demonstrates the ability to respond accurately in performing a narrow set of content specific performance indicators.Novice (200–224)The student at the Novice level, given physical assistance and/or modeling, is supported to participate in content specific performance indicators.
CRT–Alternate Performance Level Descriptors
*The sum of the points for each standard may exceed the total points, as some items correlate with more than one standard.
MontCASCRT–Alternate
School:Demonstration School 2
System:Demonstration District A
Grade:04
Spring 2016
Science
I. Distribution of Scores II. Subtest Results
School System State
Perf. Level
ScoresN
% of Students
% of Students
in Cat.N % of
Students
% of Students
in Cat.N % of
Students
% of Students
in Cat.
School Summary Report Confidential
No
vic
eA
dvan
ced
Neari
ng
Pro
ficie
ncy
Pro
ficie
nt
6 5296–300
0 0290–295
0 0 51285–289
28 25279–284
23 21274–278
9 8269–273
6 5264–268
7 6 26260–263
4 4255–259
3 3250–254
2 2245–249
2 2240–244
3 3 7235–239
1 1230–234
0 0225–229
1 1220–224
3 3215–219
0 0 15210–214
1 1205–209
12 11200–204
Results are suppressed when less than ten (10) students were assessed.
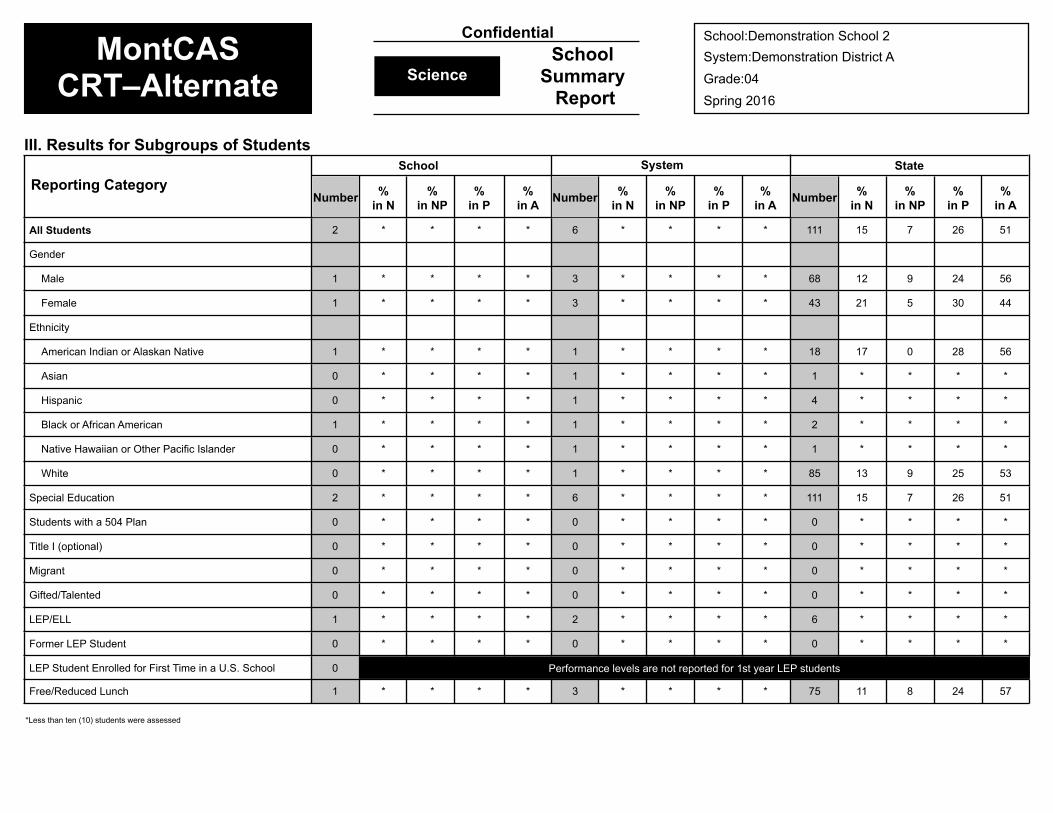
NumberNumber Number
MontCASCRT–Alternate
ScienceSchool
Summary Report
School:Demonstration School 2
System:Demonstration District A
Grade:04
Spring 2016
III. Results for Subgroups of Students
Reporting Category
SystemSchool State
%in N
%in NP
%in P
%in A
%in N
%in NP
%in P
%in A
%in N
%in NP
%in P
%in A
Confidential
All Students 2 * * * * 6 * * * * 111 15 7 26 51
Gender
Male 1 * * * * 3 * * * * 68 12 9 24 56
Female 1 * * * * 3 * * * * 43 21 5 30 44
Ethnicity
American Indian or Alaskan Native 1 * * * * 1 * * * * 18 17 0 28 56
Asian 0 * * * * 1 * * * * 1 * * * *
Hispanic 0 * * * * 1 * * * * 4 * * * *
Black or African American 1 * * * * 1 * * * * 2 * * * *
Native Hawaiian or Other Pacific Islander 0 * * * * 1 * * * * 1 * * * *
White 0 * * * * 1 * * * * 85 13 9 25 53
Special Education 2 * * * * 6 * * * * 111 15 7 26 51
Students with a 504 Plan 0 * * * * 0 * * * * 0 * * * *
Title I (optional) 0 * * * * 0 * * * * 0 * * * *
Migrant 0 * * * * 0 * * * * 0 * * * *
Gifted/Talented 0 * * * * 0 * * * * 0 * * * *
LEP/ELL 1 * * * * 2 * * * * 6 * * * *
Former LEP Student 0 * * * * 0 * * * * 0 * * * *
Performance levels are not reported for 1st year LEP studentsLEP Student Enrolled for First Time in a U.S. School 0
Free/Reduced Lunch 1 * * * * 3 * * * * 75 11 8 24 57
*Less than ten (10) students were assessed

#Split_Tag::\\measuredprogress.org\deliverables\Montana 15-16 AA\Release1\Web\DEMA\MTAlt1516SummarySystem04Sci_DEMA.pdf#
Sub scores are not reported for this standard
Science
1. Scientific Investigations
2. Physical Science
3. Life Science
4. Earth and Space Science
5. Impact on Society
6. Historical Development
Total Points
PossiblePoints StateSystem
Sta
ndard
s
4
20
36
84
26
16
30
104
32
----
--There were too few score points to report on this standard, or no items on the test measured this standard.
Average Points Earned
Sub scores are not reported for this standard
*
Advanced (274–300)The student at the Advanced level accurately and independently demonstrates the ability to carry out comprehensive content specific performance indicators.Proficient (250–273)The student at the Proficient level, given limited prompting, demonstrates the ability to respond accurately in performing a wide variety of content specific performance indicators.Nearing Proficiency (225–249)The student at the Nearing Proficiency level, given moderate prompting, demonstrates the ability to respond accurately in performing a narrow set of content specific performance indicators.Novice (200–224)The student at the Novice level, given physical assistance and/or modeling, is supported to participate in content specific performance indicators.
CRT–Alternate Performance Level Descriptors
*The sum of the points for each standard may exceed the total points, as some items correlate with more than one standard.
MontCASCRT–Alternate
System:Demonstration District A
Grade:04
Spring 2016
Science
I. Distribution of Scores II. Subtest Results
System State
Perf. Level
ScoresN % of
Students
% of Students
in Cat.
System Summary Report Confidential
No
vic
eA
dvan
ced
Neari
ng
Pro
ficie
ncy
N % of Students
% of Students
in Cat.
Pro
ficie
nt
6 5296–300
0 0290–295
0 0 51285–289
28 25279–284
23 21274–278
9 8269–273
6 5264–268
7 6 26260–263
4 4255–259
3 3250–254
2 2245–249
2 2240–244
3 3 7235–239
1 1230–234
0 0225–229
1 1220–224
3 3215–219
0 0 15210–214
1 1205–209
12 11200–204
Results are suppressed when less than ten (10) students were assessed.
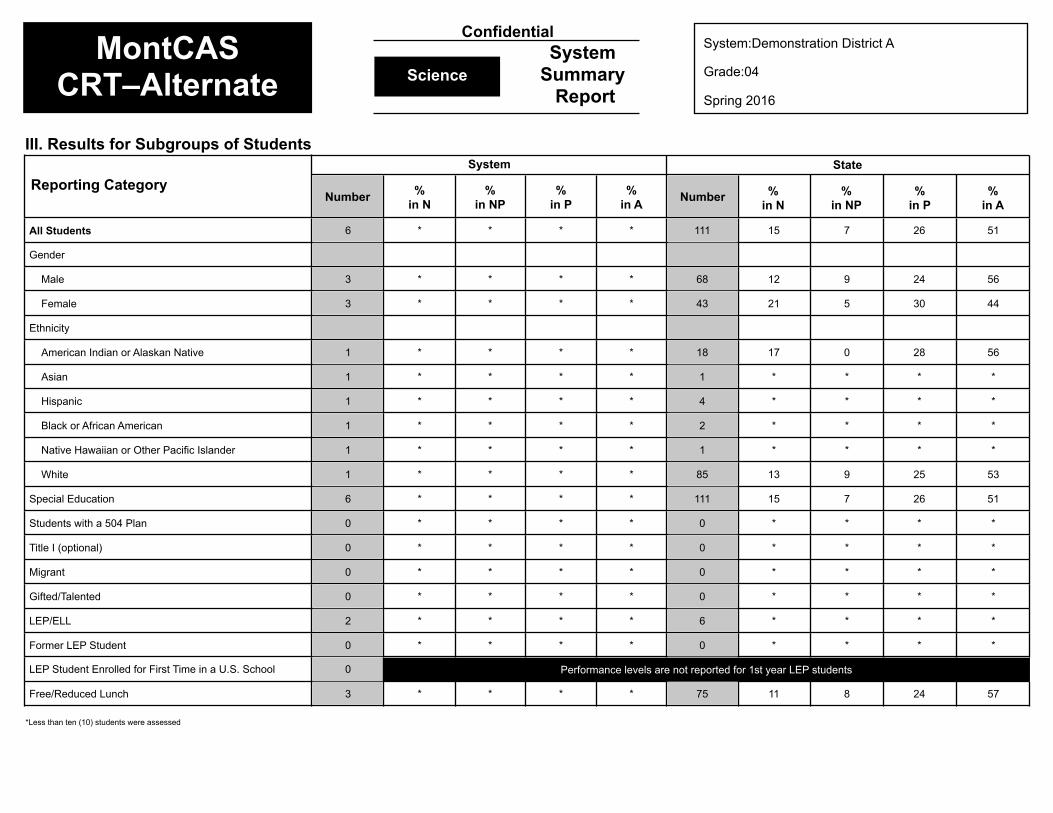
Number
MontCASCRT–Alternate Science
System Summary
Report
System:Demonstration District A
Grade:04
Spring 2016
III. Results for Subgroups of Students
Reporting Category
System State
%in N
%in NP
%in P
%in A
Number %in N
%in NP
%in P
%in A
Confidential
****6 5126715111All Students
Gender
****3 562491268Male
****3 443052143Female
Ethnicity
****1 562801718American Indian or Alaskan Native
****1 ****1Asian
****1 ****4Hispanic
****1 ****2Black or African American
****1 ****1Native Hawaiian or Other Pacific Islander
****1 532591385White
****6 5126715111Special Education
****0 ****0Students with a 504 Plan
****0 ****0Title I (optional)
****0 ****0Migrant
****0 ****0Gifted/Talented
****2 ****6LEP/ELL
****0 ****0Former LEP Student
Performance levels are not reported for 1st year LEP studentsLEP Student Enrolled for First Time in a U.S. School 0
****3 572481175Free/Reduced Lunch
*Less than ten (10) students were assessed
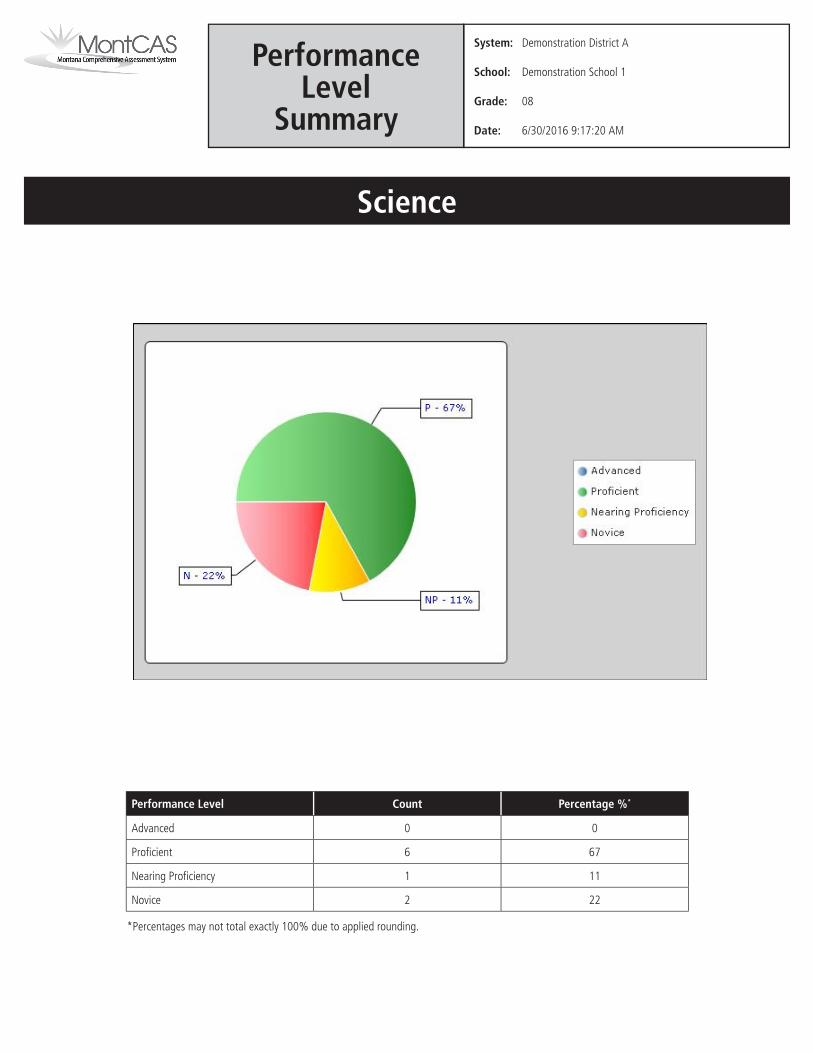
Performance Level Count Percentage %*
Advanced 0
6
1
2
0
67
11
22
Profi cient
Nearing Profi ciency
Novice
System: Demonstration District A
School: Demonstration School 1
Grade: 08
Date: 6/30/2016 9:17:20 AM
PerformanceLevel
Summary
Science
*Percentages may not total exactly 100% due to applied rounding.