monopoly and other forms of imperfect competition 1
TRANSCRIPT

Monopoly and Other Forms of Imperfect Competition
Monopoly and Other Forms of Imperfect Competition
1

Slide 2
Perfectly Competitive Market
An ideal market that maximizes economic surplus
A situation that does not always exist

Slide 3
Imperfect Competition
Imperfectly Competitive Firms Have some control over price Price may be greater than the marginal
cost of production Long-run economic profits are possible Reduce economic surplus to varying
degrees Are very common

Slide 4
1. Pure Monopoly The only supplier of a unique product with no
close substitutes
2. Monopolistic Competition A large number of firms that produce slightly
differentiated products that are reasonably close substitutes for one another
Long-run adjustment to zero economic profits Importance of differentiation
Forms of Imperfect Competition

Slide 5
3. Oligopoly Industry structure in which a small
number of firms produce products that are either close or perfect substitutes
Cost advantages from large size may prevent the long-run adjustment to zero economic profit
Undifferentiated and differentiated products
Forms of Imperfect Competition

Slide 6
The perfectly competitive firm faces a perfectly elastic demand for its product.
The imperfectly competitive firm faces a downward-sloping demand curve.
Essential Difference Between Perfectly and Imperfectly Competitive Firms

Slide 7
The Demand Curves Facing Perfectly and Imperfectly Competitive Firms
Quantity
$/u
nit
of
ou
tpu
t
Quantity
DMarket
price Pri
ce
D
Perfectly competitive firm Imperfectly competitive firm

Slide 8
Supply and demand determine equilibrium price. The firm has no market power.
At the equilibrium price, the firm sells all it wishes. If the firm raises its price, sales will be zero. If the firm lowers its price, sales will not
increase. The firm’s demand curve is the horizontal
line at the market price.
Perfectly competitive market

Slide 9
The firm has some control over price or some market power. A firm’s ability to raise the price of a
good without losing all its sales Sellers face a downward sloping
demand
Imperfectly Competitive Markets
Slide 10
Exclusive control over inputs Patents and Copyrights Government Licenses or Franchises Economies of Scale (Natural
Monopolies) Network Externalities
Sources of Market Power

Slide 11
Economies of Scale and the Importance of Start-Up Costs
Firms with large fixed costs and low variable costs: Have low marginal costs Average total cost declines sharply as
output increases Economies of scale will exist
Slide 12
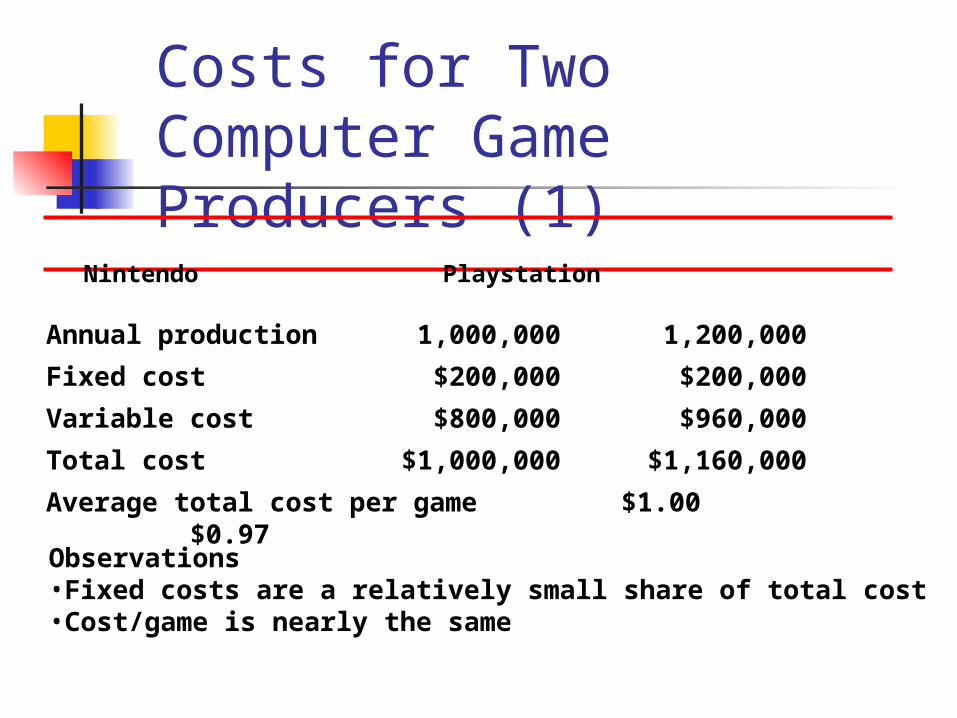
Costs for Two Computer Game Producers (1)
Nintendo Playstation
Annual production 1,000,000 1,200,000
Fixed cost $200,000 $200,000
Variable cost $800,000 $960,000
Total cost $1,000,000 $1,160,000
Average total cost per game $1.00 $0.97
Observations•Fixed costs are a relatively small share of total cost•Cost/game is nearly the same
Slide 13
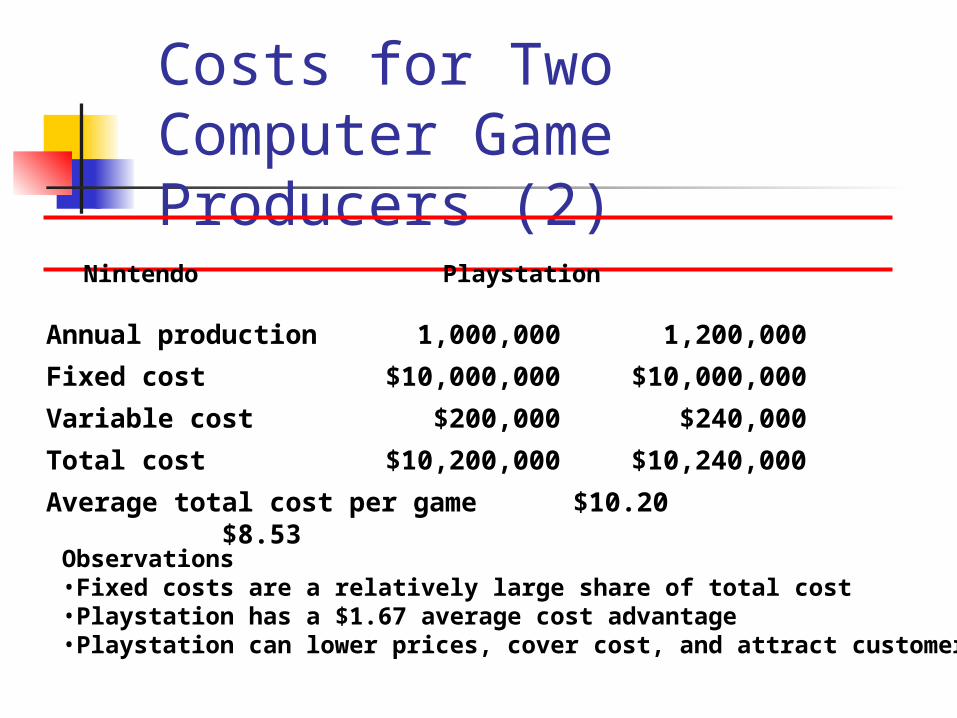
Costs for Two Computer Game Producers (2)
Annual production 1,000,000 1,200,000
Fixed cost $10,000,000 $10,000,000
Variable cost $200,000 $240,000
Total cost $10,200,000 $10,240,000
Average total cost per game $10.20 $8.53
Nintendo Playstation
Observations•Fixed costs are a relatively large share of total cost•Playstation has a $1.67 average cost advantage•Playstation can lower prices, cover cost, and attract customers

Slide 14
Annual production 500,000 1,700,000
Fixed cost $10,000,000 $10,000,000
Variable cost $100,000 $340,000
Total cost $10,100,000 $10,340,000
Average total cost per game $20.20 $6.08
Costs for Two Computer Game Producers (3)
Nintendo Playstation
• Shift of 500,000 units to Playstation• Nintendo’s average cost increases to $20.20/unit• Playstation average cost falls to $6.08• A large number of firms cannot survive when the cost differential is high

Slide 15
Economies of Scale and the Importance of Fixed Costs
Fixed investment in research and development has been increasing as a share of production costs.
1984 20% 80%1990 80% 20%
Cost of producing a computerFixed Cost Variable Cost
Software Hardware

Slide 16
Profit Maximization for the Monopolist
A price taker (perfect competition) and a price setter (imperfect competition) share the economic goal. They want: To maximize profits; i.e., To select the output level that maximizes
the difference between TR and TC, where MB= MC (when quantity is divisible and not producing at all is not optimal).

Slide 17
For a producer MB = Marginal Revenue (MR) or a
change in a firm’s total revenue that results from a one-unit change in output
Profit Maximization for the Monopolist

Slide 18
Marginal Revenue for the Monopolist Perfect competition and monopolies
Both increase output when MR > MC. Calculate MC the same way. Do not have the same MR at a given
price. In perfect competition: MR = P In monopoly: MR < P
Profit Maximization for the Monopolist

Slide 19
The Monopolist’s Benefit from Selling an Additional Unit
Pri
ce (
$/u
nit
)
Quantity (units/week)
D
8
8
2
6
3
5
• If P = $6, then TR = $6 x 2 = $12• If P = $5, then TR = $5 x 3 = $15• The MR of selling the 3rd unit = $3 (=15-12)• For the 3rd unit, MR = $3 < P = $5

Slide 20
Observations MR < P MR declines as quantity
increases MR is the change
between two quantities MR < P because price
must be lowered to sell an additional unit
6 2 12
5 3 15
4 4 16
3 5 15
P Q TR MR
3
1
-1
Marginal Revenue in Graphical Form

Slide 21
6 2 12
5 3 15
4 4 16
3 5 15
P Q TR MR
3
1
-1
Marginal Revenue in Graphical Form
Pri
ce &
mar
gin
al r
even
ue
($/u
nit
)
Quantity (units/week)
8
8
D
432-1
3
5
1
MR

Slide 22
The Marginal Revenue Curve for a Monopolist with a Straight-Line Demand Curve
Pri
ce
Quantity
Observations• The vertical intercept, a, is the same for MR and D• The horizontal intercept for MR, Q0/2, is one half the demand intercept, Q0.
D
Q0
a
Q0/2
a/2
MR

Slide 23
Profit Maximization for the Monopolist
Profit Maximizing Decision Rule When MR > MC, output should be
increased. When MR < MC, output should be
reduced. Profits are maximized at the level of
output for which MR = MC.

Slide 24
The Monopolist’s Profit-Maximizing Output Level
Pri
ce (
$/u
nit
of
ou
tpu
t)
Quantity (units/week)
6
D
3
12 24
Marginal Cost
2
4
MR
8
Observations• If P = $3 & Q = 12, MR < MC
and output should reduce• Profits are maximized at 8
units where MR = MC• P = $4 where quantity
demanded = quantity supplied

Slide 25
Even a Monopolist May Suffer an Economic Loss
Pri
ce (
$/m
inu
te)
Minutes (millions/day)
Pri
ce (
$/m
inu
te)
Minutes (millions/day)2420
0.12
0.10 ATC
20
0.08
0.10
ATC
Economic loss= $400,000/day
Economic profit= $400,000/day
D
0.05 MC
MR
D
0.05 MC
MR
Being a monopolist doesn’t guarantee an economic profit

Slide 26
D
3
12
6
24
Marginal cost
The socially optimalamount occurs whereMC = D(=MB) @ 12 units
The Demand and Marginal Cost Curves for a Monopolist
Pri
ce (
$/u
nit
of
ou
tpu
t)
Quantity (units/week)
Why the Invisible Hand Breaks Down Under Monopoly

Slide 27
2
4
MR
8
• The profit maximizing level of output of 8 units, where MR = MC, is less than the socially optimal output of 12
• Between 8 and 12, MB to society > MC to society
• Does not increase output because MR to the firms is less than MC
Pri
ce (
$/u
nit
of
ou
tpu
t)
Quantity (units/week)
D
12
6
24
Why the Invisible Hand Breaks Down Under Monopoly
3
Marginal cost
The Demand and Marginal Cost Curves for a Monopolist

Slide 28
2
4
MR
8
• Because MR<P, the monopoly produces less than the socially optimal amount
• The deadweight loss of the monopoy to society = (1/2)($2/unit)(4 units/wk) = $4/wk.P
rice
($/
un
it o
f o
utp
ut)
Quantity (units/week)
D
12
6
24
Why the Invisible Hand Breaks Down Under Monopoly
3
Marginal cost
The Demand and Marginal Cost Curves for a Monopolist
Deadweight loss

Slide 29
Why the Invisible Hand Breaks Down Under Monopoly
Monopoly Profits are
maximized where MR = MC.
P > MR P > MC Deadweight loss
Perfect Competition Profits are
maximized where MR = MC.
P = MR P = MC No deadweight
loss

Slide 30
Difficulties in Reducing the Deadweight Loss of Monopolies Enforcing antitrust laws Patents, copyrights, and innovation Natural monopolies
Why the Invisible Hand Breaks Down Under Monopoly

Slide 31
The practice of charging different buyers different prices for essentially the same good or service
Examples Senior citizens and student discounts
on movie tickets Supersaver discounts on air travel Rebate coupons
Price Discrimination

Slide 32
Why do many movie theaters offer discount tickets to students?
Food For Thought

Slide 33
How many manuscripts should Carla edit?
Example: Carla Edit

Slide 34
Total and MarginalRevenue from Editing
Reservation Price Total Revenue Marginal revenueStudent ($ per paper) ($ per week) ($ per paper)
A 40 40
B 38 76
C 36 108
D 34 136
E 32 160
F 30 180
G 28 196
H 26 208
40
36
32
28
24
20
16
12

Slide 35
How many manuscripts should Carla edit? Opportunity cost = $29 TR = P x Q, or for 4 papers, 4 x $34 =
$136/wk MR is the difference in TR from adding
another student If MR > MC: increase output
Example: Single Price Monopoly

Slide 36
How many manuscripts should Carla edit?
Carla edits 3 papers TC = 3 x $29 = $87 TR = $108 Economic profit = $108 - $87 =
$21/wk
Example: Single Price Monopoly

Slide 37
How many manuscripts should Carla edit? O.C. of her time per editing= $29 Must charge the same price Reservation price > opportunity cost for
student A to F Socially efficient number is 6
TR = 6 x $30 = $180 TC = 6 x $29 = $174 Economic profit = $180- $174 = $6
Example: Social Optimal

Slide 38
If Carla can do perfect price discriminate, how many papers should she edit?
Assume Carla can charge each student the reservation price.
Example: Perfect Price Discrimination

Slide 39
ReservationStudent
price
A 40
B 38
C 36
D 34
E 32
F 30
G 28
H 26
• Carla would edit A to F• TR = $40 + $38… = $210• TC = 6 x $29 = $174• Economic Profit = $210 - $174 = $36/wk
• Economic Profit is $30 more
Example: Perfect Price Discrimination

Slide 40
Perfectly Discriminating Monopolist Charging each buyer exactly their
reservation price Economic surplus is maximized Consumer surplus is zero Economic surplus = producer surplus
Perfect Price Discrimination

Slide 41
Seller will not know each buyer’s reservation price.
Low price buyers could resell to other buyers at a higher price.
Limitation to Perfect Price Discrimination

Slide 42
Profit-maximizing seller’s goal is to charge each buyer his/her reservation price. There are two problems to implementing
this pricing strategy. Seller does not know the reservation prices Seller must separate high and low price buyers
The hurdle method of price discrimination is used to solve these problems.
The Hurdle Method of Price Discrimination

Slide 43
The practice of offering a discount to all buyers who overcome some obstacle. Example
Offering a rebate to those who mail in a coupon
The Hurdle Method of Price Discrimination

Slide 44
A Perfect Hurdle Separates buyers precisely according
to their reservation prices
What do you think? Is a perfect hurdle possible?
The Hurdle Method of Price Discrimination

Slide 45
Question How much should Carla charge for
editing if she uses a perfect hurdle?
Example: Price Discriminationwith a Perfect Hurdle

Slide 46
Assume Carla offers a mail in rebate coupon Students with at least a $36
reservation price never use the coupon
Students with a reservation price below $36 use the coupon
Opportunity cost = $29 Discount coupon = $4
Example: Price Discriminationwith a Perfect Hurdle

Slide 47
Price Discriminationwith a Perfect Hurdle
Reservation Price Total Revenue Marginal revenue
Student ($ per paper) ($ per week) ($ per paper)
A 40 40
B 38 76
C 36 108
D 34 34
E 32 64
F 30 90
G 28 112
H 26 130
40
36
32
List Price Submarket
Discount Price Submarket
34
30
26
22
18

Slide 48
Solution TR = (3)(36) + (2)(32) = $172 MC = ($5)($29) = $145 Economic Profit = $27/wk
Example: Price Discriminationwith a Perfect Hurdle

Slide 49
Is price discrimination a bad thing? In fact, the hurdle method raised
economic surplus.
Price Discriminationwith a Perfect Hurdle

Slide 50
Producer Surplus Single price = 3(36 - 29) = $21/wk Discount price = 3(36 - 29) = $21/wk
2(32 - 29) = $6/wk$27/wk
Calculating Economic Surplus
Consumer Surplus Reservation Price Actual Price Consumer Surplus A $40 $36 $4
B $38 $36 $2
C $36 $36 $0
BothSingle price& discount
Without Discount $6
D $34 $22 $2
With Discount $8
Economic Surplus Under Price Discrimination with a Perfect Hurdle

Slide 51
Economic Surplus Single price = $6 + $21 = $27/wk Discount price = $8 + $27 = $35/wk
Calculating Economic Surplus
Consumer Surplus Reservation Price Actual Price Consumer Surplus A $40 $36 $4
B $38 $36 $2
C $36 $36 $0
BothSingle price& discount
Without Discount $6
D $34 $22 $2
With Discount $8
Economic Surplus Under Price Discrimination with a Perfect Hurdle

Slide 52
Is Carla’s discount rebate completely efficient?
Food For Thought

Slide 53
Temporary Sales Book publishers and paperback
books Automobile producers offer various
models Commercial air carriers Movie producers
Examples of Price Discrimination

Slide 54
Single price monopolies are inefficient because P > MR.
The hurdle method of price discrimination reduces the inefficiency. The more finely the seller can discriminate,
the smaller the efficiency loss. Hurdles are not perfect, therefore, there will
be some efficiency loss.
Summary

EndEnd
55