monitoring the moin beach to control...
TRANSCRIPT

Proceedings of the 6th International Conference on the Application of Physical Modelling in Coastal and Port Engineering and Science (Coastlab16) Ottawa, Canada, May 10-13, 2016 Copyright ©: Creative Commons CC BY-NC-ND 4.0
1
MONITORING THE MOIN BEACH TO CONTROL MORPHOLOGICAL CHANGES DUE THE CONSTRUCTION OF THE MOIN CONTAINER TERMINAL, LIMON
HENRY ALFARO1, GEORGES GOVAERE1, RONALD VIQUEZ1
1 Engineering Research Institute, University of Costa Rica, Costa Rica, [email protected], [email protected], [email protected]
ABSTRACT
The Moin Container Terminal (MCT) is a project under construction that represents one of the largest investments in Latin American port facilities. The first stage consists of a seven million cubic meter sand fill constructed using dredged material, a 1.5 kilometer breakwater, a 600 meter and two berth quay with a draft of 14.5 meter, a 16 meter deep approach channel and the placement of six gantry cranes.
The MCT is located in the Caribbean coast of Costa Rica, specifically in Moin, next to the existing port facilities, where the coastline is straight and perpendicular to the direction of the most frequent waves that affect the area.
Due to the geometry of the project, its location and interaction with the morphodynamics of the site, a series of periodic survey profiles were carried out with a echosounder and drone-based flights in order to assess changes occurring during the project implementation, on the stretch of beach occupied by the project.
This paper encompasses the results obtained up to date, which combine monthly based changes in the coastline obtained using photogrammetric techniques, 250 meter resolution bathymetric profiles in the area of the project, bathymetric surveys in the fill zone and wave information.
KEWORDS: Drone, Monitoring, Implementation.
1 INTRODUCTION
Changes in natural beach morphology are primarily due to interaction of the waves with the contours. These changes have a spatial and temporal gating. The first one is limited to the physiographic unit whereas the second one is studied both at the short and long term scales.
Before the MCT project, the Moin Beach had a behavior that responded to interactions between dynamics and boundaries such as bathymetry, the current Moin port, the mouth of the Moin river and sediments.
Although the hydrodynamics remains, the MCT project produced new boundaries that resulted in a variation of the local hydrodynamics.
In such context, this work aims to analyze changes in the stretch of coast which is adjacent to the MCT project, based on information collected in the field and information of wave climate.
This document is organized as follows: section 2 presents an overview of the methodology for monitoring the changes in the coastline around nine kilometers of the MCT project. Section 3 includes the results obtained up to date with the methodology and the tools used. Finally, section 4 presents the general discussion of the results and some conclusions.

2
2 OVERVIEW OF THE METHODOLOGY
A numerical model study of coastal dynamics (Baird-CH2M HILL, 2013), forecast the future shape of the coastline around the MCT project if mitigation measures were not implemented. The scenario to be expected, according to Baird, around four to ten years after the end of the works is shown schematically in Figure 1.
Figure 1. Estimated future shoreline on either side of the breakwater. Source: Baird.
The present methodology shows the way to monitoring the changes in the coastline around the MCT project. First, in a
zone defined by (ATM, 2014) and referred to as the general zone in this document, bathymetric and topographic profiles were obtained. Figure2 shows a plan view of the location and distribution of the profiles.
The total profiles are 32, the first 28 are each separated by 250 meters whereas the separation of this group of profiles and the other four is 500 meters. Each profile starts in the berm zone and finishes approximately in the 17 meter depth contour. The 32 profiles are surveyed every three months with a singlebeam echosounder.
Also the Figure 2 shows, between profiles 13 to 25 is located the borrow area. In this zone, between 6 to 13 meters depth contour, the constructor can dredge the material to built the container terminal. Is forbidden dredge in zone shallower than 6 meters depth, because it considers that on the order of 6 meters depth is the depth of closure (ATM, 2014).

3
Figure 2. Distribution of the control bathymetric and topographic profiles
Each of the profiles has been subdivided into 4 sections: • Top beach (above Mean High Water (MHW). • nearest beach (between MHW and the contour -6 meters). • nearest coast (between the contour -6 meters and -10 meters). • deep water (between the contour -10 meters and -17 meters).
The northwest beach from the breakwater of MCT project, particularly in the nearest beach section, is controlled so that the erosion would not exceed the threshold of 600m2/m. This area is called the active zone of beach profile. In areas with depths greater than about six meters, waves are estimated not to significantly change the beach profile, (ATM, 2014).
As a complement for the beach profiles, an area encompassed between the points located one kilometer northwest and southeast of the MCT project were surveyed with a drone. With this technique, a hexacopter carrying a camera, takes a series of pictures which are post processed to create an image mosaic and a digital terrain model, representing the beach face in three dimensions using photogrammetric and georeferencing tools. The drone has been flown monthly starting in August 2015.
In addition to the latter, the wave climate obtained over a yearlong period in front of Limon has been analyzed. For this, the GOW (Global Ocean Waves) hindcast database (Reguero et al, 2012) was used. Such information is used to correlate the expected annual change in beach profile in a similar manner to calculating the time during the year when the winter and the summer beach profiles are expected to take place.
4
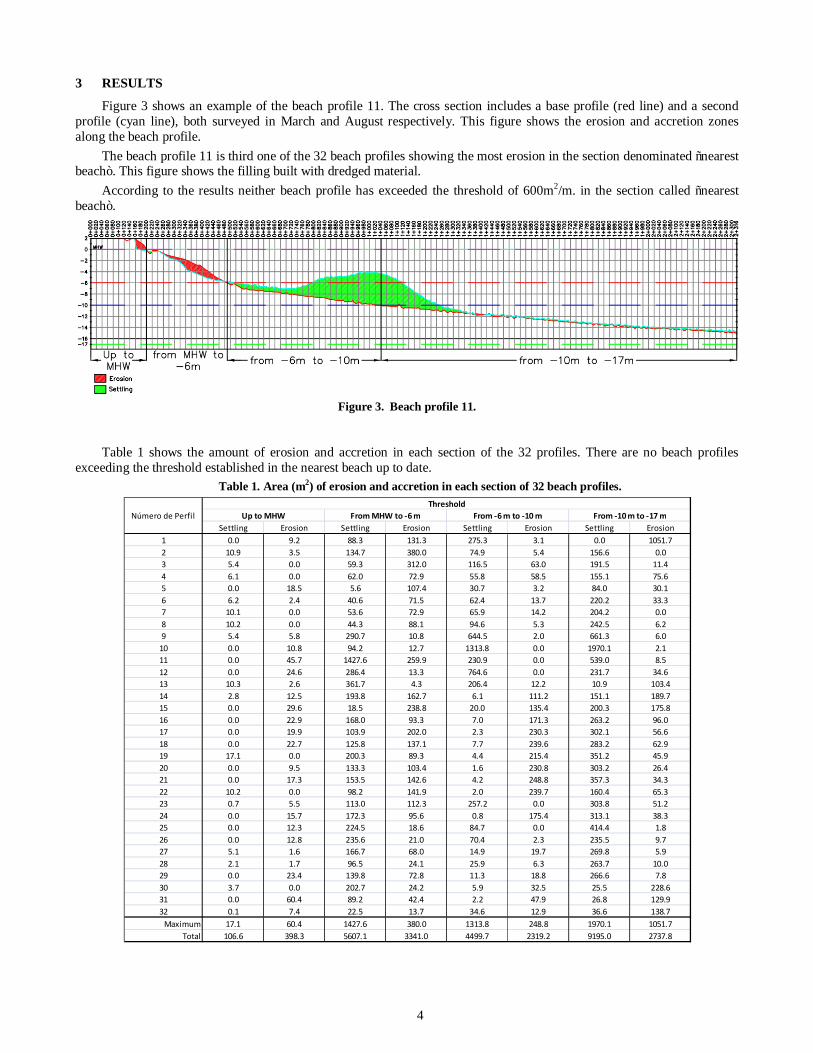
3 RESULTS
Figure 3 shows an example of the beach profile 11. The cross section includes a base profile (red line) and a second profile (cyan line), both surveyed in March and August respectively. This figure shows the erosion and accretion zones along the beach profile.
The beach profile 11 is third one of the 32 beach profiles showing the most erosion in the section denominated “nearest beach”. This figure shows the filling built with dredged material.
According to the results neither beach profile has exceeded the threshold of 600m2/m. in the section called “nearest beach”.
Figure 3. Beach profile 11.
Table 1 shows the amount of erosion and accretion in each section of the 32 profiles. There are no beach profiles
exceeding the threshold established in the nearest beach up to date. Table 1. Area (m2) of erosion and accretion in each section of 32 beach profiles.
Settling Erosion Settling Erosion Settling Erosion Settling Erosion1 0.0 9.2 88.3 131.3 275.3 3.1 0.0 1051.72 10.9 3.5 134.7 380.0 74.9 5.4 156.6 0.03 5.4 0.0 59.3 312.0 116.5 63.0 191.5 11.44 6.1 0.0 62.0 72.9 55.8 58.5 155.1 75.65 0.0 18.5 5.6 107.4 30.7 3.2 84.0 30.16 6.2 2.4 40.6 71.5 62.4 13.7 220.2 33.37 10.1 0.0 53.6 72.9 65.9 14.2 204.2 0.08 10.2 0.0 44.3 88.1 94.6 5.3 242.5 6.29 5.4 5.8 290.7 10.8 644.5 2.0 661.3 6.0
10 0.0 10.8 94.2 12.7 1313.8 0.0 1970.1 2.111 0.0 45.7 1427.6 259.9 230.9 0.0 539.0 8.512 0.0 24.6 286.4 13.3 764.6 0.0 231.7 34.613 10.3 2.6 361.7 4.3 206.4 12.2 10.9 103.414 2.8 12.5 193.8 162.7 6.1 111.2 151.1 189.715 0.0 29.6 18.5 238.8 20.0 135.4 200.3 175.816 0.0 22.9 168.0 93.3 7.0 171.3 263.2 96.017 0.0 19.9 103.9 202.0 2.3 230.3 302.1 56.618 0.0 22.7 125.8 137.1 7.7 239.6 283.2 62.919 17.1 0.0 200.3 89.3 4.4 215.4 351.2 45.920 0.0 9.5 133.3 103.4 1.6 230.8 303.2 26.421 0.0 17.3 153.5 142.6 4.2 248.8 357.3 34.322 10.2 0.0 98.2 141.9 2.0 239.7 160.4 65.323 0.7 5.5 113.0 112.3 257.2 0.0 303.8 51.224 0.0 15.7 172.3 95.6 0.8 175.4 313.1 38.325 0.0 12.3 224.5 18.6 84.7 0.0 414.4 1.826 0.0 12.8 235.6 21.0 70.4 2.3 235.5 9.727 5.1 1.6 166.7 68.0 14.9 19.7 269.8 5.928 2.1 1.7 96.5 24.1 25.9 6.3 263.7 10.029 0.0 23.4 139.8 72.8 11.3 18.8 266.6 7.830 3.7 0.0 202.7 24.2 5.9 32.5 25.5 228.631 0.0 60.4 89.2 42.4 2.2 47.9 26.8 129.932 0.1 7.4 22.5 13.7 34.6 12.9 36.6 138.7
Maximum 17.1 60.4 1427.6 380.0 1313.8 248.8 1970.1 1051.7Total 106.6 398.3 5607.1 3341.0 4499.7 2319.2 9195.0 2737.8
Número de PerfilThreshold
Up to MHW From MHW to -6 m From -6 m to -10 m From -10 m to -17 m

5
In relation with photogrammetric analyses, figure 4 shows the result of in the image mosaic obtained in December 2015. In this figure colored ellipses are placed to identify the stretches of coastline that have had the most important changes. The sections in the red ellipses show the areas with evident erosion between July and August 2015, and the sections enclosed within the green ellipses show accretion.
The southeast stretch of coast within the green ellipse (lower right) remained stable first but increased in size between the months of September and October. Southeastward of the breakwater, the stretch of coast inside the red ellipse, immediately adjacent to the breakwater area, was subjected to severe erosion between May and September and required mitigation measures to avoid further erosion processes.
Northwestward of the breakwater, the stretch of coast inside the green ellipse shows how the beach has grown in this sector, portraying a situation numerically simulated by Baird. However, this scenario was expected to happen a number of years (perhaps a decade) after the end the MCT project.
Farther north, also in accordance with numerical simulations, the stretch of coast into the red ellipse was the sector subjected to erosion due the construction of the breakwater, which caused the diffraction effect and the gradients of wave height. Both processes seem to be responsible for the to movement of sand from north to south.
Figure 4. Mosaic of images obtained during the drone flight in December 2015.
As a reference and to assess the wave climate conditions affecting the beach around the MCT project during the
construction, a database called GOW was used. The period of the GOW series is 61 years, from 1948-2008. The GOW is based on the model WAVEWATCH III; and the point of analysis used was the closest to Puerto Limon, located in the position 82.75º W and 10.25º N.
The GOW series contains hourly information on significant wave height, which was calibrated by (IH Cantabria, 2012), with data buoy # 42058 from NOAA which records average period, peak period and average propagation direction. The calibration algorithm suggested by IH Cantabria is a potential function that depends on the significant wave height and mean wave direction.

6
��� ��� = ������� ������ (1)
where: HsmodC: significant wave height calibrated Hsmod: significant wave height simulated a, b: coefficients that depend on wave direction Since the GOW database extends until 2008, some work was performed to extend it until 2015. Data after 2008 were
generated using the same wind source (NCEP/NCAR) and the WAVEWATCH III model; then this updated database was calibrated, using newly the calibration algorithm suggested by IH Cantabria.
Once the GOW databases was updated and calibrated, it was plotted using graphic boxes. This type of graphics is useful to visualize the distribution of the dataset, along with other parameters such as the median, quartiles, the whisker and extraordinary values. The default maximum whisker length (w) corresponds to a value of 1.5. The default of 1.5 is associated with approximately +/–2.7σ and 99.3% coverage if the data are normally distributed. Points are drawn as extraordinary values if they are larger than q3 + w(q3 – q1) or smaller than q1 – w(q3 – q1), where q1 and q3 are the 25th and 75th percentiles, respectively.
Below two graphics boxes are shown, and in both, data were pooled in the 12 months of the year. The first graphic box, shown in Figure 5 displays monthly the average of significant wave high data from 1948 to 2014. In each box, the central mark is the median (red line in the graph), the edges of the box are the 25th and 75th percentiles, the whiskers extend to the most extreme data points still not considered extreme events, and the latter are plotted individually as crosses.
It is observed that the months of highest energy are December, January and February. Starting in March wave heights begin to decline but go up again in July to decrease and reach the lowest values in the months of September and October. This figure shows that in the months of February, July and November, highly energetic heights (Hs) are present, as it can be observed by the presence of crosses.
This information is useful because it provides elements to figure out what the shape of beach profile might be throughout the year.
Figure 5. Average of significant wave height represented by graphic boxes. Series from 1948 to 2014.
JAN FEB MAR APR MAY JUN JUL AUG SEP OCT NOV DEC0
0.5
1
1.5
2
2.5
3
Months
Hs(
m)

7
The second chart is similar to the previous. However, the difference in Figure 6, is that this dataset includes the average of significant wave height information estimated for 2015. By including this information, a verification of extreme events that occurred from May to September in 2015 was established.
Figure 6. Average of significant wave height represented by graphic boxes. Series from 1948 to 2015.
4 CONCLUSIONS
The stretch of coast southeast of the breakwater has behaved differently than expected during the months between May and September 2015. It is clear that the behavior of the stretch of coast, southward of breakwater, shown in Figure 4 inside the red ellipse, was directly affected by the extraordinary events that happened during the months between May and September 2015, as well as the effect of the new boundaries of the MCT project. However, in the months after, the behavior has adjusted to forecast.
Figure 7 shows the dike and fill zone in construction. In the latter it is possible to observe when the waves dissipate their energy over the fill, causing a delay of the wave face that interact with the wave reflect from the dike. This situation caused, southward of breakwater, a change in the patterns of currents that caused the movement of sand from north to south. However, this movement of sand was not expected to take place in such direction and during those months.
The evolution of the stretch of coast northwest of the breakwater has behaved as predicted in previous studies by Baird-CH2M HILL. However it has happen much sooner because the wave climate during the last year was power.
The dredging works for the construction of the landfill, have not exceeded the threshold (600 m2/m) in the area called nearest beach (MHW to -6 m).
JAN FEB MAR APR MAY JUN JUL AUG SEP OCT NOV DEC0
0.5
1
1.5
2
2.5
3
Months
Hs(
m)

8
Figure 7. Overview of the project zone during a day in August . Source: BICA Consults
ACKNOWLEDGEMENT
Appreciation is extended to APM Terminals, the Tropical Scientific Center and the Government of Costa Rica for allowing us to share the information collected in this study. Logistic, technical and institutional support has been provided by University of Costa Rica through research projects to the authors.
REFERENCES ATM, 2014. Impact Assessment System and the Coastal Management Recommendations. Environmental study of The Moin Container
Terminal project for APM Terminals. Costa Rica. Baird in association with CH2M HILL, 2013. Sediment transport and changes in the coastline. Environmental study of The Moin
Container Terminal project for APM Terminals. Costa Rica. Reguero, B.G, Menéndez, M., Méndez, F. J., Mínguez, R., Losada, I. J., 2012. A global ocean wave (GOW) calibrated reanalysis from
1948 onwards. Coast Eng. 65, 38-55. IH Cantabria, 2012, July. Wave reanalysis database, location Moin, Costa Rica.