monitoring the effects of enhanced air force training in ... · monitoring the effects of enhanced...
TRANSCRIPT
Monitoring the Effects of Enhanced Air Force Training in Idaho:Baseline Vegetation Map
by
Steven K. RustRobert K. Moseley
Conservation Data Center
March 1999
Idaho Department of Fish and GameNatural Resource Policy Bureau600 South Walnut, P.O. Box 25
Boise, Idaho 83707Jerry Mallet, Director


Abstract
The United States Air Force Enhanced Training Range may effectecosystem processes over large areas of the Owyhee Plateau regionin southwestern Idaho. Existing spatial and tabular baselineinformation on the distribution, extent, and condition of vegetationis compiled to monitor the effects of training range developmentand use. Field reconnaissance was conducted to assist with thereconciliation of existing information sources into a commonvegetation data language and an integrated spatial database.Ecological data was collected on 366 point observation plots at 28reference sites within the study area. Existing information whichwas not recovered is identified. An assessment of mappingaccuracy suggests that the combination of spatial information onexisting vegetation and potential natural vegetation will yield amore accurate map of existing vegetation than consideration ofdata on existing vegetation alone.

v
TABLE OF CONTENTS
Introduction . . . . . . . . . . . . . . . . . . . . . . . . . . . . . . . . . . . . . . . . . . . . . . . . . . . . . . 1
Methods and Study Area . . . . . . . . . . . . . . . . . . . . . . . . . . . . . . . . . . . . . . . . . . . . 1
Results and Conclusions . . . . . . . . . . . . . . . . . . . . . . . . . . . . . . . . . . . . . . . . . . . . 2Reference Area Sampling . . . . . . . . . . . . . . . . . . . . . . . . . . . . . . . . . . . . . . . . 2Collection and Summary of Existing Spatial and Tabular Data . . . . . . . . . . . 2Building An Accurate Vegetation Map . . . . . . . . . . . . . . . . . . . . . . . . . . . . . . 2
Literature Cited . . . . . . . . . . . . . . . . . . . . . . . . . . . . . . . . . . . . . . . . . . . . . . . . . . . 4
Figure 1. Location of the study area . . . . . . . . . . . . . . . . . . . . . . . . . . . . . . . . . . . 5
Figure 2. The distribution of major vegetation zones . . . . . . . . . . . . . . . . . . . . . . 6
Table 1. Summary of the extend of major vegetation zones . . . . . . . . . . . . . . . . . 7
Table 2. Summary of reference areas sampled . . . . . . . . . . . . . . . . . . . . . . . . . . . 8
Table 3. Plant associations observed . . . . . . . . . . . . . . . . . . . . . . . . . . . . . . . . . 10
Table 4. Crosswalk of ETI vegetation mapping units . . . . . . . . . . . . . . . . . . . . 13
Table 5. Crosswalk of ITR vegetation mapping units . . . . . . . . . . . . . . . . . . . . 14
Table 6. Crosswalk of SCR vegetation mapping units . . . . . . . . . . . . . . . . . . . . 16
Appendix 1. Summary of Vegetation Spatial and Tabular Data . . . . . . . . . . . . 17

vi

Page 1
Introduction
The United States Air Force Enhanced Training Range may effect ecosystem processes overlarge areas of the Owyhee Plateau region in southwestern Idaho. Vegetative condition is a keyindicator of the health of ecosystem functioning, including the viability of wildlife species. Comprehensive baseline information on the distribution, extent, and condition of vegetation andkey wildlife species habitat use within the training range area will serve as a tool in themaintenance and enhancement of critical wildlife habitats and ecosystem processes.
The objective of this vegetation mapping project is to provide baseline information on thedistribution, extent, and condition of vegetation on the Owyhee Plateau. This information willbe used to monitor the effects of training range development and use.
Methods and Study Area
The 3.69 million acre study area in is located in Owyhee and Twin Falls counties, and generallyencompasses the Owyhee Plateau of southwestern Idaho (Figure 1). The Owyhee Plateau is anuplifted region; dome and block-fault geological formations are common. Rhyolites and weldedtuffs are the principal rocks of the uplands. These formations occur with silicic volcanic flows,ash deposits, and wind-blown loess. The Owyhee Mountains are principally granitic. Thebiophysical region is deeply dissected by erosional processes. Aridisol, Entisol, Alfisol,Inceptisol and Mollisol soils occur in combination with mesic and frigid and xeric and aridic soiltemperature and moisture regimes, respectively. Mean annual precipitation ranges from 7 to 15inches. The annual distribution of precipitation is nearly even, though summers are relativelydrier. Mean annual temperature ranges from 35 to 45 oF. The potential natural vegetation withinthe study area is principally sagebrush steppe (McNab and Avers 1994; United States Air Force1993 and 1996).
A fair amount of information on wildlife habitats within the study area was available at the onsetof the project. This information was generated through three Air Force contracts, large regionalstudies (ICBEMP, TNC, GAP), and through the routine work of resource management agencies. The information was developed, however, to meet a range of different objectives and using arange of different methods. A specific task of this project is to compiled this information into acommon format within the Idaho Department of Fish and Game’s (IDFG) geographicinformation system. Field reconnaissance focused on the reconciliation of these variousinformation sources into a common vegetation data language and an integrated spatial database.
Existing spatial data for potential natural vegetation, current vegetation condition, anddisturbance history was verified through field reconnaissance. Field reconnaissance occurredthrough a stratified stand-level sampling strategy. The study area was stratified based on majorenvironmental factors. First to second order drainage basins representing major environmentalstrata were selected as reference areas for intensive stand-level sampling. Data on the existingvegetation, potential natural vegetation, ecological condition, stand seral status, structural
Page 2
condition, and basic physical environmental parameters were collected for entire homogeneousstands within each of these reference areas.
Results and Conclusions
Reference Area Sampling--The study area was stratified based on major patterns in precipitationand physiography. These strata represent the major vegetation zones within the study area. Eightmajor vegetation zones were identified (Figure 2), ranging from salt-desert shrubland toWyoming big sagebrush shrubland to Douglas fir forest (Table 1). Wyoming big sagebrushshrubland, low sagebrush dwarf shrub, and mountain big sagebrush shrubland vegetation zoneswere targeted for reference area sampling as these vegetation zones are most likely to providekey sage grouse habitats.
Reference area sampling and preliminary map field testing occurred during June - November,1998. Ecological data was collected on 366 point observation plots at 28 reference sites withinthe study area. One half of these sites are designated ecological reference areas (i.e., researchnatural areas or preserves) that represent relatively pristine conditions. The remaining sitesrepresent a range of different ecological conditions. Reference area sites were selected tocomplement, rather than duplicate existing plot data (reported by United State Air Force 1993and 1996). The reference sites and their distribution within the major vegetation zones of thestudy area is summarized in Table 2. Fifty-six plant associations are identified as occurringwithin the area (Table 3). Plant association nomenclature follows Hironaka et al. (1983).
Collection and Summary of Existing Spatial and Tabular Data--Over 100 GIS data filesconcerning the study area were reviewed (summarized in Appendix 1). Five were select forfurther consideration and utilization: Idaho Land Cover (the 1998 revision of GAP AnalysisProgram vegetation coverage; Landscape Dynamics Lab 1999), NRCS SSURGO (USDANatural Resources Conservation Service 1996), Idaho Training Range (ITR) Vegetation (UnitedStates Air Force 1993), Enhanced Training in Idaho (ETI) Vegetation (United States Air Force1996) (the location of ITR and ETI analysis areas is indicated in Figure 2), and BLM FireHistory. Numerous digital NWI maps were also located which may support mapping wetlandand riparian habitats. The Idaho Land Cover GIS file was generated from LANDSAT imageryand provides information on the existing vegetative cover. The NRCS SSURGO coverageprovides information on potential natural vegetation.
The Idaho Land Cover, NRCS SSURGO, ITR Vegetation, ETI Vegetation files are compiledinto an initial common vegetation data language (Tables 4 - 5). This work currently possesses abias toward upland vegetation; wetland and riparian plant associations and cover types identifiedby Moseley (1998) and more recent work are yet to be fully integrated into the vegetation datalanguage.
Building An Accurate Vegetation Map--An important initial focus of the study is thecorroboration and compilation of existing spatial vegetation data into a common vegetation data
1 The reinterpretation was blind in the sense that only a general knowledge of theperformance of each coverage involved in the intersection was utilized, rather than the sitespecific knowledge represented by the actual point data.
Page 3
language. Existing information required (but not yet recovered) to complete this task fully is:
C the point location of plot data generated for the Saylor Creek Rangeecosystem analysis (Science Applications International Corporation 1996)
C point location and original plot composition and structure data generated forthe ITR analysis (United States Air Force 1993)
C additional detailed information identified in Appendix 1.
Through the development of this study the issue of the accuracy of existing spatial vegetationdata and the potential accuracy of vegetation map products generated by this study have arisen asa principal concern. Landscape Dynamics Lab (1999) estimates the Idaho Land Cover aspossessing an accuracy of 69.3 percent (with a range 63.6 to 79.3 percent) for southern Idaho. This accuracy value reflects allowance for acceptable errors and is for the work developed byHomer et al. (1998) (for southern Idaho) before it was merged with the work developed byRedmond et al. (1997) (for northern Idaho). During the merge process the classification ofexisting vegetation reported by Homer et al. (1998) was revised to match the classificationdeveloped by Redmond et al. (1997) (Landscape Dynamic Lab 1999). Considerable informationloss for the Owyhee Plateau area may have occurred during this merge process.
I conducted an independent accuracy assessment to evaluate the level of improvement of spatialdata for existing vegetative cover generated through the use of spatial data for potential naturalvegetation and disturbance history. Using point observation data collected in 1998 the IdahoLand Cover shows, on a site-by-site basis, a mean accuracy of 42 percent (range, 0 - 85 percent;standard deviation, 25 percent) with no allowance for acceptable error. An intersection of theIdaho Land Cover, NRCS SSURGO, and BLM Fire History coverages and the subsequent blind1
decision-rule-based reassignment of the cover type classes generated a (statistically) significant36 percent improvement in the mapping of existing vegetation. The mean accuracy of theintersected coverage is 57 percent (range, 18 to 89 percent; standard deviation, 18 percent) usingblind decision rules and with no allowance for acceptable error. This result allows the reasonableconclusion that the combination of spatial information on existing vegetation and potentialnatural vegetation will yield a more accurate map of existing vegetation than consideration ofdata on existing vegetation alone.
Page 4
Literature Cited
Cowardin, L. M., V. Carter, F. C. Golet, and E. T. LaRoe. 1979. Classification of wetlands and deepwater habitats ofthe United States. U.S. Department of the Interior, Office of Biological Services, Fish and Wildlife Service.103 pp.
Hironaka, M., M. A. Fosberg, and A. H. Winward. 1983. Sagebrush-grass habitat types of southern Idaho. Forestry,Wildlife, and Range Experiment Station Bulletin Number 15, University of Idaho, Moscow. 44 pp.
Homer et al. 1998. Idaho/Western Wyoming Landcover Classification. Remote Sensing/GIS Laboratories, UtahState University, Logan.
Landscape Dynamics Lab. 1999. GRID IDVEG -- Idaho Land Cover. Idaho Cooperative Fish and WildlifeResearch Unit, Moscow.
Moseley, R. K. 1998. Riparian and wetland community inventory of 14 reference areas in southwestern Idaho.Conservation Data Center, Idaho Department of Fish and Game, Technical bulletin no. 98-5, prepared forLower Snake River District, Bureau of Land Management. Order no. 1422-D010-P97-0116. 52 pp. plusappendices.
Redmond et al. 1997. Current Vegetation Map of Northern Idaho and Western Montana. Wildlife Spatial AnalysisLab, Montana Cooperative Fish and Wildlife Research Unit, Missoula.
Science Applications International Corporation. 1996. Ecosystem survey of Mountain Home Air Force Base,Saylor Creek Range, and associated restricted airspace R-3202A. Data compendium: field notes, datasheets, and photographic slides. Unpublished report prepared for United States Air Force.
USDA Natural Resources Conservation Service. 1996. Soil survey geographic (SSURGO) data base for OwyheeCounty area, Idaho. USDA Natural Resources Conservation Service, Fort Worth.
United States Air Force. 1993. Idaho Training Range, Biological Resources Technical Support Document. AirCombat Command, United States Air Force.
United States Air Force. 1996. Ecosystem survey of Mountain Home Air Force Base, Saylor Creek Range, andassociated restricted airspace R-3202A. Final Report. 79 pp. plus appendices.

Page 5
Figure 1. Location of the study area. The inset map shows the location of the study area in southwestern Idaho. Two major Air Force analysis areas, ETI andNorth and South ITR are also indicated. The outline of USGS 1:24,000 scale quadrangles provide geographic reference.
Page 6
Figure 2. The distribution of major vegetation zones within the study area. Vegetation zones are shown with the location of point observations and referencesampling sites.
Page 7
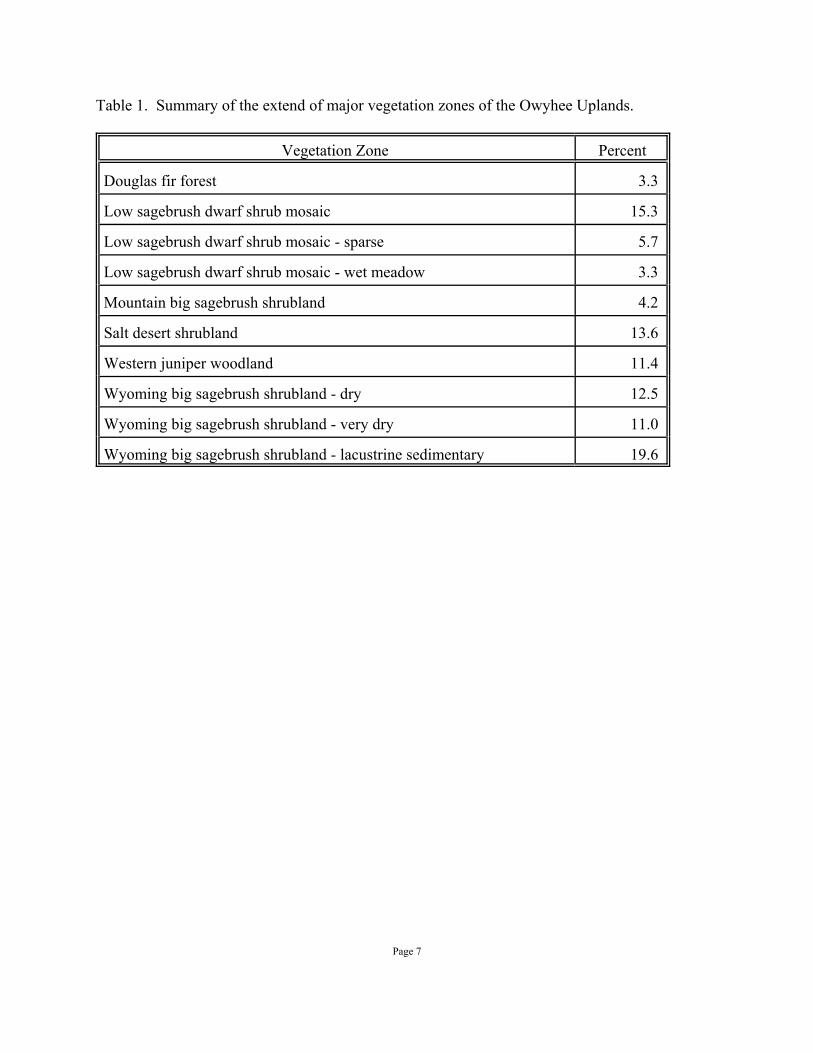
Table 1. Summary of the extend of major vegetation zones of the Owyhee Uplands.
Vegetation Zone Percent
Douglas fir forest 3.3
Low sagebrush dwarf shrub mosaic 15.3
Low sagebrush dwarf shrub mosaic - sparse 5.7
Low sagebrush dwarf shrub mosaic - wet meadow 3.3
Mountain big sagebrush shrubland 4.2
Salt desert shrubland 13.6
Western juniper woodland 11.4
Wyoming big sagebrush shrubland - dry 12.5
Wyoming big sagebrush shrubland - very dry 11.0
Wyoming big sagebrush shrubland - lacustrine sedimentary 19.6
Page 8
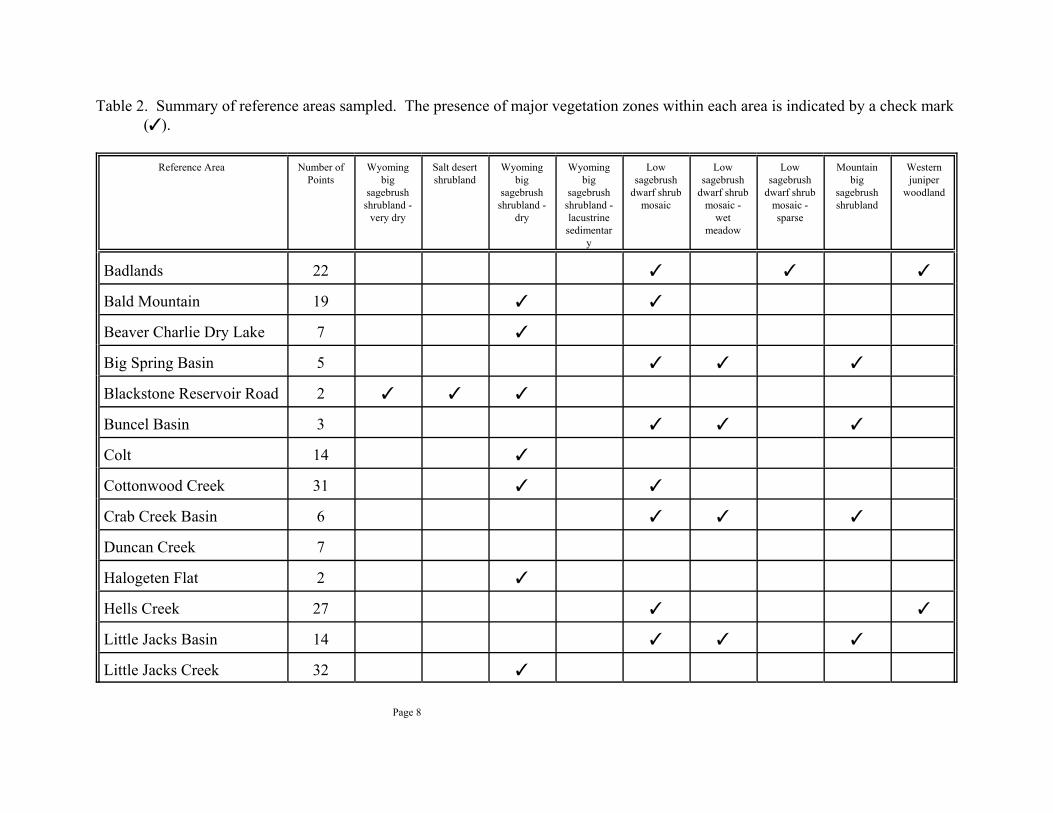
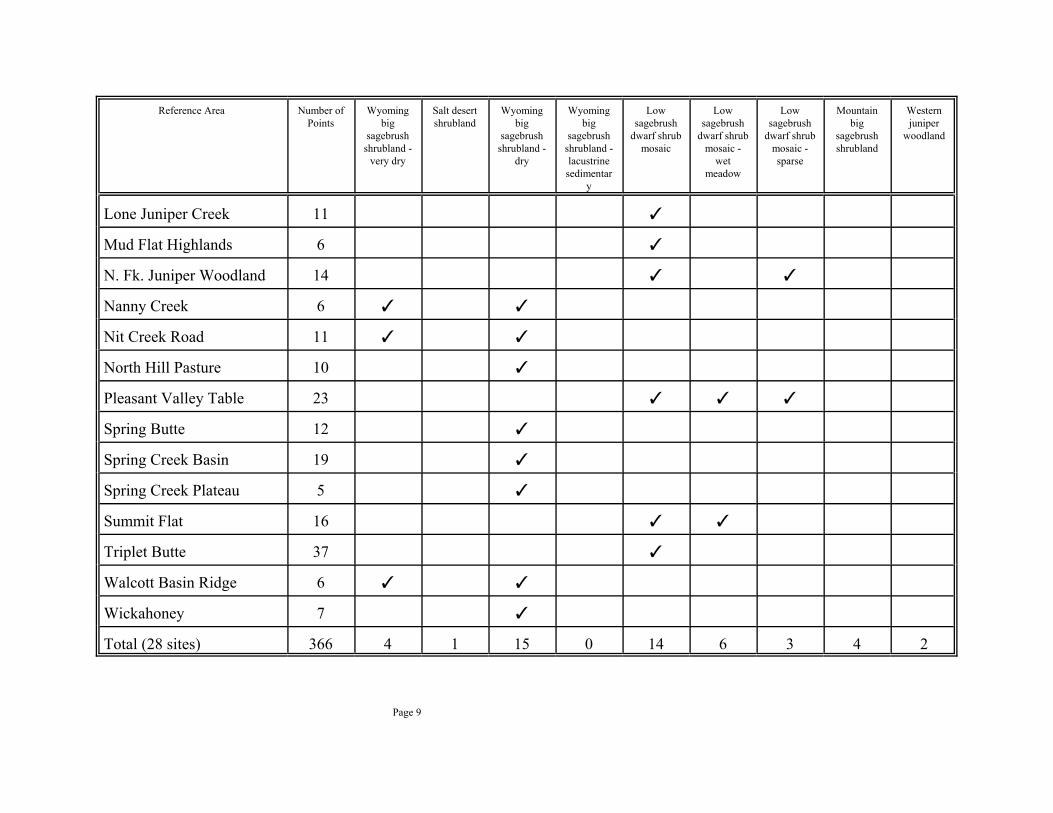
Table 2. Summary of reference areas sampled. The presence of major vegetation zones within each area is indicated by a check mark(T).
Reference Area Number ofPoints
Wyomingbig
sagebrushshrubland -
very dry
Salt desertshrubland
Wyomingbig
sagebrushshrubland -
dry
Wyomingbig
sagebrushshrubland -lacustrinesedimentar
y
Lowsagebrush
dwarf shrubmosaic
Lowsagebrush
dwarf shrubmosaic -
wetmeadow
Lowsagebrush
dwarf shrubmosaic -sparse
Mountainbig
sagebrushshrubland
Westernjuniper
woodland
Badlands 22 T T T
Bald Mountain 19 T T
Beaver Charlie Dry Lake 7 T
Big Spring Basin 5 T T T
Blackstone Reservoir Road 2 T T T
Buncel Basin 3 T T T
Colt 14 T
Cottonwood Creek 31 T T
Crab Creek Basin 6 T T T
Duncan Creek 7
Halogeten Flat 2 T
Hells Creek 27 T T
Little Jacks Basin 14 T T T
Little Jacks Creek 32 T
Reference Area Number ofPoints
Wyomingbig
sagebrushshrubland -
very dry
Salt desertshrubland
Wyomingbig
sagebrushshrubland -
dry
Wyomingbig
sagebrushshrubland -lacustrinesedimentar
y
Lowsagebrush
dwarf shrubmosaic
Lowsagebrush
dwarf shrubmosaic -
wetmeadow
Lowsagebrush
dwarf shrubmosaic -sparse
Mountainbig
sagebrushshrubland
Westernjuniper
woodland
Page 9
Lone Juniper Creek 11 T
Mud Flat Highlands 6 T
N. Fk. Juniper Woodland 14 T T
Nanny Creek 6 T T
Nit Creek Road 11 T T
North Hill Pasture 10 T
Pleasant Valley Table 23 T T T
Spring Butte 12 T
Spring Creek Basin 19 T
Spring Creek Plateau 5 T
Summit Flat 16 T T
Triplet Butte 37 T
Walcott Basin Ridge 6 T T
Wickahoney 7 T
Total (28 sites) 366 4 1 15 0 14 6 3 4 2
Page 10
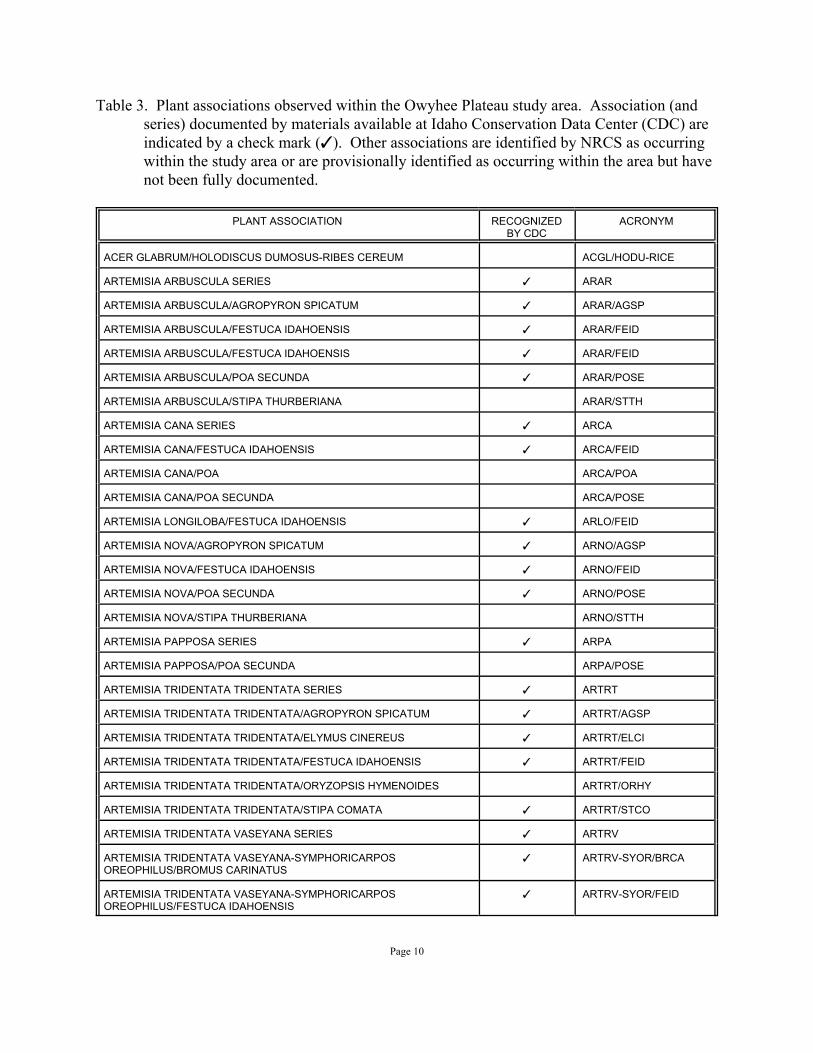
Table 3. Plant associations observed within the Owyhee Plateau study area. Association (andseries) documented by materials available at Idaho Conservation Data Center (CDC) areindicated by a check mark (T). Other associations are identified by NRCS as occurringwithin the study area or are provisionally identified as occurring within the area but havenot been fully documented.
PLANT ASSOCIATION RECOGNIZEDBY CDC
ACRONYM
ACER GLABRUM/HOLODISCUS DUMOSUS-RIBES CEREUM ACGL/HODU-RICE
ARTEMISIA ARBUSCULA SERIES T ARAR
ARTEMISIA ARBUSCULA/AGROPYRON SPICATUM T ARAR/AGSP
ARTEMISIA ARBUSCULA/FESTUCA IDAHOENSIS T ARAR/FEID
ARTEMISIA ARBUSCULA/FESTUCA IDAHOENSIS T ARAR/FEID
ARTEMISIA ARBUSCULA/POA SECUNDA T ARAR/POSE
ARTEMISIA ARBUSCULA/STIPA THURBERIANA ARAR/STTH
ARTEMISIA CANA SERIES T ARCA
ARTEMISIA CANA/FESTUCA IDAHOENSIS T ARCA/FEID
ARTEMISIA CANA/POA ARCA/POA
ARTEMISIA CANA/POA SECUNDA ARCA/POSE
ARTEMISIA LONGILOBA/FESTUCA IDAHOENSIS T ARLO/FEID
ARTEMISIA NOVA/AGROPYRON SPICATUM T ARNO/AGSP
ARTEMISIA NOVA/FESTUCA IDAHOENSIS T ARNO/FEID
ARTEMISIA NOVA/POA SECUNDA T ARNO/POSE
ARTEMISIA NOVA/STIPA THURBERIANA ARNO/STTH
ARTEMISIA PAPPOSA SERIES T ARPA
ARTEMISIA PAPPOSA/POA SECUNDA ARPA/POSE
ARTEMISIA TRIDENTATA TRIDENTATA SERIES T ARTRT
ARTEMISIA TRIDENTATA TRIDENTATA/AGROPYRON SPICATUM T ARTRT/AGSP
ARTEMISIA TRIDENTATA TRIDENTATA/ELYMUS CINEREUS T ARTRT/ELCI
ARTEMISIA TRIDENTATA TRIDENTATA/FESTUCA IDAHOENSIS T ARTRT/FEID
ARTEMISIA TRIDENTATA TRIDENTATA/ORYZOPSIS HYMENOIDES ARTRT/ORHY
ARTEMISIA TRIDENTATA TRIDENTATA/STIPA COMATA T ARTRT/STCO
ARTEMISIA TRIDENTATA VASEYANA SERIES T ARTRV
ARTEMISIA TRIDENTATA VASEYANA-SYMPHORICARPOSOREOPHILUS/BROMUS CARINATUS
T ARTRV-SYOR/BRCA
ARTEMISIA TRIDENTATA VASEYANA-SYMPHORICARPOSOREOPHILUS/FESTUCA IDAHOENSIS
T ARTRV-SYOR/FEID
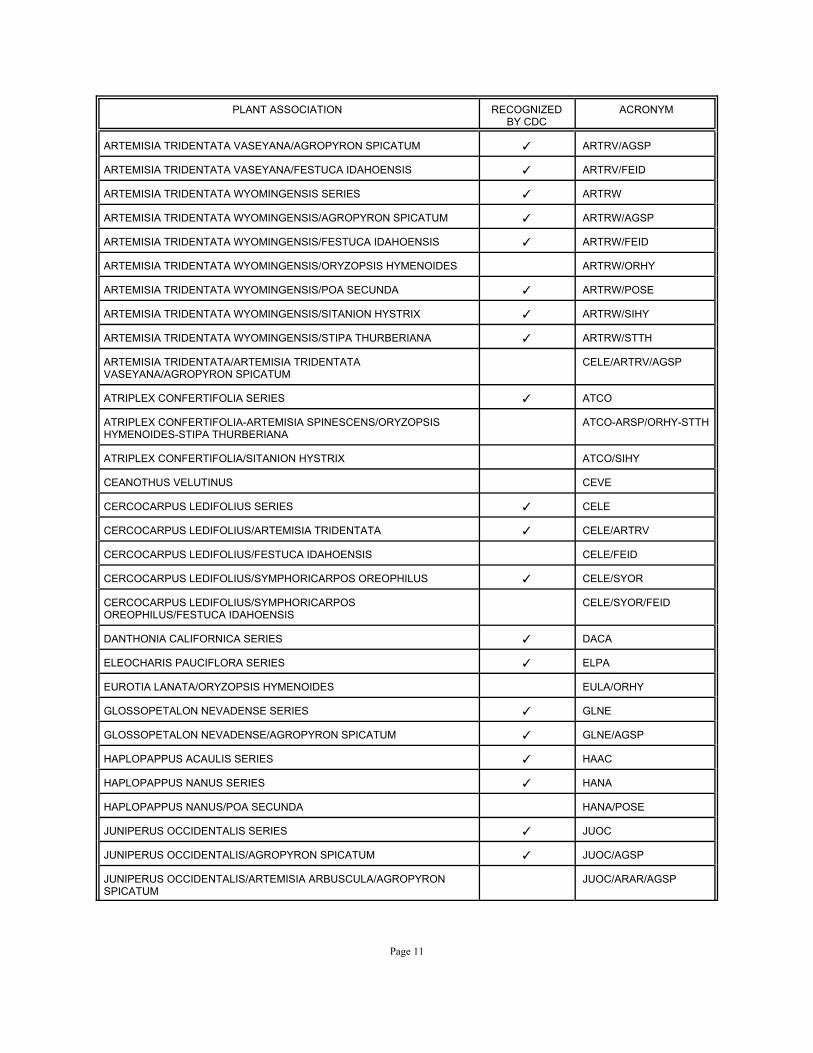
PLANT ASSOCIATION RECOGNIZEDBY CDC
ACRONYM
Page 11
ARTEMISIA TRIDENTATA VASEYANA/AGROPYRON SPICATUM T ARTRV/AGSP
ARTEMISIA TRIDENTATA VASEYANA/FESTUCA IDAHOENSIS T ARTRV/FEID
ARTEMISIA TRIDENTATA WYOMINGENSIS SERIES T ARTRW
ARTEMISIA TRIDENTATA WYOMINGENSIS/AGROPYRON SPICATUM T ARTRW/AGSP
ARTEMISIA TRIDENTATA WYOMINGENSIS/FESTUCA IDAHOENSIS T ARTRW/FEID
ARTEMISIA TRIDENTATA WYOMINGENSIS/ORYZOPSIS HYMENOIDES ARTRW/ORHY
ARTEMISIA TRIDENTATA WYOMINGENSIS/POA SECUNDA T ARTRW/POSE
ARTEMISIA TRIDENTATA WYOMINGENSIS/SITANION HYSTRIX T ARTRW/SIHY
ARTEMISIA TRIDENTATA WYOMINGENSIS/STIPA THURBERIANA T ARTRW/STTH
ARTEMISIA TRIDENTATA/ARTEMISIA TRIDENTATAVASEYANA/AGROPYRON SPICATUM
CELE/ARTRV/AGSP
ATRIPLEX CONFERTIFOLIA SERIES T ATCO
ATRIPLEX CONFERTIFOLIA-ARTEMISIA SPINESCENS/ORYZOPSISHYMENOIDES-STIPA THURBERIANA
ATCO-ARSP/ORHY-STTH
ATRIPLEX CONFERTIFOLIA/SITANION HYSTRIX ATCO/SIHY
CEANOTHUS VELUTINUS CEVE
CERCOCARPUS LEDIFOLIUS SERIES T CELE
CERCOCARPUS LEDIFOLIUS/ARTEMISIA TRIDENTATA T CELE/ARTRV
CERCOCARPUS LEDIFOLIUS/FESTUCA IDAHOENSIS CELE/FEID
CERCOCARPUS LEDIFOLIUS/SYMPHORICARPOS OREOPHILUS T CELE/SYOR
CERCOCARPUS LEDIFOLIUS/SYMPHORICARPOSOREOPHILUS/FESTUCA IDAHOENSIS
CELE/SYOR/FEID
DANTHONIA CALIFORNICA SERIES T DACA
ELEOCHARIS PAUCIFLORA SERIES T ELPA
EUROTIA LANATA/ORYZOPSIS HYMENOIDES EULA/ORHY
GLOSSOPETALON NEVADENSE SERIES T GLNE
GLOSSOPETALON NEVADENSE/AGROPYRON SPICATUM T GLNE/AGSP
HAPLOPAPPUS ACAULIS SERIES T HAAC
HAPLOPAPPUS NANUS SERIES T HANA
HAPLOPAPPUS NANUS/POA SECUNDA HANA/POSE
JUNIPERUS OCCIDENTALIS SERIES T JUOC
JUNIPERUS OCCIDENTALIS/AGROPYRON SPICATUM T JUOC/AGSP
JUNIPERUS OCCIDENTALIS/ARTEMISIA ARBUSCULA/AGROPYRONSPICATUM
JUOC/ARAR/AGSP
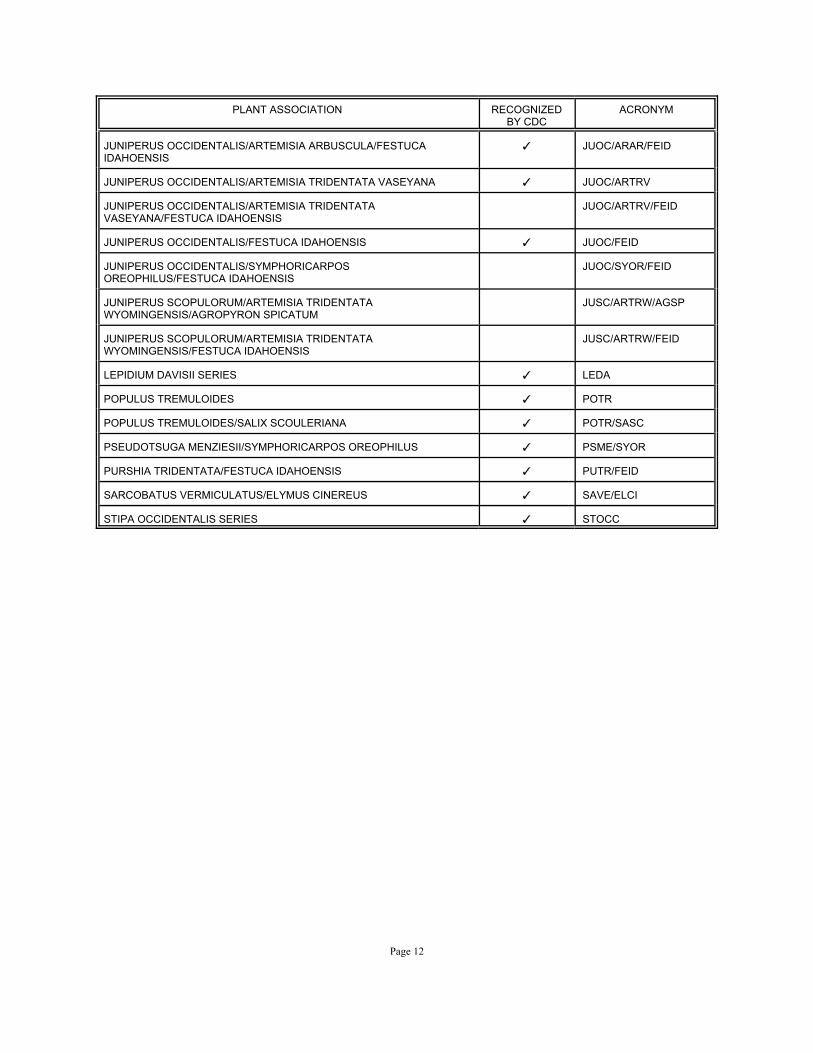
PLANT ASSOCIATION RECOGNIZEDBY CDC
ACRONYM
Page 12
JUNIPERUS OCCIDENTALIS/ARTEMISIA ARBUSCULA/FESTUCAIDAHOENSIS
T JUOC/ARAR/FEID
JUNIPERUS OCCIDENTALIS/ARTEMISIA TRIDENTATA VASEYANA T JUOC/ARTRV
JUNIPERUS OCCIDENTALIS/ARTEMISIA TRIDENTATAVASEYANA/FESTUCA IDAHOENSIS
JUOC/ARTRV/FEID
JUNIPERUS OCCIDENTALIS/FESTUCA IDAHOENSIS T JUOC/FEID
JUNIPERUS OCCIDENTALIS/SYMPHORICARPOSOREOPHILUS/FESTUCA IDAHOENSIS
JUOC/SYOR/FEID
JUNIPERUS SCOPULORUM/ARTEMISIA TRIDENTATAWYOMINGENSIS/AGROPYRON SPICATUM
JUSC/ARTRW/AGSP
JUNIPERUS SCOPULORUM/ARTEMISIA TRIDENTATAWYOMINGENSIS/FESTUCA IDAHOENSIS
JUSC/ARTRW/FEID
LEPIDIUM DAVISII SERIES T LEDA
POPULUS TREMULOIDES T POTR
POPULUS TREMULOIDES/SALIX SCOULERIANA T POTR/SASC
PSEUDOTSUGA MENZIESII/SYMPHORICARPOS OREOPHILUS T PSME/SYOR
PURSHIA TRIDENTATA/FESTUCA IDAHOENSIS T PUTR/FEID
SARCOBATUS VERMICULATUS/ELYMUS CINEREUS T SAVE/ELCI
STIPA OCCIDENTALIS SERIES T STOCC
Page 13
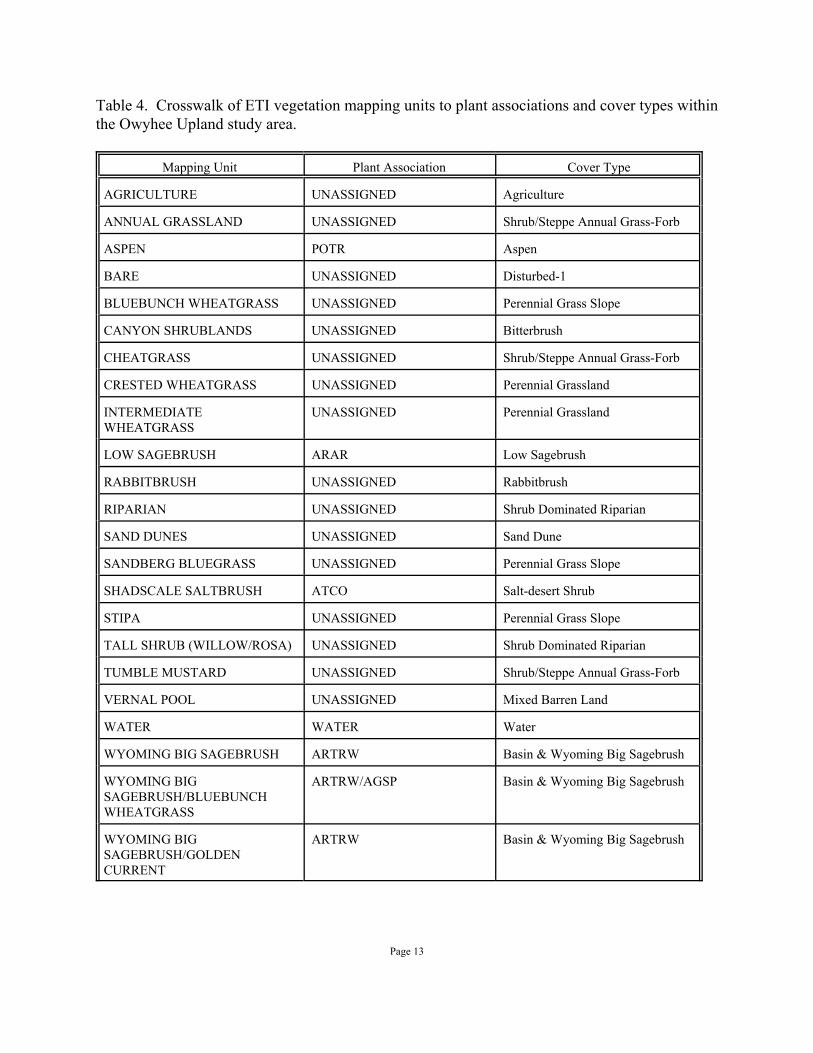
Table 4. Crosswalk of ETI vegetation mapping units to plant associations and cover types withinthe Owyhee Upland study area.
Mapping Unit Plant Association Cover Type
AGRICULTURE UNASSIGNED Agriculture
ANNUAL GRASSLAND UNASSIGNED Shrub/Steppe Annual Grass-Forb
ASPEN POTR Aspen
BARE UNASSIGNED Disturbed-1
BLUEBUNCH WHEATGRASS UNASSIGNED Perennial Grass Slope
CANYON SHRUBLANDS UNASSIGNED Bitterbrush
CHEATGRASS UNASSIGNED Shrub/Steppe Annual Grass-Forb
CRESTED WHEATGRASS UNASSIGNED Perennial Grassland
INTERMEDIATEWHEATGRASS
UNASSIGNED Perennial Grassland
LOW SAGEBRUSH ARAR Low Sagebrush
RABBITBRUSH UNASSIGNED Rabbitbrush
RIPARIAN UNASSIGNED Shrub Dominated Riparian
SAND DUNES UNASSIGNED Sand Dune
SANDBERG BLUEGRASS UNASSIGNED Perennial Grass Slope
SHADSCALE SALTBRUSH ATCO Salt-desert Shrub
STIPA UNASSIGNED Perennial Grass Slope
TALL SHRUB (WILLOW/ROSA) UNASSIGNED Shrub Dominated Riparian
TUMBLE MUSTARD UNASSIGNED Shrub/Steppe Annual Grass-Forb
VERNAL POOL UNASSIGNED Mixed Barren Land
WATER WATER Water
WYOMING BIG SAGEBRUSH ARTRW Basin & Wyoming Big Sagebrush
WYOMING BIGSAGEBRUSH/BLUEBUNCHWHEATGRASS
ARTRW/AGSP Basin & Wyoming Big Sagebrush
WYOMING BIGSAGEBRUSH/GOLDENCURRENT
ARTRW Basin & Wyoming Big Sagebrush
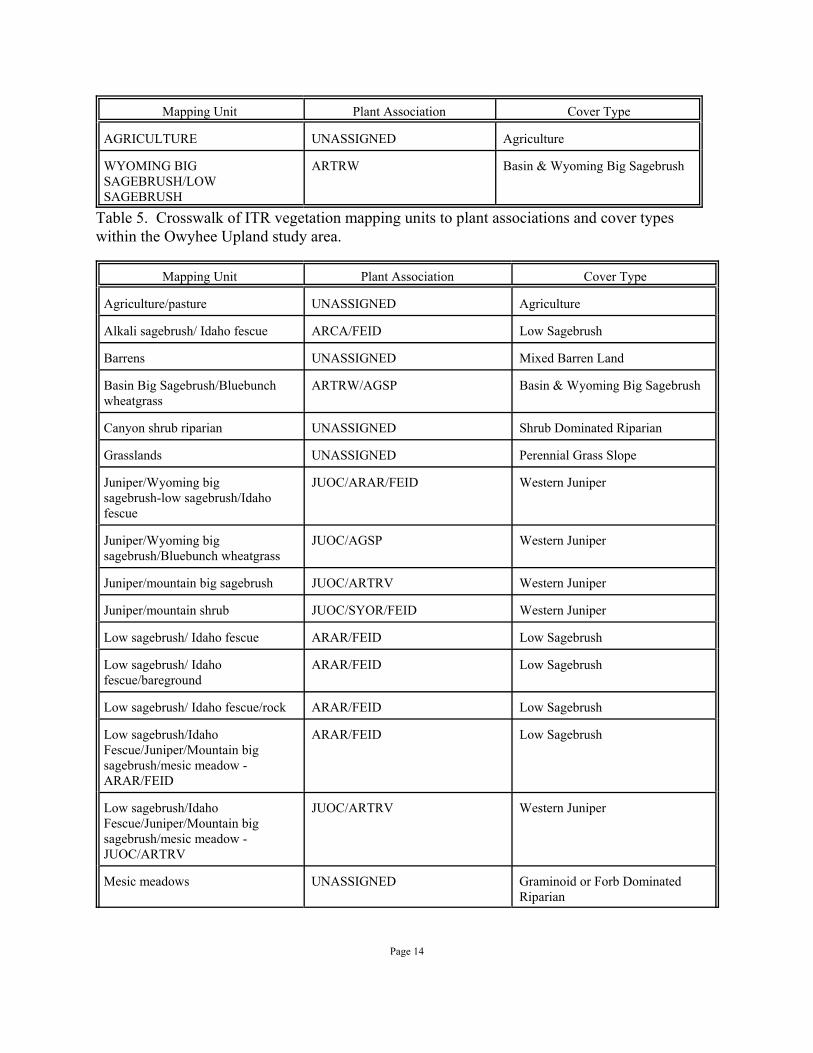
Mapping Unit Plant Association Cover Type
AGRICULTURE UNASSIGNED Agriculture
Page 14
WYOMING BIGSAGEBRUSH/LOWSAGEBRUSH
ARTRW Basin & Wyoming Big Sagebrush
Table 5. Crosswalk of ITR vegetation mapping units to plant associations and cover typeswithin the Owyhee Upland study area.
Mapping Unit Plant Association Cover Type
Agriculture/pasture UNASSIGNED Agriculture
Alkali sagebrush/ Idaho fescue ARCA/FEID Low Sagebrush
Barrens UNASSIGNED Mixed Barren Land
Basin Big Sagebrush/Bluebunchwheatgrass
ARTRW/AGSP Basin & Wyoming Big Sagebrush
Canyon shrub riparian UNASSIGNED Shrub Dominated Riparian
Grasslands UNASSIGNED Perennial Grass Slope
Juniper/Wyoming bigsagebrush-low sagebrush/Idahofescue
JUOC/ARAR/FEID Western Juniper
Juniper/Wyoming bigsagebrush/Bluebunch wheatgrass
JUOC/AGSP Western Juniper
Juniper/mountain big sagebrush JUOC/ARTRV Western Juniper
Juniper/mountain shrub JUOC/SYOR/FEID Western Juniper
Low sagebrush/ Idaho fescue ARAR/FEID Low Sagebrush
Low sagebrush/ Idahofescue/bareground
ARAR/FEID Low Sagebrush
Low sagebrush/ Idaho fescue/rock ARAR/FEID Low Sagebrush
Low sagebrush/IdahoFescue/Juniper/Mountain bigsagebrush/mesic meadow -ARAR/FEID
ARAR/FEID Low Sagebrush
Low sagebrush/IdahoFescue/Juniper/Mountain bigsagebrush/mesic meadow -JUOC/ARTRV
JUOC/ARTRV Western Juniper
Mesic meadows UNASSIGNED Graminoid or Forb DominatedRiparian
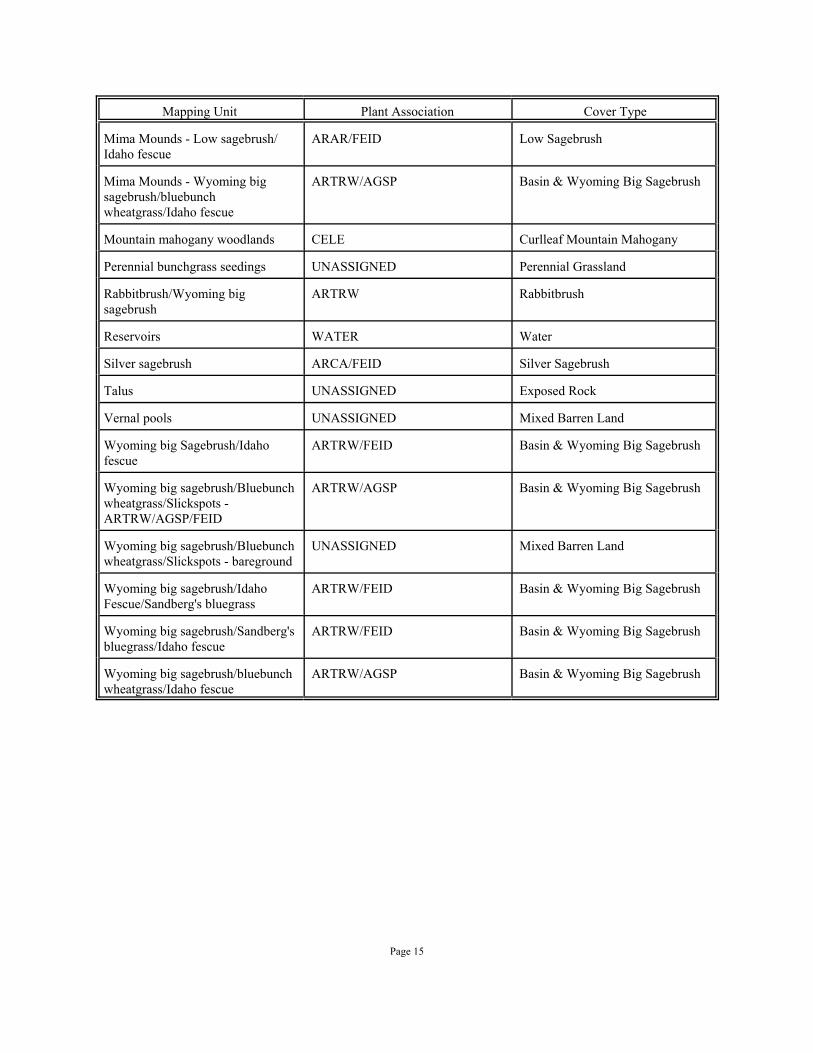
Mapping Unit Plant Association Cover Type
Page 15
Mima Mounds - Low sagebrush/Idaho fescue
ARAR/FEID Low Sagebrush
Mima Mounds - Wyoming bigsagebrush/bluebunchwheatgrass/Idaho fescue
ARTRW/AGSP Basin & Wyoming Big Sagebrush
Mountain mahogany woodlands CELE Curlleaf Mountain Mahogany
Perennial bunchgrass seedings UNASSIGNED Perennial Grassland
Rabbitbrush/Wyoming bigsagebrush
ARTRW Rabbitbrush
Reservoirs WATER Water
Silver sagebrush ARCA/FEID Silver Sagebrush
Talus UNASSIGNED Exposed Rock
Vernal pools UNASSIGNED Mixed Barren Land
Wyoming big Sagebrush/Idahofescue
ARTRW/FEID Basin & Wyoming Big Sagebrush
Wyoming big sagebrush/Bluebunchwheatgrass/Slickspots -ARTRW/AGSP/FEID
ARTRW/AGSP Basin & Wyoming Big Sagebrush
Wyoming big sagebrush/Bluebunchwheatgrass/Slickspots - bareground
UNASSIGNED Mixed Barren Land
Wyoming big sagebrush/IdahoFescue/Sandberg's bluegrass
ARTRW/FEID Basin & Wyoming Big Sagebrush
Wyoming big sagebrush/Sandberg'sbluegrass/Idaho fescue
ARTRW/FEID Basin & Wyoming Big Sagebrush
Wyoming big sagebrush/bluebunchwheatgrass/Idaho fescue
ARTRW/AGSP Basin & Wyoming Big Sagebrush
Page 16
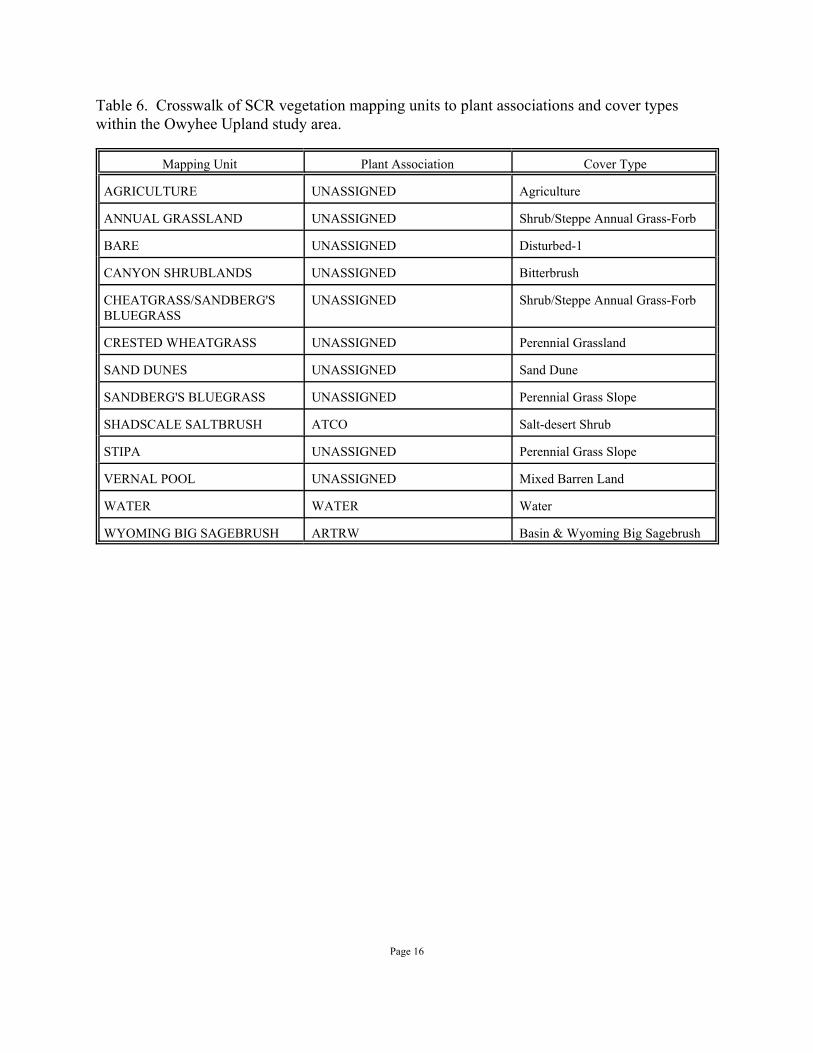
Table 6. Crosswalk of SCR vegetation mapping units to plant associations and cover typeswithin the Owyhee Upland study area.
Mapping Unit Plant Association Cover Type
AGRICULTURE UNASSIGNED Agriculture
ANNUAL GRASSLAND UNASSIGNED Shrub/Steppe Annual Grass-Forb
BARE UNASSIGNED Disturbed-1
CANYON SHRUBLANDS UNASSIGNED Bitterbrush
CHEATGRASS/SANDBERG'SBLUEGRASS
UNASSIGNED Shrub/Steppe Annual Grass-Forb
CRESTED WHEATGRASS UNASSIGNED Perennial Grassland
SAND DUNES UNASSIGNED Sand Dune
SANDBERG'S BLUEGRASS UNASSIGNED Perennial Grass Slope
SHADSCALE SALTBRUSH ATCO Salt-desert Shrub
STIPA UNASSIGNED Perennial Grass Slope
VERNAL POOL UNASSIGNED Mixed Barren Land
WATER WATER Water
WYOMING BIG SAGEBRUSH ARTRW Basin & Wyoming Big Sagebrush
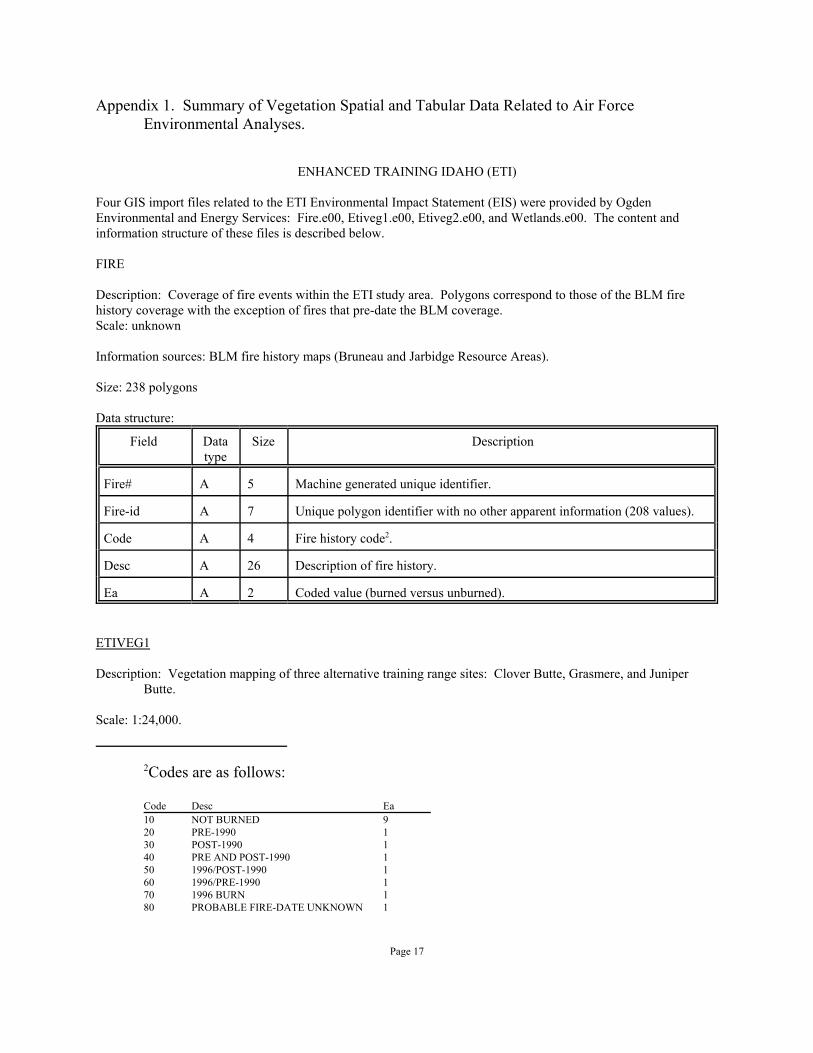
2Codes are as follows:
Code Desc Ea10 NOT BURNED 920 PRE-1990 130 POST-1990 140 PRE AND POST-1990 150 1996/POST-1990 160 1996/PRE-1990 170 1996 BURN 180 PROBABLE FIRE-DATE UNKNOWN 1
Page 17
Appendix 1. Summary of Vegetation Spatial and Tabular Data Related to Air ForceEnvironmental Analyses.
ENHANCED TRAINING IDAHO (ETI)
Four GIS import files related to the ETI Environmental Impact Statement (EIS) were provided by OgdenEnvironmental and Energy Services: Fire.e00, Etiveg1.e00, Etiveg2.e00, and Wetlands.e00. The content andinformation structure of these files is described below.
FIRE
Description: Coverage of fire events within the ETI study area. Polygons correspond to those of the BLM firehistory coverage with the exception of fires that pre-date the BLM coverage. Scale: unknown
Information sources: BLM fire history maps (Bruneau and Jarbidge Resource Areas).
Size: 238 polygons
Data structure:
Field Datatype
Size Description
Fire# A 5 Machine generated unique identifier.
Fire-id A 7 Unique polygon identifier with no other apparent information (208 values).
Code A 4 Fire history code2.
Desc A 26 Description of fire history.
Ea A 2 Coded value (burned versus unburned).
ETIVEG1
Description: Vegetation mapping of three alternative training range sites: Clover Butte, Grasmere, and JuniperButte.
Scale: 1:24,000.
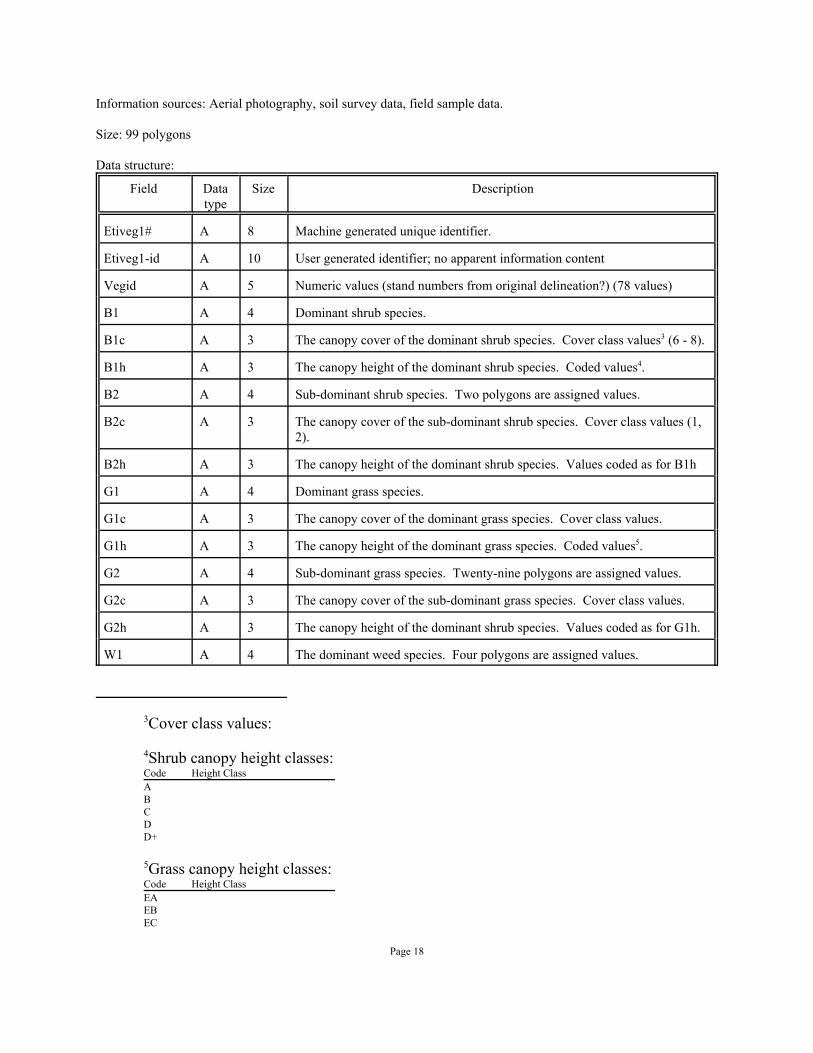
3Cover class values:
4Shrub canopy height classes:Code Height ClassABCDD+
5Grass canopy height classes:Code Height ClassEAEBEC
Page 18
Information sources: Aerial photography, soil survey data, field sample data.
Size: 99 polygons
Data structure:
Field Datatype
Size Description
Etiveg1# A 8 Machine generated unique identifier.
Etiveg1-id A 10 User generated identifier; no apparent information content
Vegid A 5 Numeric values (stand numbers from original delineation?) (78 values)
B1 A 4 Dominant shrub species.
B1c A 3 The canopy cover of the dominant shrub species. Cover class values3 (6 - 8).
B1h A 3 The canopy height of the dominant shrub species. Coded values4.
B2 A 4 Sub-dominant shrub species. Two polygons are assigned values.
B2c A 3 The canopy cover of the sub-dominant shrub species. Cover class values (1,2).
B2h A 3 The canopy height of the dominant shrub species. Values coded as for B1h
G1 A 4 Dominant grass species.
G1c A 3 The canopy cover of the dominant grass species. Cover class values.
G1h A 3 The canopy height of the dominant grass species. Coded values5.
G2 A 4 Sub-dominant grass species. Twenty-nine polygons are assigned values.
G2c A 3 The canopy cover of the sub-dominant grass species. Cover class values.
G2h A 3 The canopy height of the dominant shrub species. Values coded as for G1h.
W1 A 4 The dominant weed species. Four polygons are assigned values.
Field Datatype
Size Description
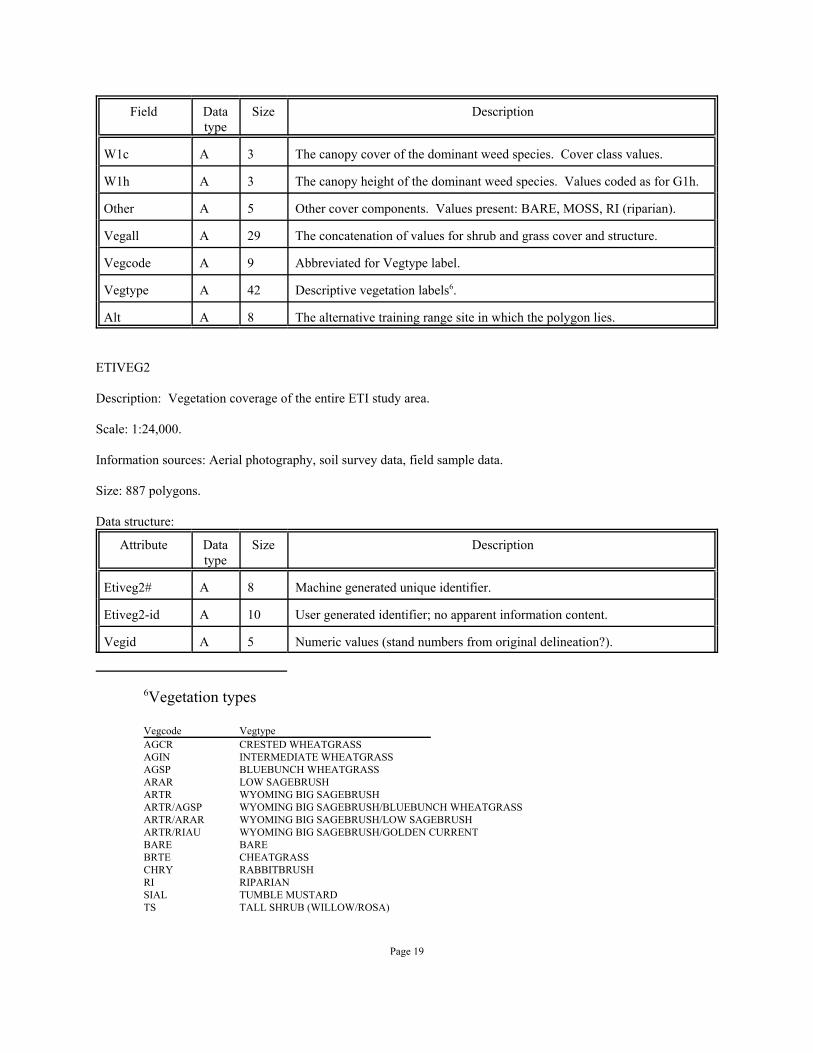
6Vegetation types
Vegcode VegtypeAGCR CRESTED WHEATGRASSAGIN INTERMEDIATE WHEATGRASSAGSP BLUEBUNCH WHEATGRASSARAR LOW SAGEBRUSHARTR WYOMING BIG SAGEBRUSHARTR/AGSP WYOMING BIG SAGEBRUSH/BLUEBUNCH WHEATGRASSARTR/ARAR WYOMING BIG SAGEBRUSH/LOW SAGEBRUSHARTR/RIAU WYOMING BIG SAGEBRUSH/GOLDEN CURRENTBARE BAREBRTE CHEATGRASSCHRY RABBITBRUSHRI RIPARIANSIAL TUMBLE MUSTARDTS TALL SHRUB (WILLOW/ROSA)
Page 19
W1c A 3 The canopy cover of the dominant weed species. Cover class values.
W1h A 3 The canopy height of the dominant weed species. Values coded as for G1h.
Other A 5 Other cover components. Values present: BARE, MOSS, RI (riparian).
Vegall A 29 The concatenation of values for shrub and grass cover and structure.
Vegcode A 9 Abbreviated for Vegtype label.
Vegtype A 42 Descriptive vegetation labels6.
Alt A 8 The alternative training range site in which the polygon lies.
ETIVEG2
Description: Vegetation coverage of the entire ETI study area.
Scale: 1:24,000.
Information sources: Aerial photography, soil survey data, field sample data.
Size: 887 polygons.
Data structure:
Attribute Datatype
Size Description
Etiveg2# A 8 Machine generated unique identifier.
Etiveg2-id A 10 User generated identifier; no apparent information content.
Vegid A 5 Numeric values (stand numbers from original delineation?).
Attribute Datatype
Size Description
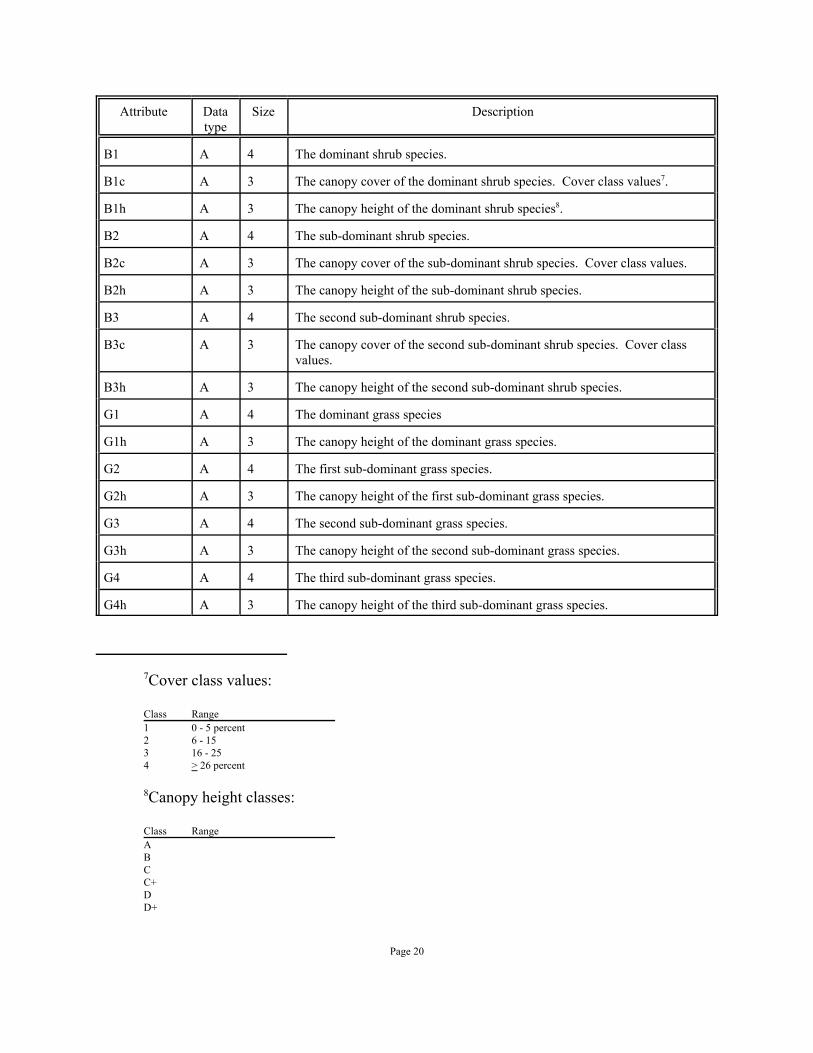
7Cover class values:
Class Range1 0 - 5 percent2 6 - 15 3 16 - 254 > 26 percent
8Canopy height classes:
Class RangeABCC+DD+
Page 20
B1 A 4 The dominant shrub species.
B1c A 3 The canopy cover of the dominant shrub species. Cover class values7.
B1h A 3 The canopy height of the dominant shrub species8.
B2 A 4 The sub-dominant shrub species.
B2c A 3 The canopy cover of the sub-dominant shrub species. Cover class values.
B2h A 3 The canopy height of the sub-dominant shrub species.
B3 A 4 The second sub-dominant shrub species.
B3c A 3 The canopy cover of the second sub-dominant shrub species. Cover classvalues.
B3h A 3 The canopy height of the second sub-dominant shrub species.
G1 A 4 The dominant grass species
G1h A 3 The canopy height of the dominant grass species.
G2 A 4 The first sub-dominant grass species.
G2h A 3 The canopy height of the first sub-dominant grass species.
G3 A 4 The second sub-dominant grass species.
G3h A 3 The canopy height of the second sub-dominant grass species.
G4 A 4 The third sub-dominant grass species.
G4h A 3 The canopy height of the third sub-dominant grass species.
Attribute Datatype
Size Description
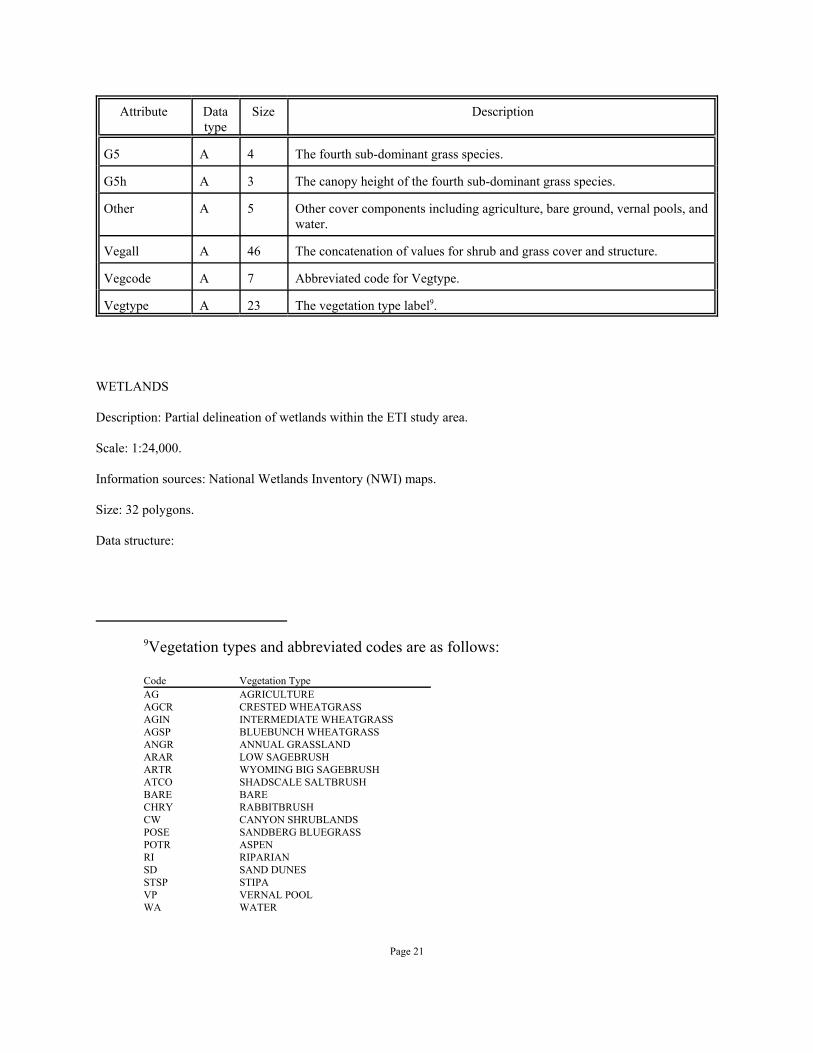
9Vegetation types and abbreviated codes are as follows:
Code Vegetation TypeAG AGRICULTUREAGCR CRESTED WHEATGRASSAGIN INTERMEDIATE WHEATGRASSAGSP BLUEBUNCH WHEATGRASSANGR ANNUAL GRASSLANDARAR LOW SAGEBRUSHARTR WYOMING BIG SAGEBRUSHATCO SHADSCALE SALTBRUSHBARE BARECHRY RABBITBRUSHCW CANYON SHRUBLANDSPOSE SANDBERG BLUEGRASSPOTR ASPENRI RIPARIANSD SAND DUNESSTSP STIPAVP VERNAL POOLWA WATER
Page 21
G5 A 4 The fourth sub-dominant grass species.
G5h A 3 The canopy height of the fourth sub-dominant grass species.
Other A 5 Other cover components including agriculture, bare ground, vernal pools, andwater.
Vegall A 46 The concatenation of values for shrub and grass cover and structure.
Vegcode A 7 Abbreviated code for Vegtype.
Vegtype A 23 The vegetation type label9.
WETLANDS
Description: Partial delineation of wetlands within the ETI study area.
Scale: 1:24,000.
Information sources: National Wetlands Inventory (NWI) maps.
Size: 32 polygons.
Data structure:
Page 22
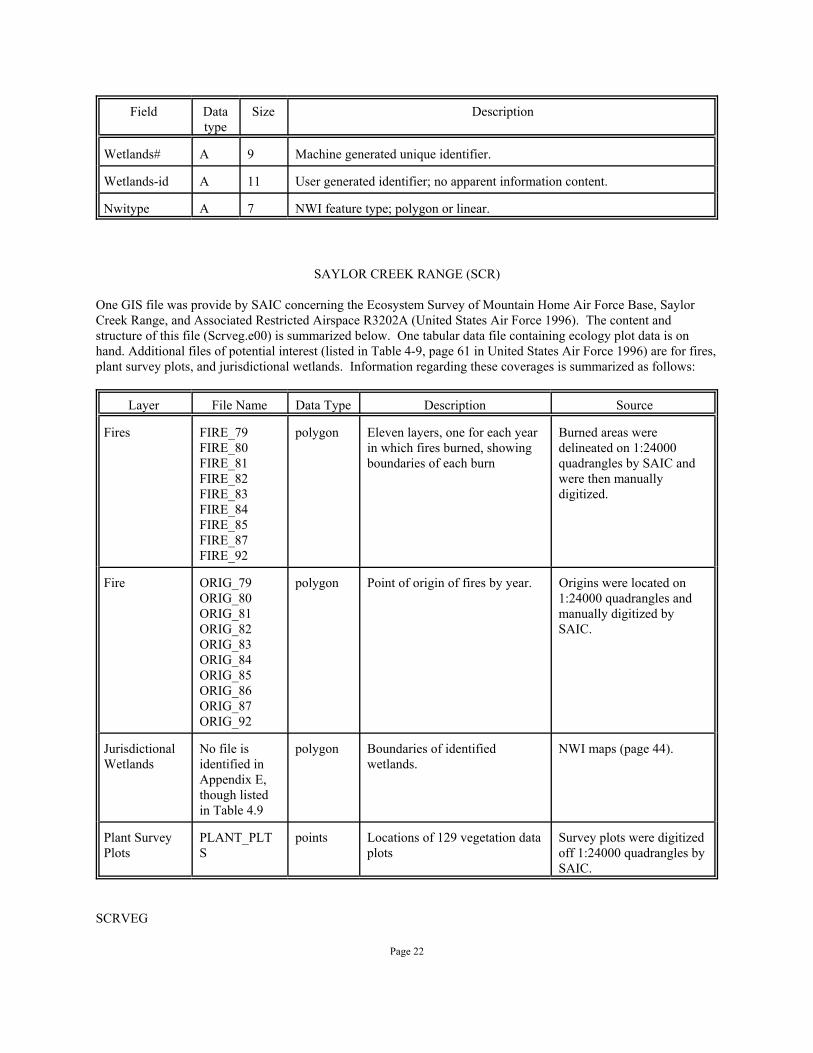
Field Datatype
Size Description
Wetlands# A 9 Machine generated unique identifier.
Wetlands-id A 11 User generated identifier; no apparent information content.
Nwitype A 7 NWI feature type; polygon or linear.
SAYLOR CREEK RANGE (SCR)
One GIS file was provide by SAIC concerning the Ecosystem Survey of Mountain Home Air Force Base, SaylorCreek Range, and Associated Restricted Airspace R3202A (United States Air Force 1996). The content andstructure of this file (Scrveg.e00) is summarized below. One tabular data file containing ecology plot data is onhand. Additional files of potential interest (listed in Table 4-9, page 61 in United States Air Force 1996) are for fires,plant survey plots, and jurisdictional wetlands. Information regarding these coverages is summarized as follows:
Layer File Name Data Type Description Source
Fires FIRE_79FIRE_80FIRE_81FIRE_82FIRE_83FIRE_84FIRE_85FIRE_87FIRE_92
polygon Eleven layers, one for each yearin which fires burned, showingboundaries of each burn
Burned areas weredelineated on 1:24000quadrangles by SAIC andwere then manuallydigitized.
Fire ORIG_79ORIG_80ORIG_81ORIG_82ORIG_83ORIG_84ORIG_85ORIG_86ORIG_87ORIG_92
polygon Point of origin of fires by year. Origins were located on1:24000 quadrangles andmanually digitized bySAIC.
JurisdictionalWetlands
No file isidentified inAppendix E,though listedin Table 4.9
polygon Boundaries of identifiedwetlands.
NWI maps (page 44).
Plant SurveyPlots
PLANT_PLTS
points Locations of 129 vegetation dataplots
Survey plots were digitizedoff 1:24000 quadrangles bySAIC.
SCRVEG
10Vegetation mapping units:
AGRICULTUREANNUAL GRASSLANDBARECANYON SHRUBLANDSCHEATGRASS/SANDBERG'S BLUEGRASSCRESTED WHEATGRASSSAND DUNESSANDBERG'S BLUEGRASSSHADSCALE SALTBRUSHSTIPAVERNAL POOLWATERWYOMING BIG SAGEBRUSH
Page 23
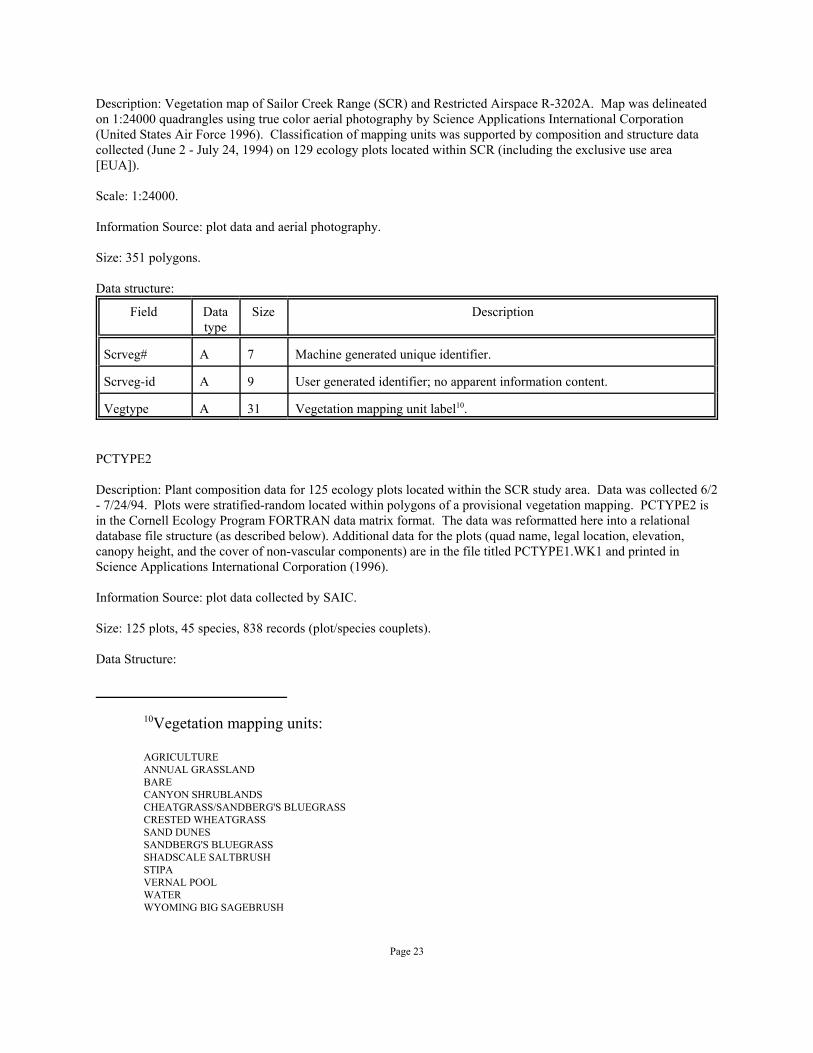
Description: Vegetation map of Sailor Creek Range (SCR) and Restricted Airspace R-3202A. Map was delineatedon 1:24000 quadrangles using true color aerial photography by Science Applications International Corporation(United States Air Force 1996). Classification of mapping units was supported by composition and structure datacollected (June 2 - July 24, 1994) on 129 ecology plots located within SCR (including the exclusive use area[EUA]).
Scale: 1:24000.
Information Source: plot data and aerial photography.
Size: 351 polygons.
Data structure:
Field Datatype
Size Description
Scrveg# A 7 Machine generated unique identifier.
Scrveg-id A 9 User generated identifier; no apparent information content.
Vegtype A 31 Vegetation mapping unit label10.
PCTYPE2
Description: Plant composition data for 125 ecology plots located within the SCR study area. Data was collected 6/2- 7/24/94. Plots were stratified-random located within polygons of a provisional vegetation mapping. PCTYPE2 isin the Cornell Ecology Program FORTRAN data matrix format. The data was reformatted here into a relationaldatabase file structure (as described below). Additional data for the plots (quad name, legal location, elevation,canopy height, and the cover of non-vascular components) are in the file titled PCTYPE1.WK1 and printed inScience Applications International Corporation (1996).
Information Source: plot data collected by SAIC.
Size: 125 plots, 45 species, 838 records (plot/species couplets).
Data Structure:
Page 24
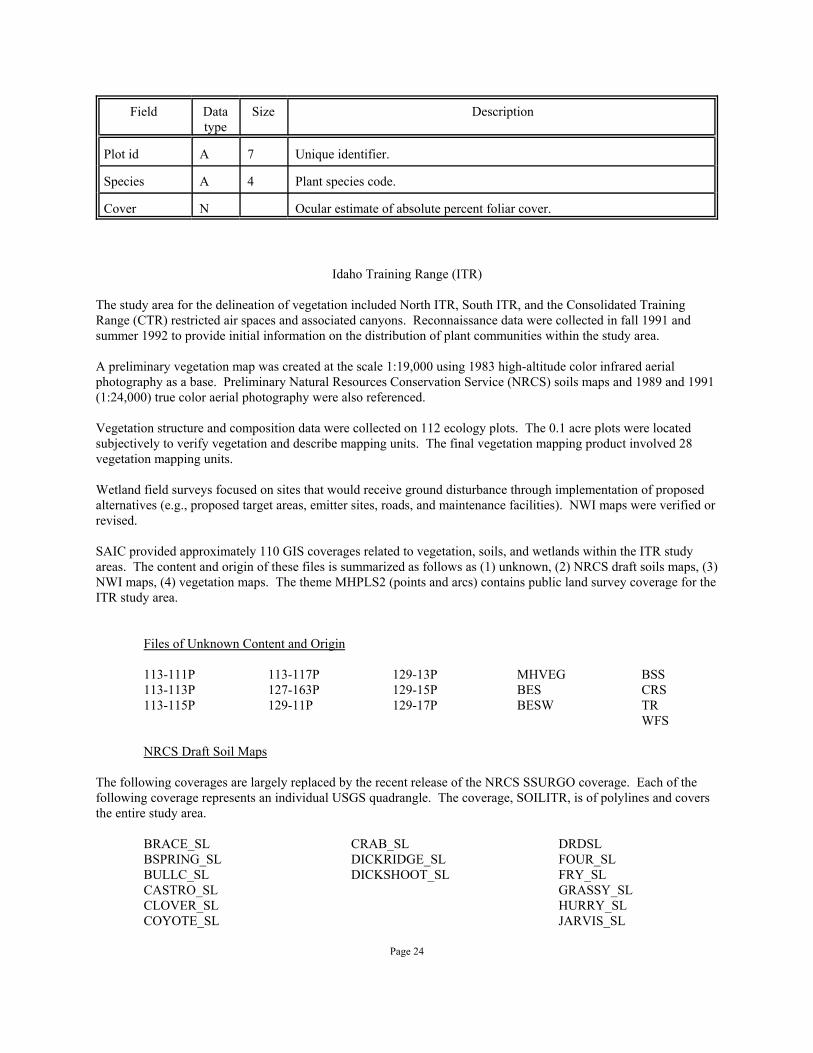
Field Datatype
Size Description
Plot id A 7 Unique identifier.
Species A 4 Plant species code.
Cover N Ocular estimate of absolute percent foliar cover.
Idaho Training Range (ITR)
The study area for the delineation of vegetation included North ITR, South ITR, and the Consolidated TrainingRange (CTR) restricted air spaces and associated canyons. Reconnaissance data were collected in fall 1991 andsummer 1992 to provide initial information on the distribution of plant communities within the study area.
A preliminary vegetation map was created at the scale 1:19,000 using 1983 high-altitude color infrared aerialphotography as a base. Preliminary Natural Resources Conservation Service (NRCS) soils maps and 1989 and 1991(1:24,000) true color aerial photography were also referenced.
Vegetation structure and composition data were collected on 112 ecology plots. The 0.1 acre plots were locatedsubjectively to verify vegetation and describe mapping units. The final vegetation mapping product involved 28vegetation mapping units.
Wetland field surveys focused on sites that would receive ground disturbance through implementation of proposedalternatives (e.g., proposed target areas, emitter sites, roads, and maintenance facilities). NWI maps were verified orrevised.
SAIC provided approximately 110 GIS coverages related to vegetation, soils, and wetlands within the ITR studyareas. The content and origin of these files is summarized as follows as (1) unknown, (2) NRCS draft soils maps, (3)NWI maps, (4) vegetation maps. The theme MHPLS2 (points and arcs) contains public land survey coverage for theITR study area.
Files of Unknown Content and Origin
113-111P113-113P113-115P
113-117P127-163P129-11P
129-13P129-15P129-17P
MHVEGBESBESW
BSSCRSTRWFS
NRCS Draft Soil Maps
The following coverages are largely replaced by the recent release of the NRCS SSURGO coverage. Each of thefollowing coverage represents an individual USGS quadrangle. The coverage, SOILITR, is of polylines and coversthe entire study area.
BRACE_SLBSPRING_SLBULLC_SLCASTRO_SLCLOVER_SLCOYOTE_SL
CRAB_SLDICKRIDGE_SLDICKSHOOT_SL
DRDSLFOUR_SLFRY_SLGRASSY_SLHURRY_SLJARVIS_SL
Page 25
JUNIPER_SLLOST_SLPIUTE_SLPIUTW_SL
PLEASV_SLRED_SLSHOOFLY_SLSLACK_SLSMITH_SL
SPRING_SLWAGON_SLWICKIUP_SL
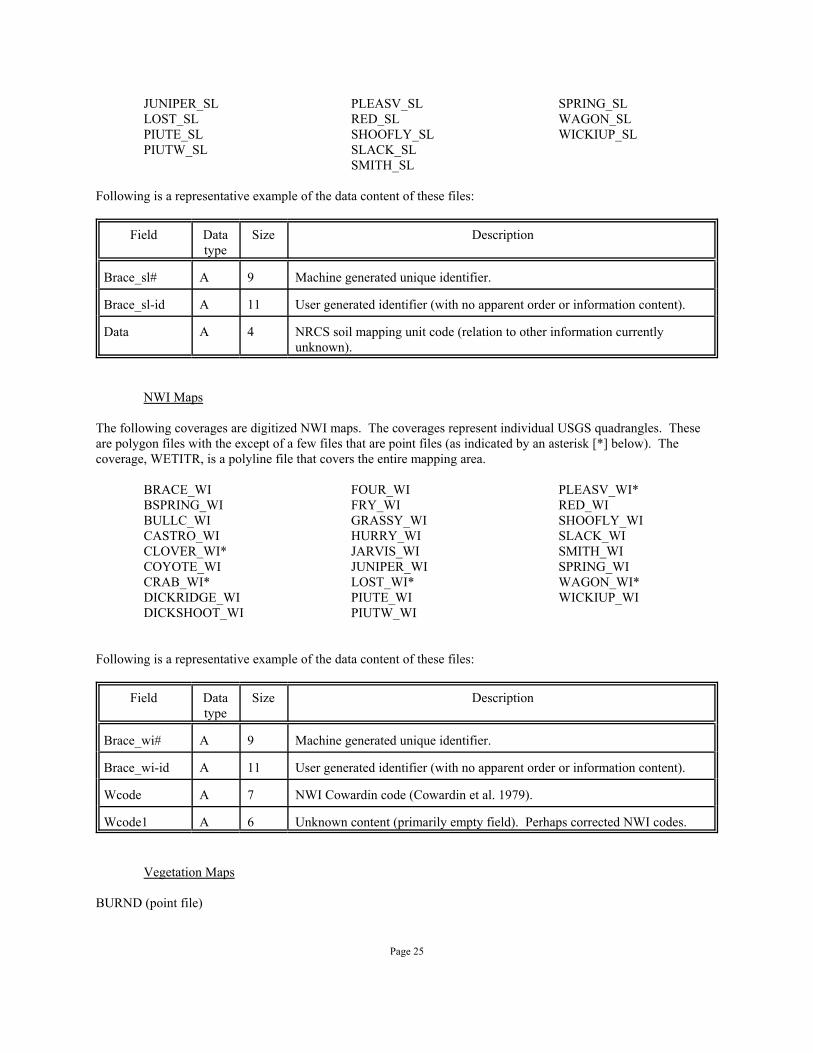
Following is a representative example of the data content of these files:
Field Datatype
Size Description
Brace_sl# A 9 Machine generated unique identifier.
Brace_sl-id A 11 User generated identifier (with no apparent order or information content).
Data A 4 NRCS soil mapping unit code (relation to other information currentlyunknown).
NWI Maps
The following coverages are digitized NWI maps. The coverages represent individual USGS quadrangles. Theseare polygon files with the except of a few files that are point files (as indicated by an asterisk [*] below). Thecoverage, WETITR, is a polyline file that covers the entire mapping area.
BRACE_WIBSPRING_WIBULLC_WICASTRO_WICLOVER_WI*COYOTE_WICRAB_WI*DICKRIDGE_WIDICKSHOOT_WI
FOUR_WIFRY_WIGRASSY_WIHURRY_WIJARVIS_WIJUNIPER_WILOST_WI*PIUTE_WIPIUTW_WI
PLEASV_WI*RED_WISHOOFLY_WISLACK_WISMITH_WISPRING_WIWAGON_WI*WICKIUP_WI
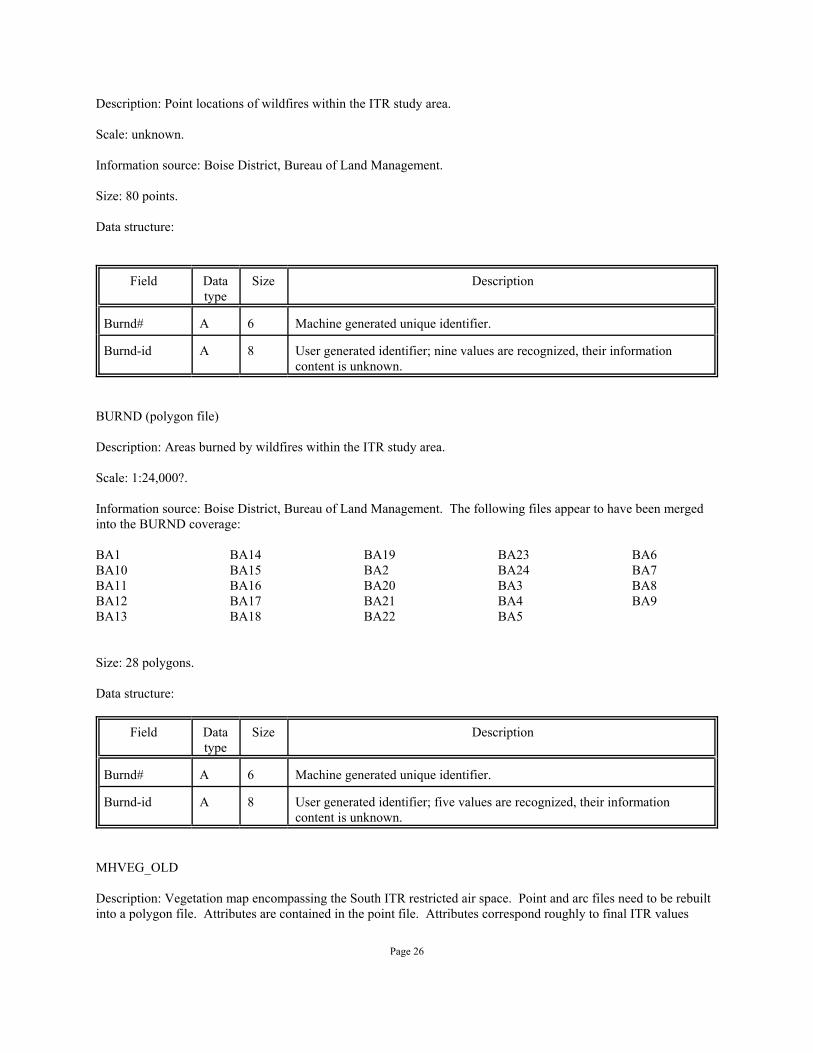
Following is a representative example of the data content of these files:
Field Datatype
Size Description
Brace_wi# A 9 Machine generated unique identifier.
Brace_wi-id A 11 User generated identifier (with no apparent order or information content).
Wcode A 7 NWI Cowardin code (Cowardin et al. 1979).
Wcode1 A 6 Unknown content (primarily empty field). Perhaps corrected NWI codes.
Vegetation Maps
BURND (point file)
Page 26
Description: Point locations of wildfires within the ITR study area.
Scale: unknown.
Information source: Boise District, Bureau of Land Management.
Size: 80 points.
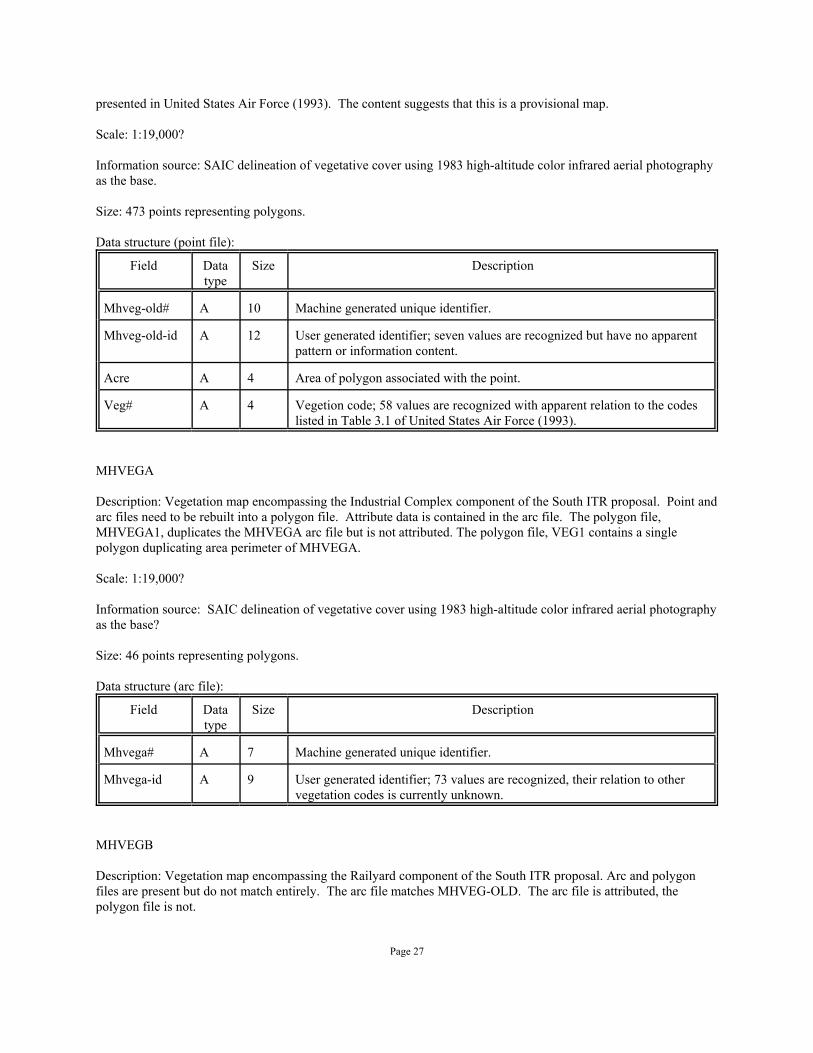
Data structure:
Field Datatype
Size Description
Burnd# A 6 Machine generated unique identifier.
Burnd-id A 8 User generated identifier; nine values are recognized, their informationcontent is unknown.
BURND (polygon file)
Description: Areas burned by wildfires within the ITR study area.
Scale: 1:24,000?.
Information source: Boise District, Bureau of Land Management. The following files appear to have been mergedinto the BURND coverage:
BA1BA10BA11BA12BA13
BA14BA15BA16BA17BA18
BA19BA2BA20BA21BA22
BA23BA24BA3BA4BA5
BA6BA7BA8BA9
Size: 28 polygons.
Data structure:
Field Datatype
Size Description
Burnd# A 6 Machine generated unique identifier.
Burnd-id A 8 User generated identifier; five values are recognized, their informationcontent is unknown.
MHVEG_OLD
Description: Vegetation map encompassing the South ITR restricted air space. Point and arc files need to be rebuiltinto a polygon file. Attributes are contained in the point file. Attributes correspond roughly to final ITR values
Page 27
presented in United States Air Force (1993). The content suggests that this is a provisional map.
Scale: 1:19,000?
Information source: SAIC delineation of vegetative cover using 1983 high-altitude color infrared aerial photographyas the base.
Size: 473 points representing polygons.
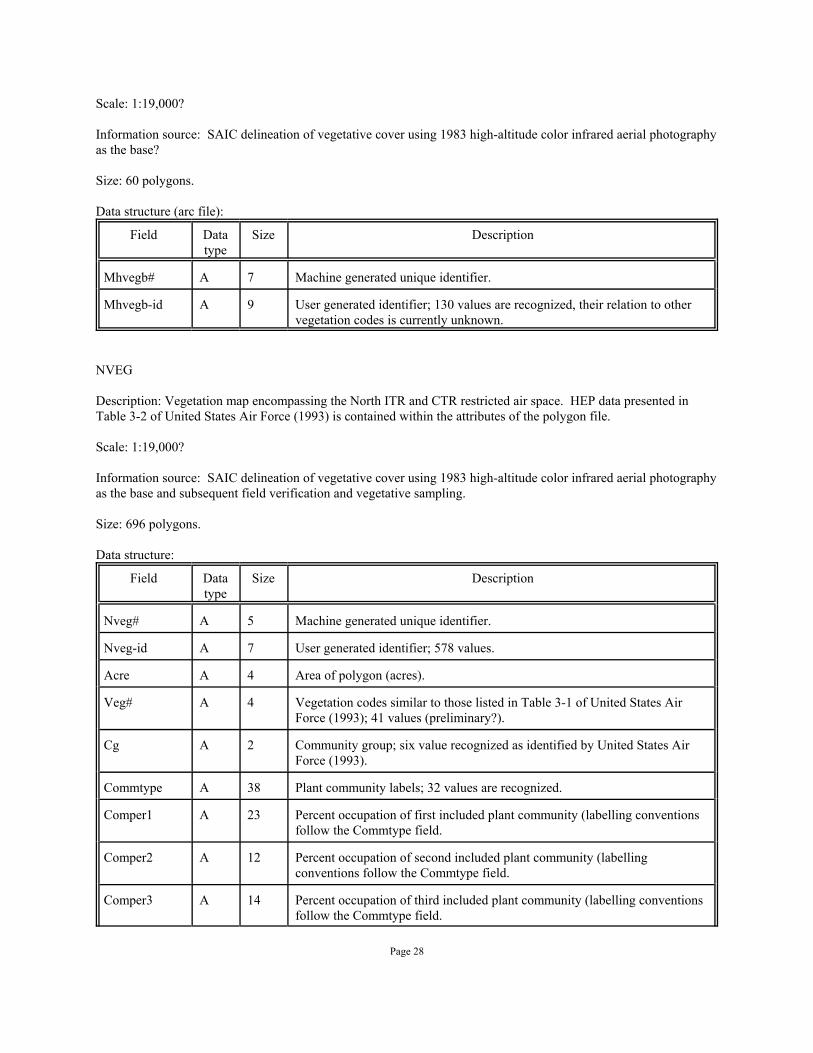
Data structure (point file):
Field Datatype
Size Description
Mhveg-old# A 10 Machine generated unique identifier.
Mhveg-old-id A 12 User generated identifier; seven values are recognized but have no apparentpattern or information content.
Acre A 4 Area of polygon associated with the point.
Veg# A 4 Vegetion code; 58 values are recognized with apparent relation to the codeslisted in Table 3.1 of United States Air Force (1993).
MHVEGA
Description: Vegetation map encompassing the Industrial Complex component of the South ITR proposal. Point andarc files need to be rebuilt into a polygon file. Attribute data is contained in the arc file. The polygon file,MHVEGA1, duplicates the MHVEGA arc file but is not attributed. The polygon file, VEG1 contains a singlepolygon duplicating area perimeter of MHVEGA.
Scale: 1:19,000?
Information source: SAIC delineation of vegetative cover using 1983 high-altitude color infrared aerial photographyas the base?
Size: 46 points representing polygons.
Data structure (arc file):
Field Datatype
Size Description
Mhvega# A 7 Machine generated unique identifier.
Mhvega-id A 9 User generated identifier; 73 values are recognized, their relation to othervegetation codes is currently unknown.
MHVEGB
Description: Vegetation map encompassing the Railyard component of the South ITR proposal. Arc and polygonfiles are present but do not match entirely. The arc file matches MHVEG-OLD. The arc file is attributed, thepolygon file is not.
Page 28
Scale: 1:19,000?
Information source: SAIC delineation of vegetative cover using 1983 high-altitude color infrared aerial photographyas the base?
Size: 60 polygons.
Data structure (arc file):
Field Datatype
Size Description
Mhvegb# A 7 Machine generated unique identifier.
Mhvegb-id A 9 User generated identifier; 130 values are recognized, their relation to othervegetation codes is currently unknown.
NVEG
Description: Vegetation map encompassing the North ITR and CTR restricted air space. HEP data presented inTable 3-2 of United States Air Force (1993) is contained within the attributes of the polygon file.
Scale: 1:19,000?
Information source: SAIC delineation of vegetative cover using 1983 high-altitude color infrared aerial photographyas the base and subsequent field verification and vegetative sampling.
Size: 696 polygons.
Data structure:
Field Datatype
Size Description
Nveg# A 5 Machine generated unique identifier.
Nveg-id A 7 User generated identifier; 578 values.
Acre A 4 Area of polygon (acres).
Veg# A 4 Vegetation codes similar to those listed in Table 3-1 of United States AirForce (1993); 41 values (preliminary?).
Cg A 2 Community group; six value recognized as identified by United States AirForce (1993).
Commtype A 38 Plant community labels; 32 values are recognized.
Comper1 A 23 Percent occupation of first included plant community (labelling conventionsfollow the Commtype field.
Comper2 A 12 Percent occupation of second included plant community (labellingconventions follow the Commtype field.
Comper3 A 14 Percent occupation of third included plant community (labelling conventionsfollow the Commtype field.
Field Datatype
Size Description
Nveg# A 5 Machine generated unique identifier.
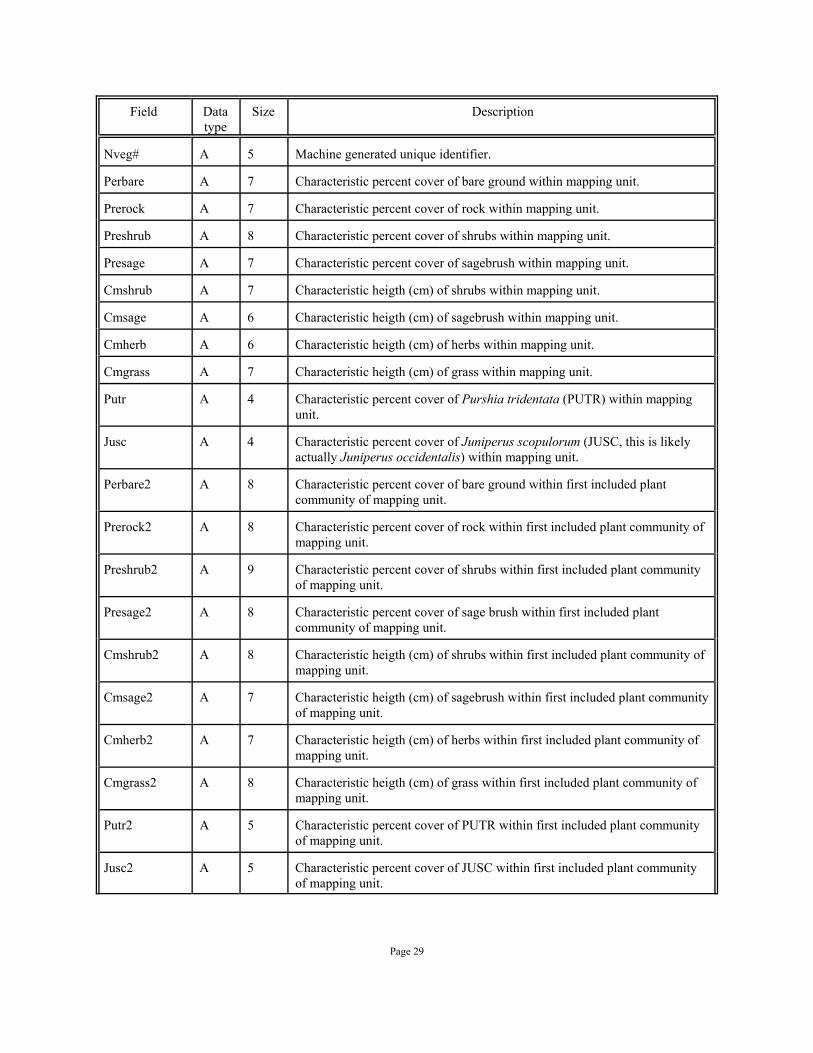
Page 29
Perbare A 7 Characteristic percent cover of bare ground within mapping unit.
Prerock A 7 Characteristic percent cover of rock within mapping unit.
Preshrub A 8 Characteristic percent cover of shrubs within mapping unit.
Presage A 7 Characteristic percent cover of sagebrush within mapping unit.
Cmshrub A 7 Characteristic heigth (cm) of shrubs within mapping unit.
Cmsage A 6 Characteristic heigth (cm) of sagebrush within mapping unit.
Cmherb A 6 Characteristic heigth (cm) of herbs within mapping unit.
Cmgrass A 7 Characteristic heigth (cm) of grass within mapping unit.
Putr A 4 Characteristic percent cover of Purshia tridentata (PUTR) within mappingunit.
Jusc A 4 Characteristic percent cover of Juniperus scopulorum (JUSC, this is likelyactually Juniperus occidentalis) within mapping unit.
Perbare2 A 8 Characteristic percent cover of bare ground within first included plantcommunity of mapping unit.
Prerock2 A 8 Characteristic percent cover of rock within first included plant community ofmapping unit.
Preshrub2 A 9 Characteristic percent cover of shrubs within first included plant communityof mapping unit.
Presage2 A 8 Characteristic percent cover of sage brush within first included plantcommunity of mapping unit.
Cmshrub2 A 8 Characteristic heigth (cm) of shrubs within first included plant community ofmapping unit.
Cmsage2 A 7 Characteristic heigth (cm) of sagebrush within first included plant communityof mapping unit.
Cmherb2 A 7 Characteristic heigth (cm) of herbs within first included plant community ofmapping unit.
Cmgrass2 A 8 Characteristic heigth (cm) of grass within first included plant community ofmapping unit.
Putr2 A 5 Characteristic percent cover of PUTR within first included plant communityof mapping unit.
Jusc2 A 5 Characteristic percent cover of JUSC within first included plant communityof mapping unit.
Field Datatype
Size Description
Nveg# A 5 Machine generated unique identifier.
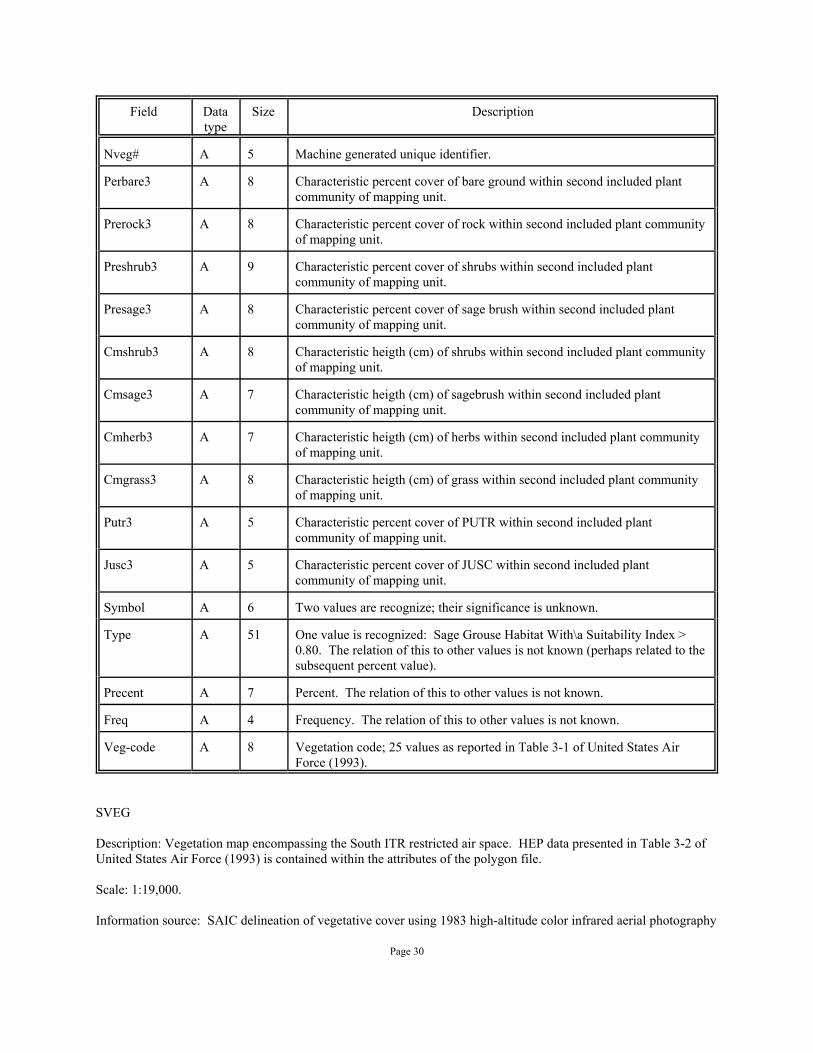
Page 30
Perbare3 A 8 Characteristic percent cover of bare ground within second included plantcommunity of mapping unit.
Prerock3 A 8 Characteristic percent cover of rock within second included plant communityof mapping unit.
Preshrub3 A 9 Characteristic percent cover of shrubs within second included plantcommunity of mapping unit.
Presage3 A 8 Characteristic percent cover of sage brush within second included plantcommunity of mapping unit.
Cmshrub3 A 8 Characteristic heigth (cm) of shrubs within second included plant communityof mapping unit.
Cmsage3 A 7 Characteristic heigth (cm) of sagebrush within second included plantcommunity of mapping unit.
Cmherb3 A 7 Characteristic heigth (cm) of herbs within second included plant communityof mapping unit.
Cmgrass3 A 8 Characteristic heigth (cm) of grass within second included plant communityof mapping unit.
Putr3 A 5 Characteristic percent cover of PUTR within second included plantcommunity of mapping unit.
Jusc3 A 5 Characteristic percent cover of JUSC within second included plantcommunity of mapping unit.
Symbol A 6 Two values are recognize; their significance is unknown.
Type A 51 One value is recognized: Sage Grouse Habitat With\a Suitability Index >0.80. The relation of this to other values is not known (perhaps related to thesubsequent percent value).
Precent A 7 Percent. The relation of this to other values is not known.
Freq A 4 Frequency. The relation of this to other values is not known.
Veg-code A 8 Vegetation code; 25 values as reported in Table 3-1 of United States AirForce (1993).
SVEG
Description: Vegetation map encompassing the South ITR restricted air space. HEP data presented in Table 3-2 ofUnited States Air Force (1993) is contained within the attributes of the polygon file.
Scale: 1:19,000.
Information source: SAIC delineation of vegetative cover using 1983 high-altitude color infrared aerial photography
Page 31
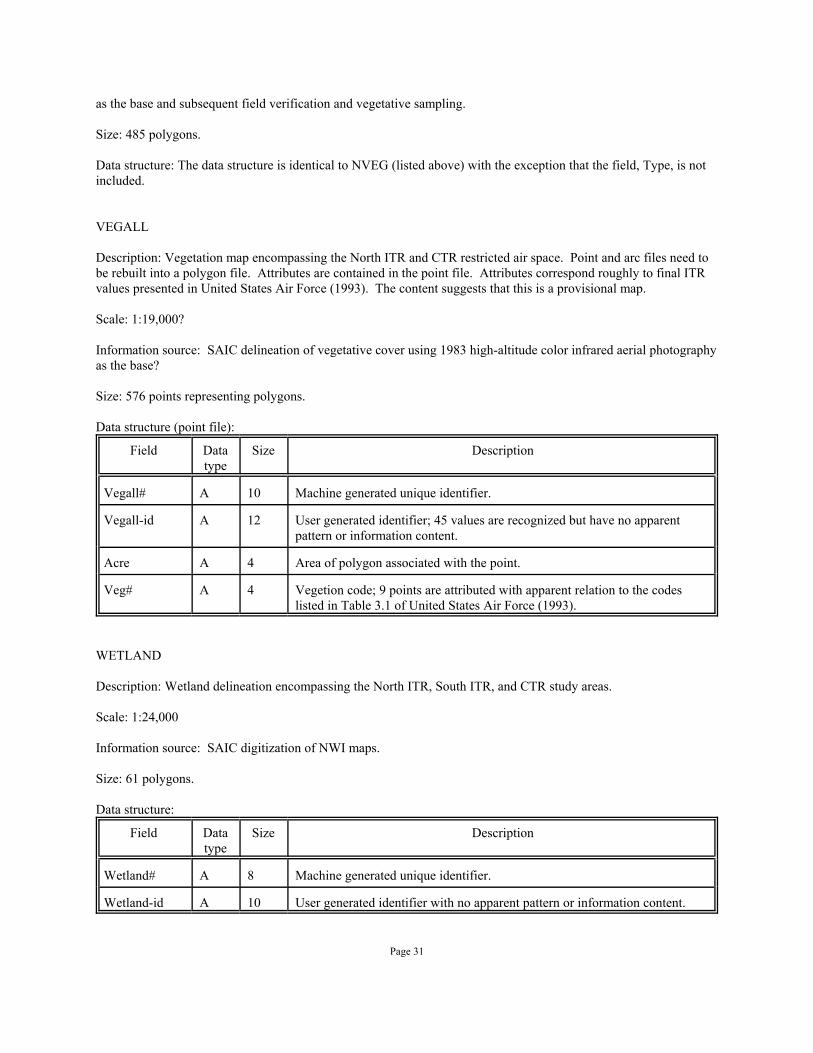
as the base and subsequent field verification and vegetative sampling.
Size: 485 polygons.
Data structure: The data structure is identical to NVEG (listed above) with the exception that the field, Type, is notincluded.
VEGALL
Description: Vegetation map encompassing the North ITR and CTR restricted air space. Point and arc files need tobe rebuilt into a polygon file. Attributes are contained in the point file. Attributes correspond roughly to final ITRvalues presented in United States Air Force (1993). The content suggests that this is a provisional map.
Scale: 1:19,000?
Information source: SAIC delineation of vegetative cover using 1983 high-altitude color infrared aerial photographyas the base?
Size: 576 points representing polygons.
Data structure (point file):
Field Datatype
Size Description
Vegall# A 10 Machine generated unique identifier.
Vegall-id A 12 User generated identifier; 45 values are recognized but have no apparentpattern or information content.
Acre A 4 Area of polygon associated with the point.
Veg# A 4 Vegetion code; 9 points are attributed with apparent relation to the codeslisted in Table 3.1 of United States Air Force (1993).
WETLAND
Description: Wetland delineation encompassing the North ITR, South ITR, and CTR study areas.
Scale: 1:24,000
Information source: SAIC digitization of NWI maps.
Size: 61 polygons.
Data structure:
Field Datatype
Size Description
Wetland# A 8 Machine generated unique identifier.
Wetland-id A 10 User generated identifier with no apparent pattern or information content.
Page 32
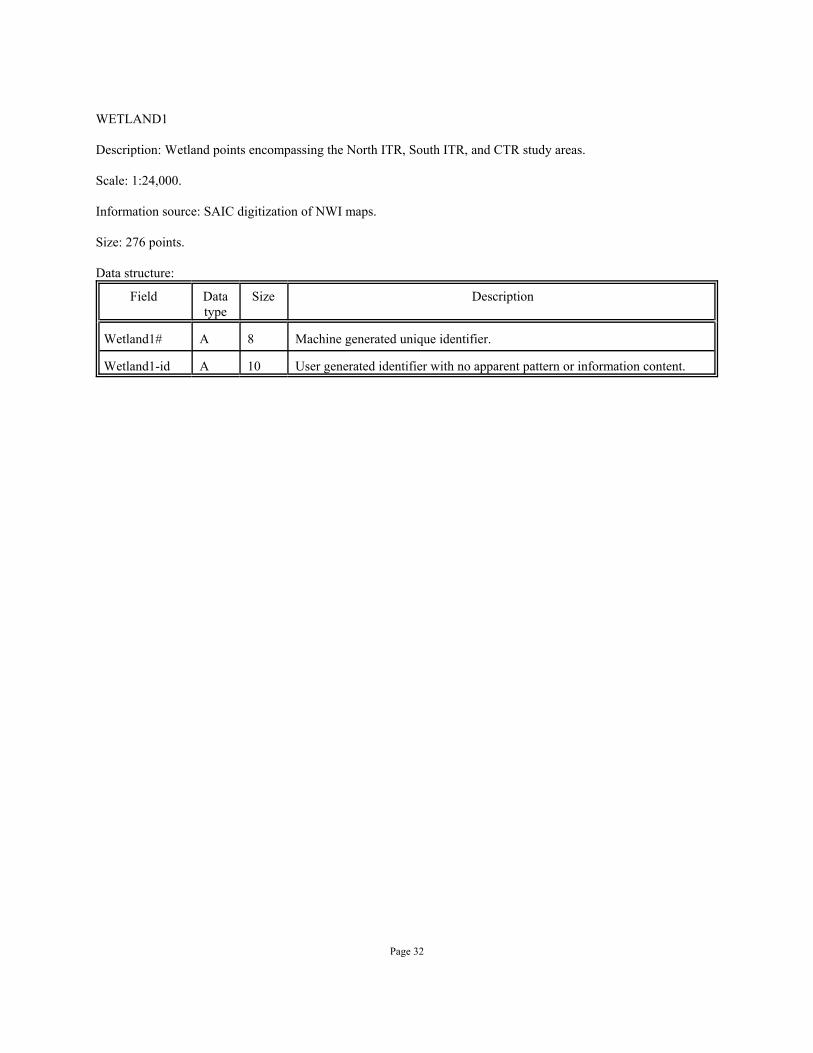
WETLAND1
Description: Wetland points encompassing the North ITR, South ITR, and CTR study areas.
Scale: 1:24,000.
Information source: SAIC digitization of NWI maps.
Size: 276 points.
Data structure:
Field Datatype
Size Description
Wetland1# A 8 Machine generated unique identifier.
Wetland1-id A 10 User generated identifier with no apparent pattern or information content.