monitoring patient safety in the recovery room
TRANSCRIPT

University of Missouri, St. LouisIRL @ UMSL
Dissertations UMSL Graduate Works
9-14-2017
Monitoring Patient Safety in the Recovery RoomGail [email protected]
Follow this and additional works at: https://irl.umsl.edu/dissertation
Part of the Perioperative, Operating Room and Surgical Nursing Commons
This Dissertation is brought to you for free and open access by the UMSL Graduate Works at IRL @ UMSL. It has been accepted for inclusion inDissertations by an authorized administrator of IRL @ UMSL. For more information, please contact [email protected].
Recommended CitationDavis, Gail, "Monitoring Patient Safety in the Recovery Room" (2017). Dissertations. 708.https://irl.umsl.edu/dissertation/708

Running head: MONITORING PATIENT SAFETY IN RECOVERY 1
Monitoring Patient Safety in the Recovery Room
Gail E. Davis
M.S.N., Saint Louis University, 1996
B.S. N. Webster University, 1990
A Dissertation Submitted to The Graduate School at the University of Missouri-St. Louis in partial fulfillment of the requirements for the degree
Doctor of Philosophy in Nursing
December 2017
Advisory Committee
Kathie Records, Ph.D., RN, FAAN
Chair person
Maryann Bozzette, Ph.D.
Nelda Martin ANP-BC, CCNS
Ericka Sanner-Stieher, Ph.D.
.
Copyright, Gail E. Davis, 2017

CARBON DIOXIDE MONITORING IN RECOVERY 2
TABLE OF CONTENTS
ABSTRACT………………………………………………………………………8
CHAPTER 1: INTRODUCTION TO THE STUDY…………………………….10
Problem Statement ……………………………………………………….……...11
Purpose of the Research………………………………………………………….15
Research Questions……………………...……………………………………….16
Significance...…………………………………………………………………….17
Limitations ……………………………………………………………………....18
Assumptions …………………….……………………………….…………...….19
Summary…………………………………………………………………………19
CHAPTER 2: CONCEPTUAL FRAMEWORK & LITERATURE REVIEW....21
Research Questions………………………………………………………………21
Conceptual Framework…………………………………………………………..21
General Systems Theory…………………………………………………21
Concepts of GST……………………………………………………...….23
Review of the Literature………………………………………………………....27
Overview of Patient Safety………………………………………………27
Perioperative Patient Safety………………………………………….…..29
Perioperative Safety Variable…..………………………………….…….31
Increased Monitoring of Safety Variable Through Capnography ………33
Transcutaneous Capnography as Related to Patient Safety…………………..….34
Current Research ……………………………………………………..….36
Table 3 Summary of Transcutaneous Research …………………………36

CARBON DIOXIDE MONITORING IN RECOVERY 3
Enhancing Monitoring of Postoperative Safety Variables……………….41
Limitations……………………………………………….……………....43
Significance of Measuring Carbon Dioxide in Recovery Room ……………......43
Consequences of Postoperative Respiratory Complications ….…...……44
Risk Assessment for Safety Variables…………………………….….….45
Summary…………………………………………………………………………46
CHAPTER 3: METHODOLOGY ……………………………………...……….48
Introduction………………...…………………………………………………….48
Participants..……………………………………………………………………...48
Measures…………….……………………………………………………….…..50
Design…................................................................................................................52
Human Subjects………………………………………………………………….53
Procedures …………………………………………………………………….…53
Data Management and Analysis……….…………………………………….…..57
Summary………………………………………………...……………………….58
CHAPTER 4: RESULTS………………………………………………….……..59
Data Analysis Decisions…………...………………………….…………….…...59
Description of Overalls Sample………………………………………………….60
Time in Phase I Recovery………………………………………………………..65
Opioid Administration……………………………………………………….…..66
Patient Safety Variables………………………………………………………….69
Transcutaneous Monitoring Subset Analysis ……………………………………74
Results……………………………………………………………………………76
CARBON DIOXIDE MONITORING IN RECOVERY 4
Summary…………………………………………………………………………79
CHAPTER 5: DISCUSSION ……………………………………..….…………80
Summary of Objectives …………………………………………...……………..80
Summary of Results ……………………………………………………………..80
Findings as Applied to GST ……………………………………….…………….83
Limitations ………………………………………………………………………84
Implications to Nursing Practice ………………………………………..……….87
Future Research …………………………………………………………………88
Conclusions ……………………………………………………………………...89

CARBON DIOXIDE MONITORING IN RECOVERY 5
LIST OF TABLES
Table 1: Modified Aldrete Recovery Score…………………………………………..….32
Table 2: Richmond Agitation-Sedation Scale Score………………………………….…32
Table 3: Summary of Transcutaneous Capnography Research…………..……………...36
Table 4: Demographic and Clinical Summaries by Study Group ………………….……61
Table 5: Frequency Table: ASA…………………………………………………...….…62
Table 6: Surgery Frequency by Primary Service………………………………………...63
Table 7: Surgeries Categorized by Operating Room Pods……………………..….….…64
Table 8: Time in phase I by Study Group……………………………………….…….....65
Table 9: Opioid Administration Doses by PACU Time and by Study Group….….…….68
Table 10: Patient Safety Variables upon PACU Admission and Overtime …..………....69
Table 11: Patient Safety Measure Target Achieved upon Admission and Overtime……72
Table 12: Patient Safety Measure target Change from PACU and Overtime…………....74
Table 13: TrCO2 Subset: Average of Subsequent TrCO2 Readings by Pain Score …..…76

CARBON DIOXIDE MONITORING IN RECOVERY 6
LIST OF FIGURES
Figure 1: General Systems Theory Framework……………………………………….....23
Figure 2: Comparison of Phase I Time in Minutes ……………………………………...66
Figure 3: Opioid Administration ………………………………………...………………69
Figure 4: Patient Safety Variables Baseline and Overtime ………………………...…....70

CARBON DIOXIDE MONITORING IN RECOVERY 7
ACKNOWLEDGEMENTS
I would like to take this opportunity to acknowledge the amazing support I
received from the faculty at the university, Dr. Anne Fish, Dr. Margaret Barton-Burke
and, most recently, Dr. Kathie Records. Each has offered me their wisdom, expertise and
guidance in my research endeavors. I thank you all for your extensive knowledge which
has provided portions to my project over the years. All of you have offered a unique
perspective which inspires me to think bigger than I ever thought I could.
I would like to thank the PACU staff at Barnes-Jewish Hospital. Also, the
leadership team who assisted: Tim, Amy, Joel, Janelle, Sandy, Mary, Kim, Wendy &
Kristen, my family away from home who carried me through the years of data collection.
Most of all, this work is dedicated to my family for their love, support and
encouragement. This is for my husband, Bob, who gently reminded me of the end-goal
when I felt it was out of reach. He held my faith when I couldn’t see the reason. Also, I
am grateful for my daughter, Jennifer, and son-in-law, Brad, for their hours of proof
reading and corrections they provided me with. How could I fail with their collective
genius tirelessly carrying me to success?
I would also acknowledge my son, Brian, although miles in distance from home,
he was always close with words of encouragement and positivity. My son has an art of
seeing greatness in people when they cannot see it in themselves, even his mother. Also, I
owe a special thanks to my loving family, mom-in-law-Jan and dad-in-law-Ken, Mark,
Mike, Kelly, Dylan, Zach, Bode and my mother, all of whom believed in me even when I
was missing from family events. As a total, my family encouraged me through this
endeavor and carried me through the high and lows. I am eternally grateful.

CARBON DIOXIDE MONITORING IN RECOVERY 8
ABSTRACT
Respiratory depression is a serious complication after surgery. Early detection is a
major patient safety concern for recovery room personnel as patients recover from
anesthesia and experience pain. The opioids used for pain management may contribute to
over-sedation effects and respiratory depression. Vital signs and pulse oximetry are
standard postoperative monitoring procedures. End-tidal capnography and arterial blood
gases may augment the standard-of-care procedures but may not be effective at detecting
early respiratory depression. The purpose of this study was to generate baseline data
trending patient safety variables and outcomes for postoperative patients using standard
monitoring with standard-of-care plus transcutaneous capnography monitoring for CO2
levels.
This study was guided by a retrospective, time series design with two study
groups. A convenience sample of 800 patients from a large Midwestern hospital was
assigned to postoperative recovery rooms equipped with standard monitoring (control
group) or standard monitoring plus transcutaneous capnography (treatment group). The
time series component refers to dependent measures collected at three points in time:
admission to the recovery room and 30- and 60-minutes after admission. Dependent
measures included respiratory rate, blood pressure, heart rate, oxygen saturation, pain
score, Aldrete score, and opioid doses. Measures and time were treated as within subject
factors.
Data were analyzed by: group (treatment vs control), dependent measures, and
time using multivariate analysis of variance. Aldrete score and opioid doses were treated

CARBON DIOXIDE MONITORING IN RECOVERY 9
as within-subject factors. Recovery time was assessed using an independent samples t-
test. Trends in variables over time showed significant differences by groups.
The transcutaneous capnography treatment group showed a shorter length of stay
in the recovery room and overall reduction in opioid administration compared to the
control group. Pain scores worsened for the treatment group over time. The
transcutaneous capnography may improve management of opioids and patients’ level of
consciousness but may have inadvertently heightened patients’ awareness of pain.
Transcutaneous monitoring of recovery room patients may be beneficial in avoiding
respiratory depression and improving patient safety and it has long-term implications for
health care costs.

CARBON DIOXIDE MONITORING IN RECOVERY 10
CHAPTER 1:
INTRODUCTION TO THE STUDY
Postoperative opioid administration is common in the recovery room and is a
recognized cause of respiratory depression (McCarter, Shaik, Scarfo, & Thompson,
2008). Life threatening respiratory depression is the most severe opioid adverse
consequence (McCarter et al., 2008). Recovery room nurses are in charge of managing
pain control for postoperative patients. A main goal of managing pain is to find a balance
between pain control and the potential effects of over sedation.
Opioid administration is particularly challenging during the immediate
postoperative period when patients are experiencing pain as well as the adverse effects
from general anesthetics and intraoperative medications. If pain management is too
aggressive it can result in a respiratory compromise that requires additional treatment to
manage the patients’ status and an increased length in hospital stay (McCarter et al.,
2008).
The immediate postoperative period is the time of greatest risk for respiratory
depression due to the mix of anesthetic drugs, muscle relaxants and narcotics affecting
the respiratory rate of patients (Taylor, Kirton, Staff, & Kozol, 2005). There is an
appreciation to optimize pain control after surgery to enhance patient comfort and
expedite recovery. An understanding of the determinants of postoperative pain and
knowledge of how pain and analgesic requirements relate to recovery time is needed by
nursing staff (Pavlin, Chen, Penaloza, Polissar, & Buckley, 2002).
There is a small margin of safety on the impact of ventilation when administering
sedatives after surgery (Sheahan & Mathews, 2014). Any unanticipated treatment can not

CARBON DIOXIDE MONITORING IN RECOVERY 11
only lengthen the amount of time a patient may require in the recovery room to stabilize
but may also increase the level of care needed within the hospital, such as admission to
an observation unit or intensive care unit (Rose, 1996). Monitoring of oxygenation and
ventilation through pulse oximetry and capnography (measurement of carbon dioxide),
especially if a patient is ventilated or is in a drug-induced hypoventilation, can alert to
impending respiratory compromise (Vimlate, Gilsanz, & Goldik, 2009).
Capnography is the standard of care in some institutions in monitoring of
general anesthetic procedures. The use of capnography in the operating room
environment has been credited with the overall drop in mortality associated with general
anesthesia from 1 in 10,000 cases to virtually undetectable levels (Koniaris, Wilson,
Durgas, & Simmons, 2003). Currently, the use of capnography in the recovery room is
not the standard practice.
Problem Statement
There are over 73 million surgeries performed annually in the United States
(D’Arcy, 2010) that not only contribute to improved health but also increase the risk of
morbidity and mortality. Pulmonary complications following the use of general
anesthesia that accompanies major surgery are a recognized problem in the perioperative
environment, with respiratory depression being the second most common cause of
preventable postoperative deaths (Kasuya, Akca, Sessler, & Komatsu, 2009).
Hypoventilation leading to hypoxia, hypercarbia, and respiratory acidosis is a central
effect of general anesthesia and is also commonly associated with opioid usage (Kopka,
Wallace, Reilly, & Binning, 2007).

CARBON DIOXIDE MONITORING IN RECOVERY 12
Opioids are used extensively for pain management during the perianesthesia
period and have the potential to contribute to respiratory depression (McCarter et al.,
2008). Unfortunately, pain management can lead to overtreatment. In some instances,
critical events such as respiratory depression and the need for reintubation may occur.
The causes of respiratory depression from opioids are not limited to prescription and
administration (Gordon & Pellino, 2005). Some patients, despite proper administration of
appropriate orders, develop significant respiratory depression. Other medical issues may
be associated with respiratory depression postoperatively such as a history of sleep apnea,
chronic obstructive pulmonary disease, metabolic disturbances, and increased age
(Gordon & Pellino, 2005).
Unfortunately, it can be challenging to know which patients will have respiratory
complications because many factors are associated with respiratory depression, such as
age, type of anesthesia, and use of opioids (Kasuya et al., 2009). A high level of carbon
dioxide (CO2) is a sign of respiratory depression. Early idendification of reduced
ventilation can lead to the prevention of hypoxia, an unusually low concentration of
oxygen in the blood. A result of reduced ventilation is a decreased PaO2 and an increase
in PaCO2 which can cause hypercapnia, increased carbon dioxide (Drysdale, 2014).
Research has found the use of capnometry as an early signal or respiratory failure is
essential (Stein, Matz, Schneeweib, Eckmann, Roth-Isigkeit, Huppe, & Gehring, 2006).
Standard monitoring for recovery room patients includes vital signs and pulse
oximetry, but does not routinely include the measurement of capnography. If there are
respiratory concerns, physicians may order end-tidal capnography which is the most
common method for continuous estimation of CO2 expired gases. This capnography

CARBON DIOXIDE MONITORING IN RECOVERY 13
method assesses ventilation via a nasal-oral cannula the patient wears (Bendjelid, Schutz,
Stotz, Gerard, Suter, & Romand, 2005; Tobias & Meyer, 1997).
Measurements of arterial blood gases (PaCO2) are occasionally obtained for
patients with an invasive arterial line. Arterial blood gas analysis (ABG) is considered
the gold standard for the measurement of arterial CO2. It is the most accurate method
available as it uses a sample of blood to test (Drysdale, 2014). Blood samples are
withdrawn from either a single arterial stick or an arterial line (Huttman, Windisch, &
Storre, 2014). Blood tests require a wait time for results to be reported and can be painful
for the patient. Drawing the ABG can be time consuming and requires specially-trained
staff (Beyan, Cirak, Varol, & Ucar, 2015). It is not a continuous reading but offers a
reflection of the blood levels at the time of being drawn (Drysdale, 2014). The correlation
between ABGs and transcutaneous capnography was found to be excellent in providing
adequate trending (Coates, Chaize, Goodman, & Rozenfeld, 2014).
Pulse oximetry is commonly used to monitor postoperative patients for
hypoxemia but does not provide early detection of hypoventilation, apnea or airway
obstruction (Waugh, Epps, & Khodneva, 2010). Oximetry cannot detect hypercarbia
which displays the adequacy of ventilation (Drysdale, 2014). Capnometry is a useful
monitoring parameter for early recognition of respiratory depression during post-
anesthesia care. Although postoperative patients are usually monitored by pulse oximetry,
many research articles support using capnography as a reliable warning for respiratory
depression compared to pulse oximetry. McCarter et al. (2008) reported that pulse
oximetry identified only 33% of patients with respiratory issues, where monitoring with
capnography identified 100% of patients.

CARBON DIOXIDE MONITORING IN RECOVERY 14
In the perioperative environment, it is advantageous to identifying patients who
may suffer from respiratory depression, and have a subsequent need for naloxone to be
administered to reverse the effects of the opioids. Trends in CO2 may have an impact on
dose administration of opioids, potential reduction in reversals with naloxone, and a
decline in the number of intubations postoperatively.
Performing a retrospective quasi-experimental study in the recovery room
environment may offer insight into providing safer postoperative management of surgery
patients. A comparison of data trends in patients was made of those who received
standard monitoring postoperatively (respiratory rate, oxygen saturations, etc.) to the
patients who had the additional assessment through trends of transcutaneous CO2
monitoring. Assessing these data comparisons may provide cues for respiratory
depression.
Identification of factors that may predict critical events within the postoperative
patient is imperative to the initiation of safer healthcare practices. Respiratory depression
is one of these life-threatening events. The complications patients can incur from
respiratory compromise can be catastrophic to their health and safety. Preventative
strategies to avoid respiratory problems include early identification of the patients at high
risk, avoidance of long-lasting anesthetic drugs which depress the level of consciousness,
safe pain management and close monitoring (Rose, 1996).
An opportunity exists to review the current assessment components obtained in
postoperative patients, incorporate the additional monitoring of transcutaneous CO2
monitoring, and trend the patient’s data and outcomes. Analysis of the data trends may
offer insight into the development of safety and quality improvement protocols. The

CARBON DIOXIDE MONITORING IN RECOVERY 15
ability to recognize which patients may have an untoward event through early recognition
of symptoms would be valuable in individualizing the care provided.
Purpose of Research
The purpose of this retrospective quasi-experimental research design study was to
generate baseline data to trend postoperative patient safety variables and outcomes.
Transcutaneous CO2 levels were assessed for the effects of transcutaneous capnography
monitoring on detection of carbon dioxide levels in recovery room patients compared
with standard of care.
This study had two objectives. One objective was to compare patients on
transcutaneous capnography with patients who received standard postsurgical monitoring
to determine if there was a difference in postoperative safety variable trends and
outcomes. The second objective of the study was to compare postoperative complications
of patients monitored with transcutaneous capnography with patients receiving standard
monitoring.
Transcutaneous capnography monitoring offers continuous information, making it
possible for the nurse to detect and follow trends (Torok, Leuppi, Baty, Tamm, &
Chhajed, 2008). The early identification of hypoxemic patients can lead to early
intervention, not by re-intubation and initiation of mechanical ventilation, but by the
timeliness of less invasive interventions such as increased incentive spirometer use and
turn-cough-breathe techniques. One potential benefit of utilizing transcutaneous
capnography with its continuous trends is that it may give nurses increased confidence in
successfully monitoring for respiratory distress while increasing or decreasing opioid
usage when needed. Although not a focus of this research the potential increased self-

CARBON DIOXIDE MONITORING IN RECOVERY 16
confidence and effectiveness in management could lead to improved patient outcomes,
increased job satisfaction of staff and decreased turnover of nurses.
For this proposal, complications are defined as any additional respiratory
intervention required within the recovery room such as naloxone administration,
increased in the length of recovery stay, reintubation or transfer to higher level of care.
The transcutaneous method provides a constant, real-time measurement and is not
affected by ventilation/perfusion abnormalities, as may be the case with the end-tidal
method (Kirk, Batuyong, & Bohn, 2006). Abnormal levels of capnography can signal
staff to reassess patients, prepare to provide potential airway support, and even avoid
administering extra amounts of sedative until concerns are resolved (Green & Pershad,
2010).
Research Questions
In this retrospective quasi-experimental study, routine demographics such as age,
sex, height, weight, body mass index (BMI), and the American Society of
Anesthesiologists (ASA) Physical status classification system scores were attained. The
following data points were also obtained for trends: pulse oximeter (SaO2), mean levels
of noninvasive arterial blood pressure measurements, respiratory rate, heart rate, level of
consciousness (LOC), pain scores, Aldrete scores and capnography (end-tidal and
transcutaneous). Opioids by dose amount and time administered were captured. The
research questions investigated are below.
Research Question 1: Are there postoperative differences in trends of safety
variables for patients who were monitored with transcutaneous capnography
compared to those who received standard monitoring?

CARBON DIOXIDE MONITORING IN RECOVERY 17
Research Question 2: How do patient complication trends relate to the
capnography trends and other safety variable trends in recovery room patients?
Significance
Surgery is an area of high impact and high potential harm to patients. Aside from
its inherent risks such as surgical site infections and deep vein thrombosis, the
perioperative environment is complex, involving multiple teams of caregivers and
transitions of care. The first 24 hours after surgery represents a high-risk period for a
respiratory event caused by narcotic use. Standards could be developed to increase safety
on the first postoperative day through identification of patients who are high-risk for
respiratory depression (Taylor et al., 2005).
Many sedation-related respiratory issues begin first with irregularities in
ventilation that can be seen in capnography trends. Oxygen saturation is often the last
sign of the respiratory issue, particularly when supplemental oxygen has been
administered (Green & Pershad, 2010). Capnography levels are not affected by
supplemental oxygen which many post-surgical patients have administered as needed
(Drysdale, 2014).
The addition of capnography in the operating room environment is credited with
an overall drop in mortality associated with general anesthesia from 1 in 10,000 cases to
virtually undetectable levels (Fecho, Joyner, & Pfeiffer, 2008). Unfortunately, the use of
capnography in the recovery room is not standard practice. The standard for a
postsurgical recovery room patient is the assessment of vital signs and pulse oximetry
(SaO2). Respiratory rates may be influenced by various factors such as patient age,

CARBON DIOXIDE MONITORING IN RECOVERY 18
weight, impaired gas exchange and sedation levels (Fu, Downs, Schweiger, Miguel, &
Smith, 2004), and the diagnostic value of pulse oximetry is limited (Kopka et al., 2007).
Assessing oxygen saturation using pulse oximetry is an important late indicator of
ventilatory status. Whereas carbon dioxide (CO2) is a better measure of determining
ventilatory standing and provides an earlier notice of impending respiratory depression
(Kopka et al., 2007).
Early identification of hypoxemic patients with respiratory compromise could a)
lead to early interventions by clinicians, b) reduce the need for re-intubation, and c)
reduce direct costs from additional procedures and extended hospitalizations (Young,
2006). There have been no large scale studies assessing the use of transcutaneous CO2
monitoring in the immediate postoperative period of the recovery room. Exploring if the
transcutaneous CO2 monitoring device is useful in detecting which patients incur a
complication and where this complication occurs during their recovery could be
extremely valuable for preventive or early intervention efforts.
Limitations
As with any research study, there were limitations. The limitations were:
1) This study was a retrospective quasi-experimental design with random
assignment to treatment. Patients were not randomized as in a controlled trial.
Patients were randomly assigned through standard room assignment. As
surgeries complete in the operating room, the operating room personnel calls
out for a recovery room assignment. Depending on open and available rooms,
a random room assignment was given. Some rooms had transcutaneous
monitoring equipment in them; others did not.

CARBON DIOXIDE MONITORING IN RECOVERY 19
2) During analysis of the data, consideration will be given to whether there was
an association between variables. None of these judgments can provide
indisputable evidence of cause and effect, but rather prompt for further
consideration to whether there were any other more likely cause and effect.
3) Trends in variables over time were taken from the electronic documentation.
Nursing and anesthesiology have an opportunity to capture documentation in a
thorough and timely manner. Electronic data is confirmed for accuracy when
the nurse highlights the content and signs off on the information. If nursing
staff does not agree with the information, it is left unconfirmed.
4) All missing data were inputted.
Assumptions
1) It was assumed that the patients participating in the study would be
representative of the recovery room population. The random selection of the
participants should represent the entire populace.
2) The four hundred patients who were randomly assigned to rooms with the
transcutaneous monitoring were compared to 400 patients who were randomly
assigned to rooms without transcutaneous monitoring within the same time
frame.
Summary
This chapter provided an introduction to the research project, including an
overview of the topic postoperative respiratory depression. The purpose of the study and
significance of the issue regarding potential respiratory complications post operatively

CARBON DIOXIDE MONITORING IN RECOVERY 20
and the management of the patients in the recovery room was reviewed. The research
questions and aims were discussed as well as key definitions.

CARBON DIOXIDE MONITORING IN RECOVERY 21
CHAPTER 2:
CONCEPTUAL FRAMEWORK AND LITERATURE REVIEW
This chapter is divided into two sections. First, the conceptual framework of
General Systems Theory is discussed in depth as providing a guide for this study. Second,
in the literature review the concept of patient safety in the perioperative environment and
the significance of early recognition of rising carbon dioxide levels in recovery room
patients are discussed. The historical use of transcutaneous capnography monitoring is
reviewed as well as reasons the monitor is not currently used in the recovery room
despite positive research findings.
Research Questions
Research Question 1: Are there postoperative differences in trends of safety
variables for patients who were monitored with transcutaneous capnography
compared to those who received standard monitoring?
Research Question 2: How do patient complication trends relate to the
capnography trends and other safety variable trends in recovery room patients?
Conceptual Framework
General Systems Theory
The General System Theory (GST), first proposed in 1936 by Ludwig von
Bertalanffy, emphasizes that systems interact with their environment and that there is a
association between the parts which connect the whole (Weinberg, 1975). The primary
concern is given to the interactions of all of the components within the system. The
system is defined as complex interacting elements (Von Bertalanffy, 1968). Investigating
single parts of processes cannot always provide a complete explanation of the process

CARBON DIOXIDE MONITORING IN RECOVERY 22
(Von Bertalanffy, 1972). The GST deals with the efficiency and effectiveness of systems
and their ability to produce a meaningful, useful output to surrounding supra systems
(Gray, Duhl, & Rizzo, 1969). A rudimentary concept in systems thinking is that of
hierarchical relationships between systems. A system is composed of subsystems of
lesser order and is also part of a larger system (Kast & Rosenzweig, 1972).
Systems are made up of an arrangement of subsystems, all of which are
characterized by individual patterns of interactions; both within their sub-systems and
with other parts of the system (Paton, Sengupta, & Hassan, 2005). The GST emphasizes
that systems are organized and that they are composed of interdependent components in
some relationship (Kast & Rosenzweig, 1972). Every system is made of at least two
interconnected elements. In a dynamic relationship with its environment, the system
receives various inputs, transforms these contributions in some way, and exports outputs
(Kast & Rosenzweig, 1972).
The concept of “General System” is broad and embraces dynamic interaction
between many variables. There is a defining characteristic of maintaining in a continuous
exchange of components. General Systems Theory offers several concepts that help to
explain the behavior of a hospital as it applies to both material and mental phenomena
(Von Bertalanffy, 1968).
A hospital is a system with inputs, processes, and outputs. It is by itself a
component of a larger system, the health care system (Weinberg, 1975). The diagram of
GST, as seen in Figure 1, can be used to understand health care structures, processes,
outcomes and their interactions within a health care system as feedback loops are
incorporated to assess the effects of interventions (Weinberg, 1975).

CARBON DIOXIDE MONITORING IN RECOVERY 23
Figure 1. General Systems Theory Framework
Concepts of General System Theory
The important concepts of general systems theory are well-defined and used by
multiple organizations. The purpose of this section is to provide a brief review of those
characteristics which seem to have widespread acceptance. Also, an explanation of how
this theory applies to the patient, their hospital stay, potential safety implications and the
importance of having a feedback loop.
Inputs include raw material, energy, and resources needed to produce the output.
Input comes from the environment and converts into energy. On a small scale, the input
may be the nurses’ or physicians giving their energy, care and time devoted to thinking,
planning, diagnosis, and decision-making. The multidisciplinary team within the hospital
demonstrates daily their plan of patient care, discuss resources needed and deliver
concrete decisions for the patient’s care. On a larger scale, examples of input could

CARBON DIOXIDE MONITORING IN RECOVERY 24
include the hospital environment itself. Each hospital is a part of a larger system of
hospital institutions collaborating in providing congruent processes to better the health
care delivered. Patients are impacted by the hospital setting in a variety of manners.
Critical care nurses are trained to rapidly recover a patient from anesthesia
postoperatively. Nurses with experience can not only recover the patient but anticipate
potential problems which may arise and intervene prior to their development.
The elements or components are the parts that make up the system. Elements are a
broad category and may include people, equipment, and supplies (Weinberg, 1975).
Individuals in a hospital environment are inclusive of patients, families and all personnel.
Equipment and supplies used on a daily basis is an enormous amount. The General
Systems Theory takes into account every components impact on the outcome. Monitoring
patients after surgery can include many specialty equipment and supplies unique to the
recovering patients. Guidelines have been established as to what minimal requirements in
monitoring are required. The measurement of capnography has not been defined as a
minimal requirement by the recovery room association.
Internal factors may include the skill of the personnel caring for patients. As the
patients and conditions treated within hospitals changes, so will the skills needed by staff.
Although all subsystems within a hospital are significant, improving the clinical
performance of staff is central to the hospital’s role. The challenge is to evaluate the
quality of care provided and to change clinical practice to make it better (McKee &
Healy, 2002). Although patients can usually have input into who their surgeon will be,
they do not have the ability to select the team that supports the surgeon. The skill level of
CARBON DIOXIDE MONITORING IN RECOVERY 25
residents, interns, and even nurses, can potentially be an internal factor affecting the
outcome of their stay.
External factors can be associated with the patient or the hospital. Examples of
external sources which may place influence on the patient are the population served,
patterns in diseases, and public expectations. The hospitals and hospital systems can have
many structural and cultural external factors impacting function. Hospitals configurations
can reflect the practice of health care and can range from rooms with too few sockets for
increasing electronic monitors or too few operating rooms to accommodate the rise in
surgeries (McKee & Healy., 2002). Also, hospitals are inhabited by a large group of
multidiscipline personnel who require consideration in how they develop working
relationships. In the hospital setting, recovery room patients are monitored with
specialized equipment and multidisciplinary teams. The fast pace, multicultural arena can
be overwhelming to the patient experience.
The Output is the outcome or the product result. Examples are potentially having
improved health and decision outcomes. The development of any strategy aimed at a
patient or organizational improvement requires an assessment of the present situation.
After critical variables and factors that affect health and well-being about the
organization are identified, data can be gathered and analyzed (Paton et al., 2005). It’s
important to be extremely attentive and examine the systems at the level of the person,
the group, the organization, the society, and the larger system (Duncan, 1972). The output
for patients postoperatively would ideally be to have no complications from their
procedure. Several complications routinely occur after surgery and are managed in the
recovery room. Pain, nausea and fluid resuscitation are common issues requiring

CARBON DIOXIDE MONITORING IN RECOVERY 26
proactive interventions to allow for the best outcomes. The output is monitored by the
“feedback loop” which senses a response and the subsequent action of the system (Von
Bertalanffy, 1968). Reassessment of interventions occurs based on the feedback.
Feedback is information about some aspect of data or energy processing that can
be used to evaluate, monitor the system and to guide it to more operative performance
(Weinberg, 1975). The concept of feedback is important to understanding how a system
maintains a steady state. Information concerning outputs or processes of the system is fed
back as an input into the system. Feedback can be positive or negative (Kast &
Rosenzweig, 1972). Analyzing feedback allows for ongoing or alternate treatment
depending on whether the outcome is positive or negative. The internal factors associated
with the skill of personnel caring for the patient is the nurse’s ability to, not just
recognize, but anticipate potential postoperative issues. The experience and expertise of
the staff can impact this early recognition. Many variables can impact the patient
outcome after surgery. Monitoring capnography trends can provide an additional
measurement of assessment. If a patient’s respiratory status is noted to be compromised
through the feedback of trending, staff could intervene early by lowering opioid doses if
applicable to prevent further sedation.
Monitoring of postoperative patient safety variables for changes and intervening
when appropriate in the feedback loop is similar to the GST ongoing model. Immediate
and ongoing trends of capnography provide real-time opportunity for information
regarding the patient’s respiratory status. Identifying and understanding the components
of which safety variables in the recovery room have a significant impact can potentially
offer an opportunity to improve patient outcomes with early interventions.

CARBON DIOXIDE MONITORING IN RECOVERY 27
Review of Literature
Overview of Patient Safety
Healthcare professionals have known about potential safety issues which impact
patients in our healthcare system, but these concerns only recently moved to the focus of
national healthcare agendas. It took several initiatives in the last decade to bring
healthcare issues to the forefront. The Institute of Medicine’s (IOM’s) landmark, 1999
report To Err is Human: Building a Safer Health System caused headlines across the
world and created much of the momentum for the patient safety movement of today
(Clancy, Farqubar, & Sharp, 2005). The Institute of Medicine estimated in the report that
as many as 44,000 to 98,000 people die in the U.S. hospitals yearly due to lapses in
patient safety (Brief report, 1999). The magnitude of healthcare safety concerns was
identified as one way organizations might change to improve the care they provide. Each
institute can vary in the development of programs their establishment may initiate to
address their specific issues (Frankel, Gandhi, & Bates, 2003).
The National Healthcare Quality Report (NHQR) has tracked a growing number
of patient safety measures. In 2011, the NHQR identified measurements to keep patients
from being hurt or becoming more ill. Postoperative respiratory failure is one of the
measures noted by this organization as requiring attention. Respiratory failure was
recognized as being not uncommon after surgery and that reintubation or prolonged
mechanical ventilation may be required. The NHQR identified over sedation as a
potential contributing source, and closer attention to risk factors may reduce rates
(Agency for Healthcare Research and Quality [AHRQ], 2014). Identifying and treating

CARBON DIOXIDE MONITORING IN RECOVERY 28
potential complications when recognized may prevent progression of issues in the
patients’ medical management.
In 2001, the development of nationwide pain assessment and management
standards employed by The Joint Commission had a key influence in healthcare. The
standards require hospitals to be familiar with the right of patients to have an accurate
pain assessment and management of their symptoms. The call to improve pain
management also led to some over treatment and increases in the incidence of reported
critical events. The Institute for Safe Medication Practices (ISMP) noticed being more
attentive to the management of pain caused a rise in events of over-sedation and
respiratory depression. Between January 1995 and June 2006, there were 369 sentinel
events in the Joint Commission database from medication errors and 20% involved
opioids. This category is the largest number of sentinel events. Almost all (e.g., 98%) of
these events resulted in death (Gordon, Rees, McCausland, Pellino, Sanford-Ring, Smith-
Helmenstine, & Danis, 2008).
Aligning with TJC, AHRQ has been funding research on patient safety and
ensuring to support the application to daily patient care. The defining mission statement
of the AHRQ is “to improve the quality, safety, efficiency, and effectiveness of health
care for all Americans” (AHRQ version 3, 2006). Patient safety goals established by
AHRQ promote specific improvements using Patient Safety Indicators (PSIs) as a guide
for identifying the incidence of adverse events following surgeries, procedures, and
childbirth. The U.S. Congress has supported AHRQ patient safety efforts by
appropriating $165 million for their research in the PSI. Also, Congress appropriated

CARBON DIOXIDE MONITORING IN RECOVERY 29
$139 million for AHRQ’s new health information technology initiative to improve safety
(Clancy et al., 2005).
Perioperative Patient Safety
Perioperative services is a very complex environment. Patients are provided care
in the preoperative screening division, same day surgery, preoperative holding areas,
operating rooms and post anesthesia care units. The care provided is given by many
teams, is fast paced, involves new technologies and ultimately causes the need for several
handoffs (Eckstrand, Habib, Williamson, Horvath, Gattis, Cozart, & Ferranti, 2009). This
combined environmental characteristic creates a risk for potential harm.
The American Society of Perianesthesia Nurses (ASPAN) is a nursing
organization which endorses a safe environment for perianesthesia practice. ASPAN
guidelines focus on the immediate postoperative course of the patient and emphasize
potential concerns which may impact immediate recovery. The guidelines provide
direction in the management of patient care as they emerge from anesthesia and are
updated every two years.
Common safety concerns include hemodynamic, respiratory, renal, and
neurological complications (Barash, Cullen, & Stoelting, 2006). Patients must be
observed continuously for changes in their status which may indicate potential unsafe
situations. There are many postoperative perioperative safety variables monitored.
Through close monitoring, the clinician hopes to identify issues quickly to intervene
earlier reducing the likelihood of critical events (American Society of Anesthesiologist
Task Force on Sedation and Analgesia by Non-Anesthesiologist, 2002). Respiratory
monitoring is a serious aspect in assuring quality care and clinical observation alone has

CARBON DIOXIDE MONITORING IN RECOVERY 30
been proven to be undependable in evaluating respiratory status (Sheahan & Mathews,
2014). Complementary detection methods are always considered desirable.
The American Society of Anesthesiologists (ASA) stresses that observing
oxygenation by pulse oximetry is not a replacement for assessing ventilation capabilities
through measuring capnography. Normal oxygen saturation can be maintained even with
a low respiratory rate. The pulse oximetry may not detect patient deterioration especially
if they are on supplemental oxygen immediately following surgery (ASA Task Force on
Sedation and Analgesia by Non-Anesthesiologist, 2002). The ASA developed practice
guidelines for post-anesthetic care and summarized their recommendations for assessing
and monitoring. The ASA use a classification of physical status for comparison of
statistical information on patients (Wolters, Wolf, Stutzer, & Schroder, 1996). The ASA
physical status classification is used to strengthen the assessment of perioperative risk
factors and, hopefully, better predict postoperative outcomes.
Monitoring respiratory status postoperatively include lung sounds, work of
breathing, SpO2, respiratory rate, and breathing pattern. Effective patient respiratory
effort can be assessed by visualization of chest expansion, the rate and depth of their
breathing, monitoring the use of accessory muscles, and the number and quality of breath
sounds (Coates et al., 2014). These are subjective findings and can be misleading.
Potential renal complications are assessed through the measuring of intake and hourly
urine output. Neurological status is measured by the patient’s mental status, level of
consciousness (LOC), and whether they are delayed in waking up (Vimlati et al., 2009).
CARBON DIOXIDE MONITORING IN RECOVERY 31
Perioperative Safety Variables
The recovery room uses a scoring system known as the Modified Aldrete for
assessing the patient’s progress in recovery and assists in establishing stability for
discharge see Table 2. This assessment specifically evaluates the level of return to the
patient’s baseline before surgery for activity, respiration, circulation, consciousness, and
O2 saturation. The system is designed to assess the patient’s transition from the
discontinuation of anesthesia until a return of protective reflexes and motor function
(Ead, 2006). Scoring is performed upon arrival to the recovery room and every thirty
minutes until the patient is fully recovered with a score minimum of 8 to 10 needed for
discharge. Aldrete uses a rating scale of zero to two to score each of the five categories:
activity, respiration, circulation, consciousness, and oxygen saturation. A score of two in
each category is considered best in all areas.
ASPAN guidelines have established discharge criteria to utilize in the evaluation
of patients. Discharge criteria include assessment and stabilization of the Aldrete
components, as well as the stabilization of the patient reports of pain and nausea. The
ASPAN Pain and Comfort Clinical Guidelines (released 2003) were developed to provide
direction for assessment, interventions, and expected outcomes for the preoperative and
postoperative phases of treatment. Patient discomfort should be managed and reduced to
a score of less than five on a scale of 1 to 10 before discharge. Symptoms of nausea
should be treated for resolution as much as possible.

CARBON DIOXIDE MONITORING IN RECOVERY 32
Table 1
Modified Aldrete Recovery Score
_______________________________________________________________________
Variable Description Score
________________________________________________________________________
Activity Able to move four extremities on command 2
Able to move two extremities on command 1
Able to move no extremities on command 0
Breathing Able to breathe deeply and cough deeply 2
Dyspnea 1
Apnea 0
Circulation Systemic blood pressure =20%of the preanesthestic level 2
Systemic blood pressure is 20%-49% of the preanesthetic level 1
Systemic blood pressure is =50% of the preanesthetic level 0
Consciousness Fully awake 2
Arousable 1
Not responding 0
Oxygen >92% while breathing room air 2
Saturation Needs supplemental oxygen to maintain saturation >90% 1
(pulse oximetry) <90% even with supplemental oxygen 0
________________________________________________________________________
The depth of sedation can vary after a patient’s procedure and requires an ongoing
assessment and documentation (Sheahan & Mathews, 2014). Although several sedation
assessment methods are used in clinical practice, the Ramsay Sedation scale (RASS) is
primarily used in recovery to assess the depth of sedation (Table 2).
Table 2
Richmond Agitation-Sedation Scale Score
______________________________________________________________________
Score Descriptor Characteristics
_______________________________________________________________________
+4 Combative Combative, violent, immediate danger to staff
+3 Very Agitated Pulls or removes tube(s), or catheter(s); aggressive
+2 Agitated Frequent nonpurposeful movement, fights ventilator
+1 Restless Anxious, apprehensive but movements not aggressive or
vigorous
0 Alerts and Calm

CARBON DIOXIDE MONITORING IN RECOVERY 33
-1 Drowsy Not fully alert, sustained awakening to voice (eye opening
and contact >10 seconds)
-2 Light Sedation Briefly awakens to voice (eye opening and contact <10
seconds)
-3 Moderate Sedation Movement/eyes open to voice but no contact
-4 Deep Sedation No response to voice; has movement/eye opening to
physical stimulation
-5 Unarousable No response to voice or physical stimulation
________________________________________________________________________
For this proposal, the safety variables observed for trends were respiratory status,
neurological changes, circulatory status, pain levels, and hemodynamic status. These
variables were monitored through respiratory rate, mean blood pressure, heart rate,
oxygen saturation, capnography levels, pain scores, Aldrete scores and RASS scores. The
ideal direction variables should take postoperatively is a respiratory rate maintaining
between twelve and twenty, a mean blood pressure < 80, a heart rate <80, an oxygen
saturation increasing > 92%, a pain score decreasing < 5, an Aldrete score increasing to
9-10, and a RASS score increasing to 0. Opioid doses, both individual and total, were
also collected in data trends.
Increased Monitoring of Safety Variables through Capnography
Capnography is a graphic display of carbon dioxide (CO2) concentration during
the respiratory cycle. Capnometry is a monitor display in number value of CO2
concentrations during the breathing. This direct technique displays a continuous level of
CO2 eliminated by the lungs, and also reflects the amount of CO2 produced by tissues and
transported to the lungs (Todorova, 2008). Capnography is accurate and non-invasive.
The number of arterial blood samplings can be drastically reduced when patients are
monitored with capnography. Although John Scott Haldane is credited with developing
the first practical means of measuring carbon dioxide in a mixture of gasses in 1905, the

CARBON DIOXIDE MONITORING IN RECOVERY 34
fundamentals of capnography were established by Karl Friedrich Luft in 1937 when he
discovered that carbon dioxide could absorb infrared radiation (Westhorpe & Ball, 2010).
Clinical capnography was introduced into the United States in 1978 and has been in
routine use in operating rooms since 1988. The use of capnography has expanded over
the years to be used in a variety of acute care settings.
Safety indications for use the of capnography monitoring include utilization to
confirm and continuously monitor endotracheal tube placement. Subtle changes in trends
can alert for impending problems. In settings where patients are breathing spontaneously
through their airways, capnography use has been mainly advocated for early detection of
respiratory depression and apnea (Fanelli, Baciarello, Squicciarini, Malagutti, Zasa &
Casati, 2008). Besides monitoring lung ventilation, capnography delivers data about
circulation and metabolism, can help in the analysis of low cardiac output conditions, and
in identify pulmonary embolisms (Whitaker, 2011).
The use of capnography during clinical events such as cardiac or respiratory arrest
can be helpful. Capnography provides continuous, real-time information concerning the
efficiency of resuscitative efforts (Jaffe, 2002). Capnography trends, side-stream, end-
tidal, or transcutaneous, has become the standard of care in many hospitals for
monitoring patients who receive general anesthesia during their surgery and has been
used to successfully detect a patient’s declining respiratory status (Koniaris et al., 2003).
Transcutaneous Capnography as Related to Patient Safety
Previously, the use of capnography meant the patient had to be intubated and in
the intensive care unit. With the development in monitoring, side-stream capnography
proved to be reliable for use on intubated and non-intubated patients (McCarter et al.,

CARBON DIOXIDE MONITORING IN RECOVERY 35
2008). Side-stream devices take a continuous sample of gas from the breathing circuit
through a six to eight-foot long small bore tube. The sample is delivered through a water
trap. After drying in the tube, the sample cell is analyzed. There can be a delay for several
seconds, and also a distorted rise time, due to the use of a remote location (Jaffe, 2002).
The response time delay can be considered substantial as clinicians need the earliest
warning as possible to any potential respiratory concern.
Less utilized, the measurement of carbon dioxide using transcutaneous
capnography on skin surfaces was first defined in 1960 by Severinghaus with an
unheated electrode. A linear relationship between skin surface PCO2 and blood level
PCO2 was noted (Eberhard, 2007). A few years later, a heated sensor was utilized by
Eberhard (2007) and proved to be a scientific breakthrough, allowing continuous
measurement of CO2 for prolonged time periods. When placed on the skin, the heated
sensor dilates the capillaries underneath. The dilatation increases the gas diffusion
through the skin allowing 20 times greater diffusion of both carbon dioxide and oxygen
to the sensor (Eberhard, 2007). At the sensor, there is a gas permeable membrane (Beyan
et al., 2015). The signal is converted by the monitor and displayed as a CO2 value (Lim &
Kelly, 2010).
Even though the heated electrode transcutaneous method was patented in 1971,
the first commercially available transcutaneous sensors were not introduced until 1980.
The term cutaneous was used to describe the technique of analyzing the concentration of
gas diffusing through the cutaneous tissue at the skin surface. The word cutaneous is still
used. Most publications have utilized the word transcutaneous making it the most
commonly used of the two (Eberhard, 2007).

CARBON DIOXIDE MONITORING IN RECOVERY 36
Transcutaneous carbon dioxide (TrCO2) measurement has become a unique way
of monitoring respiratory function noninvasively. Based on the use of a temperature-
controlled Stow-Severinghaus pH-sensitive glass electrode, this device has shown good
correlation to PaCO2 values in a wide variety of patients (Fanelli et al., 2008).
Transcutaneous monitoring is noninvasive and relies on high-resolution CO2
measurement which is applied through the heated sensors placed locally on the skin
(Beyan et al., 2015). Transcutaneous monitoring of CO2 at the skin eliminates the
influence of ventilation/perfusion abnormalities present in diseased lungs (Berkenbosch,
Lam, Burd, & Tobias, 2001; Oshibuchi, Cho, Hara, Tomiyasu, Makita, & Sumikawa,
2003; Xue, Wu, Jin, Yu, & Zheng, 2010).
Current Research
Over the years, multiple studies with small sample sizes comparing the two
methods of noninvasive CO2 monitoring have been performed by a variety of researchers
as seen in Table 3.
Table 3
Summary of Transcutaneous Capnography Research
_________________________________________________________________
Author Sample Size & Purpose Results
__________________________________________________________________ Barker, Tremper,
& Gamel (1986)
N=55
Correlation of
accuracy
Comparison of transcutaneous PCO2 and
pulse oximetry in the operating room found
both are useful noninvasive monitoring
devices which measure different variables
Reid, Marineau,
Miller, Hull, Baines,
N=22
Randomized,
prospective trial
Comparison of transcutaneous, end-tidal
and arterial measurements of carbon
dioxide during general anesthesia
established transcutaneous measurements

CARBON DIOXIDE MONITORING IN RECOVERY 37
& Sullivan (1992) to be more precise than end-tidal in
comparing to actual arterial blood level CO2
Tobias et al. (1997) N=25
Prospective
comparison of two
noninvasive
measures of
capnography
monitoring
Transcutaneous monitoring found to be
more accurate in estimation of carbon
dioxide levels compared to end-tidal
capnography results in toddlers & infants
during respiratory failure
Tobias, Wilson, &
Meyer (1999)
N=33
Prospective study
investigating the
efficacy and
accuracy of
transcutaneous
monitoring
Transcutaneous monitoring found to be an
accurate assessment of arterial carbon
dioxide in infants and children after
cardiothoracic surgery
Berkenbosch
et al.(2001)
N=25
Prospective
comparison of two
noninvasive
measures of
capnography
monitoring
Transcutaneous monitoring found to
provide more accurate assessment of
carbon dioxide compared to end-tidal
capnography in older children during
mechanical ventilation
Griffin, Terry,
Burton, Ray, Keller
Landrum &Tobias
(2003)
N=30
Prospective
comparison of two
noninvasive
measures of
capnography
monitoring
Transcutaneous monitoring found to
provide more accurate assessment of
carbon dioxide compared to end-tidal
carbon dioxide measurements during
general anesthesia in severely obese adults
Oshibuchi et al. (2003) N=26
Usefulness and
accuracy of
transcutaneous
Transcutaneous monitoring found to
provide more accurate assessment of
carbon dioxide compared to end-tidal CO2
measurements in patients undergoing
thoracic anesthesia

CARBON DIOXIDE MONITORING IN RECOVERY 38
monitoring
Chhajed, Rajasekaran,
Kaegi, Chhajed, Pflimlin,
Leuppi, & Tamm (2006)
N=114
Quantify degree of
change in pulse
oximetry and
transcutaneous
capnography during
bronch
Both oximetry and cutaneous capnography
found to be useful noninvasive monitors
measuring different variables during
flexible bronchoscopy
Kirk et al.(2006) N=609
Usefulness and
accuracy of
transcutaneous
monitoring during
sleep
Transcutaneous carbon dioxide monitoring
of pediatric patients during
polysomnography found to provide
accurate and interpretable results in
children
Kopka et al.(2007) N=28
Prospective,
observational pilot
study and
comparison study of
epidural or patient
controlled infusion
analgesia
Transcutaneous capnography found to be
an easy, sensitive indicator of respiratory
depression and can have a role in safe
administration of opioid analgesia though
early recognition of increasing carbon
dioxide levels
Storre, Steurer,
Kabitz, Dreher, &
Windisch (2007)
N=10
Usefulness and
accuracy of
transcutaneous
monitoring
Transcutaneous found to be easy, sensitive
indicator of respiratory depression by
recognition of increasing carbon dioxide
levels
Fanelli et al. (2008) N=13
Accuracy of device
in estimating carbon
dioxide in recovery
room patients
Transcutaneous monitoring found to
provide accurate assessment of carbon
dioxide for monitoring spontaneously
breathing, nonintubated patients in the
early postoperative period
Torok et al. (2008) N=20
Feasibility of
Combined oximetry and capnography found
to be feasible alternative approaches to

CARBON DIOXIDE MONITORING IN RECOVERY 39
combined oximetry
and transcutaneous
capnography to
reduce the need of
arterial blood gas
sampling
reduce the number of arterial blood gas
samplings performed when assessing
patients for long term oxygen therapy
De Oliveira, Ahamad,
Fitzgerald, & McCarthy
(2010)
N=40
Comparison
between
transcutaneous and
nasal end-tidal
carbon dioxide
measurement for
detection of
hypoventilation
during deep
sedation in patients
undergoing
ambulatory
gynecological
hysteroscopy
For patients under deep sedation, non-
invasive carbon dioxide monitoring was
more sensitive and accurate for detecting
hypercarbia than standard end-tidal carbon
dioxide measurements.
Dreher, Ekkernkamp
Storre, & Kabitz (2010)
N=15
Compared
transcutaneous
capnography,
oxygen saturation,
drug dosages and
time to recovery
Transcutaneous monitoring found to
provide an accurate assessment of carbon
dioxide in patients undergoing sedation
during flexible bronchoscopy who had pre-
existing respiratory failure
Chakravarthy, Narayan,
Govindarajan, Jawali,
& Rajeev (2010)
N=32
Usefulness and
accuracy of
transcutaneous
monitoring was
compared to
arterial blood levels
Transcutaneous accurately found to be
accurate and comparable to arterial blood
levels of carbon dioxide in patients weaning
from mechanical ventilation after off-pump
coronary artery bypass graft procedures
Waugh et al. (2010) Meta-analysis of 5 A meta-analysis with pooled findings found
capnography significantly increased

CARBON DIOXIDE MONITORING IN RECOVERY 40
selected studies detection of adverse respiratory events
during procedural sedation
Xue et al. (2010) N=16
Accuracy of
transcutaneous
monitoring
Transcutaneous monitoring found to
provide accurate assessment of carbon
dioxide in patients undergoing prolonged
laparoscopic surgery
Coates et al. (2014) N=29
Convenience
sample measuring
performance of
capnometry in non-
intubated infants in
pediatric ICU.
Simultaneous ABG
drawn if arterial line
present.
Correlation of side stream CO2 with ABG
was excellent and provided adequate
trending
Transcutaneous correlated better than side
stream to ABG CO2
Beyan et al. (2015) N=30
Comparison of
partial pressure of
carbon dioxide in
arterial blood and
transcutaneous
carbon dioxide
monitorization in
patients
Transcutaneous monitoring proven useful
in patients with obstructive sleep apnea
and sleep related hypoventilation
The recent research in Table 3 primarily supported that both transcutaneous and
end-tidal capnography were found to provide an accurate assessment of carbon dioxide in
patients. Overall, even the studies utilizing the transcutaneous monitoring alone showed
this method to be a precise and easy way to trend carbon dioxide. Although both
approaches offer the ability to trend, additional studies have also demonstrated that the
transcutaneous method may be an easy, accurate measurement for early recognition of
respiratory depression (Bendjelid et al., 2005; Berkenbosch et al., 2001; Chakravarthy,

CARBON DIOXIDE MONITORING IN RECOVERY 41
Narayan, Govindarajan, Jawali, & Rajeev, 2010; Fanelli et al., 2008; Griffin et al., 2003;
Oshibuchi et al., 2003; Reid, Marineau, Miller, Hull, Baines, & Sullivan, 1992; Tobias &
Meyer, 1997).
Transcutaneous CO2 monitoring has been established through multiple studies as
a technology that provides an earlier warning sign of impending respiratory depression
than both standard monitoring and end-tidal capnography (Bendjelid et al., 2005;
Berkenbosch et al., 2001; Chakravarthy et al., 2010; Fanelli et al., 2008; Griffin et al.,
2003; Oshibuchi et al., 2003; Reid et al., 1992; Tobias & Meyer, 1997). A transcutaneous
CO2 monitoring device may provide immediate and continuous readings as opposed to
the intermittent measure of arterial blood gas PaCO2, which is considered the gold
standard for assessing CO2 levels. Further, transcutaneous CO2 isn’t compromised by
irregularities in gas exchange (Oshibuchi et al., 2003).
Even though it cannot replace the accuracy of ABG, continuous CO2
measurement provides an ongoing trend of CO2 (Huttman et al., 2014). The localized
heating from the transcutaneous electrode increases the blood circulation in the
capillaries underneath the sensor which gives a capillary CO2 which is comparable to
arterial CO2 (Huttman et al., 2014). Overall, few studies have assessed the use of
transcutaneous CO2 monitor in the recovery room environment (Fanelli et al., 2008;
Kopka et al., 2007).
Enhancing Monitoring of Postoperative Safety Variable
There are definite advantages to providing the additional assessment component
of capnography. Upon observing rising levels of CO2, clinicians are signaled to
reevaluate their patients. Proactive preparation for airway support can be provided if

CARBON DIOXIDE MONITORING IN RECOVERY 42
needed. Also, avoidance of giving additional doses of sedatives until concerns resolve
can reduce potential respiratory complications (Green & Pershad, 2010).
There are many strengths of using transcutaneous capnography in surgical
patients. Transcutaneous CO2 readings have the advantage of being easily obtained in
patients. The electrode is not easily displaced with movement, and patients do not
consider it uncomfortable nor does it disturb their sleep patterns as may be the case with
the end-tidal method. The transcutaneous method provides a constant, real-time
measurement and is not affected by ventilation/perfusion abnormalities as may be the
case with the end-tidal method (Kirk et al., 2006; Torok et al., 2008).
Transcutaneous capnography may increase nursing awareness of trends in altered
respiratory function allowing for early nursing intervention. A post-surgical patient can
demonstrate gradual increases in his sedation level, especially when receiving opioids. A
decrease in opioids provided and more frequent assessment of trends may be required
until the patient demonstrates an increase in alertness (Pasero, 2009). When high CO2
levels occur, the monitor alarm will sound. A benefit of using transcutaneous is that it
could provide earlier detection of respiratory issues than pulse oximetry (Kaneko, 1996).
Transcutaneous capnography monitoring offers continuous information making it
possible for the nurse to detect and follow trends (Torok et al., 2008). One potential
benefit of utilizing transcutaneous capnography with its continuous read outs is that it
may give nurses increased confidence in monitoring for respiratory distress while
increasing or decreasing opioid usage when needed.
CARBON DIOXIDE MONITORING IN RECOVERY 43
Limitations of Transcutaneous Capnography Monitoring
Transcutaneous capnography monitoring is not without potential disadvantages.
Two significant concerns to healthcare institutions are the potential for thermal injury and
the costs of the monitor. According to manufacturer’s guidelines, the monitoring site
should be changed every 4-6 hours to avoid thermal injury and the electrode must be
cleaned and recalibrated before placement at a new site. The complication of thermal
burn is rare and primarily occurs when the electrode is left for long periods of time in one
location (Coates et al., 2014). The potential for a thermal burn is a significant deterrent to
many health care institutions.
Another disadvantage to the use of this monitor is the initial cost to the health care
institution in purchasing the equipment. The price of one portable monitor begins at
$20,000.00. The cost does not include the disposable electrodes, conduction gel, and
calibration supplies. The cost of the monitor must be thought of in balance with the cost
savings of avoiding re-intubation and potentially extended hospital stays from
complications of respiratory distress. Overall, research studies indicate that the benefits
of transcutaneous capnography are value added.
Documentation of avoided re-intubations due to the early warning of respiratory
depression provided by transcutaneous capnography will assist in supporting the
proactive use of this monitoring instead of the reactive treatment of events.
Significance of Measuring Carbon Dioxide in Recovery Room
Perioperative care is provided in a complex environment. Accurate patient
assessment and prompt treatment of ventilatory concerns are necessary to promote patient
safety (Greensmith & Aker, 1998). The meaning of patient safety across disciplines

CARBON DIOXIDE MONITORING IN RECOVERY 44
seems to be consistent in regard to the delicate balance of managing postoperative pain
and protecting patients from respiratory complications.
In regards to the transcutaneous device, a variety of methods are utilized for
obtaining carbon dioxide trends which may have greater safety implications depending
on which division the patient is receiving care. Due to the manufacturer’s suggested
frequency of electrode site changing to be every 4-6 hours, this device is ideal to trial at
this specific study institution as the recovery room patients’ average length of stay is two
hours; however, this device transcending to other divisions within this particular
institution may be less likely. Time constraints of nursing staff on divisions whose
assignments can include up to five patients may preclude the ability to change the
electrode site in the recommended time frame potentially setting the patient up for a
thermal burn.
When patients arrive at the recovery room after their operation, most are already
extubated, remain drowsy from their anesthesia, and verbalize their discomfort with a
request for opioids. There is a gap in the literature in regards to utilizing this type of
assessment tool in the immediate recovery room phase of care.
Consequences of Post-operative Respiratory Complications
Intubation and mechanical ventilation are interventions that can be lifesaving in
patients but can also increase the potential risk of secondary conditions such as
volutrauma, barotrauma, and ventilator-associated pneumonia (VAP). The timing of
extubation is related to clinical outcomes and can impact morbidity and mortality. Early
extubation is one way of reducing morbidity, but premature extubation may be
detrimental. The need for reintubation increases mortality up to 40% in some patient

CARBON DIOXIDE MONITORING IN RECOVERY 45
groups (Glossop, Shepherd, Bryden, & Mills, 2012). In addition to the potential increase
in mortality, patients who are reintubated have worse clinical outcomes, increased
number of days in the ICU and overall longer hospital stays (Seymour, Martinez,
Christie, & Fuchs, 2004). Anesthesia-related, unexpected admission to an ICU is
considered a serious outcome associated with anesthesia and has been identified as a
clinical indicator acknowledged by the Joint Commission on Accreditation of Healthcare
Organizations (Cullen, Nemeskal, Cooper, Zaslavsky, & Dwyer, 1992).
Given the higher cost of ICU care versus ward care, there are also economic
implications to consider. If declining respiratory status is noted early, there could be time
to allow for a noninvasive form of ventilation to reduce the rates of reintubation in
postsurgery patient. Using non-invasive forms of ventilation can reduce the incidence of
pneumonia in the postsurgery patient and improve hospital survival (Glossop et al.,
2012).
Early identification of patients in the recovery room who have an increasing CO2
level indicating potential respiratory depression will allow for interventions to increase
patient stimulation, reduce opioid administration, and potentially provide naloxone
reversal early. Early intervention may assist in avoiding the need for re-intubation and
associated increased length of stay within the hospital (Wittekamp, Van Mook, Tjan, &
Zwaveling, 2009).
Risk Assessment for Safety Variables
Identification of factors that may predict critical events, such as respiratory
depression, in the postoperative patient is of great significance to practice. Implications of
complications patients can incur from respiratory compromise can be catastrophic to their

CARBON DIOXIDE MONITORING IN RECOVERY 46
health and safety. Regrettably it is challenging to predict which patients will have
respiratory compromise due to a variety of components such as age, length of surgery,
type of anesthesia and post-operative opioids.
The immediate postoperative period is a time when even relatively healthy
surgical patients undergo significant changes and are vulnerable to the significant risk of
experiencing anesthetic and surgical complications. Approximately 10% of all anesthetic
accidents occur in the recovery period (Staroverov & Ismailova, 2009).
An opportunity exists to review the current assessment components obtained in
postoperative patients, incorporate the additional monitoring of transcutaneous CO2
monitoring, and trend the patient’s data and outcomes. Utilizing a variety of technologies
are not meant to be competitive but rather, complementary, offering the ability to
combine techniques for assessment enhancement (Huttman et al., 2014). Analysis of the
data trends may offer the ability to develop safety and quality improvement protocols
which assesses for risks preoperatively for which patients may have postoperative
complications. The ability to recognize early in the recovery phase which patients might
have an untoward event after surgery could be useful in the management of their care.
The accuracy in the nurse’s assessment of their patients’ sedation level is crucial
in preventing respiratory depression (Pasero, 2009). Nurses impact the ability to reduce
adverse outcomes. Transcutaneous capnography can augment the nurse's assessment by
providing additional accurate information.
Summary
Chapter 2 described the conceptual framework and model utilized for this study.
The literature review discussed the historical concept of patient safety in the American

CARBON DIOXIDE MONITORING IN RECOVERY 47
healthcare system. Also, the recognition of safety for patients in the immediate
perioperative environment was reviewed and the safety variables monitored in the
immediate recovery room phase. Specifically, understanding the significance of
recognizing early rising carbon dioxide levels in patients was studied. The historical use
of transcutaneous capnography monitoring was discussed as well as reasons the monitor
is not currently used for the assessment of the recovery room patient in spite of
documented research advantages.

CARBON DIOXIDE MONITORING IN RECOVERY 48
CHAPTER 3:
METHODOLOGY
Introduction
The purpose of this retrospective quasi-experimental study was to generate
baseline data to trend patient safety variables and outcomes postoperatively.
Transcutaneous CO2 levels were assessed for the effects of transcutaneous capnography
monitoring on detection of carbon dioxide levels in recovery room patients.
This study had two objectives. One objective was to compare patients on
transcutaneous capnography with patients receiving standard postsurgical monitoring to
determine if there was a difference in postoperative safety variable trends and outcomes.
The second objective of the study was to compare postoperative complications of patients
monitored with transcutaneous capnography with patients receiving standard monitoring.
Research Questions
Research Question 1: Are there postoperative differences in trends of safety
variables of patients who were monitored with transcutaneous capnography
compared to those who received standard monitoring?
Research Question 2: How do patient complication trends relate to the
capnography trends and other safety variable trends in recovery room patients?
Participants
The site of the research study was an institution characterized as a 1200-bed,
teaching hospital in a large metropolitan city within the Midwest. This hospital was a
transplant and level 1 trauma center, spans two campuses, and performs up to 140
surgeries daily.

CARBON DIOXIDE MONITORING IN RECOVERY 49
This retrospective quasi-experimental study used a convenience sample of all
patients undergoing surgery and entering into the recovery room where transcutaneous
monitoring occurred in addition to routine care. Data on all patients who had the
transcutaneous monitoring device postoperatively were analyzed and compared to an
equal number of recovery room patients who received usual care without the
transcutaneous monitoring during the same time frame.
Standard monitoring equipment used routinely in the recovery room for surgery
patients included; electrocardiography, pulse oximeter (SpO2), noninvasive arterial blood
pressure measurements, heart rate, and respiratory rate.
Transcutaneous capnography (Radiometer TCM monitoring system, Radiometer
Medical, Copenhagen) used a heated sensor which was placed on the skin. The TCM400
monitor was reported to have 95% limits of agreement of +/- 6.84 mm Hg. The sensor
caused dilatation and increased gas diffusion through the skin from the capillaries. The
heating of the sensor allowed for the diffusion of carbon dioxide and oxygen to the skin
at 20 times the normal speed. The signal was converted by the monitor and was shown as
a CO2 value. The correlation of TrCO2 and arterial CO2 was reported by the company to
be very close, r= 0.968, p<0.0001; mean bias was 0.75mmHg and a reported sensitivity
of 86% and specificity of 80%.
The exclusion criteria were: skin anomalies which affected the anterior chest wall
and the ability of the electrode to adhere, and ASA score of 6. There was no exclusion
concerning gender, race, ethnicity or geography.
Inclusion criteria included: All recovery room patients > 18years of age, no skin
anomalies which affect anterior chest wall access and electrode adherence, with an

CARBON DIOXIDE MONITORING IN RECOVERY 50
American Society of Anesthesiologists (ASA) physical status classification system score
of 5 or less. This score was obtained preoperatively on all surgical patients by the
anesthesiologist or nurse anesthetist and documented in the electronic medical record.
The ASA score definitions are as follows:
1. A normal healthy patient
2. A patient with mild systemic disease
3. A patient with severe systemic disease
4. A patient with severe systemic disease that is a constant threat to life
5. A moribund patient who is not expected to survive without the operation
6. A declared brain-dead patient whose organs are being removed for donor
purposes
Measures
Nine dependent variables were tracked for this study as safety measures. They
included:
1) Respiratory rate - the number of breaths a person takes during a one-minute
period.
2) Blood pressure (mean level) - average arterial pressure against the inner walls of
the blood vessels comparative to the diameter and elasticity of the blood vessel as
well as the heartbeat.
3) Heart rate – heart beat in number of beats per minute (bpm).
4) Oxygen saturation (SpO2) – measures blood attached to hemoglobin molecule;
how much oxygen the blood has measured as a percentage of the maximum it
could be carrying.
CARBON DIOXIDE MONITORING IN RECOVERY 51
5) Pain scores – measures a patient’s pain in intensity on a scale of 0 to 10. Zero
equaling no pain and ten being the most severe pain level. The pain score will be
reported in two ways 1) individually by the patient report on the scale of 0-10 and
2) grouped into categories of reported pain.
6) Aldrete scores – a measurement of recovery after anesthesia that includes
gauging, oxygen, consciousness, activity, respiration and blood pressure on a
scale of 1-10. Two points maximum are given in each category, and a patient
must have a score of 9 to 10 to be discharged from the recovery room.
7) Opioid doses administered, both individual and total, were also be collected. This
collection will include the number of doses administered, amount of Dilaudid
given with each dose, and the total amount of Dilaudid administered. Standard
opioid administered is Dilaudid .25 mg per dose. Dose amount given is
determined by protocol and based from the patient pain score. Pain score
grouping was 0-5, 6-8, and 9-10. This categorical grouping coincided with the
standardized medication administration orders for administration of Dilaudid
according to pain score. The group 0-4 has no pain medication administered, the
groups 5-8 have standard orders for 0.25mg Dilaudid to be administered, and 9-10
pain score patients have 0.5mg Dilaudid ordered for treatment. Upon occasions,
Morphine is ordered and administered related to patient allergies and past medical
history.
8) Recovery room time – the total number of minutes a patient remains in the
recovery room from the start of Phase I care to the end of Phase I care.

CARBON DIOXIDE MONITORING IN RECOVERY 52
9) Recovery room intubation occurrences – the insertion of a tube into the trachea
for purposes of anesthesia, airway maintenance, or ventilation. Intubations will be
entered as either a yes or no for the occurrence during the recovery room
timeframe.
Demographic variables were obtained on all participants. These variables
included: diagnosis, surgical procedure, age, gender, height, weight, BMI, and ASA
score.
Data points on variables 1 through 7 above were collected and analyzed via
repeated measures at three specific time frames. The time frames these dependent
measurements were obtained were at admission to the recovery room, 30 minutes after
admission, and 60 minutes after admission. Based on the prior use of the monitor within
this specific recovery room, if patients were to experience respirator deterioration it
would usually occur within the first 30 to 45 minutes of arrival (Davis, 2011). The
dependent variables of recovery room time and recovery room intubation were obtained
and coded when the patient is discharged from recovery. The demographic variables were
coded once.
Design
This study used a retrospective quasi-experimental design. This design allowed
for statistical contrasts between control and treatment groups with random assignment to
treatment. The time series component of this design referred to measurements (discussed
above) made on condition of the patients at three points in time.
Medical records of recovery room patients who met the inclusion criteria were
pulled from an extant database, Metavision, which houses electronic medical records.

CARBON DIOXIDE MONITORING IN RECOVERY 53
Participants who had a room assignment with a capnography device in it were
automatically included in the treatment group. An equal number of recovery room
patients’ medical records admitted to room assignments without a capnography monitor
in it during this same time frame served as the comparison group. Data on the first seven
dependent measures identified above were collected at three points in time. Measures and
time were treated as within subject factors.
Human Subjects
The principal investigator completed human subject protection training. The study
was approved by the Institutional Review Boards (IRB) at the University of Missouri-St.
Louis and also approved through the Study Proposal Review Committee at Barnes-
Jewish Hospital for administrative review. The procedures to protect the right of human
subjects were implemented, and no problems or confidentiality issues were observed. The
participants remained anonymous as codes were assigned to names. Names were
removed. All personal information taken from the electronic data system was coded and
remains unidentified.
Procedures
This retrospective quasi-experimental study was limited to the south campus
recovery room which performs approximately 140 surgeries daily. Although the recovery
room on the south campus spans across two floors, the four capnography monitors were
located on the second floor recovery room. The control group data was also taken from
the second floor recovery room population.
Education was provided by Radiometer Company representatives to all assistant
managers, resource nurses and staff nurses for specifics operations including calibration

CARBON DIOXIDE MONITORING IN RECOVERY 54
of the monitor, re-membraning the sensor, and application. The training included:
application of the electrode, identification of electrode sites, calibration of the monitor,
alarm settings, and skin assessments frequency and documentation. The unit educator
provided real time instruction if questions arose regarding calibration and application of
the electrode to confirm consistency in the process.
The calibration of the monitor was performed prior to placement of the electrode,
whenever the sight was changed, and every time the sensor was re-membraned. The steps
in calibration included: turning on the power at back of monitor, pressing the on button in
front of monitor, press ON in front of monitor and OK on the screen, inserting the sensor
in the calibration chamber and pressing CALIBRATION. A signal alerted when the
calibration was completed.
The sensor was re-membraned every 1-2 weeks as recommended by the
manufacturer. The monitor provided a visual reminder to perform this task which
eliminated the possibility of staff forgetting.
The calibration CO2 gas cylinder was changed whenever the monitor alarm
signaled the need. Staff was educated on changing the cylinder which was found to be
quick and easy. The empty cylinder was removed by unscrewing it by turning it counter
clockwise. A full cylinder required a white protection cap to be removed so the new
cylinder could be screwed clockwise onto the monitor.
Staff education also included potential alarms which could have occurred such as
changing the sensor ring, gas cylinder, and the fixation ring. The replacement steps
instructed were to calibrate the sensor, remove a fixation ring form the protective film,
apply the ring to the center of the measuring site and then to press it firmly in place. The

CARBON DIOXIDE MONITORING IN RECOVERY 55
fixation ring then required two to three drops of contact liquid before aligning the arrow
on the sensor with the mark on the actual ring. Staff found the process simplistic and easy
to perform.
Upon arrival to the preoperative holding area on the day of surgery, the nurse
obtained patient demographics and baseline assessment which was entered into the
electronic documentation system, Metavision. The anesthesiologist documented a
preoperative ASA score. Demographic variables which were assessed were: diagnosis,
surgical procedure, age, gender, height, weight, BMI, ASA score, past medical and
surgical history.
The transcutaneous capnography monitors (TCM) remained in specific rooms and
all patients admitted to that room had the TCM placed by the nurse. The average length
of stay in the recovery room for patients was two hours or less. Each room had
approximately five patients each admitted to it during one day. As patients completed
surgery, the nurse in the operating room called out to the recovery room charge nurse to
obtain room assignment. The charge nurse assigned the patient to a room randomly based
on which room was available. The room assignment was on a first come, first serve basis.
Upon the patient’s arrival to the room, the transcutaneous monitor was calibrated
before being placed on each patient’s chest. The temperature on the monitoring unit was
set, and the monitor’s settings were locked at 41 degrees centigrade. Assessment of skin
integrity for electrode site was performed and documented in Metavision before
placement and after removal.
The electrode placement was on the anterior chest wall and not placed over an
internal pacemaker or on top of previous scar tissue. The patient’s chest wall was dry and

CARBON DIOXIDE MONITORING IN RECOVERY 56
was shaven if hair prohibited adequate contact of electrode to skin. The staff applied the
transcutaneous electrode and ensured the monitor was tracking the CO2 levels. The
electrode was removed after two hours.
Standard care provided routinely in the recovery room for surgical patients
included: electrocardiography, pulse oximeter (SpO2), noninvasive arterial blood pressure
measurements, heart rate, and respiratory rate. Additional orders for end-tidal
capnography might have been obtained based on physician preference. The data was
automatically downloaded into the monitor, recorded, and saved within Metavision, the
electronic medical record. In addition to this usual care, transcutaneous capnography
(TrCO2) data which is visual continually on the monitor was manually recorded every ten
minutes into the same electronic database by the staff. Arterial blood gases were obtained
only if clinically indicated and were obtained from the arterial line, which was placed
before surgery.
All documentation of opioid administration was captured electronically by dose
amount and time given within Metavision. Also, all vital signs, pain scores, oxygen
saturation and capnography levels (both end-tidal and transcutaneous) were electronically
documented into the patient’s electronic medical record every ten minutes. Patients were
assessed by Modified Aldrete score upon admission and every thirty minutes until
discharge from the recovery room. The score was manually entered into the
documentation system by the nursing staff.
The ideal direction variables should take postoperatively was a respiratory rate
stabilizing between twelve and twenty, mean blood pressure < 80, heart rate <80, oxygen

CARBON DIOXIDE MONITORING IN RECOVERY 57
saturation increasing > 92%, pain scores decreasing < 5, Aldrete increasing to 9-10, and a
RASS score increasing to 0.
All information except for the arterial blood gas levels was automatically
collected and stored in the Phillips monitor and system every ten minutes. Arterial blood
gas results were entered by into the documentation system by hospital laboratory staff.
Data Management and Analysis
Data points were be retrieved by the Perioperative Information System (IS)
Department, formatted and saved in an Excel spreadsheet on a hard drive. A summary of
descriptive statistics were obtained from the Performance Improvement Department with
on the data retrieved with the frequencies, percent, means, median, and standard
deviation of all information (age, BMI, gender). The data on the hard drive was kept in a
locked perioperative office and access to the office was limited to the principal
investigator. The principal investigator assessed the data for any missing data points on
demographic information and manually imputed results into the Excel spreadsheet.
Data were analyzed via a group (treatment vs. control), by measures (respiratory
rate vs. blood pressure vs. heart rate vs. oxygen saturation vs. pain score vs. Aldrete score
vs. opioid doses) and by time (admission vs. 30 minutes vs. 60 minutes) multivariate
analysis of variance (MANOVA). The latter two measures were treated as within-subject
factors. Significant interactions were investigated using appropriate posthoc analyses.
Recovery time was assessed at discharge only and was analyzed via an independent t test.
Reintubation was assessed at discharge and analyzed using a 2 (treatment vs. control) by
2 (yes vs. no) Chi-Square.

CARBON DIOXIDE MONITORING IN RECOVERY 58
Summary
The purpose of the study was to examine variables for trends on recovery room
patients utilizing the transcutaneous monitor compared to patients with standard
monitoring alone. Comparison of opioids administered between both groups in addition
to complications incurred could allow for the development of protocols in the
management of high-risk patients. Identifying patients early who have an increased risk
of developing respiratory depression in the recovery room may facilitate prevention
through reduction of opioid administration and early treatment. The need for re-
intubation and associated increased length of patient stay may be reduced or eliminated
(Wittekamp et al., 2009).

CARBON DIOXIDE MONITORING IN RECOVERY 59
CHAPTER 4:
RESULTS
This chapter presents the findings of this retrospective quasi-experimental study.
Data were gathered retrospectively from the dates January 2, 2015 to July 30, 2015. This
chapter presents descriptions of the overall sample, including their characteristics, and
any potential differences between the groups. Also in this chapter are the comparison
between groups of time in Phase I recovery, opioids administered, review of all data
variables, and summary of results. The specific findings related to each research question
are also presented.
Data Analysis Decisions
There were 833 patients, aged 18 years or older, available for study participation.
Seventeen patients were found to have multiple encounters in the PACU data, so only
data from their first encounter were included in the study. For this group, the presence of
multiple entries was not associated with the TrCO2 study group (3.5% in Control group
vs. 2.1% in TrCO2 study group, p=0.234). After applying the above criteria, 17 subjects
were eliminated from the study resulting in a final sample size of 816 subjects with 397
(48.7%) in control group and 419 (51.3%) in TrCO2 study group.
Numerous demographic, patient safety, and medication utilization variables of
interest were recoded into categorical measures to improve statistical power and clinical
interpretation. Patient’s body mass index (BMI) was calculated using recorded patient
height and weight values. Age, BMI, and PACU Time in Phase I was recoded into
categorical variables. Patient safety scores were recoded as categorical variables at
clinically-relevant cut points and change from PACU admission score to 30- or 60-
minute measurements.

CARBON DIOXIDE MONITORING IN RECOVERY 60
Dosing of the opioid medications hydromorphone, fentanyl, and morphine were
classified as “High” (greater than or equal to: 0.50 mg, 50 mcg, and 4 mg, respectively)
or “Low” (less than: 0.50 mg, 50 mcg, and 4 mg, respectively). Further, medication
administration was stratified in relation to time of PACU admission (less than or equal to
15 minutes), 16 – 30 minutes, 31 – 60 minutes, or greater than 60 minutes. A tally of
these stratified dosing counts was aggregated by dosing strength and timeframe.
A series of independent samples t-tests were conducted to compare continuous
variables between study groups. Non-parametric Mann-Whitney U tests were used when
parametric assumptions were not upheld. A series of Chi-square tests were used to assess
the association of categorical variables by study group. Fisher’s exact tests were
calculated when expected cell sizes were too small. Alpha was preset at .05 for all
significance testing. Statistical analysis was performed using IBM SPSS Statistics for Mac
version 24.0 (IBM Corporation, Somers, NY, USA).
Description of the Overall Sample
The data were analyzed for a total of 419 patients (TrCO2 study group) and 397
patients (control group) who received care during the same time frame. Sixty-six patients
had more than one encounter that may have been from multiple visits to the operating
room. For the multiple encounter patients, data from the first surgeries only were
included for this analysis.
Demographic and clinical summary statistics by study group are reported in Table
4. The participants ranged in age from 14 to 95 years in the control group and 17 to 93
years in the TrCO2 study group. Gender for both groups was slightly greater in female
participants. BMI was categorized into groups of underweight (<18.5), healthy (18.5-

CARBON DIOXIDE MONITORING IN RECOVERY 61
24.9), overweight (25-29.9), and obese (> or equal 30) with the obese group having the
majority of patients for both control and TrCO2 study groups.
The study groups were equivalent with the exception of one variable. ASA was
significantly associated with the TrCO2 study group: X2 (4, N = 816) = 16.089, p = 0.003.
However, the TrCO2 study group participants were more likely to have had a missing
ASA. When missing ASA participants were excluded (Table 2), ASA remained
significantly associated with the TrCO2 study group: X2 (3, N = 222) = 12.600, p = 0.006.
Thus, TrCO2 study group participants were more likely to have had a higher ASA when
compared to the control group. The proportion of missing ASA is high (TrCO2 = 76% vs.
Control = 70%), which may warrant exclusion from subsequent adjustments in the
analysis.
Table 4
Demographic and clinical summaries by Study Group (N = 816)
Control
TrCO2
n = 397
n = 419
Difference
Variable Mean SD Mean SD Mean t df p-value
Age (years) 57.30 15.5
56.12 15.6
-1.18 1.083 814 0.279
Height (centimeters) 170.30 11.0
170.53 10.4
0.23 -0.302 794 0.763
Weight (kilograms) 87.14 24.5
86.81 26.6
-0.33 0.179 771 0.858
BMI
29.94 7.7
29.97 8.8
0.03
0.557 †
Control
TrCO2
Difference
Variable n % n % %
Chi-
square df p-value
Age
1.521 1 0.217
18 - 59 197 49.6
226 53.9
4.3
≥ 60 200 50.4
193 46.1
-4.3
Gender
0.016 1 0.899
Male 183 46.1
195 46.5
0.4
Female 214 53.9
224 53.5
-0.4
BMI
3.608 3 0.307
Underweight (< 18.5) 8 2.1
12 3.2
1.1
Healthy (18.5 - 24.9) 88 22.6
98 25.9
3.3

CARBON DIOXIDE MONITORING IN RECOVERY 62
Overweight (25.0 -
29.9) 132 33.9
108 28.5
-5.4
Obese (≥ 30) 161 41.4
161 42.5
1.1
ASA
16.089 4 0.003
1 6 1.5
9 2.1
0.6
2 75 18.9
44 10.5
-8.4
3 39 9.8
44 10.5
0.7
4 0 0.0
5 1.2
1.2
Missing 277 69.8
317 75.7
5.9
Facility
6.784 5 0.237
Pod 1 108 27.2
122 29.1
1.9
Pod 2 163 41.1
157 37.5
-3.6
Pod 3 59 14.9
62 14.8
-0.1
Pod 5 62 15.6
62 14.8
-0.8
Remote Anesthesia 2 0.5
10 2.4
1.9
CPC 3 0.8 6 1.4 0.6
† Mann-Whitney U Test
The frequency distribution for the ASA data is shown in Table 5. The groups
remained significantly different even when missing data were excluded. There was a
possibility that the missing data were located in an undetermined area of the extant
database where it could not be found, if it was documented in the electronic medical
record at all. Opportunities existed to ensure the ASA score was performed and
documented in one location within the hospital’s documentation system. This would
promote consistency so that all team members would have access for review.
Table 5
Frequency Table: ASA
_____________________________________________________ ASA Frequency Percent Valid Percent
______________________________________________________________
1 15 1.8 6.8
2 119 14.6 53.6
3 83 10.2 37.4
4 5 .6 2.3
Total 222 27.2 100.0
_______________________________________________________________________
Missing 594 72.8
Total 816 100
__________________________________________________________________________

CARBON DIOXIDE MONITORING IN RECOVERY 63
Originally the surgical procedures data were retrieved by the primary service
providing the care (Table 6). A total of 18 categories of surgery were identified, far too
many to be useful as a predictor of outcomes. The size of some of the categories caused
the variable to be statistically different by study group. This data was then represented in
a descriptive format as a variety of surgery services represented among the sample
participants.
Table 6
Surgery Frequency by Primary Service
__________________________________________________
Service Frequency Percent Cumulative %
_______________________________________________________________
ACCS 16 2.0 2.0
Anesthesiology 11 1.3 3.3
Cardiothoracic 40 4.9 8.2
Cardiovascular 9 1.1 9.3
Colorectal 2.6 3.2 2.5
Gastroenterology 4 .5 13.0
General Oncology 3 .4 3.4
GYN 99 12.1 25.5
Hepatobiliary 23 2.8 28.3
Minimally Invasive 15 1.8 30.1
Neurosurgery 71 8.7 38.8
Ophthalmology 1 .1 39.0
Orthopaedic 293 35.9 74.9
Otolaryngology 55 6.7 81.6
Plastic 9 1.1 82.7
Transplant 17 2.1 84.8
Urology 74 9.1 93.9
Vascular 50 6.1 100.0
________________________________________________________
Total 816 100

CARBON DIOXIDE MONITORING IN RECOVERY 64
Patients arrived to the recovery room from several operating room divisions, also
known as “POD”s (perioperative division). Each POD performs various surgical
specialties:
POD 1: gynecology, genitourinary, colorectal
POD 2: orthopedics, trauma, plastic surgery
POD 3: hepatobiliary, transplant, vascular, cardiac, and thoracic
POD 4: located on the north campus and not included in this study
POD 5: neurology, ear-nose-throat
CPC: cardiac procedure lab
Remote: patients who had a “procedure” performed outside of the PODs
that required anesthesia support, i.e. MRI, in vitro fertilization
Patients were categorized by the division in which their surgery was performed.
There were six potential divisions in which patient could have their procedures
performed. When patients were categorized by the division in which their surgery was
performed, there was no significant difference between study groups (Table 7). Most of
the samples were in PODs 1 through 4, with nine patients in CPC and 12 in Remote
Anesthesia.
Table 7
Surgeries Categorized by Operating Room PODs
_________________________________________________ Frequency Percent Cumulative %
__________________________________________________________________
POD 1 230 28.2 28.2
POD 2 320 39.2 67.4
POD 3 121 14.8 82.2
POD 5 124 15.2 97.4
Remote Anesthesia 12 1.5 98.9
CPC 9 1.1 100.0
___________________________________________________________________
Total 816 100.0

CARBON DIOXIDE MONITORING IN RECOVERY 65
Time in Phase I Recovery
Upon arrival to the recovery room, clinical processes classified a patient as being
in Phase I care. This was the immediate recovery phase as the patient recovers from the
effects of anesthesia. Upon completion of phase I recovery, patients were admitted to the
hospital or discharged to home if they had a small same day surgical procedure. The
average length of stay in the recovery room for Phase I level of care was approximately 2
hours. Time in Phase 1 was recorded in minutes as a continuous variable in the dataset
and also as a categorical variable (less than versus greater than and equal to 120 minutes,
based on typical care).
Time in Phase I by study group is reported below in Table 8 and displayed in
Figure 2. Time in Phase I as a continuous variable was significantly shorter for the
TrCO2 study group (M=128.4 minutes) as compared to the control group (M=151.1
minutes).
Table 8
Time in Phase I by Study Group (N = 816)
Control
TrCO2
n = 397
n = 419
Difference
Variable Mean SD Mean SD Mean U p-value
Time in Phase I (minutes) 151.1 54.5
128.4 60.8
60382.0
<.001 †
Control
TrCO2
Difference
Variable n % n % % Chi-square df p-value
Time in Phase I (minutes)
22.382 1 <.001
< 120 138 34.8
213 51.2
16.4
≥ 120 259 65.2 203 48.8 -16.4
† Mann-Whitney U Test

CARBON DIOXIDE MONITORING IN RECOVERY 66
The average length of stay in the recovery room was less than two hours. When
time in Phase I was reviewed as a categorical variable, the TrCO2 study group showed
significantly less time spent in the recovery room overall compared to the control group.
Figure 2. Comparison of Phase 1 Time in Minutes by Control and TrCO2 study groups
Opioid Administration
Overall administration of opioids was significantly less for the TrCO2 study group
as compared with the control group. This difference included administration of fewer
opioids and, particularly in later time frames, lower doses of opioids. This difference was
offset somewhat because the control group had more opportunities for opioids to be
administered due to their longer timeframe in Phase I recovery.
Opioid administrations provided to patients were categorized by four time periods
from patient’s arrival to the recovery room to the first dose administered. The categories
were: < 15 minutes of arrival in the division, between 16-30 minutes, 31-60 minutes, and
34.8 51.2
65.2 48.8
0%
10%
20%
30%
40%
50%
60%
70%
80%
90%
100%
Control Case
Time in Phase I by Study Group
< 120 minutes ≥ 120 minutes

CARBON DIOXIDE MONITORING IN RECOVERY 67
> 60 minutes (Table 6). The TrCO2 study group had significantly lower doses
administered upon review of an overall number of doses and doses occurring at the > 60
minutes period. Any “unusual values” recorded for opioid doses were excluded from
analysis as the recovery room nurse provides doses according to standardized order
sheets. Doses administered with unusual values may have been provided by the
anesthesiology department as they tend to provide doses outside recovery’s standard
orders.
In order to categorize the medications by dose, high and low dose definitions were
specified for each of the three major opioids used in the recovery room. Hydromorphone
doses of < 0.50 mg were considered as low and ≥ 0.50 mg were coded as high. Fentanyl
doses of < 50 mcg were recorded as low and ≥50 mcg were considered high. Finally,
morphine of < 4 mg was considered as low and ≥ 4 mg were recorded as high.
Each opioid dose given to the patient was counted as an encounter, recognizing
that the doses may not be equivalent across the medications but are all Schedule 2 drugs
(e.g., one hydromorphone + 2 fentanyl = 3 opioids). Because some administrations are
stronger than others, opioids were also grouped across medications by their binary dose
(e.g., two low dose hydromorphone and 1 low dose of fentanyl = 3 low dose opioids; see
Table 6). Doses of opioids administered, categorized as high versus low, were found to
be significantly lower at several time frames for the TrCO2 study group as compared with
the control group.
Opioid administration by both groups is reported in Table 9 and displayed
graphically in Figure 3. Overall opioid administration, combined across all times and

CARBON DIOXIDE MONITORING IN RECOVERY 68
doses, was significantly lower among the TrCO2 study group compared to the control
group.
Table 9
Opioid Administration Doses by PACU Time and by Study Group (N = 816)
Control
TrCO2
n = 397
n = 419
Difference
Variable Mean SD Mean SD Mean U
p-
value
Opioid 2.59 3.1
1.92 2.4
-0.67 73519.5
0.003 †
≤ 15 minutes 0.42 0.7
0.35 0.7
-0.07 78813.5
0.100 †
16 - 30 minutes 0.42 0.7
0.36 0.6
-0.06 79953.0
0.241 †
31 - 60 minutes 0.71 0.9
0.60 0.9
-0.11 78233.5
0.098 †
> 60 minutes 1.05 1.8
0.61 1.2
-0.4 70179.0
<.001 †
Opioid, Low Dose 0.78 1.4
0.44 1.0
-0.34 75013.0
0.002 †
≤ 15 minutes 0.09 0.3
0.06 0.3
-0.03 80881.5
0.114 †
16 - 30 minutes 0.14 0.4
0.07 0.3
-0.07 78785.0
0.009 †
31 - 60 minutes 0.22 0.6
0.13 0.4
-0.09 79005.0
0.030 †
> 60 minutes 0.34 0.8
0.18 0.6
-0.2 76561.5
0.001 †
Opioid, High Dose 1.81 2.7
1.47 2.2
-0.34 77725.0
0.083 †
≤ 15 minutes 0.33 0.7
0.29 0.6
-0.04 80931.0
0.365 †
16 - 30 minutes 0.28 0.6
0.29 0.6
0.01 82334.5
0.735 †
31 - 60 minutes 0.49 0.8
0.47 0.8
-0.02 82675.5
0.858 †
> 60 minutes 0.71 1.5 0.42 1.0 -0.3 74027.5 <.001 †
† Mann-Whitney U Test

CARBON DIOXIDE MONITORING IN RECOVERY 69
Figure 3. Opioid Administration
Patient Safety Variables
Although there was no statistical difference in the overall sample population, the
results of the patient safety variables over time show significant initial baseline
differences between the control and TrCO2 study group in several categories (Table 10
and Figure 4).
Table 10
Patient Safety Variables upon PACU Admission and Over Time (N = 816)
Control
TrCO2
n = 397
n = 419
Difference
Variable
PACU
Time Mean SD Mean SD Mean U
p-
value
Respiratory
Rate Admission 14.88 4.5
16.22 5.6
1.34 69135.0
<.001 †
30 minutes 14.69 4.1
16.13 5.1
1.44 68617.0
<.001 †
60 minutes 14.60 5.7
15.64 6.2
1.04 69504.5
0.001 †
Blood
Pressure,
mean level
Admission 82.99 15.0
86.67 15.9
3.68 69541.5
0.001 †
30 minutes 81.88 13.9
84.82 15.6
2.94 73074.0
0.006 †
60 minutes 81.27 13.1
82.77 14.0
1.50 75805.0
0.073 †

CARBON DIOXIDE MONITORING IN RECOVERY 70
Heart Rate Admission 80.04 15.9
85.02 53.1
4.98 75733.0
0.041 †
30 minutes 76.87 16.4
77.44 16.5
0.57 81618.0
0.825 †
60 minutes 75.95 16.9
76.23 16.7
0.28 80744.0
0.944 †
Oxygen
Saturation
(SpO2)
Admission 97.87 2.6
99.70 44.8
1.83 76121.5
0.066 †
30 minutes 97.36 2.7
99.49 44.6
2.13 78892.5
0.346 †
60 minutes 97.27 2.7
97.42 3.0
0.15 80824.5
0.820 †
Pain Score Admission 3.05 3.9
5.16 4.6
2.11 56106.5
<.001 †
30 minutes 2.68 3.5
5.83 4.3
3.15 45140.5
<.001 †
60 minutes 2.19 3.0
5.73 4.2
3.54 38379.5
<.001 †
Aldrete
Score Admission 8.40 0.8
8.21 0.7
-0.19 70282.5
0.001 †
30 minutes 8.66 0.8
8.63 0.8
-0.03 77118.0
0.715 †
60 minutes 8.77 0.9
8.67 1.1
-0.10 74724.0
0.610 †
RASS Admission -0.69 0.9
-0.85 1.0
-0.16 70035.5
0.006 †
30 minutes -0.55 0.7
-0.58 0.8
-0.03 68938.0
0.716 †
60 minutes -0.45 0.7 -0.48 0.9 -0.03 65783.5 0.361 †
† Mann-Whitney U Test
Figure 4. Patient Safety Variables Baseline & Over Time

CARBON DIOXIDE MONITORING IN RECOVERY 71
Since the two groups had baseline differences seen in their mean scores
represented in Table 10, a target number for each safety variable was established and then
a percent of change from the target (Table 11). The ability of the variable to be close to
the established target was then measured upon admission as well as 30 and 60 minutes
afterward by study groups.
The TrCO2 study group, as compared with the control group, was less likely to
achieve their target respiratory rate of ≤ 20 breaths per minute upon admission and at 30-
and 60-minutes after admission. The TrCO2 study group was less likely to achieve a
target blood pressure mean level of ≤ 80 upon admission and at 30-minutes after
admission as compared with the control group while they also were less likely to achieve
a target pain score of ≤ 5 at 30 and 60-minutes after admission as compared with the
control group. Upon admission, the TrCO2 study group as compared with the control
group was less likely to achieve a target Aldrete Score of ≥9 or a RASS of ≥0. However
upon 30 and 60 minute measurements both improved. There were significantly fewer
patients with pain scores less than 5 at 30 and 60 minutes in the TrCO2 study group. The
Richmond Agitation Scale Score (RASS) was notably more improved, a higher number,
indicating the patient is more awake and alert.

CARBON DIOXIDE MONITORING IN RECOVERY 72
Table 11
Patient Safety Measure Target Achieved upon Admission and Over Time (N=816)
Control
TrCO2
n = 397
n = 419
Difference
Variable Target
PACU
Time n % n % % Chi-
square df p-
value
Respiratory
Rate ≤ 20
Admission 363 91.9
335 81.1
-
10.8 19.968 1 <.001
30 minutes 364 92.2
346 83.6
-8.6 13.846 1 <.001
60 minutes 364 92.2
353 86.9
-5.3 5.781 1 0.016 Blood
Pressure,
mean level
≤ 80 Admission 178 45.1
154 37.6
-7.5 4.673 1 0.031
30 minutes 188 47.6
165 39.7
-7.9 5.185 1 0.023
60 minutes 194 49.1
182 44.0
-5.1 2.157 1 0.142 Heart Rate ≤ 80 Admission 204 51.6
200 47.8
-3.8 1.172 1 0.279
30 minutes 244 61.8
259 62.1
0.3 0.010 1 0.921
60 minutes 244 61.8
255 62.2
0.4 0.015 1 0.902 Oxygen
Saturation
(SpO2)
≥ 92 Admission 385 97.5
401 96.6
-0.9 0.499 1 0.480
30 minutes 382 96.7
400 96.4
-0.3 0.063 1 0.801
60 minutes 386 97.7
404 97.8
0.1 0.009 1 0.924 Pain Score ≤ 5 Admission 265 67.1
198 63.9
-3.2 0.798 1 0.372
30 minutes 280 70.9
165 55.6
-
15.3 17.359 1 <.001
60 minutes 320 81.0
185 69.3
-
11.7 12.104 1 0.001 Aldrete
Score ≥ 9
Admission 148 37.5
109 27.1
-
10.4 9.776 1 0.002
30 minutes 210 53.2
209 52.8
-0.4 0.012 1 0.913
60 minutes 227 57.5
233 60.8
3.3 0.912 1 0.340 RASS ≥ 0 Admission 153 38.7
115 29.0
-9.7 8.295 1 0.004
30 minutes 196 49.6
172 48.6
-1.0 0.080 1 0.778
60 minutes 223 56.5 182 52.8 -3.7 1.019 1 0.313
To better compare the control versus TrCO2 study group, the percent of change
noted over time (target change) was incorporated to assess the degree the subjects had a
change from their own baselines for each metric as an indicator of improvement or
worsening of variables (Table 12). This approach was helpful in adjusting for the
different starting points at admission to show actual improvement in the TrCO2 study
group.
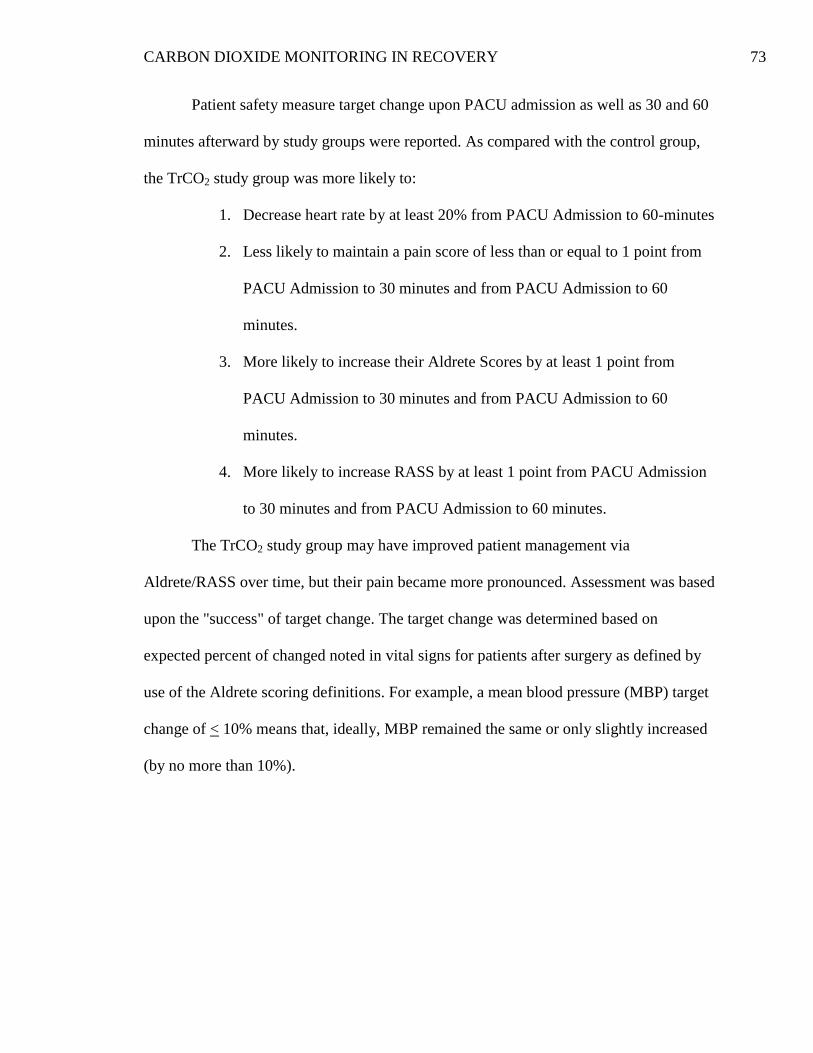
CARBON DIOXIDE MONITORING IN RECOVERY 73
Patient safety measure target change upon PACU admission as well as 30 and 60
minutes afterward by study groups were reported. As compared with the control group,
the TrCO2 study group was more likely to:
1. Decrease heart rate by at least 20% from PACU Admission to 60-minutes
2. Less likely to maintain a pain score of less than or equal to 1 point from
PACU Admission to 30 minutes and from PACU Admission to 60
minutes.
3. More likely to increase their Aldrete Scores by at least 1 point from
PACU Admission to 30 minutes and from PACU Admission to 60
minutes.
4. More likely to increase RASS by at least 1 point from PACU Admission
to 30 minutes and from PACU Admission to 60 minutes.
The TrCO2 study group may have improved patient management via
Aldrete/RASS over time, but their pain became more pronounced. Assessment was based
upon the "success" of target change. The target change was determined based on
expected percent of changed noted in vital signs for patients after surgery as defined by
use of the Aldrete scoring definitions. For example, a mean blood pressure (MBP) target
change of < 10% means that, ideally, MBP remained the same or only slightly increased
(by no more than 10%).

CARBON DIOXIDE MONITORING IN RECOVERY 74
Table 12
Patient Safety Measure Target Change from PACU Admission & Over Time (N = 816)
Control
TrCO2
n = 397
n = 419
Difference
Variable Target Change
PACU
Time n % n % %
Chi-
square df
p-
value
Respiratory Rate
Decrease ≤ 20% [Admin ≥ 8]
30 minutes 92 24.0
102 25.6
1.6 0.271 1 0.603 60 minutes 112 29.2
125 32.0
2.8 0.717 1 0.397
Blood Pressure,
mean level
Increase ≤ 10% 30 minutes 317 80.3
343 83.9
3.6 1.781 1 0.182 60 minutes 312 79.0
336 82.8
3.8 1.843 1 0.175
Heart Rate Decrease ≤ 20% 30 minutes 32 8.1
39 9.4
1.3 0.398 1 0.528
60 minutes 46 11.6
72 17.6
6.0 5.627 1 0.018
Oxygen
Saturation
(SpO2)
Increase ≥ 0 30 minutes 116 29.4
107 25.9
-3.5 1.209 1 0.272
60 minutes 114 28.9
103 25.1
-3.8 1.478 1 0.224 Pain Score Increase ≤ 1
30 minutes 347 87.8
278 73.9
-
13.9 24.287 1 <.001
60 minutes 336 85.1
240 67.4
-17.7 32.628 1 <.001
Aldrete Score Increase ≥ 1 30 minutes 100 25.3
143 37.3
12.0 13.081 1 <.001
60 minutes 139 35.2
169 45.6
10.4 8.545 1 0.003
RASS Increase ≥ 1 30 minutes 91 23.0
118 33.4
10.4 9.994 1 0.002
60 minutes 131 33.2 148 42.9 9.7 7.429 1 0.006
Transcutaneous Monitoring Subset Analysis
TrCO2 readings were captured for participant cases only. The readings were
performed repeatedly during each participant’s time in the PACU, but for different
durations and at inconsistent intervals (though most maintained a 10 minute interval).
Participant cases were excluded from this subset analysis if the initial TrCO2 reading was
zero or missing as well as if the average of subsequent readings was zero or missing.
After 7 (2%) of cases were excluded, 412 valid cases were analyzed as a case-only
subset.
On average, the initial TrCO2 reading was 36.6 (SD=8.7, range 9.0 to 65.0). The
average of subsequent TrCO2 readings was 43.3 (SD=7.2, range 21.3 to 82.3). The initial
TrCO2 readings for each participant were compared to the average of subsequent readings

CARBON DIOXIDE MONITORING IN RECOVERY 75
in order to assess directional change and management of TrCO2. Among the 412 subset
cases, 37 (9.0%) decreased by at least 5% from the initial TrCO2 reading to the average
of subsequent readings.
As reported in Table 13, the cases which reported pain scores of ≤5 at PACU
admission were less likely to decrease their TrCO2 from initial reading to average of
subsequent readings (6.7% vs. 13.4%, X2 (1, N = 305) = 3.825, p = .050). The average of
subsequent TrCO2 readings (M=42.4; Mdn=41.5) was significantly lower for those
reporting a pain score of ≤5 at PACU admission (M=43.4; Mdn=43.0; U=9323.0, p =
0.039). The comparisons of average subsequent TrCO2 readings by binary pain score in
PACU at 30 and 60 minutes were not significantly different.
The average of subsequent TrCO2 readings was significantly correlated with
opioid administration of low doses after 60 minutes. Also, there was a weak, positive
correlation, r = 0.107, n = 412, p = 0.030. The average of subsequent TrCO2 readings was
also significantly correlated with pain score at admission and at 30 minutes. Both pain
score results were weak, positive correlations: admission: r = 0.116, n = 391, p = 0.022
and 30 minutes: r = 0.101, n = 383, p = 0.049.
The time in Phase I did not differ by whether TrCO2 readings decreased. The time
in Phase I was not correlated with either initial TrCO2 readings or the average of
subsequent readings.

CARBON DIOXIDE MONITORING IN RECOVERY 76
Table 13
TrCO2 Subset: Average of Subsequent Readings by Pain Score (N = 412)
Pain Score 0-5
Pain Score 6- 10
n = 194
n = 112
Difference
Variable Mean SD Mean SD Mean U
p-
value
Average of Subsequent TrCO2
Readings 42.4 6.8
43.4 6.9
1.0 9323.0
0.039 †
Pain Score 0
- 5
Pain Score
6 - 10
Difference
Variable n % n % %
Chi-
square df
p-
value
Change from Initial to Average of
Subsequent TrCO2 Readings
3.825 1 0.050
≥ 5% Decrease 13 6.7
15 13.4
6.7
No Change 181 93.3 97 86.6 -7
† Mann-Whitney U Test
Results for Research Questions
Patient safety was a focus of this study. Patient safety variables included
respiratory rate, mean blood pressure, heart rate, oxygen saturation, pain score, Aldrete
score and RASS score. The two research questions addressed patient safety variables in
the following ways.
Research Question 1: Are there postoperative differences in trends of safety
variables for patients who were monitored with transcutaneous capnography
compared to those that received standard monitoring?
With the exception of ASA, demographics and clinical variables were equivalent
between study groups. The majority of patients in the sample were female and obese.
Noteworthy is that the ASA scores, which is the expected scoring of the patients by the
anesthesiology team preoperatively to provide potential risk identification, were

CARBON DIOXIDE MONITORING IN RECOVERY 77
frequently missing in both groups. When the missing data was excluded, ASA remained
significantly different between the study groups
Patients were categorized by the divisions their surgery was performed which
provided six categories. These categories did not differ statistically by study group.
Time in Phase I was noted to be statistically significant as shorter stays were
found in the TrCO2 study group both as continuous measurements and as binary.
Categorical times were applied in minutes as well and were still found to be significant.
Overall administration of opioids was less for the TrCO2 study group versus the control
group. Also, fewer opioids were administered to the TrCO2 study group particularly in
later time frames and among low dosing. It was noted the control group had more
opportunities for opioids to be administered due to their longer timeframe in Phase I
recovery.
Although there was no statistical difference in the overall sample population, the
results of the patient safety variables over time show significant initial baseline
differences between the control and TrCO2 study group in several categories. The pain
scores were worse (higher) among the TrCO2 study group as compared to the control
group and worsened over time. The RASS score was notably more improved (higher).
The percent of change noted over time (target change) was incorporated to assess
the degree the subjects had a change from their own baselines for each metric as an
indicator of improvement or worsening of variables. Further consistency in the
juxtaposition of pain and Aldrete/RASS was noted. Again, the TrCO2 study group may
improve patient management via Aldrete/RASS, but pain becomes more pronounced.

CARBON DIOXIDE MONITORING IN RECOVERY 78
The trends of TrCO2 were reviewed using a reference point for a normal CO2
range of 35-45 mm Hg. Initial readings were compared to subsequent readings to show
directional improvement in TrCO2. A level of 5% decrease was used to analyze. There
were very few TrCO2 study group participants who had a decrease of >5% from initial
CO2 reading to their subsequent CO2 readings. It was noted that 6.1% had a 5% or more
decrease in change from their first reading versus their subsequent maximum. Also, there
were 9.0% of the participants who had a 5% or more decrease in change from their first
reading versus their subsequent average.
Most notably, average of subsequent TrCO2 readings were lower among patients
with low pain score (<5) at admission. However, the pain score accompanied with the
opioid difference might offer consideration as to whether readings of TrCO2 as a means
to detect patients who do (or don't) require pain management (even if this initial group of
nurses were less familiar with TrCO2's application in the PACU.
Research Question 2: How do patient complication trends relate to the
capnography trends and other safety variable trends in recovery room patients?
To answer this research question, administration of naloxone was examined.
Naloxone administrations were pulled from the patients’ electronic records during the
same recovery room time frame (admission and 30- and 60-minutes after admission). Of
the 816 participants, there were only two doses of naloxone administered, and both were
administered to the same patient. That patient was in the control group. Therefore, there
were no trends that could be examined in complication trends.

CARBON DIOXIDE MONITORING IN RECOVERY 79
Summary
This chapter reported the findings from this study. This complex evaluation
compared patient variables that were monitored with transcutaneous capnography as
compared to variables from patients who received standard monitoring.

CARBON DIOXIDE MONITORING IN RECOVERY 80
CHAPTER 5:
DISCUSSION
The purpose of this retrospective quasi-experimental study was to generate
baseline data to trend patient safety variables and outcomes post-operatively.
Transcutaneous CO2 levels were assessed for the effects of transcutaneous capnography
monitoring on detection of carbon dioxide levels in recovery room patients. Trends in
data on 816 subjects were obtained retrospectively from an extant database. The
summary of the study’s objectives and results are discussed, as well as the limitations and
implications for nursing practice and future research.
Summary of Objectives
This study had two objectives. The first was to compare patients on
transcutaneous capnography with patients receiving standard post-surgical monitoring to
determine if there was a difference in postoperative safety variable trends and outcomes.
The second objective was to compare postoperative complications of patients monitored
with transcutaneous capnography with patients receiving standard monitoring. The final
sample consisted of 816 patients (control group = 397; TrCO2 study group = 419). Trends
in the identified safety variables were tracked over time (admission to recover, 30 and 60
minutes after admission) to provide comparative data.
Summary of Results
The TrCO2 study group monitored with transcutaneous capnography showed a
shorter length of stay in the recovery room. The time in Phase I as a continuous variable
was significantly shorter among the TrCO2 study group (M=128.4 minutes) compared to
the control group (M=151.1 minutes). The TrCO2 study group participants (51.2%) were

CARBON DIOXIDE MONITORING IN RECOVERY 81
more likely to have had a Time in Phase I of less than 120 minutes as compared to the
control group (34.8%). Overall opioid administration, combined across all times and
doses, was significantly lower among the TrCO2 study group compared to the control
group. The total dose of opioids overall for the control group was 2.59 administered
doses compared to 1.92 doses administered in the TrCO2 study group. Unfortunately, the
TrCO2 study group was less likely to achieve a target pain score of ≤5 at 30 minutes and
60 minutes after admission.
When comparing the percent of change noted over time (target change) from
baseline metrics as an indicator of improvement or worsening of a variable, the TrCO2
study group was more likely to decrease heart rate by at least 20% from admission to 60
minutes. Also, the TrCO2 study group was more likely to increase both their Aldrete
score and RASS scores by at least 1 point from admission to 30 minutes and admission to
60 minutes. Both the Aldrete and the RASS scores demonstrated the patient’s increasing
level of consciousness and their return to baseline level of awareness sooner than the
control group. Although the subjective pain scores of the patients were above the control
at 30 and 60 minutes from admission, the delicate balance between pain control and
sedation levels is showcased. The balance of potentially administering less opioid to
allow for the patient to wake up faster and breathe deeper can be tenuous. The quicker a
patient returns to their baseline, the shorter their potential stay in the recovery room.
Patients must demonstrate they are awake enough to breathe effectively and deeply on
their own.
Typical length of stay for patients to recover from the effects of anesthesia in this
study was approximately 1 ½ to 2 hours which is within expected parameters. Early

CARBON DIOXIDE MONITORING IN RECOVERY 82
release from recovery could have cost saving benefits related to the expedited safe care
administered. The patients in this study who did not have the additional monitoring of
capnography had an overall increase in both opioid administration and stay in recovery.
Patients who receive higher doses of opioids tend to remain more sedated for longer
periods of time. The combination of sedation from opioids and anesthesia can enhance
sedation prolonging the patient’s stay in recovery and potentially increasing the costs of
care.
Fear of respiratory depression can be a barrier to effective pain management with
opioids. It is unrealistic to think patients will be pain free after surgery. Pain score levels
of 5 or less are the goal for recovery room management. Clinically significant respiratory
depression may be prevented by identification of high-risk patients, individualizing their
analgesic regimes, and close monitoring of their respiratory and sedation status. There are
many processes hospitals can implement to enhance patient safety (Pasero, 2014).
Respiratory depression is rare but can be life threatening complication of opioid use.
Perhaps utilizing transcutaneous capnography provided improved management of opioids
which could help speed up the level of consciousness (RASS) but inadvertently
heightened awareness of pain.
Potential complications associated with respiratory complications include the use
of naloxone to reverse the opioid effects. More serious would be the need for reintubation
of the patient to protect their airway and artificially assist in their ventilation. Patients
who require ventilatory support require intensive care unit monitoring until they are
extubated from their breathing support. Intensive care unit level of care is significantly

CARBON DIOXIDE MONITORING IN RECOVERY 83
more costly than floor care. Also, there is an associated increased length of overall stay
by days for patients who require ventilatory support.
Findings as Applied to General Systems Theory
The conceptual framework of general systems theory (GST) provided the
structure for this study and directly supported the efforts of patient safety in the
healthcare environment. As patients enter the recovery room after surgery, the nurses
provided ongoing assessment of stability. The goal was for the patient to rapidly recover
from the potential effects of anesthesia while providing early identification and
immediate treatment of any change in status caused by either anesthesia or the surgery
before the patients deteriorate (Vimlati et al., 2009).
Monitoring of postoperative patient safety variables for changes and intervening
when appropriate in the feedback loop was similar to the GST model. Identifying and
understanding the components of which safety variables in the recovery room had a
significant impact offered an opportunity to improve patient outcomes with early
interventions. Immediate and ongoing trends of capnography provided real-time
opportunity for information regarding the patient’s respiratory status. If a patient’s
respiratory status was noted to be compromised through the feedback of trending, staff
could intervene early by lowering opioid doses if applicable to prevent further sedation.
Using this framework allowed for the consideration of internal and external
factors impacting a patient’s postoperative course, ongoing assessment of standard
monitoring, interventions employed and reassessment based on feedback loop and
outcomes. Also noted was the feedback from the electronic medical records
documentation was a definite limitation. The inability to locate and retrieve certain data

CARBON DIOXIDE MONITORING IN RECOVERY 84
points demonstrated a failure. Input from a variety of locations in the system were not
succinctly working together to allow for an accurate analysis of the research questions.
Limitations
The results were generalizable to the sample normally seen in recovery rooms.
Inclusion criteria were broad to offer the opportunity to be able to generalize to most
populations presenting. A potential weakness of the study was the use of a retrospective
quasi-experimental design which is not as strong as other designs, such as randomized
controlled trials. Capnography monitoring is considered instrumental in assessing
ventilatory status in patients, transcutaneous capnography is not as frequently performed
primarily related to the cost of the equipment and supplies. A retrospective design was
performed to generate baseline data on trends in patient safety variables to assess for
significant trends in the variables. It would be beneficial to develop risk assessment tools
to identify patients preoperatively that may be at greater risk of respiratory compromise
post operatively.
The use of the electronic medical record was strength and a limitation.
Documentation was sometimes missing, specifically when timed variables should have
been entered, or in some cases, this was provided in another section of the patient’s
record where providers had not expected it to be located. Many electronic patient files
were missing Aldrete variables at exactly the 30 minute time frame. Aldrete scores
documented either immediately before or after the time frame were used in this study.
Accuracy of documentation cannot be addressed.
Patient vital signs automatically download into the computerized documentation
system eliminating the potential of staff being distracted from documenting at specific

CARBON DIOXIDE MONITORING IN RECOVERY 85
times. The logistics of the transcutaneous monitor did not allow for automatic download
of the transcutaneous readings. Although vital signs are automatically downloaded, the
transcutaneous levels were not. Transcutaneous levels were manually entered by staff
into the electronic documentation system. Although this was additional work, the staff
were able to accommodate this activity easily. Also, staff verbalized ease in the manual
documentation required. In the future, purchasing the additional hardware required to
allow the automatic capturing of this variable would allow for easy download into
documentation.
Another noted variable not easily found in documentation was the ASA score
provided by the anesthesia attending staff. Even with the large number of missing scores
from both groups, this variable remained significantly different between groups even
when missing data were excluded. There is a possibility that the data retrieved from the
extant database could not find the location in the electronic medical records where the
score was documented, if indeed it was documented. Opportunities exist to ensure the
ASA score is performed and documented in one location within the hospital’s
documentation system. This will promote consistency so that all team members will have
access for review.
A significant limitation in identifying patient complications was searching the
documentation system for record of naloxone administration and reintubations of
patients. The search for naloxone administration was limited to the same time frame as
the patient’s stay in the recovery room. However, it is recognized that naloxone is
sometimes administered by anesthesia immediately before the patient’s admission into
recovery and upon their discharge of the patient to the inpatient division. Future studies

CARBON DIOXIDE MONITORING IN RECOVERY 86
would be strengthened with a prospective randomized trial where complications would be
captured when they occur as opposed to a retrospective data pull which is showing
inconsistent practices in the location of documentation specifics.
Limitations of the transcutaneous monitor itself include the possibility of
electrical drifts of the signal, the requirements of regular maintenance, the need to change
the electrode membrane, and risk of thermal burns. These limitations are overcome with
training staff to calibrate the equipment, change the electrode, and ensure the electrode is
removed after two hours of use.
The cost of the monitor itself is over approximately $20,000.00. This charge does
not include the consumable items required for use. The calibration gas lasts
approximately three to four months. The canister contains enough CO2 to complete 180
calibrations. The membrane kit contains 12 membranes per kit. The membrane needs to
be changed once a month so the kit typically lasts 1 year. The fixation rings contains 60
adhesive rings and the bottle of contact solution for patient application. Normal use is one
ring per patient. The sensor itself is a permanent piece of equipment. The membrane
piece of the electrode is what requires changed.
Based on the above usage the daily cost of use is approximately $8.45. The daily
cost was calculated on a single patient per day. If the monitor were ran on multiple
patients per day the cost would increase by $3.68 per additional patient for the single use
fixation rings. The cost of three patients per day would be $15.81. Staff found the
monitors to be user-friendly. Set up was not complicated or time-consuming. Patients
were not bothered with the electrode. The comfort in using an electrode was greater
accepted than patients who had to utilize awkward masks for oxygen. Patients were not

CARBON DIOXIDE MONITORING IN RECOVERY 87
limited in mobility in the bed from the electrode. Most did not realize it was even on as it
is light weight.
Implications for Nursing Practice
Standard of care requires that pain documentation should occur upon admission
into the unit, with the administration of opioids, and 30 minutes after opioid
administration to assess the outcome of dose. Many charts were missing repeat pain score
assessments and simply commented on the patient “being asleep.” Thus, opportunities
exist to improve practice to the recommended standard of care. In 2001, The Joint
Commission implemented standards specifically addressing documentation and
assessment of pain. Assessment and reassessment were incorporated into the required
standards (Gordon et al., 2008). Education regarding policy guidelines in pain assessment
could be provided to staff. Routine documentation audits could assess compliance with
documentation guidelines and ongoing sustainment. There is a need to establish one
consistent location to document ASA scores and naloxone administration to allow for
easier retrieval.
Findings indicated that there is an opportunity to develop a predictive risk model
that could be used preoperatively to prevent events. With a risk assessment model, there
are several quality improvement initiatives that could be implemented. Patients with a
known history of over-sedation could be identified before admission into recovery. There
could be a separate protocol to increase monitoring for patients with risk factors that may
cause over-sedation. This could include recommendations for health care providers to use
adjunctive opioid sparing non-sedation medications. Utilizing risk assessment protocols
could allow for ongoing priority to patient safety initiatives.

CARBON DIOXIDE MONITORING IN RECOVERY 88
Future Research
Future studies include randomization of patients to strengthen the outcome for
cause and effect. Coding the types of surgery may help to identify procedures that would
be important for the recovery room to focus attention towards. Also, the length of surgery
and type of anesthesia could be captured to assess the contribution of variables on patient
outcomes. With a prospective approach, variables which were difficult to track
retrospectively such as ASA scores, naloxone administrations, intubation rates, could be
better accounted for in the process. Also, recognizing the study groups had statistically
significance differences in their safety variables at baseline measurement, a randomized
study could also better assess variables which may have been unaccounted for in a
retrospective approach.
There is an opportunity to explore the financial implications associated with
prevention of respiratory events by avoidance of intensive care unit stay and increased
days hospitalized from an untoward event. As it was noted in the TrCO2 study group that
length of time in the recovery room was significantly less than the control group,
associated costs savings could be reviewed for the shorter time frame required.
Patients with multiple case encounters for surgery were distinguished clinically
from the rest of the sample. Retaining the data from this subgroup provides an
opportunity to explore how patients with a repeat surgery trends at a later date. The
opportunity to assess if this group is significantly different in their trending of safety
variables than the group of patients with one encounter exists. It could be interesting to
assess how a multimodal pain approach preoperatively can impact outcomes on patients.

CARBON DIOXIDE MONITORING IN RECOVERY 89
Conclusions
Adequacy of postoperative pain control is a factor in determining when a patient
can be safely discharged from the recovery room. Using opioids may cause respiratory
depression which may be inconsequential most of the time but becomes significant with
some patients. It would seem logical that there is clinical benefit to reducing the number
of opioids administered to patients after surgery for both reduced sedation potential and a
decreased length of stay in the recovery room.
Knowing that systematic assessment of respiratory status and sedation levels
should be conducted on all patients who receive opioids. Capnography monitoring may
improve confidence in assessing whether opioid doses can be safely administered to more
effectively manage postoperative pain. Transcutaneous carbon dioxide monitoring is an
easy and sensitive monitor of respiratory depression. Although controlling postoperative
pain is an important goal, patient safety must not be compromised. It is a balance
between administration and ongoing patient assessment. Various technologies exist that
are both invasive and noninvasive. Different clinical scenarios may require the
combination of different techniques. The use of capnography offers a reliable trend as an
early indication of changes in a patient’s respiratory status in the recovery room.

CARBON DIOXIDE MONITORING IN RECOVERY 90
References
Agency for Healthcare Research and Quality. (2011). National Healthcare Quality
Report. U.S. Department of Health and Human Services. Retrieved from
https://archive.ahrq.gov/research/findings/nhqrdr/nhqr11/nhqr11.pdf
Agency for Healthcare Research and Quality. (2014). 2014 National Healthcare Quality
and Disparities Report. U.S. Department of Health and Human Services. Retrieved https://www.ahrq.gov/sites/default/files/wysiwyg/research/findings/nhqrdr/nhqdr
14/2014nhqdr.pdf American Society of Anesthesiologists Task Force on Sedation and Analgesia by Non
Anesthesiologists. (2002). Practice guidelines for sedation and analgesia by non-
anesthesiologists. Anesthesiology, 96(4), 1004-1017.
Barash, P., Cullen, B., & Stoelting, R. (2006). Clinical anesthesia. Philadelphia, PA:
Lippincott, Williams and Wilkins.
Barker, S., Tremper, K., & Gamel, D. (1986). A clinical comparison of transcutaneous
PO2 and pulse oximetry in the operating room. Anesthesia & Analgesia, 65, 805-808.
Bendjelid, K., Schutz, N., Stotz, M., Gerard, I., Suter, P., & Romand, J. (2005).
Transcutaneous PCO2 monitoring in critically ill adults; Clinical evaluation of a new
sensor. Critical Care Medicine, 33(10), 2203-2206.
Berkenbosch, J., Lam, J., Burd, R., & Tobias, J. (2001). Noninvasive monitoring of
carbon dioxide during mechanical ventilation in older children: End-tidal versus
transcutaneous techniques. Anesthesia & Analgesia, 92, 1427-1431.
Beyan, A.C., Cirak, A.K., Varol, Y., & Ucar, Z.Z. (2015). Comparison of partial pressure
of carbon dioxide in arterial blood and transcutaneous carbon dioxide monitorization

CARBON DIOXIDE MONITORING IN RECOVERY 91
in patients with obstructive sleep apnea and sleep related hypoventilation/hypoxemia
syndromes. Journal of Turkish Sleep Medicine, 3, 53-58.
Chakravarthy, M., Narayan, S., Govindarajan, R., Jawali, V., & Rajeev, S. (2010).
Weaning mechanical ventilation after off-pump coronary artery bypass graft
procedures directed by noninvasive gas measurements. Journal of Cardiothoracic
and Vascular Anesthesia, 24(3), 451-455.
Chhajed, P., Rajasekaran, R., Kaegi, B., Chhajed, E., Pflimlin, E., Leuppi, J., & Tamm,
M. (2006). Measurement of combined oximetry and cutaneous capnography during
flexible bronchoscopy. European Respiratory Journal, 28(2), 386-390.
Clancy, C.M., Farqubar, M.B., & Sharp, B.C. (July-Sept 2005). Patient safety in nursing
practice. Journal of Nursing Care Quality, 20, 193-197.
Coates, B., Chaize, R., Goodman, D., & Rozenfeld, R. (2014). Performance of
capnometry in non-intubated infants in pediatric intensive care unit. BioMedical
Central Pediatrics 14, 163, 1-6.
Cullen, D., Nemeskal, R., Cooper, J., Zaslavsky, A., & Dwyer, M. (1992). Effect of pulse
oximetry, age, and ASA physical status on the frequency of patients admitted
unexpectedly to a postoperative intensive care unit and the severity of their
anesthesia related complications. Anesthesia Analogs, 74, 181-188.
Davis, G. (2011). Cutaneous capnography in the PACU: Immediate assessment of
respiratory status emerging from anesthesia. Journal of Perianesthesia Nursing,
26(3), 185.
D’Arcy, Y. (2010). Managing chronic pain in acute care; get it right. Nursing 2010,
40(4), 48-51.

CARBON DIOXIDE MONITORING IN RECOVERY 92
De Oliveira, G.S., Ahamad, S., Fitzgerald, P.C., & McCarthy, R.J. (2010). Detection of
hypoventilation during deep sedation in patients undergoing ambulatory
gynecological hysteroscopy: A comparison between transcutaneous and nasal end-
tidal carbon dioxide measurements. British Journal of Anaesthesia, 104(6), 774-778.
Dreher, M., Ekkernkamp, E., Storre, J., & Kabitz, H. (2010). Sedation during flexible
bronchoscopy in patients with pre-existing respiratory failure: Midazolam versus
midazolam plus alfentanil. Respiration, 79, 307-314.
Duncan, D. (1972). James G. Miller’s living systems theory: Issue for management
thought and practice. Academy of Management Journal, 15(4), 513-523.
Drysdale, D. (2014) Transcutaneous carbon dioxide monitoring: Literature review.
Journal of Oral Health and Dental Management, 13(2), 453-457.
Ead, H. (2006). From Aldrete to PADSS: Reviewing discharge criteria after ambulatory
surgery. Journal of Perianesthesia Nursing, 21(4), 259-267.
Eberhard, P. (2007). The design, use, and results of transcutaneous carbon dioxide
analysis: Current and future directions. International Anesthesia Research Society,
105(6), D48-S52.
Eckstrand, J., Habib, A., Williamson, A., Horvath, M., Gattis, K., Cozart, H., & Ferranti,
J. (2009). Computerized surveillance of opioid-related adverse drug events in
perioperative care: A cross-sectional study. Patient Safety in Surgery, 3(18), 1-7.
Fanelli, G., Baciarello, M., Squicciarini, G., Malagutti, G., Zasa, M., & Casati, A. (2008).
Transcutaneous carbon dioxide monitoring in spontaneously breathing, nonintubated
patients in the early postoperative period. Minerva Anesthesiology, 74, 375-380.

CARBON DIOXIDE MONITORING IN RECOVERY 93
Fecho, K., Joyner, L., & Pfeiffer, D. (2008). Opioids and code blue emergencies.
Anesthesiology, 109, 34.
Frankel, A., Gandhi, T. K., & Bates, D. W. (2003). Improving patient safety across a
large integrated health care delivery system. International Journal for Quality in
Health Care, 15(Supplement 1), i31-i40.
Fu, E., Downs, J., Schweiger, J., Miguel, R., & Smith, R. (2004). Supplemental oxygen
impairs detection of hypoventilation by pulse oximetry. Chest, 126, 1552-1558.
Glossop, A., Shepherd, N., Bryden, D., & Mills, G. (2012). Non-invasive ventilation for
weaning, avoiding reintubation after extubation and in the postoperative period: A
meta-analysis. British Journal of Anaesthesia, 109(3), 305-314.
Gordon, D., & Pellino, T. (2005). Incidence and characteristics of naloxone use in
postoperativepain management: A critical examination of naloxone use as a potential
quality measure. Pain Management, 6(1), 30-36.
Gordon, D., Rees, S., McCausland, M., Pellino, T., Sanford-Ring, S., Smith–
Helmenstine, J., & Danis, D., (2008). Improving reassessment and documentation of
pain management. The Joint Commission on Quality and Patient Safety, 34(9), 509-
517.
Gray, W., Duhl, F., & Rizzo, N. (1969). General systems theory and psychiatry (1st ed.).
Boston, MA: Little, Brown and Company.
Green, S.M., & Pershad, J. (2010, March). Should capnographic monitoring be standard
practice during emergency department procedural sedation and analgesia? Pro and
con. Annals of Emergency Medicine, 55(3), 265-267.

CARBON DIOXIDE MONITORING IN RECOVERY 94
Greensmith, J., & Aker, J. (1998). Ventilatory management in the postanesthesia care
unit. Journal of Perianesthesia Nursing, 13(6), 370-381.
Griffin, J., Terry, B., Burton, R., Ray, T., Keller, B., Landrum, A., & Tobias, J. (2003).
Comparison of end-tidal and transcutaneous measures of carbon dioxide during
general anesthesia in severely obese adults. British Journal of Anaesthesia, 91(4),
498-501.
Huttmann, S., Windisch, W., & Storre, J. (2014). Techniques for the measurement and
monitoring of carbon dioxide in the blood. Annals American Thoracic Society, 11(4),
645-652.
Institute of Medicine. (2001). Crossing the quality chasm: A new health system for the
21st century. Washington, DC: The National Academies Press.
Jaffe, M. (2002). Mainstream or sidestream? (White Paper). Retrieved from
www.respironics.com.
Kaneko, Y. (1996). Clinical perspectives on capnography during sedation and general
anesthesia in dentistry. Anesthesia Progress, 42, 126-130.
Kast, F., & Rosenzweig, J. (1972). General systems theory. The Academy of Management
Journal, 15(4), 447-463.
Kasuya, Y., Akca, O., Sessler, D., & Komatsu, R. (2009). Accuracy of postoperative end-
tidal PCO2 measurements with mainstream and sidestream capnography in non-
obese patients and in obese patients with and without obstructive sleep apnea.
Anesthesiology, 111, 609-615.
Kirk, V., Batuyong, E., & Bohn, S. (2006). Transcutaneous carbon dioxide monitoring
and capnography during pediatric polysomnography. Sleep, 29(12), 1601-1608.

CARBON DIOXIDE MONITORING IN RECOVERY 95
Koniaris, L., Wilson, S., Durgas, G., & Simmons, W. (2003). Capnographic monitoring
of ventilatory status during moderate (conscious) sedation. Surgery Endoscopy, 17,
1261- 1265.
Kopka, A., Wallace, E., Reilly, G., & Binning, A. (2007). Observational study of
perioperative PtcCO2 and Spo2 in non-ventilated patients receiving epidural infusion
or patient-controlled analgesia using a single earlobe monitor (TOSCA). British
Journal of Anaesthesia, 99, 567-571.
Lim, B., & Kelly, A. (2010). How useful is transcutaneous carbon dioxide monitoring in
adult emergency department. Journal of Emergency Medicine, 17(1), 82-84.
McCarter, T., Shaik, Z., Scarfo, K., & Thompson, L. (2008). Capnography monitoring
enhances safety of postoperative patient-controlled analgesia. Retrieved from
www.AHDBonline.com
McKee, M., & Healy, M. (2002). Hospitals in a changing Europe. Buckingham, PA:
Open University Press.
Oshibuchi, M., Cho, S., Hara, T., Tomiyasu, S., Makita, T., & Sumikawa, K. (2003). A
comparative evaluation of transcutaneous and end-tidal measurement of CO2 in
thoracic anesthesia. Anesthesia & Analgesia, 97, 776-779.
Pasero, C. (2009). Assessment of sedation during opioid administration for pain
management. Journal of Perianesthesia Nursing, 24(3), 186-190.
Pasero, C. (2014). One size does not fit all: Opioid dose range orders. Journal of
Perianesthesia Nursing, 29(3), 246-252.

CARBON DIOXIDE MONITORING IN RECOVERY 96
Paton, K., Sengupta, S., & Hassan, L. (2005). Settings, systems and organization
development: The healthy living and working model. Health Promotion
International, 20(1), 81-89.
Pavlin, P., Chen, C., Penaloza, D., Polissar, N., & Buckley, F. (2002). Pain as a factor
complicating recovery and discharge after ambulatory surgery. Ambulatory
Anesthesia, 95, 627-34.
Reid, C., Marineau, R., Miller, D., Hull, K., Baines, J., & Sullivan, P. (1992). A
comparison of transcutaneous, end-tidal and arterial measurements of carbon dioxide
during general anesthesia. Canadian Journal of Anaesthesia, 39(1), 31-36.
Rose, D.K. (1996). Recovery room problems or problems in PACU. Canadian Journal of
Anaesthesia, 43(5), R116-R122.
Seymour, C., Martinez, A., Christie, J., & Fuchs, B. (2004). The outcome of extubation
failure in a community hospital intensive care unit: a cohort study. Critical Care,
8(5), R322-R327.
Sheahan, C.G., & Mathews, D.M. (2014). Monitoring and delivery of sedation. British
Journal of Anesthesia, 113(S2), ii32-ii42.
Staroverov, D., & Ismailova, F. (2009). Recovery room: Safety island in the operating
theatre. Medical Journal of Zambia, 36(3), 132-135.
Stein, N., Matz, H., Schneeweib, A., Eckmann, C., Roth-Isigkeit, A., Huppe, M., &
Gehring, H. (2006). An evaluation of transcutaneous and an end-tidal capnometer for
noninvasive monitoring of spontaneously breathing patients. Respiratory Care,
51(10), 1162-1166.

CARBON DIOXIDE MONITORING IN RECOVERY 97
Storre, J., Steurer, B., Kabitz, H., Dreher, M., & Windisch, W. (2007). Transcutaneous
PCO2 monitoring during initiation of noninvasive ventilation. Chest, 132(6), 1810-
1816.
Taylor, S., Kirton, O. C., Staff, I., & Kozol, R.A. (2005). Postoperative day one: A high
risk period for respiratory events. The American Journal of Surgery, 190, 752-756.
Tobias, J., & Meyer, D. (1997). Noninvasive monitoring of carbon dioxide during
respiratory failure in toddlers and infants; End-tidal versus transcutaneous carbon
dioxide. Anesthesia & Analgesia, 85, 55-58.
Tobias, J., Wilson, W., & Meyer, D. (1999). Transcutaneous monitoring of carbon
dioxide tension after cardiothoracic surgery in infants and children. Anesthesia &
Analgesia, 88, 531-534.
Todorova, Z.N. (2008). Clinical applications of capnography. Signa Vitae, 3 Suppl, S 44-
45.
Torok, S., Leuppi, J., Baty, F., Tamm, M., & Chhajed, P. (2008). Combined oximetry-
cutaneous capnography in patients assessed for long-term oxygen therapy. Chest,
133(6), 1421-1425.
Vimlati, L., Gilsanx, F., & Goldik, Z. (2009). Quality and safety guidelines of post-
anesthesia care. European Journal of Anesthesiology, 26(9), 715-721.
Von Bertalanffy, L. (1968). Organismic psychology and systems theory. Barre, MA:
Clark University Press, Barre Publishing Company
Von Bertalanffy, L. (1972). The history and status of general systems theory. The
Academy of Management Journal, 15(4), 407-426.

CARBON DIOXIDE MONITORING IN RECOVERY 98
Waugh, J., Epps, C., & Khodneva, Y. (2010). Capnography enhances surveillance of
respiratory events during procedural sedation: A meta-analysis. Journal of Clinical
Anesthesia, 23(3), 189-96.
Weinberg, G. (1975). An introduction to general systems thinking (1975 ed.). New York,
NY: Dorset House Publishing, Wiley-Interscience.
Westhorpe, R., & Ball, C. (2010). The history of capnography. Anaesthsia & Intensive
Care, 38(4), 611.
Whitaker, D.K. (2011). Time for capnography - everywhere [Editorial]. Journal of the
Association of Anesthetists of Great Britain and Ireland, 66, 539-549.
Wittekamp, B., Van Mook, W., Tjan, D., & Zwaveling, J. (2009). Clinical review: Post-
extubation laryngeal edema and extubation failure in critically ill adult patients.
Critical Care, 13(6), 1-9.
Wolters, U., Wolf, T., Stutzer, H., & Schroder, T. (1996). ASA classification and
perioperative variables as predictors of postoperative outcome. British of Journal of
Anaesthesia, 77, 217-222.
Young, J. (2006). Nursing attitudes and beliefs in pain assessment and management.
Journal of Advanced Nursing, 53(4), 412-421.
Xue, Q., Wu, X., Jin, J., Yu, B., & Zheng, M. (2010). Transcutaneous carbon dioxide
monitoring accurately predicts arterial carbon dioxide partial pressure in patients
undergoing prolonged laparoscopic surgery. Anesthesia & Analgesia, 111, 417-420.