monitoring of vegetation dynamics: … · monitoring of vegetation dynamics ... leaf from stressed...
TRANSCRIPT

MONITORING OF VEGETATION MONITORING OF VEGETATION DYNAMICS: PERSPECTIVES, METHODS, DYNAMICS: PERSPECTIVES, METHODS,
AND SENSOR TECHNOLOGYAND SENSOR TECHNOLOGY
1st GMES WorkshopKyiv, 26th – 27th November 2008
Vitaliy YatsenkoSpace Research Institute of NASU and NSAU
Kyiv, [email protected]://my.elvisti.com/fond/
OUTLINE
Problems (order parameters, vegetation monitoring)Experimental spectral data
• Methods (chlorophyll, nitrogen, water, anthocyan)• Risk analysis (CVaR, crop yield forecasting)
Sensor technologies (optical spectrometers)Perspectives (aircraft hyperspectrometer, nano-sensors,
intelligence sensors)Summary

IntroductionIntroduction
• Agriculture: Supporting sustainable agriculture and combating desertification
• Strengthening observation, data sharing and prediction
• New methods to obtain various informative parameters of reflectance spectra
EXPERIMENTAL DATAEXPERIMENTAL DATA
Two kind data sets were used for estimation of chlorophyll, nitrogen, and water content in vegetation:
simulation dataexperimental data
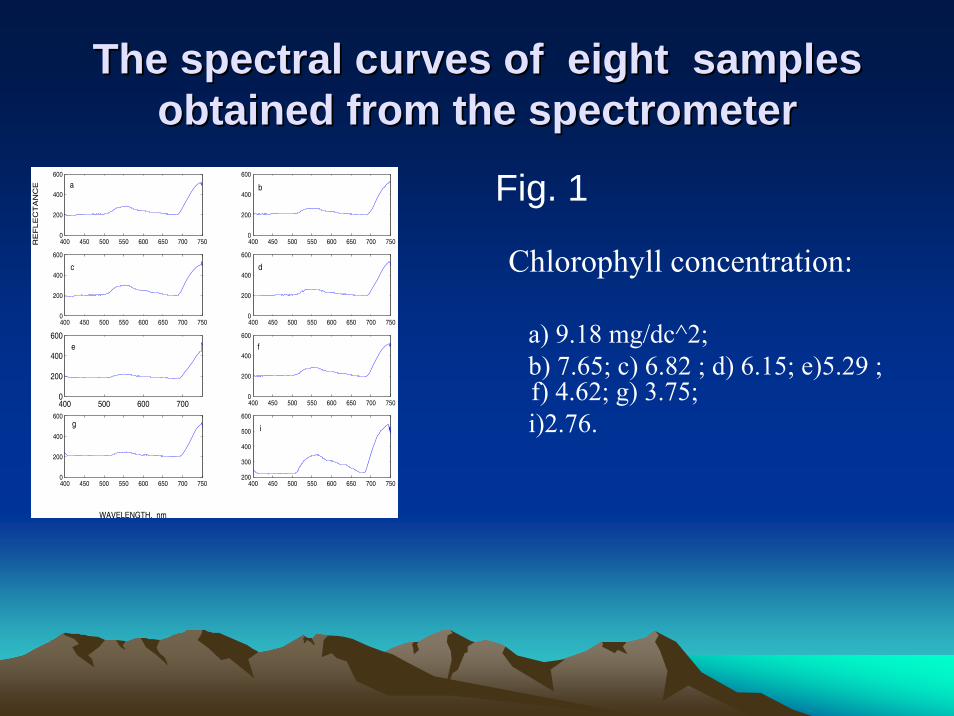
The spectral curves of eight samples The spectral curves of eight samples obtained from the spectrometerobtained from the spectrometer
400 450 500 550 600 650 700 7500
200
400
600
RE
FLE
CT
AN
CE
400 450 500 550 600 650 700 7500
200
400
600
400 450 500 550 600 650 700 7500
200
400
600
400 450 500 550 600 650 700 7500
200
400
600
400 500 600 7000
200
400
600
400 450 500 550 600 650 700 7500
200
400
600
400 450 500 550 600 650 700 7500
200
400
600
WAVELENGTH, nm
400 450 500 550 600 650 700 750200
300
400
500
600
a b
c d
e f
g i
Fig. 1
Chlorophyll concentration:
a) 9.18 mg/dc^2; b) 7.65; c) 6.82 ; d) 6.15; e)5.29 ; f) 4.62; g) 3.75;i)2.76.

Typical reflectance spectrum of winter wheat leaveTypical reflectance spectrum of winter wheat leaveunder normal and under normal and defficientdefficient mineral mineral nutrationnutration
400 450 500 550 600 650 700150
200
250
300
350
400
450
Typical Reflectance Spectrum of Winter Wheat leave under normal mineral nutrition (RP37.dat)
nm
Ref
lect
ans,
%
Indicator chlorophyll presents
400 450 500 550 600 650 700200
250
300
350
400
450
500
550
Typical Reflectance Spectrum of Winter Wheat leave under deficient mineral nutrition (RP67.dat)
nm
Ref
lect
ans,
%
Indicator chlorophyll presents
Fig. 2

Fig. 3 Here are the leaves from plants grown under various condFig. 3 Here are the leaves from plants grown under various conditionsitionsleaf from plant under optimal environment conditions. It is normleaf from plant under optimal environment conditions. It is normal green coloredal green coloredleaf from plant under nitrogen deficient conditions. It is yelloleaf from plant under nitrogen deficient conditions. It is yelloww--green coloredgreen coloredleaf from stressed plant (unfavorable ecological conditions). Itleaf from stressed plant (unfavorable ecological conditions). It is red colored, but its RS (Reflectance Spectrum) is red colored, but its RS (Reflectance Spectrum) fingerprints (see next page) allows to reveal the chlorophyll prfingerprints (see next page) allows to reveal the chlorophyll presence at the leaf. Induction fluorescence test esence at the leaf. Induction fluorescence test displays its photosynthetic activity. Therefore this leaf is alidisplays its photosynthetic activity. Therefore this leaf is aliveveleaf from stressed plant by other type of stress (leaf from stressed plant by other type of stress (technogenictechnogenic pollution)pollution)
400 450 500 550 600 650 700150
200
250
300
350
400
450
500
550
Reflectance Spectrum of the leaf from plant under optimal environment conditions (Rvv257.dat)
nm
Re
flect
an
s, %
400 450 500 550 600 650 700150
200
250
300
350
400
450
500
550
600
Reflectance Spectrum of the leaf from plant under nitrogen deficient conditions (Rvv258.dat)
nm
Re
fle
cta
ns,
%
400 450 500 550 600 650 700150
200
250
300
350
400
450
500
550
Reflectance Spectrum of the leaf from stressed plant (unfavorable ecological conditions) (Rvv259.dat)
nm
Re
fle
cta
ncs,
%
400 450 500 550 600 650 700150
200
250
300
350
400
450
500
550
600
Reflectance Spectrum of the leaf from stressed plant by other type of stress (technogenic pollution) (Rvv260.dat)
nm
Re
fle
cta
ns,
%

METHODSMETHODS
Derivative method (ratio of two maxima of the 1-st derivative from reflectance spectral curves in the region 680-750 nm)
Global optimization approachPrincipal component analysisNonlinear component analysisSynergetics approachSVM

Fig. 4. Estimation of the 1Fig. 4. Estimation of the 1--st derivative from reflectancest derivative from reflectancespectral curves using a spectral curves using a SavitzkySavitzky--GolayGolay smoothing filtersmoothing filter
680 690 700 710 720 730−1
0
1
2
3
4
5
6
7Graf of first derivative
nano−meters
first
der
ivativ
e
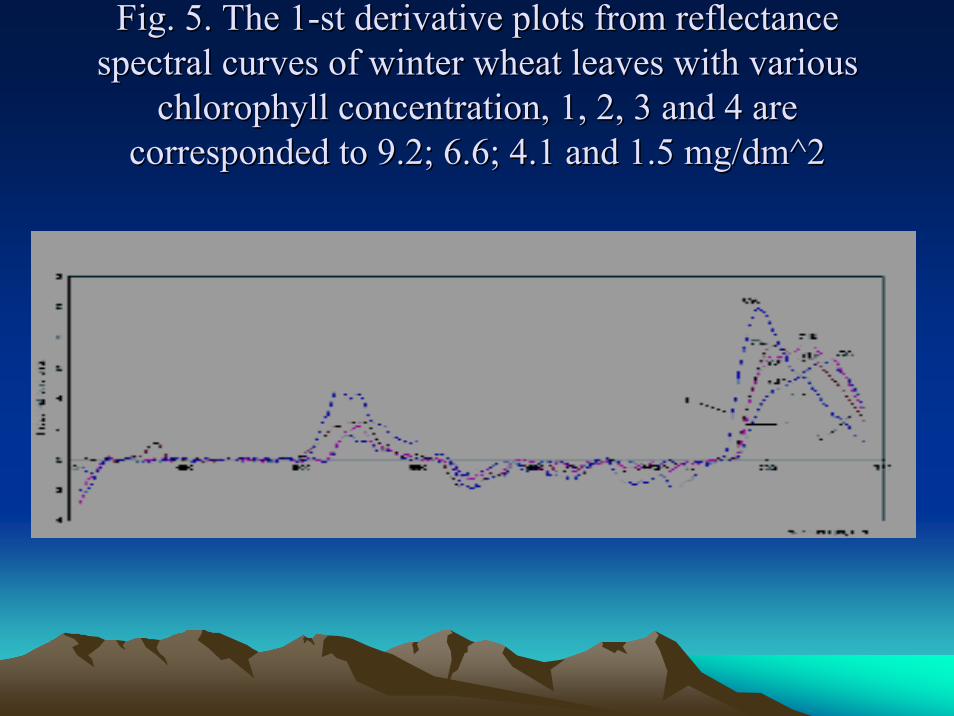
Fig. 5. The 1Fig. 5. The 1--st derivative plots from reflectance st derivative plots from reflectance spectral curves of winter wheat leaves with various spectral curves of winter wheat leaves with various
chlorophyll concentration, 1, 2, 3 and 4 are chlorophyll concentration, 1, 2, 3 and 4 are corresponded to 9.2; 6.6; 4.1 and 1.5 mg/dm^2corresponded to 9.2; 6.6; 4.1 and 1.5 mg/dm^2

0.2 0.25 0.3 0.35 0.4 0.45 0.50
2
4
6
8
10
12
y1 / y
2
Chlo
rophyll
conte
nt, m
g/d
c2
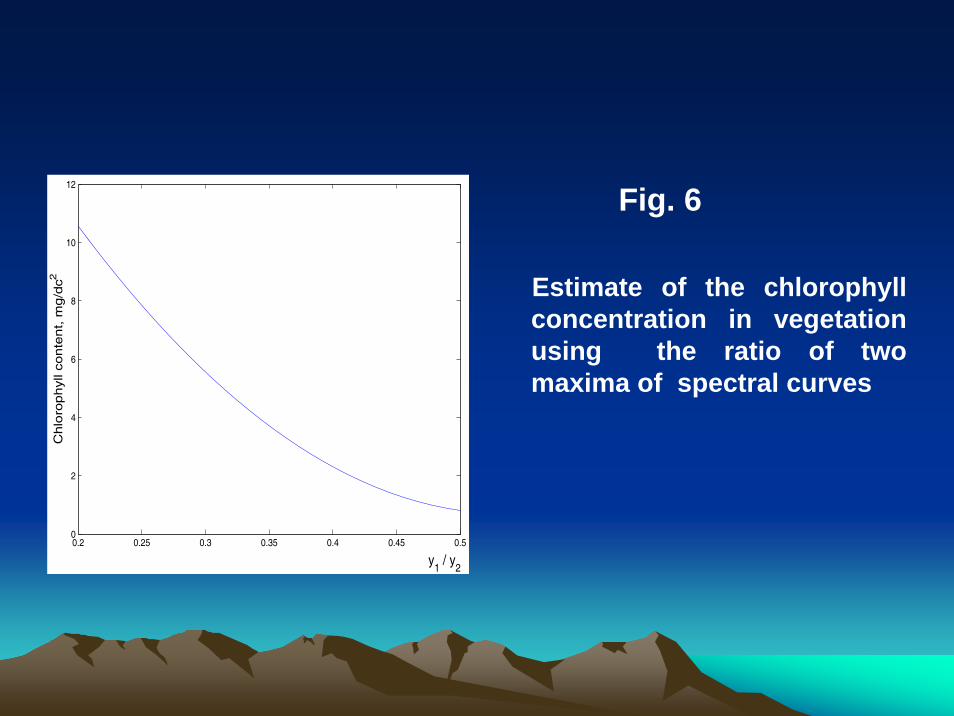
Fig. 6
Estimate of the chlorophyll concentration in vegetation using the ratio of two maxima of spectral curves
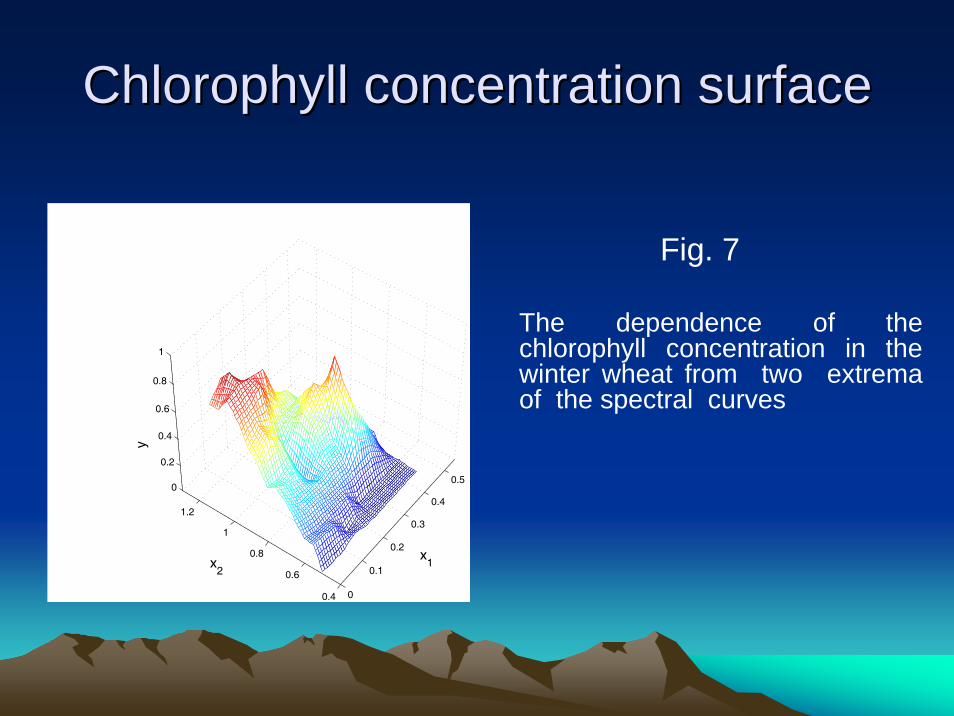
Chlorophyll concentration surfaceChlorophyll concentration surface
0
0.1
0.2
0.3
0.4
0.5
0.4
0.6
0.8
1
1.2
0
0.2
0.4
0.6
0.8
1
x1x
2
y
Fig. 7
The dependence of the chlorophyll concentration in the winter wheat from two extremaof the spectral curves
0 500 1000 1500 20000
1
2
3
4
5
6
7
8
9
10
Shape−preserving interpolantC
hlo
rophyll
conte
nt, m
g/d
c2
data 1 shape−preserving
Euclidean distance
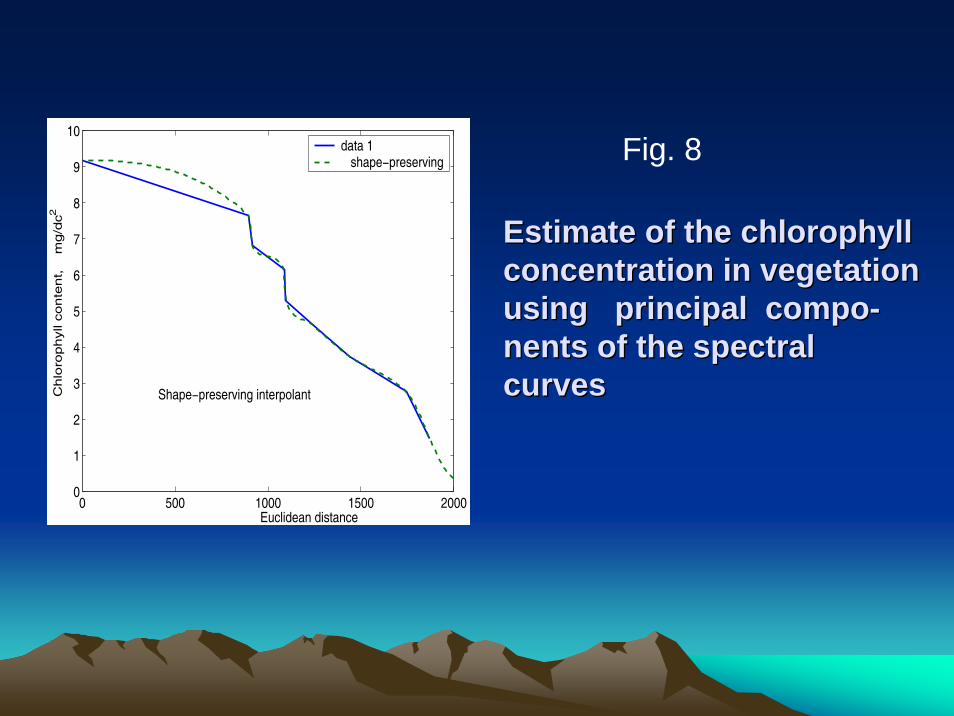
Fig. 8
Estimate of the chlorophyll Estimate of the chlorophyll concentration in vegetation concentration in vegetation using principal compousing principal compo--nentsnents of the spectral of the spectral curvescurves

Nitrogen concentration Nitrogen concentration –– Fig. 9Fig. 9

SOFTWARE
Graphical user interface
Graphical results visualization subsystem
Algorithmlibrary
Web siteWeb site
Sensors
Matlab Tools
ControlSubsystem
Database
Fig. 10

SENSOR TECHNOLOGYSENSOR TECHNOLOGY
Optical componnentsNoise compensationModeling Pre-processing

Fig. 11
•The device consists of two blocks – optical and computing.
•The optical block is a two-cannel spectrometer with high resolution, adjusted to measurements under field conditions.
•Results of measurements in a digital form are recorded on a flash card or can be transferred to the computing block for accumulation in a database.
•The device is supplied with detectors of temperature, irradianceand the GPS-receiver for determining of geographical coordinates of a site where measurements are carried out.••A developed software has two channels for processing of the datatransferred from optical block – user's (subsystem USWHL) and for scientific purpose.
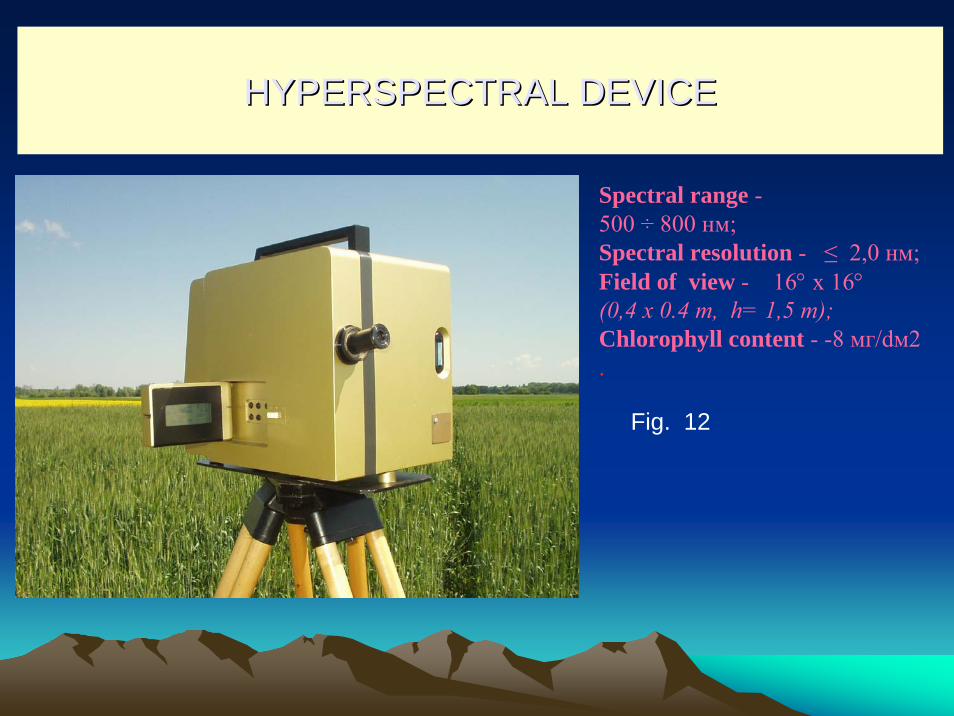
HYPERSPECTRAL DEVICEHYPERSPECTRAL DEVICE
Spectral range -500 ÷ 800 нм;Spectral resolution - ≤ 2,0 нм; Field of view - 16° х 16°(0,4 х 0.4 m, h= 1,5 m);Chlorophyll content - -8 мг/dм2.
Fig. 12

TESTINGTESTINGwww.vegetation.kiev.ua
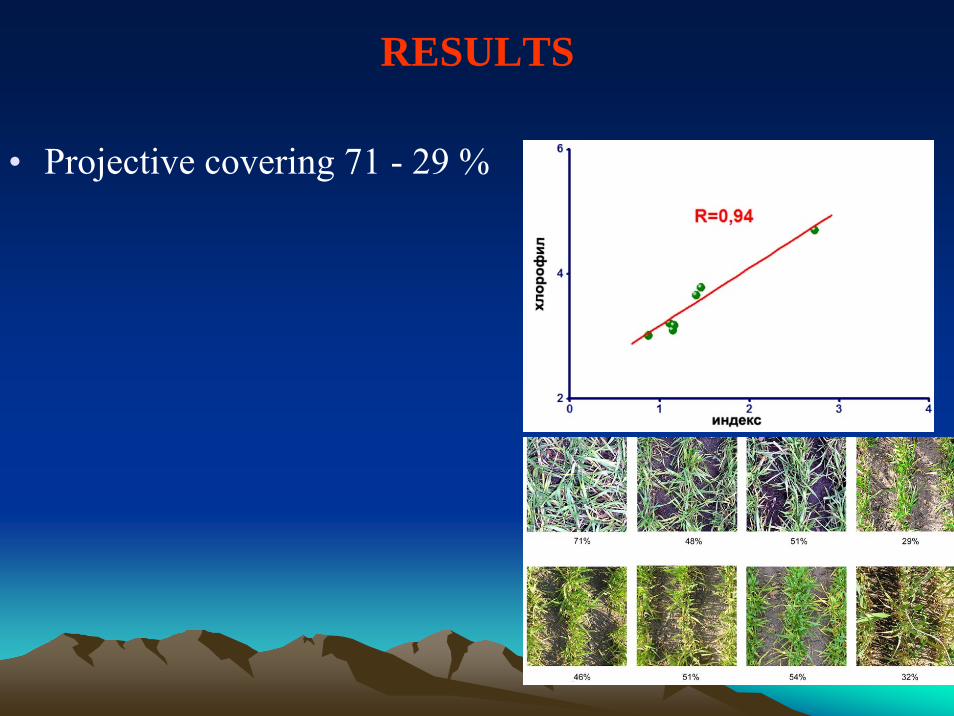
RESULTS
• Projective covering 71 - 29 %

PERSPECTIVES PERSPECTIVES
• Hyperspectral Monitoring• Calibration and Validation Technologies• Nano-sensors

IMPLEMENTATION OF HYPERSPECTRAL MONITORING
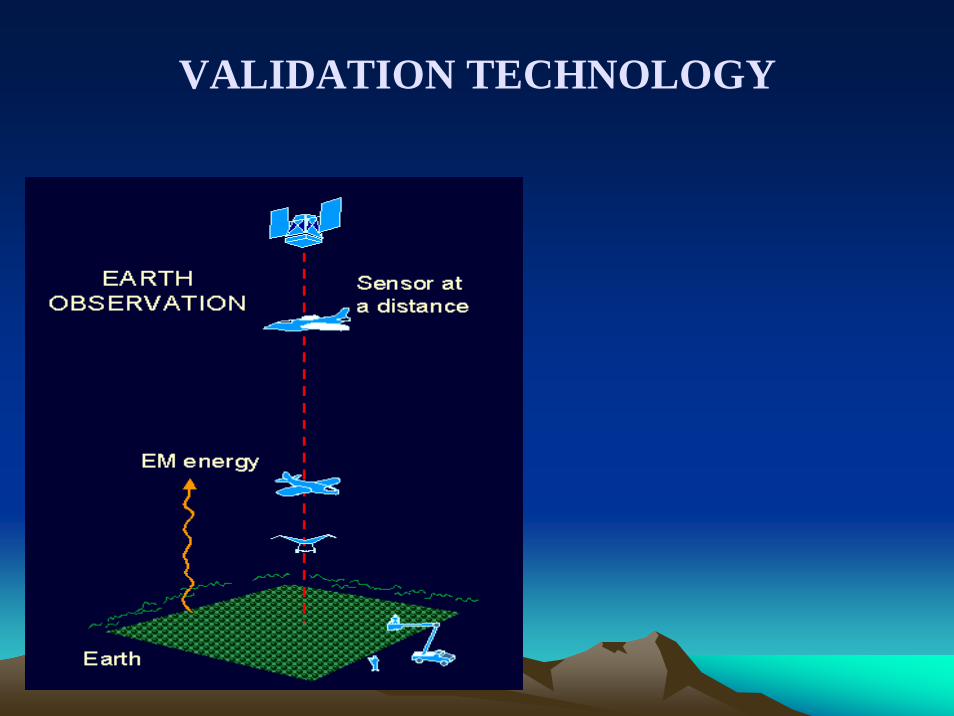
VALIDATION TECHNOLOGY

PAPERS PAPERS
• V.A.Yatsenko, S.M. Kochubey, P.M.Pardalos, L.Zhan. Estimation of chlorophyll concentration in vegetation using global optimization approach. ‘Technologies, Systems, and Architectures for Transnational Defence II’, SPIE Conference ‘AeroSence. Technologies and Systems for Defence & Security’, 21-25 April 2003, Orlando USA, Proc. of SPIE, V. 5071.
• S.M.Kochubey, V.A. Yatsenko. Monitoring system for agricultural crops on chlorophyll basis. SPIE 10th International Symposium Remote Sensing 8-12 September 2003, Barcelona, Spain, Vol. 5232-07
• Advances in Modeling Agricultural Systems. Series: Springer-Optimization and Its Applications , Vol. 25, 2008.

PROJECTS PROJECTS
• STCU Project #2416: Development of the Method and the Device for Remote Sensing of Vegetation (DRSV) (2002-2004)
• STCU project U039k: Development of the Cryogenic-Optical Sensor for the Highly Sensitive Gravity Meters (2002-2004)
• NATO project SST.GLS.975052: Information Technology for Analysisof Nuclear Objects on the Basis of Modern Mathermatical Methods(2002-2003)
• STCU project Gr.33(J): Information Technology for Analysis ofEcological Dangerous Objects on the Basis of Modern MathematicalModeling and Optimization Methods (2002-2003)
• NATO project SST.GLS.975032: Calculating Robust BayesianEstimates Using Optimization Approaches (2000-2001)STCU projects (US, EU)
• NASU projects

COLLABORATIONS COLLABORATIONS
• GMES• CEOS• SPIE• Max Plank Institute• University of Florida• Cennedy Space Center

29
GEOSS: A Global, Coordinated, Comprehensive and Sustained System of Observing Systems
GEOSS
CONCLUSIONCONCLUSION
The ratio of intensities in two maxima of the 1-st derivative plots from reflectance spectral curves of winter wheat leaves is a chlorophyll index high resistant to interference of the soil reflection. The maximal distortion is equal to 11% at the 25% level of projective covering.
CONCLUSIONCONCLUSION
• We shown that two principal components of spectral curves contain essential Shannon's information. These components can be used as independent variables of a nonlinear regression model.
• We proposed new methods and derivative indexes(chlorophyll, nitrogen, water, anthocyan, crop forecasting, estimation of projective covering, detection of illness)
SUMMARY
Follow Reccomendations from GMESBuild upon 2009 – 2012 Work PlanDevelopment and Implementation of Data Sharing PrinciplesImplementation Web-based Portal, Clearinghouse for Searching Spectral Data, Information and ServicesGlobal Agriculture MonitoringRisk Analysis (Use of Sattellites for Risk Management, Systematic Monitoring for Earthquake Risk Assessment)Special Sessions on GMES and Integral Risk Management Moving Forward with the Implementation of GEO-UA