monitoring of forests through remote sensing
TRANSCRIPT

October 2020
Monitoring of Forests through Remote Sensing
Final Report
Neither the European Commission nor any person acting on behalf of the Commission is responsible for the use that might be made of the following information.
Luxembourg: Publications Office of the European Union, 2020
© European Union, 2020 Reuse is authorised provided the source is acknowledged. The reuse policy of European Commission documents is regulated by Decision 2011/833/EU (OJ L 330, 14.12.2011, p. 39). For any use or reproduction of photos or other material that is not under the EU copyright, permission must be sought directly from the copyright holders.
Web ISBN 978-92-76 -25285-6 doi:10. 2779/ 175242 KH-03-20-754-EN-N
Getting in touch with the EU In person All over the European Union there are hundreds of Europe Direct information centres. You can find the address of the centre nearest you at: https://europa.eu/european-union/contact_en On the phone or by email Europe Direct is a service that answers your questions about the European Union. You can contact this service:
– by freephone: 00 800 6 7 8 9 10 11 (certain operators may charge for these calls),– at the following standard number: +32 22999696 or– by email via: https://europa.eu/european-union/contact_enFinding information about the EUOnlineInformation about the European Union in all the official languages of the EU is available on the Europa website at: https://europa.eu/european-union/index_enEU publicationsYou can download or order free and priced EU publications at: https://publications.europa.eu/en/publications. Multiple copies of free publications may beobtained by contacting Europe Direct or your local information centre (see https://europa.eu/european-union/contact_en).EU law and related documentsFor access to legal information from the EU, including all EU law since 1952 in all the official language versions, go to EUR-Lex at: http://eur-lex.europa.euOpen data from the EUThe EU Open Data Portal (http://data.europa.eu/euodp/en) provides access to datasets from the EU. Data can be downloaded and reused for free, bothfor commercial and non-commercial purposes.
Acknowledgements We acknowledge the valuable contribution of several co-workers from within the four participating in-stitutions, as well as the support received from the European Environment Agency and the National Reference Centres on Forests.
Study on
Monitoring of Forests through Remote Sensing
ENV.D.1/ETU/2018/0022MV Final Report
Atzberger, C.; Zeug, G.; Defourny, P.; Aragão, L.; Hammarström, L.; Immitzer, M.
Terranea UG (haftungebeschränkt) (DE)
University of Natural Resources and Life Sciences Vienna (AT)
Université catholique de Louvain Louvain-la-Neuve (BE)
Remote Sensing Division Instituto Nacional de Pesquisas Espaciais (BR)
Monitoring Forests Through Remote Sensing Final Report
3
Table of Content
Acknowledgements ..................................................................................................................................... 2 Executive Summary ..................................................................................................................................... 8 1. Background and objectives of the study .......................................................................................... 16 2. Stock taking and review of existing evidence ................................................................................... 17
2.1 Phenology ................................................................................................................................ 19 2.1.1 In-situ methods ................................................................................................................... 19 2.1.2 Remote sensing methods ................................................................................................... 22 2.1.3 Vegetation indices .............................................................................................................. 23 2.1.4 Other methods ................................................................................................................... 30 2.1.1 Conclusion and Summary Table Phenology ....................................................................... 31
2.2 Illegal logging ........................................................................................................................... 37 2.2.1 Exploiting features detection methods .............................................................................. 38 2.2.2 Land use change detection methods ................................................................................. 43 2.2.1 Conclusion and Summary Table Illegal logging .................................................................. 47
2.3 Pest and diseases .................................................................................................................... 52 2.3.1 Vulnerability of forests to attacks ...................................................................................... 52 2.3.2 Difficulty in detecting disturbances in EO data .................................................................. 53 2.3.3 Bark beetles related damages ............................................................................................ 54 2.3.4 The phenology of bark beetle attacks ................................................................................ 56 2.3.5 The need for detecting green-attack to prevent mass outbreaks of bark beetles ........... 56 2.3.6 Detection of bark beetle-caused tree mortality ................................................................ 61 2.3.7 Detection of other pest and diseases using remote sensing data .................................... 62 2.3.8 Conclusion and Summary Table Pest and Diseases ........................................................... 64
2.4 Wildfires .................................................................................................................................. 72 2.4.1 Europe ................................................................................................................................. 75 2.4.2 Canada ................................................................................................................................ 80 2.4.3 United States ...................................................................................................................... 83 2.4.4 Conclusions Wildfires ......................................................................................................... 86
2.5 Storm damages ....................................................................................................................... 87 2.6 Forest drought and water content monitoring: ..................................................................... 89
2.6.1 Regional coverage .............................................................................................................. 89 2.6.2 Quantification of drought effects in forests using vegetation indices and coarse resolution data 89 2.6.3 Portability and robustness of indices ................................................................................. 91
Monitoring Forests Through Remote Sensing Final Report
4
2.6.4 Use of high-resolution sensors & quantification of leaf water content ............................ 92 2.6.5 Sensor fusion ...................................................................................................................... 92 2.6.6 Machine learning, up-scaling and validation/visualization ................................................ 93 2.6.1 Conclusions and Summary Table Forest drought .............................................................. 93
2.7 Brazilian monitoring ................................................................................................................ 97 2.7.1 Historical context ................................................................................................................ 98 2.7.2 Existing operational systems .............................................................................................. 99 2.7.3 Methods which could become operational ..................................................................... 100
2.8 Survey .................................................................................................................................... 104 2.8.1 Remote sensing applications ............................................................................................ 105 2.8.2 Future improvements ....................................................................................................... 107
3. Remote sensing for forest condition and disturbance related policy development and implementation monitoring ................................................................................................................... 109
3.1 The European Green Deal, COM(2020) 80 final ................................................................... 110 3.2 The European Forest Strategy, COM (2013) 659 final ......................................................... 112 3.3 The EU Biodiversity Strategy for 2030, COM (2020/380) final ............................................ 113 3.4 EU Regulation on support for Rural Development (No 1305/2013) ................................... 115 3.5 EU Regulation for the Land Use, Land Use Change and Forestry sector (LULUCF) ............ 116
4. Recommendations for the Commission ........................................................................................ 118 5. References ..................................................................................................................................... 125
Monitoring Forests Through Remote Sensing Final Report
5
List of figures
Figure 1. Pan-European Tree Cover Density 2015 as determined by the Copernicus program ............. 16
Figure 2. Sample PhenoCam images of the canopy in a US tower site in 2006 on B: an early spring day, C: a summer day (Source: Richardson et al., 2007). ............................................................................... 21
Figure 3. Map showing dormancy onset date in deciduous broadleaf forests over the US in 2003, colour legend indicates the day of year (Source: Li, 2010). ................................................................................ 26
Figure 4. Spatial distribution of a) beginning of season date derived from ground observations, b) start of season date derived from AVHRR data, over 1986 to 2006 in Northern China, DOY: Day Of Year (Source: Luo et al., 2013). ......................................................................................................................... 27
Figure 5. Predicted start of season date (day of year) for 2011 over the Vermont study area (Source: White et al., 2014). ................................................................................................................................... 29
Figure 6. Annual deforested maps for 2005 to 2017 in a Brazilian Amazon site (Source: Shimabukuro et al., 2019). .................................................................................................................................................. 39
Figure 7. LiDAR estimated gap fraction in logged and unlogged blocks of a Sierra Leone national park at 14m canopy height (Source: Kent et al., 2015). ....................................................................................... 41
Figure 8. Results over one area A: Landsat 2000 composite, B: Landsat 2005 composite, C: Classification results with tree cover loss in red and forest cover in 2000 in green (Source: Potapov et al., 2011). ... 44
Figure 9. Overview of variables affecting eruptive forest insects (here Ips typographus) (Source: Biedermann et al., 2019) .......................................................................................................................... 52
Figure 10. Sequence of Landsat RGB-images (SWIR-nIR-Red) over a beech forest in Germany. Red colours indicate strong leaf loss caused by Gypsy moth infestation. The pre-infestation state is depicted in the image from June 1991. The infestation was strongest during June-July 1994. The forest recovered quickly after the attack (June 1995) (Source: Stöver et al., 1996) .......................................................... 55
Figure 11. Sensitivity of leaf optical properties to (stress-induced) changes in chlorophyll and protein content (Source: Schlerf et al., 2010). ...................................................................................................... 57
Figure 12. Investigating of the suitability of 8-band WorldView-2 satellite imagery for detecting bark beetle infestations (Source: Immitzer and Atzberger, 2014). ................................................................ 59
Figure 13. Flowchart describing the approach used by Meddens et al. (2013) to determine the utility of multi-temporal EO image sequences for detecting tree mortality caused by bark beetles compared to single-date classifications (Source: Meddens et al., 2013). .................................................................... 61
Figure 14. Classification accuracies obtained in the study of Meddens et al. (2013) for the detection of bark beetle red-attack. (a) Red-stage class accuracy, (b) red stage commission error, and (c) red stage omission error for single- (solid line) and multi-date (broken line) classifications. Reference data taken from classified aerial imagery. Error bars indicate the standard deviation (Source: Meddens et al., 2013). ................................................................................................................................................................... 62
Figure 15. Comparison of NIR (left) and SWIR (right) channels. Smoke has minor impact on the emitted radiance (Copernicus Sentinel data). ....................................................................................................... 73
Figure 16. Burnt area mapping result based on NBR (Source: Weirather et al., 2018) .......................... 73
Figure 17. CEMS map example of forest fire situation map (EMSR 171 - Nurri, Sardegna) ................... 75
Figure 18. Fire smoke forecast 09.10.2019 (Source: Canadian Wild Fire Information System) ............. 81

Monitoring Forests Through Remote Sensing Final Report
6
Figure 19. Preliminary BAER date for the Horsefly fire (08/05/2019) in Helena National Forest, Montana, USA; left: post-fire image, right: Validated soil burn severity classification (Source: Burned Area Emergency Response program) ............................................................................................................... 84
Figure 20. Operational drought monitoring system based on MODIS NDVI time series operated by BOKU and covering Austria, Germany and Switzerland. The VIC data is updated at weekly intervals and aggregated at administrative level. Different land cover types can be selected, including deciduous forests and conifers (map on the right). The temporal evolution of the drought indicator is shown as a matrix (bottom left) as well as with respect to historical minimum and maximum (top left) (Source: BOKU Geomatics). ............................................................................................................................................... 91
Figure 21. Image interpretation pattern for identification of clear-cut deforestation in Landsat images (Source: INPE) ........................................................................................................................................... 99
Figure 22. Descriptive flowchart for obtaining Forest / Non-forest maps, burned area map to generate an annual forest degradation map caused by burning (Source: INPE) .................................................. 101
Figure 23. TM / Landsat image in orbit /point (226/069) in colour composition R5 G4 B3 showing burnt areas in dark colour (Left); and shade fraction image with brighter pixels highlighting the burned areas (Right) (Source: INPE) ............................................................................................................................. 102
Figure 24. Methodological approach to burn mapping through digital image processing of remote sensors (Source: INPE) ............................................................................................................................ 103
Figure 25. Overview map of NRCs who have responded to the survey to date (Sept-2020) ............... 105
Figure 26. Use of forest remote sensing in thirteen selected EEA39 countries responding to the information request ................................................................................................................................ 105
Figure 27. Platforms and sensors mostly used amongst the thirteen EEA39 countries responding to the information request ................................................................................................................................ 107
Figure 28. Comparison of the EDGAR (Emission Database for Global Atmospheric Research) data with the corresponding UNFCC land cover areas for each EU country level as derived from the CCI Land Cover maps (Source: Rossi et al., 2019). ........................................................................................................... 117

Monitoring Forests Through Remote Sensing Final Report
7
List of Tables
Table 1. Summary table listing characteristics of a few phenological networks ..................................... 32
Table 2. Summary table listing phenology studies or products using remote sensing or near surface sensing ...................................................................................................................................................... 33
Table 3. Summary table listing studies or products on illegal logging using remote sensing ................. 48
Table 4. Bark beetle species that have the capacity to cause landscape-scale tree mortality in the western United States and Canada (Source: Bentz et al., 2010) ............................................................. 54
Table 5. Aggregated confusion matrix for classification of different health classes; BL: Broadleaved, CF: coniferous, GMS: Green Mortality Stage, EMS: Early Mortality Stage, LMS: Late Mortality Stage, UA: User’s Accuracy, PA: Producer’s Accuracy, OA: Overall Accuracy (Source: Fassnacht et al., 2014). ...... 60
Table 6. Summary table listing pest and diseases studies or products using remote sensing or near surface sensing ......................................................................................................................................... 65
Table 7. Summary table listing drought studies or products using remote sensing ............................... 94
Table 8. Important initiatives on biome or global scale mappings to estimating and monitoring forests formations. ................................................................................................................................................ 98
Table 9. NRCs who provided feedback to the survey ............................................................................ 104

Monitoring Forests Through Remote Sensing Final Report
8
Executive Summary
Forest ecosystems are of high socio-economic and ecological importance but increasingly under threat – both from biotic and abiotic disturbances. Unfortunately, as a result of the ongoing climate change, the frequency and intensity of disturbances are believed to further increase in the near future. This makes the set-up of an appropriate Forest Monitoring Information System for Europe (FISE) a high pri-ority. To exploit synergies, and to avoid unnecessary redundancies and double developments, it is rec-ommended to set up such a FISE addressing various disturbances in parallel, while building on the same IT infrastructure and datasets. Beyond the economy of scale, it is also of critical importance from the user perspective to insure the consistency and interoperability across the different forest information layers.
In this desk study, the possible contribution of (satellite-based) Earth Observation (EO) to such a moni-toring system is critically assessed by reviewing the available scientific literature and by summarizing existing operational or experimental attempts at European and global level. Moreover, a survey among members of the EIONET National Reference Centers on Forests was conducted to gain additional infor-mation about forest remote sensing activities in the EEA 39 countries. Complementary - and highly val-uable - information was provided by colleagues from the European Environment Agency (EEA), the Eu-ropean Joint Research Center (JRC), the Brazilian Institute for Space Research (INPE) and the US Forest Service (USFS).
Thanks to the collected information, it was possible to describe the advantages and limitations of vari-ous remote sensing techniques and to design strategies and recommendations for an effective use of EO data at European level for six highly relevant threats:
• Wildfires • Pest infestations • Droughts • Storm damages • Illegal logging • Phenology shifts
Wild fires
Wildfires are amongst the most common disturbances in forest ecosystems. With the ongoing climate change, it is projected that wildfires will become more frequent and intense, and that the fire seasons will become longer.
To prevent ignition and to reduce the impact of wildfires, EO-based monitoring systems should address three stages: before the fire (pre-fire), during the fire (active) and after the fire (post-fire). In all stages, remote sensing can support wildfire management. Particularly well suited are optical sensors.
To reduce the ignition risk, knowledge about fuel types (i.e. tree species) and their conditions is ex-tremely informative. This information can be readily derived from optical datasets from Sentinel-2, com-bined with suitable weather information and forest structure information (e.g. gap-size distribution and vertical forest structure). The structural information should be updated in regular intervals (e.g. every 3-5 years) and possibly build on LiDAR data.

Monitoring Forests Through Remote Sensing Final Report
9
During the active fire phase, forest fighters should ideally be supported by thermal imagery. Currently, suitable EO sensors for this task are not well adapted to smaller forest fires. Future Copernicus satellites should ideally have at least one thermal sensor at 50m spatial resolution with 5 days revisit time to address this gap. Meanwhile, currently available coarse resolution (and geo-stationary) thermal sensors should be further exploited for large scale fire assessment and drought condition.
After fires it is in a first step necessary to describe what is left of the forest as this impacts the recovery phase. This information should than be complemented by information about fire severity and finally the monitoring of the recovery of the vegetation.
Pest infestations
Forests are vulnerable to pest and diseases. Large forest losses occurred in the past through bark beetle attacks, but also fungal pathogens and their insect vectors. Although predation of trees from native organisms is natural, the balance can be upset by inappropriate forest management practices and fur-ther amplified by climate change. Both factors can greatly increase the predisposition of forests to health issues. Indeed, most larger bark beetle outbreaks follow previous disturbances by droughts or fires and are further facilitated by large, even-aged and not well adapted monocultures.
To preclude mass outbreaks and to minimize economic losses, an early detection of infestations is cru-cial, that is before the infestation is visible on the ground (e.g. at the so-called ‘green-attack’ stage). To mitigate possible disturbances, a European forest risk assessment is recommended. This permits to fo-cus on the most vulnerable sites and would also yield useful information for forest management.
For both information requests, EO techniques based on optical data can provide useful indicators. While the risk assessment is probably best addressed at stand level for which suitable techniques and datasets exist (e.g. Sentinel-2), the actual detection of infested trees - in particular in the green-attack phase - has to be done at the level of individual trees. For this most relevant task, currently no suitable sensor exists. It is also not yet clear if future research will be able to uncover robust ‘spectral fingerprints’ (nor ‘spatio-temporal fingerprints’) that permit to unambiguously distinguish reversible (weather-related) vegetation anomalies from green-attacks. The task is further complicated by the fact that extremely short lag-times are required for preventive actions and to control the spread. More research in this area is recommended.
Droughts
Droughts can be readily monitored using existing space assets. As droughts are meso-scale events with slow onset and long duration, the data requirements in terms of spatial resolution are relatively modest.
To depict the spatial extent and severity of droughts, various techniques are available - using a range of different sensors and methods. From the four general drought types, satellite sensors can particularly well address meteorological, hydrological and agricultural droughts. As forests are often deep-rooted in the soil, a pure description of meteorological conditions (e.g. rainfall deficits) is seldom sufficient. High uncertainties are usually also associated with soil moisture retrievals using active and passive mi-crowaves, due to the high vegetation coverage and low signal-to-noise ratio. For this reason, observa-tions of vegetation conditions in the optical domain (e.g. the assessment of the so-called ‘agricultural drought’) are usually the most beneficial. Relatively well suited are also methods (often based on geo-

Monitoring Forests Through Remote Sensing Final Report
10
stationary sensors) that assess the water balance, e.g. by combining evapotranspiration losses with pre-cipitation data. Such approaches would benefit from spatially higher resolved thermal sensors, currently not available. It is recommended to pursue such approaches and to combine them with heat wave in-formation.
Storm damages
Storms and high-speed wind gusts cause serious damages in forest ecosystems. Damages range from (single tree) wind-breaks to large windthrows affecting hundreds of hectares. As the timber supply can strongly increase after large events, often the entire value chain is disturbed. Forests which are not well adapted to local site conditions are particularly vulnerable. As site conditions are predicted to change under climate change, in some regions forest conversions are needed to better adapt future forests to this increasing threat.
Well established EO techniques are available to map current tree species distribution as well as storm-affected areas. Detailed tree species information at fine resolution is mandatory to model the suscepti-bility of forest stands to climate risks - both current and projected - and to assess economic damages and potential impacts on the value chain.
The detection of windthrows requires high spatial resolution data. If windthrows are to be detected in a timely manner, sensors with a high temporal revisit frequency are required. Both Sentinel-1 (micro-wave) as well as Sentinel-2 (optical) are well suited for this task, and it is recommended to integrate both systems for an enhanced detection rate and all-weather capability.
An EO-based windthrow monitoring system would also greatly benefit from forecasted high-speed wind fields as this would not only reduce commission errors but also enable preventive actions. Very high resolution (VHR) imagery from commercial image providers should be included whenever possible. The set-up of such a European monitoring system is recommended.
Illegal logging
Illegal logging is most prevalent in tropical countries. It is however also existing in European countries such as Greece, Romania, Latvia, Cyprus, Ukraine, Kosovo and Russia. Due to populist governments in countries such as Brazil (paired with corruption), important forest ecosystems such as the Amazon are again under immense pressure, after years of improving natural resources management and protection.
The practice of illegal logging results in noticeable disturbances to forest biodiversity and soil, can dam-age the residual trees and reduces carbon storage. The necessary infrastructure (e.g. roads and decks) opens canopy gaps and the resulting forest edges are more susceptible to fire, droughts and other dis-turbances, besides use for agricultural activities.
EO techniques using both optical (Sentinel-2) and microwave sensors (Sentinel-1) have proven an ex-cellent capability to detect forest logging. However, to distinguish between legal and illegal logging re-quires information about the forest concession and protection status of a given forest patch. This infor-mation has to be provided through non-EO sources. To uncover illegal logging, it is recommended to ensure that logging records within Europe are kept accurately and up-to-date. In this way it is possible to distinguish (post-hoc) between legal and illegal logging.

Monitoring Forests Through Remote Sensing Final Report
11
Generally, larger disturbances are easier to detect compared to the felling of individual trees - the latter is currently best addressed using commercial VHR datasets with meter to sub-meter spatial resolution. For detecting the illegal logging, the so-called spectral mixture analysis (SMA) is also well suited, as any logging leads to an increase in the shadow fraction in the roof zone of the forest canopy, which can be well detected with SMA. Several other alternative techniques are available such as change detection methods based on thresholds (both microwave and optical).
The main technical challenge is the required short latency if the information is to be used by the exec-utive to prevent further logging. The set-up of a European monitoring system is recommended, focus-sing on smaller disturbances, and possibly applying ensemble approaches that combine the information of several weak learners into one robust indicator. As the monitoring of windthrows and the detection of illegal logging use many similar methods and datasets, it is recommended to integrate both disturb-ances in one common monitoring system, which first and forehand detects forest cover changes – but not necessarily directly the agent leading to the loss of forest cover.
Phenology shifts
Shifts in the phenological development of forests - and the species that make up the forest ecosystems - can potentially threaten species with synchronized life cycles and can induce shifts in species distribu-tions and the suitability of certain sites for specific tree species. The monitoring of forest phenology holds moreover valuable insights on the impact of climate change.
EO can provide valuable information about forest phenology at any desired spatial detail through meas-urements of e.g. the timing of vegetation onset and senescence (e.g. start of spring/autumn). The re-motely derived information is complementary to in-situ observations which are by definition more pre-cise and recording real phenological development stages, but limited to a few places.
The review highlighted the potential of optical EO satellites such as Sentinel-2 (and to a lesser extent Sentinel-3) for such a land surface phenology (LSP) monitoring system. However, as those satellites were only launched recently, a backward calibration against MODIS/Landsat-derived products is recom-mended. The necessary LSP extraction algorithms are well developed and can be readily deployed. The set-up of a European LSP monitoring system is recommended, building on the rich information provided by existing in-situ networks, thus leveraging the complementary nature of both observation systems. The main technical challenge is the proper pre-processing of the big data to remove the noise from the EO datasets and to link LSP indicators to plant phenology development stages.
Remote sensing for forest condition and disturbance related policy development and implementation monitoring
There is no single EU forest policy in Europe equivalent e. g. to the Common Agriculture Policy (CAP). Forest protection and forestry fall under a number of shared competences between the EU and its Member States (MS). Nevertheless, the sustainable management of forests is of highest European in-terest. This is for example expressed through the different EU policies contributing to the implementa-tion of the 2030 Agenda and towards achieving the Sustainable Development Goals (SDG) - first and foremost the European Green Deal (EGD).

Monitoring Forests Through Remote Sensing Final Report
12
The implementation and monitoring of these policies depend on timely and reliable forest information, ideally based on a standardized set of indicators and variables obtained through harmonized ap-proaches. Thus, there is a need to understand how remote sensing can facilitate policy development and monitoring the implementation of policies affecting EU forest condition and disturbances.
This study investigates this potential by reviewing the following five European policies:
• The European Green Deal • The EU Forest Strategy • The EU Biodiversity Strategy • The EU Rural Development Programme • The Regulation for the Land Use, Land Use Change and Forestry sector
Each policy is summarised and its implication on forest disturbances is assessed. How remote sensing can be used to efficiently monitor the different types of forest disturbances is presented in the first part of the report. The impact and effectiveness of forest remote sensing in the light of the selected policies is further discussed in the final section of the report.
Remote sensing can provide independent timely and reliable forest information and existing and future Copernicus products will build an important backbone for the European FISE. The value of Copernicus for European policy making is underlined through an increasing number of agriculture, environment and climate related policies explicitly mentioning the use of Copernicus data to monitor the implemen-tation of the policy measures. The Copernicus Land Cover Monitoring Service (CLMS) offers already a range of suitable land cover and land use products for that purpose. However, the portfolio has to be expanded to support e. g. the future Land Use, Land Use Change and Forestry sector (LULUCF) reporting by the Member States. Corresponding requirements exist e. g. in relation to better spatial detail and higher update frequencies but also a further harmonisation of approaches between Member States is required. The forest policies having a link to forest disturbances can also be supported through products of the Copernicus Emergency Management Service (CEMS). Hazard maps offering information about events and their impact as well as risk maps specifying exposure and vulnerabilities are two examples. The European Forest Fire Information System (EFFIS) is another component supporting forest manage-ment. Future Copernicus services such as a phenology service provided by the CLMS will deliver addi-tional data for forest disturbance monitoring. Moreover, the services will provide information to de-velop forest related policies for their mitigation and enable the monitoring of their successful imple-mentation in Europe.
Final conclusions
Overall, the review made very clear that for most disturbances and information needs, reliable and cost-efficient EO solutions exist. The EO-based approaches could nowadays be readily operational thanks to the fleet of Copernicus satellites and other (non-European) space assets.
Based on the reported findings, the development of a centralized or at least coordinated Forest Moni-toring Information System (FISE) for Europe shall target as priority applications those which fall at the intersection of three dimensions: the saliency for EU policies, the national ownership thanks to their relevance for the forest sector and the techno-scientific credibility. Indeed, the priority applications shall be directly related to the EU forest policy objectives. At the same time, they should be relevant to the national forestry/biodiversity stakeholders to support their practices towards more sustainable forest management and turn information into action. Last but not least, these priority applications should cor-

Monitoring Forests Through Remote Sensing Final Report
13
respond to very high level of EO science & technology readiness to deliver accurate and robust opera-tional services. In the space sector, the latter is coded along a scale of Technology Readiness Level (TRL) (ESA TRL Working, 2013) ranging from 1 to 9 for a fully proven operational solution as reported for the forest disturbances in the table here below. It is also considered that countries’ forest data are often based on ground surveys at decadal intervals. The great opportunities offered by EO should in our opin-ion also be considered by these national stakeholders, while they might at the same time contribute to the forest information quality control.
EO Applications
Wildfires Pest infes-
tations Droughts Storm damages
Illegal log-ging
Phenology shifts
TRL* 9# 2 8 5 7 6 Copernicus Ser-vices
CEMS EFFIS CEMS
Drought CLMS Phe-nology
European Green Deal x x X x x
EU Forest Strat-egy x x x
EU Biodiversity Strategy x x x
EU Rural Dvpt Programme x x X x
LULUCF Regula-tion x x X x x x
* Technological Readiness Level (TRL): TRL 2 – Technology concept formulated, TRL 5 – Technology validated in relevant environment, TRL 6 – Technology demonstrated in relevant environment, TRL 7 – System prototype demonstration in operational environment, TRL 9 – Actual system proven in operational environment #TRL indicated here for large scale forest fires
As most forest disturbances detection methods require low latencies for optimum intervention, how-ever, the launch of two additional Sentinel-2 satellites (e.g. S2C and S2D) is recommended. With the constellation of four identical Sentinel-2 satellites, one would obtain an observation every second day for most places in Europe. Such a high revisit frequency is necessary to deal with the cloud coverage. Maintaining all the Sentinel-1 satellites could lead to a revisit capacity lower than one day for most of Europe enhancing the monitoring capacity thanks to a possible one-day interferometric coherence. The strong capacity of the currently active Sentinel 1 and 2 over Europe is highlighted in the below figure (source: UCL), which shows the number of observations per year. It highlights the strong capacity of Sentinel 1 and 2 over Europe, with much higher revisit than the nominal corresponding to the equator (most Europe with one S2 around every 3 days, and every 2 days for S1).
All disturbances have moreover in common (with the exception of phenological shifts) that not only the reliable and timely detection of the disturbance itself is important, but also the recovery phase after the event. This recovery is to be monitored both in the immediate aftermath of the disturbance as well as over the following years.

Monitoring Forests Through Remote Sensing Final Report
14
Among the six forest disturbances considered in this study, the only threat for which currently no oper-ational solution can be envisioned are disturbances induced by pests and diseases. For this biotic forest disturbance, a near-real-time monitoring capacity at extremely high revisit frequency - and with high spatial and spectral resolution - would be needed to detect the so-called ‘green-attack’ stage. Such a sensor currently does not exist. Only a detection at this ‘green-attack’ stage would permit a timely re-moval of the infested tree(s) to prevent a further spread of the disease and to limit the associated dam-ages. More research in this field is recommended.
Recommendations
1. It is recommended to better leverage the potential of EO (1) by integrating, not side-lining, the tradi-tional inventory approaches to create mutually beneficial synergies, (2) to design and implement a pan-European EO policy for state-of-the-art monitoring of European and global forest resources with short lag-times and frequent updates, (3) to create a competitive and fair market for EO service providers to feed a Forest Information System for Europe (FISE) integrating harmonised information about forests and forest resources.
2. As the sustainable management and monitoring of forest resources are of European interest, a com-mon EU forest policy is recommended, which builds on existing national policies and experiences while ensuring convergence and harmonization towards a sustainable forest management.
3. A stronger role of EO in the five following European policies is recommended, leveraging the potential of EO for policy development and the monitoring of the implementation of European policies in the field of forest disturbances: (1) The European Green Deal, (2) The EU Forest Strategy, (3) The EU Biodiversity Strategy, (4) The EU Rural Development Programme, and (5) The Regulation for the Land Use, Land Use Change and Forestry sector. Specific EO contributions to each policy are detailed in the report conclu-sions.
4. Copernicus provides professionally organised services offering standardised products of high quality. However, the consistency and the compatibility across services and their associated products is hardly investigated by the producers. The forest-related information provided by the CLMS, the CEMS and others should be compatible and possibly consolidated between products from a given service and be-tween services.
5. To make the Copernicus program more effective it is recommended to better balance investments between space and ground segments and to ensure that the thematic programs are better balanced

Monitoring Forests Through Remote Sensing Final Report
15
between climate and land communities. This is underlined through the implementation of the EU Reg-ulation for the Land Use, Land Use Change and Forestry sector, which creates the legislative framework for emissions and removals from the land use and forest sector for the period 2021-2030. In this respect it is possibly counterproductive to read in Nature (Ceccherini et al., 2020) that „JRC has been asked to establish a permanent EU observatory on forests“.
6. It is recommended to clean as soon as possible the confusing DIAS landscape and to pave the way for a federated European set of infrastructure and data providers. A truly cross-DIAS transferability of code needs to be achieved and as it is still unclear under which business model the DIASes will operate, while US-based cloud computing infrastructures attract most European scientists, including JRC EO teams.
7. We strongly recommend the design and the implementation of a Forest Information System for Eu-rope (FISE) which could probably focus on the harmonization, the consolidation and the integration of the EO-derived forest information as provided by Copernicus services and other information providers. If properly designed in collaboration with the Member States, such a system would become the EU observatory on forests serving the most up-to-date information about the European forest and forest resources and supporting a more sustainable forest management across Europe.
8. Among the six forest disturbances investigated in this study, only the detection of forest pests and diseases is at an early stage. To permit forest stakeholders to prevent their spread across larger regions, still requires a significant EO research. It is recommended to further support those research efforts as the problem is severe and its impacts are expected to expand with the climate change. All other dis-turbances are seen at higher TRL where research developments should ideally focus on the robustness of approaches to ensure their applicability within the highly diverse European forest ecosystems.

Monitoring Forests Through Remote Sensing Final Report
16
1. Background and objectives of the study
European and national forest policy making requires reliable information on forest conditions and dis-turbances. Setting up a Forest Monitoring Information System for Europe (FISE) is therefore a high pri-ority. It should be the central information hub for information on European forests delivering compati-ble, reliable and accountable forest statistics as well as a well-adapted monitoring capacity in order to permit stakeholders to react on various threats and for planning purposes. In comparison to Eurostat’s assessments, which focus on the economic aspects of forest (production, areas, timber prices, etc.), the FISE should also provide information on forest ecosystems and their services and on global activities influencing forests and forestry activities in Europe.
Figure 1. Pan-European Tree Cover Density 2015 as determined by the Copernicus program
The project “Monitoring of Forests through Remote Sensing” aims at enhancing the EC’s understanding of forest remote sensing capabilities and technologies and how they could be used to support forest related policy making and subsequently to monitor policy implementation and effects.
The project includes three main tasks:
1. Stock taking and review of existing evidence 2. A critical assessment of the evidence found 3. Recommendations for the European Commission
The following report summarises the results of these three tasks, based on analysis of relevant literature and existing monitoring systems, and complemented by the author’s own long-lasting experience in the use of space assets for forest related activities.

Monitoring Forests Through Remote Sensing Final Report
17
2. Stock taking and review of existing evidence
Forests constitute a rich, diverse and invaluable ecosystem. It is the most widespread ecosystem in the European Union covering 40 % of the area from which 22.9 % is protected under Natura2000 (European Commission and Directorate-General for the Environment, 2016). Forests are subject to recurrent changes, be them anthropic or not, from logging, to pest infestation, fires or storms. Climate change and related factors are likely to exacerbate the threats and risks (Altwater et al., 2011). In this light, the Convention on Biological Diversity and the EU Forest strategy of 2013, recommend to improve the cur-rent monitoring of forests and to better spread the information to all involved stakeholders. In the con-text of carbon storage initiatives, Global Forest Observations Initiative (GFOI) requests that satellite data for forest monitoring be made widely available (Committee on Earth Observation Satellites and Space Data Coordination Group, 2018).
At the global level, the Global Forest Resource Assessments from the FAO provides roughly estimated statistics on forest extent, biomass and disturbances, as well as other parameters, per country (FAO, 2018). This initiative started in 1948, and has benefited from the use of remote sensing more recently. The Global Forest Survey from the FAO aims at compiling field data from sample plots in open access (FAO, 2019). The dataset of the Global Forest Observations Initiative (GFOI) which is still in development, provides an example of a remote sensing derived system for the monitoring of forests. Thus, the need for harmonized, accessible, detailed information on forests at the EU scale is a pressing matter. Forest mapping aspects, and the assessment of its biodiversity, are already well covered. Forest carbon storage and fluxes fit well into the Land Use, Land Use Change and Forestry (LULUCF) framework. Forest health, phenology monitoring as well as assessing disturbances remain to be analysed at the European scale.
The present study explores the feasibility of a remote sensing-based system to evaluate and measure the aforementioned metrics and indicators in the EU. An overview of current operational applications of remote sensing on forest condition and disturbances both from public and private stakeholders is required. Areas of interest cover the EU, Brazil, Canada, the US and the Congo basin. Although the list of these countries is far from being complete, they cover well a range of typical ecosystems and related threats.
Several key variables on European forests are already collected through other activities. These include assessments of forest area, types, and their distribution. Similarly, forest biodiversity and forest carbon are already covered. The existing study therefore concentrates on six thematic priority areas:
• Wildfire monitoring • Pest infestation • Storm damages • Drought • Phenology • Illegal logging
The study assesses current state-of-the-art and operational approaches of remote sensing applications. New developments which could become operational are identified and evaluated, too. This includes larger pilot projects demonstrating successful monitoring approaches. Even though the analysis covers also Brazil, Canada, the US and the Congo basin, it is the objective to assess if the outcomes from those areas could be applicable to Europe and help implementing and controlling European policies.

Monitoring Forests Through Remote Sensing Final Report
18
The findings of this report are based on the expert knowledge of the project partners who are and have been involved in many forest related remote sensing projects in the countries under investigation. Moreover, a desk-research was conducted to complement the existing knowledge. A survey among members of the EIONET National Reference Centers on Forests was an additional source for information about forest remote sensing activities in the EEA 39 countries. Finally, colleagues from the European Environment Agency (EEA), the Joint Research Center (JRC), the Brazilian Institute for Space Research (INPE) and the US Forest Service (USFS) provided additional information.
The following sections 2.1 – 2.6 provide information about the above-mentioned thematic priority ar-eas. Each sub-section is followed by references. This reference literature was the information source of the literature study. Section 2.7 is dedicated to forest monitoring in Brazil. Section 2.8 includes results of the NRC survey. However, until today (16.05.2020) only 13 NRCs (of 39) returned feedback to the survey, despite repeated reminders. Section 3 will include the critical assessment of the findings (task 2) and section 4 will include recommendations to the EC (task 3).

Monitoring Forests Through Remote Sensing Final Report
19
2.1 Phenology
Phenology constitutes “the study of the timing of recurring biological events” (Lieth, 1974). In forest ecosystems, one typically observes the timing of leaf unfolding, flowering, fruiting or leaf fall of trees. Additional metrics include the length of growing season, the amplitude of the intra-annual vegetation density and the inter-annual stability of the aforementioned metrics (Atzberger et al., 2014; Atzberger and Eilers, 2011a; Beck et al., 2006).
Studying forest phenology holds valuable insights on the impact of climate change, to recognize droughts, and to assess the impact of adverse weather conditions on critical development phases (Li, 2010). Importantly, land surface phenology (LSP) also provides an extremely important link between vegetation cover and dependent animal species linked to the tree’s development (Buitenwerf et al., 2015; Thomas et al., 2004). As pointed out by Buitenwerf et al. (2015), changes in the phenology of vegetation activity can threaten species with synchronized life cycles. Reliable and harmonized infor-mation about LSP can also be applied to managing forests pests, invasive species as well as assess human health risks such as allergies (USA National Phenology Network, 2018a).
For ease of readability, the literature on forest phenology is presented below by differentiating on whether they are based on Earth Observation (EO) data or in-situ data.
2.1.1 In-situ methods
Phenological networks have been developed even before the bourgeoning of remote sensing methods. They are visual ground observations of the date of specific and discrete biological development events occurring in plants. The observations can be done by either trained professionals, citizens, or both, de-pending on the given network (O’Connor, 2011). Phenological networks such as the International Phe-nological Gardens of Europe (IPG) record the timing on trees of a specific variety in controlled plots (Chmielewski et al., 2013), while the USA National Phenological Network (USA NPN), contains infor-mation on various species in natural forests (Rosemartin et al., 2018). Involving non-professionals in the recording can drastically improve the quantity of data available. For instance, around 2 million of phe-nophase records in 3,734 sites were compatibilized on the USA NPN platform in 2018 (USA National Phenology Network, 2018b). The phenology network’s recording plots can be spread out over a whole continent, for instance in the case of IPG (Humboldt State University, 2019) or only within a country such as the Réseau National de suivi à long terme des Ecosystèmes Forestiers (Renecofor) (Office Na-tional des Forêts, 2019). The European PEP725 project (www.pep725.eu), collected a wealth of in-situ information from all countries across Europe. Table 1 lists details about a few examples of these net-works.
The data that these networks provide can be extremely valuable due to its spatial extent and in some cases historical scope (O’Connor, 2011). Moreover, the entire range of biological development phases and processes are visible on the ground, while some are impossible to identify remotely (Verhegghen, 2013). Moreover, data from the ground is essential to confirm and validate some of the results obtained with other approaches.
However, some forests are too remote and inaccessible to be observed. Spotting key vegetation phases requires frequent enough observations, which can prove to be expensive and time consuming in remote or inaccessible locations (Richardson et al., 2007). Observations depend on human operators, which can

Monitoring Forests Through Remote Sensing Final Report
20
be fallible. With citizen networks, some species can be overlooked and there might be an accumulation of phenological records in some sites and very little in others (O’Connor, 2011).
It has also be clearly stated that phenology derived from individual plant observations will substantially differ from remotely sensed phenology (aka LSP), as the latter aggregates information on the timing of the vegetation density over a pixel and does not characterise a specific phenological development event (Elmore et al., 2016; Hamunyela et al., 2013; Li, 2010). Yet, both approaches complement each other, as ground data can validate results obtained from remote sources, while satellite data can bridge gaps in plant observations series (Betancourt et al., 2005; Elmore et al., 2016).
Optical or radiometric devices inside the forest setting described as “near remote sensing” or “proximal sensing” can also be used to assess its phenology (Eklundh et al., 2011; Richardson et al., 2007). For example, a number of canopy towers carry measurement instruments or webcams to record oblique imagery and measurements of the (forested) landscape. Such instruments can for example measure the reflected Photosynthetic Active Radiation (PAR) and shortwave radiation that can then be transformed into vegetation indices to assess phenology (Rankine, 2016). Results, however, were not conclusive in this case as very dissimilar phenophase onset dates were found for MODIS compared to the radiometric sensors (Rankine, 2016).
A multi-spectral sensor on a mast can also provide reflectance values in several spectral bands, just as a satellite would, allowing the computation of a vegetation index (Eklundh et al., 2011). In fact, the vegetation indices derived from multispectral and hyperspectral sensors were found to be highly corre-lated to ones obtained with both Sentinel-2 and MODIS imagery (Lange et al., 2017). Still, Sentinel-2 extracted green-up and senescence dates were closer to the in-situ ones than MODIS. According to the authors, the continuous monitoring of this site with tower sensors allowed to validate both phenology products (Lange et al., 2017).
Photon flux density and CO2 flux measurements (eddy covariance) can also be proxies to evaluate veg-etation state at a moment of the year (Eklundh et al., 2011; Richardson et al., 2007). These devices can be organized into networks but require heavy investments and well trained personal for its operation and maintenance. For instance, the AmeriFlux or the European Fluxes Database networks are composed of hundreds of eddy flux measurement sites (Li, 2010). In the case of a radio wireless network, Normal-ized Difference Vegetation Index (NDVI) and PAR were extracted in a Canadian forest (Rankine, 2016).
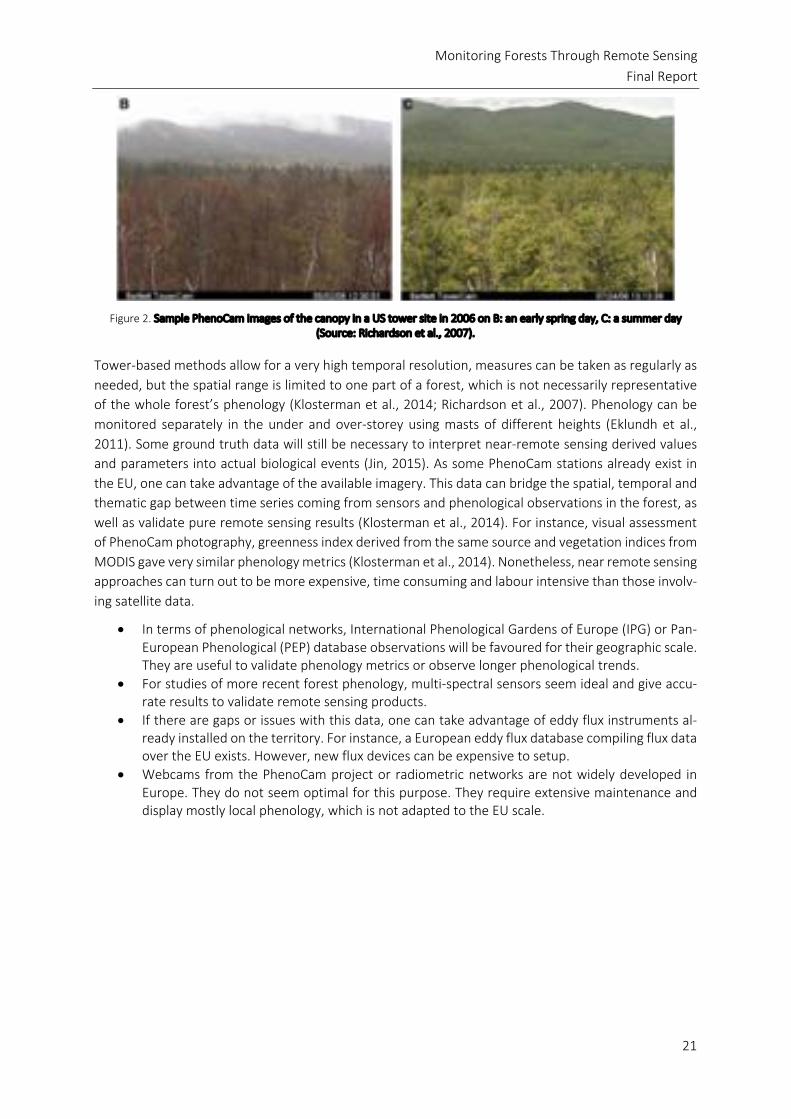
Webcams are the basis of the PhenoCam project, with 586 cameras installed since 2007 (University of New Hampshire, 2018). They are mostly disseminated over the USA and Canada, but there are some in Europe (Sweden, Italy, Spain, Germany) as well as China, Brazil and Israel. The project forms a coopera-tive network with the goal of sharing and storing continuous near real-time phenology information (Fig-ure 2). The guidelines and instructions are available and precise, so that new cameras can be added to develop the network more widely. Yet, comparing the network of multiple cameras to MODIS estimates of phenology over one forest site, gave only very low correlation (St. Peter et al., 2018).
Monitoring Forests Through Remote Sensing Final Report
21
Figure 2. Sample PhenoCam images of the canopy in a US tower site in 2006 on B: an early spring day, C: a summer day
(Source: Richardson et al., 2007).
Tower-based methods allow for a very high temporal resolution, measures can be taken as regularly as needed, but the spatial range is limited to one part of a forest, which is not necessarily representative of the whole forest’s phenology (Klosterman et al., 2014; Richardson et al., 2007). Phenology can be monitored separately in the under and over-storey using masts of different heights (Eklundh et al., 2011). Some ground truth data will still be necessary to interpret near-remote sensing derived values and parameters into actual biological events (Jin, 2015). As some PhenoCam stations already exist in the EU, one can take advantage of the available imagery. This data can bridge the spatial, temporal and thematic gap between time series coming from sensors and phenological observations in the forest, as well as validate pure remote sensing results (Klosterman et al., 2014). For instance, visual assessment of PhenoCam photography, greenness index derived from the same source and vegetation indices from MODIS gave very similar phenology metrics (Klosterman et al., 2014). Nonetheless, near remote sensing approaches can turn out to be more expensive, time consuming and labour intensive than those involv-ing satellite data.
• In terms of phenological networks, International Phenological Gardens of Europe (IPG) or Pan-European Phenological (PEP) database observations will be favoured for their geographic scale. They are useful to validate phenology metrics or observe longer phenological trends.
• For studies of more recent forest phenology, multi-spectral sensors seem ideal and give accu-rate results to validate remote sensing products.
• If there are gaps or issues with this data, one can take advantage of eddy flux instruments al-ready installed on the territory. For instance, a European eddy flux database compiling flux data over the EU exists. However, new flux devices can be expensive to setup.
• Webcams from the PhenoCam project or radiometric networks are not widely developed in Europe. They do not seem optimal for this purpose. They require extensive maintenance and display mostly local phenology, which is not adapted to the EU scale.

Monitoring Forests Through Remote Sensing Final Report
22
2.1.2 Remote sensing methods
Remote sensing constitutes a fundamental means to explore and comprehend very large phenological patterns, such as those at a continental scale (Delbart, 2005; Jones, 1998). It also allows high frequency monitoring, to assess the exact date of a given event. To this end, the temporal resolution of the product needs to be sufficient (Delbart, 2005). Compared to in-situ approaches, there is a supplementary di-mension with remote sensing. Indeed, biological stages are reflected by quantitative variations of values all along the plant’s life. In-situ observations, on the other hand, only record qualitative visible changes, for example leaf apparition (Verhegghen, 2013).
To adapt to the diversity of forest types and climates in Europe, the below literature review will be slightly tweaked to the region considered. For example, snow is a typical challenge in temperate as well as boreal forests, since it can modify the signal of reflectance, hence swaying vegetation index values (Beck et al., 2006; Delbart, 2005). Thus, snow covered pixels are often filtered and removed from satel-lite time series (Li, 2010). Differences in cloudiness and understorey vegetation across latitudes are also factors to be taken into account (Eklundh et al., 2011). It is more difficult to monitor the phenology of coniferous forests as opposed to deciduous ones since they present a more ‘subtle’ seasonality (Eklundh et al., 2011). In addition, autumn phenology events are usually harder to spot remotely than spring ones, as they imply a slower change in greenness (Elmore et al., 2016).
Obviously, validation of the remote sensing products needs to be robust, which implies having ground phenological observations, canopy sensors, a phenology model or meteorological data (Eklundh et al., 2011). In the absence of suitable reference data, plausibility checks are possible, for example by tracing transects across an elevation gradient to check if the start of season (SOS) is positively correlated with height (Klisch and Atzberger, 2014). The same authors also use well documented climatological anom-alies (here an unusually cold winter in Ireland) as a means to check if the remotely derived LSP behaved in the expected manner. A range of other plausibility checks are illustrated in Atzberger and Eilers (2011b).
Phenology can be expressed and quantified remotely by a wide range of metrics. These might be the dates of certain biological stages: such as greenup (or onset of greenup), senescence, leaf colouring, flowering, bud burst or maturity. One can additionally explore the values of a vegetation index on the aforementioned dates, its maximum and minimum value (Lange et al., 2017) or its amplitude (Elmore et al., 2016). It is moreover possible to assess the length of season: the number of days between greenup and senescence and its variations throughout decades (Verhegghen, 2013). Amongst these metrics, greenup (start of season), maturity and senescence (end of season) dates are most common-place in the studies analysed within this review.
Remote sensing study of phenology can be separated into methods based on the calculation of vegeta-tion indices and alternative methods based for example on microwave or Lidar sensors.
Monitoring Forests Through Remote Sensing Final Report
23
2.1.3 Vegetation indices
The wide majority of studies are based on all kind of spectral vegetation indices such as NDVI, EVI or MTCI (Atkinson et al., 2012; Busetto et al., 2010; Reed et al., 2009). In some cases, Gross Primary Produc-tivity (GPP) of the forest has been modelled and taken as an indicator of canopy’s development and senescence (Gamon et al., 2016; Moreau and Defourny, 2012). In addition, several studies are using bio-physical variables such as LAI or fAPAR to assess land surface phenology (Meroni et al., 2013). These alternative “indices” will be covered here together with the spectral vegetation indices, as vegetation indices (VI) are by far the most ubiquitous satellite product used to monitor forest phenology, and have been used since the first developments of remote sensing (Frison et al., 2018; Verhegghen, 2013).
The two main vegetation indices are the Normalized Difference Vegetation Index (NDVI) and the En-hanced Vegetation Index (EVI). The NDVI uses the reflectance in the red and near infrared bands, the EVI adds to it the reflectance of a blue band, as well as aerosol coefficients and a background correction factor (Dugarsuren and Lin, 2016). There is also a two-band EVI (EVI-2) calculated only with red and near-infrared bands but still accounting for aerosol and soil adjustment (Elmore et al., 2016). Variations in NDVI are generally well correlated with seasonal changes in the vegetation (Dugarsuren and Lin, 2016). However, NDVI tends to saturate in areas with high biomass and is sensitive to soil background, whereas EVI was created to rectify these issues (Bhandari et al., 2012). Furthermore, snow has an almost null NDVI value, hence melting in the spring causes an artificial increase of the index, which is not linked to vegetation’s growth (Delbart, 2005). The EVI and NDVI do not reflect smaller variations in photosyn-thetic activity or consider the Light Use Efficiency (LUE), which are critical to monitor coniferous forests (Ulsig et al., 2017). For this purpose, another index, the Photochemical Reflectance Index (PRI), was created which combines reflectance in yellow and orange wavelengths (de Gea, 2018; Eklundh et al., 2011). PRI is sensitive to changes in carotenoid pigments in leaves and thus LUE throughout the year (Gamon et al., 2016). The reflectance chlorophyll/carotenoid index (CCI), comparing two different red bands (MODIS band 1 and 11), has also shown interesting results for evergreen forests (Gamon et al., 2016). Finally, the Normalized Difference Water Index (NDWI) was used as an alternative to NDVI, and combines shortwave infrared and infrared reflectance, which should override the snow melt effect and be more suitable in a boreal forest (Delbart, 2005).
Vegetation indices are very robust products, as well as straightforward to calculate (Verhegghen, 2013). They can be derived from most satellite’s multispectral sensor. In addition, they do not rely on any previous assumptions and can be extended accurately over pixels through time and space (Verhegghen, 2013). Even if different research groups favour specific vegetation indices, overall a strong similarity of the derived information has to be stated.
Far more important than the selection of a particular vegetation index is, however, the applied (pre)pro-cessing necessary to retrieve the sought information from the original data (Verger et al., 2013). Indeed, noise from undetected clouds and poor atmospheric conditions affects the values of vegetation indices and thus the derived phenology metrics (Atkinson et al., 2012; Hamunyela et al., 2013). The time series also usually presents data gaps, and it is in most cases necessary to do a temporal compositing or smoothing on it (Lange et al., 2017; Verhegghen, 2013). To fill data gaps, a large number of studies have applied a Maximum Value Composite procedure, which consists in retaining the highest VI value for a pixel inside the time period considered (Lange et al., 2017). Other studies use Fast Fourier Transfor-mation (FFT), Savitzky-Golay filtering, splines, Whittaker smoother or pre-defined functional forms to smooth and gap-fill the noisy original input data in a single step. Comparative studies involving those

Monitoring Forests Through Remote Sensing Final Report
24
methods are for example found in Atkinson et al. (2012) and DeBeurs and Henebry (2010), Cai et al. (2017), White et al. (2009) and Kandasamy et al. (2013).
Furthermore, the effects of understory vegetation on the remotely retrieved signal has to be consid-ered. In some forest environments, the understorey vegetation signal can even dominate the signal stemming from the overstory (Lange et al., 2017). If the spatial resolution is low, there is also a possi-bility for the pixel to also contain the reflectance of unwanted vegetation types and land uses (Lange et al., 2017); a phenomena called “mixed-pixel effect”.
Platforms with daily revisit time
The NASA provides a NDVI and EVI 16-days composite product (MOD13Q1), calculated with the MODIS sensor, which is directly available for use (Eklundh et al., 2011). It exists at a 1 km, 500 and 250 m spatial resolution and is particularly suitable for landscape-level assessments (St. Peter et al., 2018). However, few of the studies on phenology have utilized it, perhaps because of its relatively low temporal resolu-tion. Bhandari et al. (2012) have used this MODIS NDVI product for validation against the NDVI obtained with their Landsat time series. It was deemed optimal for validation as it ‘represents vegetation phenol-ogy correctly’. On average, the difference between start of season dates was marked, with 21 days. The peak of canopy and end of season dates, on the other hand, showed less variation between methods.
The composite MODIS NDVI series is qualified as ‘good proxy for the start and end of vegetation growing season’ (Hamunyela et al., 2013). The 250 m dataset was used to extract start of season dates for 2001 to 2011 in the whole of Western Europe. It was compared with temperature data as well as observations in stations from the Pan-European Phenological Network (Table 1). A significant correlation between satellite start of season and observations was only noted at a few of the stations and for some of the tree species. This lack of correlation can be attributed to the short year sample of the MODIS time series and a lack of consistent phenological observations in most of the stations (Hamunyela et al., 2013). Moreover, there is a fundamental difference between real phenological observations, and LSP from satellite, which explains the often observed lack of correlation.
Some authors have explored the utility of using temporal composite to assess phenology, as opposed to daily data. For instance, the NDVI and EVI 16-days composites from MODIS were compared with their daily equivalents (Testa et al., 2015). The results for the start of season dates were similar for both temporal resolutions, showing low agreement with Renecofor (Réseau National de suivi à long terme des ECOsystèmes FORestiers - National Network for Long-term FOrest ECOsystem Monitoring) network ground observations. Thus, it appears that time composites are sufficient to characterize phenology over these 50 plots. Indeed, daily data can be noisy which explains why many studies are based on composited vegetation indices.
More recently, the MODIS Land Cover Dynamics product (MCD12Q2), version 6, was brought out for 500 m resolution using the EVI-2. It characterizes global phenology annually by directly providing met-rics: minimum and amplitude of EVI-2, start of greenup, greenup midpoint and maturity dates, and start of senescence, senescence midpoint and dormancy dates (Gray et al., 2019). One study has made use of the earlier version of this product and has extracted the dates of onset of greenness increase and maximum (spring phenophase) and of onset of greenness decrease and minimum (autumn phe-nophase) (Elmore et al., 2016). The aim was to create regression models combining phenology records from citizens as part of the USA NPN with the MODIS phenology metrics. Only half of these models

Monitoring Forests Through Remote Sensing Final Report
25
turned out to be statistically significant, and amongst them the coefficients of determination were very variable ranging from 0.1 up to 1. The large database of observations from the phenological network requires a demanding quality control process, time-consuming and tedious. Furthermore, the autumn phenophase is detected less accurately than the spring onset, which is a pattern repeatedly found in a number of phenology studies (Elmore et al., 2016). An evaluation was carried out for the MODIS MCD12Q2 (version 5) compared to the GLOBCOVER Vegetation Growth Cycle Parameter (Samalens et al., 2010). GLOBCOVER combines data from SPOT Vegetation and ESA Earth Observation, at 1 km reso-lution, the parameters are derived annually from LAI curves, instead of a VI. Validation with the Ren-ecofor observations showed a higher accuracy of the MODIS product for the leaf unfolding stage in this context. This superior performance is likely a result of the higher spatial and temporal resolutions. In autumn, however, none of the products displayed any correlation with leaf discolouration dates (Sama-lens et al., 2010).
In the majority of experiments using MODIS, daily reflectance was utilized and then the compositing period was chosen to fit the objective. For instance, Li (2010) chose to calculate NDVI and EVI with an 8-days compositing period. A land cover map was used to select deciduous forests over the whole USA and phenological records from one specific forest were used as validation. Variations in both indices across a year were represented with logistic models. The signals were similar for NDVI and EVI, but the onset of greenup extracted was earlier than the field observed dates. This was explained by the compo-siting period and the 1 km resolution masking phenology of individual trees. However, the dormancy onset in autumn detected from the EVI was in accordance with field data, much more than NDVI (Figure 3). A study realized over Austria and Slovakia compared NDVI derived from SPOT and MODIS sensors with 10-days composite over six years. A variety of phenology metrics were extracted with the Phenolo model developed by the European Commission Joint Research Centre. For example, the peak of season, defined as the date of maximum NDVI, appeared quite different for the two satellite datasets (Clerici et al., 2012). The numerous metrics of this study were however not validated, they solely served as inputs for a habitat classification. An 8-day composite of MODIS reflectance was the basis to determine timing of events over Mongolia (Dugarsuren and Lin, 2016). The EVI and NDVI were calculated for a 10-year period, a threshold method allowing to retrieve onset of greenup and dormancy dates. The authors reported that EVI onset of greenup occurred earlier than NDVI while onset of dormancy was later for EVI. However, no formal validation step was implemented, which makes it impossible to assess the true accuracy of these metrics. Gamon et al. (2016) used the NASA atmospherically corrected daily MODIS data and did not composite reflectance values. They attempted to find a more suitable index to depict phenology in evergreen forests. Over a year, CCI and NDVI were computed and compared. A large num-ber of ground measurements were made; spectral reflectance, leaf pigments, leaf gas exchanges as well as flux data. The GPP derived from flux data was predicted more accurately by the CCI variations than by NDVI. The former index was said to reflect seasonal dynamics in evergreen forest environment better than greenness indices would. Similarly, PRI and NDVI were calculated with the same NASA corrected MODIS series over 13 years (Ulsig et al., 2017). The aim was testing which index would best render start and end of season in a Finnish coniferous forest. GPP was retrieved from flux measurements on the site, to serve as validation. The PRI profile showed the highest correlation with ground GPP, and their start of season dates were related by a high coefficient of determination. The validation of NDVI derived metrics also proved conclusive. However, end of season estimated values varied consistently between the different indices.

Monitoring Forests Through Remote Sensing Final Report
26
Figure 3. Map showing dormancy onset date in deciduous broadleaf forests over the US in 2003, colour legend indicates the
day of year (Source: Li, 2010).
The SPOT satellite VEGETATION system was specifically created for global phenology monitoring at a daily temporal resolution. In a study of the Amazonian evergreen forest, 10-days VEGETATION imagery composites at 1 km resolution were analysed (Moreau and Defourny, 2012). Both EVI and NDVI are calculated and compared to GPP retrieved from an eddy flux tower. There were no actual phenology metrics derived, but EVI variations, unlike NDVI, closely followed GPP ones. Thus, EVI seemed to perform better than NDVI, as has been reported repeatedly in tropical forest environments (Moreau and Defourny, 2012). A whole chapter of a thesis was dedicated to exploring phenology metrics derived from SPOT data around Europe (Verhegghen, 2013). The EVI and NDVI are computed over 13 years of SPOT VEGETATION reflectance. 7-days composites are created, and phenology metrics extracted with a derivative method. The metrics were: the start and end of season dates, corresponding VI values, the number of seasons, length of season, maximum VI value, and its corresponding maximum date. MODIS MCDQ12 product’s onset of greenness increase is used to visually verify the start of season date from SPOT. The start of season occurred at a similar time for both indices (same date in 60% of cases), whilst the end of season date shows more discrepancy between them. On a global scale, EVI represented seasonality better in tropical or cloudy areas and NDVI was recommended for sparsely vegetated ones. The mapped EVI start of season date values were considered ‘quite close’ to the MODIS ones. Two in-situ observations of start of season dates in France and Russia were compared to the NDVI-derived metric, the differences were respectively of 32 and 9 days. Unfortunately, the simple visual comparison is not a satisfactory validation to ensure the quality of the phenology metrics. These estimates would be more conclusive if compared with a larger number of in-situ observations (Verhegghen, 2013). The utility of the NDWI to assess phenology in boreal zones was demonstrated over Siberia (Delbart et al., 2005). A thresholding approach was implemented on NDWI and NDVI profiles to derive greenup and senescence dates from SPOT VEGETATION data. There was a high coefficient of determination between phenological observations and NDWI greenup and low root mean square error (RMSE). The methods that derived greenup from NDVI presented higher deviation from in-situ observed date. As for the se-nescence date, however, neither indices gave satisfying results (Delbart et al., 2005).
The Advanced Very-High Resolution Radiometer (AVHRR) sensor with its twice daily Earth coverage is a good candidate for forest phenology monitoring as well. Its relatively coarse resolution and wide swath allows for larger-scale studies. For instance, Luo et al. (2013) characterized phenology of all deciduous

Monitoring Forests Through Remote Sensing Final Report
27
forests in northern China. In addition, AVHRR delivers a ready to use NDVI dataset composited over 15 days. This product was used at an 8 km resolution in combination with temperature and ground pheno-logical data (Luo et al., 2013). The start of season per pixel and year was obtained from the profile using a midpoint model (Figure 4). A positive correlation between observed growing season beginning and the satellite metric was revealed. Yet, the NDVI time series of 21 years was favoured over the 16 years one, since it showed a higher correlation (Luo et al., 2013). These results suggest that investigating phe-nology accurately over a large area will require the longest available time series. Trends in phenology and plant productivity were examined in the Northern Hemisphere over a 30-year period using the AVHRR NDVI dataset. Correlations were drawn between the derived Start, end and length of season and the growing season integral, a proxy for productivity (Wang and Fensholt, 2017; Zhao et al., 2015).
Figure 4. Spatial distribution of a) beginning of season date derived from ground observations, b) start of season date derived
from AVHRR data, over 1986 to 2006 in Northern China, DOY: Day Of Year (Source: Luo et al., 2013).
The MERIS sensor onboard ESA’s Envisat satellite, no longer operational, had high spectral resolution and a daily revisit time. It was exploited to characterize phenology of all vegetation types over Czech Republic (Štych et al., 2015). NDVI, fraction of absorbed PAR (fAPAR) as well as LAI were calculated from the imagery and represented across one year. This study also took advantage of MERIS specific indices: MGVI (MERIS Global Vegetation Index) and MTCI (MERIS Terrestrial Chlorophyll Index). The former uses reflectance in blue, red, near-infrared and is related to vegetation greenness, while the latter is very sensitive to chlorophyll content. It was noticed that MERIS specific indices were valuable in discriminat-ing and highlighting forest dynamics. Still, it is hard to reach a conclusion since no validation or phenol-ogy metrics extraction were executed. This MGVI data was also gathered across seven years to study the land surface phenology of Ireland (O’Connor, 2011). The author investigated the composite period to accurately observe start of season and the optimal one was 10 days . Although the IPG Irish sites were mentioned as possible validation, these observations were not compared against satellite start of sea-son.

Monitoring Forests Through Remote Sensing Final Report
28
Finally, Zhang (2012) used a combination of sensor data on an USA-wide study. The AVHRR phenology metrics, MCDQ12 phenology product and MERIS MCTI were all evaluated over 4 years and resampled at an 8 km resolution to match (Zhang, 2012). A wide array of phenological observations across several sites and networks were put in comparison with MODIS data. The greenup onset dates match the ear-liest spring ground events, but the fall phenophase dates showed no correlation at all with MODIS se-nescence onset. MCTI and MODIS derived onset of greenup were closer than any other combination of satellite data metrics. Here, it was inferred that different sensors displayed similar seasonal spring pat-terns over a large spatial extent, although the exact greenup dates diverged (Zhang, 2012).
Platforms with longer revisit time
Sentinel-2 and 3 imagery are cited in a multitude of papers as tools that could potentially improve phe-nology studies capacities. Indeed, the various bands in the red-edge appear extremely suitable for this purpose (Štych et al., 2015). Their high spatial resolution is likely to lower mixed-pixel effect, and the corrections included will simplify their use (Lange et al., 2017). Nonetheless, Sentinel data have not yet been commonly utilized to track phenology in forest environments.
Sen3App is a project financed by the 7th Framework Programme of the European Commission and de-veloped by the Finnish Meteorological Institute. It aimed in establishing processing lines for Sentinel satellites data to map land cover and phenology. Within this project, the Finnish Environment Institute is generating annual maps, with the dates of start and end of growing season for deciduous and ever-green forests (Finnish Meteorological Institute, 2016). They have been produced using the NDVI and NDWI, from 2001 on with MODIS signal, but Sentinel-3 will become its main platform going forward. The spatial resolution is currently 5 km and it was validated successfully for Finland against in-situ ob-servations of bud break. In addition, the Copernicus Land Monitoring Service intends to release a phe-nology product from Sentinel-2 data in 2020 (Copernicus Programme, 2019). It would be available 1 to 3 days after sensing date, allowing near-real time monitoring at 10-20 m spatial resolution. The Evolu-tion of Copernicus Land Services based on Sentinel data (ECoLaSS) project in a requirement report also mentioned that a European-wide phenology layer was one of the highest-priority demands of users (Schwab et al., 2019). This product should be providing start, end and length of growing season metrics.
A pilot study assessed the possibility of using Sentinel-2 data to monitor forest phenology, before it was available. SPOT-4 and 5 imagery at 20 and 10 m resolution were used to simulate Sentinel-2. NDVI was calculated over 16-days composites. The TIMESAT programme applied filtering and smoothing and pro-duced realistic NDVI profiles for forest. The system also calculates a variety of metrics useful in phenol-ogy analysis. The hypothesis inferred is that ‘combination of TIMESAT and high-resolution data from Sentinel-2 will be excellent for extracting precise and spatially detailed information’ on phenology. In their comparison of Sentinel-2 and MODIS phenology metrics against indicators derived from near-sur-face sensors, the former showed much closer dates of greenup and senescence than the latter (Lange et al., 2017). Consequently, the Sentinel-2 platform seems optimal to accurately represent phenology in the forest landscape.
Coarse-resolution sensors are limited in their rendition of spatial variability of phenology and they are more difficult to compare with ground-measurements . Landsat with its high spatial resolution of 30 m can in principle address this limitation. Very frequent field observations were associated with Landsat TM and ETM+ imagery at several local sites in the USA (J. C. White et al., 2014). Hemispheric canopy photographs were also analysed to provide LAI and canopy greenness estimates. NDVI, NDWI, EVI were
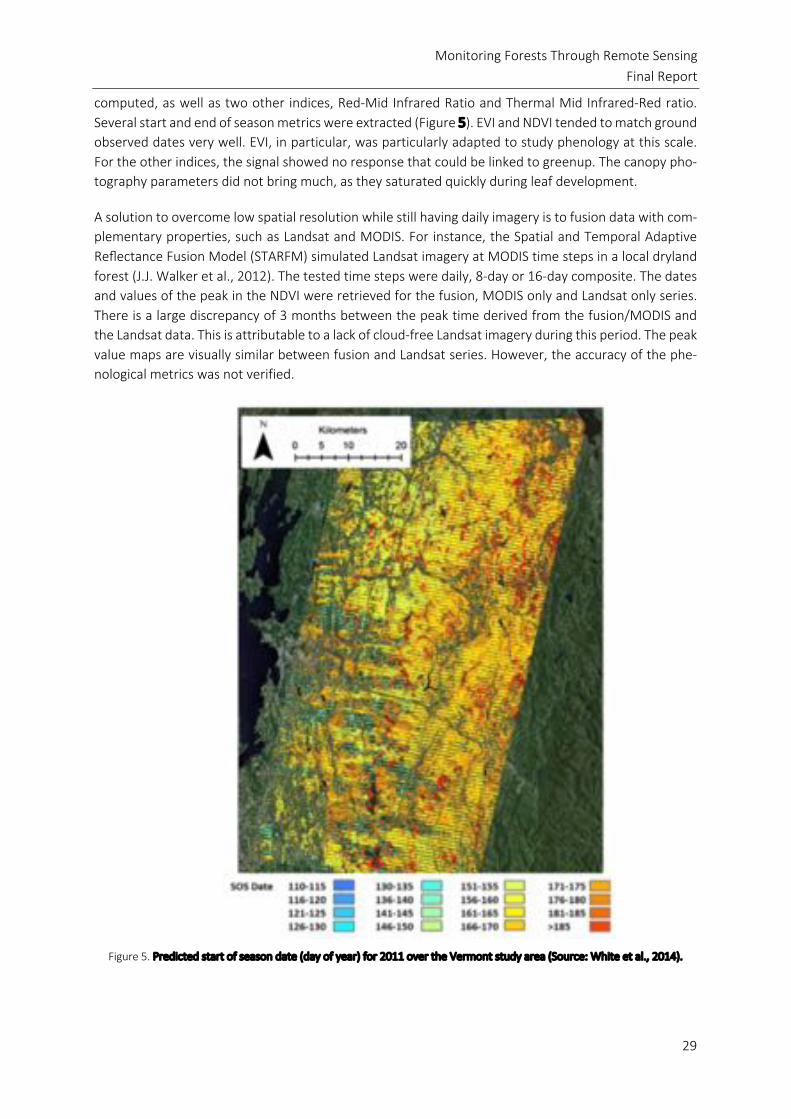
Monitoring Forests Through Remote Sensing Final Report
29
computed, as well as two other indices, Red-Mid Infrared Ratio and Thermal Mid Infrared-Red ratio. Several start and end of season metrics were extracted (Figure 5). EVI and NDVI tended to match ground observed dates very well. EVI, in particular, was particularly adapted to study phenology at this scale. For the other indices, the signal showed no response that could be linked to greenup. The canopy pho-tography parameters did not bring much, as they saturated quickly during leaf development.
A solution to overcome low spatial resolution while still having daily imagery is to fusion data with com-plementary properties, such as Landsat and MODIS. For instance, the Spatial and Temporal Adaptive Reflectance Fusion Model (STARFM) simulated Landsat imagery at MODIS time steps in a local dryland forest (J.J. Walker et al., 2012). The tested time steps were daily, 8-day or 16-day composite. The dates and values of the peak in the NDVI were retrieved for the fusion, MODIS only and Landsat only series. There is a large discrepancy of 3 months between the peak time derived from the fusion/MODIS and the Landsat data. This is attributable to a lack of cloud-free Landsat imagery during this period. The peak value maps are visually similar between fusion and Landsat series. However, the accuracy of the phe-nological metrics was not verified.
Figure 5. Predicted start of season date (day of year) for 2011 over the Vermont study area (Source: White et al., 2014).

Monitoring Forests Through Remote Sensing Final Report
30
2.1.4 Other methods
Optical sensors can show gaps in time series due to cloud cover or low daylight, they are in addition unable to render forest structure in details (Frison et al., 2018; Rüetschi et al., 2018). To obtain all-weather capacity, synthetic aperture radar (SAR) instruments, such as present on the Sentinel-1 satel-lites, provide continuous time series regardless of the conditions, resulting in potentially useful esti-mates of vegetation phenology (Frison et al., 2018).
In order to verify this hypothesis, a study at local scale compared SAR temporal profiles with Landsat NDVI variations. The radar data originated from Sentinel-1A, with 12 days temporal resolution, in the period from Spring 2015 to Winter 2017. The backscattering coefficients for the vertical-vertical (VV) and vertical-horizontal (VH) polarizations were analysed over the forest. The ratio between both coeffi-cients appeared very close to Landsat NDVI signal for deciduous stands, showing a sharp increase in spring and decrease in winter. Evergreen ones showed no distinct seasonality in the radar signal, which limits the use of this method. Overall, Sentinel-1 was seen as applicable to monitor phenology in local deciduous forests, thanks to its high spatial and temporal resolution (Frison et al., 2018).
Rüetschi et al. (2018) monitored forest seasonal cycles in a canton of Switzerland. They collected Senti-nel-1 data with a 12 days compositing period, an official forest stand map as well as meteorological and phenological information. The SAR backscatter signal over time presented break points, the first break date was related to leaf emergence while the second was linked to leaf fall. Deciduous and coniferous forests had an opposite yearly backscatter pattern. Radar derived metrics showed reasonable agree-ment with ground phenological dates, most deviations were inferior or equal to the 12 days resolution of the composite. The second break date in the signal was claimed being an especially accurate predictor of the actual leaf fall date. Generally, however, signal from active microwave sensors are extremely noisy and often show artefacts that cannot be related to any ground characteristic.
Spring phenology can also be assessed with terrestrial Light Detection and Ranging (LiDAR). Indeed, this technique allows to characterize the structure and tree height inside the forest, and was applied here to display Plant Area Index (PAI) along the season (Calders et al., 2015). The LiDAR measurements were made frequently in the beginning of spring and then less so as spring passed. The PAI values were fitted to a sigmoidal model, from which a threshold was set to retrieve start of season dates. Validation took the form of regular field observations, meteorological data as well as the NDVI curve from MODIS. The dates noted by the observers were the exact same or up to 3 days later than the LiDAR start of season. The difference between LiDAR and MODIS estimate was a lot more significant (Calders et al., 2015). Notwithstanding the conclusive results, terrestrial LiDAR requires frequent and extensive ground work which would be unreasonable for a monitoring at EU scale.
An Unmanned Aerial Vehicle (UAV) has been used in Portugal to detect flowering and thus distribution of a plant invasive species (de Sá et al., 2018). Values of two colour indices (greenness and redness chromatic coordinate) extracted from UAV imagery allowed to calculate the date of end, start and mid-dle of spring and fall for a canopy in the USA. These dates were validated against ground measurements of PAI and a high correlation was found. UAVs can be deployed in a landscape study of phenology, whilst ensuring a similar resolution to near surface photography (Klosterman and Richardson, 2017). However, the spatial extent of UAVs are rather limited, per area costs of UAVs are extremely high, European for-ests are numerous and a whole UAV-based system would not be applicable to the whole of the territory (de Sá et al., 2018). Notwithstanding the fact that one has to plan and carry out a high number of flights to be able to accurately spot the date of a given stage. As a result of these limitations, UAVs are best

Monitoring Forests Through Remote Sensing Final Report
31
used for very local studies, or as a means to characterise in high spatial detail in-situ measurement sites. A much better coverage and for a fraction of costs, one could alternatively employ aircrafts. Until now, however, aerial photography has been very rarely applied to assessing phenology in forests, probably because it is difficult to expand to a wide area and the still non-negligible costs. Still, photographs taken from a small aircraft have been said to detect phenological differences between tree species at a local scale (Key et al., 2001).
2.1.1 Conclusion and Summary Table Phenology
In summary, the following general statements can be made:
• Sentinel-2 data seems to have the optimal spatial and spectral resolution to study forest phe-nology EU-wide. The future phenology layer of Copernicus Land Monitoring Service appears as a possible candidate for this purpose.
• Imagery from satellites with daily revisit time present a lower spatial resolution, which makes it harder to represent fine-scale spatial patterns in phenology. However, MODIS has proven to be an excellent sensor to derive a variety of LSP products.
• Possibly, Sentinel-1 data can be used as a complement on days with adverse meteorological conditions to fill longer-lasting data gaps.
• LiDAR or UAV are not adapted for this spatial scale and would require important human and financial resources to operate. If such very detailed data were required, classical airborne data would be a much better alternative.

Monitoring Forests Through Remote Sensing Final Report
32
Table 1. Summary table listing characteristics of a few phenological networks
Reference Info source
Status and name of entity operating sys-
tem
Spatial Extent
Temporal Extent
Frequency of measure
Number of plots
Size of plots Species num-ber and distri-
bution
Phenology metrics
Limitations Application
use Product dis-semination
Operators Measurement
standards Product check Link doc
Renecofor Project web-
site
Office National
des Forêts, for-
estry agency
Country
(France)
27 years (1992-
today) Weekly 102 2 ha
One species
per plot
Start, End of
Season
Only one spe-
cies per plot
Monitoring
pollution im-
pact on forests
Freely
available
Professional
staff Medium Yes
http://www1.o
nf.fr/ren-
ecofor/som-
maire/sites/++
oid++b6b/@@
display_ad-
vise.html
International Co-operative Pro-gramme on the Assessment and
Monitoring of Air Pollution Effects on Forests (ICP
Forests)
Manual
United Nations
Economic
Commission
for Europe
Continent
(Europe)
25 years
(1994-today) Yearly 183 +/- 0,25ha Not specified
Leaf unfolding,
flowering, leaf
fall
Labour
intensive
Monitor
forests in a
standardized
manner
On request Professional
staff High No
http://www.ic
p-for-
ests.org/pdf/m
anual/2016/IC
P_Man-
ual_2016_01_
part06.pdf
International Phenological
Gardens of Europe (IPG)
Book
chapter
Humboldt
University Ber-
lin
Continent
(Europe)
60 years
(1959-today) Unknown 71 Unknown
Same few vari-
eties
on each plot
Leaf unfolding,
flowering,
fruiting, au-
tumn colour-
ing, leaf fall
Constraints of
maintaining
pure varieties
Phenological
mapping, data
for modelling,
climate change
impact
Registered
users
Professional
staff High No
http://ipg.hu-
berlin.de/
USA National
Phenology Network
Report
US Geological
Survey, Re-
search Insti-
tute
Country
(USA)
12 years
(2007-today)
Possibly
endless
Possibly
endless
No specific
area Any species
Time of start
and end of
phenophase
and intensity
on the site
Heterogenous
locations and
time of record-
ings, accuracy
variable de-
pending on us-
ers
Collect, store,
share pheno-
logical data
Freely
available
Citizens or
professionals Medium Yes
https://www.u
sanpn.org
Pan-European Phenology Data-
base
Project web-
site
Zentralanstalt
für Meteorolo-
gie und Geody-
namik, public
research insti-
tute & Net-
work of Euro-
pean Meteoro-
logical Services
Continent
(Europe)
60 years
(1950-today)
Possibly end-
less 20,000
No specific
area Any species
All phenopha-
ses
Heterogenous
locations and
time of record-
ings
Promote and
facilitate phe-
nological re-
search by de-
livering a pan
European da-
tabase
Registered
users
National mete-
orological ser-
vices (profes-
sionals)
Variable
depending on
the data pro-
vider
Yes
http://www.pe
p725.eu/in-
dex.php
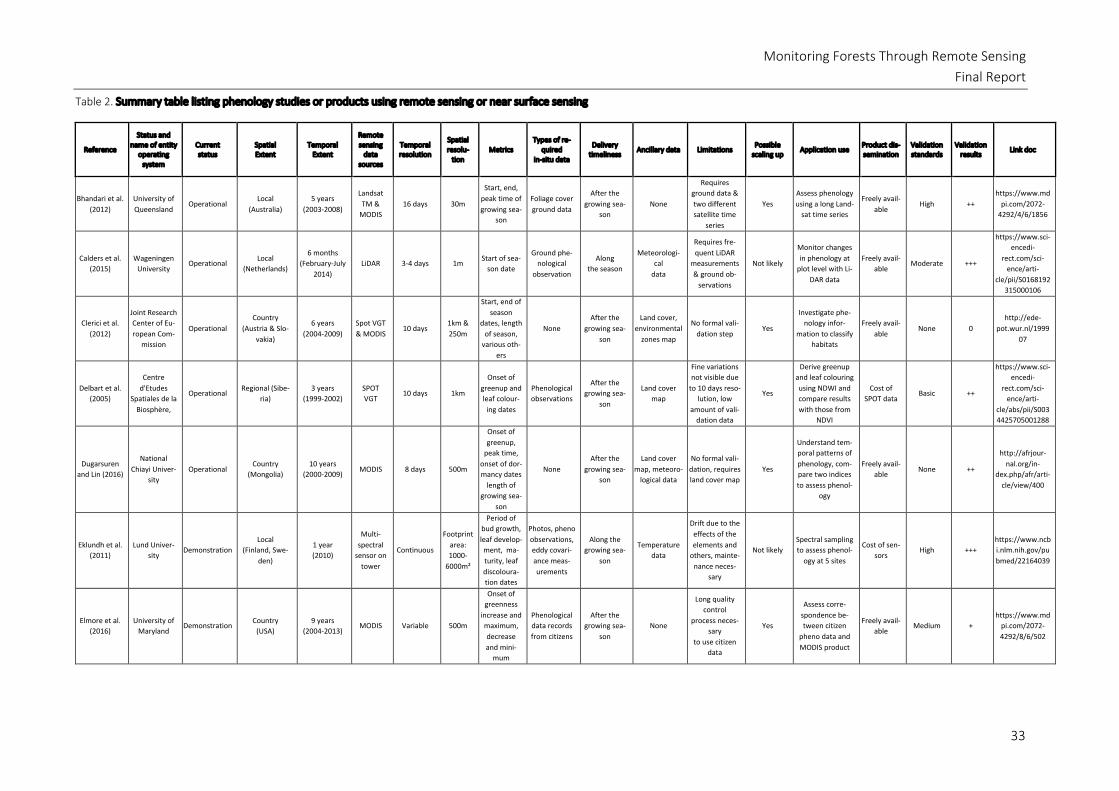
Monitoring Forests Through Remote Sensing Final Report
33
Table 2. Summary table listing phenology studies or products using remote sensing or near surface sensing
Reference
Status and name of entity
operating system
Current status
Spatial Extent
Temporal Extent
Remote sensing
data sources
Temporal resolution
Spatial resolu-
tion Metrics
Types of re-quired
in-situ data
Delivery timeliness
Ancillary data Limitations Possible
scaling up Application use
Product dis-semination
Validation standards
Validation results
Link doc
Bhandari et al.
(2012)
University of
Queensland Operational
Local
(Australia)
5 years
(2003-2008)
Landsat
TM &
MODIS
16 days 30m
Start, end,
peak time of
growing sea-
son
Foliage cover
ground data
After the
growing sea-
son
None
Requires
ground data &
two different
satellite time
series
Yes
Assess phenology
using a long Land-
sat time series
Freely avail-
able High ++
https://www.md
pi.com/2072-
4292/4/6/1856
Calders et al.
(2015)
Wageningen
University Operational
Local
(Netherlands)
6 months
(February-July
2014)
LiDAR 3-4 days 1m Start of sea-
son date
Ground phe-
nological
observation
Along
the season
Meteorologi-
cal
data
Requires fre-
quent LiDAR
measurements
& ground ob-
servations
Not likely
Monitor changes
in phenology at
plot level with Li-
DAR data
Freely avail-
able Moderate +++
https://www.sci-
encedi-
rect.com/sci-
ence/arti-
cle/pii/S0168192
315000106
Clerici et al.
(2012)
Joint Research
Center of Eu-
ropean Com-
mission
Operational
Country
(Austria & Slo-
vakia)
6 years
(2004-2009)
Spot VGT
& MODIS 10 days
1km &
250m
Start, end of
season
dates, length
of season,
various oth-
ers
None
After the
growing sea-
son
Land cover,
environmental
zones map
No formal vali-
dation step Yes
Investigate phe-
nology infor-
mation to classify
habitats
Freely avail-
able None 0
http://ede-
pot.wur.nl/1999
07
Delbart et al.
(2005)
Centre
d'Etudes
Spatiales de la
Biosphère,
Operational Regional (Sibe-
ria)
3 years
(1999-2002)
SPOT
VGT 10 days 1km
Onset of
greenup and
leaf colour-
ing dates
Phenological
observations
After the
growing sea-
son
Land cover
map
Fine variations
not visible due
to 10 days reso-
lution, low
amount of vali-
dation data
Yes
Derive greenup
and leaf colouring
using NDWI and
compare results
with those from
NDVI
Cost of
SPOT data Basic ++
https://www.sci-
encedi-
rect.com/sci-
ence/arti-
cle/abs/pii/S003
4425705001288
Dugarsuren
and Lin (2016)
National
Chiayi Univer-
sity
Operational Country
(Mongolia)
10 years
(2000-2009) MODIS 8 days 500m
Onset of
greenup,
peak time,
onset of dor-
mancy dates
length of
growing sea-
son
None
After the
growing sea-
son
Land cover
map, meteoro-
logical data
No formal vali-
dation, requires
land cover map
Yes
Understand tem-
poral patterns of
phenology, com-
pare two indices
to assess phenol-
ogy
Freely avail-
able None ++
http://afrjour-
nal.org/in-
dex.php/afr/arti-
cle/view/400
Eklundh et al.
(2011)
Lund Univer-
sity Demonstration
Local
(Finland, Swe-
den)
1 year
(2010)
Multi-
spectral
sensor on
tower
Continuous
Footprint
area:
1000-
6000m²
Period of
bud growth,
leaf develop-
ment, ma-
turity, leaf
discoloura-
tion dates
Photos, pheno
observations,
eddy covari-
ance meas-
urements
Along the
growing sea-
son
Temperature
data
Drift due to the
effects of the
elements and
others, mainte-
nance neces-
sary
Not likely
Spectral sampling
to assess phenol-
ogy at 5 sites
Cost of sen-
sors High +++
https://www.ncb
i.nlm.nih.gov/pu
bmed/22164039
Elmore et al.
(2016)
University of
Maryland Demonstration
Country
(USA)
9 years
(2004-2013) MODIS Variable 500m
Onset of
greenness
increase and
maximum,
decrease
and mini-
mum
Phenological
data records
from citizens
After the
growing sea-
son
None
Long quality
control
process neces-
sary
to use citizen
data
Yes
Assess corre-
spondence be-
tween citizen
pheno data and
MODIS product
Freely avail-
able Medium +
https://www.md
pi.com/2072-
4292/8/6/502

Monitoring Forests Through Remote Sensing Final Report
34
Reference
Status and name of entity
operating system
Current status
Spatial Extent
Temporal Extent
Remote sensing
data sources
Temporal resolution
Spatial resolu-
tion Metrics
Types of re-quired
in-situ data
Delivery timeliness
Ancillary data Limitations Possible
scaling up Application use
Product dis-semination
Validation standards
Validation results
Link doc
Frison et al.
(2018)
Université
Paris-Est Demonstration
Regional
(France)
2 years
(2015-2017)
Sentinel-1
SAR 12 days 20m
Backscatter-
ing coeffi-
cient varia-
tions
None
After the
growing sea-
son
Digital
Elevation
Model
Unable to
detect season-
ality
over coniferous
forests
Yes
Analyse potential
of Sentinel-1 data
to monitor tem-
perate forests
Freely avail-
able Medium ++
https://www.md
pi.com/2072-
4292/10/12/204
9
Gamon et al.
(2016)
University of
Alberta Demonstration
Local
(Canada)
1 year
(2012-2013) MODIS 1-2 days 1km
Gross pri-
mary
productivity
along the
year
Flux & spec-
tral reflec-
tance meas-
urements
After the
growing sea-
son
None
Need for
independent
ground valida-
tion
Not likely
Detect photosyn-
thetic activity in
evergreen forests
with new index
Freely avail-
able Medium +++
https://www.pn
as.org/con-
tent/113/46/130
87
Hamunyela et
al. (2013)
Wageningen
University Demonstration
Continental
(Western Eu-
rope)
10 years
(2001-2011) MODIS 16 days 250m
Start of sea-
son date
Ground phe-
nological ob-
servations
After the
growing sea-
son
Temperature
data
Frequent pheno
observations
only limited to
2 countries in
the region
Yes
Compare tem-
poral trends of
start of season be-
tween satellite
and in-situ obser-
vations
Freely avail-
able High +
https://core.ac.u
k/down-
load/pdf/292173
88.pdf
Klosterman
and Richard-
son (2017)
Harvard Uni-
versity Operational Local (USA)
1 year
(2015)
Un-
manned
Aerial Ve-
hicle
5 days
(spring)
7 days
(fall)
1cm
Start, mid-
dle, end of
spring, start,
middle, end
of fall dates
Phenological
observations
& plant area
index meas-
urements
After the
growing sea-
son
None
Labour for UAV
flights, error
linked to trees
with naturally
reddish leaves
Not likely
Determine leaf life
cycles with aerial
drone imagery
Cost of UAV
device Moderate +++
https://www.ncb
i.nlm.nih.gov/pu
bmed/29292742
Klosterman et
al. (2014)
Harvard Uni-
versity Operational
Regional
(Eastern USA &
Canada)
10 years
(2005-2014)
PhenoCam
& MODIS 3 & 8 days
0.1 mm
& 1.5km
Start, mid-
dle, end of
spring, start,
middle, end
of fall dates
None
Along the
growing sea-
son
Land cover
maps
Spatial extent
limited to the
camera sites,
more uncer-
tainty for fall
phenology met-
rics
Not over the
whole EU,
but existing
webcams
can be used
Evaluate corre-
spondence be-
tween visual bio-
logical events and
sensor-based phe-
nology dates
Freely avail-
able High +++
https://www.bi-
ogeosci-
ences.net/11/43
05/2014/
Lange et al.
(2017)
Helmholtz-
Centre
for Environ-
mental Re-
search
Operational Local
(Germany)
2 years
(Spring 2015-
Winter 2016)
Sentinel-2
& MODIS 1 day
10m
& 250m
Greenup, se-
nescence
dates, dates
of min &
max NDVI
Multispectral
and hyper-
spectral sen-
sors measure
After the
growing sea-
son
None
Snow melt ef-
fect affects veg-
etation index
Not likely
Validate phenol-
ogy products with
ground sensor
measurements
Cost of sen-
sors Moderate +++
https://www.ncb
i.nlm.nih.gov/pm
c/arti-
cles/PMC557947
9/
Li (2010) George Mason
University Operational Country (USA)
7 years
(2001-2007) MODIS 8 days 1km
Greenup on-
set and dor-
mancy dates
Ground phe-
nological ob-
servations
After the
growing sea-
son
Land use map,
land surface
temperature
data
Onset of
greeenup date
not well pre-
dicted with the
method
Yes
Quantify pheno-
logical variation at
broad geographic
scale
Freely avail-
able High +
http://mars.gmu
.edu/han-
dle/1920/6027
Luo et al.
(2013)
Peking Univer-
sity Demonstration
Regional
(Northern
China)
26 years
(1981-2006
&
30 years
(1981-2011)
AVHRR 15 days 8km Start of sea-
son date
Phenological
observations
After the
growing sea-
son
Land cover
map, tempera-
ture data
Requires exten-
sive ground and
temperature
data, lower cor-
relation with a
shorter satellite
time series
Not likely
Compare perfor-
mance of satellite
start of season
with ground be-
ginning of season
dates
Freely avail-
able Moderate ++
https://www.md
pi.com/2072-
4292/5/2/845

Monitoring Forests Through Remote Sensing Final Report
35
Reference
Status and name of entity
operating system
Current status
Spatial Extent
Temporal Extent
Remote sensing
data sources
Temporal resolution
Spatial resolu-
tion Metrics
Types of re-quired
in-situ data
Delivery timeliness
Ancillary data Limitations Possible
scaling up Application use
Product dis-semination
Validation standards
Validation results
Link doc
Moreau and
Defourny
(2012)
IEEE Interna-
tional
Geoscience
and Remote
Sensing Sym-
posium, Mu-
nich
Operational Regional (Ama-
zon)
11 years
(2000-2010)
SPOT
VGT 10 days 1km
Gross pri-
mary
productivity
Eddy flux
measure-
ments
After the
growing sea-
son
Meteorologi-
cal data
Requires eddy
flux data Not likely
Determine sea-
sonal characteris-
tics of evergreen
tropical forest
Cost of
SPOT data High ++
https://ieeex-
plore.ieee.org/d
ocu-
ment/6351641
O’Connor
(2011)
University Col-
lege Cork Operational
Country (Ire-
land)
7 years (2003-
2009) MERIS 10 days 1.2km
Start of sea-
son date
Optional to
improve accu-
racy
After the
growing sea-
son
CORINE land
cover map
Compositing
period, cloud
cover
Yes
Land Surface Phe-
nology at country
scale
Freely avail-
able Basic ++
https://cora.ucc.i
e/han-
dle/10468/501?s
how=full
PhenoCam
Network
University
of New Hamp-
shire
Operational
Global (mostly
Americas + Eu-
rope)
2005-today Webcams 30 mins 0.1mm
Spring
greenup
date
Radiation and
photon flux
density meas-
urements
Along
the season None
Cameras
require
maintenance,
variable solar
radiation can
cause bias
Not over the
whole EU,
but existing
webcams
can be used
Continuous real-
time monitoring
of phenology
across ecosystems
Freely avail-
able after
sign up
Medium +++
https://pheno-
cam.sr.unh.edu/
webcam/about/
Phenology
Layer
Copernicus
Land Monitor-
ing Service,
EU pro-
gramme
Planned-
in testing
Continent (Eu-
rope)
Continuous
from 2017
Sentinel
1 & 2 2-3 days 10-30m N/A N/A N/A N/A N/A
Adequate
scale
Assess phenology
metrics at Euro-
pean scale
Planned
for 2019 N/A N/A
https://land.co-
perni-
cus.eu/product-
portfolio/over-
view
Phenology
Product
Finnish Envi-
ronment
Institute
(SYKE)
Demonstration Country (Fin-
land) 2001-2016 MODIS Annual 5km
Start of
season date
Ground
phenological
data
After the
growing sea-
son
None
Cloud cover,
low light condi-
tions, decidu-
ous and ever-
green forest
products sepa-
rated
Possible Explore phenology
in boreal zones On request Medium +
https://cordis.eu
ropa.eu/docs/re-
sults/607/60705
2/final1-
sen3app-final-re-
port.pdf
Rankine
(2016)
University of
Alberta Demonstration
Local
(Brazil)
7 years
(2007-2014)
Radio-
metric
sensors &
MODIS
100m
&250m
15 min &
16 days
Onset of
greenup,
maturity, se-
nescence
dates, length
of season
None
After the
growing sea-
son
None
Discrepancy be-
tween near)sur-
face and MODIS
signal, light, ge-
ometry effects
Not likely
Investigate perfor-
mance of MODIS
product with radi-
ometric monitor-
ing systems
Cost of sen-
sors Moderate +
https://era.li-
brary.ual-
berta.ca/items/0
e392612-5c96-
4ed6-bb39-
45ee4fa5624b
Rüetschi et al.
(2018)
Zürich Univer-
sity Operational
Regional
(Switzerland)
2.5 years
(January 2015-
May 2017)
Sentinel-1
SAR 24 days 10m
Break dates
in backscat-
ter signal
Phenological
observations
After the
growing sea-
son
Digital
Elevation
Model
Trouble extract-
ing break dates
when disturb-
ance in
backscatter sig-
nal
Not likely
Classify mixed
temperate forests
and explore vege-
tation seasonal cy-
cles
Freely avail-
able Moderate ++
http://www.mdp
i.com/2072-
4292/10/1/55
Samalens et
al. (2010)
Institut Na-
tional de la
Recherche
Agronomique,
public re-
search insti-
tute
Demonstration Country
(France)
6 years
(2001-2006) &
10 years
(1998-2007)
MODIS &
Globcover
product
(SPOT
VGT/MERI
S)
Annual 500m &
1km
Onset of
greenness
increase, de-
crease, max-
imum, mini-
mum,
Renecofor
network ob-
servations
After the
growing sea-
son
National forest
inventory da-
tabase
Neither prod-
ucts can predict
leaf discolora-
tion date
Not likely
Evaluate capacity
of two phenology
products to moni-
tor forest foliar
dynamics
Freely avail-
able Moderate +
https://prodinra.
inra.fr/?lo-
cale=fr#!Consult-
Notice:37825

Monitoring Forests Through Remote Sensing Final Report
36
Reference
Status and name of entity
operating system
Current status
Spatial Extent
Temporal Extent
Remote sensing
data sources
Temporal resolution
Spatial resolu-
tion Metrics
Types of re-quired
in-situ data
Delivery timeliness
Ancillary data Limitations Possible
scaling up Application use
Product dis-semination
Validation standards
Validation results
Link doc
Štych et al.
(2015)
Charles Uni-
versity Prototype
Country
(Czech Republic) 1 year (2009) MERIS Monthly 300m
VI, LAI, PAR
profiles None
After the
growing sea-
son
Land cover
map
No quantitative
metrics of phe-
nology, no for-
mal validation
step
Not likely
Evaluate spectral
characteristics of
various land cover
with MERIS and
GIS
Freely avail-
able None 0
http://aucgeo-
graphica.cz/in-
dex.php/aucg/ar
ticle/view/88
Testa et al.
(2015)
IEEE Interna-
tional
Geoscience
and Remote
Sensing Sym-
posium,
Milan
Operational Country
(France)
12 years
(2001-2012) MODIS
16 days
or 1 day 250m
Start of sea-
son date
Phenological
network ob-
servations
After the
growing sea-
son
None
Relatively high
deviation be-
tween satellite
metrics and the
dates from ob-
servations
Not likely
Estimate start of
season with com-
bination of vege-
tation index and
MODIS data
Freely avail-
able Moderate +
http://ieeex-
plore.ieee.org/d
ocu-
ment/7326857/
Ulsig et al.
(2017)
University of
Edinburgh Operational Local (Finland)
13 years
(2002-2014) MODIS Daily 1km
Start, end of
season dates
Flux measure-
ments
After the
growing sea-
son
None
End of season
not estimated
correctly with
satellite data
Yes
Investigate indices
to infer photosyn-
thetic activity in a
coniferous forest
On request High +++
http://www.mdp
i.com/2072-
4292/9/1/49
Verhegghen
(2013)
Université de
Louvain Operational
Continent
(Europe)
12 years
(1999-2011)
SPOT
VGT 7 days 1km
Start, end of
season
dates, length
of season,
number of
seasons
Few pheno-
logical obser-
vations for
comparison
After the
growing sea-
son
Land cover
map
Lower detec-
tion in moun-
tains / high lati-
tude, validation
by simple com-
parison with
MODIS data
Yes
Extract phenologi-
cal metrics at
global scale
Cost of
SPOT data Basic +
https://dial.uclo
uvain.be/pr/bo-
real/object/bo-
real:135909
Walker et al.
(2012)
Virginia Poly-
technic Insti-
tute and
State Univer-
sity
Demonstration Local (USA) 1 growing sea-
son (2006)
MODIS &
Landsat
data fu-
sion
Variable 30m
NDVI peak
date and
value
None
After the
growing sea-
son
Land cover
map
No formal vali-
dation, error in
phenology met-
ric due to gaps
in Landsat se-
ries
Yes
Observe efficacy
of MODIS and
Landsat fusion for
phenology moni-
toring in dryland
forest
Freely avail-
able None +
https://linking-
hub.else-
vier.com/re-
trieve/pii/S0034
425711003622
White et al.
(2014)
University of
Vermont Prototype
Region
(Vermont state)
5 months
(March-July
2011)
Landsat
TM/ETM+ 16 days 15-30m
Start of sea-
son date
Ground phe-
nological data
+ hemispheric
photos
After the
growing sea-
son
None
Bud burst not
visible with RS,
more error in
mixed forests
Not likely
Compare methods
with Landsat im-
agery
Freely
available Medium +
https://www.fs.f
ed.us/nrs/pubs/j
rnl/2014/nrs_20
14_white_001.p
df
Zhang (2012) Utah State
University Operational
Continent
(North America)
6 years
(2001-2006) MODIS Annual 500m
Greenup on-
set, ma-
turity, dor-
mancy, se-
nescence
dates
Ground phe-
nological ob-
servations
After the
growing sea-
son
None
Relies on high
number
of ground data,
no correlation
for fall phenol-
ogy
Adequate
scale
Comparison of re-
mote sensing
products with ac-
tual plant phenol-
ogy
Freely
available High ++
https://digital-
com-
mons.usu.edu/et
d/1316/

Monitoring Forests Through Remote Sensing
Final Report
2.2 Illegal logging
The global degradation of forests is mostly the result of selective logging, be it legal or illegal (Bourgoin et al., 2018; Shimabukuro et al., 2014). Illegal logging not only touches tropical countries with important and precious timber resources, but it is also an issue in Europe. Chatham House on their web portal identifies illegal logging as significant in countries such as Greece, Romania, Latvia or Cyprus. Russia, Ukraine and Kosovo are also particularly impacted (Chatham House The Royal Institute of International Affairs, 2019). Some conditions facilitate the apparition and development of illegal logging; for instance weak forest management institutions, corruption and a lack of law enforcement (Jovanović and Mila-nović, 2017; Kuemmerle et al., 2009). In Europe, however, this phenomenon does not reach the extent and volume that it does in South-East Asia, Africa or Amazonia (Chatham House The Royal Institute of International Affairs, 2019). Furthermore, the EU No 995/2010 regulation prohibits the trade of illegally sourced timber inside the European Union (European Commission, 2019).
Illegal logging is not without consequences as it produces disturbances to forest biodiversity and soil, can damage the residual trees and reduces carbon storage (Hirschmugl et al., 2014). Logging also mod-ifies the structure and organization of the natural forest. It will require the building of logging roads and decks and will present more canopy gaps than untouched forest (Bourgoin et al., 2018; Broadbent et al., 2006). In these situations, usually, the most valuable trees in the forest will be harvested first (Bour-goin et al., 2018; Hethcoat et al., 2019). The forest edges will be more susceptible to fire, droughts or use for agriculture after being logged (Bourgoin et al., 2018). Yet, illegal logging will be less visible than legal harvest because of the lower biomass collected, especially if it takes place in an area already ex-ploited (Bourgoin et al., 2018).
Forestry statistics or inventories do not provide reliable estimates of logging, and survey methods are often not consistent or unclear (Kuemmerle et al., 2009; Sieber et al., 2013). Illegal logging by definition defies official surveying, and no internationally accepted definition of this practice exists (Jovanović and Milanović, 2017; Kuemmerle et al., 2009). Remote sensing can be part of the solution, as it can monitor large spatial extent and temporal periods. Moreover, it can account for logging in remote areas, where no field inventory or logging records are available (Shimabukuro et al., 2014). EO provides verifiable and almost objective estimates of logging events inside the forest. In combination with field survey, remote sensing can be an extremely accurate, convenient, economical instrument to investigate illegal logging (Jovanović and Milanović, 2017).
Due to their wide swaths and high revisit times, coarse spatial resolution sensors are extremely relevant to detect changes on a regional or global scale. Landsat data has been deemed optimal to detect logging roads and is used very frequently to study logging in tropical forests. Nevertheless, the case of illegal logging might require very high-resolution imagery that is frequent enough to ensure real time moni-toring (Fuller, 2006). Temporal resolution used is especially important because selective logging can become impossible to identify past a few years or even months (Kent et al., 2015). Very high spatial resolution images can also be used to verify coarser maps of cover changes. To ensure near real time detection of illegal logging, field surveys should probably be combined to the remote sensing products (Fuller, 2006). Finally, logging concessions as well as protected areas boundaries data are of the utmost importance to spot these events Europe-wide.
There have been a few global initiatives to quantify forest loss, but these are not necessarily focused on illegal logging. They can show any type of forest removal from natural or anthropogenic causes. For instance, Global Forest Watch launched by the World Resources Institute (WRI) provides a yearly global

Monitoring Forests Through Remote Sensing
Final Report
38
map of forest gain and loss from 2000 onwards (World Resources Institute, 2019a). This product is de-rived from Landsat imagery with a 30 m resolution based on the methodology by Hansen et al. from University of Maryland (2013). The accuracy was assessed against test datasets and was found very high. In addition, the estimates of forest loss have the advantage of being consistent globally (Hansen et al., 2013). However, this University of Maryland dataset was tested against a machine learning classification using higher spatial resolution SPOT and RapidEye imagery (Mitchard et al., 2015). It yielded extremely high omission error for deforestation in a site in Ghana, hence its resolution and forest definition could make it unsuitable to detect forest change in some landscapes. The resolution does not allow detection of very small degradation such as might happen in Europe. This level of activity can possibly be better observed with RADAR, LiDAR data or ground surveys (Mitchard et al., 2015). Furthermore, an annual assessment of forest loss is too infrequent to monitor illegal activities as they occur.
Another country-scale initiative, named Forest Atlas, was developed by the World Resources Institute in collaboration with countries forestry agencies (World Resources Institute, 2019b). It is composed of an online platform which is operational for six countries of the Congo Basin as well as Georgia (World Resources Institute, 2019b). Logging roads are detected from Landsat and Advanced Land Observation Satellite (ALOS) imagery and validated with field surveys (Mertens et al., 2012). Official inventory and designation of protected areas gives information on permitted harvest zones, the boundaries of biodi-versity reserves, national parks, etc. Illegal logging can also be inferred indirectly by the presence of roads outside the permit areas. These atlases are updated yearly (Mertens et al., 2012).
Amongst the lower spatial scale studies on remote sensing of illegal and selective logging, this study identified two distinct approaches. One approach will attempt to spot specific features linked to exploi-tation such as canopy gaps, logging roads and landings. The second will compare the change in land use occurring before and after logging.
2.2.1 Exploiting features detection methods
These methods make use of the specific spectral, textural, or shape properties of some features associ-ated with logging. Indeed, logging leaves traces and cannot happen without modifying the landscape around it. For instance, felling areas or removed trees will present an irregular shaped gap in the canopy, through which bare ground will be exposed. Roads will form linear features enclosing or crossing ex-ploited areas. Even illegal logging cannot be entirely invisible, as roads must be prepared or used.
Use of Linear Spectral Unmixing
Linear spectral unmixing or spectral mixture analysis (SMA) methods were widely used to detect the features of forest exploitation. It consists in decomposing the spectral signature of a mixed pixel into signatures of so-called “endmembers” which all occupy fractions of the pixel. For instance, there is the Carnegie Landsat Analysis System (CLAS) used in Asner et al. (2005). It uses a specific unmixing model which extracts the fraction of live vegetation, dead vegetation and bare soil in a satellite pixel. Threshold of the fraction of these endmembers allows to identify deforested or degraded areas. In this case, Land-sat ETM+ data is used to spot the damage attributable to logging in Amazonia. Differences between photosynthetic and non-photosynthetic vegetation fractions between consecutive images underline disturbances in the area. CLAS identifies point or line features with disturbance corresponding respec-tively to logging decks or tree fell gaps and logging roads. A validation against logging event points taken on the ground showed that CLAS was ‘precise and accurate’. The same CLAS system was used to identify

Monitoring Forests Through Remote Sensing
Final Report
39
logging gaps, characterized by important fraction of senescent vegetation (Tritsch et al., 2016). How-ever, the present study cannot assess how accurate this detection was, since no verification was per-formed (Asner et al., 2005). In another study using Landsat imagery to assess carbon cycling and storage in a tropical forest, however, the same spectral mixture method was used. The correlation was ex-tremely high between canopy gaps listed on the ground and canopy cover fraction extracted from a SMA (Keller et al., 2004).
One study proposed a classification of Landsat imagery in a selectively logged forest based on spectral mixture unmixing (Shimabukuro et al., 2019). The unmixing generates pixels with soil, shade and vege-tation fractions. Maps of newly deforested and burned areas are produced through unsupervised clas-sification using a reference deforestation map and the Hansen et al. (2013) dataset (Figure 6). Log land-ings and decks are then identified through thresholding of the soil and vegetation fraction images. Ran-dom sampling of RapidEye imagery was used for validation against the logging, deforested and burned classes in the map. The overall accuracy was 94%, however the logging class presented only a user ac-curacy of 68%.
A very similar methodology was applied to characterize selective logging in an Amazonian site. Yearly Landsat composite over a 15-year period were analysed. A forest mask was first generated to detect original non-forested areas, then the pixels went through the spectral unmixing step, creating soil, veg-etation and shade fractions. Logged areas were spotted by setting a threshold on the soil fraction im-ages. One can then assess the intensity of disturbance by looking at the number of logged pixels situated in the total forest area. A random stratified sampling on the disturbance map created points which were interpreted for validation. The overall accuracy reaches 85% by assessing only the binary disturbed (logged) and undisturbed map, it is lower if the various disturbance intensity classes were added (Grec-chi et al., 2017).
Similarly, Verhegghen et al. (2015) applied spectral unmixing onto SPOT-4 imagery in a forest concession in the Congo Basin. The pixels were then expressed as soil, vegetation and shadow fractions. The Nor-malized Difference Vegetation Index (NDVI) was also computed. Gaps and roads linked to logging events could then be located, by observing the NDVI values and soil fractions (Verhegghen et al., 2015).
Figure 6. Annual deforested maps for 2005 to 2017 in a Brazilian Amazon site (Source: Shimabukuro et al., 2019).
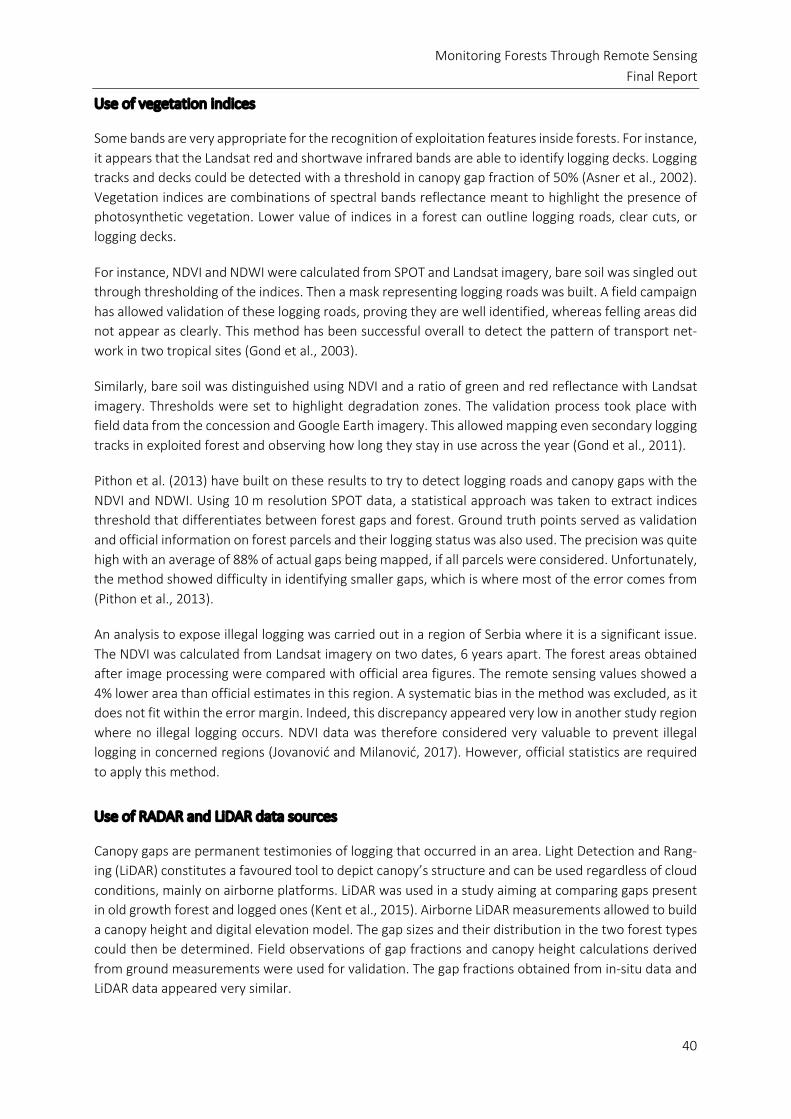
Monitoring Forests Through Remote Sensing
Final Report
40
Use of vegetation indices
Some bands are very appropriate for the recognition of exploitation features inside forests. For instance, it appears that the Landsat red and shortwave infrared bands are able to identify logging decks. Logging tracks and decks could be detected with a threshold in canopy gap fraction of 50% (Asner et al., 2002). Vegetation indices are combinations of spectral bands reflectance meant to highlight the presence of photosynthetic vegetation. Lower value of indices in a forest can outline logging roads, clear cuts, or logging decks.
For instance, NDVI and NDWI were calculated from SPOT and Landsat imagery, bare soil was singled out through thresholding of the indices. Then a mask representing logging roads was built. A field campaign has allowed validation of these logging roads, proving they are well identified, whereas felling areas did not appear as clearly. This method has been successful overall to detect the pattern of transport net-work in two tropical sites (Gond et al., 2003).
Similarly, bare soil was distinguished using NDVI and a ratio of green and red reflectance with Landsat imagery. Thresholds were set to highlight degradation zones. The validation process took place with field data from the concession and Google Earth imagery. This allowed mapping even secondary logging tracks in exploited forest and observing how long they stay in use across the year (Gond et al., 2011).
Pithon et al. (2013) have built on these results to try to detect logging roads and canopy gaps with the NDVI and NDWI. Using 10 m resolution SPOT data, a statistical approach was taken to extract indices threshold that differentiates between forest gaps and forest. Ground truth points served as validation and official information on forest parcels and their logging status was also used. The precision was quite high with an average of 88% of actual gaps being mapped, if all parcels were considered. Unfortunately, the method showed difficulty in identifying smaller gaps, which is where most of the error comes from (Pithon et al., 2013).
An analysis to expose illegal logging was carried out in a region of Serbia where it is a significant issue. The NDVI was calculated from Landsat imagery on two dates, 6 years apart. The forest areas obtained after image processing were compared with official area figures. The remote sensing values showed a 4% lower area than official estimates in this region. A systematic bias in the method was excluded, as it does not fit within the error margin. Indeed, this discrepancy appeared very low in another study region where no illegal logging occurs. NDVI data was therefore considered very valuable to prevent illegal logging in concerned regions (Jovanović and Milanović, 2017). However, official statistics are required to apply this method.
Use of RADAR and LiDAR data sources
Canopy gaps are permanent testimonies of logging that occurred in an area. Light Detection and Rang-ing (LiDAR) constitutes a favoured tool to depict canopy’s structure and can be used regardless of cloud conditions, mainly on airborne platforms. LiDAR was used in a study aiming at comparing gaps present in old growth forest and logged ones (Kent et al., 2015). Airborne LiDAR measurements allowed to build a canopy height and digital elevation model. The gap sizes and their distribution in the two forest types could then be determined. Field observations of gap fractions and canopy height calculations derived from ground measurements were used for validation. The gap fractions obtained from in-situ data and LiDAR data appeared very similar.

Monitoring Forests Through Remote Sensing
Final Report
41
Figure 7. LiDAR estimated gap fraction in logged and unlogged blocks of a Sierra Leone national park at 14m canopy height (Source: Kent et al., 2015).
Even in forests logged long ago, gap fractions were superior and canopy height slightly lower than in old growth forests (Figure 7). However, in this case, historical information on forest plots and field data are still needed to interpret the LiDAR results.
LiDAR can also be a way to calculate above ground biomass. Singh et al. (2018) used LiDAR data to derive a Canopy Height Model (CHM). This model was used to retrieve estimates of canopy gap fractions as well as above ground biomass. A Relative Density Model (RDM) computed from the same LiDAR values can evidence the traces of exploitation such as roads or landings in the forest. Over three years, the values of relative density declined in the Cambodian community forests studied, indicating that some logging had occurred (Singh et al., 2018). However, these findings could not be confirmed as there was no validation.
In a study on small-scale logging, CHM and RDM derived from airborne LiDAR were combined with an extensive field inventory. Above ground biomass was calculated with field data and modelled with LiDAR CHM, showing a moderate correlation between both estimations. Furthermore, a relative density model was derived from LiDAR returns, which was meant to highlight impacts from skid trails, logging roads and decks as well as canopy gaps. These low-density points in the model were verified against actual exploitation features in the field. All the inventoried points correctly coincided with the disturbed cells in the model (d’Oliveira et al., 2012).
Solberg et al. (2013) examined the ability of Radio Detection and Ranging (RADAR) data to determine forest clear cuts in Norway. The assumption is that they could be identified by looking at the difference between Digital Surface Models at two dates. Official logging records as well as a recent Digital Terrain Model were also added for verification. The Shuttle Radar Topography Mission’s DSM from 2000 was compared with the Tandem-X Interferometric SAR one from 2011. The results were fairly good overall, although the clear-cut class showed a low user accuracy of 58%. However, other logging practices that do not reduce the canopy height as much as a clear cut does (for instance illegal logging), could not be identified with this technique (Solberg et al., 2013).
A thesis was carried out on the use of Synthetic Aperture RADAR (SAR) data to monitor logging in a tropical forest. Radarsat-2 data was combined with a field survey measuring diameters and calculations of AGB. Records of logged plots were available for validation. DSM were extracted from the SAR images through radargrammetric (stereo) processing. The change in canopy height is found by subtracting the

Monitoring Forests Through Remote Sensing
Final Report
42
later DSM to the earlier one. Partial logging could be recognized easily by a diminution in the DSM height. Some plots that were not supposed to be harvested presented a similar diminution, caused per-haps by illegal logging or just by inaccuracy of the method. The authors concluded that longer time series of in-situ as well as SAR data would possibly allow to better interpret the DSM height variations (Lohne, 2013).
Terra SAR-X imagery was used as a means to evidence degradation in an Indonesian forest. One chapter focused on the best method to detect logging trails. The result was validated against trails visible on a VHR RapidEye image. A supervised nearest neighbour classifier extracted the features more accurately than an object-based approach, and reduced speckle noise. The overall objective of the thesis was to classify degradation types: logging areas, burned areas, roads in this study site. Two methods were com-pared; one making use of SAR data only and one of a fusion of Landsat and SAR data. They were assessed against field survey points. The maximum overall accuracy that was reachable with the classification of solely SAR data was of 80%. The Landsat and SAR fusion, on the other hand, showed excellent results with a 96% overall accuracy. However, the actual logged areas pixels were sometimes misclassified as logging trails (Nuthammachot, 2016).
Bourgoin et al. (2018) found similarly that radar data and the derived indicators are not sensitive enough to model differences in above-ground biomass and to map forest disturbances. The images are simply too noisy and the recorded signal is influenced by a large number of non-controllable site-specific fea-tures.
From this analysis of relevant literature, the following conclusions can be drawn:
• The Hansen et al. (2013) global forest change dataset is too broad scale and does not necessarily register small changes in the forest cover, typical of low-level logging.
• Spectral Mixture Analysis (SMA) has shown interesting results to detect logged areas. However, this method is more suitable to the local scale. Indeed, it will be necessary to manually create thresholds that are adapted to the region considered, as well as identify locally well-adapted end-member signatures.
• Recognition of exploitation features through vegetation indices requires lengthy observation of the data to set thresholds. This is similarly not ideal to study illegal logging at the EU scale.
• Collection of LiDAR data will be too time-consuming and not cost-efficient as an airborne plat-form is needed and any spaceborne sensor would most probably come with a too large spatial footprint.
• SAR data on its own does not seem able to represent illegal logging. We recommend therefore the fusion of SAR and optical satellite data such as Landsat or Sentinel-2.

Monitoring Forests Through Remote Sensing
Final Report
43
2.2.2 Land use change detection methods
With this approach one observes the change in land use/ land cover occurring over the study site before and after illegal logging. In that respect, this report first looks into classification and then modelling methodologies.
Classification
Image classification is the process of assigning pixels to distinct land cover types. In the case of moni-toring illegal logging, such classifications generally produce a map with forest and non-forest classes. It is essential to have a remote sensing image of the situation before the period of interest to serve as reference for the state of forest in the area (Shimabukuro et al., 2014). Otherwise one might account in the logging estimates for zones that were harvested prior to the study. This early image is also useful to mask out other land covers that are out of focus. Doing so, one can then observe if logging occurs in unauthorized areas by adding protection sites boundaries for instance. If logging occurs frequently and at low intensity, the classification will need to be performed at a higher temporal resolution.
A very simple classification was realized in an Indian wildlife sanctuary, where two satellite images were compared at a 10-year interval. The first was taken with Landsat TM while the second was from the Indian Remote Sensing Satellite-P6 (IRS-P6). Ground truth points of dense, open forest, bare soil and other land covers were used as training data. A maximum likelihood algorithm was applied to both im-ages independently. The overall classification accuracy was high: 94% for the recent image and 92% for the older one. A simple differencing allowed to assess the change in each land cover between both dates (Giriraj et al., 2008).
A more complex multi-temporal Landsat classification was used to monitor forest degradation in two African sites (Hirschmugl et al., 2014). Very High-Resolution (VHR) images were also acquired over both regions for training and validation. A variety of spectral features (vegetation indices, bands reflec-tance…) were generated from the Landsat data to assess which one could classify the temporal imagery best. The assessment was made by looking at the correlations with the interpreted VHR image. The best feature was found to be the spectral unmixed soil fraction before a few vegetation indices. The spectral signatures of forest and degraded forest in the VHR imagery was used as training data. Classification follows a minimum distance algorithm. Finally, the validation was realized thanks to random sample points on the VHR images. The method performed well in both sites. However, degraded forest showed the lowest user accuracy with 66%. Indeed, degraded forest spectral signal was sometimes confounded with natural spectral differences in intact canopy.
Shimabukuro et al. (2014) classified Landsat ETM+ imagery over one dry season. A forest mask was created representing the situation before the study period. Then soil, shade and vegetation fractions were generated from the time series using SMA. An unsupervised classification of the soil fraction im-ages was used to separate between a selectively logged, forest and clear-cut class. Validation was done through an official deforestation map from the Brazilian National Institute for Space Research and sam-ples points in the Landsat images interpreted by an expert. The overall accuracy for this classification was 79% and selectively logged pixels were usually well identified.
An object image analyses (OBIA) has been tested to map degradation of forest in Madagascar (Burivalova et al., 2015). The aim was to assess the relevance of the Hansen et al. (2013) global product to a local management context. An extensive survey recorded truth points for selective logging, intact
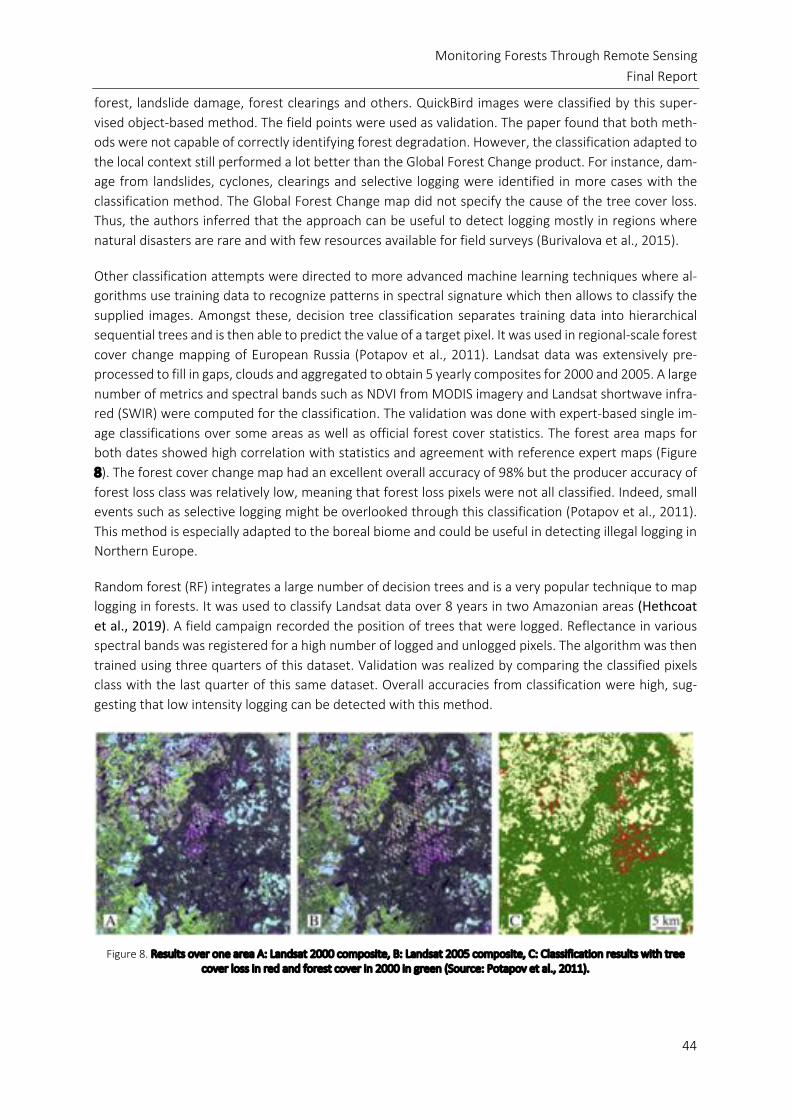
Monitoring Forests Through Remote Sensing
Final Report
44
forest, landslide damage, forest clearings and others. QuickBird images were classified by this super-vised object-based method. The field points were used as validation. The paper found that both meth-ods were not capable of correctly identifying forest degradation. However, the classification adapted to the local context still performed a lot better than the Global Forest Change product. For instance, dam-age from landslides, cyclones, clearings and selective logging were identified in more cases with the classification method. The Global Forest Change map did not specify the cause of the tree cover loss. Thus, the authors inferred that the approach can be useful to detect logging mostly in regions where natural disasters are rare and with few resources available for field surveys (Burivalova et al., 2015).
Other classification attempts were directed to more advanced machine learning techniques where al-gorithms use training data to recognize patterns in spectral signature which then allows to classify the supplied images. Amongst these, decision tree classification separates training data into hierarchical sequential trees and is then able to predict the value of a target pixel. It was used in regional-scale forest cover change mapping of European Russia (Potapov et al., 2011). Landsat data was extensively pre-processed to fill in gaps, clouds and aggregated to obtain 5 yearly composites for 2000 and 2005. A large number of metrics and spectral bands such as NDVI from MODIS imagery and Landsat shortwave infra-red (SWIR) were computed for the classification. The validation was done with expert-based single im-age classifications over some areas as well as official forest cover statistics. The forest area maps for both dates showed high correlation with statistics and agreement with reference expert maps (Figure 8). The forest cover change map had an excellent overall accuracy of 98% but the producer accuracy of forest loss class was relatively low, meaning that forest loss pixels were not all classified. Indeed, small events such as selective logging might be overlooked through this classification (Potapov et al., 2011). This method is especially adapted to the boreal biome and could be useful in detecting illegal logging in Northern Europe.
Random forest (RF) integrates a large number of decision trees and is a very popular technique to map logging in forests. It was used to classify Landsat data over 8 years in two Amazonian areas (Hethcoat et al., 2019). A field campaign recorded the position of trees that were logged. Reflectance in various spectral bands was registered for a high number of logged and unlogged pixels. The algorithm was then trained using three quarters of this dataset. Validation was realized by comparing the classified pixels class with the last quarter of this same dataset. Overall accuracies from classification were high, sug-gesting that low intensity logging can be detected with this method.
Figure 8. Results over one area A: Landsat 2000 composite, B: Landsat 2005 composite, C: Classification results with tree cover loss in red and forest cover in 2000 in green (Source: Potapov et al., 2011).

Monitoring Forests Through Remote Sensing
Final Report
45
A random forest method was also implemented to assign various disturbances in a forested region of Myanmar. Using Tasseled Cap Transformation, Landsat spectral bands were converted into a spectral index: Tasseled Cap Wetness, which is sensible to disturbances. For instance, the index value reduces when vegetation is removed over the pixel. Change is detected through thresholding of this index; strat-ified samples were used for validation of the change detection method. The method’s overall accuracy was relatively low. The RF algorithm was subsequently used to classify forest disturbance by what caused them. For this purpose, a dataset of disturbance events was created manually. One part was used for training and the rest to validate the results. This yielded an 85% overall accuracy. Nonetheless, the classification did not allow to differentiate between legal and illegal logging (Shimizu et al., 2017).
Support Vector Machine (SVM) forms another area of machine learning. It discriminates between clas-ses by using a separation hyperplane between the training samples (Baumann, 2013). The hyperplane maximizing the margin between two classes is chosen to perform classification. The number of training samples necessary is lower than with a RF method (Kuemmerle et al., 2009). Using SVM, a large study was realized to assess the illegal logging occurring over the whole Ukrainian Carpathians from 1988 to 2007. Official forest statistics were available to extract the logged quantities and the plots not destined for harvest as well as an inventory map. Very high-resolution imagery and a field survey provided ground-truth points. Most of these points were used to train the SVM and the rest as validation. Maps of forest/non-forest were realized for four dates with Landsat imagery and the difference between them was then represented. The SVM method performed very well, with an overall accuracy of over 94% for the binary maps and between 94% and 99% for the cover change maps. The official inventory map differed significantly from the map derived from the Landsat data. The authors report that ‘illegal log-ging is the main reason explaining this disagreement’. Furthermore, using a viewshed analysis, they as-sessed if tree removal occurred in zones that were invisible from roads or railways tracks. This was the case before 1988 where most disturbances were in non-visible areas, but the tendency disappeared after this date. Overharvest past the boundaries was an issue in the areas designated for harvest, whilst some unauthorized zones were still being logged. Consequently, illegal logging was deemed as frequent and substantial as legal logging in the Ukrainian Carpathians for that period (Kuemmerle et al., 2009).
SVM was also applied to Landsat data on a 25 years analysis of forest cover change. A large number of truth points were assigned as either forest or non-forest by comparing with VHR imagery, and then used to train the model. An extensive validation process was carried out, using a classification of the same region from other authors as well as a portion of the truth points. The method resulted in very accurate forest/non-forest maps. These were compared between different dates to evaluate forest cover change. The resulting change maps displayed high accuracy. However, the filtering in the classification meant that some small-scale forest disturbances were overlooked. In addition, no points at the forest boundary were included in this study (Baumann, 2013). Hence, one cannot be sure how this method would perform in detecting low level logging close to the forest boundary.
In an assessment of the Hansen et al. (2013) forest change product, a SVM classification was used suc-cessfully to create forest/non forest maps in Brazil (Mitchard et al., 2015). The SVM was also employed to assess the effectiveness of protected areas in Romania and detect forest disturbances. Training and validation points were created for forest and non-forest class using Google Earth imagery. Then Landsat data was classified with SVM for the earliest and latest dates in the time series, reaching high overall accuracies. A disturbance index was computed for each pixel and date with thresholds selecting actual disturbed pixels. Protected area boundaries, core forest and old growth forest zones were added. The validation step for the disturbed forest map consisted of interpreting random samples. The resulting

Monitoring Forests Through Remote Sensing
Final Report
46
map was highly accurate with a 95% overall accuracy. It was then possible to examine disturbances taking place inside and outside the protected areas. For all three study areas, the core protected zone, with stricter access conditions was less impacted than the rest of the park. Although the method does not make the distinction between natural disturbances and logging, it seems that the former is negligi-ble in the Romanian context (Knorn et al., 2012).
An almost identical approach was taken to assess the effectiveness of two strictly protected areas in Russia. Indeed, SVM was also used on Landsat data, followed by thresholding of a disturbance index. The validation was done by interpreting random point samples for each class in the map. In this case, the method performed poorly with a 71% overall accuracy of the cover change map. The forest disturb-ance class displayed a very low producer accuracy but high user accuracy, reflecting high omission error. Despite the errors, one could still observe that protected areas limited logging effectively. There was actually a reduction in disturbance rates in the post-soviet period across the protected zone and the outskirts (Sieber et al., 2013). However, one drawback is that disturbance in the map are not discrimi-nated by their origins, so one cannot specifically highlight illegal logging.
Modelling
A modelling approach has been taken in several studies to portray the complex processes behind illegal logging. For instance, Bourgoin et al. (2018) aimed to model the above ground biomass (AGB) in de-graded and intact forest in Brazil. A field survey was carried out over two dry seasons in various forest sites; logged, burned, intact and secondary forest. Tree diameters were measured in order to calculate AGB. A wide variety of remote sensing metrics were analysed. The MODIS EVI 16-day product was ac-quired for the sites and statistics calculated. Landsat images were used inside the CLAS system to re-trieve soil, photosynthetic, and non-photosynthetic vegetation indices. The backscatter coefficients were derived from the ALOS-1 PALSAR instrument and Sentinel-1 imagery. The indicators’ efficiency in modelling AGB was assessed with a random forest algorithm. The field AGB values were used to train and validate this model. For each indicator, the incremental mean square error was calculated to see its importance on the model’s predictive power. Predicted AGB values were then compared to those calculated with field data, as well as to a referenced biomass map of the region. The most performant indicators were a few of the EVI statistics and the bare soil index from Landsat. Despite this, the RF model did not perform too well, it could only explain a small portion of the AGB mean variance. The modelled biomass map was more accurate, however, than the reference one derived through simple kriging. It was able to depict details such as skid trails, roads and canopy gaps. The selectively logged areas were also highlighted by lower biomass values. The RF model could probably be improved by adding more in-situ data (Bourgoin et al., 2018). A regression model combining MODIS-derived NDVI and density of logging tracks was a good predictor of AGB logged in a Cameroon forest concession (Shu et al., 2014). This method could probably indicate the intensity of logging in different areas of the land-scape, and thereby distinguish between illegal and legal logging.
A complex Multi-Layer Neural Network model was constructed to capture land use change in a nature reserve in Vietnam. The principle was to predict land use change based on observed past changes. Land use zones were identified from field observations, Landsat imagery and interviews, after which a maxi-mum likelihood classification was applied to obtain land use maps. The neural network was trained with spatial variables and the maps, producing conversion potential maps. Forest cover prediction maps were then obtained through a land allocation model. The neural network model was validated, and the

Monitoring Forests Through Remote Sensing
Final Report
47
predicted forest cover was correct for 92% of pixels. This model was valuable in monitoring forest con-version in the region and was able to predict areas more vulnerable to change in the future (Khoi and Murayama, 2010). There was slight error in the prediction of change location, which might be important to consider if very-low level logging is studied.
Near real time monitoring of logging was investigated via a fusion model of Landsat and MODIS data. The available Landsat imagery, at 30 m resolution, were put through a fusion model which generates simulated daily MODIS data. Three Amazonian sites were tested. The change in land cover is detected by looking at the difference between the daily simulated and observed MODIS imagery. This time series of residuals is computed by the Fusion2 algorithm and examined for sudden variations. That is, if the residual value passes a given threshold, the algorithm classifies the pixel as disturbed. Stable forest and stable non-forest are also classified. The model’s accuracy was assessed through comparison with a random set of pixels as well as exploring the number of disturbance events detected after a given time. The user accuracy of the disturbance class was of 87%. Furthermore, one out of five events were not detected by the model, because they were either too subtle or too small, for instance partial clearing or roads (Tang, 2018). This makes this approach a weak candidate for monitoring low intensity illegal logging in the EU.
In another chapter of the same thesis, the performance of MODIS and its successor, the Visible Infrared Imaging Radiometer Suite (VIIRS) in monitoring forest disturbance were compared (Tang, 2018). For this, the Continuous Change Detection and Classification model was used to achieve near real time de-livery. Pixels are classified as forest and non-forest with a Random Forest algorithm, using NDVI as a parameter among others. The pixels that are converted from forest to non-forest are assigned to the disturbed class. MODIS 250 m resolution data resulted in higher accuracy with 93% than VIIRS, which showed 88% overall accuracy. This divergence is attributable to the higher spatial resolution and less cloudy images thanks to the TERRA satellite’s morning overpass. Therefore, it was concluded that high spatial resolution as well as frequent clear imagery was paramount to investigate logging in near real time.
2.2.1 Conclusion and Summary Table Illegal logging
From the above studies, a number of findings can be derived:
• Frequent classification of the forest areas of the EU would seem like a good option. Optical and SAR data could be both classified jointly. Sentinel-2, with its high spatial resolution would be the obvious source to use. Specifically, machine learning methods give good results and can be eas-ily modified to fit the regions’ particularities.
• Modelling approaches are complex and require time to understand the drivers and conse-quences of illegal logging. The models discussed here were developed for a tropical forest con-text. The method can probably not be applied to detect illegal logging in the EU.
• Logging records from the countries of the EU need to be kept accurately and frequently. This allows comparison with the remote sensing estimates, to possibly uncover illegal logging.
• One limitation for obtaining more accurate results is the cost of acquiring field reference data. All approaches benefit from higher number, better quality and well distributed and representa-tive reference data. A large set of well distributed reference sites would be ideal for training, similar to the ImageNet reference data set used by the computer vision community.
• Protected areas and concession boundaries data will be essential to discriminate legal from illegal logging.

Monitoring Forests Through Remote Sensing Final Report
48
Table 3. Summary table listing studies or products on illegal logging using remote sensing
Reference Status and name
of entity operating system
Current status
Spatial Extent
Temporal Extent
RS Data sources
Spatial res-olution
Temporal resolution
Types of re-quired in-situ
data
Delivery timeliness
Ancillary data Limitations Possible
scaling up Application use Product dis-semination
Validation standards
Validation results Link to document
Asner et al. (2005)
Carnegie Institution of Washington
Opera-tional
Regional (Amazon)
3 years (1999- 2002)
Landsat ETM+
30m Annual Canopy gap
data After log-
ging Deforesta-tion map
Requires ground surveys & official forest deforesta-
tion data
Yes
Detect and quan-tify the amount of selective log-
ging
Freely availa-ble
High +++ http://www.science-
mag.org/cgi/doi/10.1126/science.1118051
Baumann (2013)
University of Wisconsin-Mad-
ison
Opera-tional
Regional (Rus-sia)
25 years (1985-2010)
Landsat TM/ETM+
30m 5 years None After
logging None
Omission of smaller forest
disturbances, no information on
accuracy around forest bounda-
ries
Yes Analyse forest cover change
Freely availa-ble
High +++ https://search.li-
brary.wisc.edu/cata-log/9912147242502121
Bourgoin et al. (2018)
Centre de Coopé-ration Internatio-
nale en Recherche Agronomique pour le Développement (CIRAD), public re-
search center
Testing Regional
(Amazonia) 14 years
(2001-2014)
Landsat OLI &
MODIS & ALOS-1 & Sentinel-1
20m Once Above-ground
biomass data
After logging
Map of forest bio-
mass
High number of indicators to test, error due to spa-tial resampling and to diversity of forest types
Yes
Model and map above-ground bi-
omass of de-graded forests
Freely availa-ble
Moderate ++
https://hal.archives-ou-vertes.fr/hal-
01816125/file/Bour-goin2018a.pdf
Burivalova et al. (2015)
Swiss federal Institute of
Technology, Zürich
Demon-stration
Local (Madagascar)
2 years (2011- 2013)
QuickBird 15m Variable Ground-truth
points After
logging
Global for-est cover
change map by Hansen
et al. (2013)
Underestimate of forest degrada-tion, confusion
between natural and anthropo-genic degrada-
tion
Not likely
Assess the utility of the Hansen et al. (2013) forest data set to map
forest loss
Access cost of QuickBird im-
agery High +
https://www.research-collection.ethz.ch/han-
dle/20.500.11850/106123
Ceccherini (2020)
European Commis-sion Joint Research
Centre
Opera-tional
Continental (Eu-rope)
12 years (2004-2018)
Landsat (Global For-est Change
product)
30m Yearly Google Earth
imagery After log-
ging None
Underestimate forest harvest, low temporal resolution not
optimal to detect logging
Adequate scale for the
EU
Assess the change in har-vested forest
area across Eu-rope
Freely availa-ble
High ++ http://www.na-ture.com/arti-
cles/s41586-020-2438-y
Csillik et al. (2020)
Arizona State Uni-versity
Demon-stration
Country (Peru) Dry season
(July-Septem-ber 2018)
Planet Dove 3.7m Daily SRTM eleva-
tion data After log-
ging None
Requires com-plex processing and modelling
Yes
Automatically as-sess top of can-opy height over
the country
Freely availa-ble
Moderate ++ https://www.mdpi.com/
2072-4292/12/7/1160
Desclée et al. (2006)
Université Catholique de Lou-
vain
Demon-stration
Local (Belgium) 11 years
(1992-2003) SPOT 2, 3 &
5 20m
3 and 8 years
Field survey After log-
ging
Forest in-ventory
map, Digital Elevation Model, CORINE
Land Cover map, aerial
photo
Requires optimi-zation of param-eters to be used in other places
Yes
New method to extract land cover changes with im-age segmentation
Freely availa-ble
High +++
https://linkinghub.else-vier.com/re-
trieve/pii/S0034425706000344

Monitoring Forests Through Remote Sensing Final Report
49
Reference Status and name
of entity operating system
Current status
Spatial Extent
Temporal Extent
RS Data sources
Spatial res-olution
Temporal resolution
Types of re-quired in-situ
data
Delivery timeliness
Ancillary data Limitations Possible
scaling up Application use Product dis-semination
Validation standards
Validation results Link to document
d'Oliveira et al. (2012)
Brazilian Agricul-tural Research Cor-
poration (EM-BRAPA)
Opera-tional
Local (Amazonia)
One data (May 2010)
Airborne Li-DAR
1m Once
Tree diame-ter measure-
ments, ground truth points of log-
ging roads and landings
After log-ging
None
CHM could not identify har-
vested from non-harvested areas, GPS position er-
ror
Not likely
Estimate forest biomass and
identify low in-tensity logging ar-
eas using LiDAR
Cost of LiDAR device
High ++
https://linkinghub.else-vier.com/re-
trieve/pii/S0034425712002179
Giriraj et al. (2008)
Universität Bayreuth
Opera-tional
Local (India)
10 years (1993-2004)
Landsat TM & IRS-P6
LISS III 30m & 20m Once
Ground truth points
After log-ging
Topograph-ical map
Requires ground truth data
Not likely
Land use/land cover maps for Indian wildlife
sanctuary
Freely availa-ble
Moderate +++
http://www.scial-ert.net/ab-
stract/?doi=jest.2008.73.79
Global Forest Change map
Global Forest Watch, NGO
Opera-tional
Global 19 years
(2000-today) Landsat 30m Annual None
After logging
None
Once a year de-livery too rare to capture low level
logging, confu-sion of forest
with plantations
Adequate scale for EU
Map global tree extent, loss and
gain
Freely availa-ble
High +++ https://www.global-
forestwatch.org
Gond et al. (2003)
CIRAD Opera-tional
Local (Guyana + Gabon)
1 date (2003)
SPOT-4 & Landsat
ETM+
20m & 30m
Once Ground truth
points Along the
season None
Felling areas not detected well
Yes
Automatic map-ping
of logging roads network
Freely availa-ble
Moderate +++ http://science.science-
mag.org/con-tent/310/5747/480
Grecchi et al. (2017)
JRC & INPE Opera-tional
Local (Amazonia)
15 years (2000-2015)
Landsat TM/ETM+/
OLI 30m Yearly None
After log-ging
Deforesta-tion map & global for-est change
map & RapidEye & Sentinel-2
image
No precise delin-eation of logged boundaries, par-tial mapping of
some roads
Yes
Investigate forest disturbance pro-cesses in the Bra-
zilian Amazon
Freely availa-ble
High ++
https://www.sciencedi-rect.com/science/arti-
cle/pii/S0303243417300971
Hethcoat et al. (2019)
University of Shef-field
Testing Local
(Amazonia) 8 years
(2008-2016)
Landsat TM/
ETM+/OLI 30m
Twice yearly
Forest inven-tory measure-
ments
After logging
Official de-forestation
map
Only imagery close to date of
logging is able to map, cluster ef-fect due to the
spatial resolution
Yes
Detect selective logging of low in-tensity in tropical
forest
Freely availa-ble
High +++
https://www.sciencedi-rect.com/science/arti-
cle/pii/S0034425718305534
Jovanović and Milanović
(2017)
Remote sensing and Forest Conser-
vation
Demon-stration
Regional (Serbia)
6 years (2006-2011)
Landsat TM 30m 6 years None After log-
ging Official area
estimates
No formal valida-tion since official estimates incor-
rect
Yes
Evaluate the pos-sible use of NDVI to prevent illegal
logging
Freely availa-ble
Basic +
http://www.intechopen.com/books/forest-ecol-
ogy-and-conservation/re-mote-sensing-and-forest-conservation-challenges-of-illegal-logging-in-kur-
sumlija-municipality-serb
Kent et al. (2015)
University of Cam-bridge
Opera-tional
Local (West Africa)
One date (March 2012)
Airborne Li-DAR
1m Once
Canopy gaps and tree heights
ground data
After log-ging
None
Need for field data and historic knowledge of the
forest
Not likely
Distinguish old growth and selec-tively logged for-ests in West Af-
rica
Cost of LiDAR device
High ++ https://www.reposi-tory.cam.ac.uk/han-
dle/1810/248707
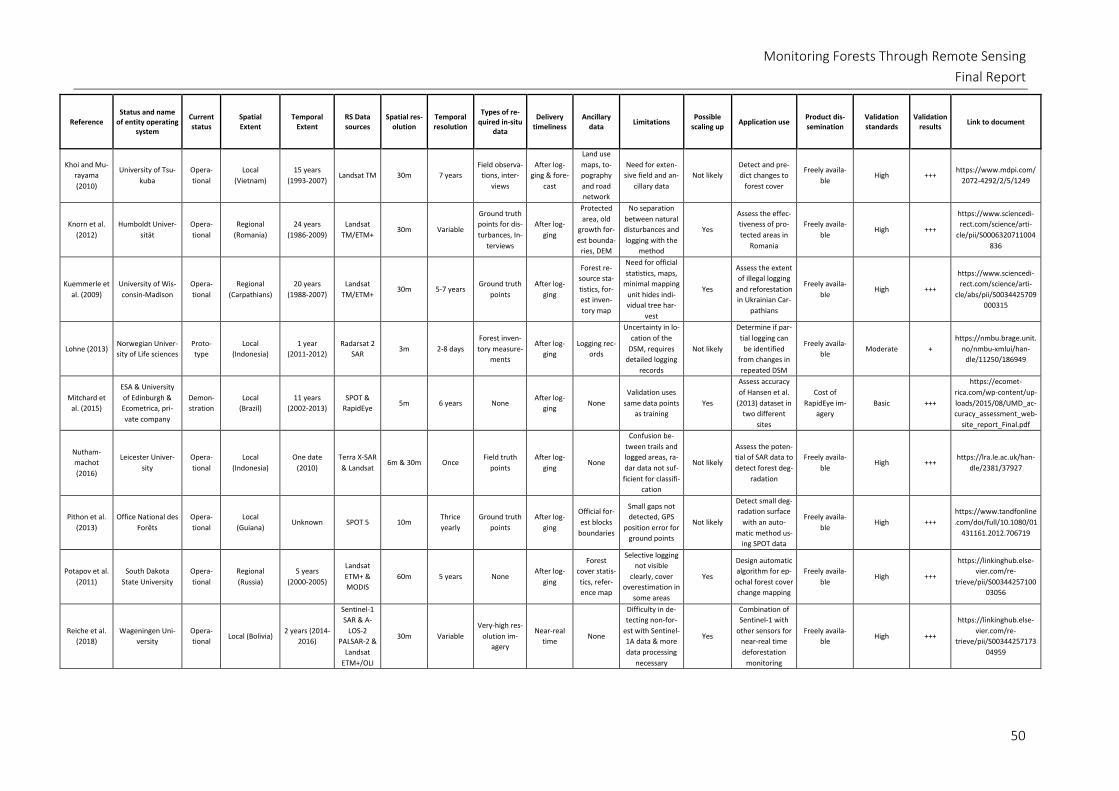
Monitoring Forests Through Remote Sensing Final Report
50
Reference Status and name
of entity operating system
Current status
Spatial Extent
Temporal Extent
RS Data sources
Spatial res-olution
Temporal resolution
Types of re-quired in-situ
data
Delivery timeliness
Ancillary data Limitations Possible
scaling up Application use Product dis-semination
Validation standards
Validation results Link to document
Khoi and Mu-rayama (2010)
University of Tsu-kuba
Opera-tional
Local (Vietnam)
15 years (1993-2007)
Landsat TM 30m 7 years Field observa-
tions, inter-views
After log-ging & fore-
cast
Land use maps, to-pography and road network
Need for exten-sive field and an-
cillary data Not likely
Detect and pre-dict changes to
forest cover
Freely availa-ble
High +++ https://www.mdpi.com/
2072-4292/2/5/1249
Knorn et al. (2012)
Humboldt Univer-sität
Opera-tional
Regional (Romania)
24 years (1986-2009)
Landsat TM/ETM+
30m Variable
Ground truth points for dis-turbances, In-
terviews
After log-ging
Protected area, old
growth for-est bounda-
ries, DEM
No separation between natural disturbances and logging with the
method
Yes
Assess the effec-tiveness of pro-tected areas in
Romania
Freely availa-ble
High +++
https://www.sciencedi-rect.com/science/arti-
cle/pii/S0006320711004836
Kuemmerle et al. (2009)
University of Wis-consin-Madison
Opera-tional
Regional (Carpathians)
20 years (1988-2007)
Landsat TM/ETM+
30m 5-7 years Ground truth
points After log-
ging
Forest re-source sta-tistics, for-est inven-tory map
Need for official statistics, maps,
minimal mapping unit hides indi-vidual tree har-
vest
Yes
Assess the extent of illegal logging
and reforestation in Ukrainian Car-
pathians
Freely availa-ble
High +++
https://www.sciencedi-rect.com/science/arti-
cle/abs/pii/S0034425709000315
Lohne (2013) Norwegian Univer-sity of Life sciences
Proto-type
Local (Indonesia)
1 year (2011-2012)
Radarsat 2 SAR
3m 2-8 days Forest inven-tory measure-
ments
After log-ging
Logging rec-ords
Uncertainty in lo-cation of the
DSM, requires detailed logging
records
Not likely
Determine if par-tial logging can
be identified from changes in repeated DSM
Freely availa-ble
Moderate + https://nmbu.brage.unit.
no/nmbu-xmlui/han-dle/11250/186949
Mitchard et al. (2015)
ESA & University of Edinburgh & Ecometrica, pri-vate company
Demon-stration
Local (Brazil)
11 years (2002-2013)
SPOT & RapidEye
5m 6 years None After log-
ging None
Validation uses same data points
as training Yes
Assess accuracy of Hansen et al.
(2013) dataset in two different
sites
Cost of RapidEye im-
agery Basic +++
https://ecomet-rica.com/wp-content/up-loads/2015/08/UMD_ac-curacy_assessment_web-
site_report_Final.pdf
Nutham-machot (2016)
Leicester Univer-sity
Opera-tional
Local (Indonesia)
One date (2010)
Terra X-SAR & Landsat
6m & 30m Once Field truth
points After log-
ging None
Confusion be-tween trails and logged areas, ra-dar data not suf-ficient for classifi-
cation
Not likely
Assess the poten-tial of SAR data to detect forest deg-
radation
Freely availa-ble
High +++ https://lra.le.ac.uk/han-
dle/2381/37927
Pithon et al. (2013)
Office National des Forêts
Opera-tional
Local (Guiana)
Unknown SPOT 5 10m Thrice yearly
Ground truth points
After log-ging
Official for-est blocks
boundaries
Small gaps not detected, GPS
position error for ground points
Not likely
Detect small deg-radation surface
with an auto-matic method us-
ing SPOT data
Freely availa-ble
High +++ https://www.tandfonline.com/doi/full/10.1080/01
431161.2012.706719
Potapov et al. (2011)
South Dakota State University
Opera-tional
Regional (Russia)
5 years (2000-2005)
Landsat ETM+ & MODIS
60m 5 years None After log-
ging
Forest cover statis-tics, refer-ence map
Selective logging not visible
clearly, cover overestimation in
some areas
Yes
Design automatic algorithm for ep-ochal forest cover change mapping
Freely availa-ble
High +++
https://linkinghub.else-vier.com/re-
trieve/pii/S0034425710003056
Reiche et al. (2018)
Wageningen Uni-versity
Opera-tional
Local (Bolivia) 2 years (2014-
2016)
Sentinel-1 SAR & A-
LOS-2 PALSAR-2 &
Landsat ETM+/OLI
30m Variable Very-high res-
olution im-agery
Near-real time
None
Difficulty in de-tecting non-for-
est with Sentinel-1A data & more data processing
necessary
Yes
Combination of Sentinel-1 with
other sensors for near-real time deforestation
monitoring
Freely availa-ble
High +++
https://linkinghub.else-vier.com/re-
trieve/pii/S0034425717304959

Monitoring Forests Through Remote Sensing Final Report
51
Reference Status and name
of entity operating system
Current status
Spatial Extent
Temporal Extent
RS Data sources
Spatial res-olution
Temporal resolution
Types of re-quired in-situ
data
Delivery timeliness
Ancillary data Limitations Possible
scaling up Application use Product dis-semination
Validation standards
Validation results Link to document
Shimabukuro et al. (2019)
Brazilian National Institute for Space
Research (INPE)
Opera-tional
Local (Amazonia)
Dry Season (May to Sep-
tember) 2005-2017
Landsat TM /OLI
30m 30 days None After
logging
Global For-est Change + national deforesta-tion map
Requires costly VHR image for
validation Yes
Monitor and as-sess deforesta-tion and forest
degradation with automated
method in Ama-zon
Freely availa-ble
High +++
https://www.tandfonline.com/doi/abs/10.1080/01431161.2019.1579943?j
ournalCode=tres20
Shimizu et al. (2017)
Kyushu University Opera-tional
Regional (Myanmar)
15 years (2000-2014)
Landsat TM/ETM+/
OLI 30m
Yearly or
twice yearly None
After log-ging
Digital Ele-vation Model
No differentia-tion between le-
gal and illegal logging
Yes
Assess capacity of Landsat time se-ries to attribute disturbances in tropical forest
Freely availa-ble
Moderate ++ https://www.mdpi.com/
1999-4907/8/6/218
Shu et al. (2014)
Helsinki University Opera-tional
Local (Came-roon)
4 months (2010-2012)
MODIS 250m 16 days
Forest inven-tory measure-
ments, ground points
for logging roads and
yards
After log-ging
None
Requires exten-sive field cam-paign, coarse
spatial resolution
Not likely
Investigate prox-ies to predict for-est degradation due to selective
logging
Freely availa-ble
High ++ https://helda.hel-
sinki.fi/han-dle/10138/39106
Singh et al. (2018)
Imperial College London
Opera-tional
Regional (Cambodia)
5 years (2011-2015)
Landsat TM & ALOS
PALSAR & airborne Li-
DAR
30m & 25m
Yearly Ground truth
points After log-
ging None Labour intensive Not likely
Compare tem-poral variation in forest cover and structure in com-
munity forests
Upon registra-tion
High +++ https://onlineli-
brary.wiley.com/doi/full/10.1002/ece3.4492
Solberg et al. (2013)
Norwegian Forest and Land-scape Institute
Demon-stration
Local (Norway)
11 years (2000-2011)
Shuttle Ra-dar & Tan-dem-X In-
SAR
10m 11 years None After log-
ging
Official log-ging rec-
ords
Inaccuracy in log-ging records, low detection of non-
clear-cut areas
Yes
Determine clear cut areas with differences in Digital Surface
Models
Freely availa-ble
Moderate ++
https://pdfs.seman-ticscholar.org/13c1/92b17afd8fcfa4106c4252c107
dd0bf8c1f6.pdf
Tang (2018) Boston University Proto-type
Local (Amazonia)
4 years (2012-2015)
MODIS & Landsat TM
fusion 30m Daily None
Near-real time
None
No detection of smaller disturb-ance or low in-
tensity ones
Yes
Near-real time monitoring forest
disturbance via multiple sensors
Freely availa-ble
High ++ https://open.bu.edu/han
dle/2144/27562
Tang (2018) Boston University Demon-stration
Local (Amazonia)
4 years (2012-2015)
VIIRS & MODIS
500m & 250m
Daily None Near-real
time None
Low detection rate with VIIRS, high cloud cover due to afternoon
overpass
Yes
Compare MODIS and VIIRS capac-
ity to monitor dis-turbance in near
real-time
Freely availa-ble
High + https://open.bu.edu/han
dle/2144/27562
de Wasseige and Defourny
(2004)
Université Catholique de Lou-
vain
Opera-tional
Local (Central African Repub-
lic)
5 years (1990-1995)
SPOT XS & Landsat TM
30 to 120m 5 years Field survey of logging
trails
After log-ging
Reference SAR image
Requires timely imagery without
clouds, Yes
Improve detec-tion and monitor-ing of logging at
local scale
Freely availa-ble
High +++
https://linkinghub.else-vier.com/re-
trieve/pii/S0378112703003876

Monitoring Forests Through Remote Sensing
Final Report
2.3 Pest and diseases
2.3.1 Vulnerability of forests to attacks
Forests are vulnerable to pest and diseases, for example through attacks by beetles, fungal pathogens
and their insect vectors etc. (Evangelista et al., 2011; Lindner et al., 2010). Although predation from
native organisms, such as fungi and insects, is typical of the natural equilibrium of forest ecosystems,
Niemann et al. (2015) pointed out that this balance can be upset by forest management practices and
further amplified by climate change. They argue, that in many managed forests, the increased homoge-
neity (of even-aged monoculture) stands benefitted these organisms to the point that population dy-
namics have reached epidemic proportions. In Europe nowadays, insect infestations, as for example
caused by the spruce bark beetle (Ips typographus L.) form the main disturbance event and destroy
more forested areas than all other natural disturbances together (Seidl et al., 2017). To minimize eco-
nomic loss and to preclude mass outbreaks, an early detection of infestations is crucial (Fettig et al.,
2007). In addition, identification of forest stands at risk is of high value for mitigation and for prevention
mass outbreaks (Immitzer et al., 2018).
The vulnerability of forests to pest and diseases depend on one hand on abiotic factors which affect the
health of a forest, such as issues linked to moisture like drought, winter-drying, and waterlogging. A
forest’s predisposition to damage from both abiotic and biotic effect can vary to a large extent (Neuvo-
nen et al., 2005). The predisposition is usually a direct consequence of site characteristics and the indi-
vidual’s adaptation to local site conditions (Nowak et al., 2015). The actual risk and probability of infes-
tation is a direct result of both stand susceptibility and the magnitude of surrounding pest populations,
e.g. the population pressure (Bone et al., 2013). The interchange between biotic and abiotic factors is
illustrated in Figure 9 for the case of bark beetles (from Biedermann et al. (2019)).
Figure 9. Overview of variables affecting eruptive forest insects (here Ips typographus) (Source: Biedermann et al., 2019)
Monitoring Forests Through Remote Sensing
Final Report
53
As disturbances such as fire and windthrow can alter and weaken forest ecosystems, attacks often fol-
low such events (Netherer and Nopp-Mayr, 2005). At the same time, pest and diseases make forests
more vulnerable to storm damage etc. Due to ongoing global climate change, affecting both average
weather conditions and extreme events, an increase in the frequency and severity of pest and diseases
is expected (Bentz et al., 2010; Seidl et al., 2017).
Hlásny and Turčáni (2009) for example pointed out that insects are physiologically extremely sensitive
to temperature. This effects on one hand their distributional range. In addition, climate also influences
their voltinism (i.e. the annual number of generations). The multi-voltinism is expected to shift to north-
ern locations and higher altitudes, if climate warming continues extending the vegetation season. This
might cause further severe damage to forests in such regions (Hlásny and Turčáni, 2009).
2.3.2 Difficulty in detecting disturbances in EO data
EO can contribute to the cost-efficient mapping and monitoring of pests and diseases by detecting the
resulting disturbances as manifested in modified spectral/temporal signatures. Unfortunately, many
other factors may also alter the biochemical and structural characteristics of trees and forest stands –
as well as their spectral/thermal properties –, making such changes both relatively unspecific and often
buried in „background noise“.
The wide „natural“ variability in forest spectral characteristics can be demonstrated both empirically
(Gregory P. Asner et al., 2009; Guyot et al., 1989; Hallik et al., 2019; Rautiainen, 2005) and using suitable
forest radiative transfer models (Kötz et al., 2004; Kuusk and Nilson, 2000; Schlerf and Atzberger, 2006).
With respect to the red-attack stage, Niemann et al. (2015) for example pointed correctly out that „alt-
hough the red foliage is commonly visible, other factors such as outbreak size, other codominant canopy
species, understory mixtures, and the spatial/spectral resolutions of the remotely sensed imagery can
often restrict our ability to detect and map red-attack from satellites.“
In Rullan-Silva et al. (2013) a general review about detection of insect defoliation is available. A more
recent review of applied EO to detect insect disturbances is provided in Senf et al. (2017) and a brief
introduction to EO-based insect pest detections in Canada in Hall et al. (2016). Rullan-Silva et al. (2013)
review remote sensing techniques for the detection of forest insect defoliation.

Monitoring Forests Through Remote Sensing
Final Report
54
2.3.3 Bark beetles related damages
Many different species can attack and harm forests (Flower and Gonzalez-Meler, 2015; Lee et al., 2007).
Table 4 summaries bark beetle species having the capacity to cause landscape-level tree mortality in
the western US and Canada. Many other species can also disturb forest growth.
Table 4. Bark beetle species that have the capacity to cause landscape-scale tree mortality in the western United States and Canada (Source: Bentz et al., 2010)
In Figure 10, a German beech forest is shown („Bienwald“) which was heavily defoliation by a Gypsy
Moth infestation (June-July 1994), visible through changes in the SWIR-nIR-Red RGB composite from
Landsat satellite. However, as seen in the post-event image (June 1995), deciduous forests usually re-
cover quickly from such attacks.
In the coniferous forests of Europe and North America, bark beetles are the most important disturbance
agents (Raffa et al., 2008; Seidl et al., 2011a). A large number of studies exist, often related to the recent
increase in unplanned harvesting of European forests following bark beetle infestations (Seidl et al.,
2011b). The increasing number of severe bark beetle outbreaks caused extensive economic loss in the
forest industry (Goheen and Hansen, 1993; Waring et al., 2009). The economic impacts include a reduc-
tion in the commercial value of the infested trees as well as increased management costs (Schowalter,
2012). Besides causing economic losses, beetle outbreaks form an important ecological factor in the
development of the forest landscape, leading to structural and compositional changes, while biodiver-
sity and ecosystem services are altered (Thom and Seidl, 2016).
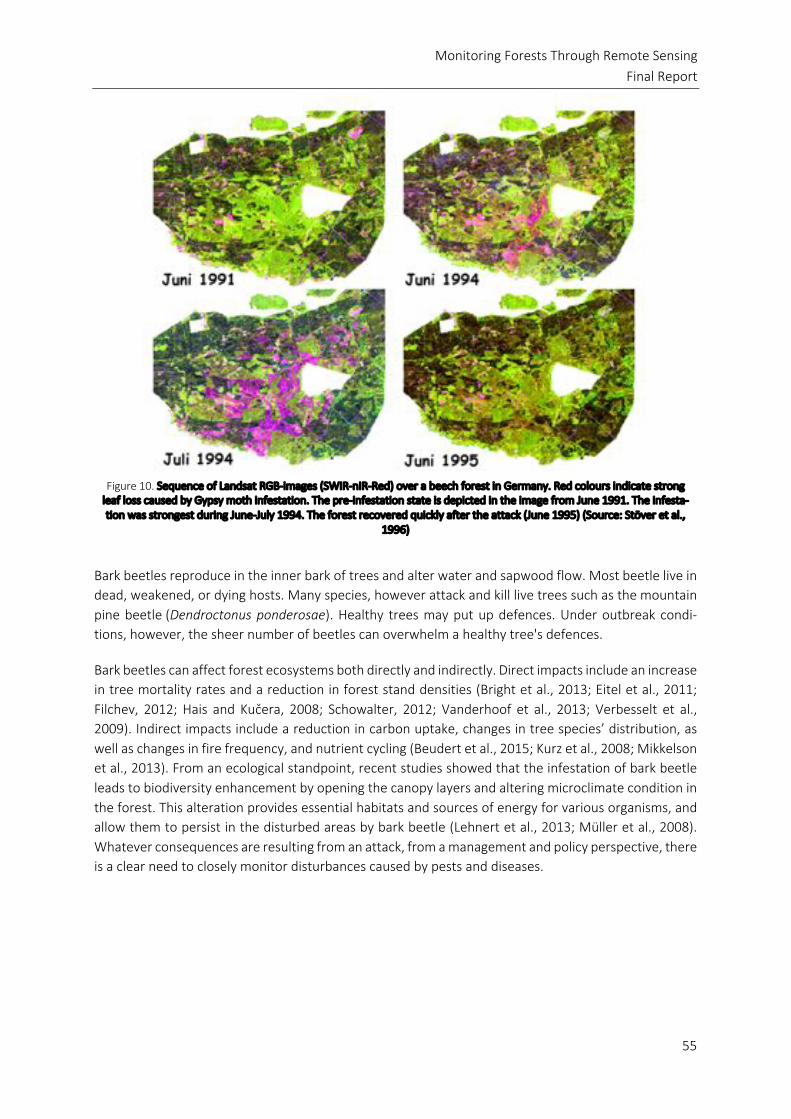
Monitoring Forests Through Remote Sensing
Final Report
55
Figure 10. Sequence of Landsat RGB-images (SWIR-nIR-Red) over a beech forest in Germany. Red colours indicate strong
leaf loss caused by Gypsy moth infestation. The pre-infestation state is depicted in the image from June 1991. The infesta-tion was strongest during June-July 1994. The forest recovered quickly after the attack (June 1995) (Source: Stöver et al.,
1996)
Bark beetles reproduce in the inner bark of trees and alter water and sapwood flow. Most beetle live in
dead, weakened, or dying hosts. Many species, however attack and kill live trees such as the mountain
pine beetle (Dendroctonus ponderosae). Healthy trees may put up defences. Under outbreak condi-
tions, however, the sheer number of beetles can overwhelm a healthy tree's defences.
Bark beetles can affect forest ecosystems both directly and indirectly. Direct impacts include an increase
in tree mortality rates and a reduction in forest stand densities (Bright et al., 2013; Eitel et al., 2011;
Filchev, 2012; Hais and Kučera, 2008; Schowalter, 2012; Vanderhoof et al., 2013; Verbesselt et al.,
2009). Indirect impacts include a reduction in carbon uptake, changes in tree species’ distribution, as
well as changes in fire frequency, and nutrient cycling (Beudert et al., 2015; Kurz et al., 2008; Mikkelson
et al., 2013). From an ecological standpoint, recent studies showed that the infestation of bark beetle
leads to biodiversity enhancement by opening the canopy layers and altering microclimate condition in
the forest. This alteration provides essential habitats and sources of energy for various organisms, and
allow them to persist in the disturbed areas by bark beetle (Lehnert et al., 2013; Müller et al., 2008).
Whatever consequences are resulting from an attack, from a management and policy perspective, there
is a clear need to closely monitor disturbances caused by pests and diseases.

Monitoring Forests Through Remote Sensing
Final Report
56
2.3.4 The phenology of bark beetle attacks
To understand the potential of EO in pest related monitoring systems, it is imperative to analyse the
potential detectability of such attacks. In this respect, the phenology of bark beetle and the associated
host responses are well described (e.g. Wermelinger, 2004). Indeed, the infested trees go through three
stages of attack (Coulson et al., 1985), with varying degree of „visibility“ for both human observer and
EO sensors:
• green-attack
• red-attack
• grey-attack
During the green-attack stage, the foliage retains its vigorous green appearance. Therefore, a visual
detection of this stage at leaf and canopy levels is difficult (Niemann and Visintini, 2005; Wulder et al.,
2009). However, the subsequent degradation of the needles during the red-attack stage can be noted
by regular field observations, as the chlorotic needles turn from green to yellow/red-brown. The infes-
tation leads finally to complete foliar necrosis, which produces the characteristic red colour and ulti-
mately the abscission or shedding of all foliage (commonly referred to as grey attack). This discoloration
and needle loss of the attacked trees is easily visible at canopy level (Coulson et al., 1985).
As changes occur in the biochemical composition of the needles and the biophysical characteristics of
the entire tree, bark beetle infestations induce changes in the spectral response of the infested trees
(Immitzer and Atzberger, 2014; Meddens et al., 2013). For example, as pointed out by Abdullah et al.
(2018), during the infestation period, trees are subjected to increasing stress and face physiological
change, as water and sapwood flows are interrupted while the beetle drills into the tree’s cambium
tissue and thereby deterioration the chloroplasts. At the same time, the fungi carried by the beetles
penetrate the living phloem and xylem cells, hampering the translocation of water, sugar and other
nutrients within the bole of the tree (Abdullah et al., 2018). This leads to a gradual change in biochemical
and water content in the attacked tree, thus inducing alterations to its spectral characteristics over the
course of the infestation (Lawrence and Labus, 2003), as well as changes in surface temperatures
(Sprintsin et al., 2011).
2.3.5 The need for detecting green-attack to prevent mass outbreaks of bark bee-tles
From a management perspective, the detection outbreaks at the green-attack stage is the most im-
portant, as management aims to preclude a mass outbreak by removing the infested tree(s) (Wermel-
inger, 2004). At the green-attack stage, the trees hold the next generation of beetles (Wulder et al.,
2009). Management intervention to prevent further outbreaks therefore involve the removal of in-
fested trees before the new brood emerges and migrates (Wulder et al., 2009).
Traditionally, foresters perform field surveys to identify infested trees. Obviously, such surveys are very
laborious, costly, and therefore inefficient and hard to apply over large areas. EO has the potential to
detect pest infestations over large areas in a timely, repeatable and cost-efficient manner. Employing
remotely sensed data allows monitoring changes in leaf and canopy properties before and after insect
infestation (Ahern, 1988; Bright et al., 2013; Carter et al., 1998; Dye et al., 2008; Eitel et al., 2011; Foster
et al., 2017; Lausch et al., 2013; Lottering et al., 2018; Meddens et al., 2013; Niemann et al., 2015; Ortiz

Monitoring Forests Through Remote Sensing
Final Report
57
et al., 2013; Stöver et al., 1996). A good review on EO detection techniques during green attack is pro-
vided in Niemann and Visintini (2005). The review of Wulder et al. (2009) focusses on the main chal-
lenges for reliably detecting the (mostly) subtle changes.
To date, the utilisation of remote sensing for the monitoring and detection of bark beetles by forest
managers has mainly focused on the last two attack stages (i.e., the red and grey stage) (Abdullah et al.,
2018). During red and grey-attack, the changes in leaf and canopy composition and structure affect the
spectral reflectance signature which is readily accessible as an indicator to detect infestations (Carter et
al., 1998; Franklin et al., 2003; Heurich et al., 2010; Latifi et al., 2014; Skakun et al., 2003; M.A. Wulder
et al., 2006; Michael A. Wulder et al., 2006). However, detecting the infestation in the last two stages is
only of limited value for a successful management, as the newly developed beetles have already left
their host trees and started to attack neighbouring trees (Abdullah et al., 2018). Therefore, the outbreak
progression cannot be prevented by salvage logging during this stage. Consequently, to have a mean-
ingful means of controlling the spreading of the beetle, it is necessary to detect the bark beetle at the
green-attack stage (Abdullah et al., 2018; Immitzer and Atzberger, 2014). This is obviously very chal-
lenging due to subtleties of the symptoms (Einzmann et al., 2014), and moreover considering the above
mentioned huge natural variability of spectral signatures within forests. For example, Schlerf et al.
(2010) have demonstrated that chlorophyll can be relatively well retrieved in forests leaves/needles as
the chlorophyll absorption is very strong in the visible spectral region (Figure 11). However, the weak
absorption bands of protein in the SWIR hinder its accurate prediction even at leaf-level. At the canopy
level, weak absorption bands related to protein content will be hidden by strong modifications of the
reflectance spectra as a result to changes in canopy structure not related to any infestation (e.g. differ-
ent stand ages, stand densities, understory vegetation cover).
Figure 11. Sensitivity of leaf optical properties to (stress-induced) changes in chlorophyll and protein content (Source: Schlerf et al., 2010).
Leaf-level studies
At the leaf level, numerous studies have examined the differences in spectral reflectance between
healthy needles and needles affected by bark beetle green attack (Ahern, 1988; Carter and Knapp, 2001;
Cheng et al., 2010; Foster et al., 2017; Jones and Vaughan, 2010). Cheng et al. (2010), for example,
observed significant differences in water absorption features of healthy and infested needles. As differ-
ences in water content and water absorption affect the foliar spectral properties, these results show
Clab Protein

Monitoring Forests Through Remote Sensing
Final Report
58
that remote sensing has the potential to detect early stages of attacks. Indeed, as mentioned earlier,
and as pointed out by Abdullah et al. (2018), it is expected that the infested tree will exhibit a change in
terms of its biochemical and spectral properties. This is due to the beetle larva and blue stain fungi
carried by the beetles which penetrate the living phloem and xylem cells, hampering the translocation
of water, sugar and other nutrients within the bole of the tree. Based on those facts, Abdullah et al.
(2018) investigated the potential of early detection of a bark beetle green-attack by examining and
comparing the foliar biochemical (chlorophyll and nitrogen) and spectral properties of needles from
both healthy and green-attacked trees. They demonstrate that chlorophyll and nitrogen concentrations
are indeed reduced during such an attack – albeit with strong overlaps. EO-based estimates of these
biochemicals can thus provide suitable proxies for detecting the presence of Ips typographus L. during
a green-attack stage (Abdullah et al., 2018). However, as discussed above, this would require (i) that the
observed changes at leaf-level induce similarly strong alterations at canopy level, and that (ii) the in-
duced changes can be observed within the „background noise“.
Canopy-level studies involving aerial photos
At canopy level, early detection of infestations by Dendroctonus spp. in lodgepole pine trees has been
investigated by Gimbarzevsky et al. (1992). For pine stands in grey stage (e.g. beetle-killed), Gimbarzev-
sky et al. (1992) were able to demonstrate the operational use of airborne remote sensing techniques
for identification of beetle-killed forest stands and for mapping their areal extent. However, a clear sep-
aration of different levels of damage intensity was not possible using this data.
Canopy-level studies involving Landsat and Sentinel-2 imagery
Abdullah et al. (2019) evaluated the ability of spectral vegetation indices extracted from Landsat-8 and
Sentinel-2 imagery to map bark beetle green-attack in old and mature Norway spruce (Picea abies) in
the Bavarian National Park (BNP) using principal component analysis (PCA) and partial least square dis-
criminate analysis (PLS-DA). Results were validated using a recent infestation map produced through
visual interpretation of high-resolution aerial photographs. They observed that the canopy reflectance
spectra differed significantly between healthy and infested plots for both Sentinel-2 and Landsat-8. At
the same time, a large number of spectral vegetation indices (SVIs) calculated from Sentinel-2 involving
red-edge and SWIR bands were able to discriminate healthy from infested plots. In contrast, fewer in-
dices from Landsat-8 were able to discriminate between healthy and infested plots. The total number
of pixels identified as harbouring a green attack that matched with ground truth data (aerial photog-
raphy) was higher for Sentinel-2 (67%) than for Landsat-8 (36%). Although the accuracy obtained from
the Sentinel-2 may not be high enough for operational forestry practice and management purposes, it
shows some potential for the use of Sentinel-2 data for alerting to bark beetle green attacks.
Canopy-level studies involving commercial satellites
Detection of a bark beetle green-attack (Ips typographus, L.) at canopy level in Norway spruce trees has
also been investigated more recently by Immitzer and Atzberger (2014), Marx (2010) and Ortiz et al.
(2013) using commercial satellites. These studies did partly succeed in discriminating healthy from green
attacked trees. For example, in the study of Immitzer and Atzberger (2014), the suitability of 8-band
WorldView-2 satellite imagery for detecting bark beetle infestations was investigated. WorldView-2 is a
commercial very high resolution satellite with pixel size of about 1 m. The study distinguished the two
intensity stages (e.g. grey and green-attack) against healthy (non-attacked) trees.

Monitoring Forests Through Remote Sensing
Final Report
59
Figure 12. Investigating of the suitability of 8-band WorldView-2 satellite imagery for detecting bark beetle infestations (Source: Immitzer and Atzberger, 2014).
Despite the relatively large class overlap in the spectral signatures (Figure 12), the sample trees (n =
600) could be assigned to the classes dead, green-attack, and healthy with an overall accuracy of about
75%. Producer’s and user’s accuracies of all classes were around 70%. For the separation of the classes
healthy and green-attack, vegetation indices based on 2-band normalized differences yielded nearly as
good results as the classification with all eight spectral bands.
In the study of Marx (2010), RapidEye imagery was used to study the separability of healthy trees from
green and red-attack, and results were only moderate. RapidEye is another commercial VHR satellite
but with somehow reduced spectral performance compared to WorldView-2. Whereas red-attack could
be relatively well detected, the confusion between healthy and green-attack was too high to permit a
useful mapping. In the study of Ortiz et al. (2013), RapidEye and TerraSAR-X data were analysed to de-
tect bark beetle green-attack. As expected, the microwave TerraSAR-X data resulted in a poor classifi-
cation accuracy with a cross-validated Cohen’s Kappa Coefficient of only 0.23. The optical RapidEye data
resulted in a higher classification accuracy (kappa of 0.51) but still not satisfying.
Canopy-level studies involving experimental sensors
Beside the use of commercial EO sensors, several studies examined the potential of experimental sen-
sors. For example, Niemann et al. (2015) used LIDAR and imaging spectrometer data to examine the
spectral properties of healthy and infested trees (green-attack). Their analysis suggest that green-attack
spectra are consistently separable from the other two groups of spectra (healthy and red-attack) when
addressing the shape of absorption features. This is especially true of the pigment feature centred on
680 nm, but is also evident in the foliar water features entered on 1250 nm and 940 nm.

Monitoring Forests Through Remote Sensing
Final Report
60
Table 5. Aggregated confusion matrix for classification of different health classes; BL: Broadleaved, CF: coniferous, GMS: Green Mortality Stage, EMS: Early Mortality Stage, LMS: Late Mortality Stage, UA: User’s Accuracy, PA: Producer’s Accuracy, OA: Overall Accuracy (Source: Fassnacht et al., 2014).
In another study involving airborne imaging spectrometer data, Fassnacht et al. (2014) investigated the
identification of several bark beetle attack stages in Norway spruce within the Bavarian National Park
(BNP). Due to the absence of field data, CIR aerial imagery was employed to provide the required refer-
ence data. Despite a reasonable overall accuracy, the results were judged to be not sufficiently applica-
ble for operational use. This is demonstrated in Table 5 showing the confusion matrix, where the most
important classes (i.e., classes of GMS and Healthy Coniferous and those of EMS and LMS) are highly
confused.
To simulate stress conditions which ultimately lead to bark beetle infestations in Norway spruce stands,
Reichmuth et al. (2018) conducted an experiment in which trees were artificially stressed and thereafter
repeatedly sampled and overflown with airborne imaging spectrometers. Their ring-barking experiment
shows that an early detection, compared with visual crown assessment, is partly possible using this
specific data set.
Näsi et al. (2015) used a VNIR hyperspectral sensor mounted on an unmanned aerial vehicle (UAV) to
map bark beetle damage at tree level, differentiating between three different classes: healthy, red-at-
tack and dead. They found that the healthy and dead trees can be classified with high accuracies, how-
ever, when all classes were considered (healthy, red-attack and dead), the overall accuracy dropped
significantly.
Although promising, the above reviewed experimental approaches clearly demonstrate that there is a
potential for an improved monitoring. However, all mentioned experimental sensors are currently un-
suitable for large scale and operational applications. Indeed, from an operational point of view, timeli-
ness, costs and sensor availability need to be considered in addition to accuracy. This excludes the use
of LIDAR sensors, UAV and imaging spectrometer data. On the other hand, the use of commercial very
high-resolution satellite imagery such as WorldView-2/3 is in principle feasible, but will entail high costs
for data provisioning. No studies have been published so far investigating the potential of Planet’s dove
imagery with about 5 m spatial resolution and daily revisit capacity. As the cameras on-board of these
satellites only cover the VNIR spectral region, and this with relatively low signal-to-noise ratio (SNR), a
break-through is not expected.

Monitoring Forests Through Remote Sensing
Final Report
61
2.3.6 Detection of bark beetle-caused tree mortality
Bark beetles cause significant tree mortality in coniferous forests across North America and Europe.
Although not helpful for the prevention of mass outbreaks, mapping beetle-caused tree mortality is
important for gauging impacts to forest ecosystems and assessing trends (Meddens et al., 2013).
To determine the accuracy of multi-temporal disturbance detection methods for mapping forest dis-
turbances, and to quantify differences between these methods and single-date image classification
methods, Meddens et al. (2013) conducted a large and conclusive study in North America (Figure 13).
They compared single-date to multi-date (using time series of spectral indices) classification methods
of Landsat imagery and investigated how detection accuracy changed with varying levels of mortality
severity. As reference data, a fine-resolution classified aerial image within the Landsat footprint was
used. For the single-date image classification, an overall accuracy of 91% was achieved, with 11.7%
omission and 2.3% commission errors for the red stage (tree mortality) class. For the multi-date analysis,
overall accuracies were similarly high, however with improved balance between omission and commis-
sion errors for the red stage class: 12.6% omission and 7.1% commission errors. The multi-date method
was more accurate at intermediate levels of tree mortality, whereas the single-date method was more
accurate at high mortality levels (Figure 14). The authors concluded that both single-date and multi-
date methods can result in high classification accuracy for mapping of forest disturbances.
Figure 13. Flowchart describing the approach used by Meddens et al. (2013) to determine the utility of multi-temporal EO
image sequences for detecting tree mortality caused by bark beetles compared to single-date classifications (Source: Meddens et al., 2013).

Monitoring Forests Through Remote Sensing
Final Report
62
Figure 14. Classification accuracies obtained in the study of Meddens et al. (2013) for the detection of bark beetle red-attack. (a) Red-stage class accuracy, (b) red stage commission error, and (c) red stage omission error for single- (solid line)
and multi-date (broken line) classifications. Reference data taken from classified aerial imagery. Error bars indicate the standard deviation (Source: Meddens et al., 2013).
2.3.7 Detection of other pest and diseases using remote sensing data
Very high-resolution data and imaging spectrometer data
Ismail et al. (2008) found that simple band combinations, in combination with field and/or ancillary data,
can detect Sirex noctilio infestation levels using Gaussian maximum likelihood classifier. Tree specific
spectral responses were successfully extracted by Coops et al. (2003) to monitor health/unhealthy for-
est by different simple spectral ratios. In other studies, insect-infested areas are detected combining a
genetic algorithm for feature selection with SVM classification (Fassnacht et al., 2014). Root problems
in trees were identified using hyperspectral images combined with automated spectral feature extrac-
tion. This data was found viable for detecting laminated root rot centres when severe symptoms are
present (Leckie et al., 2004). Abdel-Rahman et al. (2014) distinguished amongst healthy, sirex grey (last

Monitoring Forests Through Remote Sensing
Final Report
63
stage)-attacked and lightning-damaged pine trees using complex machine learning classifiers and imag-
ing spectrometer data. Dimensionality reduction techniques were applied to permit the use of a simpler
classifier. Pu et al. (2008) used the most common dimensionality reduction in remote sensing commu-
nity, that is, principal component analysis. Then, a multi-level maximum likelihood classifier was used to
detect mortality and vegetation stress associated with a new forest disease. A QuickBird image was used
by Coops et al. (2006) to detect mountain pine beetle red attack damage using ANOVA testing of indi-
vidual spectral bands, as well as NDVI and Red-Green Index. To identify mountain pine beetle-caused
mortality in a high-elevation white bark, a ratio of Red/Green and Green bands from QuickBird was used
within a maximum likelihood classification approach (Hicke and Logan, 2009). A WorldView-2 image
together with several vegetation indices and environmental variables were used separately within PLS
regression models to predict and map the severity of T. peregrinus damage in plantation forests (Oumar
and Mutanga, 2014). Barmpoutis et al. (2019) shows a great potential to identify tree health condition
using multi- pyramid feature extraction (different resolutions) compared to traditional feature extrac-
tion using a single image acquisition. Using a modify NDVI, in the study of Lehmann et al. (2015) a single
UAV acquisition was sufficient to distinguish between five vegetation health classes: infested, healthy
or dead branches, other vegetation and canopy gaps. Time-series multi-spectral imagery acquired by
UAV were used to detect and monitor the symptoms resulting from simulated forest disease outbreaks
(Dash et al., 2018, 2017).
Landsat
The temporal resolution and the free availability of Landsat makes the sensor a good option to work
with temporal series. For example, the sensor has been used to classify the severity of mountain pine
beetle disturbance using a generalized least squares model (Assal et al., 2014) and to detect significant
reductions in the photosynthetic activity of forested areas during disturbed growing seasons with a
maximum likelihood classifier (Babst et al., 2010). In another study, Landsat data was used to predict
percent red stage tree mortality caused by mountain pine beetle outbreaks with multiple linear regres-
sion models and generalized additive models (Meddens and Hicke, 2014). Finally, in Meigs et al., (2011),
Landsat data was analysed to characterize spectral trajectories associated with insect activity of varying
duration and severity. These authors were able to relate those trajectories to ground-based measure-
ments of tree mortality and surface fuels using a change detection algorithm. As Sentinel-2 has im-
proved properties compared to Landsat, it can be expected that similar or better results can be obtained
for these EO applications.

Monitoring Forests Through Remote Sensing
Final Report
64
2.3.8 Conclusion and Summary Table Pest and Diseases
For this review, a large number of studies have been reviewed that relate to pests and diseases. Due to
dominance of bark beetle infestations in European forests, most papers focus on bark beetle infesta-
tions, while studies of other pests and diseases are less abundant. Despite this focus on bark beetles, it
is believed that from the analysed studies a number of findings can be derived that are valid for other
pests and diseases as well:
• EO data has great potential to support pest-related monitoring attempts as remotely sensed data
can over large areas, cost-efficiently in a repeated manner. To monitor pests and diseases such a
fine spatial resolution and a high revisit frequency are mandatory.
• Claims by some commercial service providers of having developed feasible and robust solutions
are to be questioned as all peer-reviewed scientific studies show that currently only low to moder-
ate accuracies can be expected. The difficulties are mainly related to the extremely large natural
variability in spectral signatures of forests compared to the small variations associated with the
disturbance itself.
• Similar to findings of other disturbances in forests, one has to keep in mind that while the effect of
a given agent can be detected, causal links generally do not exist. In particular, there is no such
“spectral fingerprint” to distinguish a specific pest from another health issue. This implies that al-
ways a kind of a “triangulation” is necessary to attribute a detected vegetation anomaly to a specific
pest.
• When setting up a pan-European monitoring system, one has to distinguish between green-attacks
on one side and red/grey-attacks on the other side. The system requirements of both sub-systems
are different. Obviously, a green-attack monitoring system is the most beneficial for stakeholders.
• Ideally, monitoring systems for pest and diseases should be embedded in suitable forecasting sys-
tems considering other important determinants of attacks such as general health characteristics
and drought-related predisposition etc.
• Red/grey attacks can be detected with higher accuracy compared to green-attacks, however their
usefulness is limited to down-stream services such as timber market.
• To prevent the outbreak of large infestations, a detection capability at green-attack stadium is nec-
essary. The identification of green-attack stadium requires not only the detection of extremely sub-
tle reflectance changes but also a very high temporal revisit frequency as the development cycle
of the pests are mostly very short.
• In the absence of a spaceborne imaging spectrometer with deca-metric resolution and weekly re-
visit frequency, only spaceborne sensors will provide the necessary spatial coverage at high tem-
poral resolution. We recommend the use of Sentinel-2 imagery, complemented by commercial
VHR satellites which should be tasked on request, once suspicious areas have been identified from
the Sentinel-2 time series.
• As many pathogens are linked to specific tree species, a monitoring system should build on a de-
tailed tree species map, currently unavailable at European scale. The existing HR forest layers are
not sufficient for this task.
• While the set-up of a pan-European monitoring system is the ultimate aim, local/regional
knowledge will be necessary to fine-tailor the algorithms to different environmental settings.

Monitoring Forests Through Remote Sensing Final Report
65
Table 6. Summary table listing pest and diseases studies or products using remote sensing or near surface sensing
Reference
Status and name of en-
tity operating system
Current status Spatial Extent
Temporal Extent
Remote sensing
data sources
Temporal resolution
Spatial resolu-
tion Metrics
Types of required
in-situ data
Delivery timeliness Ancillary data Limitations Possible
scaling up Application use Product
dissemina-tion
Validation standards
Validation results Link doc
Abdel-Rah-man et al.
(2014)
University of KwaZulu-Na-
tal
Demonstra-tion
Local (Hodgsons Sappi planta-
tion, KwaZulu-Natal, South Af-
rica)
1 year (2009) AISA Eagle
hyper-spectral
-- 2m
Random for-est and sup-port vector machines
Ground true data
After ground true acquisi-
tion and dam-age
None
Requires ground data & study area
extension
Yes
Distinguish amongst healthy,
sirex grey-attacked and lightning-dam-
aged pine trees
Cost of sensors
High +++ https://www.na-
ture.com/arti-cles/ngeo2400
Ahern (1988) Canada Cen-
tre of Remote Sensing
Demonstra-tion
Local (Central British Colum-bia, Canada)
- None -- --
ANOVA, Tukey multi-ple compari-
son, PLS
Ground true data (6 trees)
After ground true data ac-
quisition None
Ground true data is essen-
tial No
Examining foliar re-flectance proper-ties revealing the earliest signs of
mountain pine bee-tle attack
Cost of spectrom-
eter
No valida-tion
--
https://www.tandfonline.com/doi/abs/10.1080/01431168808954
952
Assal et al. (2014)
U.S. Geologi-cal Survey
Demonstra-tion
Local (Glacier National Park,
US)
15 years (1973-1987)
Landsat 16 days 30m generalized linear model
None
After data availability (after dam-
age)
Colour infrared aerial photo-graphs, aerial
detection survey data and ground
true collected from aerial pho-
tos
Study area extension
and simple statistical analysis
Yes
Characterize retro-spectively a land-scape scale moun-
tain pine beetle disturbance
Freely available
Moderate ++
https://www.sci-encedi-
rect.com/sci-ence/arti-
cle/pii/S0034425714003435
Babst et al. (2010)
Swiss Federal Research In-stitute WSL
Demonstra-tion
Local (Lake Tor-neträsk, Swe-
den)
4 acquisitions (1990,
1996,1998, 2001)
Landsat & LISS-III
16 days & 24 days
30m & 23m
Maximum likelihood classifier
Increment cores from 18–20 trees were taken
during a field campaign
After data availability (after dam-
age)
DEM, inventory tree and climate
data
In-situ meas-urements into small
area
Yes
Detect significant reductions in the
photosynthetic ac-tivity of forested areas during dis-turbed growing
seasons
Freely available
after regis-tration
Moderate ++
https://www.sci-encedi-
rect.com/sci-ence/arti-
cle/pii/S0034425709003307
Barmpoutis et al. (2019)
Imperial Col-lege London
Demonstra-tion
Local ( fir tree forest area,
Greece) N/A UAV -- N/A
Multi-pyra-mid feature extraction
None
After data availability (after dam-
age)
Dataset with 50 forest images
and in total 1548 trees
Opening study, num-ber of tree
species
Yes
Detect individual trees and identify
their health condition
Cost of sensors
High +++
https://ieeex-plore.ieee.org/a
bstract/docu-ment/8683128
Bone et al. (2013)
University of Victoria
Demonstra-tion
Local (British Columbia, Can-
ada) 2002-2006
Multitem-poral AOS
(Arial Overview Survey)
-- -- bivariate lo-cal Moran's I
Observed se-verity classes
data
After data availability (after dam-
age)
None
Depends on AOS data, which has
large omis-sion errors in case of very light damage
No
Assessing the short-term risk (se-
verity classes) of mountain pine bee-
tle Dendroctonus ponderosae attack over large forested
areas
Freely available
High +++
https://www.sci-encedi-
rect.com/sci-ence/arti-
cle/pii/S0143622813000623
Bright et al. (2013)
University of Idaho
Demonstra-tion
Local (Northern Colorado, USA)
2000-2011 Landsat, MODIS
16 days & 1-2 days
30m & 500m, 1km
(repro-jected)
GAM with no spatial
autocorrela-tion in the residuals
Ground data
After ground true data ac-quisition and EO data avail-ability (after
damage)
None Ground data
sampling No
To estimate changes in biogeo-chemical and bio-geophysical varia-bles Bark beetle
impact on LAI, GPP, ET, LST and albedo
Freely available
Moderate +
https://agupubs.onlineli-
brary.wiley.com/doi/full/10.100
2/jgrg.20078

Monitoring Forests Through Remote Sensing Final Report
66
Reference
Status and name of en-
tity operating system
Current status Spatial Extent
Temporal Extent
Remote sensing
data sources
Temporal resolution
Spatial resolu-
tion Metrics
Types of required
in-situ data
Delivery timeliness Ancillary data Limitations Possible
scaling up Application use Product
dissemina-tion
Validation standards
Validation results Link doc
Cao et al. (2019)
Inner Mongo-lia University
of Technology
Demonstra-tion
- 1
acquisition (2019)
TomoSAR -- -- PolSAR pro Simulation
None
After simula-tion of
healthy and non-healthy vegetation
None Opening
study Yes
SAR capability of Forest 3D vertical
simulation regarding healthy and non-healthy
forest
Freely available
No valida-tion
--
https://www.re-searchgate.net/
publica-tion/331875235
_Monitor-ing_Broad-leaf_For-
est_Pest_Based_on_L-
Band_SAR_To-mography
Cao et al. (1998)
University of Southern Mis-
sissippi
Demonstra-tion
Local (Ouachita National Forest, Arkansas, USA)
1 acquisition
(1998)
RDACS model II (with Ko-
dak Mega-plus 1.4
cameras)
-- 1m -- --
After data availability (flight after
damage)
None Very costly, small area
Yes
Monitoring forest health:
detecting damage by southern pine
beetle based on re-luctance
Cost of cameras
plus flight
No valida-tion
--
https://www.nrcresearch-
press.com/doi/pdf/10.1139/x98-
079
Carter and Knapp (2001)
University of Southern Mis-
sissippi
Demonstra-tion
Local (wood-lands of Stennis Space Centre,
Mississippi, USA)
-- -- -- -- ANOVA, lin-ear regres-
sion
Leaves col-lected after
early infesta-tion,
1 acquisition
(1995)
Simulation of stress-in-
duced changes after early infesta-
tion
None A unique
ecosystem No
Research: leaf spectral reflec-tance, absorp-
tance, transmit-tance changes to
early infestation by the southern pine beetle (Dendrocto-
nus frontalis)
Takes time for moni-
toring stress-in-
duced samples
No valida-tion
--
https://bsapubs.onlineli-
brary.wiley.com/doi/full/10.230
7/2657068
Cheng et al. (2010)
University of Alberta
Demonstra-tion
Local (Edmon-ton Alberta,
Canada) -- -- -- --
Linear cor-relation,
paired t-test
Reflectance spectra were collected for 16 pairs (con-
trol and stressed tree)
of trees -2 acquisition
(June and Au-gust, 2007)
After infesta-tion
None Data acquisi-
tion Not likely
Research: obtain-ing spectral infor-mation (wavelet transformation)
Considera-ble overlap
between data de-
rived from both in-
fested and control samples
High +++
https://www.sci-encedi-
rect.com/sci-ence/arti-
cle/pii/S0034425709003605#!
Coops et al. (2003)
CSIRO For-estry and For-est Products
Demonstra-tion
Local (southern New South Wales, Aus-
tralia)
1 acquisition (2001)
CASI-2 -- 0.8m ANOVA
Ground true assessed for
the severity of Dothistroma needle blight
on a scale of 1 to 6
After ground true acquisi-tion and data
availability (after dam-
age)
None
Use of hyper-spectral
scanners in Aircraft and
better selec-tion of indi-vidual tree
crowns
Yes Monitoring forest
health
Cost of CASI-2 data
Moderate ++
https://apsjour-nals.ap-
snet.org/doi/abs/10.1094/PHYTO.2003.93.12.152
4
Coops et al. (2006)
University of British Colum-
bia
Demonstra-tion
Local (British Columbia, Can-
ada)
1 acquisition (2005)
QuickBird & Landsat
1 to 3.5 days & 16
days
0.65m & 30m
ANOVA test of spectral
bands, NDVI and RGI
None
After data availability (after dam-
age)
Forest inventory database & For-est health data
Number of acquisition & extension of study area
Yes Detecting moun-
tain pine beetle red attack damage
Cost of QuickBird
data High +++
https://www.sci-encedi-
rect.com/sci-ence/arti-
cle/pii/S0034425706001283

Monitoring Forests Through Remote Sensing Final Report
67
Reference
Status and name of en-
tity operating system
Current status Spatial Extent
Temporal Extent
Remote sensing
data sources
Temporal resolution
Spatial resolu-
tion Metrics
Types of required
in-situ data
Delivery timeliness Ancillary data Limitations Possible
scaling up Application use Product
dissemina-tion
Validation standards
Validation results Link doc
Dash et al. (2017)
SCION Demonstra-
tion
Local (Kinleith Forest, New Zealand’s)
Temporal-se-ries
UAV & Narrow
band multi-
spectral imagery
-- 0.06m
Linear re-gression
(OLS), ANOVA to check the relations
and Random Forest for classifica-
tion
Tree health data
After ground true acquisi-tion and data
availability (after dam-
age)
None Extension of study area
Not likely
Detect and monitor the
symptoms resulting from a simulated
forest disease outbreak resulting in foliar discoloura-
tion
Cost of sensors
High ++
https://www.sci-encedi-
rect.com/sci-ence/arti-
cle/pii/S0924271617302745
Dye et al. (2008)
University of KwaZulu-Na-
tal
Demonstra-tion
Local (KwaZulu-Natal, South Af-
rica)
1 acquisition (November
2005) LReye -- 0.5m
Stepwise multiple lin-ear regres-
sion
Ground true data
After ground true data ac-quisition and EO data avail-
ability
None Costly, flight plus cameras
No
Prediction od of wood wasp infesta-tion levels in pine
plantations
Cost of EO data col-lection
High +++ https://doi.org/10.4001/1021-3589-16.2.263
Eitel et al. (2011)
University of Idaho
Demonstra-tion
Local (Mountai-nair, New Mex-
ico, USA)
22 time series images (Sept 2009 – Aug
2010)
RapidEye 5,5 days 5m Linear re-gression
Ground true data from two eddy covari-
ance flux tow-ers
After ground true data ac-quisition and EO data avail-
ability and
Simulated SVI based on ground
true data
Ground data sampling
No
Research: conifer early stress
detection using red-edge extracted SVI: NDVI, GNDVI,
NDRE
Freely available
High +++
https://www.sci-encedi-
rect.com/sci-ence/arti-
cle/pii/S0034425711003294#!
Evangelista et al. (2011)
Colorado State Univer-
sity
Demonstra-tion
Local (eight states including
the Rocks Mountains,
USA)
1991-2008
Aerial sur-veys
polygonised (pre-pared data)
-- N/A Maximum
Entropy None
After data availability (after dam-
age)
Polygons of in-fected area, 19 bioclimatic vari-ables from the
WorldClim data-base, three cli-mate models, polygons of in-
fected area
Accuracy of prepared pol-
ygon No
Predicting poten-tial distribution of three bark beetles
under three cli-mate scenarios for
2020-2050.
Freely available
High +++
https://www.sci-encedi-
rect.com/sci-ence/arti-
cle/pii/S0378112711001794?via%
3Dihub
Fassnacht et al. (2014)
University of Freiburg
Demonstra-tion
Local (Bavarian Forest National Park, Germany & Czech Repub-
lic)
2 acquisitions (August 2009)
HyMap -- 7 & 5m
Genetic al-gorithm for feature se-lection and
SVM for classifica-
tion
None
After data availability (after dam-
age)
Collection of sample points
Single scene (training)
procedure Yes
Detect insect-in-fested areas in a central European
landscape.
Cost of HyMap
data High +
https://www.sci-encedi-
rect.com/sci-ence/arti-
cle/pii/S0034425713003350
Foster et al. (2017)
University of Virgina
Demonstra-tion
Local (Monarch Pass, Colorado,
USA)
1 acquisition (sept 2014)
Landsat 16 days 30m Random Forest
Ground true data (needles)
to obtain spectral re-
flectance -hy-perspectral data) (Sept,
2014)
After ground true data ac-quisition and EO data avail-ability (after infestation)
None None Yes
Determining im-portant wave-
lengths for detect-ing early-stage
spruce beetle infes-tation in Engel-mann spruce.
Freely available
High +++
https://www.sci-encedi-
rect.com/sci-ence/arti-
cle/pii/S0378112716309604
Franklin et al. (2003)
N/A Demonstra-
tion
Local (Fort St. James Forest
District, British Columbia, Can-
ada)
1 acquisition (1999)
Landsat 16 days 30m Maximum-likelihood
Field data
After ground true data ac-quisition and EO data avail-ability (after
damage)
Aerial survey data point, GIS
forest inventory data
One model Yes
Identification and classification of
mountain pine bee-tle, red-attack
damage pattern in mature lodgepole
pine forest
Freely available
Very high +++
http://www.cfs.nrcan.gc.ca/pub-
ware-house/pdfs/212
80.pdf
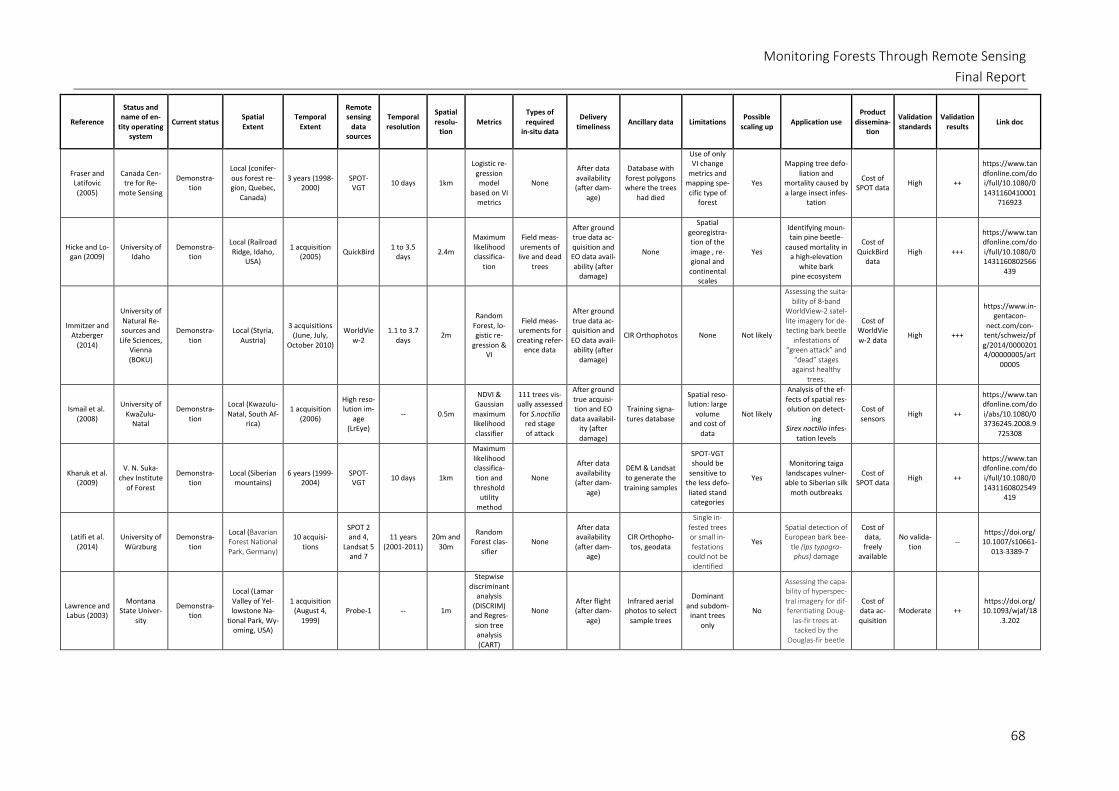
Monitoring Forests Through Remote Sensing Final Report
68
Reference
Status and name of en-
tity operating system
Current status Spatial Extent
Temporal Extent
Remote sensing
data sources
Temporal resolution
Spatial resolu-
tion Metrics
Types of required
in-situ data
Delivery timeliness Ancillary data Limitations Possible
scaling up Application use Product
dissemina-tion
Validation standards
Validation results Link doc
Fraser and Latifovic (2005)
Canada Cen-tre for Re-
mote Sensing
Demonstra-tion
Local (conifer-ous forest re-gion, Quebec,
Canada)
3 years (1998-2000)
SPOT- VGT
10 days 1km
Logistic re-gression model
based on VI metrics
None
After data availability (after dam-
age)
Database with forest polygons where the trees
had died
Use of only VI change
metrics and mapping spe-cific type of
forest
Yes
Mapping tree defo-liation and
mortality caused by a large insect infes-
tation
Cost of SPOT data
High ++
https://www.tandfonline.com/doi/full/10.1080/01431160410001
716923
Hicke and Lo-gan (2009)
University of Idaho
Demonstra-tion
Local (Railroad Ridge, Idaho,
USA)
1 acquisition (2005)
QuickBird 1 to 3.5
days 2.4m
Maximum likelihood classifica-
tion
Field meas-urements of live and dead
trees
After ground true data ac-quisition and EO data avail-ability (after
damage)
None
Spatial georegistra-tion of the image , re-gional and continental
scales
Yes
Identifying moun-tain pine beetle-
caused mortality in a high-elevation
white bark pine ecosystem
Cost of QuickBird
data High +++
https://www.tandfonline.com/doi/full/10.1080/01431160802566
439
Immitzer and Atzberger
(2014)
University of Natural Re-sources and
Life Sciences, Vienna (BOKU)
Demonstra-tion
Local (Styria, Austria)
3 acquisitions (June, July,
October 2010)
WorldView-2
1.1 to 3.7 days
2m
Random Forest, lo-gistic re-
gression & VI
Field meas-urements for
creating refer-ence data
After ground true data ac-quisition and EO data avail-ability (after
damage)
CIR Orthophotos None Not likely
Assessing the suita-bility of 8-band
WorldView-2 satel-lite imagery for de-tecting bark beetle
infestations of “green attack” and
“dead” stages against healthy
trees.
Cost of WorldView-2 data
High +++
https://www.in-gentacon-
nect.com/con-tent/schweiz/pfg/2014/00002014/00000005/art
00005
Ismail et al. (2008)
University of KwaZulu-
Natal
Demonstra-tion
Local (Kwazulu-Natal, South Af-
rica)
1 acquisition (2006)
High reso-lution im-
age (LrEye)
-- 0.5m
NDVI & Gaussian maximum likelihood classifier
111 trees vis-ually assessed for S.noctilio
red stage of attack
After ground true acquisi-tion and EO
data availabil-ity (after damage)
Training signa-tures database
Spatial reso-lution: large
volume and cost of
data
Not likely
Analysis of the ef-fects of spatial res-olution on detect-
ing Sirex noctilio infes-
tation levels
Cost of sensors
High ++
https://www.tandfonline.com/doi/abs/10.1080/03736245.2008.9
725308
Kharuk et al. (2009)
V. N. Suka-chev Institute
of Forest
Demonstra-tion
Local (Siberian mountains)
6 years (1999-2004)
SPOT- VGT
10 days 1km
Maximum likelihood classifica-tion and
threshold utility
method
None
After data availability (after dam-
age)
DEM & Landsat to generate the training samples
SPOT-VGT should be
sensitive to the less defo-liated stand categories
Yes
Monitoring taiga landscapes vulner-able to Siberian silk
moth outbreaks
Cost of SPOT data
High ++
https://www.tandfonline.com/doi/full/10.1080/01431160802549
419
Latifi et al. (2014)
University of Würzburg
Demonstra-tion
Local (Bavarian Forest National Park, Germany)
10 acquisi-tions
SPOT 2 and 4,
Landsat 5 and 7
11 years (2001-2011)
20m and 30m
Random Forest clas-
sifier None
After data availability (after dam-
age)
CIR Orthopho-tos, geodata
Single in-fested trees or small in-festations
could not be identified
Yes
Spatial detection of European bark bee-
tle (Ips typogra-phus) damage
Cost of data, freely
available
No valida-tion
-- https://doi.org/
10.1007/s10661-013-3389-7
Lawrence and Labus (2003)
Montana State Univer-
sity
Demonstra-tion
Local (Lamar Valley of Yel-lowstone Na-
tional Park, Wy-oming, USA)
1 acquisition (August 4,
1999) Probe-1 -- 1m
Stepwise discriminant
analysis (DISCRIM)
and Regres-sion tree analysis (CART)
None After flight (after dam-
age)
Infrared aerial photos to select
sample trees
Dominant and subdom-
inant trees only
No
Assessing the capa-bility of hyperspec-tral imagery for dif-ferentiating Doug-
las-fir trees at-tacked by the
Douglas-fir beetle
Cost of data ac-quisition
Moderate ++ https://doi.org/10.1093/wjaf/18
.3.202

Monitoring Forests Through Remote Sensing Final Report
69
Reference
Status and name of en-
tity operating system
Current status Spatial Extent
Temporal Extent
Remote sensing
data sources
Temporal resolution
Spatial resolu-
tion Metrics
Types of required
in-situ data
Delivery timeliness Ancillary data Limitations Possible
scaling up Application use Product
dissemina-tion
Validation standards
Validation results Link doc
Leckie et al. (2004)
Canadian For-est Service
Demonstra-tion
Local (coastal British Colum-bia, Canada)
2 acquisitions (1995-1996)
CASI -- 0.06m
Maximum likelihood classifica-
tion
Crown condi-tions assessed in the ground survey of root disease symp-
toms
After ground true data ac-quisition and EO data avail-ability (after
damage)
None
Limited sam-ple from a
single study area
Yes
Analysis of the overall distribution
of root rot dam-aged trees
Cost of sensors
High ++
https://www.tandfonline.com/doi/full/10.1080/01431160310001
39926
Lehmann et al. (2015)
University of Münster
Demonstra-tion
Local (Germany) 1 year (2013)
High-reso-lution col-our infra-red (CIR)
-- 0.02m
Modified NDVI, OVIA & NN-algo-
rithm
Database of Agrilus Bigut-tatus infested and dead oaks
After data-base and EO
data availabil-ity (after damage)
None Limited spec-tral combina-
tion Yes
Forest stand obser-vation and pest in-festation monitor-
ing
Cost of sensor
High +++ https://www.md
pi.com/1999-4907/6/3/594
Lottering et al. (2018)
University of KwaZulu-Na-
tal
Demonstra-tion
Local (Sappi Hodgsons Estate in KwaZulu-Na-
tal, South Africa)
1 Acquisition
(September, 2012)
WorldView-2
1.1 to 3.7 days
0.5m
Artificial Neural Net-work (ANN), Band combi-
nations
Ground true data (col-lected be-
tween Sep-tember 24
and October 5, 2012)
After ground true data ac-quisition and EO data avail-ability (after
damage)
None None Not likely
Detecting and map-ping the severity
and extent of Gonipterus. scutel-latus weevil defoli-ation using texture parameters derived from satellite data
Cost of data
High +++
https://www.tandfonline.com/doi/full/10.1080/10106049.2016.1
250823
Marx (2010) -- Demonstra-
tion
Local (Thür-ingen,
Germany)
2 acquisitions (2009)
RapidEye From 1 day 6.5m
C5 classifier, Kolmogo-
rov-Smirnov Test & VI
Ground true data
After ground true data ac-quisition and EO data avail-
ability
Geodata, CIR or-thophotos, DEM
None Yes Distinguishing be-tween bark beetle infestation stages.
Cost of data
High +++
https://www.in-gentacon-
nect.com/con-tent/schweiz/pfg/2010/00002010/00000004/art
00003
Meddens et al. (2013)
University of Idaho
Demonstra-tion
Local (northcen-tral Colorado,
US)
16 years (1996-2011)
Landsat 16 days 30m
Maximum likelihood
classification & spectral
index thresholds
None
After data availability (after dam-
age)
2008 classified aerial image
Requires a classified im-
age or ground true and exten-sion of the study area
Yes Mapping bark
beetle-caused tree mortality
Freely available
High +++
https://www.sci-encedi-
rect.com/sci-ence/arti-
cle/pii/S0034425713000060
Meddens and Hicke (2014)
University of Idaho
Demonstra-tion
Local (Rocky Mountains, US)
16 years (1996-2011)
Landsat 16 days 30m
Multiple lin-ear regres-
sion models and general-ized additive
models
None
After data availability (after dam-
age)
2008 classified aerial image
Low tem-poral resolu-
tion and study area extension
Yes Predict percent red stage tree mortal-
ity
Freely available
High +++
https://www.sci-encedi-
rect.com/sci-ence/arti-
cle/pii/S037811271400139X
Meigs et al. (2011)
Oregon State University
Demonstra-tion
Local (Cascade Range, Oregon,
US)
24 years (1984-2007)
Landsat 16 days 30m LandTrendr
Tree mortal-ity, surface fuels and landcover
After ground true data ac-quisition and EO data avail-ability (after
damage)
Multiple decade aerial surveys of forested lands
No quantifi-cation of the variation and uncertainty associated
with the tra-jectories and
study area extension
Yes
Spectral trajecto-ries associated with
insect disturbance and re-
lated those spec-tral trajectories to
ground-based measurements of tree mortality and
surface fuels
Freely available
None ++
https://www.sci-encedi-
rect.com/sci-ence/arti-
cle/pii/S0034425711003361
Näsi et al. (2015)
Finnish Geo-spatial Re-
search Insti-tute
Demonstra-tion
Local (southern Finland)
1 acquisition (2013)
UAV (RGB & FPI)
-- 2.4cm
and 9cm k-NN classi-
fier
Tree-wise measure-
ments
After ground true data ac-quisition and
UAV data availability (after dam-
age)
DEM Study area extension
Yes Identification of in-dividual anomalous
trees
Cost of sensor
High +++
https://www.mdpi.com/2072-
4292/7/11/15467

Monitoring Forests Through Remote Sensing Final Report
70
Reference
Status and name of en-
tity operating system
Current status Spatial Extent
Temporal Extent
Remote sensing
data sources
Temporal resolution
Spatial resolu-
tion Metrics
Types of required
in-situ data
Delivery timeliness Ancillary data Limitations Possible
scaling up Application use Product
dissemina-tion
Validation standards
Validation results Link doc
Niemann et al. (2015)
University of Victoria
Demonstra-tion
Local (Central British Colum-bia, Canada)
2 acquisitions (2008 Septem-
ber, 2009 July)
VNIR-SWIR with SPECIM’s AISA Dual imaging spec-
trometer, LiDAR
-- 2m and 0.25m
ANOVA, Spectral An-gle Mapper classifier,
Continuum Removal analysis
Ground true data
After ground true data ac-quisition and EO data avail-ability (after flights and procession)
CHM,DSM, INS Small area Not likely
Assessing spectral properties of indi-
vidual trees in a monoculture pine forest infected by
mountain pine bee-tle (Dendrotonus
ponderosae)
Cost of sensor,
cost of Li-DAR data
acquisition
No valida-tion
--
https://www.tandfonline.com/doi/full/10.1080/07038992.2015.1
065707
Ortiz et al. (2013)
Forest Re-search Insti-
tute of Baden-Württemberg,
Freiburg
Demonstra-tion
Local () 2 acquisition s (May, 2009)
RapidEye and Ter-raSAR-X
-- 6.5m and
2m
Generalized Linear Model,
Maximum Entropy and
Random Forest
Ground true data
After ground true data ac-quisition and EO data avail-ability (after infestation)
LiDAR for DSM None Not likely Detecting bark
beetle green at-tack.
Cost of EO data
High +++ https://www.md
pi.com/2072-4292/5/4/1912
Oumar and Mutanga
(2014)
University of KwaZulu-Na-
tal
Demonstra-tion
Local (KwaZulu-Natal, South Af-
rica)
1 acquisition (2010)
WorldView-2
1.1 to 3.7 days
1.8m Vegetation
indices &PLS regression
Leaf sampling and T. pere-grinus dam-
age
After ground true data ac-quisition and EO data avail-ability (after
damage)
Environmental variables (cli-mate & topo-graphic data)
Number of test samples,
study area extension & number of
acquisitions
Yes
Predict and map the sever-ity of T. peregrinus damage in planta-
tion forests
Cost of WorldView-2 data
Moderate +
https://www.sci-encedi-
rect.com/sci-ence/arti-
cle/pii/S0924271613002323
Pu et al. (2008)
University of South Florida
Demonstra-tion
Local (Califor-nia)
1 acquisition (2002)
CASI-2 -- 2m
Principal component analysis & maximum likelihood classifier
Field surveys
After ground true data ac-quisition and EO data avail-ability (after
damage)
ADAR 5500 data
Error of first levels is
propagate to the lasts
(multi-level classification)
study area extension
Yes
Detecting mortality and vegetation
stress associated with a new forest
disease
Cost of CASI-2 data
High ++
https://www.in-gentacon-
nect.com/con-tent/asprs/pers/2008/00000074/00000001/art00
005
Skakun et al. (2003)
University of Calgary
Demonstra-tion
Local (Prince George Forest, British Colum-bia, Canada)
3 acquisition (1999, 2000,
2001) Landsat 16 days 30m
Tasselled Cap Trans-formation,
Discriminant classifica-tion, t-test and F-test
--
After data availability
(after infesta-tion)
Red-attack dam-age aerial survey
data, geodata
Depending on aerial sur-
vey data which can be
biased
No
Detecting red-at-tack damage
caused by moun-tain pine beetle
(Dentroctonus pon-derosa)
Freely available
High, how-ever based on aerial surveys
++
https://www.sci-encedi-
rect.com/sci-ence/arti-
cle/pii/S0034425703001123?via%
3Dihub
Sprintsin et al. (2011)
University of Toronto
Demonstra-tion
Local (Entiako Provincial Park, British Colum-bia, Canada)
1 acquisition (August 2,
1999) Landsat 16 days 30m
Own equa-tions Tem-perature Condition Index (TCI) and Mois-
ture Condi-tion Index
(MCI)
--
After data availability
(after infesta-tion)
Aerial survey records of areas of tree mortality, judged from red
and/or grey crowns
Depending on aerial sur-
vey data which can be
biased
No
Detecting mountain pine beetle green attack using TCI
and MCI for large area
Freely available
Moderate + https://doi.org/10.1117/1.3662
866
Stöver et al. (1996)
University of Trier
Demonstra-tion
Local (Bienwald, Upper Rhine Valley, Ger-
many)
3 acquisitions (1991 July, 1994 June, 1995 June)
Landsat 16 days
30m -- Field survey
After ground true data ac-quisition and EO data avail-ability (after
damage)
CIR orthophotos Requires cloudless
data No
Gypsy moth (Lymantria dispar) infestation damage
mapping, change detection, model-
ling spectral reflec-tance with FLIM,
PROSPECT and SAIL
Freely available
No valida-tion
--
https://www.ac-a-
demia.edu/download/7001340/atzberger_bien-
wald.pdf

Monitoring Forests Through Remote Sensing Final Report
71
Reference
Status and name of en-
tity operating system
Current status Spatial Extent
Temporal Extent
Remote sensing
data sources
Temporal resolution
Spatial resolu-
tion Metrics
Types of required
in-situ data
Delivery timeliness Ancillary data Limitations Possible
scaling up Application use Product
dissemina-tion
Validation standards
Validation results Link doc
Wulder et al. (2006)
Pacific For-estry Center,
Canada
Demonstra-tion
Local (Lolo Na-tional Forest,
Montana, USA)
2 acquisitions (1999 August, 2002 August)
Landsat 16 days 30m
Logistic Re-gression
Model, Solar Radiation, Enhanced Wetness
Difference Index
(EWDI), ele-vation, slope
Ground true data collected
annually (1999-2002)
After ground true data ac-quisition and EO data avail-ability (after
damage)
DEM
Complex combination
of various data
Yes
Detecting and mapping mountain pine beetle red-at-
tack infestation.
Freely available
Very high +++
https://www.sci-encedi-
rect.com/sci-ence/arti-
cle/pii/S0034425705004220?via%
3Dihub
Wulder et al. (2009)
Pacific For-estry Center
Canada Review Local (Canada) -- -- -- -- -- -- -- None None No
Assessing opera-tional viability of
the use of remotely sensed data for the detection and map-ping of the green-
attack stage of mountain pine bee-
tle infestation
-- No valida-
tion --
https://pubs.cif-ifc.org/doi/abs/10.5558/tfc85032
-1

Monitoring Forests Through Remote Sensing Final Report
2.4 Wildfires
Wildfires are amongst the most common and challenging disturbance factors in forest ecosystems. Due to the changing climate, wildfires are expected to become more frequent and intense in fire prone re-gions, but also in regions that were hitherto resistant to fires. Also, fire seasons will be longer (Moreno, 2014). On the one hand, fires are a natural process and play a beneficial role to many forest ecosystems. On the other hand, they can have devastating impact if they are too intense or break out in regions that don’t benefit from fires. Therefore, it is very important to prevent ignition and reduce the impact of wildfires.
An EO-based forest fire monitoring and management system should therefore distinguish between three stages: before the fire (pre-fire), during the fire (active) and after the fire (post-fire).
1. The pre-fire measurements consist of definition of fuel types and their condition. Fuel types are closely related to tree species and are influenced by climate, weather parameters such as wind speed, vegetation zones, topography and land management.
2. The active phase, is the time where the fire breaks out and spreads over the forest. Fire intensity and therefore fire emissions can be measured. This phase is influenced by the fuel type, topog-raphy and weather conditions.
3. The post-fire stage is when the fire has been extinguished. In this phase it is necessary to de-scribe what is left of the forest after the fire. In this phase, there are three possible measure-ments: the mapping of the burnt area, the assessment of fire severity, the monitoring of the recovery of the vegetation (Veraverbeke et al., 2018) and restoration measures (Almeida et al., 2019).
In all three stages, remote sensing can support wildfire management. Successful applications of remote sensing include fuel type mapping (Marino et al., 2016; Peterson et al., 2013) and fire risk assessment (Chuvieco et al., 2004; Gibson et al., 2020; Su et al., 2019; Yu et al., 2017) in the pre-fire stage. During the active phase, EO can contribute to fire detection (Giglio et al., 2003; Schroeder et al., 2014) and fire temperature retrieval (Dennison, 2006). In the post-fire stage, remotely sensed imagery is very useful to map burned areas (Barbosa et al., 1999; Giglio et al., 2009; Gitas et al., 2008; Pereira, 2003; Roy et al., 2005; Weirather et al., 2018), for fire severity assessment (Meng et al., 2017; Veraverbeke et al., 2017), vegetation recovery mapping (Lewis et al., 2017; Veraverbeke et al., 2012) and forest restoration (Almeida et al., 2019; Lewis et al., 2017; Liu et al., 2019; White et al., 2017). Up to date, most of the research has investigated the use of multispectral remote sensing imagery for these applications.
In the pre-fire phase, type and condition of fuels are mapped. Fuel is defined by a combination of pa-rameters such as vegetation species, form and size arrangement. Its condition is based on moisture content and the live or dead fuel status. Remotely sensed fuel-type mapping is mostly done by mapping plant functional types with the use of classification and vegetation index methods (Bartholomé and Bel-ward, 2005; Ryan and Opperman, 2013).. Also, mapping of fuel condition is based on calculation of spectral indices (Anderson et al., 2004), sometimes complemented by land surface temperature (Chu-vieco et al., 2003). Structural information by LiDAR can complement such assessments as it potentially provides information about understory structure and fire ladders. Topography parameters can be tested through reflectance and severity indices (Gibson et al., 2020).

Monitoring Forests Through Remote Sensing Final Report
73
Figure 15. Comparison of NIR (left) and SWIR (right) channels. Smoke has minor impact on the emitted radiance (Copernicus
Sentinel data).
Methods of remote sensing in the active fire phase are fire detection and the retrieval of fire tempera-ture. Most methods use brightness temperature under the assumption that fire is a blackbody emitter (Giglio et al., 2003; Schroeder et al., 2014). The short-wave infrared (SWIR) and mid-wave infrared (MIR) spectral regions are most useful for active fire detection because smoke has not much impact on emit-ted radiance in these regions (Figure 15).
Post-fire methods concentrate on burned area mapping and the assessment of fire severity. Also, veg-etation recovery is monitored and technical restoration such as reforestation, potentially over many years. In multispectral remote sensing, spectral indices are used for these purposes. The Normalized Burn Ratio (NBR) is most widely used and is calculated by combining NIR and SWIR reflectance. The differenced NBR (dNBR) is the result of differencing pre- and post-fire NBR images and is a good esti-mation for vegetation recovery, but the classical NDVI is also used (Katagis et al., 2014; Storey et al., 2016) (Figure 16).
Figure 16. Burnt area mapping result based on NBR (Source: Weirather et al., 2018)

Monitoring Forests Through Remote Sensing Final Report
74
The monitoring of restoration outcomes can be also supported by ground LiDAR as a proxy for airborne laser scanners in order to classify forest cover types, dry woody biomass and tree species (Almeida et al., 2019). Zhou et al. (2019) have shown that the integration of forest spatial structural information and spectral information derived from synthetic aperture radar and optical remote sensing can effectively measure restauration outcomes.
Although remote sensing can be successfully applied in every stage of the fire disturbance, only few operational applications exist. Most of them focus on the burned area mapping and describe the post-fire phase. The following section describes operational services in Europe, Canada and the U.S. which could be identified. Besides the European EFFIS, only few operational EO-based forest fire services could be found. However, many research projects are currently conducted to test different image processing approaches and resulting products.

Monitoring Forests Through Remote Sensing Final Report
75
2.4.1 Europe
Copernicus Emergency Management Service (EMS)
Country: Europe and beyond Year: since 2012 Type: operational
Platform/Sensor: Sentinel-2/-1, RapidEye and more Frequency: on demand
Coverage: Europe and beyond Open data / software: no Cost: free of charge
Webpage: https://emergency.copernicus.eu/mapping Contact:
The Copernicus Emergency Management Service (CEMS) has been operational since April 2012. The service provides EO-based information about global emergencies, such as natural disasters, technical accidents and humanitarian disasters. It primarily serves professional and authorised users who are ac-tive in the area of risk and natural disaster management. The CEMS has two service components:
• Rapid mapping, risk & recovery mapping and validation; • Early Warning and Monitoring for Floods (EFAS), Forest Fires (EFFIS) and Droughts (DO) (see
next section);
At the heart of CEMS rapid mapping is the timely provision of information generated from satellite im-agery and other reference data. Activation of the CEMS can only be done by authorized users. The gen-erated information includes digital maps, geodata and reports. The rapid mapping serves the support of emergency management activities immediately after or during a catastrophic event, such as wildfires. Risk and recovery mapping differ from rapid mapping. The data products are used to support risk man-agement activities that are not directly related to the management of an emergency. In particular, they should support prevention and reconstruction. The validation component is an independent quality as-surance task. Rapid mapping and risk and recovery mapping products are regularly checked by an inde-pendent expert team. Figure 17 shows a sample map produced by the CEMS for a forest fire in Italy.
Figure 17. CEMS map example of forest fire situation map (EMSR 171 - Nurri, Sardegna)

Monitoring Forests Through Remote Sensing Final Report
76
Copernicus European Forest Fire Information System (EFFIS)
Country: Europe Year: since 1998 Type: operational
Platform/Sensor: MODIS, VIIRS Frequency: daily
Coverage: Europe Open data / software: no Cost: free of charge
Webpage: https://emergency.copernicus.eu/ Contact:
The European Forest Fire Information System EFFIS is a component of the CEMS. A web portal provides near real-time and historical information about forest fires in Europe, the Middle East and Northern Africa. EFFIS includes the following modules:
• Fire danger assessment, • Rapid damage assessment, which includes
o Active fire detection o Fire severity assessment and o Land cover damage assessment
• Emissions assessment and smoke dispersion, • Potential soil loss assessment, and • Vegetation regeneration
The fire danger forecast provides daily maps of one to nine days lead time. It is based on numerical weather predictions obtained from ECMWF and Meteo France. The fire danger level is applying the Canadian Fire Weather Index (FWI) approach (Government of Canada, 2020). Fire danger is mapped in 6 classes (very low, low, medium, high, very high and extreme) with a spatial resolution of about 8 km (ECMWF) and 10 km (MeteoFrance).
Information about active fires is retrieved from MODIS and VIIRS satellites. The data is based on the measurement of thermal anomalies between a potential fire and the land cover surrounding the fire. If the temperature difference exceeds a certain threshold, a potential fire is confirmed as "hot spot" (Eu-ropean Commission, 2020).
Burned area maps for rapid damage assessments are also derived from MODIS imagery. Through a semi-automated processing chain, information about burned areas is provided and updated twice daily. Fires that are mapped by an unsupervised procedure are visually verified and corrected through visual inter-pretation of the MODIS images. The image resolution is 250 m, thus small fires can't be mapped pre-cisely. It is estimated that ca. 75 % - 80 % of the European fires are mapped through the service. Besides burned areas, the fire severity is estimated applying the difference Normalised Burnt Ratio (dNBR) (Eu-ropean Commission, 2018).

Monitoring Forests Through Remote Sensing Final Report
77
SILVISENSE / Norway
Country: Portugal/Norway Year: 2017 Type: operational
Platform/Sensor: Sentinel-2 Frequency: on demand
Coverage: in this example Por-tugal/Norway, but can be ap-plied globally
Open data / software: no Cost: customer can choose from a range of products available for subscription
Webpage: www.silvisense.com Science&Technology AS https://stcorp.no/
Contact:
Silvisense is a service offering information about forest disturbances related to pests, storms, fires and land use using EO imagery. Data from Sentinel-2 is automatically processed as soon as new images be-come available and provided through a dashboard to the users. A range of products is available through a subscription service. Through the regular monitoring the developers of the service estimate a 60 % reduction of reaction time to identify disturbance outbreaks. Silvisense is a commercial service offered through a Norwegian company.
RHETICUS WILDFIRE / Italy
Country: Italy Year: 2017 Type: operational
Platform/Sensor: Sentinel-2 Frequency: on demand, can be ac-tivated
Coverage: potentially global Open data / software: no Cost: n.a.
Webpage: https://www.rheticus.eu/rheticus-services/wildfires/ Planetek Italia www.planetek.it
Contact:
Rheticus Wildfire is a commercial service offered through an Italian service provider. It provides weekly information about burned areas and fire severity. On a yearly basis the vegetation recovery is moni-tored. Through a dashboard the clients get access to different maps and analytical products. Alterna-tively, PDF-reports can be provided through email. The data processing is based on Sentinel-2 imagery and additional open data and implemented in a cloud computing environment. Besides the dashboard the information can also be retrieved through an OGC-webservice.

Monitoring Forests Through Remote Sensing Final Report
78
National Observatory of Forest Fires / Greece
Country: Greece Year: 2017 (pre-operational: 2016)
Type: operational
Platform/Sensor: Sentinel-2 Frequency: every fire season since 2016
Coverage: Greece, national level
Open data / software: yes, as a QGIS-plugin
Cost: n.a.
Webpage:
http://epadap.web.auth.gr/?page_id=2175&lang=en NOFFi http://epadap.web.auth.gr/?lang=en
Contact:
The National Observatory of Forest Fires (NOFFI) is a research project aiming at developing a pilot op-eration of a forest fire observatory for Greece and the Balkan region. It provides three fire-related prod-ucts and services: a remote sensing-based fuel type mapping methodology, a semi-automatic burned area mapping service and a dynamically updatable fire danger index providing mid-term predictions. Input imagery is from Sentinel-2 and Landsat 8 for the fuel and burned area maps and Modis for the fire danger index.
Forest fire Yeste / Spain
Country: Spain Year: 2017 Type: operational
Platform/Sensor: Sentinel-2/-3, MODIS, Landsat-ETM+ Frequency: one time
Coverage: Albacete Open data / software: web application yes, algorithms no
Cost: n.a.
Methodology: The burnt area was extracted per day. It was also used information from the Coperni-cus Emergency Mapping Service and global wind data was collected on every day of the event from NOAA. A set of web mapping services were created to tell the story of the fire.
Webpage: http://projects.randbee.com/yeste_storytelling
Randbee Consultants www.randbee.com
Contact:
Randbee developed a storytelling tool to better explain the Yeste forest fire in the Castialla la Mancha / Spain. It combines data from Copernicus with meteorological data to analyse how the fire spread over time.

Monitoring Forests Through Remote Sensing Final Report
79
Italian National Fire and Rescue Service
Country: Italy Year: 2017 Type: operational
Platform/Sensor: Sentinel-2 Frequency: one time
Coverage: Campania Open data / software: no Cost: n.a.
Webpage: Italian National Fire and Rescue Service, Corpo Na-zionale dei Vigili del Fuoco
Contact:
The Italian National Fire and Rescue Service uses Sentinel-2 imagery to map forest fires in Campania region. Burned area maps are produced to monitor the emergency evolution. For statistical purposes information about the type of the affected vegetation and the extent of the fire event are assessed in order to improve the planning process for future forest fire fighting operations.
Wildfire management on the Croatian territory
Country: Croatia Year: 2017 Type: research
Platform/Sensor: Sentinel-2 Frequency: one time
Coverage: Croatia Open data / software: no Cost: n.a.
Webpage: Faculty of Geodesy, University of Zagreb Contact:
The University of Zagreb used data from EFFIS and imagery from Sentinel-2 to obtain the burned areas of a 2017 wildfire in the Makarska Riviera area. After locating the fire using EFFIS, before and after imagery were used for detailed analysis.

Monitoring Forests Through Remote Sensing Final Report
80
2.4.2 Canada
Canadian Wildland Fire Information System
Country: Canada Year: 1986 Type: operational
Platform: AVHRR, MODIS, VIIRS Frequency: annually
Coverage: Canada Open data / software: no Cost: data free of charge
Webpage: http://cwfis.cfs.nrcan.gc.ca/home Contact:
The Canadian Wildland Fire Information System is a service providing daily fire weather and fire behav-iour maps throughout the whole year and hot spot maps throughout the forest fire season (May – Sep-tember). It monitors fire danger conditions and fire occurrence across Canada. Fire weather and behav-iour maps are based on weather data. Satellite imagery is used to detect forest fires.
The information system includes a range of products:
• The Fire Weather Index (FWI) is based on daily observations of climatic parameters (tempera-ture, rain, wind, relative humidity). Moisture content of different fuel types are additional pa-rameters. The FWI consists of three indices: the Initial Spread Index is providing information about the expected rate of fire spread. It combines wind effects and the moisture data. The Build-up Index indicates the total amount of fuel available for combustion. The Fire Weather Index is a rating of the fire intensity. It combines the Initial Spread Index and the Build-up Index. It is suitable as a general index for fire danger throughout forested areas. The FWI is also applied in Europe and integrated in the EFFIS.
• The Fire Behaviour Prediction (FBP) System estimates the potential head fire spread rate at the front of the fire (meters per minute), total fuel consumption (predicted weight of fuel in kilo-grams per square meter), head fire intensity (predicted energy output in kilowatts per meter), crown fraction burned (predicted fraction of crowns consumed by the fire) and fire type (gen-eral description of fire: surface fire, crown fire, intermittent crown fire).
• The Fire Monitoring, Mapping and Modelling (Fire M3) is used for the detection of actively burning fires, for the estimation of burned areas and for the modelling of fire behaviour and biomass consumption from fires. Fire hotspots are obtained from AVHRR, MODIS and VIIRS im-agery.
FireWork
Country: Canada Year: Type: operational
Platform/Sensor: input data from Fire M3 (Canadian Wild Fire Information System)
Frequency: twice daily April to Oc-tober
Coverage: Canada Open data / software: no Cost: n.a.
Webpage: https://weather.gc.ca/firework/index_e.html Contact:
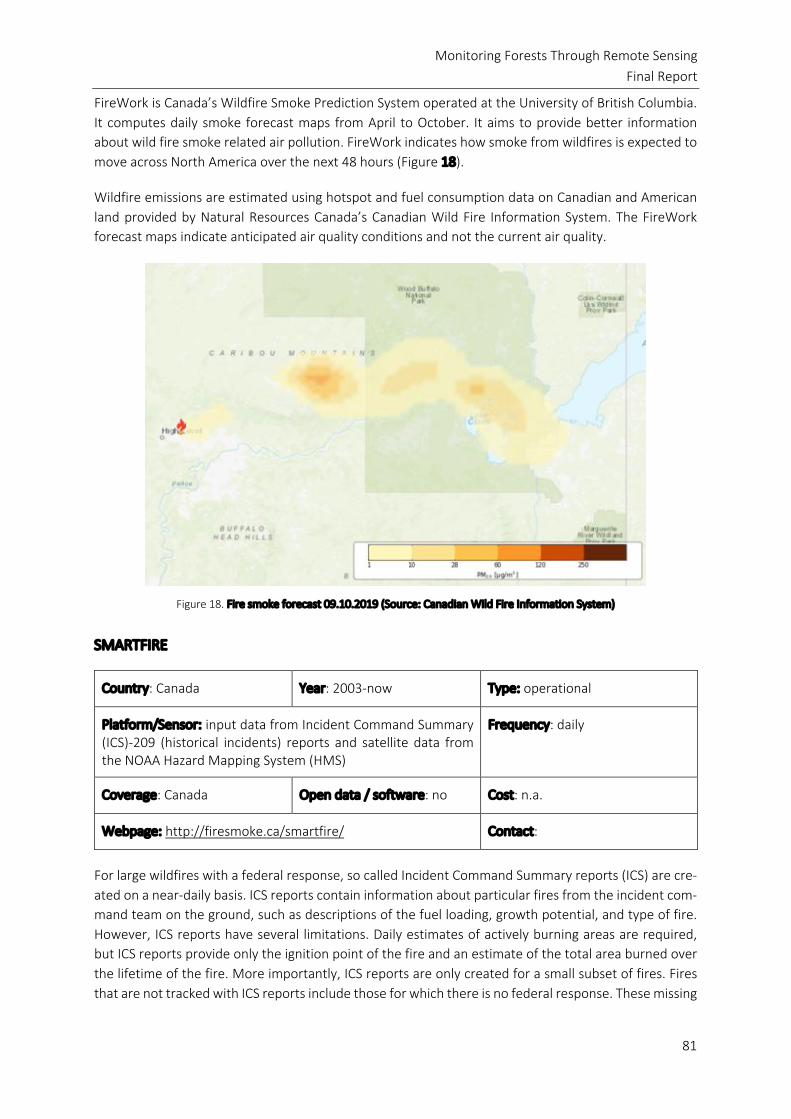
Monitoring Forests Through Remote Sensing Final Report
81
FireWork is Canada’s Wildfire Smoke Prediction System operated at the University of British Columbia. It computes daily smoke forecast maps from April to October. It aims to provide better information about wild fire smoke related air pollution. FireWork indicates how smoke from wildfires is expected to move across North America over the next 48 hours (Figure 18).
Wildfire emissions are estimated using hotspot and fuel consumption data on Canadian and American land provided by Natural Resources Canada’s Canadian Wild Fire Information System. The FireWork forecast maps indicate anticipated air quality conditions and not the current air quality.
Figure 18. Fire smoke forecast 09.10.2019 (Source: Canadian Wild Fire Information System)
SMARTFIRE
Country: Canada Year: 2003-now Type: operational
Platform/Sensor: input data from Incident Command Summary (ICS)-209 (historical incidents) reports and satellite data from the NOAA Hazard Mapping System (HMS)
Frequency: daily
Coverage: Canada Open data / software: no Cost: n.a.
Webpage: http://firesmoke.ca/smartfire/ Contact:
For large wildfires with a federal response, so called Incident Command Summary reports (ICS) are cre-ated on a near-daily basis. ICS reports contain information about particular fires from the incident com-mand team on the ground, such as descriptions of the fuel loading, growth potential, and type of fire. However, ICS reports have several limitations. Daily estimates of actively burning areas are required, but ICS reports provide only the ignition point of the fire and an estimate of the total area burned over the lifetime of the fire. More importantly, ICS reports are only created for a small subset of fires. Fires that are not tracked with ICS reports include those for which there is no federal response. These missing

Monitoring Forests Through Remote Sensing Final Report
82
fires represent a large fraction of the total area burned and resulting smoke emissions. Near real-time fire information is also available from satellite-derived measurements providing many advantages over ground-based reporting systems, including daily or better temporal resolution and the ability to detect relatively small fires. However, satellite-derived fire observations are limited by false positive detections and interference from clouds. The Satellite Mapping Automated Reanalysis Tool for Fire Incident Rec-onciliation (SMARTFIRE) combines both sources of fire information and merges them into a unified GIS database: satellite-derived information and ground based reports. SMARTFIRE was developed by the USDA Forest Service AirFire Team and Sonoma Technology, Inc. under a grant from NASA. The system has been running in an experimental operational configuration since late 2007.
Monitoring Forests Through Remote Sensing Final Report
83
2.4.3 United States
Active Fire Mapping Program
Country: U.S. Year: Type: operational
Platform/Sensor: MODIS Frequency: after a fire
Coverage: U.S. Open data / software: no Cost: n.a.
Webpage: https://fsapps.nwcg.gov/afm/ Contact:
The Active Fire Mapping Program is an operational, satellite-based fire detection and monitoring pro-gram managed by the USDA Forest Service Geospatial Technology and Applications Center (RSAC). The Active Fire Mapping program provides near real-time detection and characterization of wildland fire conditions in a geospatial context for the continental United States, Alaska, Hawaii and Canada. Detect-able fire activity across all administrative ownerships in the United States and Canada are mapped and characterized by the program.
MODIS data is currently the primary remote sensing data source of the program. Due to multiple daily observations of the United States and Canada MODIS data are ideal for continuous operational moni-toring and characterization of wildland fire activity. The created products provide an accurate and cur-rent assessment of current fire activity, fire intensity, burned area extent and smoke conditions through-out the U.S. and Canada. Products provided by the program include fire mapping and visualization prod-ucts, fire detection GIS datasets and live data services, multi-spectral image subsets, and analytical prod-ucts/summaries. Large incident map products are updated daily.
Burned Area Emergency Response (BAER)
Country: U.S. Year: Type: operational
Platform/Sensor: n.a. Frequency: after a fire
Coverage: U.S. Open data / software: no Cost: n.a.
Webpage: https://fsapps.nwcg.gov/baer/ Contact:
The Burned Area Emergency Response (BAER) program assesses damage to both infrastructure and the environment. BAER teams, assisted by burn severity datasets, identify areas where ecosystems such as clean water supplies might be threatened through wildfire impacts and prescribe treatments to ensure that large volumes of soil and debris do not contaminate the water supply. One of the team's first tasks in the field is to create a soil burn severity map. Input is a Burned Area Reflectance Classification (BARC), a satellite-derived layer of post-fire vegetation condition consisting of four classes: high, moderate, low and unburned. BARC is a satellite-derived data layer of post-fire vegetation condition derived from the Differenced Normalized Burn Ratio (dNBR)(Figure 19). BAER Imagery Support utilizes freely available satellite images such as those acquired through the Landsat and Sentinel missions.

Monitoring Forests Through Remote Sensing Final Report
84
Figure 19. Preliminary BAER date for the Horsefly fire (08/05/2019) in Helena National Forest, Montana, USA; left: post-fire image, right: Validated soil burn severity classification (Source: Burned Area Emergency Response program)
Monitoring Trends in Burn Severity (MTBS)
Country: U.S. Year: 2005-now Type: operational
Platform/Sensor: Landsat Frequency: after a fire
Coverage: U.S., Alaska, Hawaii, Puerto Rico
Open data / software: burned areas can be downloaded
Cost: n.a.
Webpage: https://www.mtbs.gov/ Contact:
Monitoring Trends in Burn Severity (MTBS) is an interagency program whose goal is to consistently map the burn severity and extent of large fires across all lands of the United States from 1984 to present. This includes all fires 400 ha (1000 acres) or greater in the western United States and 200 ha or greater in the eastern Unites States. The extent of coverage includes the continental U.S., Alaska, Hawaii and Puerto Rico. The program is conducted by the U.S. Geological Survey Center for Earth Resources Obser-vation and Science (EROS) and the USDA Forest Service Geospatial Technology and Applications Center (GTAC) and provides data to a wide range of users such as national policy-makers and others who are focused on implementing and monitoring national fire management strategies, field management units like national forests and parks and other federal land cover mapping programs. MTBS data are gener-ated by using data from Landsat which allows consistency of the data products over a long time period. Goal is to consistently map burn severity and extent of large fires. A semi-automated approach is fol-lowed using expert knowledge together with dNBR maps to calculate the burned area and the burn severity product.
Rapid Assessment of Vegetation Condition after Wildfire (RAVG)
Country: U.S. Year: 2007-now Type: operational
Platform/Sensor: Landsat Frequency: after a fire
Coverage: U.S., Alaska, Hawaii, Puerto Rico
Open data / software: burned areas can be downloaded
Cost: n.a.
Webpage: https://fsapps.nwcg.gov/ravg/ Contact:

Monitoring Forests Through Remote Sensing Final Report
85
The RAVG program is managed by the USDA Forest Service Geospatial Technology and Applications Center (GTAC) and provides a rapid initial assessment of post-fire vegetation condition following large wildfires on National Forests.
The process was first implemented in California followed by a nationwide implementation in 2007. RAVG products are made available within 45 days after fire containment. RAVG products are generated using a two-date change detection process and regression equations that relate imagery-derived burn severity indices to field-based burn severity measures. Pre- and post-fire images are used to derive the Relative Differenced Normalized Burn Ratio (RdNBR), which is sensitive to vegetation mortality resulting from the wildfire event. Regression equations are used to determine burn severity measures from RdNBR. The RAVG program relies primarily on Landsat imagery.
RAVG is the third US post-fire programs. The others are the Burned Area Emergency Response (BAER) Imagery Support program and the Monitoring Trends in Burn Severity (MTBS) program. Although the three programs have many similarities, they differ in their methods and protocols, as well as in their intended audiences.
LANDFIRE
Country: U.S. Year: 2002-now Type: operational
Platform/Sensor: Landsat Frequency: continuous
Coverage: U.S. Open data / software: 20+ na-tional geo-spatial layers (e.g. vegetation, fuel, disturbance, etc.), databases, and ecologi-cal models
Cost: n.a.
Webpage: https://www.landfire.gov Contact:
LANDFIRE (LF), Landscape Fire and Resource Management Planning Tools, is a shared program between the wildland fire management programs of the U.S. Department of Agriculture Forest Service and U.S. Department of the Interior, providing consistent, geospatial data across the United States to support cross-boundary planning, management, and operations. LF data characterize the current states of veg-etation, fuels, fire regimes, and disturbances. Additional products include reference data, land manage-ment activities databases, and ecological models.

Monitoring Forests Through Remote Sensing Final Report
86
2.4.4 Conclusions Wildfires
From the above reviewed literature and the studied fire monitoring systems a number of findings can be derived:
• A number of operational European and international fire monitoring systems exist, tailored to specific needs and/or covering specific areas. In addition, several national systems exist, as well as pre-operational systems.
• In all systems, EO data plays an important role with respect to (i) fire fuel characterisation, (ii) the detection of active fires, and (iii) post-fire recovery monitoring. Most systems also include a fire prediction component.
• Most systems are built around optical imagery, with thermal imagery and MIR/SWIR prevailing for active forest fire detection. Landsat and Sentinel-2 data are important components of many systems thanks to their higher spatial resolution compared to MODIS type of sensors. Weather data are important for assessing fire risk and potential spread.
• A better characterisation of the ignition risk and fuel conditions would add value to existing systems. In particular, Sentinel-2 data can potentially contribute a wealth of valuable infor-mation as it permits to identify tree species (groups) particularly prone to fire risk as well as information about (leaf) water status.
• Sentinel-3 can potentially complement MODIS imagery to detect active forest fires and for as-sessment of drought conditions.
• The value of active microwave sensors (e.g. Sentinel-1) for assessment of fuel moisture condi-tions needs further studies. Soil moisture information from passive microwave sensors is prob-ably far too coarse to provide actionable information.
• Forest fire monitoring systems should be closely integrated with drought monitoring systems (as a precursor) and systems for mapping and monitoring diseases – as diseases often follow forest fires.

Monitoring Forests Through Remote Sensing Final Report
87
2.5 Storm damages
In comparison to other forest disturbances, the field of research in the area of windfall induced forest damage is rather small (Baumann, 2013; King et al., 2005). Even fewer are operational services in that field. According to Baumann et al. (2013), most of these studies can be divided into two groups. One group investigates the impacts of tropical storms on forest structure with multispectral or radar data (Cheung et al., 2013; Ramsey et al., 2009; Wang and Xu, 2010). The other group focuses on severe storms (including tornados) and their damage to continental land (smaller areas but higher inten-sity)(Rich et al., 2010; Wolter et al., 2012).
In general, pixel-based approaches based on medium-spatial resolution sensors such as Landsat or MODIS have been used to calculate vegetation indices such as the NDVI to extract the affected area (Chehata et al., 2014). However, there is some research going on focusing on object-based approaches using high- and very-high-resolution imagery. The results of these studies show good results in deter-mining the affected area (Chehata et al., 2014; Einzmann et al., 2017; Elatawneh et al., 2014).
Remote sensing is sometimes used as an additive resource in post-storm assessment, but mostly just once and not in an operational way. Lower Saxony in Germany used remote sensing to assess storm damages after storm Friederike in the beginning of 2018. The objective was to derive information about larger affected areas within 5 – 7 days after the event for a preliminary assessment of the storm dam-ages. Beside the activation of the Copernicus EMS, the affected areas were delineated with Sentinel-1 data and Sentinel-2 data. In addition, aerial images were taken. Data from the aerial images were taken as a reference for the other methods. The CEMS delineated the affected areas by means of manual interpretation, the results were not satisfactory. The Sentinel-1 images were not usable because of snow in the tree crowns and on the ground. Sentinel-2 data was evaluated using multiple change de-tection algorithms (NDVI, brightness difference, change vector) and delivered better results. However, the best results were derived from the aerial images (Ackermann, 2018).
In Baden-Württemberg, Germany, storm hazard maps were generated for the whole state. Sentinel-2 data was used to classify tree species based on a maximum-likelihood classifier (Albrecht and Alme-hasneh, 2018).
As part of a research project FastResponse the Bavarian Agency for Forestry developed a concept for an operational forest emergency management system. The objective was to assess the usability of sat-ellite EO imagery to rapidly provide information and a situational overview about the storm extent (Seitz and Straub, 2017). Limited information flow about the occurred damages and their locations is still a major reason for large economic damages. Usually, damage assessments are only available several weeks after an event occurred. A timely assessment of forest damages is needed to plan the right re-sponse activities. The FastResponse processing chain includes a storm early warning system based on meteorological data and a change detection to investigate the affected forest areas. The results are visualized in a GIS environment. Additional information about tree species, the accessibility of the af-fected areas as well as ownership data enriches the damage assessment. The change detection deliv-ered different results depending on the used sensors and test areas. Storm damages detected using optical imagery showed better results (90 % overall accuracy) over SAR imagery.

Monitoring Forests Through Remote Sensing Final Report
88
From the above reviewed literature, a number of findings can be derived:
• No operational system to monitor and/or predict storm damages at fine spatial resolution in European forests exists, despite the fact that damages from windfall can have important eco-logical and economic consequences.
• To assess areas affected by storm a number of EO datasets can provide valuable contributions. The main limitation is mainly to detect smaller-scale windthrows and rolled lumber.
• An efficient monitoring system should not only focus on the mapping activity itself but also optimize the entire value chain and involved stakeholders.

Monitoring Forests Through Remote Sensing Final Report
89
2.6 Forest drought and water content monitoring:
After visual screening 86 research studies, two literature reviews and few studies using remote sensing to visualize forest disturbance were found focusing on drought/water content in the context of forest disturbance. The two review studies focused on drought impacts (Asner and Alencar, 2010) and drought effects in forests ecosystems (Deshayes et al., 2006) from a remote sensing perspective. However, both papers are almost 10 years old and should therefore be updated.
Most of the research studies used either spectrometer data, multi-spectral satellite imagery or a com-bination of LiDAR/satellite or climate/satellite data. The main problems related to the review task were:
• many studies were focused on vegetation and did not specifically distinguish forests from other vegetation types, and
• studies that aimed at predicting canopy water content were conducted during a specific period, without analysing the resulting disturbances.
Nevertheless, the study identified major contributions that allow to highlight the various approaches and datasets available to study drought effects on forests.
2.6.1 Regional coverage
Relevant literature attempting to study the impact of droughts on forests and/or vegetation covered almost all forested parts of the Earth. Not surprisingly, many studies focused on Amazonia as a large and also critical and vulnerable forest area. As a result of the huge area occupied by the Amazonian forests, satellite data are also key to obtain reliable assessments of drought and other perturbations in this region. Nevertheless, Amazonia is not the only area where the impacts of droughts on forests were studied. For instance, important studies have been published for Europe (Gobron et al., 2005) or re-gional areas like the Mediterranean region (Lobo and Maisongrande, 2006). In addition, there are stud-ies in local regions like South Tyrol (Lewińska et al., 2016) where the Alpine forest drought was moni-tored.
2.6.2 Quantification of drought effects in forests using vegetation indices and coarse resolution data
A large number of studies used the most common and well-known remote sensing product to detect and quantify vegetation to assess drought effects: NDVI. The NDVI provides a measurement of the quan-tity and the temporal development of vegetation, including forests (Atzberger and Eilers, 2011a). An-derson et al., (2010) used NDVI as well as Enhanced Vegetation Index (EVI) to explore the relationships between vegetation indices and drought and their respective deterioration due to atmospheric effects. MODIS data from 2000 to 2006 were used to assess the impact of droughts in Amazonia in 2005. Addi-tionally, the relationship between vegetation indices and tree mortality were evaluated using Pearson correlation. This analysis revealed that higher absolute mortality rates in 2005 tend to have positive EVI anomalies.
However, multispectral data from optical sensors are not the only type of remote sensing data used to study the impact of droughts. Microwaves satellite sensors were used to measure precipitation and canopy water content and thereby to quantify the relative severity of recent droughts and potential
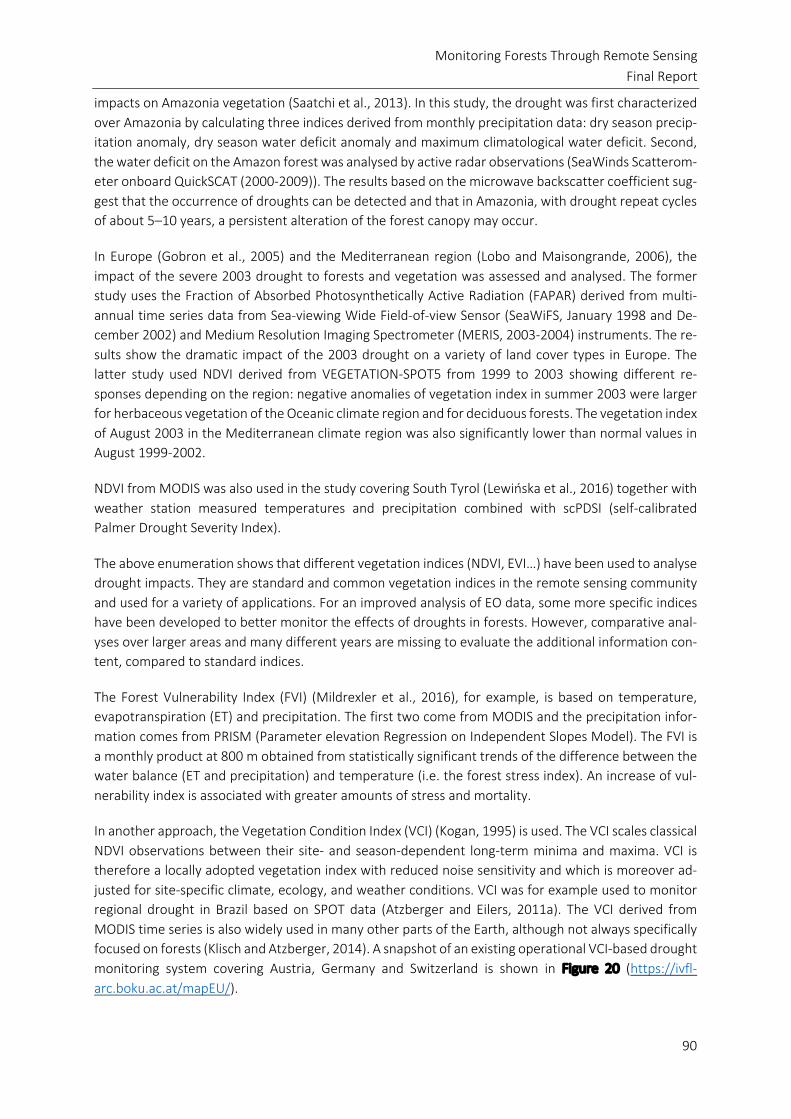
Monitoring Forests Through Remote Sensing Final Report
90
impacts on Amazonia vegetation (Saatchi et al., 2013). In this study, the drought was first characterized over Amazonia by calculating three indices derived from monthly precipitation data: dry season precip-itation anomaly, dry season water deficit anomaly and maximum climatological water deficit. Second, the water deficit on the Amazon forest was analysed by active radar observations (SeaWinds Scatterom-eter onboard QuickSCAT (2000-2009)). The results based on the microwave backscatter coefficient sug-gest that the occurrence of droughts can be detected and that in Amazonia, with drought repeat cycles of about 5–10 years, a persistent alteration of the forest canopy may occur.
In Europe (Gobron et al., 2005) and the Mediterranean region (Lobo and Maisongrande, 2006), the impact of the severe 2003 drought to forests and vegetation was assessed and analysed. The former study uses the Fraction of Absorbed Photosynthetically Active Radiation (FAPAR) derived from multi-annual time series data from Sea-viewing Wide Field-of-view Sensor (SeaWiFS, January 1998 and De-cember 2002) and Medium Resolution Imaging Spectrometer (MERIS, 2003-2004) instruments. The re-sults show the dramatic impact of the 2003 drought on a variety of land cover types in Europe. The latter study used NDVI derived from VEGETATION-SPOT5 from 1999 to 2003 showing different re-sponses depending on the region: negative anomalies of vegetation index in summer 2003 were larger for herbaceous vegetation of the Oceanic climate region and for deciduous forests. The vegetation index of August 2003 in the Mediterranean climate region was also significantly lower than normal values in August 1999-2002.
NDVI from MODIS was also used in the study covering South Tyrol (Lewińska et al., 2016) together with weather station measured temperatures and precipitation combined with scPDSI (self-calibrated Palmer Drought Severity Index).
The above enumeration shows that different vegetation indices (NDVI, EVI…) have been used to analyse drought impacts. They are standard and common vegetation indices in the remote sensing community and used for a variety of applications. For an improved analysis of EO data, some more specific indices have been developed to better monitor the effects of droughts in forests. However, comparative anal-yses over larger areas and many different years are missing to evaluate the additional information con-tent, compared to standard indices.
The Forest Vulnerability Index (FVI) (Mildrexler et al., 2016), for example, is based on temperature, evapotranspiration (ET) and precipitation. The first two come from MODIS and the precipitation infor-mation comes from PRISM (Parameter elevation Regression on Independent Slopes Model). The FVI is a monthly product at 800 m obtained from statistically significant trends of the difference between the water balance (ET and precipitation) and temperature (i.e. the forest stress index). An increase of vul-nerability index is associated with greater amounts of stress and mortality.
In another approach, the Vegetation Condition Index (VCI) (Kogan, 1995) is used. The VCI scales classical NDVI observations between their site- and season-dependent long-term minima and maxima. VCI is therefore a locally adopted vegetation index with reduced noise sensitivity and which is moreover ad-justed for site-specific climate, ecology, and weather conditions. VCI was for example used to monitor regional drought in Brazil based on SPOT data (Atzberger and Eilers, 2011a). The VCI derived from MODIS time series is also widely used in many other parts of the Earth, although not always specifically focused on forests (Klisch and Atzberger, 2014). A snapshot of an existing operational VCI-based drought monitoring system covering Austria, Germany and Switzerland is shown in Figure 20 (https://ivfl-arc.boku.ac.at/mapEU/).

Monitoring Forests Through Remote Sensing Final Report
91
Figure 20. Operational drought monitoring system based on MODIS NDVI time series operated by BOKU and covering Aus-tria, Germany and Switzerland. The VIC data is updated at weekly intervals and aggregated at administrative level. Differ-ent land cover types can be selected, including deciduous forests and conifers (map on the right). The temporal evolution
of the drought indicator is shown as a matrix (bottom left) as well as with respect to historical minimum and maximum (top left) (Source: BOKU Geomatics).
2.6.3 Portability and robustness of indices
Contrary to what one would expect, the same index derived from imagery of different sensors can yield contrasting information. This was for example highlighted in the study of Atzberger et al. (2014) cover-ing a 40° x 40° window over Europe. In this study, the same index (NDVI) - but from two sensors (MODIS and AVHRR) - was used to assess climate-related changes in vegetation phenology in the period 2002-2011. Interestingly, only a moderately good agreement of NDVI values was found. Particularly large differences occurred during winter. Large discrepancies were also observed for phenological metrics, in particular the start of season, whereas information regarding the maximum of season was more con-sistent.
For more advanced biophysical variables such as fAPAR, the employed retrieval algorithm/pre-pro-cessing also matters, even if data is from the same sensor and satellite. In the paper of Meroni et al., (2013), for example, three multitemporal fAPAR data sets derived from the SPOT-VEGETATION instru-ment were analysed and compared. The comparative analysis was conducted for the years 2003 and 2004 over three 10° x 10° regions with different eco-climatic characteristics: Niger, Brazil, and France. The study revealed that fAPAR estimates from one specific processing chain were sometimes systemat-ically higher/lower compared to other fAPAR products. The spatial analysis moreover showed only mod-erate to high agreement between data sets. The temporal agreement showed spatial (and land cover-related) variability spanning from very low to almost perfect. Large differences were observed in regions and periods with large cloud occurrence. These findings are significant as any detected (drought-re-lated) disturbance has apparently a sensor and algorithmic component. The sensor related component can be understood as being the direct result of (small) changes in band setting and differences in foot-print size and location. The algorithmic component for more elaborated indices such as FAPAR, is most probably related to differences in the formulation and parameterisation of the inverse problem. Hence, care should be taken if data from different sensors or processing pipelines are to be combined to quan-tify forest disturbances.

Monitoring Forests Through Remote Sensing Final Report
92
2.6.4 Use of high-resolution sensors & quantification of leaf water content
It is obvious that satellite sensors with coarse spatial resolution mix different land cover classes and cannot unravel fine scale effects for example related to microclimate and/or differences in water avail-ability and/or soil quality. Thus, high spatial resolution sensors are probably better for focusing on trees and forests. Volcani et al. (2005) for example, used Landsat-TM and ETM+ (30-meter spatial resolution) to detect and assess seasonal/phenological changes and inter-annual changes in forest trees with re-spect to the drought effect by means of NDVI differences at different dates. The work shows that drought years seriously affect the amount of water available for the trees, manifested by reduced NDVI values. Specifically, the trees in Yatir forest (Israel) showed significant stress signs during drought years.
Using high resolution data, a direct quantification of leaf/needle water content is also possible, thereby getting a more direct access to the plants’ water status (Mirzaie et al., 2014; Zhu et al., 2019). Besides the analysis of reflectance spectra, it is moreover possible to retrieve the canopy water content by means of thermal measurements (Neinavaz et al., 2019). None of these approaches is operational.
2.6.5 Sensor fusion
The analysis of the impact of drought or water content on forests is not necessarily restricted to satellite data or data from a single platform. A combination of different types of data has the potential to further improve results as in the case of a mixed temperate forest where satellite data was combined with LiDAR data as well as plant functional traits derived from radiative transfer models (Shi et al., 2018). The results obtained for a natural forest in Germany show that equivalent water thickness can be estimated through inversion of a radiative transfer model from LiDAR and hyperspectral data. Zhu et al. (2019) derived a three-dimensional map of 2013 for forests in Germany combining airborne hyperspectral and LiDAR data. The model was validated in 26 forest plots providing a normalized root mean square error (nRMSE) equal to 13% in the retrieved leaf water content.
Other studies confirmed that the combination of LiDAR and satellite data is very useful to understand the forest canopy physiological responses to progressive drought. For instance, Asner et al. (2016) pre-sented a combination of laser-guided spectroscopy and satellite-based models to assess losses in can-opy water content (CWC) in California forests between 2011 and 2015. Four years of high-resolution forest CWC maps were generated by his group. Results show that severe canopy water losses of greater than 30% occurred over 1 million ha.
Martin et al. (2018) used field and airborne remote sensing measurements (airborne high-fidelity imag-ing spectroscopy (HiFIS) and LiDAR) taken in 2015 and 2016 to analyse biological responses of giant sequoias to dryness. A step-wise linear regression was used to determine the primary relationships among the canopy variables. The results suggest that remotely sensed canopy water content is a useful measure of water stress in giant sequoia, and valuable for assessing and managing forests affected by droughts. Neither LiDAR data nor suitable imaging spectrometers are available at continental scale.

Monitoring Forests Through Remote Sensing Final Report
93
2.6.6 Machine learning, up-scaling and validation/visualization
To understand the impacts of droughts on forests, most of the above papers employed methodologies based on (1) correlations between vegetation indices and plant traits, (2) the use of linear (or polygonal) regressions involving the original spectral bands, or (3) the use of radiative transfer models. In addition, machine learning and cloud computing have already made contributions in this field.
For instance, Gopal und Woodcock (1996) studied conifer mortality due to a prolonged drought using Artificial Neural Networks with Landsat-TM bands. High resolution global maps of canopy water content (Campos-Taberner et al., 2018), forest cover change (Hansen et al., 2013) or global terrestrial net pri-mary production (Zhao and Running, 2010) were also generated using cloud-based solutions. These studies demonstrate that it is possible to scale up drought impact studies of forests from local/regional level to global level.
Remote sensing data were also used to validate field measurements or to visualize the impacts of droughts on forests. For instance, Anderegg et al. (2015) validated the regional patters of tree mortality predicted using field measurements of branch hydraulic conductivity by means of Landsat data. The prediction achieved around 75% of accuracy between in field plots and mortality maps derived from Landsat imagery. On the other hand, Cohen et al. (2016) developed a visualization tool based on Land-sat. In another study, Bell et al. (2018) presented a visualization tool (TimeSync) and a hierarchical Bayesian time series modelling that was applied to five different forest types.
2.6.1 Conclusions and Summary Table Forest drought
From the above reviewed literature, a number of findings can be derived:
• At European level, no operational system to monitor and/or predict drought related disturb-ances in forests exists, despite the fact that EO-based drought management systems are heavily used in many parts of the world and despite the fact that such a drought monitoring system would be an important (input) component for both forest fire and pest/disease systems.
• EO data from MODIS, and in particular the use of the Vegetation Condition Index (VCI), can well detect drought severity and the spatial extent of droughts in near-real-time, as demonstrated in several non-forest specific applications. The contribution from microwave sensors are less clear.
• As droughts are mostly meso-scale events with slow onset covering larger areas, it is currently unclear if a higher spatial resolution would really add additional information. However, a better description of the forest types per raster cell would certainly benefit such a system.
• For any operational drought monitoring system, the near-real-time capacity is of utmost im-portance. This requires well adopted pre-processing chains to remove negative impacts of un-detected clouds and poor atmospheric conditions.

Monitoring Forests Through Remote Sensing Final Report
94
Table 7. Summary table listing drought studies or products using remote sensing
Reference
Status and name of en-
tity operating system
Current status
Spatial Extent
Temporal Extent
Remote sensing
data sources
Temporal resolution
Spatial res-olution Metrics
Types of re-quired
in-situ data
Delivery timeliness
Ancillary data Limitations
Possible scaling
up Application use Product dis-
semination Validation standards
Valida-tion
results Link doc
Anderegg et al. (2015)
Princeton University
Demon-stration
Local (San Juan Na-tional Forest,
Colorado, USA)
13 years (2000-2013)
Landsat TM 16 days 30m
Start, end, peak time of
growing season
branch hydrau-lic conductivity
After mor-tality ob-
servations and data availabil-
ity
Accumulated Cli-matic Water Deficit
Requires ground data & ancillary data, remote sens-ing is used to validate the
model
Yes Assess the
causes of tree mortality
Freely avail-able High ++
https://www.na-ture.com/arti-cles/ngeo2400
Anderson et al. (2010)
Oxford Uni-versity
Demon-stration
Local (Amazon)
6 years (2000-2006)
MODIS 16 days 1km Vegetation Index (NDVI)
long-term for-est
inventory plots
After mor-tality ob-
servations and data availabil-
ity
Weather data: Rainfall data and
solar radiation data & aerosol optical
depth Evergreen forest
limits
Requires ground obser-
vations Yes
Assess the im-pact of the
drought
Freely avail-able
None 0
https://nph.onlineli-
brary.wiley.com/doi/full/10.1111/j.1
469-8137.2010.03355.
x
Asner et al. (2004)
Carnegie Insti-tution of
Washington
Opera-tional
Local (Amazon)
4 months (July November
2001)
space-borne
imaging spectros-
copy
4 months 30m NDVI, simple ratio band, fAPAR, PRI,
ARI and SWAM
Volumetric soil water content,
midday leaf water poten-
tial (LWP), and LAI and soil
water.
After the field work and data availabil-
ity
Land cover, envi-ronmental zones
map
The method requires 1-yr intercalibra-tion period & several in-situ
data
Not likely
quantify differ-ences in canopy water and NNP resulting from drought stress
Cost of sen-sors None 0
https://www.pnas.org/con-
tent/101/16/6039
Asner et al. (2016)
Carnegie Insti-tution of
Washington
Opera-tional
Regional (California, US)
3 years (2012-2015)
Landsat, HiFIS and
LiDAR
16 days/ 2m/1m 30m
A multi-layer neu-ral network, was
used to model CWC maps
stem densities
After the field work and data availabil-
ity
Tree density map, forest mask,
Requires ancil-lary data and spectrometer
and LIDAR data
Yes Assess losses in canopy water
content
Cost of sen-sors High ++
https://www.pnas.org/con-
tent/113/2/E249
Lewińska et al. (2016)
Graz Tech-nical Univer-
sity
Demon-stration
Local (South Tirol,
Austria)
11 years (2001-2012)
MODIS 8 days 500m
NDVI and Nor-malized differ-
ence Infrared In-dex
None After data availabil-
ity
Meteorological data (temperatures and precipitation)
and scPDSI (self-cal-ibrated Palmer
Drought Severity Index))
Pixel analysis Not likely
Bridge the gap understanding drought impact
on forest ecosys-tems
Freely avail-able
None ++ https://www.mdp
i.com/2072-4292/8/8/639
Gobron et al. (2005)
EC Joint Re-search Centre
Opera-tional
Continent (Europa)
5 years (1998-2002)
SeaWiFS & MERIS
300m & 1.1km FAPAR None
After data availabil-
ity None
Spatial resolu-tion and the
analysis is done only for 1
year (2003)
Yes
Characterize the spatio-temporal patterns in the observable re-
sponse of terres-trial
vegetation to the drought
stress on a conti-nental scale
Freely avail-able None ++
https://www.tandfonline.com/doi/abs/10.1080/0143116041233133029
3?jour-nalCode=tres20
Gopal und Woodcock
(1996)
Boston Uni-versity
Demon-stration
Local (Lake Tahoe
Basin, Califor-nia, US)
2 years (1988 & 1991) Landsat 16 days 30m Artificial Neural
Networks Total conifer
mortality After the field work
Forest stand struc-ture and GIS
Temporal data availability,
need for inde-pendent
ground valida-tion and the use of multi-
spectral bands of Landsat
Yes Estimates coni-
fer mortality
Freely avail-able None ++
https://ieeex-plore.ieee.org/ab-
stract/docu-ment/485117
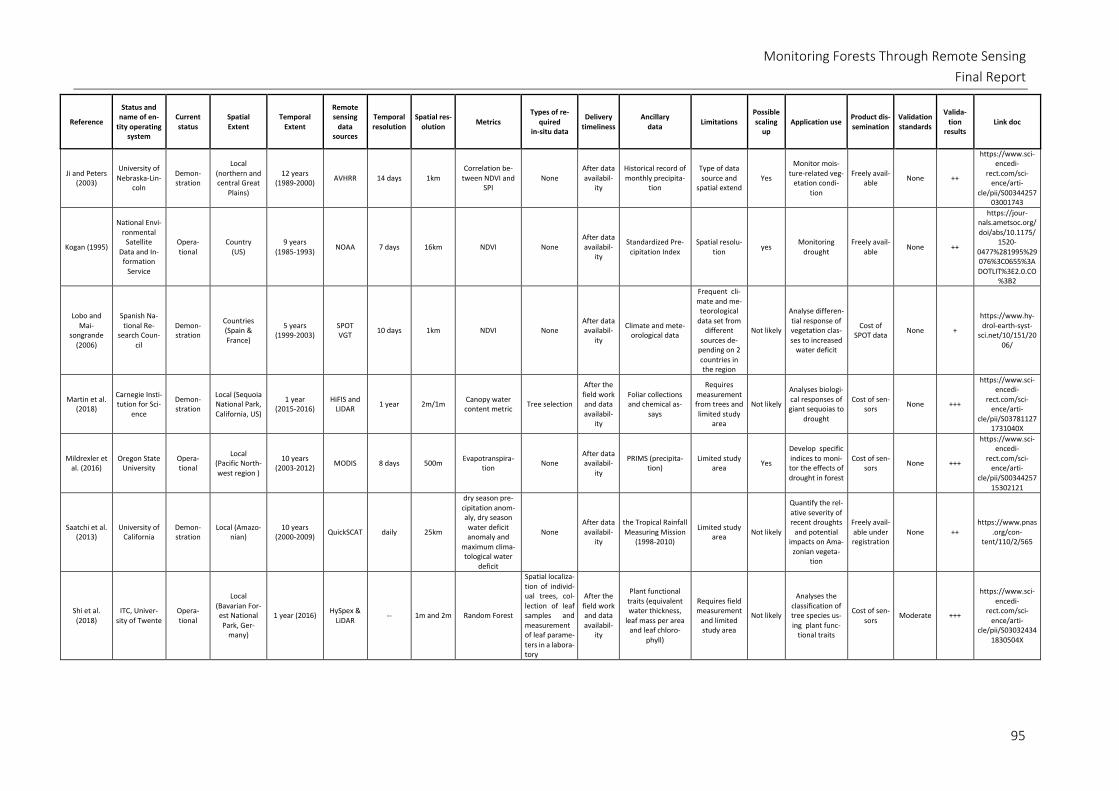
Monitoring Forests Through Remote Sensing Final Report
95
Reference
Status and name of en-
tity operating system
Current status
Spatial Extent
Temporal Extent
Remote sensing
data sources
Temporal resolution
Spatial res-olution Metrics
Types of re-quired
in-situ data
Delivery timeliness
Ancillary data Limitations
Possible scaling
up Application use Product dis-
semination Validation standards
Valida-tion
results Link doc
Ji and Peters (2003)
University of Nebraska-Lin-
coln
Demon-stration
Local (northern and central Great
Plains)
12 years (1989-2000) AVHRR 14 days 1km
Correlation be-tween NDVI and
SPI None
After data availabil-
ity
Historical record of monthly precipita-
tion
Type of data source and
spatial extend Yes
Monitor mois-ture-related veg-
etation condi-tion
Freely avail-able None ++
https://www.sci-encedi-
rect.com/sci-ence/arti-
cle/pii/S0034425703001743
Kogan (1995)
National Envi-ronmental
Satellite Data and In-formation
Service
Opera-tional
Country (US)
9 years (1985-1993) NOAA 7 days 16km NDVI None
After data availabil-
ity
Standardized Pre-cipitation Index
Spatial resolu-tion yes
Monitoring drought
Freely avail-able None ++
https://jour-nals.ametsoc.org/doi/abs/10.1175/
1520-0477%281995%29076%3C0655%3ADOTLIT%3E2.0.CO
%3B2
Lobo and Mai-
songrande (2006)
Spanish Na-tional Re-
search Coun-cil
Demon-stration
Countries (Spain & France)
5 years (1999-2003)
SPOT VGT 10 days 1km NDVI None
After data availabil-
ity
Climate and mete-orological data
Frequent cli-mate and me-teorological
data set from different
sources de-pending on 2 countries in the region
Not likely
Analyse differen-tial response of vegetation clas-ses to increased
water deficit
Cost of SPOT data None +
https://www.hy-drol-earth-syst-
sci.net/10/151/2006/
Martin et al. (2018)
Carnegie Insti-tution for Sci-
ence
Demon-stration
Local (Sequoia National Park, California, US)
1 year (2015-2016)
HiFIS and LIDAR 1 year 2m/1m Canopy water
content metric Tree selection
After the field work and data availabil-
ity
Foliar collections and chemical as-
says
Requires measurement from trees and limited study
area
Not likely
Analyses biologi-cal responses of giant sequoias to
drought
Cost of sen-sors None +++
https://www.sci-encedi-
rect.com/sci-ence/arti-
cle/pii/S037811271731040X
Mildrexler et al. (2016)
Oregon State University
Opera-tional
Local (Pacific North-west region )
10 years (2003-2012) MODIS 8 days 500m Evapotranspira-
tion None After data availabil-
ity
PRIMS (precipita-tion)
Limited study area Yes
Develop specific indices to moni-tor the effects of drought in forest
Cost of sen-sors None +++
https://www.sci-encedi-
rect.com/sci-ence/arti-
cle/pii/S0034425715302121
Saatchi et al. (2013)
University of California
Demon-stration
Local (Amazo-nian)
10 years (2000-2009) QuickSCAT daily 25km
dry season pre-cipitation anom-aly, dry season water deficit anomaly and
maximum clima-tological water
deficit
None After data availabil-
ity
the Tropical Rainfall Measuring Mission
(1998-2010)
Limited study area Not likely
Quantify the rel-ative severity of recent droughts
and potential impacts on Ama-zonian vegeta-
tion
Freely avail-able under registration
None ++ https://www.pnas
.org/con-tent/110/2/565
Shi et al. (2018)
ITC, Univer-sity of Twente
Opera-tional
Local (Bavarian For-est National Park, Ger-
many)
1 year (2016) HySpex & LiDAR
-- 1m and 2m Random Forest
Spatial localiza-tion of individ-ual trees, col-lection of leaf samples and measurement of leaf parame-ters in a labora-tory
After the field work and data availabil-
ity
Plant functional traits (equivalent water thickness,
leaf mass per area and leaf chloro-
phyll)
Requires field measurement
and limited study area
Not likely
Analyses the classification of tree species us-ing plant func-
tional traits
Cost of sen-sors
Moderate +++
https://www.sci-encedi-
rect.com/sci-ence/arti-
cle/pii/S030324341830504X

Monitoring Forests Through Remote Sensing Final Report
96
Reference
Status and name of en-
tity operating system
Current status
Spatial Extent
Temporal Extent
Remote sensing
data sources
Temporal resolution
Spatial res-olution Metrics
Types of re-quired
in-situ data
Delivery timeliness
Ancillary data Limitations
Possible scaling
up Application use Product dis-
semination Validation standards
Valida-tion
results Link doc
Volcani et al. (2005)
Ben Gurion University of
the Negev
Opera-tional
Local (between the Mediterra-nean and Dead
Seas)
winter & spring
1994/1995; fall 1995; winter and spring of
2000; and spring 2001
Landsat 16 days 30m NDVI Leaf gas ex-
change meas-urements
After the field work and data availabil-
ity
spatial information of soil type, geol-ogy, plant year,
slope, and aspect derived by DEM
The methods is based in a sim-
ple NDVI dif-ferences
Yes
Detect and as-sess sea-
sonal/phenologi-cal changes and
inter-annual changes in the
forest trees with respect to the drought effect
Freely avail-able None ++
https://www.sci-encedi-
rect.com/sci-ence/arti-
cle/pii/S0378112705003348
Zhu et al. (2019)
ITC, Univer-sity of Twente
Opera-tional
Local (Bavarian For-est National Park, Ger-
many)
1 year (2013) HySpex &
LiDAR -- 1m and 2m Look-up Table in-version (INFORM
model)
land cover map, leaf sam-
ples, back-ground sam-ples and can-
opy cover
After the field work and data availabil-
ity
Land use map, land surface tempera-
ture data
Requires field measurement, limited study area and very
specific sensor.
Not likely Retrieve leaf wa-
ter content Cost of sen-
sors High +++
https://sciencedi-rect.com/sci-
ence/arti-cle/pii/S03032434
18305361

Monitoring Forests Through Remote Sensing
Final Report
2.7 Brazilian monitoring
Deforestation rates in tropical forests and their negative effects have been widely evidenced in recent
decades (INPE, 2008; Tyukavina et al., 2017). Although deforestation is the main destructive force (As-
ner et al., 2005), others disturbances such as selective logging and fire have advanced in frequency and
extent in forested areas (Aragão et al., 2014, 2008; Asner et al., 2005). These disturbances thus become
one of the main causes of forest degradation and carbon emissions in the Amazon, besides inducing
changes in forest structure, species composition, biomass stocks and favouring conversion to deforesta-
tion (e.g. Barlow et al., 2016; Davidson et al., 2012; Numata et al., 2010; Watson et al., 2018).
Increasing international pressure to reduce greenhouse gas emissions, such as carbon dioxide (CO2)
(UNFCCC, 2011) has contributed to the establishment of government policies to control deforestation,
especially in the Amazon (Mello and Artaxo, 2017; Nepstad et al., 2014). These initiatives, in part, can
minimize the incidence of burning and illegal logging. However, at the national level, the effectiveness
of the impact of these actions on reducing forest disturbances is still poorly evaluated, becoming one
of the main socio-environmental challenges facing today (Morello et al., 2017).
Brazil is a pioneer in the monitoring of the Amazon and since 1988 has maintained a satellite monitoring
operating system developed by researchers from the National Institute for Space Research (INPE) (INPE,
2017, 2008). Despite being recently criticised for political gain, this information contributed to a better
understanding of the causes and impacts of deforestation, allowing the creation of more efficient pre-
vention and combat plans based on knowledge of the frequency and the factors that drive it (Fonseca
and Ribeiro, 2003; Pereira and Silva, 2016).
However, to assess and operationally monitor forest degradation is much more challenging than map-
ping forest deforestation (Hirschmugl et al., 2017). Although Brazil has made great progress in recent
years to reduce deforestation rates, other factors of forest degradation are not always explicitly consid-
ered in the estimates related to deforestation activities (Achard et al., 2014).
Before presenting an overview with emphasis on forest degradation and deforestation mapping pro-
cesses adopted in Brazil, it is necessary to establish a definition for the term presented here. Although
at the national level the consolidated concept of forest degradation has not yet been considered (MMA,
2017), for this chapter forest degradation will be adopted as a long-term disturbance in forest areas
(Simula, 2009), i.e. while deforestation is associated with the conversion of forest to other land uses,
degradation is related to a combination of forest disturbances generated by selective logging and burn-
ing (G. P. Asner et al., 2009; Souza, Jr et al., 2013) that can be detected by remote sensor images.
Therefore, this chapter aims to provide an overview of current operational applications, or which could
become operational, through remote sensing techniques on deforestation and forest disturbances, con-
sidering the methods and products currently used for mapping and monitoring in Brazil. This chapter
also presents some examples of applications from continental to local scales, highlighting the limitations
and challenges faced in establishing a reliable and comprehensive methodology.

Monitoring Forests Through Remote Sensing
Final Report
98
2.7.1 Historical context
The main initiatives for estimating and monitoring land cover changes in projects covering forests for-
mations are summarized in this topic.
Initially, as a pioneer project of forest monitoring, the PRODES (Brazilian Satellite Rainforest Monitoring
Program System) has been carrying out an inventory of primary forest loss using EO satellite images
since 1988, for the entire area of the Brazilian Amazon (BA). PRODES's objective is to estimate the an-
nual rate of deforestation of primary forest in BA. Since 1990, others biomes, as the Atlantic Forest (AF),
also have been included in the monitoring initiatives. Thus, the land cover mapping of AF by the SOS
Mata Altântica Project has become a reference for scientific research objective.
To generate systematic maps regarding land use and land cover in all deforested areas of the BA, iden-
tified by PRODES, the project entitled TerraClass was launched in 2011 (Almeida et al., 2016). Currently,
the project results are presented between 2004 and 2014 and they have allowed the analysis of the
dynamics of land use and land cover in the Amazon, enabling the identification of the main transition
processes in the region.
Considering the three initiatives cited above, the main common point between them, to meet the pro-
posed objectives, is the classification based on a visual image interpretation. Also, all initiatives also use
Landsat-like images as a main orbital image data.
In 2016, the MAPBIOMAS (Annual Land Coverage Mapping Project in Brazil) was launched. The project
uses cloud computing to produce an annual temporal series of land cover and land use maps of Brazil
from 1985 to 2018. MAPBIOMAS has become the only frequent and updated mapping project for the
entire Brazilian territory (Souza and Azevedo, 2018). In addition to these initiatives, other studies on a
global scale (Chen et al., 2015; Hansen et al., 2013) were generated for this purpose (Table 8).
Table 8. Important initiatives on biome or global scale mappings to estimating and monitoring forests formations.
Author Scale Purpose / Time Scale Satellite / Spa-tial Resolution
GFC¹ (Hansen et al., 2013)
Global Forest Cover (2000); Loss and Gain Cover
(2001-2015);
Landsat-like (30 m)
GlobeLand30 (Chen et al., 2015)
Global Land Use and Land Cover (2000-2010)
Landsat
PROBIO² All Brazilian Biomes Land Use and Land Cover (2002) Landsat-like
PMDBBS³ PROBIO Continuation Deforestation (2002-2008; 2008-2009)
Landsat-like
Imazon4 Brazilian Amazon Detection of environmental risks, deforested areas, timber harvesting,
forest typologies
Landsat-like
¹ GFC: Global Forest Change; ² PROBIO: Projeto de Conservação e Utilização Sustentável da Diversidade Biológica Brasileira (Conservation and Sustainable Use of Brazilian Biological Diversity Project); ³ PMDBBS: Projeto de Monitoramento do Desmatamento dos Biomas Brasileiros por Satélite (Brazilian Biomes Deforestation Monitoring by Satellite Project); 4http://imazon.org.br/en/publicacoes/mapping-and-spatiotemporal-characterization-of-degraded-forests-in-the-brazilian-amazon-through-remote-sensing-2/

Monitoring Forests Through Remote Sensing
Final Report
99
2.7.2 Existing operational systems
Mapping Land Use and Land Cover
Several general-purpose land use and land cover maps were produced, relevant in the Brazilian context
such as GlobalLand30, MapBiomas, TerraClass and OSO Mata Atlantica.
Deforestation
To specifically map ongoing deforestations within Brazil, several specific initiatives were set up, such as
GFC, PRODES and DETER. In the context of GFC, the approach to forest / non-forest mapping developed
by Hansen et al. (2013) was used. This approach aimed to map the planet's pan-tropical forests using
cloud computing technology on the Google Earth Engine platform (Gorelick et al., 2017). The authors
processed Landsat images between 2000 and 2012 and provided information such as forest loss and
gain, as well as the 2000 forest cover product (Treecover2000).
Treecover2000 is a raster file in which each pixel can range from 0 to 100, representing the percentage
of forest cover in the year 2000, that is, the pixel containing the value 0 means no forest cover, while
the value 100 means that the pixel has full forest cover. Thus, to establish the Forest / Non-forest mask
using Treecover2000, the user must decide their own cut-off threshold for later applications. In recent
work, Taubert et al. (2018) used forest thresholds from 30% coverage, while Shimabukuro et al. (2017)
established forest area from 50% pixel coverage and Wagner et al. (2017) only considered the pixels
above 80% coverage as forest formation.
The monitoring by PRODES is carried out to detect abrupt changes in the forest known as clear-cut.
Deforestation identification is done by photointerpretation, carried out by trained specialists who de-
limit deforestation polygons directly on the computer screen. These experts identify the pattern of
change of forest cover to clear-cut based on the three main elements criteria observable in images: hue,
texture and context, following standardization shown in Figure 21 (INPE, 2018).
Figure 21. Image interpretation pattern for identification of clear-cut deforestation in Landsat images (Source: INPE)

Monitoring Forests Through Remote Sensing
Final Report
100
DETER, launched in 2004, is a support system for the supervision and control of deforestation and deg-
radation in the Brazilian Amazon. DETER produces daily change alerts forest cover for areas larger than
3 hectares. Alerts indicate areas deforested (clear cut) as well as degrading areas (logging, mining, burn-
ing and others).
The project used images from MODIS sensor onboard Terra satellite and WFI sensor onboard CBERS-2
satellite in a 250 m spatial resolution. Since 2015, DETER improved the methodology and started to
operate with images from WFI sensor onboard CBERS-4 satellite, with a 64 m spatial resolution (INPE,
2018).
Forest Degradation
To assess forest degradation in Brazil, the DEGRAD initiatives was developed. This was necessary, as
forest degradation activities such as burning and selective logging are not contemplated by PRODES. To
fill this gap, a solution used by researchers at INPE was to establish the DEGRAD Project. DEGRAD uses
the same approach as PRODES with respect to the minimum mapping unit (6.25 ha), but contrast en-
hancement techniques are applied to orbital images using Landsat and CBERS satellites to highlight ar-
eas that occur forest degradation (INPE, 2018).
However, DEGRAD data do not distinguish between degradation agents such as burning and selective
exploitation. These two types of forest degradation have different dynamics and deserve different at-
tention regarding ecological study. Thus, it is evident that different techniques and approaches to map
the different types of forest degradation are needed.
2.7.3 Methods which could become operational
Forest degradation
Currently, object-based approaches are more effective for fire mapping, while pixel-based approaches
have shown better results for selective logging mapping (Grecchi et al., 2017; Shimabukuro et al., 2015,
2014). Knowing a priori where forest and non-forest areas are located is essential for the correct detec-
tion of forest degradation areas (Shimabukuro et al., 2014). Thus, PRODES and GFC data can be used as
a mask to identify whether degradation is occurring.
A suggestive approach to annual forest degradation mapping is presented in the flowchart below (Figure
22). Initially, from the choice of the base year in which the degradation areas are to be quantified, the
mapping is performed by digital image processing (DIP) techniques of the Forest / Non-Forest mask.
Subsequently, also using PDI techniques, the burned area and selective logging maps are obtained for
the years of interest. Finally, by combining both maps obtained previously, it is possible to map the
annual forest degradation caused by fire and selective logging.

Monitoring Forests Through Remote Sensing
Final Report
101
Figure 22. Descriptive flowchart for obtaining Forest / Non-forest maps, burned area map to generate an annual forest degra-dation map caused by burning (Source: INPE)
Wildfire
Detailed knowledge of forest fire patterns in Brazil is critical to avoid the negative impacts of fires on
populations and ecosystems (Aragão et al., 2008). Thus, the monitoring allows the understanding of the
main factors that drive the temporal and spatial patterns of fire, enabling the prediction of the occur-
rence and impacts of these events (Earl and Simmonds, 2018).
Mapping of fires in the Amazon has been developed by researchers from INPE in recent years through
the application of DIP techniques. The methods developed have been applied in images from medium
spatial resolution sensors, such as the Landsat series (Shimabukuro et al., 2014), as well as moderate
spatial resolution sensors, such as MODIS on Terra and Aqua platforms (Anderson et al., 2015, 2005;
Shimabukuro et al., 2009).
The widely employed methodology is based on the use of shade fraction images, derived from the ap-
plication of the linear spectral mixing model (LSMM). LSMM assumes that the pixel is formed by the
spectral mixture of several components, i.e. vegetation, soil and shade (Shimabukuro and Smith, 1991).
For the application of the model, it is necessary to obtain pure pixels called endmembers - pixels that
have not been influenced by other targets. To obtain such endmembers, the most commonly used ap-
proach is the acquisition of endmembers from the spectral responses in the same image under study
(Shimabukuro and Ponzoni, 2017). Thus, assuming that the spectral responses of each component are
known, then their proportions can be estimated. The linear spectral mixture model can be represented
in the image according to Equation 1.

Monitoring Forests Through Remote Sensing
Final Report
102
!! = Σ%&!"'"#( +*! (Equation 1)
where:
!! = Average spectral reflectance in the spectral band i; "!" = Spectral response of the j component of the mixture in the spectral band i; #" = Proportion of the component j at a pixel; $! = Error in the spectral band i; % = 1, n (number of spectral bands used); & = 1, m (number of considered components).
The results of equation (1) is obtained for each pixel, representing the proportions of its components
(Shimabukuro and Smith, 1991). Fraction images are represented by the variation in brightness in the
generated images, so the brightest pixels have the highest endmember percentage in the respective
fraction image (Figure 23; right). Thus, the linear spectral mixture model is not a thematic classifier, but
it provides data reduction, besides highlighting the information contained in the pixel for several appli-
cations (Shimabukuro and Ponzoni, 2017).
Figure 23. TM / Landsat image in orbit /point (226/069) in colour composition R5 G4 B3 showing burnt areas in dark colour
(Left); and shade fraction image with brighter pixels highlighting the burned areas (Right) (Source: INPE)
From the shade fraction image, it is possible to apply an image segmentation algorithm, creating objects
with spectral similarity, to spatially delineate the boundaries of different targets. Thus, the image seg-
mentation algorithm separates the burn scar from the other targets due to the high brightness differ-
ence in the shade fraction image.
Figure 24 presents the methodological steps of mapping burn scars. After segmentation, the next step
is image classification using the unsupervised classification method from the segments obtained in the
previous step. Finally, a manual editing is recommended to eliminate omission and commission errors
that may occur in the automatic classification step and, then, to produce a map of burned areas with
good accuracy.

Monitoring Forests Through Remote Sensing
Final Report
103
Figure 24. Methodological approach to burn mapping through digital image processing of remote sensors (Source: INPE)
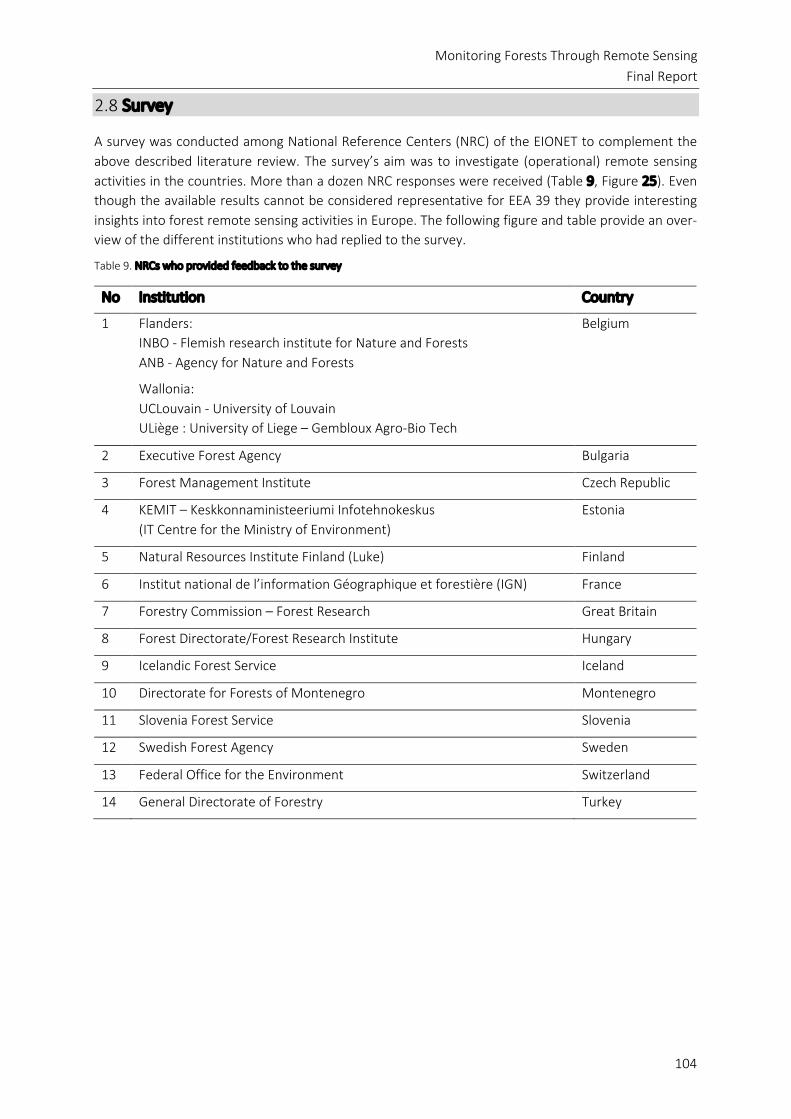
Monitoring Forests Through Remote Sensing
Final Report
104
2.8 Survey
A survey was conducted among National Reference Centers (NRC) of the EIONET to complement the
above described literature review. The survey’s aim was to investigate (operational) remote sensing
activities in the countries. More than a dozen NRC responses were received (Table 9, Figure 25). Even
though the available results cannot be considered representative for EEA 39 they provide interesting
insights into forest remote sensing activities in Europe. The following figure and table provide an over-
view of the different institutions who had replied to the survey.
Table 9. NRCs who provided feedback to the survey
No Institution Country
1 Flanders:
INBO - Flemish research institute for Nature and Forests
ANB - Agency for Nature and Forests
Wallonia:
UCLouvain - University of Louvain
ULiège : University of Liege – Gembloux Agro-Bio Tech
Belgium
2 Executive Forest Agency Bulgaria
3 Forest Management Institute Czech Republic
4 KEMIT – Keskkonnaministeeriumi Infotehnokeskus
(IT Centre for the Ministry of Environment)
Estonia
5 Natural Resources Institute Finland (Luke) Finland
6 Institut national de l’information Géographique et forestière (IGN) France
7 Forestry Commission – Forest Research Great Britain
8 Forest Directorate/Forest Research Institute Hungary
9 Icelandic Forest Service Iceland
10 Directorate for Forests of Montenegro Montenegro
11 Slovenia Forest Service Slovenia
12 Swedish Forest Agency Sweden
13 Federal Office for the Environment Switzerland
14 General Directorate of Forestry Turkey

Monitoring Forests Through Remote Sensing
Final Report
105
Figure 25. Overview map of NRCs who have responded to the survey to date (Sept-2020)
2.8.1 Remote sensing applications
Among all NRCs five apply remote sensing operationally, two only for research purposes and six have
operational and research activities in place. Only the Icelandic NRC reported that remote sensing was
not used in their operations. Monitoring of storm damages, pest infestation and illegal logging are the
most applied applications. Forest fire monitoring is used by four countries, followed by phenology anal-
ysis (3) and drought monitoring (1). Remote sensing is also widely used for setting up forest inventories
(Figure 26).
Figure 26. Use of forest remote sensing in thirteen selected EEA39 countries responding to the information request
4
7
9
1
3
7
3
0123456789
10
Forest fire Pestinfestation
Stormdamages
Drought Phenology Illegallogging
Other
Use of Forest Remote Sensing in selected EEA39 countries

Monitoring Forests Through Remote Sensing
Final Report
106
High resolution multispectral images are used for evaluating the forest status of grid points for the
Flemish Forest Inventory. Afforestation / deforestation is evaluated based on NDVI information and Li-
DAR data. In Wallonia, an early warning system was developed for the detection of Ips typographus (Un.
Agr. Gembloux). Moreover, NDVI and forest maps are produced. With Forestimator, a QGIS plugin was
developed to estimate the top height of conifer stands using local maxima extracted from LiDAR Data.
Finally, remote sensing data is also integrated in the regional forest inventories.
In Bulgaria, remote sensing is randomly used for investigating wildfires, pests and storm damages. These
surveys have a local character and are always conducted with special purpose.
In Czech Republic orthophotos are used for the visual stereoscopic interpretation of the NFI plots and
the creation of a country-wide normalised digital surface model (nDSM). Moreover, thematic forestry
maps based on aerial and satellite (Sentinel-2, Planet) images are produced to support the National
Forest Inventory or the EU Timber Regulation. Country-wide activities include the creation of forest
cover maps (according to FAO definition), the periodic detection of clear-cuts, maps of species compo-
sition, analysis of stand development phases, assessment of forest health status or the monitoring of
bark beetle infestation.
Satellite imagery and LiDAR data are used in Estonia to regularly assess changes of forest land in relation
to logging and damages. Moreover, information about stand characteristics such as tree species, height
and volume are determined. Wildfire, storm impacts and pest infestations are evaluated, if a stand has
collapsed or was removed after an event. Legal and illegal logging are regularly monitored.
Finland produces forest resource maps for the whole country and estimates of forest parameters for
municipalities by remote sensing. The NFI inventories are based on field plot data and other background
information. Combining field plot data and satellite images enables to present forest information as
detailed forest resource maps specific to each municipality. This method is called the multi-source na-
tional forest inventory (MS-NFI).
In France, IGN is considering updating the forest map (BD Forêt) with automatic or semi-automatic re-
mote sensing methods. Having an updated version of the forest database every three years will also
facilitate the establishment of the multisource national forest inventory.
To monitor woodland loss and clear-felling, but also woodland expansion, is the purpose for remote
sensing in Great Britain.
Besides using EFFIS, Hungary applies remote sensing for the classification of NFI plots, to locally assess
forest damages or to assess illegal logging.
Slovenia was affected by two large windthrows in 2017 and 2018 causing damage in the area of Kočevje
and Slovenj Gradec. For each event, different commercial UAV companies offered the collection of the
data to quickly assess damages. Images provided where suitable and helpful for visual assessment. The
density of the derived point clouds was not sufficient though for small-scale data analysis.
Sweden uses change detection for clear-cut monitoring and forest fire monitoring. Vegetation index
analysis is applied for mapping of pre-commercial thinning areas.

Monitoring Forests Through Remote Sensing
Final Report
107
Figure 27. Platforms and sensors mostly used amongst the thirteen EEA39 countries responding to the information request
Switzerland supports its NFI with remote sensing data. Moreover, forest and timber maps are created.
Vegetation height models are determined using active and passive sensors such as LiDAR and aerial
images and are used for the NFI. Information on the forest mix rate NFI is modelled using also remote
sensing methods. In the past, information about storm damages was also made available.
In Turkey, forest management and forest fire departments have been using aerial images on local level.
Satellite imagery have been used for LULUCF reporting.
Aerial imagery is still the most widely used image data followed by high resolution multispectral satellite
data. But also UAV and SAR are sources applied. Commercial VHR satellite imagery doesn’t play a role
for current analysis (Figure 27).
2.8.2 Future improvements
Many countries consider further remote sensing use cases in the future. In Belgium, deriving potential
dendrometric information from LiDAR data is such use case. The Bulgarian “Program for protection from
forest fires” includes the activity “Development of common system for monitoring, early detection and
warning of forest fires“. To determine additional stand characteristics on reference ground plots
through LiDAR is a future activity foreseen in Estonia. In France, the existing forest map is produced
through a semi-automatic approach using 25 cm colour infrared orthoimages (CIR). Images are first
segmented. In a second step an operator assigns a class to the various polygons. In the near future a
new methodology mainly based on remote sensing will be set up. This includes the automatic produc-
tion of a binary forest / non-forest map from IGN’s stereoscopic aerial survey. Forest species will be
discriminated through the processing of Sentinel 2 imagery using deep learning models. IGN is also ex-
perimenting collaborative works with the ONF, the national forest office, which is responsible for man-
aging the French public forests (1/4 of the French forest surface).
In Great Britain, remote sensing should be used in the future for species identification but also the as-
sessment of pest and diseases. A new project aiming at the regular monitoring of forest damages and
illegal logging is set up in Hungary. Based on its good results of using UAV data for forest damage as-
sessment, Slovenia’s long-term plan is to establish a contract with a UAV imagery and point cloud pro-
vider to allow regular monitoring and natural disaster response and assessments. The goal is to achieve
10
5
1
11
6
3
0
2
4
6
8
10
12
HR SAR VHR Aerial UAV OTHER
Platform and sensors used

Monitoring Forests Through Remote Sensing
Final Report
108
periodical remote sensing data acquisitions at the national level. Furthermore, a national remote sens-
ing team for a quick response to different natural disasters should be formed.
Sweden considers the implementation of time series analysis in future forest monitoring activities. The
Swiss Forest Inventory provides already data with good quality through the use of aerial images and
field verification. The use of satellite derived information is only considered as an added value when
high quality standards can be met.
The survey shows that remote sensing is widely used by European stakeholders for different forest man-
agement activities. However, aerial imagery is still the most important data source. Nevertheless, many
stakeholders have plans to further expand the use of satellite remote sensing in the future.

Monitoring Forests Through Remote Sensing
Final Report
109
3. Remote sensing for forest condition and disturbance related policy develop-ment and implementation monitoring
The review of existing forest remote sensing approaches and operational monitoring services underlines
that remote sensing is a powerful tool to support sustainable forest management. It enables a rapid and
cost-effective monitoring and change detection of large forest areas. This is highly relevant because
forest managers often lack accurate and up-to-date data. To date, National Forest Inventories (NFIs) are
primary data sources for large area assessment of forest resources. NFIs have been traditionally de-
signed to provide country-based estimates on the kind, amount and condition of forest resources (Co-
rona et al., 2011). Based on sample surveys forest population parameters are estimated to assess also
changes over time. NFIs are very costly and conducted over long time periods. For example in Germany,
the forest law stipulates a repetition every ten years (BMEL, 2015). In other countries, a continuous
approach assesses annually the forest condition for a part of the total forest area, thus updating the NFI
continuously. Commercial forests use, climate change and impacts of extreme events are among the
reasons though, why more frequent information updates are required for comprehensive forest deci-
sion and policy making.
Copernicus is the European Earth observation (EO) programme. It will be a key information source for
the Forest Information System for Europe (FISE). Moreover its value for European policy making is un-
derlined through the recent JRC study on the Copernicus uptake in the European Commission (Kucera
et al., 2020). The report mentions that an increasing number of agriculture, environment and climate
related policies explicitly mention the use of Copernicus data to monitor the implementation of the
policy measures. The Regulation on the inclusion of greenhouse gas emissions and removals from land
use, land use change and forestry in the 2030 climate and energy framework (LULUCF) is one such ex-
ample (European Union, 2016).
There is no single EU forest policy in Europe equivalent to e. g. the Common Agriculture Policy. Forest
protection and forestry fall under a number of shared competences between the EU and its Member
States. Nevertheless, the sustainable management of forests is of highest European interest. This is for
example expressed through the different EU policies contributing to the implementation of the 2030
Agenda and towards achieving the Sustainable Development Goals - first and foremost the European
Green Deal. Thus, there is a need to understand how remote sensing can facilitate policy development
and monitoring the implementation of policies affecting EU forest condition and disturbances.
The following section investigates this potential in relation to five European policies:
1. The European Green Deal
2. The EU Forest Strategy
3. The EU Biodiversity Strategy
4. The EU Rural Development Programme
5. The Regulation for the Land Use, Land Use Change and Forestry sector (LULUCF)
All of the presented policies refer to forest disturbances and each policy summary is followed by a sec-
tion about its implications on forest disturbances. How remote sensing can be used to efficiently mon-
itor the different types of forest disturbances is already presented in section 2 and its subsections. It
offers advantages compared to traditional forest inventories in terms of geographical coverage, timely
repetition and cost. However, existing limitations have to be addressed through the development of
additional tailored services and dedicated research. The impact and effectiveness of forest remote sens-
ing in the light of the following selected policies will be further discussed in section 4.

Monitoring Forests Through Remote Sensing
Final Report
110
3.1 The European Green Deal, COM(2020) 80 final
Ecosystems and biodiversity are one of the main elements in the European Green Deal where Europe
wants to lead by example with new measures to address the main drivers of biodiversity loss and eco-
system degradation, and with other measures to tackle soil and water pollution as well as forest regen-
eration.
The European Parliament declared in a symbolic vote a resolution of a climate and environmental emer-
gency in Europe and globally (November 2019). The vote paved the way for the shaping of new policies
in line with the framework of the Paris Agreement tackling climate change. The Green Deal is a new key
policy of the Commission’s strategy to implement the United Nation’s 2030 Agenda and the Sustainable
Development Goals in line with green priorities announced by the political guidelines of the recent pres-
idency. Critical aspects of the deal contain efforts to reduce emissions, to fund research and innovation,
to preserve Europe’s natural environment. The regulation aims to set in legislation the EU’s 2050 cli-
mate-neutrality objective to become the first climate-neutral continent by 2050. The EU regulation is a
new growth strategy for a resource efficient economy with no net emissions of greenhouse gases in
2050. It refers to the long-term goal to pursue efforts to keep the global temperature increase below
1.5° C. Further elements include:
Supplying clean, affordable and secure energy
The policy aims at decarbonising the energy system of Member States through modernization. Renew-
ables, and energy efficiency efforts will guide sustainable solutions across sectors.
Mobilising industry for a clean and circular economy
Through an EU-wide industrial strategy sustainable economy shall expand and industrial sectors and all
the value chains shall be transformed. Resource-intensive sectors should undergo a transition towards
a circular economy approach. Digital technologies can have an enabling role in meeting sustainability
goals of the deal.
Building and renovating in an energy and resource efficient way
The construction, use and renovation of buildings require significant amounts of energy and mineral
resources. Buildings consume high energy for maintenance and heating. Hence, the Commission will
rigorously enforce the legislation related to the energy performance of buildings and incentivize energy
efficiency in the management of buildings.
Accelerating the shift to sustainable and smart mobility
Transport accounts for a quarter of the EU’s greenhouse gas emissions, and is still growing. Mobility
services need to become cleaner and sustainable alternative fuels need to become available at scale.
The revision of the legislation on CO2 emission performance standards for cars and vans is envisaged to
ensure a perspective from 2025 onwards towards zero-emission mobility.

Monitoring Forests Through Remote Sensing
Final Report
111
From ‘Farm to Fork’: designing a fair, healthy and environmentally-friendly food system
The Commission will formulate a sustainable food policy. Plans will foster the limited use of fertilizer
and promote the awareness of the risk of chemical pesticides and antibiotics to strive for a more sus-
tainable food consumption.
Preserving and restoring ecosystems and biodiversity
The envisaged biodiversity strategy will tackle as a policy measure the issues of biodiversity loss. A new
EU forest strategy will focus on the protection of forest ecosystems that are under more and more
pressure due to climate change. Forests play for the EU a vital role in reaching climate neutrality and a
healthy environment.
A zero pollution ambition for a toxic-free environment
Through a zero pollution action plan the EU plans to better monitor, report, prevent and remedy pollu-
tion from air, water, soil, and consumer products. Ground and surface water will be better protected
and industrial pollution shall be reduced. These measures shall help to protect citizens and the environ-
ment better against hazardous chemicals.
It is the aim that the European Green Deal will accelerate and underpin the transition needed in all
sectors and the mainstreaming of sustainability in all EU policies.
Implications of the “Green Deal” on forest disturbances
The Communication of the European Commission underlines the need for preserving and restoring eco-
systems and biodiversity because they mitigate natural disasters, pests and diseases and help regulate
the climate. However, biodiversity loss is a persistent problem in Europe and its overall target to halt it
by 2020 won't be met (EEA, 2019a). The new 2030 Biodiversity Strategy will require legal measures and
binding targets to protect and restore vulnerable ecosystems and should address the drivers of biodi-
versity loss. Also the Commission calls for a European legal framework to ensure deforestation-free
supply chains especially imported deforestation. Further, it refers to the EU Forest Strategy highlighting
the imperative role of forests and forest management in the fight against climate change. The EU's for-
ested areas need to improve in quality and quantity. Reducing the incidence and extent of forest fires
and combatting illegal logging will help serving forest preservation and restoration to increase the ab-
sorption of CO2.

Monitoring Forests Through Remote Sensing
Final Report
112
3.2 The European Forest Strategy, COM (2013) 659 final
The European Forest Strategy is a reference and a policy framework for the coordination of forest re-
lated policies in Europe. The strategy was adopted in 2013, defining principles that are required to en-
hance sustainable forest management and forest protection but it addresses also forests as an eco-
nomic resource. Moreover, it aims at coordinating and ensuring coherence of forest-related policies
allowing synergies with other sectors that influence forest management. The strategy considers forests
and the forest sector in general as important components of a green economy. At the same time it
values the services they provide while ensuring their protection. Eight priority areas are specified in the
forest strategy including forest protection and enhancement of ecosystem services, promoting the role
of sustainable forest management in mitigation of and adaptation to climate change, and securing sus-
tainable livelihoods and welfare in both rural and urban communities.
In 2018, the EU Commission published a mid-term review of the EU forest strategy. In its conclusions in
2019, the Council of the EU noted a need to develop a new forest strategy beyond 2020, building on
the progress made so far. An update of the Forest Strategy is under way and expected to be published
in 2020.
Implications of the Forest Strategy on forest disturbances
Forests are very vulnerable to climate change. Sustainable forest management is therefore of highest
importance to maintain and enhance their resilience and adaptive capacity. This includes for example
the planting of appropriate species coping with higher average temperatures and being more resilient
against pests and diseases. Pressures on forests derive also from fragmentation, the spread of invasive
alien species, drought, forest fires and other extreme events. This calls for an enhanced protection and
underlines the importance of forest management. However, to achieve this, up-to-date forest infor-
mation is a key prerequisite. This is the idea behind the setup of a Forest Information System for Europe
(FISE) integrating harmonised information about forests and forest resources and integrating existing
services such as the European Forest Fire Information System (EFFIS). According to the strategy the EC
is about to develop several modules, e.g. on forests and natural disturbances like fires and pests, climate
change and ecosystem services that could contribute to the EU’s forestry statistics and Integrated Envi-
ronmental and Economic Accounting for Forests.

Monitoring Forests Through Remote Sensing
Final Report
113
3.3 The EU Biodiversity Strategy for 2030, COM (2020/380) final
Biodiversity loss and ecosystem collapse are one of the biggest threats facing humanity in the next dec-
ade . The biodiversity crisis is intrinsically linked to the climate crisis. The EU Biodiversity Strategy for
2030 reflects the ambition to build a transformative post-2020 global framework at the 15th Conference
of the Parties to the Convention on Biological Diversity in 2021. By 2050 all of the world’s ecosystems
shall be restored, resilient, and adequately protected. The EU Biodiversity Strategy aims at guiding Eu-
rope’s biodiversity on the path to recovery by 2030.
It addresses the following drivers of biodiversity:
Protecting and restoring nature in the EU
A coherent network of protected area is envisaged compared to rather fragmented nature networks of
today. At least 30 % of the land and 30 % of the sea should be protected in the EU. This translates in an
additional 4 % for land and 19 % for sea areas as compared to today. The target complies with what is
being proposed as part of the post-2020 global biodiversity framework. 10 % of EU land and 10 % of EU
sea – should be strictly protected. All protected areas need to be protected appropriately with clear
conservation objectives and monitoring rules.
A new EU Nature Restoration Plan shall restore ecosystems across land and sea strengthening the EU
legal framework for nature restoration. A proposal for new EU nature restoration targets in 2021 aims
at restoring degraded ecosystems, in particular those with the most potential to capture and store car-
bon and to prevent and reduce the impact of natural disasters. Member states should prevent any de-
terioration in conservation trends and status of all protected habitats and species by 2030.
As set out in the Farm to Fork Strategy and the New Common Agricultural Policy, the Commission will
take action to reduce by 50 % the overall use of – and risk from – chemical pesticides by 2030 and
reduce by 50 % the use of more hazardous pesticides by 2030. Additional measures may be imple-
mented if necessary by the end of 2020 based on a review of the initiative. At least 10 % of agricultural
area should fall under high-diversity landscape features in the future and least 25 % of the EU’s agricul-
tural land must be cultivated in an organic way by 2030.
The importance of soil protection is underlined by an update of the EU Soil Thematic Strategy in 2012
and the Zero Pollution Action Plan for Air, Water and Soil that will be adopted in 2021. Soil fertility shall
be fostered, soil erosion be reduced and soil organic matter increased.
The quantity, quality and resilience of forests shall be increased in line with strictly protecting all re-
maining EU primary and old-growth forests. Threats like fires, droughts, pests, diseases are an impact
of climate change. Therefore forests need to be protected to fulfill their crucial role for biodiversity and
climate. The new Forest Strategy aims at planting at least 3 billion additional trees in the EU by 2030.
Tree planting is important in urban areas for their function to improve the micro climate and in rural
areas they play a role in agroforestry and increased carbon sequestration.
Renewable energy will be essential to fight climate change and biodiversity loss and shall be promoted.
Based on the Renewable Energy Directive, the Commission will also develop operational guidance in
2021 on the new sustainability criteria on forest biomass for energy. Biofuels with high indirect land-
use change risk shall gradually phase out by 2030.
Marine ecosystems need to be protected. National maritime spatial plans will need to cover conserva-
tion measures and a new action plan aims at conserving fisheries resources and protecting marine eco-
systems in 2021. Greater efforts are needed to restore freshwater ecosystems. Therefore, at least

Monitoring Forests Through Remote Sensing
Final Report
114
25,000 km of rivers will be restored into free-flowing rivers by 2030 to achieve the objectives of the
Water Framework Directive.
Urban Greening Plans shall be developed in order to bring nature back to the urban realm. Under the
so called Green City Accord an EU Urban Greening Platform will be designed.
A new EU Chemicals Strategy for Sustainability will be put forward along with a Zero Pollution Action
Plan for Air, Water and Soil. Nutrient losses through fertilizers shall be reduced and a target of fertilizer
reduction of at least 20 % is implemented. This goes in line with the development of an Integrated
Nutrient Management Action Plan in 2022.
Alien species in the EU environment should be eliminated through the implementation of the EU Inva-
sive Alien Species Regulation. Also the number of Red List species threatened by invasive alien species
should decrease by 50 %.
Enabling a transformative change
A new European biodiversity governance framework will be set up to manage the implementation of
biodiversity commitments agreed at national, European or international level.
A sustainable corporate governance initiative is planned to be built in 2021 in order to build a European
Business for Biodiversity movement. Environmental footprinting of products and organisations will be
promoted and a new Knowledge Centre for Biodiversity in close cooperation with the European Envi-
ronment Agency set up in order to:
• track and assess progress by the EU and its partners including in relation to implementation of
biodiversity related international instruments;
• foster cooperation and partnership, including between climate and biodiversity scientists, and
• underpin policy development.
The EU and the global diversity agenda
The EU wants to help to adopt to an ambitious new global framework for post-2020 at the upcoming
15th Conference of the Parties to the Convention on Biological Diversity. The idea is that by 2050, all of
the world’s ecosystems are restored, resilient, and adequately protected. The world should commit to
the net-gain principle to give nature back more than it takes. The world should commit to no human-
induced extinction of species, at minimum where avoidable. The global 2030 targets should be in line
with EU commitments in the Biodiversity Strategy. An international Ocean Governance, ecologically
adapted trade policies and greater cooperation with partners including increased financing will be re-
quired for delivering an ambitious post-2020 global biodiversity framework.
Implications of the Biodiversity Strategy on forest disturbances
• The strategy addresses forests in section 2.1 and paragraph 2.2.4: Restoring and protecting
forests requires a spatial and temporal monitoring of all of the EU’s remaining primary and
old-growth forests. Forest fires are a major threat to damage forest biodiversity and therefore
need to be prevented by the Member States. As it was shown in section 2.4 of this report
Earth observation technology is a valuable technology to make use of for monitoring forests
and forest fires. The Rapid Mapping as well as the Risk and Recovery Mapping of the Coperni-
cus Emergency Management Service provide already relevant data products for wildfire man-
agement. The European Forest Fire Information System provides additional information about
wildfire risk, burnt areas, and historical events.
Monitoring Forests Through Remote Sensing
Final Report
115
3.4 EU Regulation on support for Rural Development (No 1305/2013)
The EU Regulation on support for rural development, (No 1305/2013, European Commission, 2013f) is
designed to ensure that rural areas across the EU receive support for rural development for the period
2014 - 2020. It provides for an important reorganisation of the rural knowledge system, integrating it
therefore within the wider strategy to consolidate agricultural and forestry research and development.
Very substantial provisions for the good of the environment are made to face challenges of biodiversity,
greenhouse gas emissions, soil and water quality, and landscape preservation.
The priorities of development encompass:
1. Encouraging knowledge transfer and innovation in agriculture, forestry and rural areas.
2. Improving the viability and competitiveness of every kind of agriculture, promoting both inno-
vative agriculture and sustainable forest management.
3. Promoting the organisation of the food chain, animal welfare and agricultural risk management.
4. Restoring, conserving and improving ecosystems that depend on agriculture and forestry.
5. Promoting the efficient use of resources and supporting progress towards a low carbon econ-
omy that can adapt to climate change in the agricultural, food and forestry sectors.
6. Fostering social inclusion, reducing poverty and economic development in rural areas.
Implications of the EU Regulation on support for Rural Development on forest disturbances
The Directive’s support on ecosystem conservation integrates the restoration of forests and the im-
provement of ecosystems and climate resilience. Investments are granted to private and public forest-
holders and other private law and public bodies and their associations. Measures focus on the preven-
tion and restoration of damage to forests from forest fires, natural disasters and catastrophic events,
pest and disease outbreaks, and climate related threats. Forest fire, pest and diseases monitoring facil-
ities and communication equipment can be established and improved. Forests potentially damaged
from fires and other natural disasters including pests, diseases as well as catastrophic events and climate
change related events can be restored by the regulation funding (article 21 and 24).
Monitoring Forests Through Remote Sensing
Final Report
116
3.5 EU Regulation for the Land Use, Land Use Change and Forestry sector (LULUCF)
The EU Regulation for the Land Use, Land Use Change and Forestry sector (LULUCF, Regulation (EU)
2018/841, European Commission 2018f) sets out the legislative framework for emissions and removals
from the land use sector for the period 2021 - 2030. For the first time it includes these in the overall EU
commitment to reduce emissions. Member States need to ensure that there are no net accounted emis-
sions by the LULUCF sector and the rules provide an accounting incentive to maintain or enhance sinks
in forests, soils and other associated carbon pools. Corresponding to land use reporting under the
United Nations Framework Convention on Climate Change (UNFCCC) the regulation sets out land cate-
gory-dependent accounting rules that also include wetlands from 2026 onwards.
The LULUCF regulation introduces an important step towards an alignment of reporting and accounting
approaches as it addresses “land-based accounting” (applicable under the UNFCCC accounting frame-
work). A “land-based approach” estimates the total carbon stock (C stock) changes in selected carbon
pools on all managed land areas as a basis for accounting. Accounting is thus carried out on the reported
forest inventory datasets, to determine if emissions have decreased and / or removals been enhanced.
The regulation strives for an optimization of data collection and analysis by geographical monitoring of
land areas in line with the existing systems of the Member States and the EU. This can include a spec-
trum of spatial data (EO and maps) and in-situ data repositories. This approach is more comprehensive
spatially and maps emissions and removals more completely, leading to a more accurate modelling of
carbon fluxes from land and the resulting impact on the atmosphere. The regulation seeks thereby to
incentivize the optimization of land management, including forests in the EU. Overall, the legislation
results in a comprehensive coverage of emissions and removals from the LULUCF sector that Member
States are to comply with in 2025 and 20301.
Implications of LULUCF on forest disturbances
The LULUCF Regulation requires a big bundle of mandatory land accounting categories. Hence, for re-
ducing the uncertainties of GHG estimates (emission / removal) of managed forests and other land cover
categories as well as accurate emission factors need to be tracked with a high resolution spatial and
temporal mapping (Böttcher et al., 2019). The detection of phenology trends indicating the character-
istics of the vegetation growing season (under natural or anthropogenic conditions) can optimize the
estimation of the carbon sinks and emissions and support decision making for adequate climate mitiga-
tion and adaptation measures. As discussed in detail in section 2.1 above, research has shown that Sen-
tinel-2 data have a great potential to contribute to the detection of phenology trends and classification
of forest types due to the concurrent availability of multispectral bands with high spatial resolution and
quick revisit time. A study by Close et al. (2018) revealed that Sentinel-2 data can successfully be used
for mapping GHG emissions and removals associated with the Land Use, Land Use Change and Forestry
(LULUCF) while Rossi et al. (2019) completed the analysis from already available EO datasets (Figure 28).
To meet the current and future requirements for European Land Use / Land Cover (LU / LC) monitoring
and reporting obligations a 2nd generation Corine Land Cover (Corine Land Cover Plus - CLC+) is cur-
rently under development by the Copernicus Land Monitoring Service (CLMS). The product shall provide
1 Reported with a delay of two years, so 2027 and 2032.

Monitoring Forests Through Remote Sensing
Final Report
117
an increased spatial and temporal detail that can be combined with in-situ data in the future. Of partic-
ular importance is to separate land cover from land use information and to integrate attribute data on
landscape characteristics to create a data model that better fits to the real world.
With the LULUCF regulation calling for the use of higher tiered methodologies in the emissions and
removal calculations there is an expectation that Copernicus products and specifically a dedicated CLC+
instance on LULUCF can contribute to a higher accuracy of LULUCF accounts in Member States. Never-
theless, to be effective for greenhouse gas emission inventories this requires further harmonisation of
LULUCF categories and stratification by carbon stock type between Member States (EEA, 2019b).
The regulation addresses also the issue of natural (forest) disturbances and their impact on greenhouse
gas emissions2. It specifically clarifies that GHG emissions from natural disturbances, that are beyond
their control, have to be excluded from their accounts for afforested land and managed forest land
when they exceed the average emissions caused by natural disturbances from the period 2001 to 2020.
As demonstrated in section 2.1, high-resolution phenology data can help assess vegetation responses
to disturbances, e.g. droughts, wildfires, storms, insect infestations, and illegal logging. It can monitor
impacts on plant functional types such as forest stands. Moreover, through EFFIS and the Rapid Map-
ping component information on wildfire risks and events is already provided by the Copernicus Emer-
gency Management Service today (section 2.4.1).
Figure 28. Comparison of the EDGAR (Emission Database for Global Atmospheric Research) data with the corresponding UNFCC land cover areas for each EU country level as derived from the CCI Land Cover maps (Source: Rossi et al., 2019).
2 Reg. 2018/841 Recital (20): “…wildfires, insect and disease infestations, extreme weather events and geological disturbances that are beyond the control of, and not materially influenced by, a Member State, can result in greenhouse gas emissions of a temporary nature in the LULUCF sector, or cause the reversal of previous remov-als.”

Monitoring Forests Through Remote Sensing
Final Report
118
4. Recommendations for the Commission
It is widely accepted that humanity needs to halt and reverse increasing carbon concentrations in the
atmosphere and oceans. Forests play an important role in this endeavour and policies and management
strategies are needed (1) to sequester additional carbon in forests, (2) to reduce forest disturbances,
unsustainable use of forest resources as well as forest and land cover conversations to minimize carbon
emissions, while at the same time (3) maintaining the economic and social benefits of healthy forest
resources under climate change and increasingly volatile weather conditions. This challenge requires
coordinated actions and policies within Europe as well as internationally.
In this chapter, the potential role of Earth Observation (EO) data is forest disturbance monitoring sys-
tems is described. It includes specific recommendations regarding a number of important parameters:
• Satellite platforms and imagery required
• In-situ data to be provided
• Effective processing and analytical workflows
• Timeliness aspects
• Accuracies to be expected
• Data management requirements
• Validation requirements
• Ease / complexity of implementation and related costs
• Stakeholders to be involved
• Possible combination with existing European initiatives (e.g. Copernicus)
Remote sensing techniques offer tremendous yet widely untapped potential to inform forest-related
policies thanks to its complementary nature to traditional – field-based inventories – and its capacity to
observe any place on Earth at any desired temporal revisit frequency and at spatial resolutions well
adapted to specific tasks, ranging from sub-meter to kilo-metric resolutions.
The wealth of literature, and the many successful pilot studies, underline that robust and cost-efficient
monitoring solutions based on EO data for various disturbance types and geographies are readily avail-
able, and that the main bottleneck is the slow uptake by stakeholders and not the lack of suitable satel-
lite sensors or methods.
It is therefore recommended to better leverage the potential of EO (1) by integrating, not side-lining,
the traditional inventory approaches to create mutually beneficial synergies, (2) to design and imple-
ment a pan-European EO policy for state-of-the-art monitoring of European and global forest resources
with short lag-times and frequent updates, (3) to create a competitive and fair market for EO service
providers to feed a Forest Information System for Europe (FISE) integrating harmonised information
about forests and forest resources. A market-driven approach where EU and other stakeholders directly
order services seems the best way forward, embedded in the continued development and upgrading of
a pan-European EO data infrastructure with free data access. Avoiding counter-productive cronyism of
large national “champions” and established consortia, and reducing the administrative procedures and
heavy reporting, should allow to focus on the EO-derived information quality and support a more dy-
namic and responsive information ecosystem.
After decades of excellent satellites but counter-productive business models, Europe’s Copernicus pro-
gram, with its freely available EO data products, is an important step into the right direction, as exem-
plified by the increasing uptake of Copernicus services in the European Commission and the increasing

Monitoring Forests Through Remote Sensing
Final Report
119
usage of the datasets by researchers and companies. Thanks to its long-ranging funding scheme, Coper-
nicus provides the necessary long-term visibility for service providers and stakeholders dealing with for-
est disturbances. Such long-term visibility is a basic requirement for service developers to invest in la-
bour- and time-demanding development of forest monitoring tools.
To make the Copernicus program more effective it is recommended to better balance investments be-
tween space and ground segments and to ensure that the thematic programs are better balanced be-
tween climate and land communities. The climate crisis cannot be solved without putting more empha-
sis on the ground segment and especially the land / forest service sector. This is underlined through the
implementation of the EU Regulation for the Land Use, Land Use Change and Forestry sector, which
creates the legislative framework for emissions and removals from the land use and forest sector for
the period 2021-2030 and establishes for the first time a target for this sector.
Apart from commercial cloud providers such as AWS and GEE, the development of a truly global obser-
vation capacity of forest resources is currently still hindered by sub-optimal data access infrastructure
in Europe. Even after heavy funding, and after several years of “operation”, most of the established
DIASes still do not work as intended. It is not yet clear how the DIAS landscape will look like in the near
future. This creates unnecessary obstacles for service providers as it is highly unrealistic that a truly
cross-DIAS transferability of code will ever be achieved, and as it is still unclear under which business
model the DIASes will operate, which datasets will be stored where, and under which access restrictions
etc. It is recommended to clean as soon as possible the confusing DIAS landscape and to pave the way
for a federated European set of infrastructure and data providers.
The existing national monitoring and reporting initiatives are generally well adapted to regional partic-
ularities, but hinder cross-border comparability and standardization. As the sustainable management
and monitoring of forest resources are of European interest, a common EU forest policy is recom-
mended, which builds on existing national policies and experiences while ensuring convergence and
harmonization – successful examples are CORINE and LUCAS. Such convergence and harmonization ef-
forts including terminology, methods and procedures, should serve not only the reporting for the policy
makers but also the forestry sector stakeholders to be supported towards a sustainable forest manage-
ment.
A stronger role of EO in the five following European policies is recommended, leveraging the potential
of EO for policy development and the monitoring of the implementation of European policies in the field
of forest disturbances: (1) The European Green Deal, (2) The EU Forest Strategy, (3) The EU Biodiversity
Strategy, (4) The EU Rural Development Programme, and (5) The Regulation for the Land Use, Land Use
Change and Forestry sector (LULUCF).
Under the European Green Deal it is recommended to leverage the outstanding monitoring capacity of
the Copernicus program - in particular related to the optical Sentinel-2 satellites - for continuous mon-
itoring of forest conditions and disturbances. This should ideally be embedded in the envisaged strategy
to halt biodiversity loss and the desired protection of forest ecosystems as codified in the 2030 Biodi-
versity strategy of the European Commission. The preservation and restoration of ecosystems and bio-
diversity are at the core of the European Green Deal as healthy ecosystems mitigate natural disasters,
pests and diseases and help regulate the climate. The Commission has also called for a European legal
framework to foster deforestation-free supply chains, both internationally and within Europe. In the
same spirit, combatting illegal logging and a reduction of forest fires positively contribute to carbon
absorption and biodiversity protection. The literature review reveals that EO can provide a wealth of
cost-efficient and transparent monitoring, reporting and compliance measures. As forest resources and
non-forest ecosystems share many of the same set of disturbance drivers, the EO-backbone of such a

Monitoring Forests Through Remote Sensing
Final Report
120
monitoring system could be identical, while being flexible enough to be upgradable for serving ecosys-
tem-specific requirements.
The European Forest Strategy aims at coordinating and ensuring coherence of the forest-related poli-
cies. Priority is given to enhanced management of forests and natural disturbances like droughts, fires
and pests and to mitigate climate change. The importance of regularly updated and up-to-date forest
information is well recognized; information that could also positively contribute to the EU’s forestry
statistics and Integrated Environmental and Economic Accounting for Forests (IEEAF). In this context, it
is recommended to continue the establishment of a Forest Information System for Europe (FISE) inte-
grating harmonised information about forests and forest resources. This also includes the integration
of existing services such as the European Forest Fire Information System (EFFIS).
With respect to drought monitoring and management under the European Forest Strategy, the use of
coarse resolution time series from Sentinel-3, extended backwards by MODIS datasets and enhanced
by soil moisture information from Sentinel-1 and ASCAT, is recommended as droughts are meso-scale
phenomena that are best captured and managed at kilometric scale. To provide forest owners a means
to manage drought risk, the same datasets should be leveraged within index-based insurance schemes
specifically designed to drought management in forest ecosystems.
To address forest conversation towards better adapted species, it is recommended to leverage the high
spatial resolution and information-rich Sentinel-2 time series to identify vulnerable forest stands, which
should be prioritized given the externally provided site characteristics and predicted growing conditions.
As EO guarantees continuous, gap-free identifications of forest species independent from forest own-
ership, the detailed mapping of species distributions would enable stakeholders to design appropriate
policies for both private and public forests.
To reduce negative impacts by forest fires, an integrated risk forecasting and observation system is to
be established, where EO contributes to (i) the mapping of tree species and forest structures as proxies
for ignition risk and fire propagation, (ii) the timely detection of fires to minimize its impacts, and (iii)
the monitoring of forest regeneration after the disturbance event. It is recommended to derive the
species-related and structural information through high-resolution Sentinel-2 time series, possibly en-
hanced by detailed point-clouds from (airborne) Lidar sensors. The same sensors are also best suited to
monitor the regeneration phase, while the detection of forest fires is best handled using thermal im-
agery for example provided through Sentinel-3 and MODIS. The latter observation capacity is currently
not available at the necessary high spatial resolution and high revisit frequency needed to detect the
prevailing small-scale events within Europe but a new mission candidate operating in the thermal do-
main is currently considered as a future Sentinel mission.
The detection of forest pests and diseases at an early stage, mandatory to permit forest stakeholders to
prevent their spread across larger regions, is currently an active area of research. It is recommended to
further support those research efforts as the problem is severe. A suitable near-real-time detection
system is currently out of reach as current sensor technology does not permit to identify suitable spec-
tral fingerprints during the green-attack phase. While scheduled imaging spectrometers such as EnMap
would offer an excellent spectral resolution to identify subtle changes in the spectral characteristics of
forests, their spatial footprint is probably far too large to identify small nests of pests. The same holds
for the otherwise promising technology of fluorescence (e.g. FLEX mission). Drone-based solutions, on
the other hand, cannot be scaled-up to cover large areas in a cost-efficient way and the employed sen-
sors are mostly sub-par.
The monitoring of windthrow can in principle done efficiently using EO data, in particular if the affected
areas are not too small. However, currently no operational system has been developed. For a timely

Monitoring Forests Through Remote Sensing
Final Report
121
assessment of damages, a combination of optical and microwave data is recommended. After a first
detection of suspicious areas, commercial VHR satellites can be tasked to make more detailed assess-
ments. Such a combined analysis of free Copernicus data and commercial VHR data is probably more
cost-efficient compared to a sole use of the latter data source.
The European Biodiversity Strategy implicitly or explicitly addresses topics similar to what was described
above, e.g. the loss of ecosystems and ecosystem services. Our recommendations in this respect remain
unchanged. However, as compensation and offsetting schemes are a central part of the strategy, it is
additionally recommended to leverage the documentary value of EO datasets for compliance monitor-
ing and as a means to detect hot spots in a timely manner that require more detailed investigations.
The deployment of Sentinel-2 time series is recommended for such tasks.
The EU Regulation on support for Rural Development supports private and public forest owners to set-
up preventive measures against forest disturbances, respectively, to restore forests damaged through
fire and other natural hazards. It is recommended to integrate EO into the assessment of damages as
well as for the monitoring of restoration efforts. A huge potential is also seen in promoting market-
driven solutions for risk management (i.e. EO-based insurance solutions) which prevent the externalisa-
tion of costs while fostering the general uptake of EO-based insurance solutions in the forest sector. For
such a claim-based insurance, the use of Sentinel-2 data streams is recommended, potentially enhanced
by appropriate very high resolution (VHR) datasets.
The EU Regulation for the Land Use, Land Use Change and Forestry sector promotes the use of forests
as carbon sinks. Carbon balances have to be produced by all Member States, considering stocks from
existing forests and human-induced changes in land cover (e.g. conversion of forests to cropland) while
(at least partly) excluding emissions from disturbances beyond human control. It is recommended to
use combined time series from Sentinel-1 and Sentinel-2 to detect, map and account forests as well as
land cover conversions. The future Corine Land Cover Plus (CLC+) will be a potential source providing
the necessary data for that. This information should be combined with the above recommended ap-
proaches dealing with natural hazards in forests, to permit a separation between human-induced and
non-controllable land cover changes. To directly address the total carbon stock (C stock) changes in all
land carbon pools, it is recommended to generate in 5-year intervals incremental forest stock volume
changes based on machine learning techniques linking optical EO datasets against field inventory data.
The soil carbon pool under forest canopy cannot be observed remotely, though.
The impact and effectiveness of forest remote sensing in the light of the selected policies
All of the presented policies refer to forest disturbances. They are threats to European forests and cli-
mate change is expected to increase frequencies and intensities of natural disturbances (Seidl et al.,
2017). Increasing risk of forest fires and longer fire seasons are a consequence not only in the European
South (EEA, 2019c). Climate change also affects the occurrence of pests and diseases (EEA, 2017) and
storm damage is projected to increase by 15 % by 2100 (Gardiner et al., 2013).
The key to successful forest management is information. Remote sensing is a powerful tool to fill the
information gap because of its synoptic view and the possibility to monitor large areas. Part 1 of this
report reviews various remote sensing applications in different parts of the world. Forest remote sens-
ing services from Brazil, Canada and the US deliver operational applications especially in the fields of
fire monitoring and deforestation. In Europe, Copernicus provides all the necessary tools to produce the
required information on forest disturbances. It includes data from currently seven Sentinel satellites
and different sensors and six different services producing standardised datasets on regional, European
and global level integrating not only Sentinel satellite imagery but data from complementing sources.
Monitoring Forests Through Remote Sensing
Final Report
122
However, as published in July 2020 in Nature (Ceccherini et al., 2020), the EU-JRC researchers rather
analysed EO-derived information as provided by GEE using NASA satellite and US-developed algorithms
to assess the annual forest harvesting in the 28 EU countries. This study clearly illustrates the critical
role of EO to assess the EU policies impact by highlighting an unexpected increase of forest harvest for
the last few years in relation to the new EU bioeconomy policy, an increase of the harvested forest patch
sizes impacting negatively the biodiversity landscape, and the carbon impact in conflict with the EU
climate targets in the context of the Paris Agreement. Such analysis demonstrating the interest of wall-
to-wall mapping compared to classical inventory-based statistics (e.g. Eurostat, FAO) for analysing the
policies impact calls for an independent solution to monitor the EU forest using the Copernicus assets.
The Copernicus Emergency Management service (CEMS) offers products to support natural hazard pre-
vention, response and recovery. It is operational since April 2012 and serves primarily professional users
active in the field of risk and natural disaster management. The Copernicus EMS includes two service
components:
• CEMS mapping with Rapid Mapping (RM), Risk & Recovery Mapping (RRM) and its validation;
• The CEMS Early Warning and Monitoring for floods (EFAS), forest fires (EFFIS) and droughts
(DO).
The core of CEMS mapping is the timely provision of information generated from satellite or aerial im-
ages, sensor data and other reference data. The generated information includes digital maps, geodata
and reports. The RM is used to quickly support management activities immediately after or during dis-
aster events such as forest fires or floods. RRM differs from RM not only in the products but also in the
time component. The data products are used to support risk management activities that are not directly
related to the management of an emergency. In particular, they are used for prevention, preparedness
and reconstruction. In relation to forest disturbances, the RRM was for example activated to explore
the risk of forest fires in Ukraine, to evaluate storm damages in France and Slovenia, to evaluate the
post-forest fire restoration and reforestation activities in Spain or to support the design of preventive
wildfire measures in Germany, to name a few.
Besides the European Flood Early Warning System (EFAS), the Copernicus Early Warning and Monitoring
System includes the European Forest Fire Information System (EFFIS) providing relevant information for
the protection against forest fires in the EU and neighbouring countries. A third early warning service
for droughts has been in place since 2018.
The Copernicus Land Monitoring service (CLMS) provides information on land cover and land use
(LC/LU), corresponding changes and land cover characteristics on different scales. Of the different forest
products, the tree cover density product can be used to determine increase or decrease of forested
areas. However, due to its update rates of approximately three years and a spatial resolution of 100 m,
it is not suitable to monitor e.g. illegal logging.
A new CLMS phenology service is currently under development. It is expected to contribute to the LU-
LUCF reporting mechanism from 2021 onwards in view of the Climate Change mitigation measures.
Phenology trends, such as changes in the start, the end or the length of the vegetation growing season
as well as productivity trends will be useful for improved estimation of the carbon uptake and as a plan-
ning tool for climate mitigation and adaptation measures. From an end-user perspective, the high-res-
olution phenology data will allow for a much more detailed assessment of vegetation responses to dis-
turbances, e.g. droughts, storms, insect infestations, and human influence. It will be possible to monitor
impacts on plant functional types, like agricultural fields or forest stands. Productivity metrics linked to
the growing season will enable mapping and assessing some aspects of land degradation.

Monitoring Forests Through Remote Sensing
Final Report
123
Copernicus provides professionally organised services offering standardised products of high quality.
Nevertheless, shortcomings exist which are mainly related to system-specific characteristics of satellite
missions and to the structure of the services. Indeed the consistency across services and their associated
products is hardly investigated by the producers. The CLMS Copernicus High Resolution Layer corre-
sponding to forest which could not match the CEMS EFFIS and Drought information. The ambition of a
Forest Information System for Europe shall probably focus on the harmonization, the consolidation and
the integration of the EO-derived forest information as provided by Copernicus services. Such a system
would become the geoportal serving the most up-to-date information about the European forest and
forest resources.
Compatibility, interoperability and consistency between EO-derived information is never a given for
many (technical) reasons such as differences in orbits and instrumentation. Hence, to map an event
continuously (e.g. a daily wildfire assessment), data from various satellite missions often have to be
considered for the analysis, which is challenging. A straightforward solution could be to simply double
the number of Sentinel-2 and Sentinel-1 satellites in orbit. Indeed, due to the twin missions of Sentinel-
2A and 2B as well as 1A and 1B, a relatively high temporal coverage can already be achieved by the
Sentinel satellites over Europe. With respect to Sentinel-2, current attempts by ESA to launch 2C and
2D are fully supported as this would bring the revisit time for most locations down to 2-3 days.
As imagery of optical satellite systems are affected by clouds, radar systems (Synthetic Aperture Radar
– SAR), such as the Sentinel-1, can play a complementary role in forest monitoring systems. Radar sen-
sors are independent of the weather, since they operate in wavelength ranges where the atmosphere
is transparent. On the other hand, imagery provided by active sensors is generally extremely noisy and
cannot be applied in mountainous regions. The signal has also not the rich information content provided
by optical sensors and usually consists only of one band recorded in several polarisations. Often, the
recoded backscatter coefficient defies interpretation and shows spatial and temporal variations that
cannot be unambiguously attributed to a clear cause. For these reasons it is recommended that the
backbone of a forest monitoring system should be based on optical imagery, complemented were ap-
propriate by microwave data.
The above discussed sensor characteristics influence the feasibility of remote sensing applications and
services have to be developed accordingly. To give an example, slow and rapid onset disasters have
different demands in relation to the timely provision of imagery. While droughts are usually monitored
over longer time periods and larger regions, sudden events such as storms require a fast provision of
information usually for smaller areas. For monitoring larger regions medium resolution imagery is fea-
sible.
In comparison, to identify selective logging or storm damages to small patches of trees, very high-reso-
lution imagery is necessary. Wildfires should be detected as quickly as possible in their active phase,
while less frequent updates are required during the recovery phase. Meteorological satellites such as
Meteosat are geostationary and deliver updated images every 15 minutes. However, they have low
spatial resolution. Their very high temporal resolution can be used to detect larger wildfire hotspots
quickly because the satellites are equipped with the necessary infrared sensors. It is difficult though to
map the burned areas in detail with this kind of satellites.

Monitoring Forests Through Remote Sensing
Final Report
124
Besides the EO-system related shortcomings, there are options for improving Copernicus workflows and
extending the product portfolio for forest related issues and harmonizing them in an information sys-
tem.
1. A temporal improvement of the CEMS could be achieved through more automated processing
chains considering for example early warning systems. In case of flood events, EFAS forecasts
are considered to task the acquisition of VHR satellite imagery from commercial providers. Even
though it is challenging to predict which forest could be affected from a storm a close monitor-
ing of extreme weather event forecasts could speed up the provision of information. Moreover,
a combined monitoring of lightning in combination with hotspots from meteorological satellites
and detailed information about the forest (structure) could support the early detection of wild-
fires.
2. EFFIS provides a wide range of information applying fully automated data processing chains. It
should be evaluated if some of the underlying datasets such as the European fuel map should
be regularly updated. The land cover is constantly changing through construction and natural
disturbances. A regular update could be therefore be considered.
3. Smoke from wildfires can be a major source of air pollution. To assess the resulting emissions is
highly relevant for climate change. Nevertheless, the fine particles in the smoke can be a serious
risk to health. Because smoke may be carried thousands of kilometres downwind, distant loca-
tions can be affected almost as severely as areas close to the fire. Smoke forecast maps could
therefore be useful.
4. Forest fragmentation jeopardises the provision of many ecosystem services and the resilience
of habitats. Forest edges are exposed to pest invasions (Guo et al., 2018) and due to microcli-
matic changes droughts and subsequently fires become more likely. Even without EU-wide tar-
gets to limit fragmentation the biodiversity strategy includes the objective to restore at least 15
% of degraded ecosystems by 2020. Monitoring Europe's forest fragmentation regularly could
become a standard product making use of existing Copernicus HRL Forest products.
5. Insect infestations have to be detected quickly to limit their spread and reduce the economic
damage. However, the initial green attack stage is very difficult to detect or not detectable with
most of the sensors. It requires further research using e.g. hyperspectral imagery to detect dis-
ease outbreaks.
6. The EU Timber Regulation (Regulation (EU) No 995/2010) prohibits the placing of illegally har-
vested timber and products derived from such timber on the EU market. However, illegal log-
ging is increasingly reported in Europe (EEA, 2019a). A systematic monitoring of illegal logging
in Europe is therefore required. Because field surveys are costly and even dangerous, remote
sensing would be an ideal tool to achieve this.
Forest disturbances have an impact on the ecosystem services of the forests. Remote sensing provides
powerful tools for their monitoring and can be used to generate up-to-date information for sustainable
forest management. The European Copernicus program provides the data for the required services
which could become important contributions to the Forest Information System strengthening the
knowledge base about European forests.

Monitoring Forests Through Remote Sensing
Final Report
125
5. References
Abdel-Rahman, E.M., Mutanga, O., Adam, E., Ismail, R., 2014. Detecting Sirex noctilio grey-attacked and lightning-struck pine trees using airborne hyperspectral data, random forest and support vec-tor machines classifiers. ISPRS J of Photogrammetry and Remote Sensing 88, 48–59. https://doi.org/10.1016/j.isprsjprs.2013.11.013
Abdullah, H., Darvishzadeh, R., Skidmore, A.K., Groen, T.A., Heurich, M., 2018. European spruce bark beetle (Ips typographus, L.) green attack affects foliar reflectance and biochemical properties. Int J Appl Earth Obs Geoinf 64, 199–209. https://doi.org/10.1016/j.jag.2017.09.009
Abdullah, H., Skidmore, A.K., Darvishzadeh, R., Heurich, M., 2019. Sentinel-2 accurately maps green-attack stage of European spruce bark beetle (Ips typographus, L.) compared with Landsat-8. Re-mote Sens Ecol Conserv 5, 87–106. https://doi.org/10.1002/rse2.93
Achard, F., Beuchle, R., Mayaux, P., Stibig, H., Bodart, C., Brink, A., Carboni, S., Desclée, B., Donnay, F., Eva, H.D., Lupi, A., Raši, R., Seliger, R., Simonetti, D., 2014. Determination of tropical deforesta-tion rates and related carbon losses from 1990 to 2010. Glob Change Biol 20, 2540–2554. https://doi.org/10.1111/gcb.12605
Ackermann, J., 2018. Erfahrungen bei der Erfassung von Sturmschäden durch unterschiedliche Senso-ren und den Einsatz des Copernicus EMS [WWW Document]. URL https://www.d-coperni-cus.de/fileadmin/Content/pdf/Forum_2018/copernicus_sturmschaeden_friedrike_acker-mann.pdf (accessed 6.4.20).
Ahern, F.J., 1988. The effects of bark beetle stress on the foliar spectral reflectance of lodgepole pine. Int J Remote Sens 9, 1451–1468. https://doi.org/10.1080/01431168808954952
Albrecht, A., Almehasneh, A., 2018. Sturmgefährdungskarten für Baden-Württembergs Wälder als Grundlage für mittel- und langfristige Planungen [WWW Document]. URL http://fachdoku-mente.lubw.baden-wuerttemberg.de/servlet/is/127423/U82-W03-N21.pdf?command=down-loadContent&filename=U82-W03-N21.pdf (accessed 6.4.20).
Almeida, C., Mourão, M., Dessay, N., Lacques, A.-E., Monteiro, A., Durieux, L., Venturieri, A., Seyler, F., 2016. Typologies and Spatialization of Agricultural Production Systems in Rondônia, Brazil: Linking Land Use, Socioeconomics and Territorial Configuration. Land 5, 18. https://doi.org/10.3390/land5020018
Almeida, D.R.A., Stark, S.C., Chazdon, R., Nelson, B.W., Cesar, R.G., Meli, P., Gorgens, E.B., Duarte, M.M., Valbuena, R., Moreno, V.S., Mendes, A.F., Amazonas, N., Gonçalves, N.B., Silva, C.A., Schietti, J., Brancalion, P.H.S., 2019. The effectiveness of lidar remote sensing for monitoring for-est cover attributes and landscape restoration. Forest Ecology and Management 438, 34–43. https://doi.org/10.1016/j.foreco.2019.02.002
Altwater, S., Görlach, B., Osberghaus, D., McCallum, S., Dworak, T., Klostermann, J., van de Sandt, K. van de, Tröltzsch, J., Frelih Larsen, A., 2011. Recommendations on priority measures for EU policy mainstreaming on adaptation – task 3 report. Ecologic Institute, Berlin.
Anderegg, W.R.L., Flint, A., Huang, C., Flint, L., Berry, J.A., Davis, F.W., Sperry, J.S., Field, C.B., 2015. Tree mortality predicted from drought-induced vascular damage. Nature Geoscience 8, 367–371. https://doi.org/10.1038/ngeo2400
Anderson, L.O., Aragão, L.E.O. e C. de, Lima, A. de, Shimabukuro, Y.E., 2005. Detecção de cicatrizes de áreas queimadas baseada no modelo linear de mistura espectral e imagens índice de vegetação utilizando dados multitemporais do sensor MODIS/TERRA no estado do Mato Grosso, Amazônia brasileira. Acta Amaz. 35, 445–456. https://doi.org/10.1590/S0044-59672005000400009
Monitoring Forests Through Remote Sensing
Final Report
126
Anderson, L.O., Aragão, L.E.O.C., Gloor, M., Arai, E., Adami, M., Saatchi, S.S., Malhi, Y., Shimabukuro, Y.E., Barlow, J., Berenguer, E., Duarte, V., 2015. Disentangling the contribution of multiple land covers to fire-mediated carbon emissions in Amazonia during the 2010 drought: DROUGHT, FIRE, AND C EMISSION IN AMAZONIA. Global Biogeochem. Cycles 29, 1739–1753. https://doi.org/10.1002/2014GB005008
Anderson, L.O., Malhi, Y., Aragão, L.E.O.C., Ladle, R., Arai, E., Barbier, N., Phillips, O., 2010. Remote sensing detection of droughts in Amazonian forest canopies. New Phytologist 733–750. https://doi.org/10.1111/[email protected]/(ISSN)1469-8137(CAT)FeatureIs-sues(VI)Amazonianrainforestsanddrought
Anderson, M., Neale, C., Li, F., Norman, J., Kustas, W., Jayanthi, H., Chavez, J., 2004. Upscaling ground observations of vegetation water content, canopy height, and leaf area index during SMEX02 us-ing aircraft and Landsat imagery. Remote Sens Environ 92, 447–464. https://doi.org/10.1016/j.rse.2004.03.019
Aragão, L.E.O.C., Malhi, Y., Barbier, N., Lima, A., Shimabukuro, Y., Anderson, L., Saatchi, S., 2008. In-teractions between rainfall, deforestation and fires during recent years in the Brazilian Amazonia. Phil. Trans. R. Soc. B 363, 1779–1785. https://doi.org/10.1098/rstb.2007.0026
Aragão, L.E.O.C., Poulter, B., Barlow, J.B., Anderson, L.O., Malhi, Y., Saatchi, S., Phillips, O.L., Gloor, E., 2014. Environmental change and the carbon balance of Amazonian forests: Environmental change in Amazonia. Biol Rev 89, 913–931. https://doi.org/10.1111/brv.12088
Asner, G.P., Alencar, A., 2010. Drought impacts on the Amazon forest: the remote sensing perspec-tive. New Phytologist 569–578. https://doi.org/10.1111/[email protected]/(ISSN)1469-8137(CAT)FeatureIssues(VI)Amazonianrainforestsand-drought
Asner, G.P., Brodrick, P.G., Anderson, C.B., Vaughn, N., Knapp, D.E., Martin, R.E., 2016. Progressive forest canopy water loss during the 2012–2015 California drought. PNAS 113, E249–E255. https://doi.org/10.1073/pnas.1523397113
Asner, G.P., Keller, M., Pereira, R., Zweede, J.C., 2002. Remote sensing of selective logging in Amazo-nia: Assessing limitations based on detailed field observations, Landsat ETM+, and textural analy-sis. Remote Sens Environ 80, 483–496. https://doi.org/10.1016/S0034-4257(01)00326-1
Asner, G. P., Knapp, D.E., Balaji, A., Paez-Acosta, G., 2009. Automated mapping of tropical deforesta-tion and forest degradation: CLASlite. J Appl Remote Sens 3, 033543. https://doi.org/10.1117/1.3223675
Asner, G.P., Knapp, D.E., Broadbent, E.N., Oliveira, P.J.C., Keller, M., Silva, J.N., 2005. Selective Log-ging in the Brazilian Amazon. Science 310, 480–482. https://doi.org/10.1126/science.1118051
Asner, Gregory P., Martin, R.E., Ford, A.J., Metcalfe, D.J., Liddell, M.J., 2009. Leaf chemical and spec-tral diversity in Australian tropical forests. Ecological Applications 19, 236–253. https://doi.org/10.1890/08-0023.1
Asner, G.P., Nepstad, D., Cardinot, G., Ray, D., 2004. Drought stress and carbon uptake in an Amazon forest measured with spaceborne imaging spectroscopy. PNAS 101, 6039–6044. https://doi.org/10.1073/pnas.0400168101
Assal, T.J., Sibold, J., Reich, R., 2014. Modeling a Historical Mountain Pine Beetle Outbreak Using Landsat MSS and Multiple Lines of Evidence. Remote Sens Environ 155, 275–288. https://doi.org/10.1016/j.rse.2014.09.002

Monitoring Forests Through Remote Sensing
Final Report
127
Atkinson, P.M., Jeganathan, C., Dash, J., Atzberger, C., 2012. Inter-comparison of four models for smoothing satellite sensor time-series data to estimate vegetation phenology. Remote Sens Envi-ron 123, 400–417. https://doi.org/10.1016/j.rse.2012.04.001
Atzberger, C., Eilers, P.H.C., 2011a. A time series for monitoring vegetation activity and phenology at 10-daily time steps covering large parts of South America. Int J Digit Earth 4, 365–386.
Atzberger, C., Eilers, P.H.C., 2011b. Evaluating the effectiveness of smoothing algorithms in the ab-sence of ground reference measurements. Int J Remote Sens 32, 3689–3709.
Atzberger, C., Klisch, A., Mattiuzzi, M., Vuolo, F., 2014. Phenological Metrics Derived over the Euro-pean Continent from NDVI3g Data and MODIS Time Series. Remote Sens 6, 257–284. https://doi.org/10.3390/rs6010257
Babst, F., Esper, J., Parlow, E., 2010. Landsat TM/ETM+ and tree-ring based assessment of spatiotem-poral patterns of the autumnal moth (Epirrita autumnata) in northernmost Fennoscandia. Remote Sens Environ 114, 637–646. https://doi.org/10.1016/j.rse.2009.11.005
Barbosa, P.M., Grégoire, J.-M., Pereira, J.M.C., 1999. An Algorithm for Extracting Burned Areas from Time Series of AVHRR GAC Data Applied at a Continental Scale. Remote Sens Environ 69, 253–263. https://doi.org/10.1016/S0034-4257(99)00026-7
Barlow, J., Lennox, G.D., Ferreira, J., Berenguer, E., Lees, A.C., Nally, R.M., Thomson, J.R., Ferraz, S.F. de B., Louzada, J., Oliveira, V.H.F., Parry, L., Ribeiro de Castro Solar, R., Vieira, I.C.G., Aragão, L.E.O.C., Begotti, R.A., Braga, R.F., Cardoso, T.M., Jr, R.C. de O., Souza Jr, C.M., Moura, N.G., Nunes, S.S., Siqueira, J.V., Pardini, R., Silveira, J.M., Vaz-de-Mello, F.Z., Veiga, R.C.S., Venturieri, A., Gardner, T.A., 2016. Anthropogenic disturbance in tropical forests can double biodiversity loss from deforestation. Nature 535, 144–147. https://doi.org/10.1038/nature18326
Barmpoutis, P., Stathaki, T., Kamperidou, V., 2019. Monitoring of Trees’ Health Condition Using a UAV Equipped with Low-cost Digital Camera, in: ICASSP 2019 - 2019 IEEE International Conference on Acoustics, Speech and Signal Processing (ICASSP). Presented at the ICASSP 2019 - 2019 IEEE In-ternational Conference on Acoustics, Speech and Signal Processing (ICASSP), pp. 8291–8295. https://doi.org/10.1109/ICASSP.2019.8683128
Bartholomé, E., Belward, A.S., 2005. GLC2000: a new approach to global land cover mapping from Earth observation data. Int J Remote Sens 26, 1959–1977. https://doi.org/10.1080/01431160412331291297
Baumann, M., 2013. Forests through the Eye of a Satellite: Understanding regional forest-cover dy-namics using Landsat Imagery. University of Wisconsin-Madison, Madison, Wis.
Beck, P.S.A., Atzberger, C., Høgda, K.A., Johansen, B., Skidmore, A.K., 2006. Improved monitoring of vegetation dynamics at very high latitudes: A new method using MODIS NDVI. Remote Sens Envi-ron 100, 321–334.
Bell, D.M., Cohen, W.B., Reilly, M., Yang, Z., 2018. Visual interpretation and time series modeling of Landsat imagery highlight drought’s role in forest canopy declines. Ecosphere 9, e02195. https://doi.org/10.1002/ecs2.2195
Bentz, B.J., Régnière, J., Fettig, C.J., Hansen, E.M., Hayes, J.L., Hicke, J.A., Kelsey, R.G., Negrón, J.F., Seybold, S.J., 2010. Climate Change and Bark Beetles of the Western United States and Canada: Direct and Indirect Effects. BioScience 60, 602–613. https://doi.org/10.1525/bio.2010.60.8.6
Betancourt, J.L., Schwartz, M.D., Breshears, D.D., Cayan, D.R., Dettinger, M.D., Inouye, D.W., Post, E., Reed, B.C., 2005. Implementing a U.S. National Phenology Network. Eos, Transactions American Geophysical Union 86, 539–539. https://doi.org/10.1029/2005EO510005

Monitoring Forests Through Remote Sensing
Final Report
128
Beudert, B., Bässler, C., Thorn, S., Noss, R., Schröder, B., Dieffenbach-Fries, H., Foullois, N., Müller, J., 2015. Bark Beetles Increase Biodiversity While Maintaining Drinking Water Quality. Conservation Letters 8, 272–281. https://doi.org/10.1111/conl.12153
Bhandari, S., Phinn, S., Gill, T., 2012. Preparing Landsat Image Time Series (LITS) for Monitoring Changes in Vegetation Phenology in Queensland, Australia. Remote Sens 4, 1856–1886. https://doi.org/10.3390/rs4061856
Biedermann, P.H.W., Müller, J., Grégoire, J.-C., Gruppe, A., Hagge, J., Hammerbacher, A., Hofstetter, R.W., Kandasamy, D., Kolarik, M., Kostovcik, M., Krokene, P., Sallé, A., Six, D.L., Turrini, T., Vanderpool, D., Wingfield, M.J., Bässler, C., 2019. Bark Beetle Population Dynamics in the Anthro-pocene: Challenges and Solutions. Trends in Ecology & Evolution 34, 914–924. https://doi.org/10.1016/j.tree.2019.06.002
BMEL, 2015. Surveying the forest - Bundeswaldinventur. BMEL, Bonn.
Bone, C., Wulder, M.A., White, J.C., Robertson, C., Nelson, T.A., 2013. A GIS-based risk rating of forest insect outbreaks using aerial overview surveys and the local Moran’s I statistic. Applied Geogra-phy 40, 161–170. https://doi.org/10.1016/j.apgeog.2013.02.011
Böttcher, H., Zell-Ziegler, C., Herold, A., Siemons, A., 2019. EU LULUCF Regulation explained - Sum-mary of core provisions and expected effects. Institute for Applied Ecology, Berlin.
Bourgoin, C., Blanc, L., Bailly, J.-S., Cornu, G., Berenguer, E., Oszwald, J., Tritsch, I., Laurent, F., Hasan, A.F., Sist, P., Gond, V., 2018. The Potential of Multisource Remote Sensing for Mapping the Bio-mass of a Degraded Amazonian Forest. Forests 9, 303. https://doi.org/10.3390/f9060303
Bright, B.C., Hicke, J.A., Meddens, A.J.H., 2013. Effects of bark beetle-caused tree mortality on bioge-ochemical and biogeophysical MODIS products. Journal of Geophysical Research: Biogeosciences 118, 974–982. https://doi.org/10.1002/jgrg.20078
Broadbent, E.N., Zarin, D.J., Asner, G.P., Peña-Claros, M., Cooper, A., Littell, R., 2006. Recovery of for-est structure and spectral properties after selective logging in lowland Bolivia. Ecol Appl 16, 1148–1163. https://doi.org/10.1890/1051-0761(2006)016[1148:rofsas]2.0.co;2
Buitenwerf, R., Rose, L., Higgins, S.I., 2015. Three decades of multi-dimensional change in global leaf phenology. Nature Clim Change 5, 364–368. https://doi.org/10.1038/nclimate2533
Burivalova, Z., Bauert, M.R., Hassold, S., Fatroandrianjafinonjasolomiovazo, N.T., Koh, L.P., 2015. Rel-evance of Global Forest Change Data Set to Local Conservation: Case Study of Forest Degradation in Masoala National Park, Madagascar. Biotropica 47, 267–274. https://doi.org/10.1111/btp.12194
Busetto, L., Colombo, R., Migliavacca, M., Cremonese, E., Meroni, M., Galvagno, M., Rossini, M., Si-niscalco, C., Cella, U.M.D., Pari, E., 2010. Remote sensing of larch phenological cycle and analysis of relationships with climate in the Alpine region. Glob Change Biol 16, 2504–2517. https://doi.org/10.1111/j.1365-2486.2010.02189.x
Cai, Z., Jönsson, P., Jin, H., Eklundh, L., 2017. Performance of Smoothing Methods for Reconstructing NDVI Time-Series and Estimating Vegetation Phenology from MODIS Data. Remote Sens 9, 1271. https://doi.org/10.3390/rs9121271
Calders, K., Schenkels, T., Bartholomeus, H., Armston, J., Verbesselt, J., Herold, M., 2015. Monitoring spring phenology with high temporal resolution terrestrial LiDAR measurements. Agricultural and Forest Meteorology 203, 158–168. https://doi.org/10.1016/j.agrformet.2015.01.009
Monitoring Forests Through Remote Sensing
Final Report
129
Campos-Taberner, M., Moreno-Martínez, Á., García-Haro, F.J., Camps-Valls, G., Robinson, N.P., Kattge, J., Running, S.W., 2018. Global Estimation of Biophysical Variables from Google Earth En-gine Platform. Remote Sensing 10, 1167. https://doi.org/10.3390/rs10081167
Cao, K., Tan, W., Li, Xinwu, Xu, W., Huang, P., Fu, W., Liang, L., Li, Xiujuan, Peng, X., 2019. Monitoring Broadleaf Forest Pest Based on L-Band SAR Tomography. IOP Conf. Ser.: Earth Environ. Sci. 237, 052004. https://doi.org/10.1088/1755-1315/237/5/052004
Carter, G.A., Knapp, A.K., 2001. Leaf optical properties in higher plants: Linking spectral characteris-tics to stress and chlorophyll concentration. Am. J. Bot. 88, 677–684. https://doi.org/10.2307/2657068
Carter, G.A., Seal, M.R., Haley, T., 1998. Airborne detection of southern pine beetle damage using key spectral bands. Can J For Res 28, 1040–1045. https://doi.org/10.1139/x98-079
Ceccherini, G., Duveiller, G., Grassi, G., Lemoine, G., Avitabile, V., Pilli, R., Cescatti, A., 2020. Abrupt increase in harvested forest area over Europe after 2015. Nature 583, 72–77. https://doi.org/10.1038/s41586-020-2438-y
Chatham House The Royal Institute of International Affairs, 2019. Illegal Logging [WWW Document]. Illegal Logging Portal - Countries. URL https://www.illegal-logging.info/ (accessed 3.26.19).
Chehata, N., Orny, C., Boukir, S., Guyon, D., Wigneron, J.P., 2014. Object-based change detection in wind storm-damaged forest using high-resolution multispectral images. Int J Remote Sens 35, 4758–4777. https://doi.org/10.1080/01431161.2014.930199
Chen, Jun, Chen, Jin, Liao, A., Cao, X., Chen, L., Chen, X., He, C., Han, G., Peng, S., Lu, M., Zhang, W., Tong, X., Mills, J., 2015. Global land cover mapping at 30m resolution: A POK-based operational approach. ISPRS J Photogramm Remote Sens 103, 7–27. https://doi.org/10.1016/j.is-prsjprs.2014.09.002
Cheng, T., Rivard, B., Sánchez-Azofeifa, G.A., Feng, J., Calvo-Polanco, M., 2010. Continuous wavelet analysis for the detection of green attack damage due to mountain pine beetle infestation. Re-mote Sens Environ 114, 899–910. https://doi.org/10.1016/j.rse.2009.12.005
Cheung, H.-F., Pan, J., Gu, Y., Wang, Z., 2013. Remote-sensing observation of ocean responses to Ty-phoon Lupit in the northwest Pacific. Int J Remote Sens 34, 1478–1491. https://doi.org/10.1080/01431161.2012.721940
Chmielewski, F.-M., Heider, S., Moryson, S., Bruns, E., 2013. International Phenological Observation Networks: Concept of IPG and GPM, in: Schwartz, M.D. (Ed.), Phenology: An Integrative Environ-mental Science. Springer Netherlands, Dordrecht, pp. 137–153. https://doi.org/10.1007/978-94-007-6925-0_8
Chuvieco, E., Aguado, I., Cocero, D., Riaño, D., 2003. Design of an empirical index to estimate fuel moisture content from NOAA-AVHRR images in forest fire danger studies. Int J Remote Sens 24, 1621–1637. https://doi.org/10.1080/01431160210144660b
Chuvieco, E., Cocero, D., Riaño, D., Martin, P., Martınez-Vega, J., de la Riva, J., Pérez, F., 2004. Com-bining NDVI and surface temperature for the estimation of live fuel moisture content in forest fire danger rating. Remote Sens Environ 92, 322–331. https://doi.org/10.1016/j.rse.2004.01.019
Clerici, N., Weissteiner, C., Halabuk, A., Hazeu, G.W., Roerink, G., Mücher, S., 2012. Phenology re-lated measures and indicators at varying spatial scales : investigation of phenology information for forest classification using SPOT VGT and MODIS NDVI data (No. 2259), AlterraReport. Wa-geningen.

Monitoring Forests Through Remote Sensing
Final Report
130
Close, O., Benjamin, B., Petit, S., Fripiat, X., Hallot, E., 2018. Use of Sentinel-2 and LUCAS Database for the Inventory of Land Use, Land Use Change, and Forestry in Wallonia, Belgium. Land 7, 154. https://doi.org/10.3390/land7040154
Cohen, W.B., Yang, Z., Stehman, S.V., Schroeder, T.A., Bell, D.M., Masek, J.G., Huang, C., Meigs, G.W., 2016. Forest disturbance across the conterminous United States from 1985–2012: The emerging dominance of forest decline. Forest Ecology and Management, Special Section: Forest Manage-ment for Climate Change 360, 242–252. https://doi.org/10.1016/j.foreco.2015.10.042
Committee on Earth Observation Satellites, Space Data Coordination Group, 2018. Satellite Data in support of the Global Forest Observations Initiative (GFOI) Research & Development (R&D) Activi-ties SDCG Element 3.
Coops, N., Stanford, M., Old, K., Dudzinski, M., Culvenor, D., Stone, C., 2003. Assessment of Dothistroma Needle Blight of Pinus radiata Using Airborne Hyperspectral Imagery. Phytopathol-ogy 93, 1524–1532. https://doi.org/10.1094/PHYTO.2003.93.12.1524
Coops, N.C., Johnson, M., Wulder, M.A., White, J.C., 2006. Assessment of QuickBird high spatial reso-lution imagery to detect red attack damage due to mountain pine beetle infestation. Remote Sens Environ 103, 67–80. https://doi.org/16/j.rse.2006.03.012
Copernicus Programme, 2019. Copernicus Land Monitoring Service product portfolio overview [WWW Document]. Copernicus Land Monitoring Service. URL https://land.copernicus.eu/prod-uct-portfolio/overview/copy2_of_product-portfolio-overview (accessed 4.8.19).
Corona, P., Chirici, G., McRoberts, R.E., Winter, S., Barbati, A., 2011. Contribution of large-scale forest inventories to biodiversity assessment and monitoring. For Ecol Manage 262, 2061–2069.
Coulson, R.N., Amman, G.D., Dahlsten, D.L., DeMars Jr, C.J., Stephen, F.M., 1985. Forest-bark beetle interactions: bark beetle population dynamics, in: Waters, W.E., Stark, R.W., Wood, D.L. (Eds.), Integrated Pest Management in Pine-Bark Beetle Ecosystems. John Wiley & Sons, New York, pp. 61–80.
Csillik, O., Kumar, P., Asner, G.P., 2020. Challenges in Estimating Tropical Forest Canopy Height from Planet Dove Imagery. Remote Sensing 12, 1160. https://doi.org/10.3390/rs12071160
d’Oliveira, M.V.N., Reutebuch, S.E., McGaughey, R.J., Andersen, H.-E., 2012. Estimating forest bio-mass and identifying low-intensity logging areas using airborne scanning lidar in Antimary State Forest, Acre State, Western Brazilian Amazon. Remote Sens Environ 124, 479–491. https://doi.org/10.1016/j.rse.2012.05.014
Dash, J.P., Pearse, G.D., Watt, M.S., 2018. UAV Multispectral Imagery Can Complement Satellite Data for Monitoring Forest Health. Remote Sens 10, 1216. https://doi.org/10.3390/rs10081216
Dash, J.P., Watt, M.S., Pearse, G.D., Heaphy, M., Dungey, H.S., 2017. Assessing very high resolution UAV imagery for monitoring forest health during a simulated disease outbreak. ISPRS J Photo-gramm Remote Sens 131, 1–14. https://doi.org/10.1016/j.isprsjprs.2017.07.007
Davidson, E.A., de Araújo, A.C., Artaxo, P., Balch, J.K., Brown, I.F., C. Bustamante, M.M., Coe, M.T., DeFries, R.S., Keller, M., Longo, M., Munger, J.W., Schroeder, W., Soares-Filho, B.S., Souza, C.M., Wofsy, S.C., 2012. The Amazon basin in transition. Nature 481, 321–328. https://doi.org/10.1038/nature10717
de Beurs, K.M., Henebry, G.M., 2010. Spatio-Temporal Statistical Methods for Modelling Land Sur-face Phenology, in: Hudson, I.L., Keatley, M.R. (Eds.), Phenological Research: Methods for Environ-mental and Climate Change Analysis. Springer Netherlands, Dordrecht, pp. 177–208. https://doi.org/10.1007/978-90-481-3335-2_9
Monitoring Forests Through Remote Sensing
Final Report
131
de Gea, J., 2018. Phenology of Vegetation Light-Use Efficiency and Reflectance: Experiment over Two Boreal Ecosystem. Mc Gill University, Montreal.
de Sá, N.C., Castro, P., Carvalho, S., Marchante, E., López-Núñez, F.A., Marchante, H., 2018. Mapping the Flowering of an Invasive Plant Using Unmanned Aerial Vehicles: Is There Potential for Biocon-trol Monitoring? Front Plant Sci 9. https://doi.org/10.3389/fpls.2018.00293
de Wasseige, C., Defourny, P., 2004. Remote sensing of selective logging impact for tropical forest management. Forest Ecology and Management 188, 161–173. https://doi.org/10.1016/j.foreco.2003.07.035
Delbart, N., 2005. Télédétection de la phénologie dans les régions boréales (These de doctorat). Tou-louse 3.
Delbart, N., Kergoat, L., Le Toan, T., Lhermitte, J., Picard, G., 2005. Determination of phenological dates in boreal regions using normalized difference water index. Remote Sens Environ 97, 26–38. https://doi.org/10.1016/j.rse.2005.03.011
Dennison, P.E., 2006. Fire detection in imaging spectrometer data using atmospheric carbon dioxide absorption. Int J Remote Sens 27, 3049–3055. https://doi.org/10.1080/01431160600660871
Desclée, B., Bogaert, P., Defourny, P., 2006. Forest change detection by statistical object-based method. Remote Sens Environ 102, 1–11. https://doi.org/10.1016/j.rse.2006.01.013
Deshayes, M., Guyon, D., Jeanjean, H., Stach, N., Jolly, A., Hagolle, O., 2006. The contribution of re-mote sensing to the assessment of drought effects in forest ecosystems. Annals of forest science 63, 579–595.
Dugarsuren, N., Lin, C., 2016. Temporal variations in phenological events of forests, grasslands and desert steppe ecosystems in Mongolia: a remote sensing approach. Annals of Forest Research 59, 175–190. https://doi.org/10.15287/afr.2016.400
Dye, M., Mutanga, O., Ismail, R., 2008. Detecting the severity of woodwasp, Sirex noctilio, infestation in a pine plantation in KwaZulu-Natal, South Africa, using texture measures calculated from high spatial resolution imagery. afen 16, 263–275. https://doi.org/10.4001/1021-3589-16.2.263
Earl, N., Simmonds, I., 2018. Spatial and Temporal Variability and Trends in 2001–2016 Global Fire Activity. J. Geophys. Res. Atmos. 123, 2524–2536. https://doi.org/10.1002/2017JD027749
EEA, 2019a. The European environment: state and outlook 2020 : knowledge for transition to a sus-tainable Europe. European Environment Agency, Luxembourg.
EEA, 2019b. Workshop summary -Using Copernicus Land Monitoring Service (CLMS) to support the land use, land use change and forestry (LULUCF) regulation (File). Brussel.
EEA, 2019c. Forest fires (CLIM 035) [WWW Document]. European Environment Agency. URL https://www.eea.europa.eu/data-and-maps/indicators/forest-fire-danger-3/assessment (ac-cessed 3.12.20).
EEA, 2017. Climate change. impacts and vulnerability in Europe 2016: an indicator-based report, EEA Report. European Environment Agency.
Einzmann, K., Immitzer, M., Böck, S., Bauer, O., Schmitt, A., Atzberger, C., 2017. Windthrow Detec-tion in European Forests with Very High-Resolution Optical Data. Forests 8, 21. https://doi.org/10.3390/f8010021
Einzmann, K., Ng, W., Immitzer, M., Bachmann, M., Pinnel, N., Atzberger, C., 2014. Method analysis for collecting and processing in-situ hyperspectral needle reflectance data for monitoring Norway spruce. Photogramm Fernerkun 2014, 351–367.

Monitoring Forests Through Remote Sensing
Final Report
132
Eitel, J.U.H., Vierling, L.A., Litvak, M.E., Long, D.S., Schulthess, U., Ager, A.A., Krofcheck, D.J., Sto-scheck, L., 2011. Broadband, red-edge information from satellites improves early stress detection in a New Mexico conifer woodland. Remote Sens Environ 115, 3640–3646. https://doi.org/10.1016/j.rse.2011.09.002
Eklundh, L., Jin, H., Schubert, P., Guzinski, R., Heliasz, M., 2011. An Optical Sensor Network for Vege-tation Phenology Monitoring and Satellite Data Calibration. Sensors 11, 7678–7709. https://doi.org/10.3390/s110807678
Elatawneh, A., Wallner, A., Manakos, I., Schneider, T., Knoke, T., 2014. Forest Cover Database Up-dates Using Multi-Seasonal RapidEye Data—Storm Event Assessment in the Bavarian Forest Na-tional Park. Forests 5, 1284–1303. https://doi.org/10.3390/f5061284
Elmore, A.J., Stylinski, C.D., Pradhan, K., 2016. Synergistic Use of Citizen Science and Remote Sensing for Continental-Scale Measurements of Forest Tree Phenology. Remote Sens 8, 502. https://doi.org/10.3390/rs8060502
ESA TRL Working, 2013. Guidelines for the use of TRLs in ESA programmes (Technical Report No. ESSB-HB-E-002). European Space Agency.
European Commission, 2020. EFFIS - Active Fire Detection [WWW Document]. Copernicus Emer-gency Management Service. URL https://effis.jrc.ec.europa.eu/about-effis/technical-back-ground/active-fire-detection/ (accessed 9.8.20).
European Commission, 2019. Timber Regulation - Forests - Environment [WWW Document]. URL https://ec.europa.eu/environment/forests/timber_regulation.htm (accessed 3.26.19).
European Commission, 2018. EFFIS - Rapid Damage Assessment [WWW Document]. Copernicus Emergency Management Service. URL https://effis.jrc.ec.europa.eu/about-effis/technical-back-ground/rapid-damage-assessment/ (accessed 9.8.20).
European Commission, Directorate-General for the Environment, 2016. Mapping and assessment of ecosystems and their services mapping and assessing the condition of Europe’s ecosystems: pro-gress and challenges : 3rd report - final, March 2016. Publications Office, Luxembourg.
European Union, 2016. Land use and forestry regulation for 2021-2030 [WWW Document]. Climate Action - European Commission. URL https://ec.europa.eu/clima/policies/forests/lulucf_en (ac-cessed 9.8.20).
Evangelista, P.H., Kumar, S., Stohlgren, T.J., Young, N.E., 2011. Assessing forest vulnerability and the potential distribution of pine beetles under current and future climate scenarios in the Interior West of the US. For Ecol Manage 262, 307–316. https://doi.org/10.1016/j.foreco.2011.03.036
FAO, 2019. Objectives | Global Forest Survey | Food and Agriculture Organization of the United Na-tions [WWW Document]. Food and Agriculture Organization of the United Nations Website. URL http://www.fao.org/in-action/global-forest-survey/objectives/en/ (accessed 3.27.19).
FAO, 2018. Global Forest Resources Assessment Guidelines and specifications (Forest Resources As-sessment Working Paper No. 189). Food and Agriculture Organization of the United Nations, Rome.
Fassnacht, F.E., Latifi, H., Ghosh, A., Joshi, P.K., Koch, B., 2014. Assessing the potential of hyperspec-tral imagery to map bark beetle-induced tree mortality. Remote Sens Environ 140, 533–548. https://doi.org/10.1016/j.rse.2013.09.014
Fettig, C.J., Klepzig, K.D., Billings, R.F., Munson, A.S., Nebeker, T.E., Negrón, J.F., Nowak, J.T., 2007. The effectiveness of vegetation management practices for prevention and control of bark beetle

Monitoring Forests Through Remote Sensing
Final Report
133
infestations in coniferous forests of the western and southern United States. For Ecol Manage 238, 24–53. https://doi.org/10.1016/j.foreco.2006.10.011
Filchev, L., 2012. An Assessment of European Spruce Bark Beetle Infestation Using WorldView-2 Sat-ellite Data, in: Proceedings of the European SCGIS Conference. Presented at the European SCGIS Conference "Best practices: Application of GIS technologies forconservation of natural and cul-tural heritage sites”, Sofia.
Finnish Meteorological Institute, 2016. SEN3APP [WWW Document]. Phenology product of Finnish Environment Institute. URL https://sen3app.fmi.fi/index.php?page=Phenology&style=main (ac-cessed 4.8.19).
Flower, C.E., Gonzalez-Meler, M.A., 2015. Responses of Temperate Forest Productivity to Insect and Pathogen Disturbances. Annual Review of Plant Biology 66, 547–569. https://doi.org/10.1146/an-nurev-arplant-043014-115540
Fonseca, E.M.B., Ribeiro, G.A., 2003. Manual de Prevenção de Incêndios Florestais. Belo Horizonte. CEMIG, Belo Horizonte.
Foster, A.C., Walter, J.A., Shugart, H.H., Sibold, J., Negron, J., 2017. Spectral evidence of early-stage spruce beetle infestation in Engelmann spruce. For Ecol Manage 384, 347–357. https://doi.org/10.1016/j.foreco.2016.11.004
Franklin, S.E., Wulder, M.A., Skakun, R.S., Carroll, A.L., 2003. Mountain Pine Beetle Red-Attack Forest Damage Classification Using Stratified Landsat TM Data in British Columbia, Canada. Photogramm Eng Rem S 69, 283–288. https://doi.org/10.14358/PERS.69.3.283
Fraser, R.H., Latifovic, R., 2005. Mapping insect-induced tree defoliation and mortality using coarse spatial resolution satellite imagery. Int J Remote Sens 26, 193–200. https://doi.org/10.1080/01431160410001716923
Frison, P.-L., Fruneau, B., Kmiha, S., Soudani, K., Dufrêne, E., Le Toan, T., Koleck, T., Villard, L., Mougin, E., Rudant, J.-P., 2018. Potential of Sentinel-1 Data for Monitoring Temperate Mixed For-est Phenology. Remote Sens 10, 2049. https://doi.org/10.3390/rs10122049
Fuller, D.O., 2006. Tropical forest monitoring and remote sensing: A new era of transparency in for-est governance? Singapore Journal of Tropical Geography 27, 15–29. https://doi.org/10.1111/j.1467-9493.2006.00237.x
Gamon, J.A., Huemmrich, K.F., Wong, C.Y.S., Ensminger, I., Garrity, S., Hollinger, D.Y., Noormets, A., Peñuelas, J., 2016. A remotely sensed pigment index reveals photosynthetic phenology in ever-green conifers. PNAS 113, 13087–13092. https://doi.org/10.1073/pnas.1606162113
Gardiner, B., Schuck, A., Schelhaas, M.-J., Orazio, C., Blennow, K., Nicoll, B. (Eds.), 2013. Living with storm damage to forests, What science can tell us. European Forest Institute.
Gibson, R., Danaher, T., Hehir, W., Collins, L., 2020. A remote sensing approach to mapping fire sever-ity in south-eastern Australia using sentinel 2 and random forest. Remote Sensing of Environment 240, 111702. https://doi.org/10.1016/j.rse.2020.111702
Giglio, L., Descloitres, J., Justice, C.O., Kaufman, Y.J., 2003. An Enhanced Contextual Fire Detection Algorithm for MODIS. Remote Sens Environ 87, 273–282. https://doi.org/10.1016/S0034-4257(03)00184-6
Giglio, L., Loboda, T., Roy, D.P., Quayle, B., Justice, C.O., 2009. An active-fire based burned area map-ping algorithm for the MODIS sensor. Remote Sens Environ 113, 408–420. https://doi.org/10.1016/j.rse.2008.10.006

Monitoring Forests Through Remote Sensing
Final Report
134
Gimbarzevsky, P., Dawson, A.F., Van Sickle, G.A., 1992. Assessment of aerial photographs and multi-spectral scanner imagery for measuring mountain pine beetle damage. Information report BC-X - Canadian Forestry Service, Pacific Forestry Centre.
Giriraj, A., Babar, S., Sudhakar Reddy, C., 2008. Monitoring of Forest Cover Change in Pranahita Wild-life Sanctuary,Andhra Pradesh, India Using Remote Sensing and GIS. J. of Environmental Science and Technology 1, 73–79. https://doi.org/10.3923/jest.2008.73.79
Gitas, I.Z., Polychronaki, A., Katagis, T., Mallinis, G., 2008. Contribution of remote sensing to disaster management activities: A case study of the large fires in the Peloponnese, Greece. Int J Remote Sens 29, 1847–1853. https://doi.org/10.1080/01431160701874553
Gobron, N., Pinty, B., Mélin, F., Taberner, M., Verstraete, M.M., Belward, A., Lavergne, T., Widlowski, J.-L., 2005. The state of vegetation in Europe following the 2003 drought. International Journal of Remote Sensing 26, 2013–2020. https://doi.org/10.1080/01431160412331330293
Goheen, D., Hansen, E., 1993. Effects of Pathogens and Bark Beetles on Forests, in: Schowalter, T.D., Filip, G.M. (Eds.), Beetle-Pathogen Interactions in Conifer Forests, The Bark Beetles, Fuels, and Fire Bibliography. Academic Press, London, pp. 175–196.
Gond, V., Bourbier, L., Cornu, G., Guitet, S., Pithon, S., Pennec, A., Brognoli, C., Gourlet-Fleury, S., 2011. A spatio-temporal degradation index using remote sensing in Congo Basin.
Gond, V., Féau, C., Pain-Orcet, M., 2003. Télédétection et aménagement forestier tropical : les pistes d’exploitation. Bois & Forets des tropiques 29–36.
Gopal, S., Woodcock, C., 1996. Remote sensing of forest change using artificial neural networks. IEEE Transactions on Geoscience and Remote Sensing 34, 398–404. https://doi.org/10.1109/36.485117
Gorelick, N., Hancher, M., Dixon, M., Ilyushchenko, S., Thau, D., Moore, R., 2017. Google Earth En-gine: Planetary-scale geospatial analysis for everyone. Remote Sens Environ, Big Remotely Sensed Data: tools, applications and experiences 202, 18–27. https://doi.org/10.1016/j.rse.2017.06.031
Government of Canada, 2020. Canadian Wildland Fire Information System | Canadian Forest Fire Weather Index (FWI) System [WWW Document]. Canadian Forest Fire Weather Index (FWI) Sys-tem. URL https://cwfis.cfs.nrcan.gc.ca/background/summary/fwi (accessed 9.8.20).
Gray, J., Sulla-Menashe, D., Friedl, M.A., 2019. User Guide to Collection 6 MODIS Land Cover Dynam-ics (MCD12Q2) Product.
Grecchi, R.C., Beuchle, R., Shimabukuro, Y.E., Aragão, L.E.O.C., Arai, E., Simonetti, D., Achard, F., 2017. An integrated remote sensing and GIS approach for monitoring areas affected by selective logging: A case study in northern Mato Grosso, Brazilian Amazon. Int J Appl Earth Obs Geoinf 61, 70–80. https://doi.org/10.1016/j.jag.2017.05.001
Guyot, G., Guyon, D., Riom, J., 1989. Factors affecting the spectral response of forest canopies: A re-view. Geocarto International 4, 3–18. https://doi.org/10.1080/10106048909354217
Hais, M., Kučera, T., 2008. Surface temperature change of spruce forest as a result of bark beetle at-tack: remote sensing and GIS approach. Eur J Forest Res 127, 327–336. https://doi.org/10.1007/s10342-008-0208-8
Hall, R.J., Castilla, G., White, J.C., Cooke, B.J., Skakun, R.S., 2016. Remote sensing of forest pest dam-age: a review and lessons learned from a Canadian perspective*. The Canadian Entomologist 148, S296–S356. https://doi.org/10.4039/tce.2016.11

Monitoring Forests Through Remote Sensing
Final Report
135
Hallik, L., Kuusk, A., Lang, M., Kuusk, J., 2019. Reflectance Properties of Hemiboreal Mixed Forest Canopies with Focus on Red Edge and Near Infrared Spectral Regions. Remote Sens 11, 1717. https://doi.org/10.3390/rs11141717
Hamunyela, E., Verbesselt, J., Roerink, G., Herold, M., 2013. Trends in Spring Phenology of Western European Deciduous Forests. Remote Sens 5, 6159–6179. https://doi.org/10.3390/rs5126159
Hansen, M.C., Potapov, P.V., Moore, R., Hancher, M., Turubanova, S.A., Tyukavina, A., Thau, D., Steh-man, S.V., Goetz, S.J., Loveland, T.R., Kommareddy, A., Egorov, A., Chini, L., Justice, C.O., Towns-hend, J.R.G., 2013. High-Resolution Global Maps of 21st-Century Forest Cover Change. Science 342, 850–853. https://doi.org/10.1126/science.1244693
Hethcoat, M.G., Edwards, D.P., Carreiras, J.M.B., Bryant, R.G., França, F.M., Quegan, S., 2019. A ma-chine learning approach to map tropical selective logging. Remote Sens Environ 221, 569–582. https://doi.org/10.1016/j.rse.2018.11.044
Heurich, M., Ochs, T., Andresen, T., Schneider, T., 2010. Object-orientated image analysis for the semi-automatic detection of dead trees following a spruce bark beetle (Ips typographus) out-break. Eur J Forest Res 129, 313–324. https://doi.org/10.1007/s10342-009-0331-1
Hicke, J.A., Logan, J., 2009. Mapping whitebark pine mortality caused by a mountain pine beetle out-break with high spatial resolution satellite imagery. Int J Remote Sens 30, 4427–4441. https://doi.org/10.1080/01431160802566439
Hirschmugl, M., Gallaun, H., Dees, M., Datta, P., Deutscher, J., Koutsias, N., Schardt, M., 2017. Meth-ods for Mapping Forest Disturbance and Degradation from Optical Earth Observation Data: a Re-view. Curr Forestry Rep 3, 32–45. https://doi.org/10.1007/s40725-017-0047-2
Hirschmugl, M., Steinegger, M., Gallaun, H., Schardt, M., 2014. Mapping Forest Degradation due to Selective Logging by Means of Time Series Analysis: Case Studies in Central Africa. Remote Sens 6, 756–775. https://doi.org/10.3390/rs6010756
Hlásny, T., Turčáni, M., 2009. Insect Pests as Climate Change Driven Disturbances in Forest Ecosys-tems, in: Střelcová, K., Mátyás, C., Kleidon, A., Lapin, M., Matejka, F., Blaženec, M., Škvarenina, J., Holécy, J. (Eds.), Bioclimatology and Natural Hazards. Springer Netherlands, Dordrecht, pp. 165–177. https://doi.org/10.1007/978-1-4020-8876-6_15
Humboldt State University, 2019. Stations International Phenological Gardens of Europe [WWW Doc-ument]. International Phenological Gardens of Europe. URL http://ipg.hu-ber-lin.de/ipg/faces/list_stations.xhtml (accessed 3.20.19).
Immitzer, M., Atzberger, C., 2014. Early Detection of Bark Beetle Infestation in Norway Spruce (Picea abies, L.) using WorldView-2 Data. Photogramm Fernerkun 351–367. https://doi.org/10.1127/1432-8364/2014/0229
Immitzer, M., Böck, S., Einzmann, K., Vuolo, F., Pinnel, N., Wallner, A., Atzberger, C., 2018. Fractional cover mapping of spruce and pine at 1ha resolution combining very high and medium spatial reso-lution satellite imagery. Remote Sens Environ 204, 690–703. https://doi.org/10.1016/j.rse.2017.09.031
INPE, 2018. Portal do Monitoramento de Queimadas e Incêndios [WWW Document]. INPE - Instituto Nacional De Pesquisas Espaciais. URL http://queimadas.dgi.inpe.br/queimadas/portal (accessed 4.7.18).
INPE, 2017. INPE lança novo sistema para monitoramento e alertas de risco de queimadas [WWW Document]. INPE - Instituto Nacional De Pesquisas Espaciais. URL http://www.inpe.br/no-ticias/noticia.php?Cod_Noticia=4676 (accessed 8.16.18).
Monitoring Forests Through Remote Sensing
Final Report
136
INPE, 2008. Monitoramento da cobertura florestal da Amazônia por satélites: sistemas prodes, deter, degrad e queimadas 2007-2008. INPE - Instituto Nacional De Pesquisas Espaciais, Sao José dos Campos.
Ismail, R., Mutanga, O., Kumar, L., Bob, U., 2008. Determining the Optimal Spatial Resolution of Re-motely Sensed Data for the Detection of Sirex Noctilio Infestations in Pine Plantations in Kwazulu-Natal, South Africa. South African Geographical Journal 90, 22–31. https://doi.org/10.1080/03736245.2008.9725308
Ji, L., Peters, A.J., 2003. Assessing vegetation response to drought in the northern Great Plains using vegetation and drought indices. Remote Sensing of Environment 87, 85–98. https://doi.org/10.1016/S0034-4257(03)00174-3
Jin, H., 2015. Remote sensing phenology at European northern latitudes - From ground spectral tow-ers to satellites (thesis/doccomp). Lund University. https://lup.lub.lu.se/search/ws/files/5703910/5366431.pdf
Jones, H.G., Vaughan, R.A., 2010. Remote Sensing of Vegetation: Principles, Techniques, and Applica-tions. Oxford University Press, U.S.A., New York, NY, USA.
Jones, S.D., 1998. Understanding large area tropical forest phenology using remotely sensed and ground data sources (PhD Thesis). University of Leicester.
Jovanović, M.M., Milanović, M.M., 2017. Remote Sensing and Forest Conservation: Challenges of Ille-gal Logging in Kursumlija Municipality (Serbia), in: Chakravarty, S., Shukla, G. (Eds.), Forest Ecology and Conservation. InTech. https://doi.org/10.5772/67666
Kandasamy, S., Baret, F., Verger, A., Neveux, P., Weiss, M., 2013. A comparison of methods for smoothing and gap filling time series of remote sensing observations – application to MODIS LAI products. Biogeosciences 10, 4055–4071. https://doi.org/10.5194/bg-10-4055-2013
Katagis, T., Gitas, I.Z., Toukiloglou, P., Veraverbeke, S., Goossens, R., 2014. Trend analysis of medium- and coarse-resolution time series image data for burned area mapping in a Mediterranean eco-system. Int. J. Wildland Fire 23, 668. https://doi.org/10.1071/WF12055
Keller, M., Asner, G., Silva, J., Palace, M., 2004. Sustainability of Selective Logging of Upland Forests in the Brazilian Amazon Carbon Budgets and Remote Sensing as Tools for Evaluating Logging Effects: Conservation through Sustainable Management? https://doi.org/10.7312/zari12906-006
Kent, R., Lindsell, J.A., Laurin, G.V., Valentini, R., Coomes, D.A., 2015. Airborne LiDAR Detects Selec-tively Logged Tropical Forest Even in an Advanced Stage of Recovery. Remote Sens 7, 8348–8367. https://doi.org/10.3390/rs70708348
Key, T., Warner, T.A., McGraw, J.B., Fajvan, M.A., 2001. A Comparison of Multispectral and Multitem-poral Information in High Spatial Resolution Imagery for Classification of Individual Tree Species in a Temperate Hardwood Forest. Remote Sensing of Environment 75, 100–112. https://doi.org/10.1016/S0034-4257(00)00159-0
Kharuk, V.I., Ranson, K.J., Im, S.T., 2009. Siberian silkmoth outbreak pattern analysis based on SPOT VEGETATION data. Int J Remote Sens 30, 2377–2388. https://doi.org/10.1080/01431160802549419
Khoi, D.D., Murayama, Y., 2010. Forecasting Areas Vulnerable to Forest Conversion in the Tam Dao National Park Region, Vietnam. Remote Sens 2, 1249–1272. https://doi.org/10.3390/rs2051249
King, D.J., Olthof, I., Pellikka, P.K.E., Seed, E.D., Butson, C., 2005. Modelling and Mapping Damage to Forests from an Ice Storm Using Remote Sensing and Environmental Data. Nat Hazards 35, 321–342. https://doi.org/10.1007/s11069-004-1795-4

Monitoring Forests Through Remote Sensing
Final Report
137
Klisch, A., Atzberger, C., 2014. Evaluating Phenological Metrics derived from the MODIS Time Series over the European Continent. PFG Photogrammetrie, Fernerkundung, Geoinformation 409–421. https://doi.org/10.1127/1432-8364/2014/0233
Klosterman, S., Richardson, A.D., 2017. Observing Spring and Fall Phenology in a Deciduous Forest with Aerial Drone Imagery. Sensors 17, 2852. https://doi.org/10.3390/s17122852
Klosterman, S.T., Hufkens, K., Gray, J.M., Melaas, E., Sonnentag, O., Lavine, I., Mitchell, L., Norman, R., Friedl, M.A., Richardson, A.D., 2014. Evaluating remote sensing of deciduous forest phenology at multiple spatial scales using PhenoCam imagery. Biogeosciences 11, 4305–4320. https://doi.org/10.5194/bg-11-4305-2014
Knorn, J., Kuemmerle, T., Radeloff, V.C., Szabo, A., Mindrescu, M., Keeton, W.S., Abrudan, I., Griffiths, P., Gancz, V., Hostert, P., 2012. Forest restitution and protected area effectiveness in post-social-ist Romania. Biological Conservation 146, 204–212. https://doi.org/10.1016/j.biocon.2011.12.020
Kogan, F.N., 1995. Droughts of the Late 1980s in the United States as Derived from NOAA Polar-Or-biting Satellite Data. Bull. Amer. Meteor. Soc. 76, 655–668. https://doi.org/10.1175/1520-0477(1995)076<0655:DOTLIT>2.0.CO;2
Kötz, B., Schaepman, M., Morsdorf, F., Bowyer, P., Itten, K., Allgöwer, B., 2004. Radiative transfer modeling within a heterogeneous canopy for estimation of forest fire fuel properties. Remote Sens Environ, Forest Fire Prevention and Assessment 92, 332–344. https://doi.org/10.1016/j.rse.2004.05.015
Kucera, J., Janssens-Maenhout, G., Brink, A., Greidanus, H., Roggeri, P., Strobl, P., Tartaglia, G., Bel-ward, A., Dowell, M., European Commission, Joint Research Centre, 2020. Copernicus and Earth Observation in support of EU Policies. Part I, Part I,.
Kuemmerle, T., Chaskovskyy, O., Knorn, J., Radeloff, V.C., Kruhlov, I., Keeton, W.S., Hostert, P., 2009. Forest cover change and illegal logging in the Ukrainian Carpathians in the transition period from 1988 to 2007. Remote Sens Environ 113, 1194–1207. https://doi.org/10.1016/j.rse.2009.02.006
Kurz, W.A., Dymond, C.C., Stinson, G., Rampley, G.J., Neilson, E.T., Carroll, A.L., Ebata, T., Safranyik, L., 2008. Mountain pine beetle and forest carbon feedback to climate change. Nature 452, 987–990. https://doi.org/10.1038/nature06777
Kuusk, A., Nilson, T., 2000. A Directional Multispectral Forest Reflectance Model. Remote Sens Envi-ron 72, 244–252. https://doi.org/10.1016/S0034-4257(99)00111-X
Lange, M., Dechant, B., Rebmann, C., Vohland, M., Cuntz, M., Doktor, D., 2017. Validating MODIS and Sentinel-2 NDVI Products at a Temperate Deciduous Forest Site Using Two Independent Ground-Based Sensors. Sensors 17, 1855. https://doi.org/10.3390/s17081855
Latifi, H., Schumann, B., Kautz, M., Dech, S., 2014. Spatial characterization of bark beetle infestations by a multidate synergy of SPOT and Landsat imagery. Environ Monit Assess 186, 441–456. https://doi.org/10.1007/s10661-013-3389-7
Lausch, A., Heurich, M., Gordalla, D., Dobner, H.-J., Gwillym-Margianto, S., Salbach, C., 2013. Fore-casting potential bark beetle outbreaks based on spruce forest vitality using hyperspectral re-mote-sensing techniques at different scales. For Ecol Manage 308, 76–89. https://doi.org/10.1016/j.foreco.2013.07.043
Lawrence, R., Labus, M., 2003. Early Detection of Douglas-Fir Beetle Infestation with Subcanopy Res-olution Hyperspectral Imagery. Western Journal of Applied Forestry 18, 202–206.
Monitoring Forests Through Remote Sensing
Final Report
138
Leckie, D.G., Jay, C., Gougeon, F.A., Sturrock, R.N., Paradine, D., 2004. Detection and assessment of trees with Phellinus weirii (laminated root rot) using high resolution multi-spectral imagery. Int J Remote Sens 25, 793–818. https://doi.org/10.1080/0143116031000139926
Lee, J.C., Haack, R.A., Negrón, J.F., Witcosky, J.J., Seybold, S.J., 2007. Invasive bark beetles (No. 176), Forest Insect and Disease Leaflet. US Department of Agriculture and US Forest Service.
Lehmann, J.R.K., Nieberding, F., Prinz, T., Knoth, C., 2015. Analysis of Unmanned Aerial System-Based CIR Images in Forestry—A New Perspective to Monitor Pest Infestation Levels. Forests 6, 594–612. https://doi.org/10.3390/f6030594
Lehnert, L.W., Bässler, C., Brandl, R., Burton, P.J., Müller, J., 2013. Conservation value of forests at-tacked by bark beetles: Highest number of indicator species is found in early successional stages. Journal for Nature Conservation 21, 97–104. https://doi.org/10.1016/j.jnc.2012.11.003
Lewińska, K.E., Ivits, E., Schardt, M., Zebisch, M., 2016. Alpine Forest Drought Monitoring in South Tyrol: PCA Based Synergy between scPDSI Data and MODIS Derived NDVI and NDII7 Time Series. Remote Sensing 8, 639. https://doi.org/10.3390/rs8080639
Lewis, S.A., Hudak, A.T., Robichaud, P.R., Morgan, P., Satterberg, K.L., Strand, E.K., Smith, A.M.S., Zamudio, J.A., Lentile, L.B., 2017. Indicators of burn severity at extended temporal scales: a dec-ade of ecosystem response in mixed-conifer forests of western Montana. Int. J. Wildland Fire 26, 755. https://doi.org/10.1071/WF17019
Li, M., 2010. Remote Sensing Techniques for Detecting Vegetation Phenology. George Mason Univer-sity, Fairfax, VA.
Lieth, H., 1974. Purposes of a Phenology Book, in: Lieth, H. (Ed.), Phenology and Seasonality Model-ing, Ecological Studies. Springer, Berlin, Heidelberg, pp. 3–19. https://doi.org/10.1007/978-3-642-51863-8_1
Lindner, M., Maroschek, M., Netherer, S., Kremer, A., Barbati, A., Garcia-Gonzalo, J., Seidl, R., Delzon, S., Corona, P., Kolström, M., Lexer, M.J., Marchetti, M., 2010. Climate change impacts, adaptive capacity, and vulnerability of European forest ecosystems. For Ecol Manage 259, 698–709. https://doi.org/10.1016/j.foreco.2009.09.023
Liu, C.-C., Chen, Y.-H., Wu, M.-H.M., Wei, C., Ko, M.-H., 2019. Assessment of forest restoration with multitemporal remote sensing imagery. Scientific Reports 9, 7279. https://doi.org/10.1038/s41598-019-43544-5
Lobo, A., Maisongrande, P., 2006. Stratified analysis of satellite imagery of SW Europe during sum-mer 2003: the differential response of vegetation classes to increased water deficit. Hydrology and Earth System Sciences Discussions 10, 151–164.
Lohne, T.P., 2013. Radargrammetric surface models from Radarsat-2 in Indonesia : processing and application in tropical forest monitoring. Norwegian University of Life Sciences, Ås.
Lottering, R., Mutanga, O., Peerbhay, K., 2018. Detecting and mapping levels of Gonipterus scutella-tus-induced vegetation defoliation and leaf area index using spatially optimized vegetation indi-ces. Geocarto International 33, 277–292. https://doi.org/10.1080/10106049.2016.1250823
Luo, X., Chen, X., Xu, L., Myneni, R., Zhu, Z., 2013. Assessing Performance of NDVI and NDVI3g in Monitoring Leaf Unfolding Dates of the Deciduous Broadleaf Forest in Northern China. Remote Sens 5, 845–861. https://doi.org/10.3390/rs5020845
Marino, E., Ranz, P., Tomé, J.L., Noriega, M.Á., Esteban, J., Madrigal, J., 2016. Generation of high-res-olution fuel model maps from discrete airborne laser scanner and Landsat-8 OLI: A low-cost and

Monitoring Forests Through Remote Sensing
Final Report
139
highly updated methodology for large areas. Remote Sens Environ 187, 267–280. https://doi.org/10.1016/j.rse.2016.10.020
Martin, R.E., Asner, G.P., Francis, E., Ambrose, A., Baxter, W., Das, A.J., Vaughn, N.R., Paz-Kagan, T., Dawson, T., Nydick, K., Stephenson, N.L., 2018. Remote measurement of canopy water content in giant sequoias (Sequoiadendron giganteum) during drought. Forest Ecology and Management, Leaf to landscape responses of giant sequoia to hotter drought 419–420, 279–290. https://doi.org/10.1016/j.foreco.2017.12.002
Marx, A., 2010. Erkennung von Borkenkäferbefall in Fichtenreinbeständen mit multi-temporalen Ra-pidEye-Satellitenbildern und Datamining-Techniken. Photogramm Fernerkun 2010, 243–252. https://doi.org/10.1127/1432-8364/2010/0052
Meddens, A.J.H., Hicke, J.A., 2014. Spatial and temporal patterns of Landsat-based detection of tree mortality caused by a mountain pine beetle outbreak in Colorado, USA. For Ecol Manage 322, 78–88. https://doi.org/10.1016/j.foreco.2014.02.037
Meddens, A.J.H., Hicke, J.A., Vierling, L.A., Hudak, A.T., 2013. Evaluating methods to detect bark bee-tle-caused tree mortality using single-date and multi-date Landsat imagery. Remote Sens Environ 132, 49–58. https://doi.org/10.1016/j.rse.2013.01.002
Meigs, G.W., Kennedy, R.E., Cohen, W.B., 2011. A Landsat time series approach to characterize bark beetle and defoliator impacts on tree mortality and surface fuels in conifer forests. Remote Sens Environ 115, 3707–3718. https://doi.org/10.1016/j.rse.2011.09.009
Mello, N.G.R. de, Artaxo, P., 2017. Evolução do Plano de Ação para Prevenção e Controle do Des-matamento na Amazônia Legal. Rev. Inst. Estud. Bras. 108. https://doi.org/10.11606/issn.2316-901x.v0i66p108-129
Meng, R., Wu, J., Schwager, K.L., Zhao, F., Dennison, P.E., Cook, B.D., Brewster, K., Green, T.M., Serbin, S.P., 2017. Using high spatial resolution satellite imagery to map forest burn severity across spatial scales in a Pine Barrens ecosystem. Remote Sens Environ 191, 95–109. https://doi.org/10.1016/j.rse.2017.01.016
Meroni, M., Atzberger, C., Vancutsem, C., Gobron, N., Baret, F., Lacaze, R., Eerens, H., Leo, O., 2013. Evaluation of Agreement Between Space Remote Sensing SPOT-VEGETATION fAPAR Time Series. IEEE T Geosci Remote 51, 1951–1962. https://doi.org/10.1109/TGRS.2012.2212447
Mertens, B., Shu, G.N., Steil, M., Tessa, B., Minnemeyer, S., Douard, P., Blang, J.-D.M., Leach, A., Mbouna, D., Mboua, P., Fuezing, A., Methot, P., Nglilambi, H., 2012. Interactive Forest Atlas of Cameroon - Atlas Forestier Interactif du Cameroun (Version 3.0).
Mikkelson, K.M., Bearup, L.A., Maxwell, R.M., Stednick, J.D., McCray, J.E., Sharp, J.O., 2013. Bark bee-tle infestation impacts on nutrient cycling, water quality and interdependent hydrological effects. Biogeochemistry 115, 1–21. https://doi.org/10.1007/s10533-013-9875-8
Mildrexler, D., Yang, Z., Cohen, W.B., Bell, D.M., 2016. A forest vulnerability index based on drought and high temperatures. Remote Sensing of Environment 173, 314–325. https://doi.org/10.1016/j.rse.2015.11.024
Mirzaie, M., Darvishzadeh, R., Shakiba, A., Matkan, A.A., Atzberger, C., Skidmore, A., 2014. Compara-tive analysis of different uni- and multi-variate methods for estimation of vegetation water con-tent using hyper-spectral measurements. Int J Appl Earth Obs Geoinf 26, 1–11. https://doi.org/10.1016/j.jag.2013.04.004

Monitoring Forests Through Remote Sensing
Final Report
140
Mitchard, E., Viergever, K., Morel, V., Tipper, R., 2015. Assessment of the accuracy of University of Maryland (Hansen et al.) Forest Loss Data in 2 ICF project areas–component of a project that tested an ICF indicator methodology. Ecometrica, University of Edinburgh.
MMA, 2017. Degradação e restauração florestal em debate na Argentina [WWW Document]. URL http://redd.mma.gov.br/pt/noticias-principais/824-degradacao-florestal-e-restauracao-em-de-bate-na-argentina (accessed 6.4.20).
Moreau, I., Defourny, P., 2012. The vegetation phenology detection in Amazon tropical evergreen forests using SPOT-VEGETATION 11-y time series, in: 2012 IEEE International Geoscience and Re-mote Sensing Symposium. Presented at the 2012 IEEE International Geoscience and Remote Sens-ing Symposium, pp. 40–43. https://doi.org/10.1109/IGARSS.2012.6351641
Morello, T.F., Parry, L., Markusson, N., Barlow, J., 2017. Policy instruments to control Amazon fires: A simulation approach. Ecol Eco 138, 199–222. https://doi.org/10.1016/j.ecolecon.2017.03.043
Moreno, J.M., 2014. Forest Fires under Climate, Social and Economic Changes in Europe, the Medi-terranean and Other Fire-Affected Areas Of The World [WWW Document]. URL https://hori-zon.documentation.ird.fr/exl-doc/pleins_textes/divers15-08/010065139.pdf (accessed 6.4.20).
Müller, J., Bußler, H., Goßner, M., Rettelbach, T., Duelli, P., 2008. The European spruce bark beetle Ips typographus in a national park: from pest to keystone species. Biodivers Conserv 17, 2979. https://doi.org/10.1007/s10531-008-9409-1
Näsi, R., Honkavaara, E., Lyytikäinen-Saarenmaa, P., Blomqvist, M., Litkey, P., Hakala, T., Viljanen, N., Kantola, T., Tanhuanpää, T., Holopainen, M., 2015. Using UAV-Based Photogrammetry and Hyper-spectral Imaging for Mapping Bark Beetle Damage at Tree-Level. Remote Sens 7, 15467–15493. https://doi.org/10.3390/rs71115467
Neinavaz, E., Darvishzadeh, R., Skidmore, A.K., Abdullah, H., 2019. Integration of Landsat-8 Thermal and Visible-Short Wave Infrared Data for Improving Prediction Accuracy of Forest Leaf Area Index. Remote Sensing 11, 390. https://doi.org/10.3390/rs11040390
Nepstad, D., McGrath, D., Stickler, C., Alencar, A., Azevedo, A., Swette, B., Bezerra, T., DiGiano, M., Shimada, J., Seroa da Motta, R., Armijo, E., Castello, L., Brando, P., Hansen, M.C., McGrath-Horn, M., Carvalho, O., Hess, L., 2014. Slowing Amazon deforestation through public policy and inter-ventions in beef and soy supply chains. Science 344, 1118–1123. https://doi.org/10.1126/sci-ence.1248525
Netherer, S., Nopp-Mayr, U., 2005. Predisposition assessment systems (PAS) as supportive tools in forest management—rating of site and stand-related hazards of bark beetle infestation in the High Tatra Mountains as an example for system application and verification. For Ecol Manage 207, 99–107. https://doi.org/10.1016/j.foreco.2004.10.020
Neuvonen, S., Bylund, H., Tømmervik, H., 2005. Forest Defoliation Risks in Birch Forest by Insects Un-der Different Climate and Land Use Scenarios in Northern Europe, in: Caldwell, M.M., Heldmaier, G., Jackson, R.B., Lange, O.L., Mooney, H.A., Schulze, E.-D., Sommer, U., Wielgolaski, F.E., Karlsson, P.S., Neuvonen, Seppo, Thannheiser, D. (Eds.), Plant Ecology, Herbivory, and Human Impact in Nordic Mountain Birch Forests, Ecological Studies. Springer, Berlin, Heidelberg, pp. 125–138. https://doi.org/10.1007/3-540-26595-3_9
Niemann, K.O., Quinn, G., Stephen, R., Visintini, F., Parton, D., 2015. Hyperspectral Remote Sensing of Mountain Pine Beetle with an Emphasis on Previsual Assessment. Can J Remote Sens 41, 191–202. https://doi.org/10.1080/07038992.2015.1065707

Monitoring Forests Through Remote Sensing
Final Report
141
Niemann, K.O., Visintini, F., 2005. Assessment of potential for remote sensing detection of bark bee-tle-infested areas during green attack: a literature review. Natural Resources Canada, Canadian Forest Service, Victoria, BC.
Nowak, J.T., Meeker, J.R., Coyle, D.R., Steiner, C.A., Brownie, C., 2015. Southern Pine Beetle Infesta-tions in Relation to Forest Stand Conditions, Previous Thinning, and Prescribed Burning: Evalua-tion of the Southern Pine Beetle Prevention Program. J Forest 113, 454–462. https://doi.org/10.5849/jof.15-002
Numata, I., Cochrane, M.A., Roberts, D.A., Soares, J.V., Souza, C.M., Sales, M.H., 2010. Biomass col-lapse and carbon emissions from forest fragmentation in the Brazilian Amazon. J. Geophys. Res. 115, G03027. https://doi.org/10.1029/2009JG001198
Nuthammachot, N., 2016. Detecting forest degradation in tropical forests using earth observation satellites (PhD Thesis). University of Leicester.
O’Connor, B., 2011. Monitoring the vegetation start of season (SOS) across the island of Ireland using the MERIS global vegetation index (Doctoral thesis). University College Cork.
Office National des Forêts, 2019. Portal Renecofor [WWW Document]. Réseau National de suivi à long terme des Ecosystèmes Forestiers. URL http://www1.onf.fr/renecofor/@@index.html (ac-cessed 3.20.19).
Ortiz, S., Breidenbach, J., Kändler, G., 2013. Early Detection of Bark Beetle Green Attack Using Ter-raSAR-X and RapidEye Data. Remote Sens 5, 1912–1931. https://doi.org/10.3390/rs5041912
Oumar, Z., Mutanga, O., 2014. Integrating environmental variables and WorldView-2 image data to improve the prediction and mapping of Thaumastocoris peregrinus (bronze bug) damage in plan-tation forests. ISPRS J Photogramm Remote Sens 87, 39–46. https://doi.org/10.1016/j.isprsjprs.2013.10.010
Pereira, J.A.V., Silva, J.B. da, 2016. Detecção de focos de calor no estado da Paraíba: um estudo sobre as queimadas. Revista Geográfica Acadêmica. Revista Geográfica Acadêmica 10, 5–16.
Pereira, J.M.C., 2003. Remote sensing of burned areas in tropical savannas. Int. J. Wildland Fire 12, 259. https://doi.org/10.1071/WF03028
Peterson, B., Nelson, K., Wylie, B., 2013. Towards Integration of GLAS into a National Fuel Mapping Program. Photogramm Eng Rem S 79, 175–183. https://doi.org/10.14358/PERS.79.2.175
Pithon, S., Jubelin, G., Guitet, S., Gond, V., 2013. A statistical method for detecting logging-related canopy gaps using high-resolution optical remote sensing. Int J Remote Sens 34, 700–711. https://doi.org/10.1080/01431161.2012.706719
Potapov, P., Turubanova, S., Hansen, M.C., 2011. Regional-scale boreal forest cover and change map-ping using Landsat data composites for European Russia. Remote Sens Environ 115, 548–561. https://doi.org/10.1016/j.rse.2010.10.001
Pu, R., Kelly, M., Anderson, G.L., Gong, P., 2008. Using CASI Hyperspectral Imagery to Detect Mortal-ity and Vegetation Stress Associated with a New Hardwood Forest Disease. Photogramm Eng Rem S 74, 65–75. https://doi.org/10.14358/PERS.74.1.65
Raffa, K.F., Aukema, B.H., Bentz, B.J., Carroll, A.L., Hicke, J.A., Turner, M.G., Romme, W.H., 2008. Cross-scale Drivers of Natural Disturbances Prone to Anthropogenic Amplification: The Dynamics of Bark Beetle Eruptions. BioScience 58, 501–517. https://doi.org/10.1641/B580607

Monitoring Forests Through Remote Sensing
Final Report
142
Ramsey, E., Werle, D., Lu, Z., Rangoonwala, A., Suzuoki, Y., 2009. A Case of Timely Satellite Image Ac-quisitions in Support of Coastal Emergency Environmental Response Management. Journal of Coastal Research 255, 1168–1172. https://doi.org/10.2112/JCOASTRES-D-09-00012.1
Rankine, C.J., 2016. Monitoring Seasonal and Secondary Succession Processes in Deciduous Forests using Near-Surface Optical Remote Sensing and Wireless Sensor Networks. University of Alberta. https://doi.org/10.7939/R32Z12V30
Rautiainen, M., 2005. The spectral signature of coniferous forests: the role of stand structure and leaf area index (Dissertation). University of Helsinki, Helsinki.
Reed, B.C., Schwartz, M.D., Xiao, X., 2009. Remote Sensing Phenology, in: Noormets, A. (Ed.), Phenol-ogy of Ecosystem Processes: Applications in Global Change Research. Springer, New York, NY, pp. 231–246. https://doi.org/10.1007/978-1-4419-0026-5_10
Reiche, J., Hamunyela, E., Verbesselt, J., Hoekman, D., Herold, M., 2018. Improving near-real time de-forestation monitoring in tropical dry forests by combining dense Sentinel-1 time series with Landsat and ALOS-2 PALSAR-2. Remote Sensing of Environment 204, 147–161. https://doi.org/10.1016/j.rse.2017.10.034
Reichmuth, A., Henning, L., Pinnel, N., Bachmann, M., Rogge, D., 2018. Early Detection of Vitality Changes of Multi-Temporal Norway Spruce Laboratory Needle Measurements—The Ring-Barking Experiment. Remote Sens 10, 57. https://doi.org/10.3390/rs10010057
Rich, Roy.L., Frelich, L., Reich, P.B., Bauer, M.E., 2010. Detecting wind disturbance severity and can-opy heterogeneity in boreal forest by coupling high-spatial resolution satellite imagery and field data. Remote Sens Environ 114, 299–308. https://doi.org/10.1016/j.rse.2009.09.005
Richardson, A.D., Jenkins, J.P., Braswell, B.H., Hollinger, D.Y., Ollinger, S.V., Smith, M.-L., 2007. Use of digital webcam images to track spring green-up in a deciduous broadleaf forest. Oecologia 152, 323–334. https://doi.org/10.1007/s00442-006-0657-z
Rosemartin, A.H., Denny, E.G., Gerst, K.L., Marsh, L., Posthumus, E., Crimmins, T.M., Weltzin, J.F., 2018. USA National Phenology Network Observational Data Documentation (Open-File Report). US Geological Survey, Reston.
Rossi, S., Crippa, M., Guizzardi, D., Federici, S., Abad-Viñas, R., Janssens-Maenhout, G., Vignati, E., Grassi, G., 2019. EO Data in the New LULUCF Component of the EDGAR GHG Emissions Database. Presented at the ESA Living Planet Symposium, Milan, Italy.
Roy, D.P., Jin, Y., Lewis, P.E., Justice, C.O., 2005. Prototyping a global algorithm for systematic fire-affected area mapping using MODIS time series data. Remote Sens Environ 97, 137–162. https://doi.org/10.1016/j.rse.2005.04.007
Rüetschi, M., Schaepman, M.E., Small, D., 2018. Using Multitemporal Sentinel-1 C-band Backscatter to Monitor Phenology and Classify Deciduous and Coniferous Forests in Northern Switzerland. Re-mote Sens 10, 55. https://doi.org/10.3390/rs10010055
Rullan-Silva, C.D., Olthoff, A.E., Delgado de la Mata, J.A., Pajares-Alonso, J.A., 2013. Remote monitor-ing of forest insect defoliation. A review. Forest Systems 22, 377–391.
Ryan, K.C., Opperman, T.S., 2013. LANDFIRE – A national vegetation/fuels data base for use in fuels treatment, restoration, and suppression planning. For Ecol Manage 294, 208–216. https://doi.org/10.1016/j.foreco.2012.11.003
Saatchi, S., Asefi-Najafabady, S., Malhi, Y., Aragão, L.E.O.C., Anderson, L.O., Myneni, R.B., Nemani, R., 2013. Persistent effects of a severe drought on Amazonian forest canopy. PNAS 110, 565–570. https://doi.org/10.1073/pnas.1204651110
Monitoring Forests Through Remote Sensing
Final Report
143
Samalens, J.-C., Guyon, D., Bories, N., Moisy, C., Wigneron, J.-P., 2010. Spatiotemporal dynamic of French forest phenology from MODIS and GLOBCARBON products, in: Third Recent Advances in Quantitative Remote Sensing. Presented at the 3. International Symposium on Recent Advances in Quantitative Remote Sensing, Torrent, Valencia, pp. 597–602.
Schlerf, M., Atzberger, C., 2006. Inversion of a forest reflectance model to estimate structural canopy variables from hyperspectral remote sensing data. Remote Sens Environ 100, 281–294. https://doi.org/10.1016/j.rse.2005.10.006
Schlerf, M., Atzberger, C., Hill, J., Buddenbaum, H., Werner, W., Schüler, G., 2010. Retrieval of chloro-phyll and nitrogen in Norway spruce (Picea abies L. Karst.) using imaging spectroscopy. Int J Appl Earth Obs Geoinf 12, 17–26. https://doi.org/10.1016/j.jag.2009.08.006
Schowalter, T.D., 2012. Ecology and Management of Bark Beetles (Coleoptera: Curculionidae: Scolyt-inae) in Southern Pine Forests. J Integr Pest Manag 3, A1–A7. https://doi.org/10.1603/IPM11025
Schroeder, W., Oliva, P., Giglio, L., Csiszar, I.A., 2014. The New VIIRS 375m active fire detection data product: Algorithm description and initial assessment. Remote Sens Environ 143, 85–96. https://doi.org/10.1016/j.rse.2013.12.008
Schwab, K., Probeck, M., Sevillano Marco, E., Moser, L., Ruiz Gomez, I., Sannier, C., Gallaun, H., 2019. ECoLaSS - Evolution of Copernicus Land Services based on Sentinel data D3.2 “D21.1b – Service Evolution Requirements Report.” GAF, München.
Seidl, R., Fernandes, P.M., Fonseca, T.F., Gillet, F., Jönsson, A.M., Merganičová, K., Netherer, S., Arpaci, A., Bontemps, J.-D., Bugmann, H., González-Olabarria, J.R., Lasch, P., Meredieu, C., Moreira, F., Schelhaas, M.-J., Mohren, F., 2011a. Modelling natural disturbances in forest ecosys-tems: A review. Ecol Model 222, 903–924.
Seidl, R., Schelhaas, M.-J., Lexer, M.J., 2011b. Unraveling the drivers of intensifying forest disturbance regimes in Europe. Glob Change Biol 17, 2842–2852. https://doi.org/10.1111/j.1365-2486.2011.02452.x
Seidl, R., Thom, D., Kautz, M., Martin-Benito, D., Peltoniemi, M., Vacchiano, G., Wild, J., Ascoli, D., Petr, M., Honkaniemi, J., Lexer, M.J., Trotsiuk, V., Mairota, P., Svoboda, M., Fabrika, M., Nagel, T.A., Reyer, C.P.O., 2017. Forest disturbances under climate change. Nature Climate Change 7, 395–402. https://doi.org/10.1038/nclimate3303
Seitz, R., Straub, C., 2017. »FastResponse« – die schnelle Antwort nach dem Sturm 3.
Senf, C., Seidl, R., Hostert, P., 2017. Remote sensing of forest insect disturbances: Current state and future directions. Int J Appl Earth Obs Geoinf 60, 49–60. https://doi.org/10.1016/j.jag.2017.04.004
Shi, Y., Skidmore, A.K., Wang, T., Holzwarth, S., Heiden, U., Pinnel, N., Zhu, X., Heurich, M., 2018. Tree species classification using plant functional traits from LiDAR and hyperspectral data. Interna-tional Journal of Applied Earth Observation and Geoinformation 73, 207–219. https://doi.org/10.1016/j.jag.2018.06.018
Shimabukuro, Y.E., Arai, E., Anderson, L.O., Aragão, L.E.O. e C. de, Duarte, V., 2017. Mapping de-graded forest areas caused by fires during the year 2010 in mato grosso state, brazilian legal ama-zon using landsat-5 tm fraction images. Revista Brasileira de Cartografia 69.
Shimabukuro, Y.E., Arai, E., Duarte, V., Jorge, A., Santos, E.G. dos, Gasparini, K.A.C., Dutra, A.C., 2019. Monitoring deforestation and forest degradation using multi-temporal fraction images derived from Landsat sensor data in the Brazilian Amazon. Int J Remote Sens 40, 5475–5496. https://doi.org/10.1080/01431161.2019.1579943

Monitoring Forests Through Remote Sensing
Final Report
144
Shimabukuro, Y.E., Beuchle, R., Grecchi, R.C., Achard, F., 2014. Assessment of forest degradation in Brazilian Amazon due to selective logging and fires using time series of fraction images derived from Landsat ETM+ images. Remote Sens Lett 5, 773–782. https://doi.org/10.1080/2150704X.2014.967880
Shimabukuro, Y.E., Duarte, V., Arai, E., Freitas, R.M., Martini, P.R., Lima, A., 2009. Mapping and moni-toring land cover in Acre State, Brazilian Amazônia, using multitemporal remote sensing data, in: 2009 IEEE International Geoscience and Remote Sensing Symposium. Presented at the 2009 IEEE International Geoscience and Remote Sensing Symposium, p. IV-248-IV–251. https://doi.org/10.1109/IGARSS.2009.5417325
Shimabukuro, Y.E., Miettinen, J., Beuchle, R., Grecchi, R.C., Simonetti, D., Achard, F., 2015. Estimating Burned Area in Mato Grosso, Brazil, Using an Object-Based Classification Method on a Systematic Sample of Medium Resolution Satellite Images. IEEE J Sel Top Appl 8, 4502–4508. https://doi.org/10.1109/JSTARS.2015.2464097
Shimabukuro, Y.E., Ponzoni, F.J., 2017. Mistura espectral: modelo linear e aplicações. Oficina de Tex-tos.
Shimabukuro, Y.E., Smith, J.A., 1991. The least-squares mixing models to generate fraction images derived from remote sensing multispectral data. IEEE T Geosci Remote 29, 16–20. https://doi.org/10.1109/36.103288
Shimizu, K., Ahmed, O.S., Ponce-Hernandez, R., Ota, T., Win, Z.C., Mizoue, N., Yoshida, S., 2017. At-tribution of Disturbance Agents to Forest Change Using a Landsat Time Series in Tropical Seasonal Forests in the Bago Mountains, Myanmar. Forests 8, 218. https://doi.org/10.3390/f8060218
Shu, G.N., Kanninen, M., Eba’a Atyi, R., Sonwa, D.J., 2014. Assessment and prediction of above-ground biomass in selectively logged forest concessions using field measurements and remote sensing data: Case study in South East Cameroon. For Ecol Manage 329, 177–185. https://doi.org/10.1016/j.foreco.2014.06.018
Sieber, A., Kuemmerle, T., Prishchepov, A.V., Wendland, K.J., Baumann, M., Radeloff, V.C., Baskin, L.M., Hostert, P., 2013. Landsat-based mapping of post-Soviet land-use change to assess the ef-fectiveness of the Oksky and Mordovsky protected areas in European Russia. Remote Sens Envi-ron 133, 38–51. https://doi.org/10.1016/j.rse.2013.01.021
Simula, M., 2009. Towards defining forest degradation: comparing analysis of existing definitions 59.
Singh, M., Evans, D., Chevance, J.-B., Tan, B.S., Wiggins, N., Kong, L., Sakhoeun, S., 2018. Evaluating the ability of community-protected forests in Cambodia to prevent deforestation and degradation using temporal remote sensing data. Ecology and Evolution 8, 10175–10191. https://doi.org/10.1002/ece3.4492
Skakun, R.S., Wulder, M.A., Franklin, S.E., 2003. Sensitivity of the thematic mapper enhanced wet-ness difference index to detect mountain pine beetle red-attack damage. Remote Sens Environ 86, 433–443. https://doi.org/10.1016/S0034-4257(03)00112-3
Solberg, S., Astrup, R., Weydahl, D.J., 2013. Detection of Forest Clear-Cuts with Shuttle Radar Topog-raphy Mission (SRTM) and Tandem-X InSAR Data. Remote Sens 5, 5449–5462. https://doi.org/10.3390/rs5115449
Souza, C.A., Azevedo, T., 2018. Algorithm theoretical base document: results. 2017.
Souza, Jr, C., Siqueira, J., Sales, M., Fonseca, A., Ribeiro, J., Numata, I., Cochrane, M., Barber, C., Rob-erts, D., Barlow, J., 2013. Ten-Year Landsat Classification of Deforestation and Forest Degradation in the Brazilian Amazon. Remote Sens 5, 5493–5513. https://doi.org/10.3390/rs5115493

Monitoring Forests Through Remote Sensing
Final Report
145
Sprintsin, M., Chen, J.M., Czurylowicz, P., 2011. Combining land surface temperature and shortwave infrared reflectance for early detection of mountain pine beetle infestations in western Canada. J Appl Remote Sens 5, 053566. https://doi.org/10.1117/1.3662866
St. Peter, J., Hogland, J., Hebblewhite, M., Hurley, M.A., Hupp, N., Proffitt, K., 2018. Linking Phenolog-ical Indices from Digital Cameras in Idaho and Montana to MODIS NDVI. Remote Sens 10, 1612. https://doi.org/10.3390/rs10101612
Storey, E.A., Stow, D.A., O’Leary, J.F., 2016. Assessing postfire recovery of chamise chaparral using multi-temporal spectral vegetation index trajectories derived from Landsat imagery. Remote Sens Environ 183, 53–64. https://doi.org/10.1016/j.rse.2016.05.018
Stöver, O., Delb, H., Engels, F., Hill, J., Atzberger, C., 1996. An assessment of forest areas damaged by a Gypsy Moth infestation through satellite remote sensing and GIS, in: Proceedings of the Interna-tional Workshop: Application of Remote Sensing in European Forest Monitoring. pp. 359–374.
Štych, P., Šandera, J., Malíková, L., Marcinkowska-Ochtyra, A., Jarocińska, A., Zagajewski, B., 2015. The use of vegetation indices in the evaluation of vegetation phenology based on MERIS data: the Czech Republic case study. AUC Geographica 50, 101–110. https://doi.org/10.14712/23361980.2015.90
Su, Z., Tigabu, M., Cao, Q., Wang, G., Hu, H., Guo, F., 2019. Comparative analysis of spatial variation in forest fire drivers between boreal and subtropical ecosystems in China. Forest Ecology and Management 454, 117669. https://doi.org/10.1016/j.foreco.2019.117669
Tang, X., 2018. Near Real-Time Monitoring of Forest Disturbance: A Multi-Sensor Remote Sensing Ap-proach and Assessment Framework.
Taubert, F., Fischer, R., Groeneveld, J., Lehmann, S., Müller, M.S., Rödig, E., Wiegand, T., Huth, A., 2018. Global patterns of tropical forest fragmentation. Nature 554, 519–522. https://doi.org/10.1038/nature25508
Testa, S., Boschetti, L., Mondino, E.B., 2015. Modis EVI, NDVI, WDRVI, daily and composite: Looking for the best choice to estimate phenological parameters from deciduous forests, in: 2015 IEEE In-ternational Geoscience and Remote Sensing Symposium (IGARSS). Presented at the 2015 IEEE In-ternational Geoscience and Remote Sensing Symposium (IGARSS), pp. 4617–4620. https://doi.org/10.1109/IGARSS.2015.7326857
Thom, D., Seidl, R., 2016. Natural disturbance impacts on ecosystem services and biodiversity in tem-perate and boreal forests. Biological Reviews 91, 760–781. https://doi.org/10.1111/brv.12193
Thomas, C.D., Cameron, A., Green, R.E., Bakkenes, M., Beaumont, L.J., Collingham, Y.C., Erasmus, B.F.N., Siqueira, M.F. de, Grainger, A., Hannah, L., Hughes, L., Huntley, B., Jaarsveld, A.S. van, Midgley, G.F., Miles, L., Ortega-Huerta, M.A., Peterson, A.T., Phillips, O.L., Williams, S.E., 2004. Ex-tinction risk from climate change. Nature 427, 145–148. https://doi.org/10.1038/nature02121
Tritsch, I., Sist, P., Narvaes, I.D.S., Mazzei, L., Blanc, L., Bourgoin, C., Cornu, G., Gond, V., 2016. Multi-ple Patterns of Forest Disturbance and Logging Shape Forest Landscapes in Paragominas, Brazil. Forests 7, 315. https://doi.org/10.3390/f7120315
Tyukavina, A., Hansen, M.C., Potapov, P.V., Stehman, S.V., Smith-Rodriguez, K., Okpa, C., Aguilar, R., 2017. Types and rates of forest disturbance in Brazilian Legal Amazon, 2000–2013. Sci. Adv. 3, e1601047. https://doi.org/10.1126/sciadv.1601047

Monitoring Forests Through Remote Sensing
Final Report
146
Ulsig, L., Nichol, C.J., Huemmrich, K.F., Landis, D.R., Middleton, E.M., Lyapustin, A.I., Mammarella, I., Levula, J., Porcar-Castell, A., 2017. Detecting Inter-Annual Variations in the Phenology of Ever-green Conifers Using Long-Term MODIS Vegetation Index Time Series. Remote Sens 9, 49. https://doi.org/10.3390/rs9010049
UNFCCC, 2011. Outcome of the work of the ad hoc working group on long–term cooperative action under the convention - Draft decision [-/CP.17]. United Nations Framework Convention on Cli-mate Change.
University of New Hampshire, 2018. PhenoCam - About [WWW Document]. PhenoCam Network. URL https://phenocam.sr.unh.edu/webcam/about/ (accessed 3.21.19).
USA National Phenology Network, 2018a. Why Phenology? [WWW Document]. USA National Phenol-ogy Network. URL https://www.usanpn.org/about/why-phenology (accessed 3.19.19).
USA National Phenology Network, 2018b. Data Dashboard | USA National Phenology Network [WWW Document]. USA National Phenology Network. URL https://www.usanpn.org/data/dash-board (accessed 3.19.19).
Vanderhoof, M., Williams, C.A., Ghimire, B., Rogan, J., 2013. Impact of mountain pine beetle out-breaks on forest albedo and radiative forcing, as derived from Moderate Resolution Imaging Spec-troradiometer, Rocky Mountains, USA. Journal of Geophysical Research: Biogeosciences 118, 1461–1471. https://doi.org/10.1002/jgrg.20120
Veraverbeke, S., Dennison, P., Gitas, I., Hulley, G., Kalashnikova, O., Katagis, T., Kuai, L., Meng, R., Roberts, D., Stavros, N., 2018. Hyperspectral remote sensing of fire: State-of-the-art and future perspectives. Remote Sens Environ 216, 105–121. https://doi.org/10.1016/j.rse.2018.06.020
Veraverbeke, S., Rogers, B.M., Goulden, M.L., Jandt, R.R., Miller, C.E., Wiggins, E.B., Randerson, J.T., 2017. Lightning as a major driver of recent large fire years in North American boreal forests. Na-ture Clim Change 7, 529–534. https://doi.org/10.1038/nclimate3329
Veraverbeke, S., Somers, B., Gitas, I., Katagis, T., Polychronaki, A., Goossens, R., 2012. Spectral mix-ture analysis to assess post-fire vegetation regeneration using Landsat Thematic Mapper imagery: Accounting for soil brightness variation. Int J Appl Earth Obs Geoinf 14, 1–11. https://doi.org/10.1016/j.jag.2011.08.004
Verbesselt, J., Robinson, A., Stone, C., Culvenor, D., 2009. Forecasting tree mortality using change metrics derived from MODIS satellite data. For Ecol Manage 258, 1166–1173.
Verger, A., Baret, F., Weiss, M., Kandasamy, S., Vermote, E., 2013. The CACAO Method for Smooth-ing, Gap Filling, and Characterizing Seasonal Anomalies in Satellite Time Series. IEEE T Geosci Re-mote 51, 1963–1972. https://doi.org/10.1109/TGRS.2012.2228653
Verhegghen, A., 2013. Global land surface vegetation phenology using 13 years of SPOT VEGETATION daily observations. UCL - Université Catholique de Louvain.
Verhegghen, A., Eva, H., Achard, F., 2015. Assessing forest degradation from selective logging using time series of fine spatial resolution imagery in Republic of Congo, in: 2015 IEEE International Ge-oscience and Remote Sensing Symposium (IGARSS). Presented at the 2015 IEEE International Geo-science and Remote Sensing Symposium (IGARSS), pp. 2044–2047. https://doi.org/10.1109/IGARSS.2015.7326202
Volcani, A., Karnieli, A., Svoray, T., 2005. The use of remote sensing and GIS for spatio-temporal anal-ysis of the physiological state of a semi-arid forest with respect to drought years. Forest Ecology and Management 215, 239–250. https://doi.org/10.1016/j.foreco.2005.05.063
Monitoring Forests Through Remote Sensing
Final Report
147
Wagner, F.H., Hérault, B., Rossi, V., Hilker, T., Maeda, E.E., Sanchez, A., Lyapustin, A.I., Galvão, L.S., Wang, Y., Aragão, L.E.O.C., 2017. Climate drivers of the Amazon forest greening. PLoS ONE 12, e0180932. https://doi.org/10.1371/journal.pone.0180932
Walker, J.J., de Beurs, K.M., Wynne, R.H., Gao, F., 2012. Evaluation of Landsat and MODIS data fusion products for analysis of dryland forest phenology. Remote Sensing of Environment 117, 381–393. https://doi.org/10.1016/j.rse.2011.10.014
Walker, J. J., de Beurs, K.M., Wynne, R.H., Gao, F., 2012. Evaluation of Landsat and MODIS data fu-sion products for analysis of dryland forest phenology. Remote Sens Environ, Remote Sensing of Urban Environments 117, 381–393. https://doi.org/10.1016/j.rse.2011.10.014
Wang, F., Xu, Y.J., 2010. Comparison of remote sensing change detection techniques for assessing hurricane damage to forests. Environ Monit Assess 162, 311–26. https://doi.org/10.1007/s10661-009-0798-8
Wang, L., Fensholt, R., 2017. Temporal Changes in Coupled Vegetation Phenology and Productivity are Biome-Specific in the Northern Hemisphere. Remote Sens 9, 1277. https://doi.org/10.3390/rs9121277
Waring, K.M., Reboletti, D.M., Mork, L.A., Huang, C.-H., Hofstetter, R.W., Garcia, A.M., Fulé, P.Z., Da-vis, T.S., 2009. Modeling the Impacts of Two Bark Beetle Species Under a Warming Climate in the Southwestern USA: Ecological and Economic Consequences. Environmental Management 44, 824–835. https://doi.org/10.1007/s00267-009-9342-4
Watson, J.E.M., Evans, T., Venter, O., Williams, B., Tulloch, A., Stewart, C., Thompson, I., Ray, J.C., Murray, K., Salazar, A., McAlpine, C., Potapov, P., Walston, J., Robinson, J.G., Painter, M., Wilkie, D., Filardi, C., Laurance, W.F., Houghton, R.A., Maxwell, S., Grantham, H., Samper, C., Wang, S., Laestadius, L., Runting, R.K., Silva-Chávez, G.A., Ervin, J., Lindenmayer, D., 2018. The exceptional value of intact forest ecosystems. Nat Ecol Evol 2, 599–610. https://doi.org/10.1038/s41559-018-0490-x
Weirather, M., Zeug, G., Schneider, T., 2018. Automated Delineation Of Wildfire Areas Using Senti-nel-2 Satellite Imagery. giforum 1, 251–262. https://doi.org/10.1553/giscience2018_01_s251
Wermelinger, B., 2004. Ecology and management of the spruce bark beetle Ips typographus—a re-view of recent research. For Ecol Manage 202, 67–82. https://doi.org/10.1016/j.foreco.2004.07.018
White, J.C., Wulder, M.A., Hermosilla, T., Coops, N.C., Hobart, G.W., 2017. A nationwide annual char-acterization of 25 years of forest disturbance and recovery for Canada using Landsat time series. Remote Sens Environ 194, 303–321. https://doi.org/10.1016/j.rse.2017.03.035
White, J.C., Wulder, M.A., Hobart, G.W., Luther, J.E., Hermosilla, T., Griffiths, P., Coops, N.C., Hall, R.J., Hostert, P., Dyk, A., Guindon, L., 2014. Pixel-Based Image Compositing for Large-Area Dense Time Series Applications and Science. Can J Remote Sens 40, 192–212. https://doi.org/10.1080/07038992.2014.945827
White, K., Pontius, J., Schaberg, P., 2014. Remote sensing of spring phenology in northeastern for-ests: A comparison of methods, field metrics and sources of uncertainty. Remote Sensing of Envi-ronment 148, 97–107. https://doi.org/10.1016/j.rse.2014.03.017
White, M.A., de Beurs, K.M., Didan, K., Inouye, D.W., Richardson, A.D., Jensen, O.P., O’Keefe, J., Zhang, G., Nemani, R.R., van Leeuwen, W.J.D., Brown, J.F., de Wit, A., Schaepman, M., Lin, X., Dettinger, M., Bailey, A.S., Kimball, J., Schwartz, M.D., Baldocchi, D.D., Lee, J.T., Lauenroth, W.K., 2009. Intercomparison, interpretation, and assessment of spring phenology in North America esti-mated from remote sensing for 1982-2006. Glob Change Biol 15, 2335–2359.
Monitoring Forests Through Remote Sensing
Final Report
148
Wolter, P.T., Sturtevant, B.R., Miranda, B.R., Lietz, S.M., Townsend, P.A., Pastor, John., 2012. Forest land cover change (1975-2000) in the Greater Border Lakes region (No. NRS-RMAP-3). U.S. De-partment of Agriculture, Forest Service, Northern Research Station, Newtown Square, PA. https://doi.org/10.2737/NRS-RMAP-3
World Resources Institute, 2019a. Interactive Map | Global Forest Watch [WWW Document]. Global Forest Watch. URL https://www.globalforestwatch.org/map (accessed 4.25.19).
World Resources Institute, 2019b. About GFW | Global Forest Watch [WWW Document]. Global For-est Watch. URL https://www.wri.org/our-work/project/forest-atlases/about (accessed 4.25.19).
Wulder, Michael A., Dymond, C.C., White, J.C., Leckie, D.G., Carroll, A.L., 2006. Surveying mountain pine beetle damage of forests: A review of remote sensing opportunities. For Ecol Manage 221, 27–41. https://doi.org/10.1016/j.foreco.2005.09.021
Wulder, M.A., White, J.C., Bentz, B., Alvarez, M.F., Coops, N.C., 2006. Estimating the probability of mountain pine beetle red-attack damage. Remote Sens Environ 101, 150–166. https://doi.org/10.1016/j.rse.2005.12.010
Wulder, M.A., White, J.C., Carroll, A.L., Coops, N.C., 2009. Challenges for the operational detection of mountain pine beetle green attack with remote sensing. Forest Chron 85, 32–38. https://doi.org/10.5558/tfc85032-1
Yu, B., Chen, F., Li, B., Wang, L., Wu, M., 2017. Fire Risk Prediction Using Remote Sensed Products: A Case of Cambodia. Photogramm Eng Rem S 83, 19–25. https://doi.org/10.14358/PERS.83.1.19
Zhang, G., 2012. Integrating Remote Sensing and Ecosystem Models for Terrestrial Vegetation Analy-sis: Phenology, Biomass, and Stand Age (Dissertation). Utah State University, Logan, Utah.
Zhao, J., Zhang, H., Zhang, Z., Guo, X., Li, X., Chen, C., 2015. Spatial and Temporal Changes in Vegeta-tion Phenology at Middle and High Latitudes of the Northern Hemisphere over the Past Three Decades. Remote Sens 7, 10973–10995. https://doi.org/10.3390/rs70810973
Zhao, M., Running, S.W., 2010. Drought-Induced Reduction in Global Terrestrial Net Primary Produc-tion from 2000 Through 2009. Science 329, 940–943. https://doi.org/10.1126/science.1192666
Zhou, H., Xu, F., Dong, J., Yang, Z., Zhao, G., Zhai, J., Qin, Y., Xiao, X., 2019. Tracking Reforestation in the Loess Plateau, China after the “Grain for Green” Project through Integrating PALSAR and Land-sat Imagery. Remote Sensing 11, 2685. https://doi.org/10.3390/rs11222685
Zhu, X., Skidmore, A.K., Darvishzadeh, R., Wang, T., 2019. Estimation of forest leaf water content through inversion of a radiative transfer model from LiDAR and hyperspectral data. International Journal of Applied Earth Observation and Geoinformation 74, 120–129. https://doi.org/10.1016/j.jag.2018.09.008
