monitoring of environmental changes in asian middle ... · introduction since the recent remarkable...
TRANSCRIPT

MONITORING OF ENVIRONMENTAL CHANGES IN ASIAN MIDDLE LATITUDE ZONE BY ALOS DATA
- ANALYSIS OF CHANGE IN LAND COVER AND GROUND CONDITION - PI No.163
Yasunori Nakayama1, Kunihiko Endo1, Shuji Yamakawa1, Sotaro Tanaka2, Toshiro Sugimura3 and Asako Inanaga3
1 Department of Geosystem Sciences, Nihon University
2 Toyo University 3 Remote Sensing Technology Center of Japan
1. INTRODUCTION Since the recent remarkable environmental change and the frequent abnormal weather pattern have arisen in the middle latitude zone of Asia, the scientific clarification of the influence and cause of the change is expected. Especially, an investigation method to grasp those phenomena and monitor the change situation by applying the various satellite data is anticipated. ALOS observational data is very effective at this point. This paper describes the investigation results of the environmental fluctuation and change based on the natural and artificial causes in Asian middle latitude zone through the detection of micro-geomorphological features and land cover changes by using the multi-temporal and plural satellite data including ALOS data. Three principal study regions including some important regional areas from Central Asia to East Asia and Japan were selected in this study. Several kinds of multi-satellite datasets covering study areas based on ALOS observation data, the existing satellite data and other observed sources were produced. Actual environmental changes and condition such as change in the land cover including closed lakes in arid and semi-arid lands, relation between land cover and flood occurrence, and relation between land cover change and ground subsidence in low land were carried out by analyzing these data sets. Furthermore, the method and algorithm for analysis of detailed land cover, and detection of micro-geomorphological features and ground deformation were examined.
2. BACKGROUND AND OBJECTIVES Due to the rapid environmental change and the frequent abnormal weather pattern have arisen in recent years in the middle latitude zone of Asia, it is necessary to investigate the detailed land cover situation and its change by using various kinds of satellite data. The objectives of this research are to examine the method for monitoring of the wide ranging environmental change phenomena and the frequent disaster situations by using the ALOS data with
the other satellite data. Especially, the causes of the rapid change situation will be investigated by multi-temporal satellite datasets including ALOS data. The actual detailed study purposes are as follows. 1) To reconstruct the environmental change in recent and the prolonged past years through the extraction analysis of geomorphological features showing the water area change situation in the past around closed lakes in semi-arid and arid regions by using ALOS data. 2) To perform fundamental investigation about land cover and land subsidence condition by analyzing ALOS optical and microwave sensor data. 3) To investigate coastline change, land cover change and land subsidence in the delta of Yangtze River by using ALOS optical and microwave sensor data. 4) To develop and apply the investigation method for the relationship between land cover change and flood occurrence.
Fig. 1 Principal study regions such as Central Asia (①), Yangtze River basin (②) and Kanto district in Japan (③)
3. STUDY AREAS The object area covers the middle latitude zone of the Asian continent including Central Asia, East Asia and Japan. Particularly, three principal study regions such as
①
② ③
This document is provided by JAXA.
Tien Shan Mountains and its vicinity, the middle and the lower reaches of Yangtze River in China, and Kanto district in Japan shown as ①, ② and ③ in Fig. 1 were selected for the purpose of the investigation of method and application of ALOS data. Especially, the study regions for the detailed analysis which applied ALOS data are Balkhash Lake, Aral Sea and other closed lakes in Central Asia, Dongting Lake and its vicinity in the middle reaches of Yangtze River, Yangtze Delta including Shanghai, and Kanto district including Tokyo.
4. METHODOLOGY The method of the analysis or investigation which applied ALOS data is as follows. 1) To perform the examination and evaluation of an algorithm of DSM production by the PRISM stereo pair data for the purpose of the extraction of micro-geomorphological feature distribution around lakes or in plain. 2) To investigate a method for detailed analysis of changes in lake water area and land cover based on natural or artificial situation by the DSM created from PRISM data and the AVNIR-2 image, and execute actual analysis by this method. 3) To detect the ground deformation in and around big cities over soft ground by applying PALSAR DInSAR technology. 4) To perform the trial estimation of disaster as flood based on analysis results of land cover change and ground deformation. 5) To practice a trial improvement of the accuracy of land cover classification through the integrated processing of AVNIR-2 and PALSAR data. As for concrete method for every main subject of study, multi-temporal and plural satellite data sets from the 1960’s to the 2000’s were firstly produced in each study area from ALOS data with the existing satellite one. Next, in arid and semi-arid lands in Central Asia, the development and evaluation of an algorithm for the high precision DSM production from PRISM stereo pair data for the purpose of the detection of micro-geomorphological features in and around closed lakes were carried out. Then, after actual production of DSM from the algorithm, change in closed lake was investigated by the integrated analysis of the land cover condition with the characteristics of DSM in the drainage basin. In Kanto district, the ground deformation of about tens mm was analyzed by the DInSAR technology which applied the plural PALSAR data, and investigation for improvement in the land cover classification accuracy based on the integrated analysis of SAR and optical sensor data was practiced. In the Yangtze Delta, coastline change in the river-mouth by time series satellite data and the ground deformation by SAR data were detected, and those influences were also investigated. Furthermore, in the middle reaches of
Yangtze River, the topography distribution around and in the bottom of Dongting Lake were experimentally analyzed by DSM created from PRISM stereo pair data, and the initial analysis of influence to flood occurrence was practiced
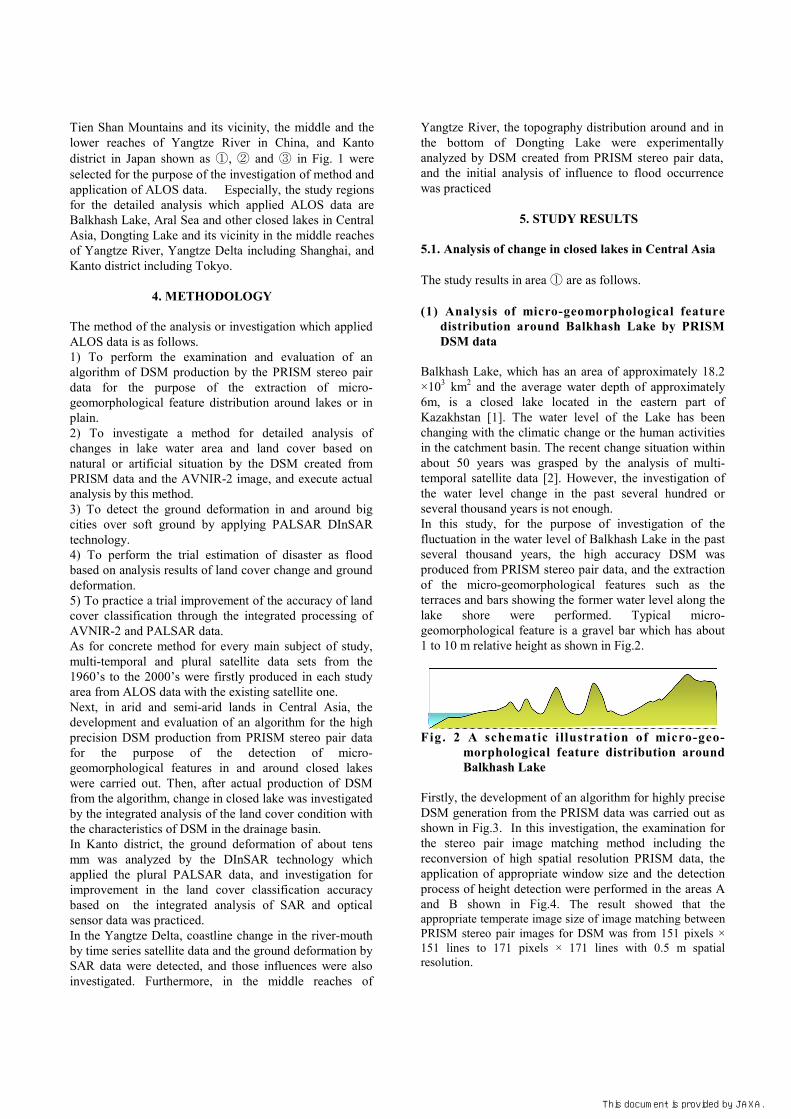
5. STUDY RESULTS 5.1. Analysis of change in closed lakes in Central Asia The study results in area ① are as follows. (1) Analysis of micro-geomorphological feature distribution around Balkhash Lake by PRISM DSM data Balkhash Lake, which has an area of approximately 18.2 ×10³ km2 and the average water depth of approximately 6m, is a closed lake located in the eastern part of Kazakhstan [1]. The water level of the Lake has been changing with the climatic change or the human activities in the catchment basin. The recent change situation within about 50 years was grasped by the analysis of multi-temporal satellite data [2]. However, the investigation of the water level change in the past several hundred or several thousand years is not enough. In this study, for the purpose of investigation of the fluctuation in the water level of Balkhash Lake in the past several thousand years, the high accuracy DSM was produced from PRISM stereo pair data, and the extraction of the micro-geomorphological features such as the terraces and bars showing the former water level along the lake shore were performed. Typical micro-geomorphological feature is a gravel bar which has about 1 to 10 m relative height as shown in Fig.2.
Fig. 2 A schematic illustration of micro-geo- morphological feature distribution around Balkhash Lake Firstly, the development of an algorithm for highly precise DSM generation from the PRISM data was carried out as shown in Fig.3. In this investigation, the examination for the stereo pair image matching method including the reconversion of high spatial resolution PRISM data, the application of appropriate window size and the detection process of height detection were performed in the areas A and B shown in Fig.4. The result showed that the appropriate temperate image size of image matching between PRISM stereo pair images for DSM was from 151 pixels × 151 lines to 171 pixels × 171 lines with 0.5 m spatial resolution.
This document is provided by JAXA.

Next, accuracy verification for detection of micro topographies along the former lake shore line was carried out by comparison with the field survey data and the existing SRTM DEM at same areas. A sample of the pan-sharpened image by PRISM and AVNIR2 data and PRISM DSM color image at area B are shown in Fig.5. Fig.6 describes an example of the comparison result between PRISM DSM and field survey measurement by the profile of relative height along a dotted line in Fig.5 (area B). This result showed that the DSM derived from PRISM data by a new algorithm was sufficient to extract 1 – 10 m height micro-geomorphological feature distribution, and it was far excellent compared with the existing SRTM DEM. Fig.3 A procedure of DSM production, its evaluation and investigation of micro-topographic features distribution. Fig.4 LANDSAT/ETM+ mosaic image of Balkhash Lake showing distribution of areas of PRISM DSM production
Fig.5 Pan-sharpened image by PRISM and AVNIR2 Data (left) and PRISM DSM color image (right) showing micro-geomorphological features at area B of Balkhash Lake
Fig.6 Comparison result between DSM and field survey measurement by the profile of relative height. Straight line and dashed line show PRISM DSM and field survey measurement result respectively. Furthermore, DSMs were created from the PRISM stereo pair data by the new algorithm and detailed distribution of micro-geomorphological features was investigated at 18 areas shown with the rectangles of the orange color in Fig.4. The pan-sharpened images and PRISM DSM color images of the area C, D and E are shown in Fig.7-9 [3], [4].
Fig.7 Pan-sharpened image (left) and PRISM DSM c o l o r i m a g e ( r i g h t ) s h o w i n g mi c r o - geomorphology at area C of Balkhash Lake
ALOS/PRISM 1B2 data with scene location information
Geometrical correction to UTM coordinates system
Stereographic pair image with 0.5m spatial resolution
Examination of window size for template matching by correlation coefficient
Processing of image matching
Creation of PRISM DSM
Investigation of micro-geomorphology distribution
Evaluation of relative height
Field survey measurements
A
B
C D
E
This document is provided by JAXA.

Fig.8 Pan-sharpened image (left) and PRISM DSM c o l o r i m a g e ( r i g h t ) s h o w i n g m i c r o - geomorphology at area D of Balkhash Lake
. Fig.9 Pan-sharpened image (left) and PRISM DSM c o l o r i ma g e ( r i g h t ) s h o w i n g mi c r o - geomorphology at area E of Balkhash Lake Finally, the characteristics of micro-geomorphological feature distribution of three typical patterns affected by the influence of past water level changes and winds or waves as shown in Fig.10 has been grasped by the result of extraction and analysis of the DSM in 18 areas. According to these results, the possibility of the recreation of the former water areas in chronological order of the high-water level of Balkhash Lake was shown [5].
Fig.10 Height profiles of micro-geomorphological feature distribution of three typical patterns around Balkhash Lake
(2) Analysis of the geomorphological features of the former lake bottom in the Aral Sea by PRISM DSM Although the Aral Sea is a typical closed lake located in Central Asia as well as Balkhash Lake, it has been showing the change of remarkable reduction of the water area. The water level has been showing drawdown quickly in past 50 years, and water area became 15% or less compared with one of about 1960. The satellite images of the Aral Sea of the mid 1970’s and the summer of 2008 are shown in Fig.11. Since water area became the smallest in the summer of 2009 and the previous lake bottom was dried up in the wide area, DSM over the lake bottom was experimentally created from the ALOS/PRISM stereo pair data observed at this year by using the algorithm developed in Balkhash Lake, the possibility of creation of detailed bathymetric map was investigated.
Fig.11 LANDSAT/MSS mosaic image in 1977 (left) and MODIS image in 2008 (right) of Aral Sea. An orange rectangle in MODIS image shows the analysis area of PRISM data. Fig.12 is A PRISM image showing the area of DSM creation as the orange rectangle in the right image of Fig.11. This object area covers 10km x 20km region. The created DSM color image is shown in Fig.13. The height profile along the deep purple dotted line described from north to south in the central part of the DSM image is shown in Fig.14 as a blue line. The brown line shows the height of the lake bottom read from the existing old bathymetric map. According to comparison of the heights in this graph, the possibility of describing of the slight topographical features over the previous lake bottom by PRISM DSM was considered. Therefore, if DSM over the lake bottom showing the past Aral Sea using PRISM stereo pair data is created in future study, the possibility of the creation of the detailed bathymetric map was shown.
height (m)
Distance (m)
This document is provided by JAXA.

Fig.12 PRISM image showing the area of DSM creation Fig.13 DSM color image derived from PRISM stereo pair images in the north area of former Aral Sea
Fig.14 Height profiles along the dotted line of PRISM DSM image of Fig.13. Blue line was described from DSM and brown line described from the existing past bathymetric map.
(3) Analysis of the geomorphological features in and around closed lake in Central Asia by ALOS PRISM and AVNIR-2 data Although many closed lakes which have different size of water area except Balkhash Lake and Aral Sea are distributed in Central Asia, they are showing each characteristic fluctuation in the water area under the influence of climate change or human activities. Therefore, authors are also investigating the distribution of the micro-geomorphological features over the lake bottom or around the lakes through creation of pan-sharpened image from AVNIR-2 and PRISM data, and the DSM creation from PRISM stereo pair data [6]. An example of DSM color image created from the PRISM data and AVNIR-2 color composite image for the change analysis of the Manas Hu in Dzungaria Basin of Xinjiang Uygur Province in China are shown in Fig.15. Though this analysis is continuing now, it has been showed that the micro- geomorphological features such as terrace and bar formed by the past water level fluctuation of the lake could be extracted clearly by using PRISM DSM. Fig.15 AVNIR-2 color composite image (left) and DSM color image created from the PRISM stereo pair data (right) of Manas Hu in Dzungaria Basin of Xinjiang Uygur Province in China 5 .2 Analysis of land cover change and ground deformation in Kanto The study results in area ③ are as follows. (1) Application of ALOS/PALSAR DInSAR analysis for ground deformation in soft ground of Tokyo Many of big cities in the world are located in the soft ground zone which consists of alluvium along the seashore or riverside. For this reason, if land subsidence arises here, the risk of the damage caused by high tide or flood accompanying typhoon or localized torrential downpour will become higher. In this study, investigation of the ground deformation detection by the DInSAR processing using SAR data was carried out in Tokyo area covering the reclamation lands along Tokyo Bay. ALOS/PALSAR data was mainly applied and JERS-1/SAR data was also
This document is provided by JAXA.

used for the comparative analysis. As this result, about 25 mm land subsidence was clearly detected in two years of the late 2000’s in Urayasu. Fig.16 and Fig.17 show a used PALSAR image and the DInSAR processing image for two years from 2007 to 2009, respectively. Moreover, the DInSAR processing images which expanded the ground deformation detection area of Urayasu in three periods of 1992 to 1997, 2007 to 2009, and 2006 to 2010 are shown in Fig.18 to Fig.20, respectively. Since comparison result between the DInSAR processing result and the leveling result showed clear coincidence, it was confirmed that DInSAR image shows suitable subsidence information. Fig.21 also shows the LANDSAT/MSS and ALOS/AVNIR-2 images in 1979 and 2009 of same area.
Fig.16 PALSAR image covering Tokyo area
Fig.17 DInSAR processing image for two years from 2007 to 2009 of Tokyo
Fig.18 DInSAR processing image for two years from 1992 to 1997 of Urayasu city
Fig.19 DInSAR processing image for two years from 2007 to 2009 of Urayasu city
Fig.20 DInSAR processing image for two years from 2006 to 2010 of Urayasu city Based on the comparison result with the land cover change by the time series optical sensor images and geological maps, it was understood that this phenomenon was
This document is provided by JAXA.

subsidence by the soft ground distribution and had the possibility of a continuous phenomenon to the future [7].
Fig.21 LANDSAT/MSS and ALOS/AVNIR-2 images In 1979 and 2009 of Urayasu city (2) Application of ALOS/PALSAR data for land cover classification analysis in Kanto district Although many big cities in the world are distributed over low land such as alluvium, the risk of flood occurrence due to the increase in severe rain or typhoon in connection with the climate change represented by global warming is becoming higher. Micro-geomorphological feature distribution of the low land influences the occurrence of flood and its damage greatly. This study aims at the improvement of the land cover classification reflected micro-geomorphological feature distribution by applying SAR data to the conventional classification by optical sensor data. ALOS/AVNIR-2 data and multi seasonal and polarization PALSAR data are used. The study area is the central part of Kanto Plain including Tokyo urban area. The multi-seasonal color composite images of AVNIR-2 and PALSAR data are shown in Fig.22, and those classification images are shown in Fig.23, respectively. Although the study is under execution continuously now, the possibility of the classification in consideration of micro-geomorphological feature distribution was suggested by the integrated classification of SAR and optical sensor data [8].
Fig.22 Multi-seasonal color composite images of AVNIR-2 (left) of PALSAR data (right)
Fig.23 Land cover classification images based on multi-seasonal AVNIR-2 (left) and PALSAR data (right) 5.3 Investigation of change in Yangtze River Basin The study results in area ② are as follows. (1) Coastline change in Yangtze Delta by multi- temporal satellite data Yangtze River (Chang Jiang) is the large river flowing from Tibet plateau to the East China Sea with crossing China. The Yangtze Delta formed in the river mouth of Yangtze River has been expanding from ancient times by the sediments such as soil and sand carried by Yangtze River. The speed of the expansion increased remarkably with the increase in the erosion of mountain slop based on the farmland and urban development in the middle and upper reaches of the river. However, since Three Gorges Dam was completed in the middle reaches in 2009, the possibility of coastal erosion is pointed out by the decrease in sedimentation.
Fig.24 AVNIR-2 color composite image of 2010 covering Yangtze River mouth
This document is provided by JAXA.

Fig.25 Change situation of the coastlines of Yangtze Delta from 1960 to 2010 Authors have been investigating the change situation of the Yangtze Delta for about 50 years by analyzing multi-temporal and various kinds of satellite data. In this study, the investigation of change of the coastline of the delta was also carried out through the integrated analysis of ALOS and other satellite data. Two scenes of ALOS/AVNIR-2 data observed in 2007 and 2010 were used. Fig.24 is the AVNIR-2 color composite image of 2010 covering Yangtze River mouth and Fig.25 shows the change situation of the coastline of the delta from 1960 to 2010. The analysis result showed that the change situation of Yangtze Delta became reducing after 2001 which was contrary to the continuous expanding until 2000. The correspondence with the construction of Three Gorges Dam in the middle reaches and expansion of afforestation in the middle and upper reaches of Yangtze River was presumed as this reason. Consequently, due to the possibility of flood and their damages, the necessity for continuous monitoring of change in Yangtze Delta was indicated. (2) Application of ALOS/PALSAR DInSAR analysis for ground deformation in soft ground of Shanghai Shanghai is a big city which has developed on the soft ground in the Yangtze Delta. In this study, analysis of the detection for ground deformation by the DInSAR processing using PALSAR data was carried out like Tokyo. The used PALSAR image and DInSAR processing image are shown in Fig.26 and Fig.27 respectively. The analysis result showed detection of the pattern of a maximum 25 mm land subsidence in two years of the late 2000’s at several places of Shanghai urban area and its vicinity. It was considered that the pattern of these areas was based on land subsidence since damage to the foundation of some buildings was recognized by the field survey. Moreover, it was presumed that the cause of land
subsidence of these areas was based on occurrence of the compaction of soft ground accompanying rapid construction of many high-rise buildings and large-scale factories, etc in recent years, through the analysis of time series optical sensor images and field survey [7].
Fig.26 Used PALSAR image covering study area in Shanghai
Fig.27 DInSAR processing image from 2007 to 2010 of Shanghai (3) Change in lakes and land cover in the middle reaches of Yangtze River In the middle reaches of Yangtze River from Three Gorges Dam to Nanjing, frequent large floods occurred because the river meanders in the very gentle slope. There
This document is provided by JAXA.

are a few large lakes such as Dongting Lake and Poyang Lake which have a function as natural retarding basin. According to the detailed analysis results of water area, bathymetric features and land cover change in the catchments basin, the relationship between the change in the lake or the land cover and the flood occurrence was expected. The analysis of AVNIR-2 and PRISM data with time series data sets from 1960s to 2010 is under execution continuously [9], [10].
6. CONCLUSION In this study, environmental change monitoring was carried out by actual analyses for land cover change and ground deformation in several areas of the Asian latitude zone using ALOS PRISM, AVNIR-2, and PALSAR data, through the development of a highly precise DSM creation algorithm, and investigation of change analysis method. The conclusion of the study is summarized as follows. 1. The development of an algorithm for highly precise DSM generation from the PRISM stereo pair data was carried out through the investigation for the stereo pair image matching method, the application of appropriate window size and the detection process in the area of Balkhash Lake. 2. The result of accuracy verification for detection of micro-morphological features using the PRISM DSM showed sufficient to extract 1 – 10 m height features around Balkhash Lake and excellent compared with the existing SRTM DEM. 3. The characteristics of micro-geomorphological feature distribution of three typical patterns and the possibility of the recreation of the former water areas in chronological order of Balkhash Lake was investigated by the analysis of crated DSM. 4. The investigation of created PRISM DSM in Aral Sea and other closed lakes showed that the possibilities of describing of the slight topographical features over the previous lake bottom and the creation of the detailed bathymetric map. 5. The ground deformation analysis by the DInSAR processing using ALOS PALSAR data in Tokyo area indicated clearly about 25 mm land subsidence based on the soft ground distribution in two years of the late 2000’s in Urayasu. 6. The investigation of the improvement of land cover classification using ALOS PALSAR suggested the integrated classification of SAR and optical sensor data 7. The analysis result of coastline change in Yangtze Delta by multi-temporal satellite data including ALOS AVNIR-2 data described the reducing of the area after 2001 which was contrary to the continuous expanding until 2000, and the cause was the correspondence with the constriction of Three Gorges Dam and the expansion of afforestation in the river basin. 8. The ground deformation analysis by the DInSAR
processing using ALOS PALSAR data also indicated a maximum 25 mm land subsidence based on occurrence of the compaction of soft ground accompanying rapid construction of many large buildings or factories in two years of the late 2000’s at several places of Shanghai urban area and its vicinity. Acknowledgement This study is conducted under the agreement of JAXA Research Announcement. Authors express their great gratitude to Prof. J. Kubota and Dr. M. Watanabe for providing some satellite data, field survey information and the opportunity of meetings or field surveys as the project “Historical Interactions between Multi-cultural Societies and the Natural Environment in a Semi-arid Region in Central Eurasia” of the Research Institute for Humanity and Nature. They also thank Prof. T. Sugai of Tokyo University, Prof. H. Soma of Nara Women’s University and Prof. T. Haraguchi of Osaka City University for their thoughtful comments and information. The authors are grateful to Mr. Y. Hara, Mr. M. Ueda, Ms. Kitta, Mr. H. Shimizu, Ms. A. Saito, Mr. N. Nagatake, Ms. S. Ogino, Mr. Y. Furuno, S. Takayanagi and Mr. N. Murayama for providing results of their research and data processing works. 7. REFERENCES [1] National Astronomical Observatory, “Rika nenpyo (Chronological Scientific Tables),” Maruzen Co., Ltd., pp. 586-587, 2003. [2] Y. Nakayama, and S., Ogino, “Recent change in the water area of Aral Sea and Lake Balkhash by satellite data,” Proc. of the 2007 Meeting, The Japanese Association for Arid Land Studies, pp.17-18, 2007 (in Japanese). [3] Y. Nakayama, and S. Ogino, “Production of DEM for Analysis of Microtopographical Features around Balkhash Lake by ALOS PRISM Data,” Transactions of the Japan Society for Aeronautical and Space Sciences, Aerospace Technology Japan, (in printing). [4] Y. Hara, Y. Nakayama, K. Endo, T. Sugai, H. Shimizu, and R. Kondo, “Analysis of micro-topographical feature distribution for reconstruction of the past Balkhash Lake by ALOS/PRISM data,” Proc. of The 48th Spring Conference of The Remote Sensing Society of Japan, pp.221-222, 2010 (in Japanese). [5] Y. Nakayama, Y. Hara, K. Endo, T. Sugai, and H. Shimizu, “Investigation of field survey for micro-geomorphology around Balkhash Lake, - Investigation and analysis in 2009 by remote sensing -,” Project report on an Oasis-region, Vol.8 No.1, pp.87-92, 2010 (in Japanese). [6] Y. Furuno, Y. Nakayama, K. Endo, and G. Mu, “Analysis of environmental change in arid region based
This document is provided by JAXA.

on the investigation of fluctuation in water area of closed lake by time series satellite data - In the catchment basin of Hei He in China -,” Proc. of the institute of Natural Sciences, Nihon University, 43, pp.325-335, 2008 (in Japanese). [7] M. Ueda, Y. Nakayama, N. Tomiyama, Y. Yamanokuchi, X. Zheng, and L. Zhou, “An analysis of ground deformation in coastal zone of large cities by using D-InSAR processing, - A case study in Tokyo and Shanghai -,” Proc. of the Institute of Natural Sciences, Nihon University, 46, (in printing). [8] H. kitta, and Y. Nakayama, “Analysis for characteristic of land-cover classification by using multi-temporal ALOS/PALSAR data,” Proc. of The 49th Autumn Conference of The Remote Sensing Society of Japan, pp.207-208, 2010 (in Japanese). [9] Y. Nakayama, J. Nakamura, H. Abe, and D. Yun, “An An analysis of the flood area in the middle reaches of the Yangtze River by satellite and DEM data,” Proc. of the institute of Natural Sciences, Nihon University, 44, pp.177-185, 2009 (in Japanese). [10] N. Murayama, and Y. Nakayama, “Investigation of change in lakes and its effect for flood of the middle reaches of Yangtze River by the analysis of satellite data,” Proc. of The Institute of Natural Sciences, Nihon University, 40, pp.131-139, 2005 (in Japanese).
This document is provided by JAXA.