monitoring of environmental change using … · 205 int. j. lifesc. bt & pharm. res. 2012 t...
TRANSCRIPT
205
Int. J. LifeSc. Bt & Pharm. Res. 2012 T Phanidra Kumar et al., 2012
MONITORING OF ENVIRONMENTAL CHANGEUSING GEOINFORMATICS TECHNOLOGY:
A CASE STUDY OF ATTAPADY BLOCK,WAYANAD DISTRICT,KERALA
T Phanidra Kumar1*, R R Hermon1, V Madhava Rao, P Kesava Rao1,Ravi Shankar S S1 and NSR Prasad1
Research Paper
The receding glaciers, shrinking cover of natural forests, the rapid loss of biodiversity, the fallingground water levels, rising temperature, falling agricultural productivity, point to the destructinghealth of the ecosystems, not well known in the past. The Nilgiri Biosphere Reserve is not out ofbounds for the same and experienced high rates of deforestation over period of time. It is beingenvisaged judicious and realistic land cover and land use change data in conservation planning,accurate and efficient techniques to detect forest change from multi-temporal satellite imageryare desired for conservation optimally. The Attapady block, in Wynad district of Kerala State wasa treasure house of dense forest and biodiversity and over a period of time, with intense pressureof human land use pattern, wide scale degradation occurred. It is imperative to conserve andreclaim lands for judicious and optimum use of land and water potential, and through alternativesfor land use, economic, social conditions, and changes of ecosystems. In view of this scenario,a study was taken up in Attapady block, primarily to study changes in vegetation type, densityand extent, analyze the extent of deforestation and to understand the temporal changes. NDVIwas used to identify the changes in density of vegetation and the change matrix identified thevariations in the land cover over period of time. DGPS marked critical locations. Periodic monitoringto arrest deforestation will be a necessity. Regulatory framework on water use for irrigation, landuse, forest resource use, incentives on conservation, regeneration and protection measureswill remarkably improve the development scenario, for which the monitoring of environmentalchange using Geoinformatics technology is imperative.
Keywords: Land use land cover classification, Image Classification, NDVI, RVI, Change Detection
*Corresponding Author: T Phanidra Kumar, [email protected]
ISSN 2250-3137 www.ijlbpr.comVol. 1, No. 2, April 2012
© 2012 IJLBPR. All Rights Reserved
Int. J. LifeSc. Bt & Pharm. Res. 2012
1 Centre on Geoinformatics Application in Rural Development (CGARD), National Institute of Rural Development, Hyderabad.
INTRODUCTIONHuman society today is faced with an ecologicalcrisis of its own making, the consequences ofwhich would not only be borne by our futuregeneration but would also drastically alter our livesin the immediate future. Closer home in India, the
receding glaciers, shrinking cover of naturalforests, the rapid loss of biodiversity, the fallingground water levels, inter annual variation inrainfall, rising temperature, falling agriculturalproductivity, point to the destructing health of ourecosystems as if bordering the tipping point if not

206
Int. J. LifeSc. Bt & Pharm. Res. 2012 T Phanidra Kumar et al., 2012
well past it. In recent years the falling health ofour ecosystem is palpably felt in both urban andrural areas. The remote and inaccessible forestsof Nilgiri Biosphere Reserve have experiencedhigh rates of deforestation corresponding tohuman migration and expansion of the agriculturalfrontier. Given the importance of land cover andland use change data in conservation planning,accurate and efficient techniques to detect forestchange from multi-temporal satellite imagerywere desired for implementation by localconservation organizations. It is the commonagreement to go for exploitation of thoseresources, which are not attended optimally tillnow. Two such lands qualify for the category isthe Attapady block. Earlier these areas weretreasure house of dense forest, was cleared bythe people migrated from Tamil Nadu, Karnataka,and from Central Travancore. Intensive andruthless felling of trees made Attapady as awasteland. For the conservation and reclamationof these lands it is necessary to map them andmonitor the changes in the spatial extent overspecified time. Monitoring the locations anddistributions of Land Cover changes is importantfor establishing links between policy decisions,regulatory actions and subsequent land useactivities. Planning plays a key role in themanagement of making best use of limitedresources. Land use planning is the systematicassessment of land and water potential,alternatives for land use, economic and socialconditions in order to select and adopt the bestland use options. Its purpose is to select and putinto practice those land area that will best meetthe needs of the people while safeguardingresources for the future. Integrated use of GIS,Remote Sensing and Image processingtechnologies enable us to cope with theobjectives of change detection. Most of thechanges of ecosystems are happening on earth
is in close proximity of human inhabitations.
OBJECTIVES1. To study changes in vegetation type, density
and extent in Attapady block of Palakkad
District, Kerala State.
2. To analyze the extent of deforestation in
Attapady Block.
3. To identify the changes in density of vegetation.
4. To understand the temporal changes.
STUDY AREAAttapady is situated in an elevated picturesquemountainous plateau in Western Ghats andgeographic coordinates are 76o 23’13’’ - 76o 48’08’’ E Longitude, 10o 55’ 06’’-11o 14’16’’ N Latitudeat the South-Western part of Nilgiri BiosphereReserve portion of the Kerala state. The area isbounded in the north by Nilgiri District of TamilNadu, in West by Malappuram District andMannarkad Blcok, in the south by Mannarkad andMalampuzha blocks of Palakkad District and in
the east by Coimbatore District (Tamil Nadu).
Name of Toposheet Year ofBlock Number Scale Survey
Attapady 58 A8, 58 A12, 1:50000 1969-1970 and58 A16, 58 B9 1975 -1976
IRS 1D LISS 1992,1997,2001III Images and 2005
Data Products Used
METHODOLOGYThe study was taken up to assess the measures
taken up by the government for prevent the
deforestation in the attapady block. The study was
carried out specifically for the years, 1992, 1997,
2000, 2001, 2005 and 2007.To reach the
objectives of the study, the satellite images were
procured for every year starting from 1992. These
images were corrected for both Geometric and
Atmospheric corrections. Using the subsetting
options these images were later subsetted as per
207
Int. J. LifeSc. Bt & Pharm. Res. 2012 T Phanidra Kumar et al., 2012
the study area .These images were later classifiedusing the hybrid classification method by takingapproximately 100 classes. Based on the spectralreflectance of the different land use classes the100 classes were grouped in to ten classes andtheir aerial extent was calculated. The vegetationindices NDVI were used to identify the changesin the density of vegetation after theimplementation of the government restorationefforts. The NDVI helps in identifying the changesin the vegetative cover apart from the normalvegetation. The change matrix technique wasused to identify the variations in the land coverover a period of time from one type to another.The field survey was carried out using the DGPSto mark the location of the critical places in thestudy area and also to check the field accuracyof the land use land cover map prepared fromthe satellite imagery. After the field visit theaccuracy assessment method was used to testthe accuracy of the land use land cover resultsgenerated from the satellite imagery. For thechange detection studies the pre and post satellite
S. No. Class Name Class Code Area (Sq.Km)
1992 1997 2001 2005
1 Barren Land BR 33.78 24.28 69.32 53.34
2 Crops CR 24.20 68.65 23.38 20.48
3 Degraded Forest DGF 14.78 73.59 61.28 68.37
4 Dense Forest DF 277.26 248.89 246.04 234.43
5 Dense Scrub DS 75.48 44.77 63.57 102.40
6 Land with Scrub LWS 95.95 102.27 87.97 87.77
7 Land without Scrub LWOS 46.25 37.15 51.25 65.28
8 Open Forest OF 142.55 119.47 93.94 53.56
9 Plantations PL 31.09 20.57 44.31 55.17
10 Water Body WT 3.66 5.36 3.95 4.20
Total 745.00 745.00 745.00 745.00
Table 1: Land Use/Land Cover, 1992-2005 - Attapady Block
data was taken for performing the change
detection studies.
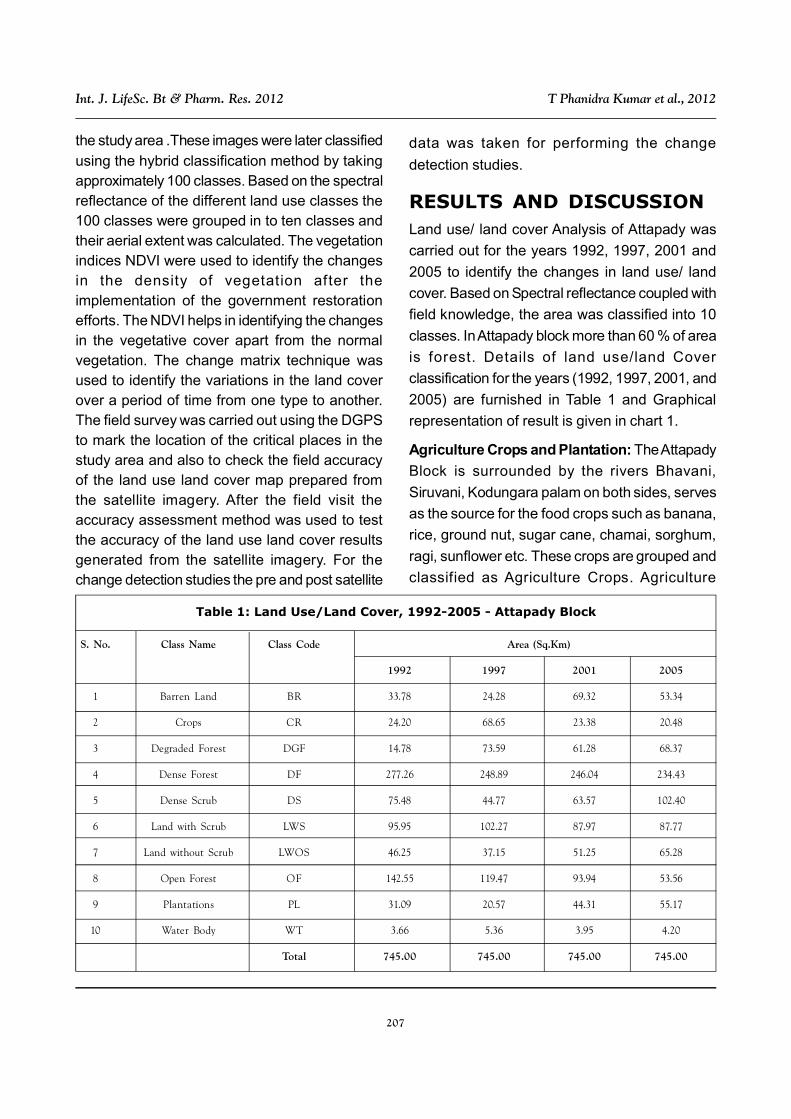
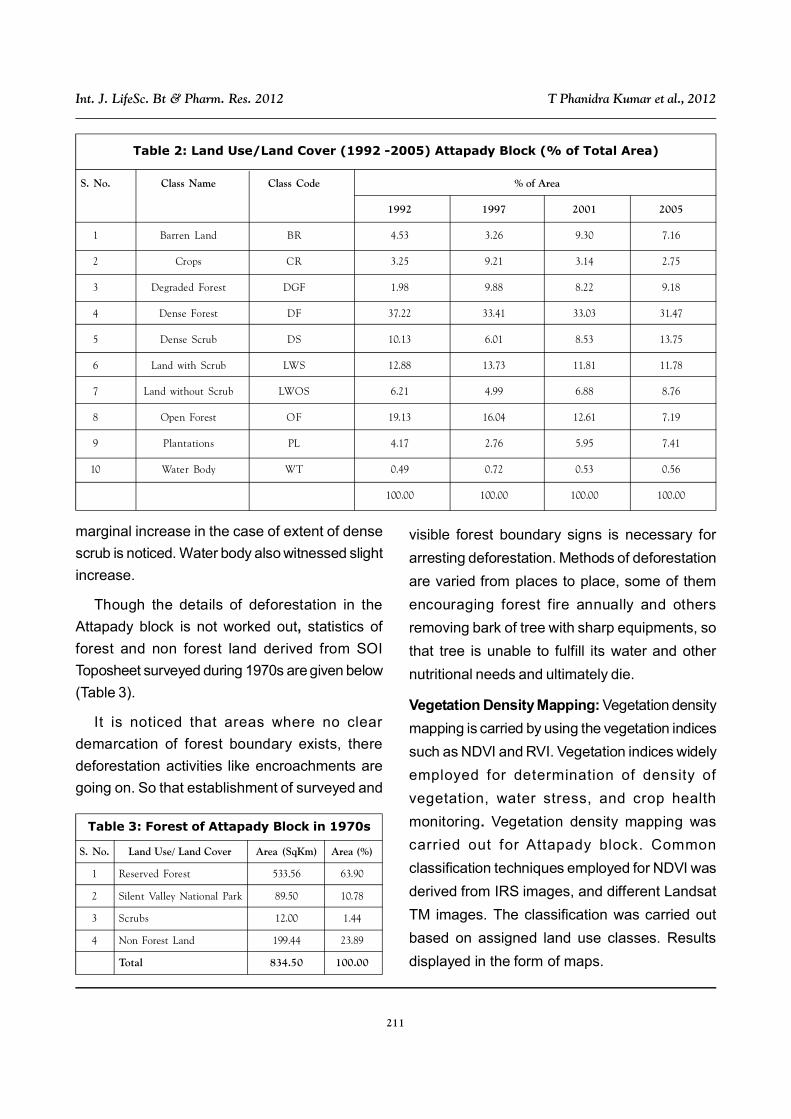
RESULTS AND DISCUSSIONLand use/ land cover Analysis of Attapady was
carried out for the years 1992, 1997, 2001 and
2005 to identify the changes in land use/ land
cover. Based on Spectral reflectance coupled with
field knowledge, the area was classified into 10
classes. In Attapady block more than 60 % of area
is forest. Details of land use/land Cover
classification for the years (1992, 1997, 2001, and
2005) are furnished in Table 1 and Graphical
representation of result is given in chart 1.
Agriculture Crops and Plantation: The Attapady
Block is surrounded by the rivers Bhavani,
Siruvani, Kodungara palam on both sides, serves
as the source for the food crops such as banana,
rice, ground nut, sugar cane, chamai, sorghum,
ragi, sunflower etc. These crops are grouped and
classified as Agriculture Crops. Agriculture
208
Int. J. LifeSc. Bt & Pharm. Res. 2012 T Phanidra Kumar et al., 2012
Plantation comprises of rubber is found in thesouthern part of Attapady block. Coconut,Arecanut are seen on either side of the rivers.Chart 2 and Chart 3 is graphically represent, thetrends in cultivation of crops and area change ofplantation during the period of 1992 -2005. Fromthe charts it is visible that area under cropsremained stable throughout the period. But a twofold increase was recorded in 1997; it may bedue to high rainfall during 96-97, moreover in theseperiods cash crops are facing severe price
depreciation so that people may be entrusted in
the production of food crops. In the case of
plantation, a gradual and steady increase is seen.
Forest: In Attapady block forests are classified
into four types’ namely dense forest, open forest,
degraded forest, and dense scrub. Dense forest
(> 40% canopy cover) is seen in the undisturbed
area of Attapady block and is characterized with
dense foliage. Chart 4 graphically represents, the
Geographical extent of dense forest from 1992 -
2005 period is remaining almost stable, minor
fluctuations are noticed, may be due to variation
in the rainfall and other climatic variables.
Chart 3: Dense Forest (1992-2005) -Attapady Block
Chart 4: Open Forest (1992-2005) -Attapady Block
Landuse/Landcover (1992-2005) -Attapady Blcok
Chart 2: Plantations (1992-2005) -Attapady Block
Chart 1: Crops (1992-2005) -Attapady Block
209
Int. J. LifeSc. Bt & Pharm. Res. 2012 T Phanidra Kumar et al., 2012
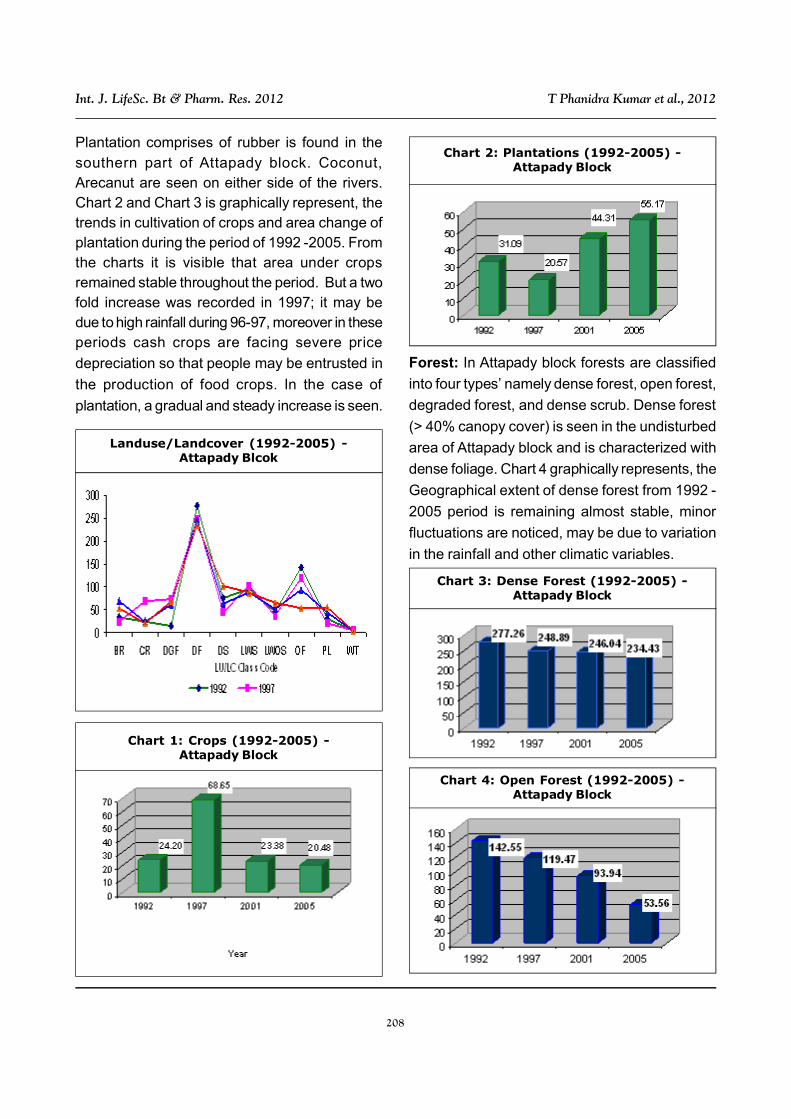
Open forests (10-40 % canopy cover) are
seen in isolated patches along the moderately
sloped areas of Attapady block near to human
settlements. In the open forest area vegetation
density is less compared to dense forest. Chart
5 graphically represent the trend of change of area
of open forest from 1992-2005 and it was
observed that the extent is decreasing.
Dense scrubs areas are characterized with
scrub vegetation, which are seen in the certain
area only and that is by the side notified area and
in the eastern part of the Attapady block receiving
lesser rainfall .The areal extents are graphically
represented in Chart 6.
Degraded forests (< 10% canopy cover) are
the land that comes under the forest area.
Degraded forests are found near to private land
holding and at proximity to open forest. These
lands are formed due to intensive felling of trees
because of human greed. There are tremendous
efforts going on to regenerate degraded forest by
planting trees with fencing, by Forest Department
and AHADS a social organization. Chart 7
graphically represents the degraded forests which
exhibits slight increase in 2005 as compared to
2001.
Scrub Land : Scrub land (10-40% canopy) are
mostly seen in the private holding at the eastern
Chart 6: Degraded Forest (1992-2005) -Attapady Block
Chart 5: Dense Scrub (1992 -2005)Attapady Blcok
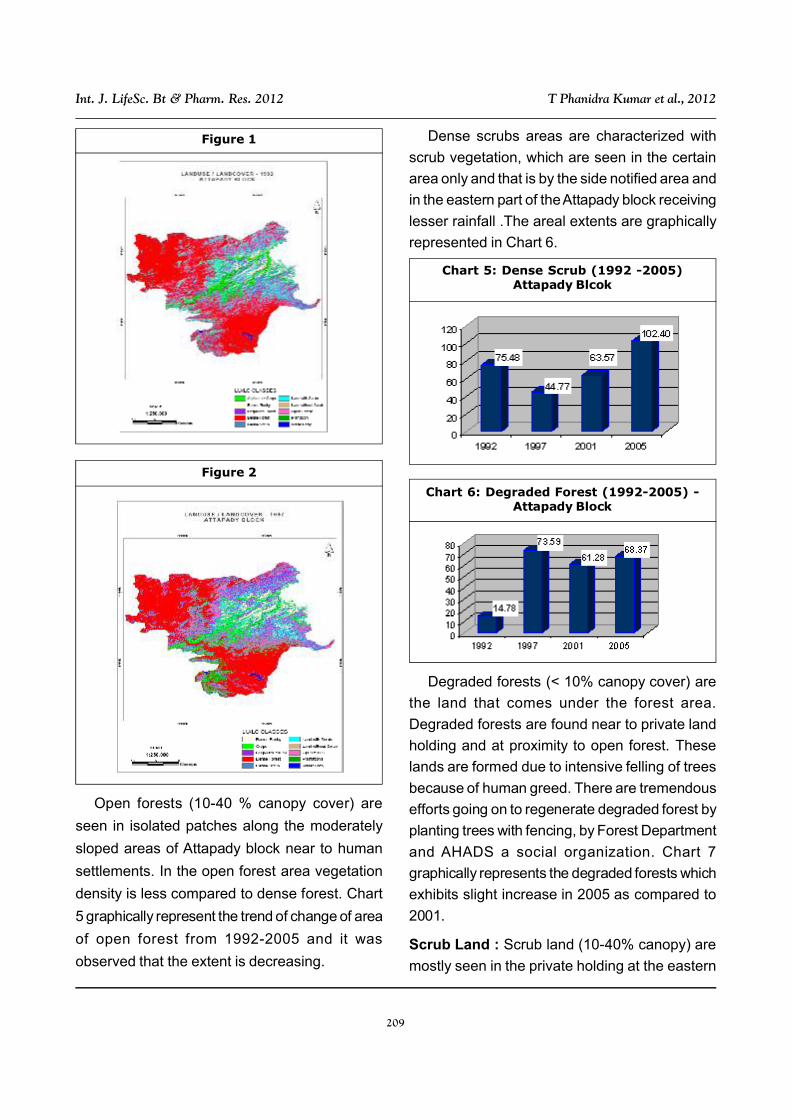
Figure 1
Figure 2
210
Int. J. LifeSc. Bt & Pharm. Res. 2012 T Phanidra Kumar et al., 2012
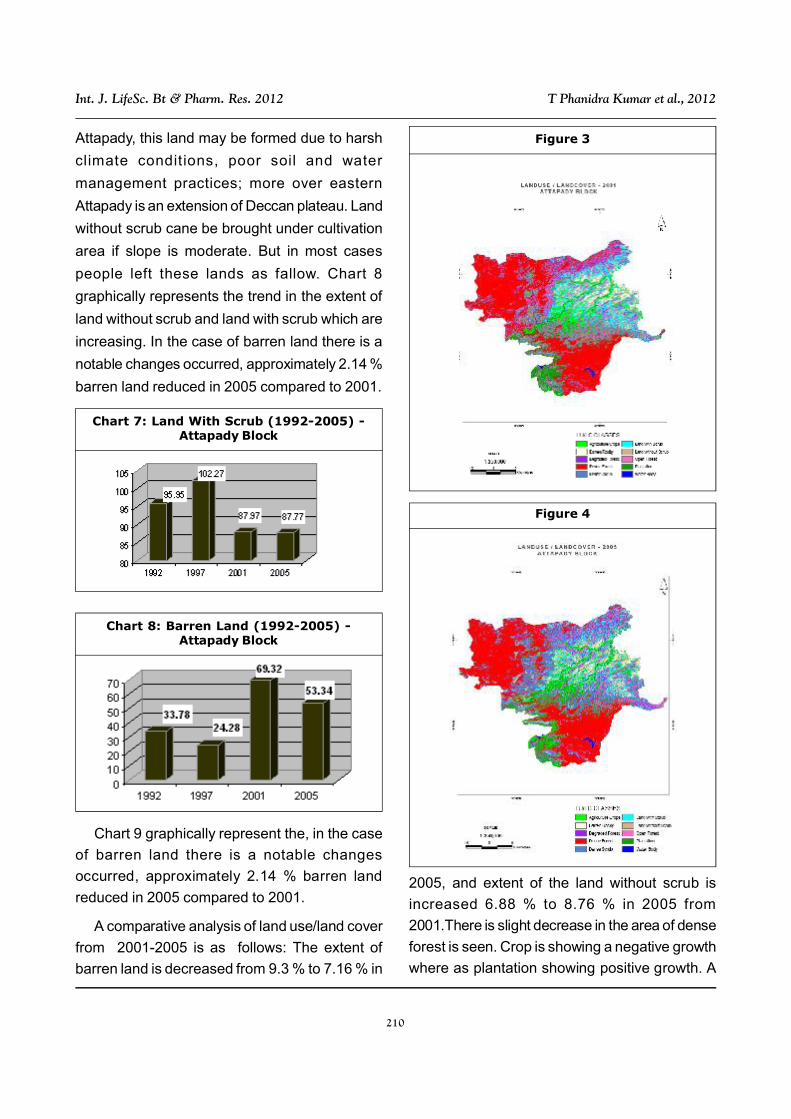
Attapady, this land may be formed due to harsh
climate conditions, poor soil and water
management practices; more over eastern
Attapady is an extension of Deccan plateau. Land
without scrub cane be brought under cultivation
area if slope is moderate. But in most cases
people left these lands as fallow. Chart 8
graphically represents the trend in the extent of
land without scrub and land with scrub which are
increasing. In the case of barren land there is a
notable changes occurred, approximately 2.14 %
barren land reduced in 2005 compared to 2001.
Chart 9 graphically represent the, in the case
of barren land there is a notable changes
occurred, approximately 2.14 % barren land
reduced in 2005 compared to 2001.
A comparative analysis of land use/land cover
from 2001-2005 is as follows: The extent of
barren land is decreased from 9.3 % to 7.16 % in
2005, and extent of the land without scrub is
increased 6.88 % to 8.76 % in 2005 from
2001.There is slight decrease in the area of dense
forest is seen. Crop is showing a negative growth
where as plantation showing positive growth. A
Chart 7: Land With Scrub (1992-2005) -Attapady Block
Chart 8: Barren Land (1992-2005) -Attapady Block
Figure 3
Figure 4
211
Int. J. LifeSc. Bt & Pharm. Res. 2012 T Phanidra Kumar et al., 2012
S. No. Class Name Class Code % of Area
1992 1997 2001 2005
1 Barren Land BR 4.53 3.26 9.30 7.16
2 Crops CR 3.25 9.21 3.14 2.75
3 Degraded Forest DGF 1.98 9.88 8.22 9.18
4 Dense Forest DF 37.22 33.41 33.03 31.47
5 Dense Scrub DS 10.13 6.01 8.53 13.75
6 Land with Scrub LWS 12.88 13.73 11.81 11.78
7 Land without Scrub LWOS 6.21 4.99 6.88 8.76
8 Open Forest OF 19.13 16.04 12.61 7.19
9 Plantations PL 4.17 2.76 5.95 7.41
10 Water Body WT 0.49 0.72 0.53 0.56
100.00 100.00 100.00 100.00
Table 2: Land Use/Land Cover (1992 -2005) Attapady Block (% of Total Area)
marginal increase in the case of extent of dense
scrub is noticed. Water body also witnessed slight
increase.
Though the details of deforestation in the
Attapady block is not worked out, statistics of
forest and non forest land derived from SOI
Toposheet surveyed during 1970s are given below
(Table 3).
It is noticed that areas where no clear
demarcation of forest boundary exists, there
deforestation activities like encroachments are
going on. So that establishment of surveyed and
S. No. Land Use/ Land Cover Area (SqKm) Area (%)
1 Reserved Forest 533.56 63.90
2 Silent Valley National Park 89.50 10.78
3 Scrubs 12.00 1.44
4 Non Forest Land 199.44 23.89
Total 834.50 100.00
Table 3: Forest of Attapady Block in 1970s
visible forest boundary signs is necessary for
arresting deforestation. Methods of deforestation
are varied from places to place, some of them
encouraging forest fire annually and others
removing bark of tree with sharp equipments, so
that tree is unable to fulfill its water and other
nutritional needs and ultimately die.
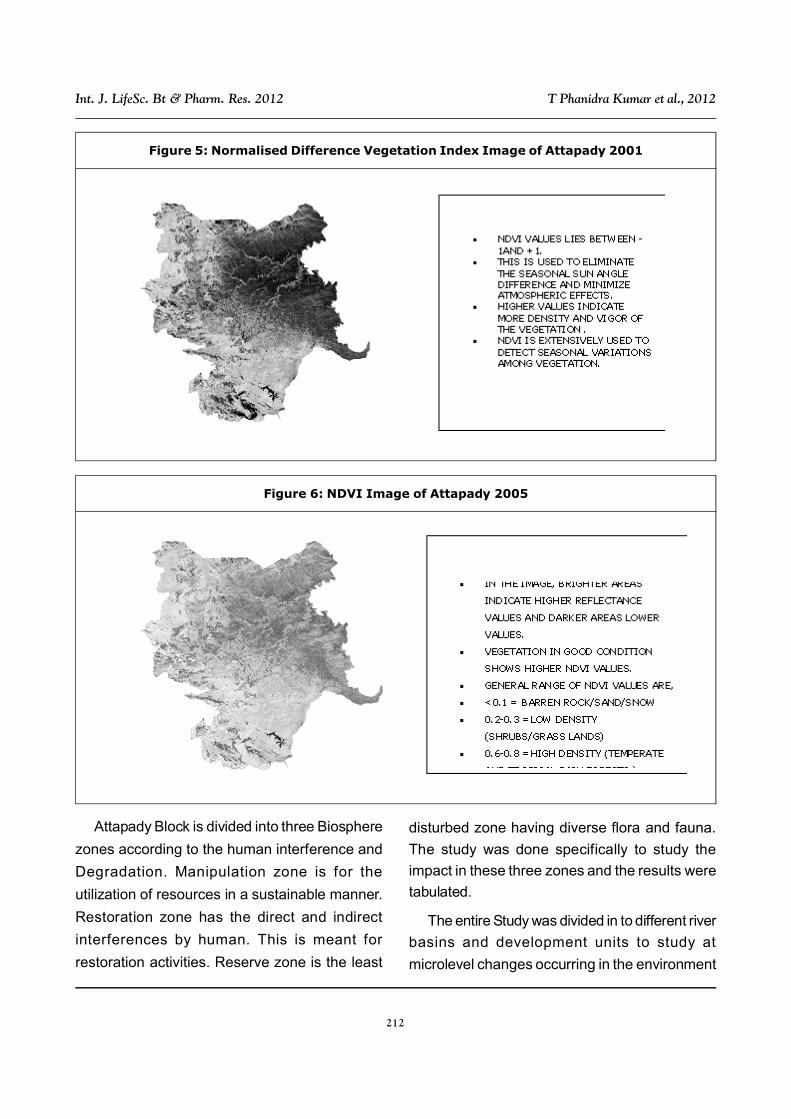
Vegetation Density Mapping: Vegetation density
mapping is carried by using the vegetation indices
such as NDVI and RVI. Vegetation indices widely
employed for determination of density of
vegetation, water stress, and crop health
monitoring. Vegetation density mapping was
carried out for Attapady block. Common
classification techniques employed for NDVI was
derived from IRS images, and different Landsat
TM images. The classification was carried out
based on assigned land use classes. Results
displayed in the form of maps.
212
Int. J. LifeSc. Bt & Pharm. Res. 2012 T Phanidra Kumar et al., 2012
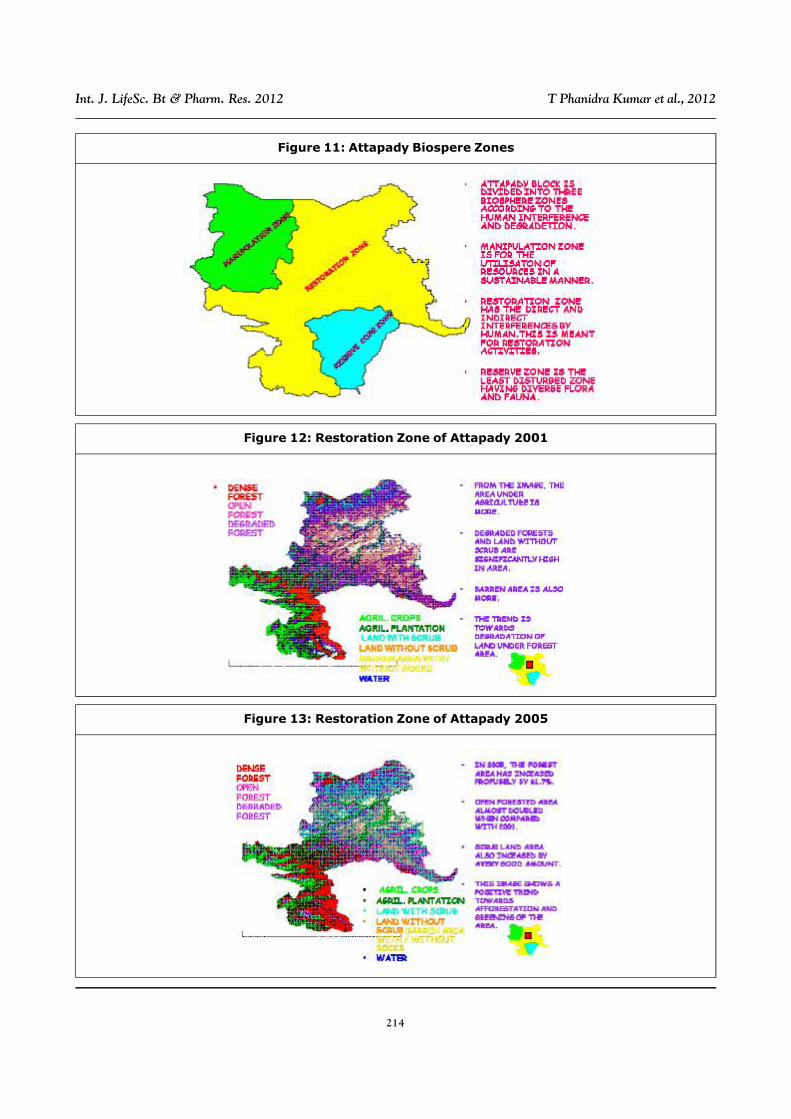
Attapady Block is divided into three Biosphere
zones according to the human interference and
Degradation. Manipulation zone is for the
utilization of resources in a sustainable manner.
Restoration zone has the direct and indirect
interferences by human. This is meant for
restoration activities. Reserve zone is the least
disturbed zone having diverse flora and fauna.
The study was done specifically to study the
impact in these three zones and the results were
tabulated.
The entire Study was divided in to different river
basins and development units to study at
microlevel changes occurring in the environment
Figure 5: Normalised Difference Vegetation Index Image of Attapady 2001
Figure 6: NDVI Image of Attapady 2005
213
Int. J. LifeSc. Bt & Pharm. Res. 2012 T Phanidra Kumar et al., 2012
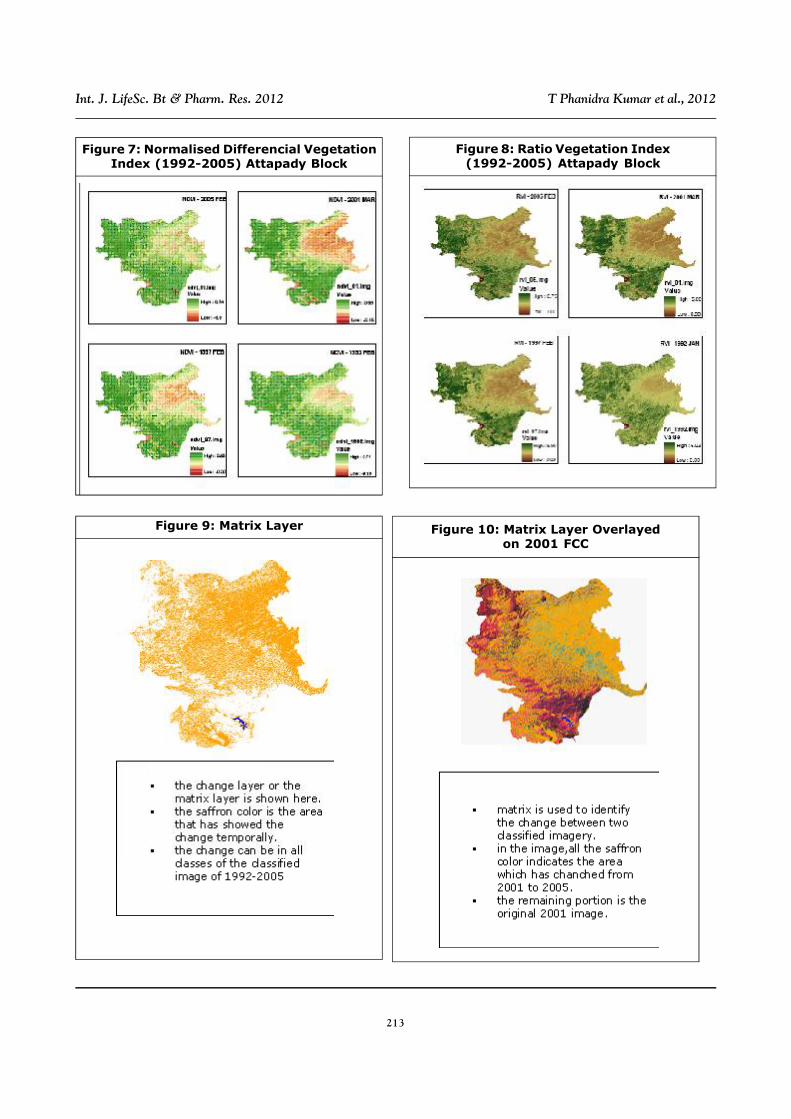
Figure 7: Normalised Differencial VegetationIndex (1992-2005) Attapady Block
Figure 8: Ratio Vegetation Index(1992-2005) Attapady Block
Figure 10: Matrix Layer Overlayedon 2001 FCC
Figure 9: Matrix Layer
214
Int. J. LifeSc. Bt & Pharm. Res. 2012 T Phanidra Kumar et al., 2012
Figure 11: Attapady Biospere Zones
Figure 12: Restoration Zone of Attapady 2001
Figure 13: Restoration Zone of Attapady 2005
215
Int. J. LifeSc. Bt & Pharm. Res. 2012 T Phanidra Kumar et al., 2012
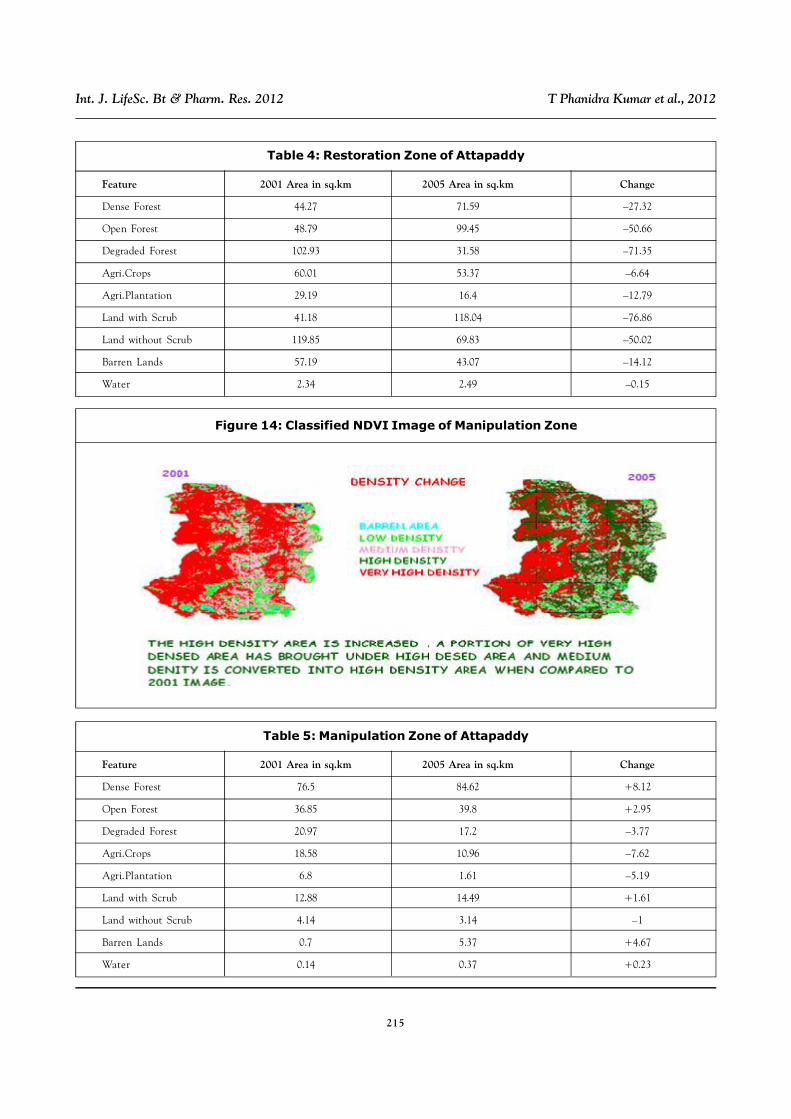
Figure 14: Classified NDVI Image of Manipulation Zone
Feature 2001 Area in sq.km 2005 Area in sq.km Change
Dense Forest 44.27 71.59 –27.32
Open Forest 48.79 99.45 –50.66
Degraded Forest 102.93 31.58 –71.35
Agri.Crops 60.01 53.37 –6.64
Agri.Plantation 29.19 16.4 –12.79
Land with Scrub 41.18 118.04 –76.86
Land without Scrub 119.85 69.83 –50.02
Barren Lands 57.19 43.07 –14.12
Water 2.34 2.49 –0.15
Table 4: Restoration Zone of Attapaddy
Feature 2001 Area in sq.km 2005 Area in sq.km Change
Dense Forest 76.5 84.62 +8.12
Open Forest 36.85 39.8 +2.95
Degraded Forest 20.97 17.2 –3.77
Agri.Crops 18.58 10.96 –7.62
Agri.Plantation 6.8 1.61 –5.19
Land with Scrub 12.88 14.49 +1.61
Land without Scrub 4.14 3.14 –1
Barren Lands 0.7 5.37 +4.67
Water 0.14 0.37 +0.23
Table 5: Manipulation Zone of Attapaddy
216
Int. J. LifeSc. Bt & Pharm. Res. 2012 T Phanidra Kumar et al., 2012
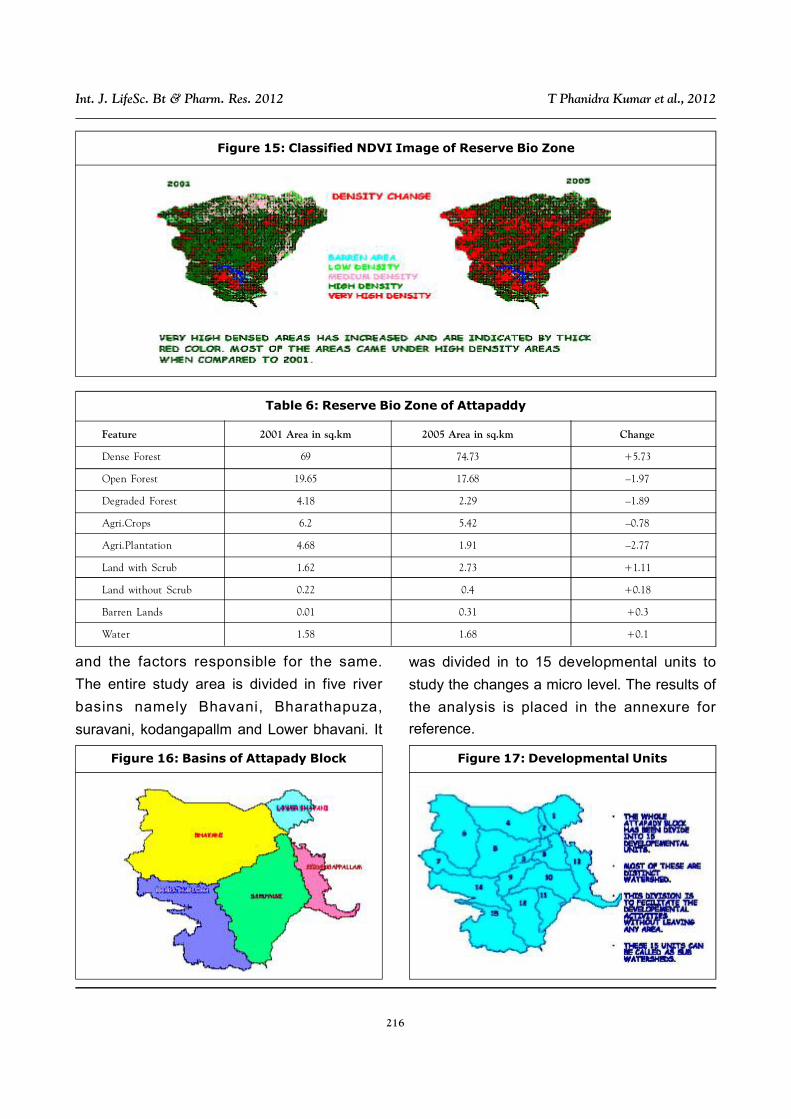
Figure 15: Classified NDVI Image of Reserve Bio Zone
Feature 2001 Area in sq.km 2005 Area in sq.km Change
Dense Forest 69 74.73 +5.73
Open Forest 19.65 17.68 –1.97
Degraded Forest 4.18 2.29 –1.89
Agri.Crops 6.2 5.42 –0.78
Agri.Plantation 4.68 1.91 –2.77
Land with Scrub 1.62 2.73 +1.11
Land without Scrub 0.22 0.4 +0.18
Barren Lands 0.01 0.31 +0.3
Water 1.58 1.68 +0.1
Table 6: Reserve Bio Zone of Attapaddy
Figure 16: Basins of Attapady Block Figure 17: Developmental Units
and the factors responsible for the same.
The entire study area is divided in five river
basins namely Bhavani, Bharathapuza,
suravani, kodangapallm and Lower bhavani. It
was divided in to 15 developmental units to
study the changes a micro level. The results of
the analysis is placed in the annexure for
reference.

217
Int. J. LifeSc. Bt & Pharm. Res. 2012 T Phanidra Kumar et al., 2012
OBSERVATIONS ANDFINDINGS OF THE STUDYFrom the study it was observed that the
Vegetation cover has changed positively from
2001 to 2005. From the analysis it was observed
that the dense, open and lands with scrub have
increased considerably during 2001-2005. There
was a considerable decrease in the degraded
forest which is a positive sign. Similarly, area
under agricultural crops and agricultural
plantations have also decreased to a considerable
extent which need ground truth for the reasons
Due to the development of scrub type vegetation,
barren area has decreased. It was observed from
the analysis that major changes in vegetation
occurred in the restoration zone. The restoration
zone area was barren with less vegetation mostly
with exposed rocks during the years 2000-2001.
But in 2005 it was observed that more vegetation
is seen in 2005 perhaps, due to afforestation
programmes. It was observed that most of the
vegetation is seen along the rivers- Bhavani and
Kondanagappallem. The possible reason may be
that sediment load along the river course from
the upper slopes might have led to the rise of
ground water levels. As a result most of the
vegetation is seen along the river Bhavani.
The basin wise analysis clearly indicated that
the Bhavani basin which covers a major part of
the restoration zone showed more changes in
vegetation. The major changes were observed
in the development of dense, open forest and
scrub type vegetation while the area under
degraded forest has shown a declining trend. The
micro level analyses of the different development
unit wise results indicate that majority of the
changes are seen in the development units which
fall in restoration zone such as 2, 3,5,8,9 and 10.
Among all, the development units, 5 and10 exhibit
highest changes in the improvement of scrub and
open forest type vegetation. There were no major
changes in the dense forest area in these
development units except in 5, 9 and 10 which
showed minor increase in dense forest.
Degraded forest in all these units showed
decreasing trend while zones 5 and 10 showed
highest decline. Due to the development of
vegetation in this area barren area has decreased.
The low density vegetated areas has become
medium and high dense areas in the year 2005.
SUMMARY AND CONCLUSIONAs ecological security is the foundation for
sustainable and equitable development, we are
committed to strengthening, reviving or restoring,
where necessary the process of ecological
succession and the conservation of land and
water resource in the country. Results of Land
Use/Land Cover analysis of Attapady block were
clearly indicate that these lands deserving more
and wide attention, that are able to penetrate to
all zone of its degrading parts of ecosystems.
The regeneration of wastelands of Attapady block
need herculean efforts and the help of indigenous
people. Still people of Attapady are farming with
the help of oxen and plough and without having
much land protection, so that losing of top soil a
major seen in the farm land of Attapady. Analysis
regarding deforestation shows that isolation of
forest from non forest land with help of strong
and concrete boundary indicating structures is
an urgent requirement. If there is any periodical
monitoring system for checking the boundary,
which will definitely help to arrest deforestation.
Vegetation density mapping, result is showing that
very undulations with respect to season and date
218
Int. J. LifeSc. Bt & Pharm. Res. 2012 T Phanidra Kumar et al., 2012
of data acquisitions, and it happens during a
period, so that without continues monitoring of it
is not easy to interpret the results. Even though
some remarkable change noticed that, the density
of vegetation in the forest land increasing, it may
due to considerable reduction of human
interference in the forest, and hunting, incidence
of forest fire and chopping of forest trees are
reduced to a considerable level. Environment and
resource management problems are both
spatially distributed and determined by complex
process and relationship involving numerous
interacting elements with multiple attributes and
a dynamic behavior that goes well beyond the
analytical capabilities to met commercial GIS
software (Fedra, 2006).
BIBLIOGRAPHY1. Forestry allied Application of Remote
Sensing—Prasad (1998) carried out a study
titled ‘Conservation Panning for the Western
Ghats of Kerala: II. Assessment of habitat
loss and degradation’.
2. Ramesh et al. (1998) studied the treat
raised against the life of lion – tailed
macaques, Macaca silenus, in Karnataka,
3. Ferreira et al. (2007) attempted to estimate
the rate of deforestation of the Brazilian
Amazon basin.
4. Ali et al. (2006), Great Southern region of
Western Australia.
5. Quinonez-Pinon et al. (2007), presented a
sampling design for monitoring spatial and
temporal changes in forest health in the
Upper Elbow River Basin, in Alberta,
Canada.
6. Yang (2007), in his study on riparian
vegetation delineation and mapping using
remote sensing and geographic information
systems (GIS) in the Hunter Region,
Australia.
7. Im et al. (2005), Introduced a Change
Detection Model Based on Neighborhood
Correlation Image (NCI) logic.
8. Maggi et al. (2007), Conducted a Change
Detection Analysis Based on a Region
Growing Segmentation Approach Which
Combines Both Spectral and Spatial
Information.
9. Maity et al. (2006), “Change Detection using
GIS and Remote Sensing Techniques-has
Carried out a Study Titled Barsey
Rhododendron Sanctuary Sikkim: A
Remote Sensing Approach”.
10. Matsuoka et al. (2007), classified land cover
over.
11. Rahul et al. (2007), Narrates That Remotely
Sensed Data from Satellites has Been
Widely Applied in Agricultural Yield
Estimation and Cropland Management.
12. Saini et al. (2003), evaluated application
digital image processing for land use/ land
cover studies
13. Vegetation Density Mapping- Kumar et al.
(2007), studied the status of forest density
in the Kangra district of Himachal Pradesh,
western Himalaya.
14. Vivek et al. (2003), Conducted a Study Titled
‘Application of High Resolution Remote
Sensing and Geographic Information
219
Int. J. LifeSc. Bt & Pharm. Res. 2012 T Phanidra Kumar et al., 2012
System in Detecting Land Use / Land Cover
Change.
15. Yamajashi et al. (1998), Satellite Image
Classification Techniques.
16. Yoder B J and Pettigrew-Crosby R E (1995),
Predicting nitrogen and chlorophyll contentand concentrations from re¯ ectancespectra (400± 2500 nm) at leaf and canopy
scales.