monitoring microbial diversity of a full-scale municipal
TRANSCRIPT
Zayed University Zayed University
ZU Scholars ZU Scholars
All Works
1-1-2013
Monitoring Microbial Diversity of a Full-Scale Municipal Monitoring Microbial Diversity of a Full-Scale Municipal
Wastewater Treatment Plant in Dubai Wastewater Treatment Plant in Dubai
Munawwar Ali Khan Zayed University
Javeria Mohsin Zayed University
Sultan Mohammad Faheem Manipal University
Follow this and additional works at: https://zuscholars.zu.ac.ae/works
Part of the Life Sciences Commons
Recommended Citation Recommended Citation Khan, Munawwar Ali; Mohsin, Javeria; and Faheem, Sultan Mohammad, "Monitoring Microbial Diversity of a Full-Scale Municipal Wastewater Treatment Plant in Dubai" (2013). All Works. 2439. https://zuscholars.zu.ac.ae/works/2439
This Article is brought to you for free and open access by ZU Scholars. It has been accepted for inclusion in All Works by an authorized administrator of ZU Scholars. For more information, please contact [email protected], [email protected].
Contents lists available at ScienceDirect
Journal of Hydrology: Regional Studies
journal homepage: www.elsevier.com/locate/ejrh
Natural radioactivity and groundwater quality assessment in thenorthern area of the Western Desert of Egypt
Mohamed Yehiaa, Ashraf Baghdadyb, Fares M. Howaric,⁎, Samir Awadb, Ahmed Gadb
a Central Laboratory for Environmental Quality Monitoring (CLEQM), National Water Research Center, El-Qanater, 13621, Cario, Egyptb Geology Department, Faculty of Science, Ain Shams University, 11566, Cairo, Egyptc College of Natural and Health Sciences, Zayed University, Abu Dhabi, United Arab Emirates
A R T I C L E I N F O
Keywords:Water qualityGroundwater assessmentToxic metalsRadiation hazardDeserts oasis
A B S T R A C T
The chemical composition and natural radioactivity of the northern area of the western desertgroundwater were determined to evaluate hydrogeochemical facies and assess groundwaterquality for different uses. Many the groundwater samples belong to the Na+- Cl−, Na2SO4
− type,followed by Ca2+- Mg2+- Cl− type. Only a few samples are of the Na+- HCO3
− type. The spatialdistributions of the major ions describe similar anomalies, with the highest concentrations foundat the extreme northeastern margin of the oasis, as well as in its northern and northwestern parts.Fe is the most abundant toxic metal, followed by Cu and Mn. Anomalies of Cr, Ni and Zn are alsodetected. Rock/water interactions strongly affect the chemical composition of the groundwater.Dissolution and cation exchange are the main processes controlling the hydrogeochemistry. Mostof the irrigation groundwater problems in the study area may be resolved using an effectivedrainage system. The estimated total annual dose due to ingestion of 238U, 232Th and 40K ingroundwater samples reveals that the groundwater is safe for human consumption. However, thetoxic metal content of the Bahariya groundwater exceeds the permissible levels for both irrigationand consumption, and the water must be filtered through suitable membranes to exclude thesetoxic metals. Regular monitoring of the quality of this water for drinking is strictly required.
1. Introduction
The Western Desert covers about two-thirds of Egypt's land area. It spans from the Mediterranean Sea south to the Sudaneseborder and from the Nile River Valley west to the Libyan border. It is one of the driest areas of the Sahara. The irrigated oases andagricultural schemes are good breeding areas for grasshoppers. They are less suitable for the Desert Locust which generally prefersnatural vegetation in the desert. Groundwater is the sole source of water supplying arid and semiarid regions such as the study areawhich known locally as Bahariya Oasis. Geochemical characteristics of groundwater, particularly the levels of potentially harmfulmetals and radionuclides, are significant factors in controlling groundwater usage and for health considerations (Baba and Tayfur2011; Murad et al., 2014; Arslan and Turan 2015). The groundwater geochemistry and contamination levels are naturally influencedby the geological setting of the area (Edmunds and Shad 2008; Al-Katheeri et al., 2009; Banat and Howari 2003; Banat and Howari2005; Banat et al., 2005) and the lithological composition of the aquifer (Yuce et al., 2009; Howari 2016; Howari et al., 2005; Howariand Banat 2001), in addition to anthropogenic factors, such as agricultural practices (Wongsasuluk et al., 2014), waste disposal (Donget al., 2015), and industrial and mining activities (Dokou et al., 2015; Hao et al., 2016).
Assessment of the potentially harmful metals and the natural radioactivity levels in groundwater sources is important in
http://dx.doi.org/10.1016/j.ejrh.2017.06.002Received 14 January 2017; Received in revised form 6 May 2017; Accepted 6 June 2017
⁎ Corresponding author.E-mail address: [email protected] (F.M. Howari).
Journal of Hydrology: Regional Studies 12 (2017) 331–344
Available online 01 July 20172214-5818/ © 2017 The Author. Published by Elsevier B.V. This is an open access article under the CC BY-NC-ND license (http://creativecommons.org/licenses/BY-NC-ND/4.0/).
T

protecting the population against toxicity and high radiation dose due to ingestion (Yuce et al., 2009). The main sources of gammaradiation in natural waters are 238U, 232Th series and 40 K (ICRP, 2012). In the study area, groundwater represents the sole watersource for irrigation and other human uses. Groundwater depletion and decline in water quality are the main concerns in this area.Consequently, many hydrogeochemical studies of the groundwater in the Bahariya Oasis have been published since the late 1980s(e.g. Eweida and Abdallah 1980; Shehata 1992; Kornay et al., 2002; Hamdan and Sawires 2013). However, few of these studies dealtwith water contamination by toxic metals and radionuclides (Shahin et al., 1996; Khater 2003). The aim of the present work is three-fold: (1) contributing to the database on quality of groundwater in the northern part of the western desert; (2) assessing waterpollution levels due to toxic metals and natural radioactivity; and (3) evaluating the suitability of this groundwater for irrigation,domestic and drinking needs.
2. Materials and methods
2.1. The study area
The study area in the northern part of the Western Desert of Egypt between longitudes 28° 35′ and 29° 10′ E and latitudes 27° 48′and 28° 30′ N (Fig. 1). The approximate area of the depression is about 2000 km2 (94 × 42 km). It has an elevation of 128 m abovesea level and suffers from hyper-arid climate. Inhabitants of the area (population of 34,000) depend mainly on agriculture, with areasof cultivation at a few separate localities. The main Egyptian iron mines are also located in this oasis. Thus, the Bahariya Oasis is aprospective area for reclamation extension, geotourism and industrial activities.
2.2. Geology and hydrogeology
Several hills and high scarps (∼175 m height) surround the Bahariya depression. They include mainly exposures of the LowerCretaceous-Oligocene formations. This succession is overlain by Miocene volcanic rocks (typically basalt) and Quaternary surficialdeposits (Said 1962; El Akkad and Issawi 1963; Catuneanu et al., 2006 and others). The Nubian Sandstone (1800 m thick) of pre-Cenomanian to Early Cenomanian age is the groundwater aquifer of the Bahariya Oasis (Korany 1984; Shehata 1992). This aquiferhas been described as a multilayered artesian aquifer system that behaves as one hydrogeologic system (Youssef 1999; Hamdan andSawires 2013). It consists of three successive water-bearing ferruginous and calcareous sandstone units separated by semi-permeable,regionally discontinuous clay and/or shale layers (Korany et al., 2002). The groundwater flow in the Bahariya Oasis has a (SW-NE)general pattern that is similar to that reported for the groundwater of the Nubian Sandstone Aquifer in the Western Desert of Egypt(Korany 1984; Shata 1982; Abdel Ati 2002; Hamdan and Sawires, 2013). The major part of the oasis floor is a flat or gently un-dulating ground of sandstone and layers of clay, strewn with fragments of rocks derived from the hills (Howari et al., 2016; Said,
Fig. 1. Satellite image of the study area showing the groundwater sampling sites.
M. Yehia et al. Journal of Hydrology: Regional Studies 12 (2017) 331–344
332
1962). The most important geomorphic features include: 1) the alternating weak and strong beds and their influence on topography2) the marked parallelism of NE-SW ridges, and 3) Geologic structure and its control of the small wadis and 4) The position andoutlines of the folds, exemplified in the ridges formed by the alternating weak and strong beds.
The geological section in Bahariya Oasis and its surroundings comprises the following units from the oldest to the youngest. Thesefeatures are summarized from Howari et al., 2016 as below:
Bahariya Formation, is mostly formed of friable, false-bedded, variegated sandstones with harder dark brown ferruginousquartzitic sandstone beds. Fluviatile sandstone and siltstone in the lower part grading upward into alternating beds of estuarinesandstone and shale in the essential composition.
Heiz formation, it marks the first carbonate deposits in Bahariya Oasis, made of 30 m thick clastics with carbonate interbeds anddolostone member at top. Basal and upper members of reddish brown dolomatic sandstone and siliceous dolostone, enclosing amiddle member of sandy clay and calcareous grit, varicolored, with ironstone concretions and flint. They represent shallow marinedeposits.
Hefhuf Formation, this formation is exposed on both the eastern and western scarps of the Bahariya Oasis, and also in almost allthe northerly isolated hillocks especially these well developed at Gebel Hefhuf. Dolostone with sandstone and sandy clay interbeds,occasional thin gritty phosphatic beds in the upper part is the general composition.
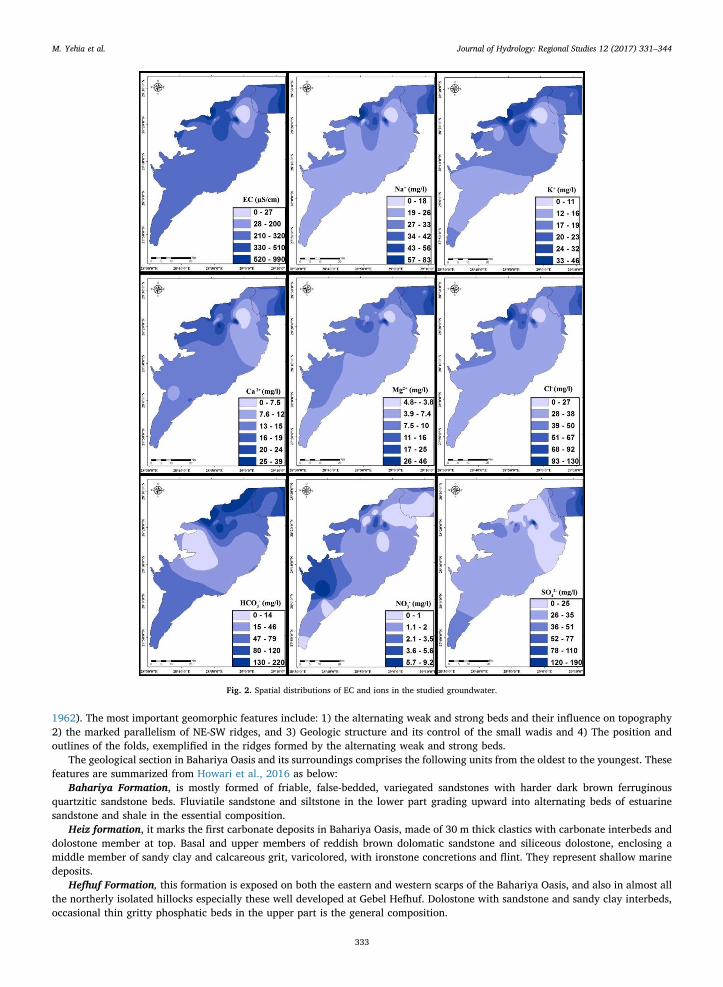
Fig. 2. Spatial distributions of EC and ions in the studied groundwater.
M. Yehia et al. Journal of Hydrology: Regional Studies 12 (2017) 331–344
333

Table 1Physico-chemical parameters, concentrations of ions and toxic metals and radionuclides activity concentrations of the studied groundwater.
No. Locality Well Name Physico-chemical Parameters Major Cations (mg/l) Major Anions (mg/l)
Depth T pH EC TDS Na+ K+ Ca2+ Mg2+ Cl− HCO3− NO3
− SO42−
(m) (C°) (μS/cm) (mg/l)
1 H El Hiez Ain El Eza 1 1152 49.5 6.8 273.4 175 22 13 11.0 9.0 32 68 4.0 262 H Ain El Eza 2 1152 49.5 6.8 373.4 239 30 14 21.6 11.0 70 24 9.0 563 H Ain Om
Kholiph300 29 6.8 265.6 170 22 17 14.2 7.1 30 46 0.3 51
4 H Tablamoun 1 320 32.1 6.9 270.3 173 22 14 15.2 6.2 32 58 1.4 335 H Tablamoun 2 320 32 7.0 384.4 246 30 14 22.1 11.2 70 25 1.2 616 H El Ris 1 370 30.4 6.8 256.3 164 20 15 15.2 5.5 30 59 1.3 327 H El Ris 2 370 31.8 7.0 237.5 152 19 17 12.8 5.3 28 65 2.6 208 Z El Zabw Qasaa 3 954 23.8 7.6 356.3 228 31 18 20.3 10.0 47 82 6.0 409 Z Qasaa 1 780 40.1 7.6 470.3 301 38 31 18.9 15.5 50 165 2.0 2410 Z El Zabu
Station950 24.1 7.3 375.0 240 35 22 16.8 10.1 51 68 3.6 32
11 B El Bawiti El Matar 997 47.6 7.2 359.4 230 36 20 18.4 7.7 55 88 2.9 2712 B Khalawy 324 31.6 7.6 318.8 204 28 23 16.5 6.9 38 102 0.9 2113 B Nebiga 1000 45.3 7.1 365.6 234 36 22 14.9 9.0 54 97 1.0 2214 B Ain Embash 205 35.8 7.0 270.3 173 18 14 15.0 12.1 25 78.8 1.6 4015 B El Beshmou 1082 50 7.2 296.9 190 31 18 13.6 6.0 46 78 0.2 2116 B Karem 840 41 6.9 318.8 204 30 20 15.7 7.7 47 83 1.6 2617 B El Bawiti
Station1100 23.9 6.9 448.4 287 29 25 25.3 16.5 42 125 1.6 60
18 Q El Qasr Mady 345 30 7.0 270.3 173 20 16 16.5 7.6 29 53 2.0 4819 Q El Tibnia 809 37.3 7.5 437.5 280 39 32 17.0 13.0 51 156 3.0 2020 Q Dedela Hot 891 45 6.9 460.9 295 52 27 17.6 9.6 80 123 0.9 19.221 Q Dedila Station 800 24 7.2 265.6 170 18 13 14.0 12.0 23 76 0.8 4122 Q Bir Wald 1167 50 6.7 300.0 192 31 17 14.1 7.4 45 85 0.2 2223 M Mandisha Mandisha
Station1050 23.9 6.9 1020.3 653 78 41 40.0 48.3 110 87 4.0 200
24 M El Aguz 1045 45 7.6 440.6 282 50 25 16.0 9.3 70 78 4.7 2125 M El Maissra 1080 46 7.2 296.9 190 28 15 14.4 6.0 40 73 0.2 2326 M El Gazair 1005 41 7.1 412.5 264 27 25 19.1 16.6 41 110 1.0 5827 M Segam 781 41.5 7.1 382.8 245 38 23 16.4 11.0 56 93 4.6 3528 R El Harra Ain Wady 830 41.4 7.6 243.8 156 24 15 12.3 5.2 36 58 1.2 2229 R Ain Hadad 995 45 7.1 260.9 167 25 16 13.0 5.1 38.2 61 0.3 2330 R Ain Yousef 1 820 40.2 7.3 251.6 161 23 15 13.0 5.2 34 60 0.2 2331 R Ain Yousef 2 684 31.1 7.4 246.9 158 24 16 13.3 5.5 35 64 0.6 2432 R Ain El
Bahariya750 41.2 7.3 246.9 158 25 15 12.5 5.9 33 68 0.2 26
33 F AinGiffara
Ain Giffara 869 38.4 6.8 235.9 151 23 16 10.1 6.1 34 60 0.2 23
34 L Qabala Qabala 1138 40 7.0 296.9 190 30 19 12.0 8.0 46 71 0.9 2735 G El Gedida Well 9 1063 36.5 7.0 867.2 555 66 28 35.0 40.0 90 150 1.0 17536 G Well 7 1117 50 6.8 292.2 187 29 19 12.6 7.1 43 75 0.3 2637 G Well 8 1003 30 6.7 445.3 285 33 27 18.0 17.0 46 112 5.0 62Min. 205.0 23.8 6.7 235.9 151.0 18.0 13.0 10.1 5.1 23.0 24.0 0.2 19.2Max. 1167.0 50.0 7.6 1020.3 653.0 78.0 41.0 40.0 48.3 110.0 165.0 9.0 200.0Average 774.5 37.7 7.1 359.1 229.8 31.4 19.9 16.9 10.9 46.7 81.8 1.9 40.8
No. Locality Well Name Toxic Metals (ppm) Radionuclides (Bq/l)
Cr Cu Fe Mn Ni Pb V Zn 238U 232Th 40K
1 H El Hiez Ain El Eza 1 0.029 1.923 2.269 0.453 0.005 0.021 0.013 0.067 56.06 2.89 10.82 H Ain El Eza 2 0.001 0.088 7.7 0.641 0.002 0.003 0.001 0.373 29.58 3.59 7.913 H Ain Om
Kholiph0.08 0.207 3.901 0.257 0.001 0.004 0.017 0.026 0.00 2.6 7.11
4 H Tablamoun 1 0.005 0.195 3.475 0.275 0.001 0.006 0.024 0.054 0.00 4.68 22.055 H Tablamoun 2 0.002 0.129 1.16 0.859 0.004 0.009 0.001 0.063 0.00 4.68 22.056 H El Ris 1 0.003 0.171 5.419 0.496 0.004 0.001 0.022 0.04 61.33 2.21 9.157 H El Ris 2 0.001 0.196 1.035 0.412 0.002 0.003 0.023 0.058 61.33 2.21 9.158 Z El Zabw Qasaa 3 0.002 0.185 0.622 0.566 0.008 0.004 0.027 0.079 39.94 1.68 6.29 Z Qasaa 1 0.002 0.144 0.726 0.089 0.041 0.002 0.05 0.058 40.67 3.41 14.0810 Z El Zabu
Station0.007 0.34 2.521 0.526 0.004 0.008 0.067 0.114 27.71 2.79 6.71
M. Yehia et al. Journal of Hydrology: Regional Studies 12 (2017) 331–344
334

Khoman Chalk, this of 50 m thick chalk and limestone beds with hard dolomitic limestone band at top. Snow-white to light tan,chalky calcilutite, moderately hard, fractured and with calcite fillings.
Plateau Limestone, it is succession of limestone beds with few marly and clayey interbeds uncomfortably overlies differentCretaceous rocks at different parts of the Bahariya area.
The Ghorabi Iron Ore Member, the origin of this important economic deposits has stirred much dispute among several workersfrom lacustrine deposits of Oligocene age.
The Qazzun Formation, this Formation covers a large tract of the plateau surface north and northwest of the Bahariya Oasis.Lagoonal limestone exist as white to gray to yellowish, thinly-bedded, partly crystalline, partly chalky, occasionally siliceous and/ordolomitic, common calcite pockets. The limestone includes characteristic melon-shaped concretions of siliceous limestone.
The Hamra Formation, the hamra makes many of the hills and ridges of the Bahariya northern and western plateaus. Shore line,partly algal reef limestone, yellowish-brown, abundant detrital grains, numerous skeletal remains, intraformational conglomerates.
The Radwan formation, The formation is 40 m at its type section in Gebel Radwan located at the central west part of thedepression. Lithologically, the Radwan is formed of dark brown non-fossiliferous ferruginous grits and sandstones. The formation wasprobably formed in connection with an Oligocene sinous river system which flowed over the Bahariya area before the depression wasformed.
The Volcanic Rocks, These rocks occur in the Bahariya Oasis mainly as capping Gebel Maysera, Gebel Mandisha, the northernpart of gebel Hefhuf, the Basalt Hill and small conical hill to the west of Qala Siwa. The volcanic cover of the Bahariya Formation andthe sandstones at the contact are altered by the eruptions.
2.3. Sampling
A total of 37 groundwater samples were collected during February 2010 from the available drilled wells (Fig. 1). The accuratesampling locations were determined using GPS. Samples were collected after 10 min of pumping and were stored in polyethylenebottles. Samples for toxic metals analysis were collected in acid-leached polyethylene bottles and preserved by adding ultra purenitric acid (5 mL/l). Sampling was handled according to the standard methods for examination of water (APHA, 1999). Field
Table 1 (continued)
No. Locality Well Name Toxic Metals (ppm) Radionuclides (Bq/l)
Cr Cu Fe Mn Ni Pb V Zn 238U 232Th 40K
11 B El Bawiti El Matar 0.001 0.134 2.539 0.331 0.001 0.001 0.005 0.011 43.79 1.61 7.5812 B Khalawy 0.005 0.061 0.924 0.096 0.004 0.008 0.058 0.042 52.65 2.6 7.2313 B Nebiga 0.002 0.143 3.16 0.086 0.002 0.01 0.048 0.042 38.48 2.79 6.9914 B Ain Embash 0.015 0.142 4.184 0.477 0.001 0.009 0.057 0.081 60.30 1.49 5.2715 B El Beshmou 0.003 0.226 3.831 0.717 0.007 0.009 0.063 0.158 69.31 1.89 8.316 B Karem 0.008 0.171 2.766 0.444 0.002 0.002 0.068 0.034 62.78 3.2 10.9517 B El Bawiti
Station0.003 0.235 5.393 0.857 0.01 0.005 0.057 0.051 44.67 2.26 19.37
18 Q El Qasr Mady 0.001 0.154 4.827 0.559 0.003 0.002 0.043 0.035 51.42 1.11 6.0619 Q El Tibnia 0.001 0.101 0.484 0.041 0.001 0.001 0.052 0.025 33.84 2.17 14.4820 Q Dedela Hot 0.003 10.47 3.03 0.555 0.045 0.023 0.053 0.083 70.26 2.44 9.3421 Q Dedila Station 0.005 0.159 0.55 0.545 0.003 0.015 0.047 0.45 47.30 4.53 20.4422 Q Bir Wald 0.033 0.206 3.91 0.758 0.004 0.001 0.053 0.102 47.89 3.17 12.4723 M Mandisha Mandisha
Station0.024 0.131 0.545 0.952 0.002 0.002 0.064 0.053 40.64 3.05 8.05
24 M El Aguz 0.038 0.369 3.151 1.291 0.004 0.012 0.058 0.111 41.91 1.75 5.8125 M El Maissra 0.321 0.166 4.936 0.937 0.002 0.002 0.072 0.095 42.12 2.91 9.326 M El Gazair 0.003 5.901 2.253 0.298 0.016 0.014 0.097 0.056 26.53 2.52 5.8727 M Segam 0.002 4.451 1.492 0.235 0.005 0.011 0.001 0.037 47.39 1.89 11.0328 R El Harra Ain Wady 0.008 0.433 3.32 0.513 0.004 0.006 0.069 0.071 54.07 5.74 15.4729 R Ain Hadad 0.027 0.402 3.211 0.508 0.004 0.006 0.048 0.052 46.33 2.64 6.730 R Ain Yousef 1 0.066 2.868 3.67 0.573 0.003 0.013 0.064 0.059 17.92 3.12 5.3331 R Ain Yousef 2 0.003 4.977 2.664 0.639 0.013 0.017 0.076 0.071 72.51 3.65 10.3132 R Ain El
Bahariya0.002 5.662 2.361 0.477 0.008 0.012 0.07 0.066 91.95 3.66 6.46
33 F AinGiffara
Ain Giffara 0.001 0.097 1.548 0.135 0.002 0.002 0.001 0.005 37.56 2.15 9.5
34 L Qabala Qabala 0.083 4.012 2.756 0.173 0.004 0.021 0.001 0.027 64.83 4.3 8.1735 G El Gedida Well 9 0.047 2.208 27.29 1.052 0.008 0.006 0.001 0.24 51.52 2.62 17.7536 G Well 7 0.093 3.258 1.348 0.167 0.003 0.01 0.001 0.013 39.81 3.6 6.9137 G Well 8 0.003 0.258 0.757 0.093 0.002 0.003 0.001 0.02 73.68 4.5 10.55Min. 0.001 0.061 0.484 0.041 0.001 0.001 0.001 0.005 0.0 1.1 5.3Max. 0.321 10.47 27.29 1.291 0.045 0.023 0.097 0.45 45.6 2.9 10.3Average 0.025 1.378 3.398 0.489 0.006 0.008 0.040 0.082 92.0 5.7 22.1
M. Yehia et al. Journal of Hydrology: Regional Studies 12 (2017) 331–344
335

parameters (temperature, EC and pH) were measured in-situ using a portable digital EC-pH-meter.
2.4. Chemical analysis
The collected groundwater samples were filtered through 0.45 μm pore-diameter filter paper. The concentrations of major cationsand total toxic metals were determined using Inductively Coupled Plasma-Optical Emission Spectroscopy (ICP-OES) with ultrasonicNebulizer (USN) (Perkin Elmer Optima 3000, USA). The major anion concentrations, on the other hand, were determined using IonChromatography (IC), model DX-500 chromatography system.
2.5. Radioactivity measurements
The groundwater samples were transferred to Marinelli beakers (1 L) and sealed for a period of about 4 weeks before counting bygamma spectrometry. The counting time for each sample was nearly 24 h The 238U, 232Th and 40K activity concentrations weremeasured using HPGe EG&Gortec Model GEM-50210-P. This equipment was used for counting and detection of radionuclide content
Fig. 3. Spatial distributions of the toxic metals in the studied groundwater.
M. Yehia et al. Journal of Hydrology: Regional Studies 12 (2017) 331–344
336

of all samples. The instrument has a depleted, sensitive thickness of centimeters, and therefore can be used as a total absorptiondetector for gamma rays up to few MeV. Cooled to liquid nitrogen temperatures (196° C), it produces spectroscopic data and pulsesproportional to the captured photon energy. The HPGe detector used is a P-type and has a diameter of 78 mm, length 69.6 mm, 16 Kchannels with relative efficiency of 80% and a resolution of 2.3 Kev at the 60 Co line of 1.33 Mev. The spectrometer was equippedwith the necessary electronics.
3. Results and discussion
3.1. Groundwater hydrochemistry
The physico-chemical parameters and concentrations of the ions and toxic metals in the studied groundwater samples are given inTable 1. The spatial distributions of these ions and metals, and EC, are illustrated in Figs. 2 and 3. From Table 1 it is evident that thegroundwater in the Bahariya Oasis is characterized by a wide range of discharge temperature (23.3–50 °C), and ranges from slightlyacidic (pH as low as 6.7) to slightly alkaline (pH as high as 7.6). According to Chebotarev (1955) and Detay (1997) it can be classifiedas slightly to moderately mineralized water and fresh water. Na+ is the dominant cation, followed by Ca2+, Mg2+ and K+. On theother hand, HCO3
− is the dominant anion, followed by Cl−, SO42− and NO3
−. Generally, the major ions show more or less similarlocations for anomalies, with the highest concentrations being recorded in El Gedida (well-9) at the extreme northeastern margin ofthe oasis, and in its northern and northwestern parts.
Fe is the most abundant toxic metal in the Bahariya Oasis groundwater, followed by Cu and Mn. The concentrations of Fe areelevated at El Heiz area, and reach a maximum value in well-9. Cu contents show significant levels in El Harraarea and in Mandishaarea, reaching a maximum in El Qasr area. Mn and Cr concentrations are high in El Gedida area (well-9 and well-7), while Ni
Fig. 4. Plots of the collected groundwater samples on the rectangular diagram proposed by Chadha (1999).
Fig. 5. Plots of the investigated groundwater samples on the diagrams proposed by Gibbs (1970).
M. Yehia et al. Journal of Hydrology: Regional Studies 12 (2017) 331–344
337

concentrations are high in El Qasr area, Mandishaarea and El Bawiti area. Zn concentrations are significant in El Gedida (well-9) andreach maximum levels in El Harra (Ain El Eza) and El Qasr (Dedela station). Generally, the toxic metals are highly concentrated in thenorthern parts of the oasis. The elevated concentrations of Fe and Mn in the Bahariya Oasis reflect the lithology of the aquifer, whichis composed of ferruginous sandstones, with local ironstone and manganese-rich bands (Youssef 1999).
3.2. Hydrogeochemical facies and processes
The concentrations of major ions in the groundwaters of the Bahariya Oasis were plotted on a discrimination diagram proposed byChadha (1999). On this diagram it is clear that the majority of the groundwater samples belong to the Na+- Cl−, Na2SO4
− type,followed by the Ca2+- Mg2+- Cl− type. A few samples are of the Na+- HCO3
− type (Fig. 4).Several scatter diagrams for major ions were used to trace the source of each element and identify the mechanisms that have
contribute to Bahariya groundwater evolution. The rock–water interaction for the groundwater was identified using the scatterdiagrams of Gibbs (1970). Fig. 5 shows that the aquifer rocks were the dominant factor controlling the chemical evolution of thegroundwater within the Nubian Sandstone. The relationship of Na+ to Cl− (Fig. 6) shows that the majority of the studied samples lieslightly above the halite dissolution line. Halite has not been recorded in the Nubian Sandstone Aquifer. Hence, the high Na+ and Cl−
contents are most likely related to the dissolution of chloride salts during infiltration of the groundwater. The additional Na+ resultedmost probably from cation exchange in the clay minerals that constitute the shale intercalations within the Nubian SandstoneAquifer. This may have led to the adsorption of Ca2+ on clay minerals and contemporaneous release of Na+ ions (cf. Magaritz et al.,1981). These predicted cation exchanges are confirmed by the results of plotting Ca2+ vs Na+, Ca2+ vs HCO3
− and (Ca2+ + Mg2+)vs. (HCO3
− + SO42−) (Fig. 6). Most of the data lie below and close to the uniline of these relations, which indicates the depletion of
the groundwater in Ca2+ and Mg2+ ions. These latter cations were derived from the weathering of carbonate minerals in the NubianSandstone Aquifer, and were accompanied by cation exchange with Na+ (cf. Reddy and Kumar 2010).
Fig. 6. Plots of the analyzed groundwater samples on different scatter diagrams.
M. Yehia et al. Journal of Hydrology: Regional Studies 12 (2017) 331–344
338

3.3. Radioactivity
The activity concentrations of the natural radionuclides 238U, 232Th and 40K and their spatial distributions in the Bahariya Oasisgroundwater samples are given in Table 1 and shown on Fig. 7. There are significant activity concentrations of 238U in thegroundwater of El Harra (Ain El Bahariya). Similarly, there is a high activity concentration of 232Th in groundwater of El Harra (AinWady), and of 40 K in groundwater of El Heiz (Tablamoun). Several U-238 and Th-232 values exceeded the maximum allowed byWHO (2011). These variations in the activity concentrations of 238U, 232Th and 40 K indicate different origins. They were inherited
Table 2Suitability of the studied groundwater for irrigation.
Parameter Equation Range Class Sample No. No. ofSamples
%
(conc. unit meq/l)
EC (μS/cm;Handa1969)
– <250 Excellent 7H, 28R, 31R, 32R, 33F 52 13.5
251–750 Good 1H, 2H, 3H, 4H, 5H, 6H, 8Z, 9Z, 10Z,11B, 12B, 13B, 14B, 15B, 16B, 17B,18Q, 19Q, 20Q, 21Q, 22Q, 24M, 25M,26M, 27M, 29R, 30R, 34L, 36G, 37G
30 81.1
750–2500 Permissible 23M, 35G 2 5.42501–6000 Doubtful – –6001–10,000 Unsuitable – –
SSP (Eaton,1950)
=+
+ + +
+ +
+ + + +SSP (Na K )x100
(Ca Mg Na K )2 2
<60 Safe Rest of samples 34 91.9
>60 Unsafe 15B, 20Q, 24M 3 8.1
SAR (Todd,1980)
=+
+ + +SAR Na
Ca2 Mg2
2
S1 < 10 Excellent All studied samples All studiedsamples
100
S2 10–18 Good –S3 18–26 Doubtful –S4 > 26 Unsuitable –
RSC (Todd,1980)
= + − +− − + +RSC (CO HCO ) (Ca Mg )32
32 2
<1.25 Excellent All studied samples All studiedsamples
100
1.25–2.5 Doubtful –>2.5 Unsuitable –
MAR (Todd,1980)
=+
+
+ +MAR
Mg x100Ca Mg
2
2 2
<50 Suitable 2H, 3H, 4H, 5H, 6H, 7H, 8Z, 10Z, 11B,12B, 15B, 16B, 18Q, 20Q, 22Q, 24M,25M, 27M, 28R, 29R, 30R, 31R, 32R,36G
24 64.9
>50 Unsuitable 1H, 9Z, 13B, 14B, 17B, 19Q, 21Q,23M, 26M, 33F, 34L, 35G, 37G
13 35.1
Fig. 7. Spatial distributions of the activity concentrations of 238U, 232Th and 40 K in the groundwater samples.
M. Yehia et al. Journal of Hydrology: Regional Studies 12 (2017) 331–344
339

from different sources, depths and experienced transportation through different pathways in the geological layers.
3.4. Groundwater quality for irrigation purposes
The evaluation of the investigated groundwater for irrigation purposes (Tables 2 & 3) is based on their Electrical Conductivity(EC), Soluble Sodium Percentage (SSP), Sodium Adsorption Ratio (SAR), Residual Sodium Carbonate (RSC), Magnesium AdsorptionRatio (MAR), and toxic metal content. The measured values of EC indicate that the groundwater at Mandisha station and Well 9,which represent 5.4% of the total samples, can be classified as permissible. The calculated values of combined SSP, SAR and RSCrevealed that there is no problem in relation to sodium content for this groundwater to be used in irrigation. However, the SSP valuesrevealed that the samples collected from Dedela Hot, El Beshmou and El Aguz, which represent 8.1% of the total samples, are unsafe.This problem in the study area may be resolved using an effective drainage system. On the other hand, the calculated values of MARindicate that 35.1% of the studied samples are unsuitable for irrigation. The concentrations of Mn, Cu, Fe and Cr in the irrigationgroundwater of the Bahariya Oasis (Table 3) exceed the maximum allowable limits (MAL) proposed by Ayers and Westcot (1985) andCCME (1999).
3.5. Groundwater quality for domestic purposes
The evaluation of the Bahariya Oasis groundwater for domestic purposes is based on their Total Dissolved Solids (TDS), TotalHardness (TH) and Corrosivity Ratio (CR). Table 4 shows that both Mandisha station and Well 9 groundwater samples (5.4% of the
Table 4Suitability of the studied groundwater samples for domestic purposes.
Parameter Equation Range Class Sample No. No. ofSamples
%
TDS (mg/l; Bruvold andDaniels 1990)
– <80 Excellent –
80–500 Good Rest of samples 35 94.6500–800 Fair 23M, 35G 2 5.4800–100 Poor>1000 Unacceptable
TH (mg/l; Sawyer andMcCarthy 1967)
= × + ×+ +TH 2.5 Ca 4.1 Mg2 2 <75 Soft 1H, 3H, 4H, 6H, 7H, 12B, 13B, 15B, 16B,18Q, 22Q, 25M, 28R, 29R, 30R, 31R, 32R,33F, 34L, 36G
20 54.1
75–150 Moderately Hard 2H, 5H, 8Z, 9Z, 10Z, 11B, 14B, 17B, 19Q,20Q, 21Q, 24M, 26M, 27M, 37G
15 40.5
150–300 Hard 23M, 35G 2 5.4>300 Very Hard
CR (Ryznre 1944)
=+
− −
−CR2xHCO
x100Cl35.5
SO42
96
3
<1 Safe 1H, 7H, 9Z, 12B, 13B, 14B, 15B, 16B, 17B,19Q, 21Q, 22Q, 25M, 26M, 31R, 32R, 36G,37G
18 48.6
>1 Unsafe 2H, 3H, 4H, 5H, 6H, 8Z, 10Z, 11B, 18Q,20Q, 23M, 24M, 27M, 28R, 29R, 30R, 33F,34L, 35G
19 51.4
Table 3Percentages of the groundwater samples which exceed the maximum allowable limit for irrigation.
Metal MAL Samples Exceed %(ppm)
Cr 0.1a 25M 2.7Cu 0.2 a 1H, 3H, 10Z, 15B, 17B, 20Q, 22Q, 24M, 26M, 27M, 28R, 29R, 30R, 31R, 32R, 34L, 35G, 36G, 37G 51.4Fe 5 a,b 2H, 6H, 17B, 35G 10.8Mn 0.2 a, b 1H, 2H, 3H, 4H, 5H, 6H, 7H, 8Z, 10Z, 11B, 14B, 15B, 16B, 17B, 18Q, 20Q, 21Q, 22Q, 23M, 24M, 25M, 26M, 27M, 28R, 29R, 30R, 31R,
32R, 35G78.4
Ni 0.2 a, b – –Pb 0.2 b – –V 0.1 a,b – –Zn 2 a – –
a = Ayers and Westcot (1985).b = CCME (1999).
M. Yehia et al. Journal of Hydrology: Regional Studies 12 (2017) 331–344
340

total samples) can be classified as fair or hard, according to their TDS concentrations and calculated values of TH, respectively. On theother hand, the CR values reveal that 51.4% of the samples are unsafe for domestic uses.
3.6. Groundwater quality for drinking
The evaluation of the Bahariya Oasis groundwater for drinking is based on their Nitrate Pollution Index (NPI), toxic metal content,radiation hazard and Water Quality Index (WQI). The calculated NPI values for the studied groundwater samples (−0.55 to −0.99)reveals that all samples are free from nitrate pollution. However, the concentrations of the toxic metals Fe, Mn, Pb, Cu, Cr, Ni and Vall exceed the MAL for drinking water (Table 6). In order to assess the radiation exposure for inhabitants of the Bahariya Oasis, theestimation of total annual dose due to ingestion of 238U, 232Th and 40K in groundwater samples was estimated based on the activityconcentrations and dose conversion factors of these radionuclides. The dose per unit intake for 238U is 4.5 × 10⁻⁸ mSv/Bq, for 232This 2.3 × 10⁻⁷ mSv/Bq and for 40K is 6.2 × 10⁻⁹ (ICRP, 2012). The annual water consumption for each adult is 730 L (2 L daily)(WHO 2011). The values of total annual dose (TAD) of natural radionuclides calculated for the Bahariya oasis groundwater samplesrange from 0.00047 to 0.00366 mSv/year, which does not exceed the recommended annual dose values for drinking water. Allchemical parameters were used to calculate the WQI for the Bahariya Oasis groundwater samples, applying the software developedby Nabizadeh et al. (2013). According to Sahu and Sikdar (2008) the obtained values (Table 5) reveal that this groundwater can beclassified as excellent (13.52%), good (40.54%), poor (40.54%), very poor (2.7%) or unsuitable (2.7%).
4. Conclusions
The chemical composition of the Bahariya Oasis groundwater is strongly affected by its interaction with the lithologies of theNubian Sandstone Aquifer. Dissolution of some aquifer rock components (carbonates and iron oxides) and chloride salts duringinfiltration of the groundwater, and addition of cations by ionic exchange of Na+ by Ca2+ in clay minerals, are the two mainprocesses controlling the geochemistry of the studied groundwater. Most of the irrigation groundwater problems in the study area canbe resolved by an effectively managed drainage system. There are no health hazards associated with natural radioactivity in thisgroundwater, however, the Bahariya Oasis communities experience other water quality problems. The Bahariya groundwater iscontaminated by toxic metals with elevated levels higher than permissible for either irrigation or drinking purposes. The groundwateris not safe to use for domestic purposes, unless there is filtration of the water through suitable membranes capable of excluding thetoxic metals. More research is required in some groundwater localities, such as Mandisha (Mandisha station) and El Gedida (Well 9).The Water Quality Index (WQI) reveals that about 45.9% of the studied groundwater samples are poor, very poor or unsuitable. Inorder to ensure safe usage of the groundwater for human consumption, regular monitoring of the water quality is vitally necessary.
Conflict of interests
Yes, I do not have conflict of interest to declare.
Acknowledgement
The authors thank Dr. Thomas Fowler Associate Professor of Geology, UAE University for reviewing the language of themanuscript.
M. Yehia et al. Journal of Hydrology: Regional Studies 12 (2017) 331–344
341

Table5
Suitab
ility
oftheinve
stigated
grou
ndwater
fordrinking
purposes.
Parameter
Equa
tion
Ran
geClass
SampleNo.
No.
ofSa
mples
%
=−
NPI
CH
AV
HA
VS
NPI(O
beidat
etal.,
2012
)Whe
re,C
Sis
thean
alytical
conc
entrationof
nitratein
thesamplean
dHAV
isthethresholdva
lueof
anthropo
genicsource
(hum
anaff
ectedva
lue)
take
nas
20mg/
l.<
0Unp
olluted
Allstud
iedsamples
Allstud
ied
samples
100
0–1
Ligh
tpo
llution
–1–
2Mod
erate
pollu
tion
–
2–3
sign
ificant
pollu
tion
–
>3
very
sign
ificant
pollu
tion
–
TAD(A
DWG,1
996)
=
×
×
TAD
(mSy
/yea
r)D
ose
per u
nit i
ntak
e(m
Sv/B
q)A
nnua
l wat
er c
onsu
mpt
ion(
litre
/yea
r)Ra
dion
uclid
e co
ncen
trat
ion(
Bq/l
)
<0.1
Safe
Allstud
iedsamples
Allstud
ied
samples
100
>0.1
Unsafe
–
=q
C Sx1
00i
i i
=SI
Wxq
ii
i
∑=
WQ
ISI
i
WQI(Sah
uan
dSikd
ar,2
008)
whe
req i
isthequ
alityrating
,Ciis
theco
ncen
trationof
each
chem
ical
parameter
ineach
water
sample,
andS i
isthedrinking
water
stan
dard
foreach
chem
ical
parameter
acco
rdingto
WHO
(201
1),S
I iis
the
subind
exof
ithpa
rameter;q
iis
therating
basedon
conc
entrationof
ithpa
rameter.
<50
Excelle
nt7H
,12B
,19Q
,33F
,37G
513
.52
50–1
00Goo
d3H
,4H,5
H,8
Z,9Z
,10Z
,11B
,13
B,16
B,21
Q,2
3M,2
7M,2
8R,
29R,3
6G
1540
.54
100–
200
Poor
1H,2
H,6
H,1
8Q,1
4B,1
5B,
17B,
20Q,2
2Q,2
4M,2
6M,
30R,3
1R,3
2R,3
4L
1540
.54
200–
300
Verypo
or25
M1
2.70
>30
0Unsuitable
35G
12.70
M. Yehia et al. Journal of Hydrology: Regional Studies 12 (2017) 331–344
342

References
ADWG (Australian Drinking Water Guidelines), 1996. Australian Drinking Water Guidelines. National Water Quality Management Strategy. Australian Water andWastewater Association, Canberra, Australia 376p.
APHA (American Public Health Association), 1999. Standard Methods for the Examination of Water and Wastewater, 21th ed. APHA, Washington.Al-Katheeri, E.S., Howari, F.M., Murad, A.A., 2009. Hydrogeochemistry and pollution assessment of quaternary-tertiary aquifer in the Liwa area, United Arab Emirates.
Environ. Earth Sci 59, 581–592. http://dx.doi.org/10.1007/s12665-009-0056-y.Arslan, H., Turan, N.A., 2015. Estimation of spatial distribution of heavy metals in groundwater using interpolation methods and multivariate statistical techniques; its
suitability for drinking and irrigation purposes in the Middle Black Sea Region of Turkey. Environ. Monit. Assess. 187, 516. http://dx.doi.org/10.1007/s10661-015-4725-x.
Ayers, R.S., Westcot, D.W., 1985. Water Quality for Agriculture. FAO Irrigation and Drainage Paper 29, 97p.Baba, A., Tayfur, G., 2011. Groundwater contamination and its effect on health in Turkey. Environ. Monit. Assess. 183, 77–94.Banat, K.M., Howari, F.M., 2002. Hydrochemical characteristics of Jordan and Yarmouk river waters: effect of natural and human activities. J Hydrol Hydromech 50
(1), 50.Banat, K.M., Howari, Fares, 2005. Water chemical characteristics of the Red Sea coastal sabkhas and associate evaporite and carbonate minerals. J. Coast. Res. 21 (5),
1068–1082.Banat, K.M., Howari, F.M., Al-Hamad, A.A., 2005. Heavy metals in urban soils of central part of Jordan: Should we worry about their environmental risks. Environ.
Res. 97 (3), 258–273.Bruvold, W.H., Daniels, J.I., 1990. Standards for mineral content in drinking water. J. Am. Water Works Assoc. 82, 59–65.CCME (Canadian Council of Ministers of the Environment) (1999). Canadian environmental quality guidelines. Canadian Council of Ministers of the Environment.
Publication No. 1299, Ottawa.Catuneanu, O., Khalifa, M.A., Wanas, H.A., 2006. Sequence stratigraphy of the lower cenomanian Bahariya formation, Bahariya Oasis, Western Desert, Egypt.
Sediment. Geol. 190, 121–137.Chadha, D.K., 1999. A proposed new diagram for geochemical classification of natural waters and interpretation of chemical data. Hydrol. J. 7, 431–439.Chebotarev, I.I., 1955. Metamorphism of natural waters in the crust weathering. Geochim. Cosmochim. Acta 8 (1), 22–32.Detay, M., 1997. Water Wells: Implementation, Maintenance and Restoration. John Wiley and Sons, London, pp. 379p.Dokou, Z., Kourgialas, N.N., Karatzas, G.P., 2015. Assessing groundwater quality in Greece based on spatial and temporal analysis. Environ. Monit. Assess. 187, 774.
http://dx.doi.org/10.1007/s10661-015-4998-0.Dong, W., Lin, X., Du, S., Zhang, Y., Cui, L., 2015. Risk assessment of organic contamination in shallow groundwater around a leaching landfill site in Kaifeng, China.
Environ. Earth Sci. 74, 2749–2756.ESDW (Egypt Standard for Drinking Water) (2007). Standards and specifications of water for drinking and domestic use. Decision of the Minister of Health and
Population No. 458 (2007), Ministry of Health and Population, 10p. (In Arabic).Eaton, F.M., 1950. Significance of carbonate in irrigation water. Soil Sci. 69, 123–134.Edmunds, M., Shad, P., 2008. Natural Groundwater Quality. Blackwell, USA.El Akkad, S., Issawi, B., 1963. Geology and Iron Ore Deposits of the Bahariya Oasis. Geological Survey of Egypt. Paper No. 18, 301p.Eweida, E.A., Abdallah, A.M., 1980. Hydrogeological studies of el gideda mines water wells, bahariya oases, western desert, Egypt. Ann. Geol. Surv. Egypt 15,
855–862.Gibbs, R.J., 1970. Mechanisms controlling world’s water chemistry. Science 170, 1088–1090.Hamdan, A.M., Sawires, R.F., 2013. Hydrogeological studies on the Nubian sandstone aquifer in El-Bahariya oasis, Western Desert, Egypt. Arab. J. Geosci. 6,
1333–1347.Handa, B.K., 1969. Description and Classification of Media for Hydro-geochemical Investigations. Symposium on Ground Water Studies in Arid and Semiarid Regions,
Roorkee.Hao, X., Wang, D., Wang, P., Wang, Y., Zhou, D., 2016. Evaluation of water quality in surface water and shallow groundwater: a case study of a rare earth mining area
in southern Jiangxi Province, China. Environ. Monit. Assess. 188, 24. http://dx.doi.org/10.1007/s10661-015-5025-1.Howari, Fares, Banat, K.M., 2001. Assessment of Fe, Zn, Cd, Hg, and Pb in the Jordan and Yarmouk River sediments in relation to their physicochemical properties and
sequential extraction characterization. Water Air Soil Pollut. 132 (1–2), 43–59.Howari, Fares, Abu-Rakah, Y., Shinaq, R., 2005. Hydrochemical composition of spring waters in North Jordan. J. Water Resour. 32 (5), 607–616.Howari, F., Goodell, P., Salman, A., 2016. Metallogenic evolution of uranium deposits in the Middle East and North Africa deposits. J. Afr. Earth Sci. 114, 30–42.
http://dx.doi.org/10.1016/j.jafrearsci.2015.11.009.Howari, F.M., 2016. Hydrochemical evaluation of rio grande water transport options from elephant butte, new mexico to el paso, texas US –Mexico border. Environ.
Earth Sci. 75 (2), 1–12.ICRP (International Commission on Radiological Protection) (2012). Compendium of dose coefficients based on ICRP Publication 60. ICRP Publication 119, Ann. ICRP
41(Suppl.), 130p.Khater, A.E., 2003. Radiological aspects of some Egyptian thermo-mineral springs. J. Environ. Monit. 5, 414–418.Korany, E.A., Hammad, F.A., Abd El Ati, A., 2002. An assessment of hydrogeological conditions of Nubia aquifer in Bahariya and Farafra depressions, Western Desert,
Egypt. J. Environ. Res. Zagazig Univ. 18, 1–24.Korany, E.A., 1984. On the demonstration of the hydrogeological control by local geologic structures, Bahariya Oasis, Egypt. E.G.S. Proc. of the 3rd Ann. Meeting
341–355.
Table 6Percentages of the groundwater samples which exceed the maximum allowable limit for drinking purposes.
Metal MAL Samples Exceed %(ppm)
Cr 0.05a,b 3H, 25M, 30R, 34L, 36G 13.5Cu 2 a,b 20Q, 26M, 27M, 30R, 31R, 32R, 34L, 35G, 36G 24.3Fe 0.3 a,c All samples 100Mn 0.4 a 1H, 2H, 5H, 6H, 7H, 8Z, 10Z, 14B, 15B, 16B, 17B, 18Q, 20Q, 21Q, 22Q, 23M, 24M, 25M, 28R, 29R, 30R, 31R, 32R, 35G 64.9Ni 0.02 a – 0.07 b 9Z, 20Q 5.4Pb 0.01 a,b 1H, 20Q, 21Q, 24M, 26M, 27M, 30R, 31R, 32R, 34L 27V 0.07c 25M, 26M 5.4Zn 3 a,b,c – –
a = ESDW (2007).b = WHO (2011).c = US EPA (2007).
M. Yehia et al. Journal of Hydrology: Regional Studies 12 (2017) 331–344
343

Magaritz, M., Nadler, A., Koyumdjisky, H., Dan, N., 1981. The use of Na/Cl ratio to trace solute sources in a semiarid zone. Water Resour. Res. 17 (3), 602–608.Murad, A., Zhou, X.D., Yi, P., Alshamsi, D., Aldahan, A., Hou, X.L., Yu, Z.B., 2014. Natural radioactivity in groundwater from the south-eastern Arabian Peninsula and
environmental implications. Environ. Monit. Assess. 186, 6157–6167.Nabizadeh, R., Amin, M.V., Alimohammadi, M., Naddafi, K., Mahvi, A.H., Yousefzadeh, S., 2013. Development of innovative computer software to facilitate the setup
and computation of water quality index. J. Environ. Health Sci. Eng. 11 (1), 1–10.Obeidat, M.M., Awawdeh, M., Abu Al-Rub, F., Al-Ajlouni, A., 2012. An innovative nitrate pollution index and multivariate statistical investigations of groundwater
chemical quality of Umm Rijam Aquifer (B4), North Yarmouk River Basin, Jordan. In: Voudouris, K., Dimitra, V. (Eds.), Water Quality Monitoring and Assessment.InTech, Croatia, pp. 169–188.
Reddy, A.G., Kumar, K.N., 2010. Identification of the hydrogeochemical processes in groundwater using major ion chemistry: a case study of Penna–Chitravathi riverbasins in Southern India. Environ. Monit. Assess. 170, 365–382.
Ryznre, J.W., 1944. A new index for determining amount of calcium carbonate scale formed by water. J. Am. Water Works Assoc. 36, 472–486.Sahu, P., Sikdar, P.K., 2008. Hydrochemical framework of the aquifer in and around East Kolkata wetlands, West Bengal, India. Environ. Geol. 55, 823–835.Said, R., 1962. The Geology of Egypt. Elsevier Sci. Ltd., Amsterdam (377p).Sawyer, G.N., McCarthy, D.L., 1967. Chemistry of Sanitary Engineers, 2nd ed. McGraw Hill, New York, pp. 518p.Shahin, R.R., Abdel Hamid, M.A., Abdel Aal, S., 1996. Contamination of groundwater in Bahariya Oasis by some heavy metals. Egypt. J. Soil Sci. 36, 119–132.Shata, A.A., 1982. Hydrogeology of the Great Nubian Sandstone basin, Egypt. Q. J. Eng. Geol. Hydrogeol. 15, 127–133.Shehata, M.A., 1992. 2. Hydrochemical Relationship Between Deep and Shallow Aquifer in Bahariya and Farafra Oases, Egypt 13. Bulleten of Faculty of Science,
Zagazig Universitypp. 206–225.Todd, D.K., 1980. Groundwater Hydrology, 2nd edn. Jhon Wiley and Sons, New York (535p.).US EPA (United States Environmental Protection Agency), 2007. Drinking Water Standards and Health Advisories Table. San Francisco, USA.WHO (World Health Organization), 2011. Guidelines for Drinking-water Quality, 4th ed. Gutenberg, 541p.Wongsasuluk, P., Chotpantarat, S., Siriwong, W., Robson, M., 2014. Heavy metal contamination and human health risk assessment in drinking water from shallow
groundwater wells in an agricultural area in Ubon Ratchathani province, Thailand. Environ. Geochem. Health 36 (1), 169–182.Youssef, A.M., 1999. Geochemical and Hydrogeochemical Investigations of El Bahariya Depression, Western Desert, Egypt, Application to Genesis of Ore Deposits
Unpublished Ph.D. Dissertation. Faculty of Science, Ain Shams University, Egypt 303p.Yuce, G., Ugurluoglu, D., Dilaver, A.T., Eser, T., Sayin, M., Donmez, M., Ozcelik, S., Aydin, F., 2009. The effects of lithology on water pollution: natural radioactivity
and trace elements in water resources of Eskisehir region (Turkey). Water Air Soil Pollut. 202, 69–89.
M. Yehia et al. Journal of Hydrology: Regional Studies 12 (2017) 331–344
344