monitoring landfill cover by electrical resistivity
TRANSCRIPT

HAL Id: hal-00716361https://hal-brgm.archives-ouvertes.fr/hal-00716361
Submitted on 10 Jul 2012
HAL is a multi-disciplinary open accessarchive for the deposit and dissemination of sci-entific research documents, whether they are pub-lished or not. The documents may come fromteaching and research institutions in France orabroad, or from public or private research centers.
L’archive ouverte pluridisciplinaire HAL, estdestinée au dépôt et à la diffusion de documentsscientifiques de niveau recherche, publiés ou non,émanant des établissements d’enseignement et derecherche français ou étrangers, des laboratoirespublics ou privés.
Monitoring landfill cover by electrical resistivitytomography on an experimental site
Fanny Genelle, Colette Sirieix, Joëlle Riss, Véronique Naudet
To cite this version:Fanny Genelle, Colette Sirieix, Joëlle Riss, Véronique Naudet. Monitoring landfill cover by electricalresistivity tomography on an experimental site. Engineering Geology, Elsevier, 2012, 145-146, p.18-29. �10.1016/j.enggeo.2012.06.002�. �hal-00716361�

1
MONITORING LANDFILL COVER BY ELECTRICAL RESISTIVITY 1
TOMOGRAPHY ON AN EXPERIMENTAL SITE 2
3
4
Fanny GENELLE a,b,*
, SIRIEIX Colette a, RISS Joëlle
a, NAUDET Véronique
a,c 5
6
a Univ. Bordeaux, I2M, UMR5295, F-33400 Talence, France ; [email protected], 7
[email protected] , [email protected], [email protected] 8
b HYDRO INVEST, 514 route d’Agris, 16430 Champniers, France 9
c Actually at BRGM, 3 avenue Claude Guillemin, 45060 Orléans, France 10
* Corresponding author. Université Bordeaux 1, Laboratoire GCE - I2M, Bâtiment B18, 11
Avenue des facultés, 33400 Talence France ; Tel : (+33) 05 40 00 26 20, Fax : (+33) 05 40 00 12
31 13, [email protected] 13
14
Abstract 15
In France, the monitoring of landfill cover after closure of the site is a local problem, since its 16
tightness must be ensured over time. Leaks in the cover are a problem, as they allow water to 17
infiltrate the stored waste. In order to locate such leaks, electrical resistivity tomography was 18
used on an experimental site in which defects had been intentionally made in the cover. 19
Repeated measurements taken on this site showed that the weather conditions preceding the 20
measurements need to be taken into account, as they affect the water content in the cover 21
material. They also showed that there are optimal weather conditions for detecting defects in 22
the cover. A statistical analysis carried out on the electrical resistivity results for all surveys 23
and cover material samples showed that the material was heterogeneous; this variability was 24
mainly due to a difference in particle size (fines content) and in compaction. 25

2
This study has shown the capacity of electrical resistivity tomography to detect defects and 26
heterogeneity in the cover material, indicating that it is a good means of monitoring the 27
quality of landfill cover both when it is put in place and subsequently. 28
29
Keywords: landfill cover, gravelly clay material, heterogeneity, compaction, electrical 30
resistivity, multivariate analysis 31
32
1. Introduction 33
34
In France, the management of household waste is a local problem regarding the 35
quantities of waste produced each year. Nearly half of it is stored in Municipal Solid Waste 36
Landfills (MSW). These sites consist of several cells which are covered once they are full of 37
waste. On its edges, this cover must have a slope of aroud 3% to facilitate water runoff. The 38
law of 9 September 1997, published in the French journal officiel on 2 October 1997, made it 39
obligatory to cover landfill so as to limit the infiltration of water into the waste; there is also 40
an economic aspect, since the cost of treating leachates is high. The law was modified by the 41
orders of 31 December 2001, 3 April 2002, 19 January 2006 and 18 July 2007. However, 42
there are no French regulations concerning the composition of the cover. It is simply 43
recommended to use clayey material which may be associated with geosynthetics 44
(geomembranes or Geosynthetic Clay Liners), depending on the date of closure (Silvestre et 45
al., 2003; ADEME, 2001). Over time, mechanical, climatic and hydraulic constraints may 46
induce leaks in the cover. Indeed, the cover can be damaged during its installation. It is 47
important to locate the damaged areas as they can cause an increase in the quantity of 48
leachates in times of rain. 49

3
Being non-destructive, geophysical methods could be a good way of detecting these 50
anomalous zones. The use of electrical methods seems interesting for investigating the cover 51
of landfills containing non-hazardous waste, for which few studies have been undertaken 52
(Carpenter et al., 1991; Guyonnet et al., 2003; Ait Saadi, 2003). The electrical resistivity of a 53
soil is a function of many properties (a synthesis of which was presented by Samouëlian et al. 54
(2005)) such as compaction (Abu-Hassanein, 1996; McCarter, 1984), water content 55
(Schwartz, 2008) and density of the material (Cosenza et al., 2010; Seladji et al., 2007; 56
Besson et al., 2004) as well as temperature (Blewett, 2003; Rein et al., 2004; Hayley et al., 57
2007). 58
In order to study the behaviour of a loamy-clay cover material, an experimental site 59
was established in which the effect of ageing was intentionally simulated through defects in 60
the cover. The aim of our study was to test the ability of electrical resistivity methods to 61
detect these defects and to characterise the heterogeneity of the cover material. 62
After the description of the study site, the electrical resistivity methods used to 63
characterise the cover material are presented. The influence of the meteorological conditions 64
(temperature and precipitations) was taken into account through the continuous recording of 65
weather data near the site, as well as humidity and temperature data at various depths in the 66
cover. Finally, the electrical resistivity models for the various surveys undertaken on the 67
experimental site are presented. After observation of the varied behaviour of the cover, we 68
carried out multivariate analysis on the electrical resistivity data of the gravelly-clay material. 69
Finally, samples taken from the cover are described and interpreted. 70
71
72
2. Material and methods 73
74

4
2.1 Presentation of the experimental site 75
76
An experimental site was excavated with the aim of studying the behaviour of a 77
landfill cover made up of 0.15 m of topsoil and one metre of reworked clayey material (Figure 78
1). The material was brought in from the town of Touvre en Charente (France), some 10 km 79
distant, and had been excavated two months before being transported to the site. The material 80
consisted of ancient alluviums made up, essentially, of silts and brown plastic clays. 81
Laboratory tests such as methylene blue adsorption test (index about 5.5) and Atterberg limits 82
(plasticity index Ip 11%) confirmed the loamy-clay nature of the material samples taken 83
with the hand auger. However, the non-samplable sand and gravel observed in-situ lead us to 84
qualify the material as gravelly clay, according to the GTR classification (NF P 11-300). 85
The material was put in place in three stages: the first layer of 40 cm and two other 86
layers of 30 cm (referred to as Layer 1, Layer 2 and Layer 3 respectively in Figure 1). The 87
experimental site was excavated in loamy alluvium, except for the north-west and south-east 88
extremities, where the bedrock was backfilled (Figure 1). The material of each layer was 89
levelled using the scoop of a 9-ton mechanical digger and then compacted by the caterpillar 90
tracks of the mechanical digger as it was driven over the whole surface. The site building 91
conditions have unfortunately not allowed to perform Proctor tests on the gravelly clay 92
material. Moreover, because of the small size of the experimental site, the recommended 93
slope of the cover has not been created. As the layers of gravelly clay material were put in 94
place, so were cracks and material generally used for geodrains in landfill sites (Figure 1). 95
96
The three 2.5 m-long cracks went through the thickness of the gravelly clay material 97
cover, from -0.15 to -1.15 m (Figures 1 and 2). They were made to simulate a construction 98
defect or the consequences of deterioration by shrinkage and swelling of the cover material or 99

5
by differential settling. The 4 and 10 cm-wide cracks were filled with sand. Two geodrains, 100
G1 and G2, 8 mm wide and with an area of approximately 1 square metre, were placed, one 101
after the first layer of the cover was put in place, the other after the second layer (Figures 1 102
and 2). 103
104
Moisture probes (FDR type thetaprobes) and temperature probes (PT100) were also 105
installed as the site was established (Figure 2) to record humidity and temperature over time. 106
The site building conditions made it necessary to develop a procedure for correcting the 107
moisture measurements after probes were put in place. As the hydric conditions of the cover 108
material were constant during the 11 days between the beginning of recording on the 109
9 October 2009 and the first rain, it was estimated that the curves would be superimposed 110
during this dry period. The a posteriori procedure was thus to check the consistency of each 111
of the four curves during this period and to superimpose them, taking, as reference, the curve 112
with values that corresponded to the humidity measurements taken in the laboratory on a 113
given date. 114
A weather station was set up near the site so as to record the meteorological conditions 115
(precipitations, atmospheric temperature, etc.). Evapotranspiration was also recorded at the 116
station. 117
118
119
2.2 Measurements by electrical resistivity tomography 120
121
Since the site was set up in September 2009, six surveys using electrical resistivity 122
tomography have been carried out using the Syscal Pro (IRIS Instruments) resistivity meter 123
with various arrays (Wenner, Wenner-Schlumberger, gradient and dipole-dipole). Here, we 124
6
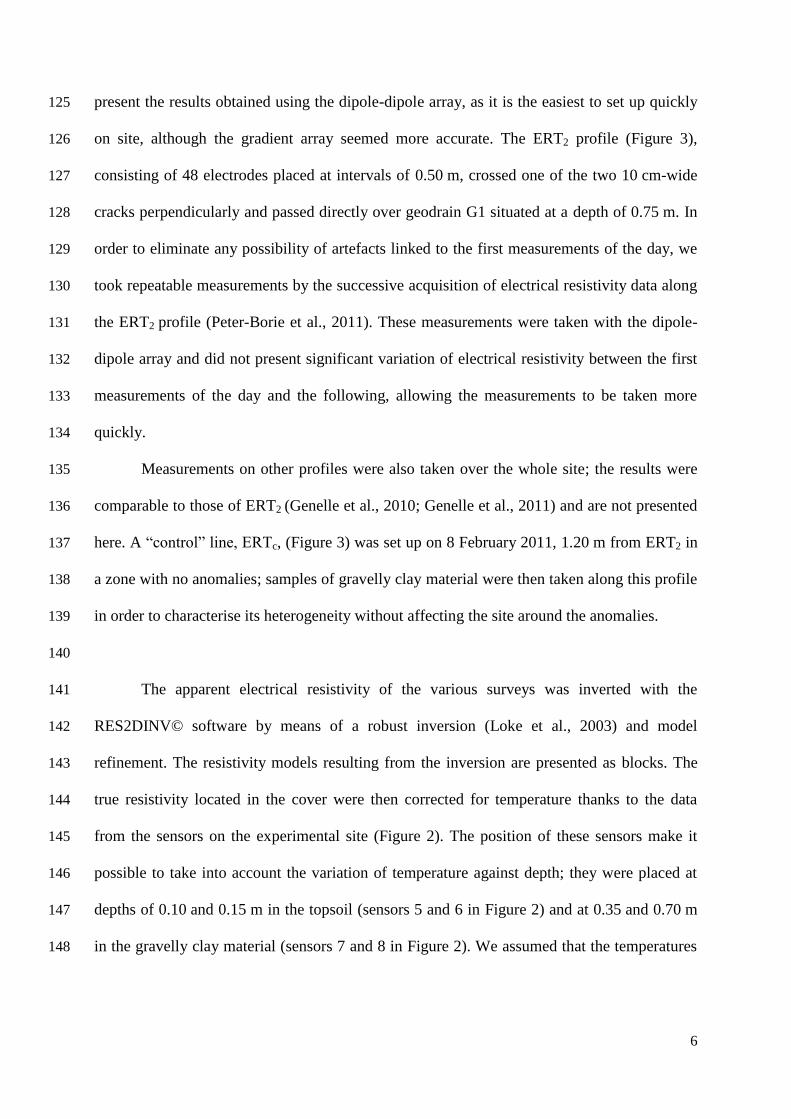
present the results obtained using the dipole-dipole array, as it is the easiest to set up quickly 125
on site, although the gradient array seemed more accurate. The ERT2 profile (Figure 3), 126
consisting of 48 electrodes placed at intervals of 0.50 m, crossed one of the two 10 cm-wide 127
cracks perpendicularly and passed directly over geodrain G1 situated at a depth of 0.75 m. In 128
order to eliminate any possibility of artefacts linked to the first measurements of the day, we 129
took repeatable measurements by the successive acquisition of electrical resistivity data along 130
the ERT2 profile (Peter-Borie et al., 2011). These measurements were taken with the dipole-131
dipole array and did not present significant variation of electrical resistivity between the first 132
measurements of the day and the following, allowing the measurements to be taken more 133
quickly. 134
Measurements on other profiles were also taken over the whole site; the results were 135
comparable to those of ERT2 (Genelle et al., 2010; Genelle et al., 2011) and are not presented 136
here. A “control” line, ERTc, (Figure 3) was set up on 8 February 2011, 1.20 m from ERT2 in 137
a zone with no anomalies; samples of gravelly clay material were then taken along this profile 138
in order to characterise its heterogeneity without affecting the site around the anomalies. 139
140
The apparent electrical resistivity of the various surveys was inverted with the 141
RES2DINV© software by means of a robust inversion (Loke et al., 2003) and model 142
refinement. The resistivity models resulting from the inversion are presented as blocks. The 143
true resistivity located in the cover were then corrected for temperature thanks to the data 144
from the sensors on the experimental site (Figure 2). The position of these sensors make it 145
possible to take into account the variation of temperature against depth; they were placed at 146
depths of 0.10 and 0.15 m in the topsoil (sensors 5 and 6 in Figure 2) and at 0.35 and 0.70 m 147
in the gravelly clay material (sensors 7 and 8 in Figure 2). We assumed that the temperatures 148

7
recorded at each depth, far from any defect, would be representative of those in the whole 149
material (top soil and gravelly clay) at the same depth. 150
Concerning the correction for temperature, various models allow the electrical 151
resistivity values recorded at temperature T (denoted as ρT) to be adjusted to the reference 152
temperature of 25° C (denoted as ρ25) (Ma et al., 2010). The correction factor fT can be 153
expressed by means of various functions: linear (Campbell et al., 1948), exponential (Sheets 154
and Hendrickx, 1995; Lück et al., 2005; Corwin and Lesch, 2005) and power (Besson et al., 155
2008). Ma et al. (2010) compared these various expressions of the correction factor to 156
measurements of electrical resistivity taken at various temperatures on soil samples and 157
published in the Agriculture Handbook n°60 (US Salinity Laboratory Staff, 1954). The 158
expression 2525TT )815.26Texp(4034.14470.0f , established by Corwin 159
and Lesch in 2005, is the one for which the residues calculated in relation to the data in the 160
Agriculture Handbook, for temperatures of between 3 and 47 °C, are the lowest. So, it is this 161
expression that is used here to correct the values of electrical resistivity. 162
163
2.3 Monitoring precipitations, atmospheric temperature and humidity 164
165
Study of the electrical resistivity measured over time on the experimental site required 166
the current and preceding meteorological conditions to be taken into account. The data for 167
effective rain (Figure 4. a) and atmospheric temperature (Figure 4. b) allow the classification 168
of the surveys undertaken on the site according to the local meteorological conditions. To 169
facilitate the use of these figures, the date of each geophysical survey is indicated in Figure 4 170
by a black line. 171
172

8
According to the hydric conditions and temperature observed during the six surveys, 173
the measurements were classified in two periods, wet and dry. The wet period measurements 174
were those taken on 2 and 10 February and 19 November 2010, when the rainfall 175
accumulation was 60.3 mm in the month of January and 90.0 mm for the period 1 to 176
18 November 2010. These high levels of precipitations were linked to low atmospheric 177
temperature, on average 2.8 °C during the surveys from 2 to 10 February and 8.4 °C during 178
the survey of 19 November 2010. 179
The meteorological conditions observed at the time of the measurements taken in 180
September 2010 differ from those of the three preceding surveys. During July, August and 181
September, atmospheric temperatures were high (the monthly averages were respectively 182
21.8 °C, 19.6 °C and 16.5 °C) and there were negative effective rainfall accumulations 183
(respectively -113.3 mm, -88.8 mm and -64.0 mm). This absence of effective rain led to a 184
decrease in humidity in the gravelly clay material. The volumetric water content during the 185
dry period at the time of this survey was 0.20 m3.m
-3 at a depth of 0.70 m (Figure 4 c.). This 186
value contrasts with the higher one recorded during the wet period (0.26 m3.m
-3 -187
corresponding to a humidity variation of 30%). 188
The February 2011 measurements were taken in intermediary hydric conditions, 189
between those of the two preceding periods. The humidity of 0.25 m3.m
-3 at a depth of 0.70 m 190
was lower than that of February 2010. This value represents a reduction of about 4% and is 191
linked to a rainfall accumulation that was four times lower in the month of January 2011 192
(15.8 mm) than in the preceding year (60.3 mm). 193
Although the volumetric water content of the gravelly clay material during the survey 194
of 8 February 2011 was similar to that of 22 October 2009 (0.23 m3.m
-3), these two surveys 195
have to be studied separately. The October survey occurred after a single fall of rain (19.3 mm 196
on 20 September 2009) which took place after the experimental site was established, while the 197

9
February 2011 survey took place after a series of episodes of light rain (on average, 2 mm per 198
day) with an accumulation of effective rain of 3.6 mm one month before the survey. 199
200
2.4 Qualification of the initial state of the experimental site 201
202
After each of the three layers of gravelly clay material was put in place, electrical 203
mapping was carried out using 2 m mesh made up of six parallel lines arranged in a north-204
west south-east direction. The measurements were taken with a Schlumberger array 205
(AB/2=0.50 m and MN/2= 0.10 m) thanks to a device developed by HYDRO INVEST. 206
Between the 8 and 14 September 2009, the cover material was put in place and the resistivity 207
measurements were taken. 208
The measurements of apparent electrical resistivity were then inverted on the basis of a 209
two-layer model in which the true resistivity of the alluvium and subjacent anthropogenic 210
deposits (Figure 1) were known thanks to an electrical resistivity tomography profile 211
established on the excavated area before the cover was put on. The values of true resistivity 212
obtained with the formula of Bhattacharya and Patra (1968) were corrected for the effect of 213
temperature on the assumption that the measurements had been influenced by atmospheric 214
temperature alone (the average value of the atmospheric temperature data from the 215
meteorological station near the site between the 4 and 21 September 2009). The gravelly clay 216
material was considered to be in equilibrium with the atmospheric temperature, the excavation 217
and storage having been done two months previously. With these data, iso-resistivity maps 218
were established for each of the three layers of material at the moment that they were put in 219
place. These maps were the result of interpolation by kriging with a search ellipse radius of 220
4 m using the SURFER software. One of the maps is presented in Figure 16; it is based on 221

10
kriging interpolation with an exponential and quadratic model fitted to the omni-directional 222
experimental variogram. 223
224
225
3. Results 226
227
3.1 Detection of the 10 cm-wide crack 228
The models of electrical resistivity for the ERT2 profile (Figure 5) presented values of 229
electrical resistivity that were not corrected for the effect of temperature during the six series 230
of measurements from October 2009 to February 2011. The range of electrical resistivity on 231
the site and its bedrock varied, overall, between 10 and 113 Ω.m. On each profile except that 232
of September 2010 (Figure 5. d.), there were two large areas: one was superficial and 233
conductive (electrical resistivity lower than 50 Ω.m) and the other was deep and resistive 234
(electrical resistivity between 50 and 113 Ω.m). The boundary between these two areas along 235
ERT2 was located at a distance of between 2 and 17.5 m and a depth of 1.15 m; it continued 236
beyond 17.5 m, gradually rising to the surface as the cover became shallower. So, this change 237
in electrical resistivity took place at a depth corresponding to the total thickness of the 238
experimental cover. The conductive area was thus that of the gravelly clay material and the 239
resistive area that of the bedrock (Figure 1). Also, we observed, on all the models of electrical 240
resistivity, a decrease in resistivity in the bedrock between 3 and 6 m. The decrease in the 241
resistivity for the measurements with the dipole-dipole array was not found in the results 242
achieved with the other arrays. We therefore suppose that it was caused by an artefact 243
introduced when inverting the measurements taken by the dipole-dipole array; the artefact 244
was verified by forward modelling. There was also a significant increase in electrical 245
resistivity at a distance of about 4 m along the profile, except for that of September 2010 246

11
(Figure 5.d), over a thin slice through the entire thickness of the cover. This increase in 247
resistivity appeared at the 10 cm-wide crack that was filled with sand (Figure 3). This 248
resistivity of more than 100 Ω.m can thus be interpreted as being the signature of the crack, 249
below 0.15 m of top soil. For deeper cracks, forward modeling computed with the 250
RES2DMOD© (Loke, 2002) software have shown that electrical resistivity tomography 251
would be able to detect these cracks (not shown here). 252
The 10 cm-wide crack was, however, not easily detected on the resistivity model for 253
September 2010 (Figure 5. d) which presented, for the central part of the cover material, 254
higher electrical resistivity (between 30 and 113 Ω.m). The contrast of resistivity between the 255
crack and the rest of the cover was no longer perceptible with the range of electrical resistivity 256
used; nevertheless, the true electrical resistivity at the place of the crack raised about 257
600 Ω.m. 258
The presence, on the surface, of electrical resistivity greater than 80 Ω.m (Figure 5. d) 259
should be seen in the light of the high atmospheric temperatures recorded during the summer 260
(Figure 4.b.) which helped to dry the ground. Indeed, many cracks caused by drying, some of 261
which were at least 36 cm deep, were observed during dry periods. These cracks no longer 262
appeared during the later surveys undertaken during the wet period. 263
Apart from the September 2010 survey, the analysis of electrical resistivity not 264
corrected for temperature for all the surveys led to the detection of the 10 cm-wide crack. 265
Moreover, spatial variations in electrical resistivity within the gravelly clay cover were 266
detected and seemed to persist over the course of the surveys. So, in order to characterise as 267
well as possible this variability, it was necessary to correct the electrical resistivity for the 268
effect of temperature in order to make the models comparable. 269
270
3.2 Electrical resistivity of the gravelly clay material : spatial organisation 271

12
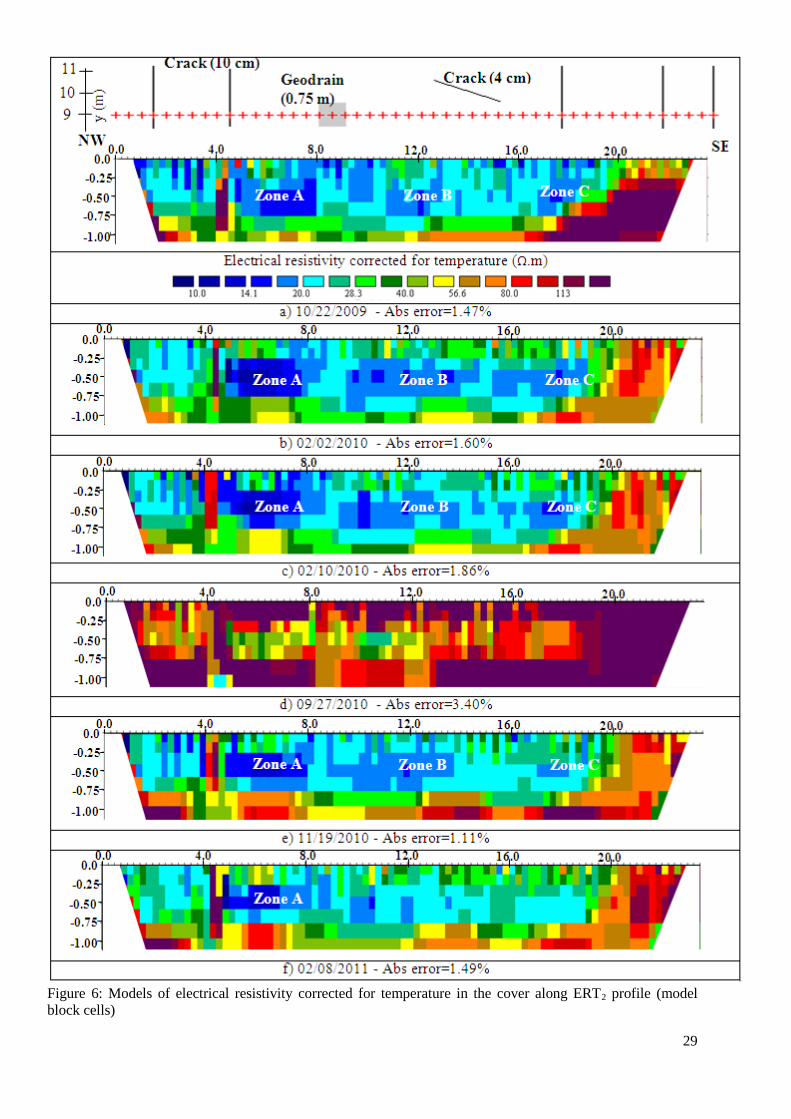
Once the values were corrected, they were found to be between 10 and 40 Ω.m (Figure 6) 272
except for those of September 2010; a detailed examination revealed a spatial organisation 273
that persisted from one ERT to the next. 274
As from the measurements taken in October 2009 (Figure 6. a.), one can see a spatial 275
organisation of electrical resistivity along the ERT2 profile. Three particularly conductive 276
zones (A, B and C, with resistivity of between 10 and 20 Ω.m), were thus brought to light. 277
The distribution of these low values of electrical resistivity was similar for the data acquired 278
in wet periods (2 and 10 February and 19 November 2010, Figures 6 b., c. and e.). These 279
zones nevertheless seemed smaller on 8 February 2011 (Figure 6 f.); this reduction in 280
extension was linked to an increase in electrical resistivity in the superficial part of the cover 281
material (between 0 and 0.25 m in depth). An analysis of precipitations over the seven days 282
before 8 February 2011 shows that the effective rainfall accumulation was -2.8 mm, while in 283
wet periods it was 6.5 mm on 2 February, 29.4 mm on 10 February and 27.1 mm on 19 284
November 2010. The extension of zones A, B and C decreased from 2 February 2010 to 8 285
February 2011; this was particularly obvious for zone A. 286
It is interesting to note the variations in electrical resistivity in the superficial part of 287
the cover material in the measurements taken at a close interval, on 2 and 10 February 2010 288
(Figures 6 b. and c.). The resistivity at between 5 and 20 m horizontal distance and to a depth 289
of 0.25 m were lower for the measurements of 10 February 2010. The average of these values 290
was 30.8 Ω.m on 2 February (with a minimum of 17.7 Ω.m) and 26 Ω m on 10 February (with 291
a minimum of 13.6 Ω.m). In fact, the precipitations’ accumulation over the seven preceding 292
days was different for each of these two surveys; it was 29.4 mm for the 10 February and only 293
6.5 mm for the 2 February 2010. Consequently, the differences of electrical resistivity in the 294
superficial part of the gravelly clay material could be, a priori, due to variations of humidity in 295

13
the cover, themselves linked to the precipitations preceding the measurements in a period that 296
was generally wet. 297
298
We noted a certain consistency in the spatial distribution of electrical resistivity in the 299
gravelly clay material, except in the month of September 2010. The change in electrical 300
resistivity over time in the various zones depends on the frequency and intensity of 301
precipitations preceding the measurements and, therefore, on the conditions of humidity at the 302
time of the surveys. 303
304
3.3 Statistical analysis of electrical resistivity values 305
In order to quantitatively establish areas of similar electrical resistivity in the cover, 306
we used multivariate analysis (ascendant hierarchical classification, ACH). The clustering of 307
164 standardized variables of electrical resistivity at between 5 and 19 m and depths of 308
between 0.26 and 0.76 m for the six series of measurements was done using the Ward linkage 309
method together with a Euclidian distance measure. The electrical resistivity data for the 310
blocks situated on the upper and lower levels of the gravelly clay material, as well as those of 311
the four blocks situated at between 18 and 19 m and at a depth of 0.76 m were not taken into 312
account because of the influence of the top soil on the surface and by the deeper, bedrock. 313
ACH (Figure 7) permits the identification of four clusters of electrical resistivity values. 314
315
The dendrogram shows the distance level for each of the four clusters. First of all, one 316
notes the greater proximity of clusters 2 and 3 which constitute 52% of the data at a distance 317
of 25.22 (Figure 7). For clusters 1 and 4, the distance is greater (38.70), showing their greater 318
variability. It is then possible to analyse by cluster and by date of measurement thanks to the 319

14
calculation of the statistical parameters, in particular the median and the standard deviation of 320
the data (Table 1). 321
322
In order of increasing median values of electrical resistivity and for all dates of 323
measurement, the clusters have the following order: 1-4-2-3. The values for clusters 1 and 4 324
are the lowest: they vary, respectively, from 14.0 to 17.3 Ω.m and from 18.0 to 21.3 Ω.m in 325
the wet period (Table 1). For clusters 2 and 3, the values were higher: they were, respectively, 326
between 19.7 and 22.5 Ω.m and between 22.9 and 25.3 Ω.m in the wet period. The values 327
confirm that clusters 2 and 3 are closer to each other than are clusters 1 and 4. Also, the ratio 328
of the standard deviation to the median (Table 1) shows that the variations in electrical 329
resistivity are of greater amplitude for clusters 1 and 3 than for clusters 4 and 2, in particular 330
for the survey of September 2010. Cluster 1 contains the lowest, and cluster 3 the highest, 331
values of electrical resistivity. 332
333
It is also interesting that the changes in the electrical resistivity of the four clusters 334
develop in a similar way over time (Figure 8). Indeed, the resistivity reduces all the more 335
when measurements are carried out during wet periods, with the exception of 22 October 336
2009 (Figure 4 a.). For that date, the resistivity values cannot be considered as representative 337
of the conditions of humidity in the material as the site had been established only one month 338
before. 339
340
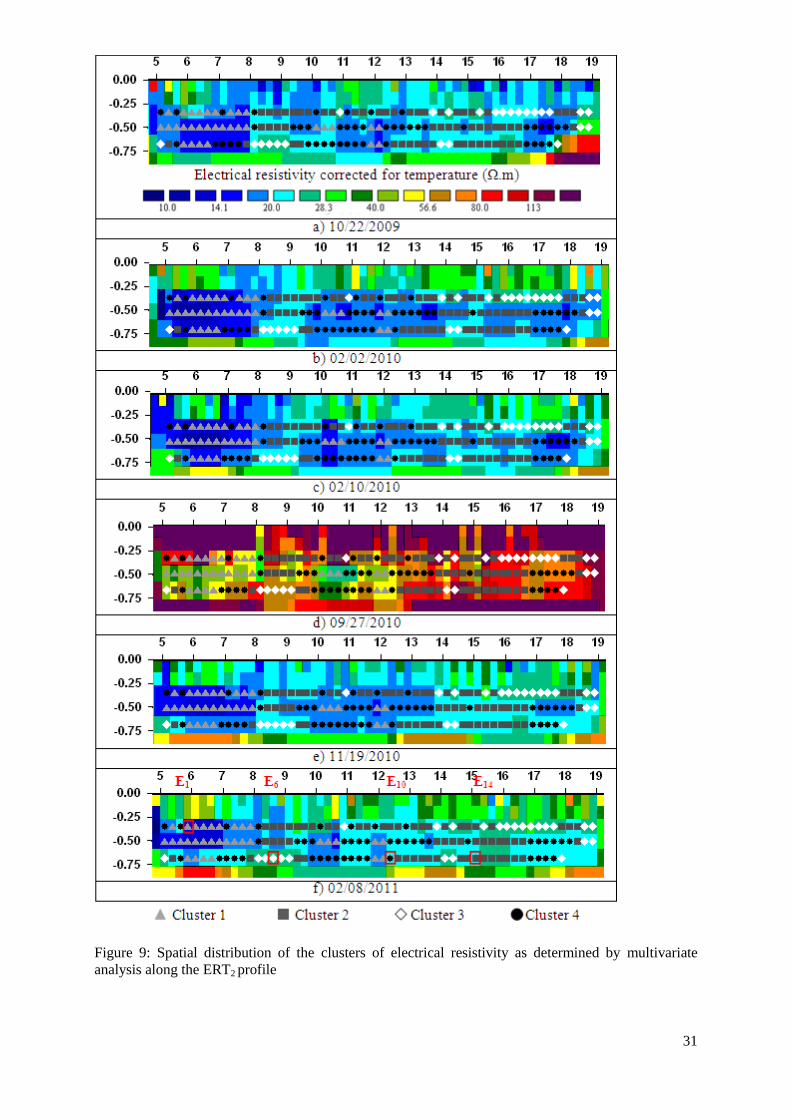
After the statistical analysis of the electrical resistivity of each of the four clusters, the 341
study of their spatial distribution allows us to note, for each block, the cluster to which it 342
belongs (for each of the six surveys) (Figure 9). The zones delimited by each cluster 343
correspond overall to the previously identified zones A, B and C. 344
15
345
3.4 Heterogeneity characterisation of the gravelly-clay material 346
In order to determine the geotechnical characteristics of each of the four clusters, 347
samples of material were taken along ERTc. Only the loamy clay component of the material 348
could be taken with the hand auger. First, the clusters determined by ACH carried out on the 349
data from ERT2 were re-attributed to each of the blocks forming the resistivity model of 350
ERTc. It was thus possible to compare the statistical parameters of ERTc profile to those of 351
ERT2 for the five series of measurements (Table 2); the values for September 2010 (a dry 352
period) are not considered. 353
354
The median values of electrical resistivity of the four clusters for ERTc had the same 355
hierarchy as for ERT2, cluster 1 having the lowest value (17.4 Ω.m) and cluster 3 the highest 356
(22.6 Ω.m). We can also note that the deviation between the median values of electrical 357
resistivity for clusters 2 and 3 was 1 Ω.m for ERTc and 2.8 Ω.m for ERT2. 358
In addition, the electrical resistivity of ERTc presents a ratio of standard deviation to 359
the median which is lower than that of ERT2. Despite the differences observed in the 360
statistical parameters of the two profiles, the electrical resistivity in ERTc (Figure 10 b.) had a 361
similar spatial layout to that of ERT2 (Figure 10. a.) on 8 February 2011. For example, they 362
both present a low localised electrical resistivity in the 5 to 8 m zone. 363
The statistical and spatial analysis of electrical resistivity leads us to suppose, as a first 364
approximation, that the electrical resistivity was, over time and as a function of the 365
precipitation, identical for the two profiles. 366
367
The four samples of loamy clay material were taken from zones with values of 368
electrical resistivity (Figure 10 b.) corresponding to the clusters defined by multivariate 369

16
analysis. Samples E1 and E10 correspond, respectively, to clusters 1 and 4, and E6 and E14 to 370
clusters 3 and 2 (Figure 11). 371
372
In order to characterise the loamy clay material from each of the four samples, 373
laboratory analysis was undertaken, to measure the gravimetric water content (Table 3) and to 374
establish the particle size distribution curve (Figure 12) of each of the samples. 375
The values of gravimetric water content (Table 3) were found to be between 21.5 and 376
28.0%. Samples E1 and E10, having a water content of 28.0 and 26.5% respectively, 377
corresponded to clusters 1 and 4. These two clusters presented the lowest electrical resistivity 378
values (the median value of electrical resistivity for these two clusters was respectively 17.4 379
and 19.7 Ω.m). For the other two samples (E14 and E6), the gravimetric water content was 380
respectively 21.5 and 23.5%. The samples came from zones attributed to clusters 2 and 3 381
which presented median values of electrical resistivity of, respectively, 21.6 and 22.6 Ω.m. 382
One sees here the inversion of electrical resistivity in relation to the values of gravimetric 383
water content; this can be explained by the proximity of clusters 2 and 3 seen in the 384
dendrogram (Figure 7). 385
386
The samples were then sieved in order to establish the particle size distribution curves 387
(Figure 12). The curves show differences in the gravimetric percentage for fractions with a 388
grain size of between 80 and 400 µm: the percentage of fines is seen to be greater than 80% 389
for samples E1 and E10 and lower than 80% for samples E6 and E14. 390
We can also note that the four gravelly clay samples characterised by different fines content 391
are placed at the location of electrical resistivity variations on the ERTc model (Figure 13). It 392
can also be noted that the proportion of fines in the loamy clay component of the material is in 393
direct relation to the gravimetric water content (Figure 14). 394

17
395
4. Discussion 396
397
The geotechnical parameters (gravimetric water and fines content) recorded for the 398
samples can be studied in relation to the median values of the electrical resistivity of the four 399
clusters in ERTc (Figure 15). The graphs show that the median values of resistivity rise to an 400
optimum peak and then decrease in direct relation to the gravimetric water content (Figure 15 401
a.) and the percentage of fines (Figure 15 b.). However, taking into account the proximity of 402
clusters 2 and 3, which are already visible in the dendrogram (Figure 7) and of the low 403
deviation of electrical resistivity between these two clusters in ERTc (Table 2), one can 404
consider that the electrical resistivity tends to decrease with the content of gravimetric water 405
and of fines. We will deal with the effect of compaction on electrical resistivity first, and then 406
with that of the meteorological conditions. 407
408
The analysis of the samples has thus shown that the electrical resistivity of the 409
different clusters is related to the heterogeneity of the cover material. This variability seems to 410
be linked to both the gravimetric water content and the percentage of fines; and knowing that 411
the electrical resistivity is also linked to compaction (Beck et al., 2008), we sought to 412
demonstrate the effect of compaction while taking into account the intrinsic heterogeneity of 413
the material. To do this, we used the map of electrical resistivity on the surface of layer 2 414
(Figure 16). This map shows a central area of low resistivity (lower than 30 Ω.m) and a 415
peripheral area of more resistive material (most of the measurements of resistivity being 416
between 30 and 50 Ω.m). The differences in electrical resistivity can be put in relation to the 417
effect of the mechanical digger: indeed, while the digger did pass regularly over the central 418
area, this was not the case for the periphery of the site, where access was more difficult. So, 419

18
the lower values of resistivity could be linked to greater compaction. The differences in 420
electrical resistivity revealed by the ERT imaging and in Figure 16 are similar: the resistivity 421
of clusters 1 and 4 corresponds to a conductive zone of the map in Figure 16, while the 422
electrical resistivity of cluster 2 corresponds to the resistive zone. Clusters 1 and 4, well 423
individualised by the imaging, are thus well characterised by a finer particle size and a more 424
obvious compaction. The coherence of the spatial distribution of the electrical resistivity, in 425
the tomography imaging as well in the resistivity map (Figure 16), is due to both the intrinsic 426
heterogeneity of the material and the effect of compaction. 427
428
Regarding the effect of precipitations on electrical resistivity, we present the 429
monitoring of the volumetric water content over time at a depth of 0.70 m, 2 m north of ERT2 430
profile (Figure 2). The monitoring of electrical resistivity along ERT2 profile allowed us to 431
relate decreasing median values of electrical resistivity of each of the four clusters to 432
increasing volumetric water content (Figure 17). Even though the values of volumetric water 433
content cannot be directly compared to the values of gravimetric water content of the samples, 434
one can nevertheless see a tendency for electrical resistivity to decrease with increasing 435
volumetric water content. The transition between high resistivity (dry period) and low 436
resistivity (wet period) can be represented either by two different straight lines or by an 437
exponential, as suggested by Russel et al. (2010), with measurements of gravimetric water 438
content. To clarify this decrease, further measurements are currently being taken. Here again, 439
it can be noted that the greater proximity of clusters 2 and 3, observed particularly on 27 440
September 2010, would seem to indicate that these two clusters could well be classified as a 441
single cluster. 442
443
5. Conclusions 444

19
445
Electrical resistivity tomography was carried out on an experimental site in order to 446
determine the capacity of this method to locate fabricated defects and to characterise the 447
heterogeneity of the cover material. The surveys, carried out at different periods in the year, 448
showed that electrical resistivity tomography provided satisfactory results over almost the 449
whole year. Detection of anomalies was easier when the inspection took place in a wet period 450
and was more difficult, or even impossible, in a dry period. In favourable meteorological 451
conditions, the 10 cm-wide crack which simulated an ageing defect was clearly identified 452
with an inter-electrode spacing of 0.50 m. The heterogeneity of the cover material was 453
demonstrated by each of the surveys in the wet period. Indeed, variations in electrical 454
resistivity, once corrected for temperature, remain in the gravelly clay material, underlining 455
the existence of different modes of behaviour. The multivariate analysis (ACH) carried out on 456
the electrical resistivity of the cover material for the different dates of measurement permitted 457
the establishment, first, of four resistivity-homogenous clusters, perceptibly distinct by 2 Ω.m 458
in the wet period; and secondly, putting the ERT model blocks into clusters highlighted the 459
spatial organisation of the cover’s heterogeneity. Finally, a combined analysis involving 460
geotechnical measurements (water and fines content) and modalities of compaction showed 461
that they were linked to the statistical characteristics of the clusters. In addition, the 462
monitoring, over time, of electrical resistivity as a function of the volumetric water content 463
showed that resistivity increased as soil humidity decreased; this increase was more rapid 464
when the measurements were made in dry periods. 465
The heterogeneity of the material forming landfill cover is thus an important parameter 466
to be taken into account when establishing the cover. However, while the permeability of the 467
cover material depends mainly on its particle size, it also depends on its state of compaction. 468
Particular attention must be paid to establishing the cover on landfill sites so as to ensure good 469

20
tightness over time. This study has shown that the use of electrical resistivity tomography can 470
allow the characterization of the heterogeneity of the cover. The monitoring, over time, of 471
electrical resistivity has also shown that the state of the soil in dry periods, with the 472
appearance of cracks in the gravelly clay material, jeopardizes the tightness of the cover in 473
these periods. Nevertheless, the closing up of cracks in wet periods was observed, both 474
visually and by tomography. These observations lead us to recommend the use of electrical 475
resistivity tomography in wet periods, which favour the detection of defects. Also, to avoid 476
cracking in the cover material, it would be useful to sprinkle the cover in dry periods so as to 477
limit the appearance of zones liable to water infiltration. 478
479
Acknowledgements 480
481
We wish to thank Stéphane Renié for its help in setting up the experimental site and 482
also Fabien Naessens for the electrical resistivity tomography measurements. We also thank 483
l’Agence de l’Environnement et de la Maîtrise de l’Energie (ADEME) and most particularly 484
Philippe Bégassat for his collaboration in this study. 485
486
References 487
488
Abu-Hassanein, Z.S., Benson, C.H., Blotz, L.R., 1996. Electrical resistivity of compacted 489
clays. Journal of Geotechnical Engineering, 122(5), 397-406. 490
ADEME, 2001. Guide pour le dimensionnement et la mise en œuvre des couvertures de sites 491
de stockage de déchets ménagers et assimilés. 167 pp. 492
Ait Saadi, L., 2003. Méthodologie de contrôle de l’homogénéité et de la perméabilité des 493
barrières argileuses. Thèse de 3ème
cycle. Université Paris VI. 494

21
Bhattacharya, P.K., Patra, H.P., 1968. Direct current geoelectric sounding. Elsevier, 495
Amsterdam, New York, London. 496
Beck, Y-L., Palma-Lopes, S., Ferber, V., Ech-Charhal, Y., Fauchard, C., Guilbert, V., 497
Froumentin, M., Côte, P., 2008. Détermination de l’état hydrique et de la masse 498
volumique d’un sol limoneux par combinaison de méthodes géophysiques : du 499
laboratoire au site contrôlé. Journées Scientifiques de Géophysique Appliquée. Aix en 500
Provence. 501
Besson, A., Cousin, I., Samouëlian, A., Boizard, H., Richard, G., 2004. Structural 502
heterogeneity of the soil tilled layer as characterized by 2D electrical resistivity 503
surveying. Soil and Tillage Research, 239-249. 504
Besson, A., Cousin, I., Dorigny, A., Dabas, M., King, D., 2008. The temperature correction 505
for the electrical resistivity measurements in undisturbed soil samples: Analysis of the 506
existing conversion models and proposal of a new model. Soil Science, 173, 707–720. 507
Blewett, J., Mc Carter, W.J., Chrisp, T.M., Starrs, G., 2003. An experimental study on ionic 508
migration through saturated kaolin. Engineering Geology, 70, 281-291. 509
Campbell, R. B., Bower, C. A., Richards, L. A., 1948. Change of electrical conductivity with 510
temperature and the relation of osmotic pressure to electrical conductivity and ion 511
concentration for soil extracts. Soil Science Society of America Proceedings, 13, 66–512
69. 513
Carpenter, P.J., Calkin, S.F., Kaufmann, R.S., 1991. Assessing a fractured landfill cover using 514
electrical resisitivty and seismic refraction techniques. Geophysics, 56(13), 1896-515
1904. 516
Cosenza, P., Seladji, S., Besson, A., Cousin, I., Goutal, N., Boizard, H., Tabbagh, A., Ranger, 517
J., Richard, G., 2010. Caractérisation géoélectrique in situ du compactage des sols 518

22
agricoles et forestiers. Journées Nationales de Géotechnique et de Géologie de 519
l’Ingénieur. Grenoble. 520
Corwin, D. L., Lesch, S. M., 2005. Apparent soil electrical conductivity measurements in 521
agriculture. Computers and Electronics in Agriculture, 46, 11–43. 522
Genelle, F., Sirieix, C., Naudet, V., Dubearnes, B., Riss, J., Naessens, F., Renié, S, Trillaud, 523
S., Dabas, M, Bégassat, P., 2010. Test de méthodes géophysiques sur couvertures de 524
CSD : site expérimental. Journées Nationales de Géotechnique et de Géologie de 525
l’Ingénieur. Grenoble. 526
Genelle, F., Sirieix, C., Naudet, V., Riss, J., Naessens, F., Renié, S., Dubearnes, B., Bégassat, 527
P., Trillaud, S., Dabas, M., 2011. Geophysical methods applied to characterize landfill 528
covers with geocomposite. In: GEOFRONTIERS, 13-16 March 2011, Dallas. ASCE Conf. 529
Proc., doi:10.1061/41165(397)199. 530
Guyonnet, D., Gourry, J.-C., Bertrand, L., Amraoui, N., 2003. Heterogeneity detection in an 531
experimental clay liner. Canadian Geotechnical Journal, 40, 149-160, doi: 532
10.1139/T02-092. 533
Hayley, K., Bentley, L.R., Gharibi, M., Nightingale, M., 2007. Low temperature dependence 534
of electrical resistivity: Implications for near surface geophysical monitoring. 535
Geophysical Research Letters 34, L18402, doi:10,1029/2007GL031124. 536
Journal Officiel de la République Française (2 octobre 1997). Arrêté du 9 septembre 1997 537
relatif aux décharges existantes et aux nouvelles installations de stockage de déchets 538
ménagers et assimilés. 539
Loke, M.H. 2002. RES2DMOD version 3.01. Rapid 2D resistivity forward modelling using 540
the finite difference and finite-element methods. 541
Loke, M.H., Acworth, I., Dahlin, T., 2003. A comparison of smooth and blocky inversion 542
methods in 2D electrical imaging surveys. Exploration Geophysics, vol. 34, 182-187. 543

23
Lück, E., Rühlmann, J., Spangenberg, U., 2005. Physical background of soil EC mapping: 544
Laboratory, theoretical and field studies. In J. V. Stafford (Ed.), Precision 545
agriculture’05 (pp. 417–424). The Netherlands: Wageningen Academic Publishers. 546
Ma, R., McBratney, A., Whelan, B., Minasny, B., Short, M., 2010. Comparing temperature 547
correction models for soil electrical conductivity measurement. Precision 548
Agriculture, 12, 55-66 doi :10,1007/s11119-009-9156-7. 549
McCarter, W.J., 1984. The electrical resistivity characteristics of compacted clays. 550
Geotechnique, 34(2), 263-267. 551
NF P 11-300, septembre 1992. Classification des matériaux utilisables dans la construction 552
des remblais et des couches de forme d'infrastructures routières. 553
Peter-Borie, M., Sirieix, C., Naudet, V., Riss, J., 2011. Electrical resistivity monitoring with 554
buried electrodes and cables: noise estimation with repeatability test. Near Surface 555
Geophysics, 9, 12 pp. 556
Rein, A., Hoffmann, R., Dietrich, P., 2004. Influence of natural time-dependent variations of 557
electrical conductivity on DC resistivity measurements. Journal of Hydrology, 285, 558
215– 232. 559
Russell, E.J.F, Barker, R.D., 2010. Electrical properties of clay in relation to moisture loss. 560
Near Surface Geophysics, 8, 173-180, doi:10,3997/1873-0604,2010001. 561
Samouëlian, A., Cousin, I., Tabbagh, A., Bruand, A., Richard, G., 2005. Electrical resistivity 562
survey in soil science : a review. Soil & Tillage research, 83, 173-193. 563
Schwartz, B.F., Schreiber, M.E., Yan, T., 2008. Quantifying field-scale soil moisture using 564
electrical resistivity imaging. Journal of Hydrology, 362, 234-246. 565
Seladji, S., Cosenza, P., Richard, G. Tabbagh, A., 2007. Mesure et modélisation des variations 566
de résistivité électrique d’un sol limoneux liées au tassement. 6ème
colloque 567
GEOFCAN, Bondy. 568

24
Sheets, K.R., Hendrickx, J.M.H., 1995. Non-invasive soil water content measurement using 569
electromagnetic induction. Water Resource Research, 31, 2401–2409. 570
Silvestre, P., Norotte, V., Oberti, O., 2003. Les géosynthétiques en couverture. 5ème
rencontres 571
géosynthétiques francophones.572

25
FIGURES
Figure 1: Section of the experimental site
Figure 2: Location of defects intentionally made and probes in the experimental site

26
Figure 3: Location of electrical resistivity tomography profiles on the experimental site

27
Figure 4: Data for effective rain and atmospheric temperature near the experimental site and humidity
data in the gravelly clay material (from October 2009 to February 2011)

28
Figure 5: Models of electrical resistivity (not corrected for temperature) of ERT2 profile after five iterations
(model block cells)
29
Figure 6: Models of electrical resistivity corrected for temperature in the cover along ERT2 profile (model
block cells)

30
Figure 7: Dendrogram of the standardized variables of electrical resistivity corrected for temperature
in the six surveys along ERT2 with the percentage of blocks in each cluster
Figure 8: Median of electrical resistivity corrected for temperature, by cluster and date of survey
31
Figure 9: Spatial distribution of the clusters of electrical resistivity as determined by multivariate
analysis along the ERT2 profile

32
Figure 10: Models of electrical resistivity corrected for temperature in the cover on
8 February 2011 (model block cells)
Figure 11: Spatial distribution of clusters of electrical resistivity established by multivariate analysis
along profile ERTC
Figure 12 : Fines content of samples along ERTc profile

33
Figure 13: Particle-size distribution curve for the samples taken
Figure 14: Percentage of fines as a function of the gravimetric water content
for the four samples

34
Figure 15: Median of electrical resistivity for the four clusters of ERTc
in relation to the gravimetric water content (a) and the fines content (b) of the four samples of loamy-
clay material

35
Figure 16: Map of resistivity corrected for temperature on the surface of layer 2 of the gravelly clay
material (depth of 0.45 m)
Figure 17: Median values of electrical resistivity of the four clusters of ERT2 as a function of the
volumetric water content at a depth of 0.70 m during the five surveys