monitoring hazardous fuels treatments - united … hazardous fuels treatments: southeast regional...
TRANSCRIPT

- 1 -
Monitoring Hazardous Fuels Treatments
Southeast Regional Field Guide US Fish and Wildlife Service
August 15, 2013

- 2 -
ACKNOWLEDGEMENTS
The authors would like to thank the following individuals for providing helpful comments and suggestions during the review stages of this document: Dave Brownlie, Vince Carver, Tim Fotinos, Chuck Hunter, Duncan Lutes, Bobby Schat, Carl Schmidt, Kelley Van Druten, Russ Walsh, and Clay Ware. Suggestions were also offered and well received by many USFWS Region 4 Fire Staff during the 2012 Region 4 Fire Management Workshop & Prescribed Fire Burn Boss Refresher. A special thanks to the staff at the Carolina Sandhills, Sam D. Hamilton Noxubee, and Okefenokee National Wildlife Refuges, for helping with field trials of the methods proposed in this field guide.

- 3 -
TABLE OF CONTENTS
I. INTRODUCTION ................................................................................................... 5
A. What is Monitoring? ...................................................................................... 5
B. Standards ................................................................................................... 5
C. Regional Guidance and Recommendations ....................................................... 6
D. Additional Resources .................................................................................... 9
II. SAMPLING DESIGN (SPACE AND TIME) ............................................................ 10
A. Link to Monitoring Objectives ....................................................................... 10
B. Time Frame and Sample Space .................................................................... 10
C. FFI and Macroplot Name ............................................................................. 11
D. Plot Establishment ...................................................................................... 11
III. METHODS - MAKING IT HAPPEN ..................................................................... 11
A. Suggested Protocols and Methods for Levels 1 and 2 Monitoring Variables ......... 11
B. Core Data (Level 1, Required) ...................................................................... 12
C. Fire Behavior & Smoke, Fuel Moisture, and Weather (Level 2).......................... 12
D. Fuel Loading (Level 2, Recommended) .......................................................... 16
E. Burn Severity (Level 2, Recommended)......................................................... 24
F. Photo Documentation (Level 1, Required) ...................................................... 28
IV. DATA COLLECTION, STORAGE, AND ARCHIVING .............................................. 29
A. Field Data Forms ........................................................................................ 29
B. Reviewing the Data - Early Quality Control .................................................... 29
C. Copies, Copies, and More Copies! ................................................................. 30
D. Data Entry and Storage Options ................................................................... 30
E. FFI Software, Installation, and Use ............................................................... 30

- 4 -
TABLE OF CONTENTS, continued
V. RESULTS REPORTING ........................................................................................ 37
A. Creating Reports ........................................................................................ 37
B. Annual Reporting........................................................................................ 37
C. Measuring Success ..................................................................................... 38
VI. REFERENCES .................................................................................................... 39
VII. APPENDICES .................................................................................................. 32
A. Field Datasheets......................................................................................... 40
B. Scale Board Construction ............................................................................ 53
C. Photopoint Monitoring Report ....................................................................... 55

- 5 -
I. INTRODUCTION
A. What is Monitoring? It is important to begin with a clear definition of what should be considered “monitoring.” For the purposes of this field guide, fuels treatment monitoring is defined as:
The collection and analysis of repeated observations or measurements to evaluate change in condition and progress toward meeting a fuels treatment management objective.
There are many different definitions of monitoring. The above definition will be the working definition of monitoring for this field guide. It is also important to note that there is a difference between monitoring and research. Research tests specific hypotheses to identify the correlation of effect with a potential cause and has a specific experimental design to test hypotheses of cause and effect.
In general, monitoring can usually be performed by refuge staff as routine operations to show general trends in ecosystem responses to fuel treatment. Specific research questions should be answered by experts who have the time and resources to adequately address research questions with a more statistically rigorous experimental design and methodology.
B. Standards This guide (Field Guide) has been designed to reflect new standards in fuels treatment monitoring that simultaneously a) support science-based decision making on US Fish and Wildlife Service (Service) lands, and b) consider financial and staffing limitations towards completing certain objectives. Information regarding these new standards can be found in the Monitoring Hazardous Fuels Treatments: Southeast Regional Plan (USFWS 2013). New standards identified in this plan include:
• A set of Level 1, Core Monitoring Elements that are required for all fuels treatments implemented on refuge lands.
• A set of Level 2, Immediate Response Monitoring Variables that should be collected on all fuels treatments on refuge lands with a minimum monitoring requirement of all approved National Fire Plan hazardous fuels treatments.
• Service-wide accepted standardized databases for data entry, storage, reporting and analysis are identified (Fire Management Information System (FMIS) and FEAT/FIREMON Integrated Database (FFI)).
• Inclusion of all National Fire Plan hazardous fuels treatment projects (chemical and mechanical), not just those treated with fire.
• Cost of data collection and input is to be included in estimated treatment costs.
• This monitoring plan does not replace already existing and established monitoring programs in other disciplines, but instead, coordinates with and supplements them.
• The approval of the Monitoring Hazardous Fuels Treatments: Southeast Regional Plan (USFWS 2013) serves as an Interim Monitoring Plan for all refuges conducting hazardous fuels treatment monitoring in the Southeast Region. It supplements all

- 6 -
previously approved Refuge and Complex Fire Effects Monitoring Plans for Southeast Refuges.
• In the near future, fuels treatment monitoring activities will be described in a refuge-wide Inventory and Monitoring Plan (IMP). No additional refuge Fire Effects Monitoring Plans will be needed once a refuge’s IMP is in place.
• Data standards are established and approved by the Regional Fire Ecologist and Inventory and Monitoring (I&M) Staff as appropriate.
C. Regional Guidance and Recommendations Guidance for developing a fire effects monitoring program, as well as a description of the monitoring protocols recommended by the Service's Southeast Regional Office (R4), are provided in this document. The monitoring guidance and recommendations follow the Service's Monitoring Hazardous Fuels Treatments: Southeast Regional Plan (USFWS 2013).
The Southeast Regional Office (R4) requires:
1. Collection of Level 1, Core Monitoring Elements (Table 1) for all fuels treatments implemented on refuge lands.
2. Collection of required Level 2, Immediate Response Monitoring Variables (Table 2) for all National Fire Plan hazardous fuels treatments implemented on refuge lands.
The Southeast Regional Office (R4) strongly recommends:
1. Collection of recommended Level 2, Immediate Response Monitoring Variables (Table 2) for all fuels treatments implemented on refuge lands.

- 7 -
Table 1. Required Level 1 Core Data for every Hazardous Fuels Reduction Treatment.
Core Elements
USFWS Unit Name
USFWS Unit Location
Management Activity Name
Management Activity Type
Management Activity Location
Management Activity #
Management Activity Size, acres
Objective(s)
Fire Regime
Dominant Fuel Model
Initiation Date and Time
Completion Date and Time
Qualitative Narrative
Comments (pictures, additional info, etc.)
Contact Information

- 8 -
Table 2. Level 2 Immediate Response Monitoring Variables
R4 Category (FFI) FFI Protocol
Prescribed Fire Data Required / Recommended
Fuel Moisture Fire Behavior Duff/Litter/Live Fuel Moisture (%) Recommended
Fuel Moisture Fire Behavior Fine Fuel Shading Recommended
Weather Fire Behavior Dry Bulb/Wet Bulb Temperature Required
Weather Fire Behavior Relative Humidity Required
Weather Fire Behavior Wind Speed/Direction Required
Weather Fire Behavior Gust Speed/Direction Required
Weather Fire Behavior Cloud Cover Required
Fire Behavior & Smoke Fire Behavior Fire Activity Required
Fire Behavior & Smoke Fire Behavior Rate of Spread Required
Fire Behavior & Smoke Fire Behavior Flame Length or Height Required
Fire Behavior & Smoke Fire Behavior Spotting Distance Required
Fire Behavior & Smoke Fire Behavior Smoke Impacts, Dispersal, and Intrusions
Required
Fire Behavior & Smoke Fire Behavior Plume Behavior Required
Dead/Downed Fine and Coarse Woody Debris
Surface Fuels 1, 10, 100, 1000-hour Fuels Count Recommended
Duff/Litter Surface Fuels Duff and Litter Depth Recommended Live and Dead Standing Vegetation
Surface Fuels - Vegetation
Live/Dead Woody and Non-woody (cover, height)
Recommended
Alternative Biomass Sampling In Marshes and Grasslands
Biomass - Plants
Live Fuel Moisture (%) Recommended
Alternate Biomass Sampling Using Photo Series
Biomass - Fuels
Digital Images Recommended
Composite Burn Index CBI CBI Score Recommended Photopoints -- Digital Images Required

- 9 -
D. Additional Resources:
FEAT / FIREMON Integrated (FFI) Website: www.frames.gov/ffi Fire Management Information System (FMIS) Website: https://intranet.fws.gov/fmis/index.cfm National Park Service Fire Monitoring Handbook (NPS FMH) Website: http://www.nps.gov/fire/wildland-fire/resources/documents/fire-effects- monitoring-handbook.pdf US Forest Service Fire Effects Monitoring and Inventory System (FIREMON) Website: www.frames.gov/firemon US Forest Service Fire Effects Information System (FEIS) Website: http://www.fs.fed.us/database/feis/ National Wildfire Coordinating Group: Fire Effects Guide Website: http://www.nwcg.gov/pms/RxFire/FEG.pdf Joint Fire Science Program Website: http://www.firescience.gov/ Monitoring Trends in Burn Severity (MTBS) Website: http://www.mtbs.gov Natural Fuels Photo Series Website: http://depts.washington.edu/nwfire/dps/
- 10 -
II. SAMPLING DESIGN (SPACE AND TIME)
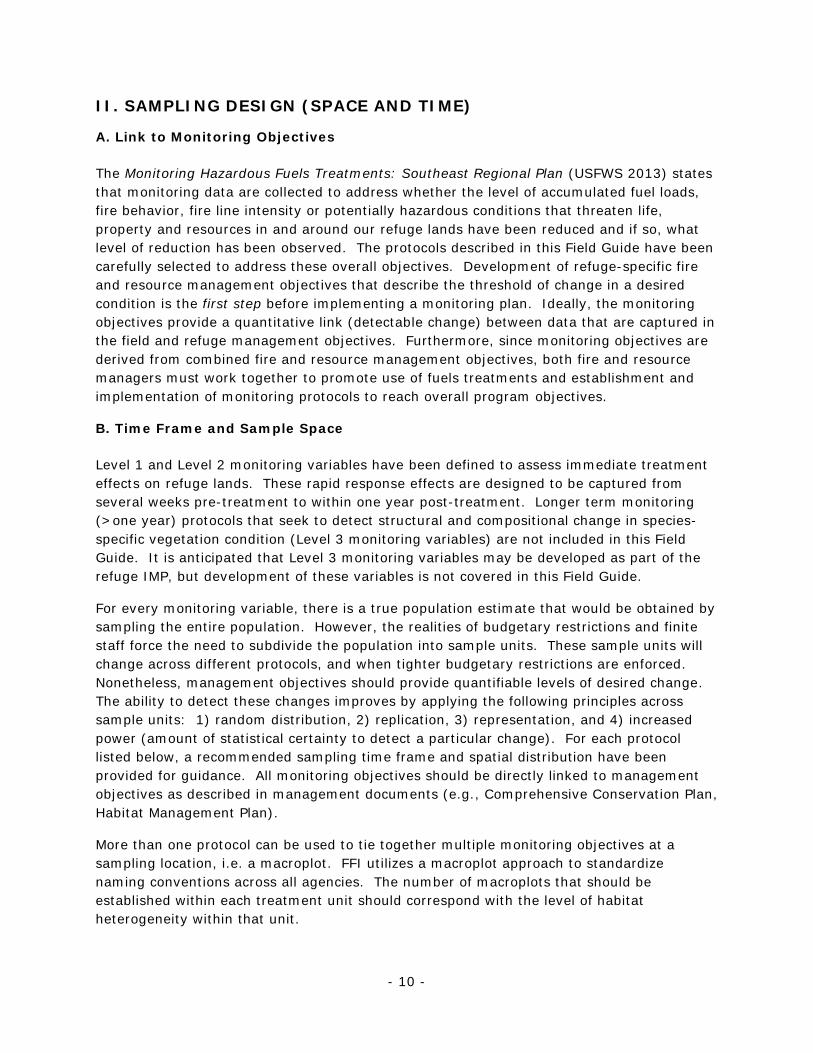
A. Link to Monitoring Objectives The Monitoring Hazardous Fuels Treatments: Southeast Regional Plan (USFWS 2013) states that monitoring data are collected to address whether the level of accumulated fuel loads, fire behavior, fire line intensity or potentially hazardous conditions that threaten life, property and resources in and around our refuge lands have been reduced and if so, what level of reduction has been observed. The protocols described in this Field Guide have been carefully selected to address these overall objectives. Development of refuge-specific fire and resource management objectives that describe the threshold of change in a desired condition is the first step before implementing a monitoring plan. Ideally, the monitoring objectives provide a quantitative link (detectable change) between data that are captured in the field and refuge management objectives. Furthermore, since monitoring objectives are derived from combined fire and resource management objectives, both fire and resource managers must work together to promote use of fuels treatments and establishment and implementation of monitoring protocols to reach overall program objectives.
B. Time Frame and Sample Space Level 1 and Level 2 monitoring variables have been defined to assess immediate treatment effects on refuge lands. These rapid response effects are designed to be captured from several weeks pre-treatment to within one year post-treatment. Longer term monitoring (>one year) protocols that seek to detect structural and compositional change in species-specific vegetation condition (Level 3 monitoring variables) are not included in this Field Guide. It is anticipated that Level 3 monitoring variables may be developed as part of the refuge IMP, but development of these variables is not covered in this Field Guide.
For every monitoring variable, there is a true population estimate that would be obtained by sampling the entire population. However, the realities of budgetary restrictions and finite staff force the need to subdivide the population into sample units. These sample units will change across different protocols, and when tighter budgetary restrictions are enforced. Nonetheless, management objectives should provide quantifiable levels of desired change. The ability to detect these changes improves by applying the following principles across sample units: 1) random distribution, 2) replication, 3) representation, and 4) increased power (amount of statistical certainty to detect a particular change). For each protocol listed below, a recommended sampling time frame and spatial distribution have been provided for guidance. All monitoring objectives should be directly linked to management objectives as described in management documents (e.g., Comprehensive Conservation Plan, Habitat Management Plan).
More than one protocol can be used to tie together multiple monitoring objectives at a sampling location, i.e. a macroplot. FFI utilizes a macroplot approach to standardize naming conventions across all agencies. The number of macroplots that should be established within each treatment unit should correspond with the level of habitat heterogeneity within that unit.
- 11 -
C. FFI and Macroplot Name When using FFI to manage Level 2 monitoring variables, several levels of unit identification are required that do not correspond with unit identification in FMIS. These include:
Administrative Unit = Refuge Name Project Unit = Burn or Treatment Unit Macroplot = Plot ID (e.g., Plot 1, 2, 3, etc.) Sampling Event = Date
D. Plot Establishment The number of macroplots that should be established within each treatment unit should correspond with the level of habitat heterogeneity within the unit. Ideally, at the minimum, a single macroplot per broad fuel load category (High, Medium, and Low) will be established in each treatment unit, and the relative acreage of each category recorded. A plot center should be established for each macroplot that is an ideal distance from treatment edges (e.g., > 50 meters). At each plot center, the following information should be recorded:
1. Macroplot Name (see above) 2. Macroplot Type (e.g., Prescribed Fire, Mechanical, Chemical, etc) 3. Purpose 4. Site Characteristics (e.g., Aspect, Slope, Elevation) 5. Location (Easting/Northing) 6. Installation Date These data can be entered into Appendix A.1 (Macroplot Data).
III. METHODS - MAKING IT HAPPEN
A. Suggested Protocols and Methods for Levels 1 and 2 Monitoring Variables This guide describes field methods and protocols for monitoring variables listed in the Monitoring Hazardous Fuels Treatments: Southeast Regional Plan (USFWS 2013). The list of protocols described are supported and recommended by the Southeast Regional Office. Core data elements were defined by the USFWS National Fire Ecology Team, prepared for the National Wildlife Refuge System National Fire Leadership Team, and can be found in the document Briefing Statement: Core Data Elements for USFWS Wildland Fire Inventory and Monitoring, 8 Nov 2012. The general timing (pre, during, post treatment) of each monitoring variable is listed in Table 3. The protocols described in this guide include:
• Level 1 Required Core Data • Level 2 Fire Behavior (including Fuel Moisture, Weather, Fire Behavior and
Smoke) • Level 2 Fuel Load Monitoring • Level 2 Burn Severity Monitoring

- 12 -
• Level 2 Photo Documentation
Table 3. A description of the timing of data collection activities for each monitoring protocol is given in the table below.
Monitoring Protocol Level Pre-Treatment
During Treatment
Post-Treatment
Core Data 1 X X X Fire Behavior & Smoke, Fuel Moisture, and Weather
2 X
Fuel Load Monitoring 2 X X Severity Monitoring 2 X X Photo Documentation 2 X X X
B. Core Data (Level 1, Required) For every treatment applied, these core data are required to be collected. Although these data represent reference information for each treatment (e.g., refuge name, date/time, dominant vegetation type), they are still treated as monitoring variables in this document. These data will be entered into FMIS, and meet the requirements for the Service's Fuels Treatment Reporting Standards as well as Core Element Standards of the Service's I&M program. Table 1 lists the Level 1 Core Data.
Time Frame: These fields are designed to be captured prior to, during, and after each treatment. Spatial Distribution: One representative location within treatment unit (latitude/longitude) and/or polygon which defines treatment perimeter. Materials: • Clipboard • Field Datasheet + Field Notebook • Lead Pencils + Extra Lead • GPS
Field Data Sheets: Appendix A.2 (Level 1 Core Data)
Data Entry: FMIS
Personnel Needed: 1 person
Time for Protocol: Observations taken once (10-20 minutes).
C. Fire Behavior & Smoke, Fuel Moisture, and Weather (Level 2) The USFWS Fire Management Handbook (Chapter 18) requires that fire weather, behavior, and where needed, smoke observation data be collected on every prescribed burn treatment. No two fires are exactly alike, and on-site observations are needed to document

- 13 -
how conditions vary during treatment. These data will help to quantify fire intensity and severity that may significantly contribute to the understanding of fire effects after treatment. Always consider safety first in any on-site collection of data during fire treatment observations!!
1. Fuel Moisture (Recommended) The fuel moisture for a class is the average moisture measured across multiple samples from a treatment unit. There are two methods of measuring fuel moistures: 1) the oven-dry method requires that multiple samples of a fuel class be collected in the field, stored in air-tight containers, and returned to the lab to be weighed and oven-dried, or 2) the indirect method involves using probes or other instruments to take moisture readings, but are generally not as accurate as the oven-dry method (Lutes et al. 2006). Complete field protocols of the oven-dry method follow Pollet and Brown (2007), and are summarized below.
1. Weigh airtight containers to obtain tare weight of each (without lids).
2. Collect samples (where appropriate) of a) live fuels (shrubs and/or herbs), b) dead fuels, c) litter, or d) duff layers from either single or multiple locations that would represent several treatment units.
3. For live fuels: Do not collect samples if water drops or dew is present on plants. Make collections of twigs (up to 1/8 inch) and foliage, and place in airtight container with a lid. Do not include flower or fruit material.
4. For dead fuels: Do not collect samples if water drops or dew is present on plants. Make collections of small 100 or 1000-hour fuel chips and place in airtight container with a lid.
5. For litter and duff: Remove all plant stems, roots, and other living plant material from the samples. Remove duff material from litter sample, and mineral soil material from duff sample. Place the litter and duff samples in separate airtight containers with a lid.
6. Samples should be weighed (without lids) soon after collection (preferably in the field). This value will be the "wet weight."
7. Preheat drying oven to 100˚ C / 212oF When heated, remove the lids from the samples and space containers evenly in the oven so that air circulates freely around each. Record the date and time samples are placed in the oven.
8. Dry samples for at least 24 hours (or up to 48 hours for very wet fuels). Remove dried samples from the oven. Record the weight from each sample. This value will be the "dry weight."
9. To calculate moisture content from each sample, use the following equation:
"Wet Weight" - "Dry Weight" of Sample
"Dry Weight" of Sample - Container Tare Weight x 100=% Moisture Content Dry Weight

- 14 -
10. Raw weight and calculated data can be entered into the datasheet located in Appendix A.3 or using the pre-populated calculation cells in the Collection Form Excel Spreadsheet located on the following website:
http://www.wfas.net/index.php/national-fuel-moisture-database-moisture-drought-103
11. Average fuel moisture values should be entered in the fuel moisture location of the FFI (Fire Behavior) datasheet, located in Appendix A.4.
Time Frame: Data should be collected within 1-2 weeks prior to treatment. Alternatively, data can be collected multiple times throughout burn season or entire year to guide prescribed fire opportunities.
Spatial Distribution: Data should be collected from single or multiple locations.
Materials: • Clippers/shears • Clipboard • Field Datasheet (Fuel Moisture Content Form + Fire Behavior, Fuel Moisture,
Weather, and Smoke) • Lead Pencils + Extra Lead • Airtight metal containers • Scale or balance weighing to nearest 0.1 g • Drying Oven
Field Data Sheets: Appendix A.3 (Fuel Moisture Content Form) + Appendix A.4 (Fire Behavior, Fuel Moisture, Weather, and Smoke)
FFI Protocol Data Entry: FFI (Fire Behavior)
Personnel Needed: 1 person
Time for Protocol: Samples collected once per day.
2. Weather (Required)
1. Collect on-site weather condition observations frequently, at least once per hour, either manually or automatically from a weather station.
2. On-site weather observation data collected throughout the treatment application include: 1) dry bulb/wet bulb temperature, 2) relative humidity, 3) wind speed and direction, 4) gust speed and direction, 5) cloud cover, and 6) fine fuel shading (> or < 50%).
3. These data can be entered into field data forms located in Appendix A.4 and in the Fire Behavior protocol in FFI Appendix 3.1. KDBI may be entered into the "comments" section of the FFI Fire Behavior datasheet Appendix 3.1.
Time Frame: Data should be collected at least once per hour during treatment.

- 15 -
Spatial Distribution: Data should be collected from multiple locations within the treatment unit (not the road!) unless using a weather station.
Materials: • Clipboard • Field Datasheet + Field Notebook • Lead Pencils + Extra Lead • GPS • Belt Weather Kit and/or Handheld Weather Meter
Field Data Sheets: Appendix A.4 (Fire Behavior, Fuel Moisture, Weather, and Smoke)
FFI Protocol Data Entry: FFI (Fire Behavior)
Personnel Needed: 1 person
Time for Protocol: Observations taken every hour or as requested by the burn boss on site.
3. Fire Behavior & Smoke (Required)
1. Collect on-site Fire Behavior & Smoke observations frequently and from different locations throughout the treatment unit during the treatment application. Data collected for Fire Behavior may include: 1) fire activity, 2) rate of spread, 3) spread azimuth, 4) flame length or height, 5) spotting information, 6) smoke impacts, dispersal, and intrusions, and 7) plume behavior.
2. Spotting information can be based on instructions provided in FIREMON (Lutes et al. 2006). Codes include: SD (spotting downslope or downwind), SU (spotting upslope or upwind), SE (spotting is erratic and very random), NS (no spotting observed), and NA (difficult to determine spotting due to smoke obstruction).
3. Plume behavior also can be based on instructions provided in FIREMON (Lutes et al. 2006). Codes include: WV (plume well ventilated, rising, and dispersing high above burn), US (plume unstable and its behavior is erratic), and PD (plume is dropping and going downhill into the valleys).
4. These data can be entered into field data forms located in A.4.
Time Frame: Data should be collected at least once per hour during treatment or as requested by the burn boss.
Spatial Distribution: Data should be collected from multiple locations throughout the treatment unit.
Materials: • Clipboard • Field Datasheet or field notebook

- 16 -
• Lead Pencils + Extra Lead • GPS/ Map of burn unit • Compass • Flagging Tape • Watch/Timer for estimating rates of spread • Digital Camera
Field Data Sheets: Appendix A.4 (Fire Behavior, Fuel Moisture, Weather, and Smoke)
FFI Protocol Data Entry: FFI (Fire Behavior)
Personnel Needed: 1 person
Time for Protocol: Observations taken every hour or as requested by burn boss on site.
D. Fuel Loading (Level 2, Recommended) Fuel load monitoring is used to estimate three structural components of fuel loads: dead and downed woody fuels, duff and litter, and understory standing vegetation (Lutes et al. 2006). Together, these vertical and horizontal fuel strata have substantial influence on fire effects, behavior, and severity. Valuable information can be gathered when fuel loads are captured both pre- and post-treatment across ecosystems. To monitor fuel loading, the Southeast Regional Office recommends the following:
a) For forests, woodlands, and other woody habitats, implementing the combination of Protocol D.1 (Dead/Downed Woody Debris), D.2 (Duff/Litter), and D.3 (Live and Dead Standing Vegetation).
b) For marshes, grasslands, and other non-woody habitats, the use of Protocol D.4 (Alternative Biomass Sampling in Marshes and Grasslands).
c) Protocol D.5 (Photo Series Documentation) can be used only if refuges fall within 100 miles of existing published photo series AND structural and compositional conditions between the treatment unit and photo series are similar.
1. Dead/Downed Fine and Coarse Woody Debris In woody habitats, the Brown's Fuel Inventory Transect methods are used to estimate downed debris, duff, and litter (Brown 1974, Brown et al. 1982). In these methods, planar transects are established within monitoring or treatment units and the number of different fuel size classes (1, 10, 100 and 1000-hr fuels) along select lengths of a transect are tallied. Biomass of dead and down woody fuels are calculated using existing equations that estimate the tons per acre of different fuel size classes using fuel constants established by research studies. FFI automatically calculates fuel loading once the data is entered. Various options in FFI are available to adjust fuel constants used to calculate fuel loadings for different species.
- 17 -
1. Establish a plot center with a permanent stake or marker in an area where fuel load calculations are desired.
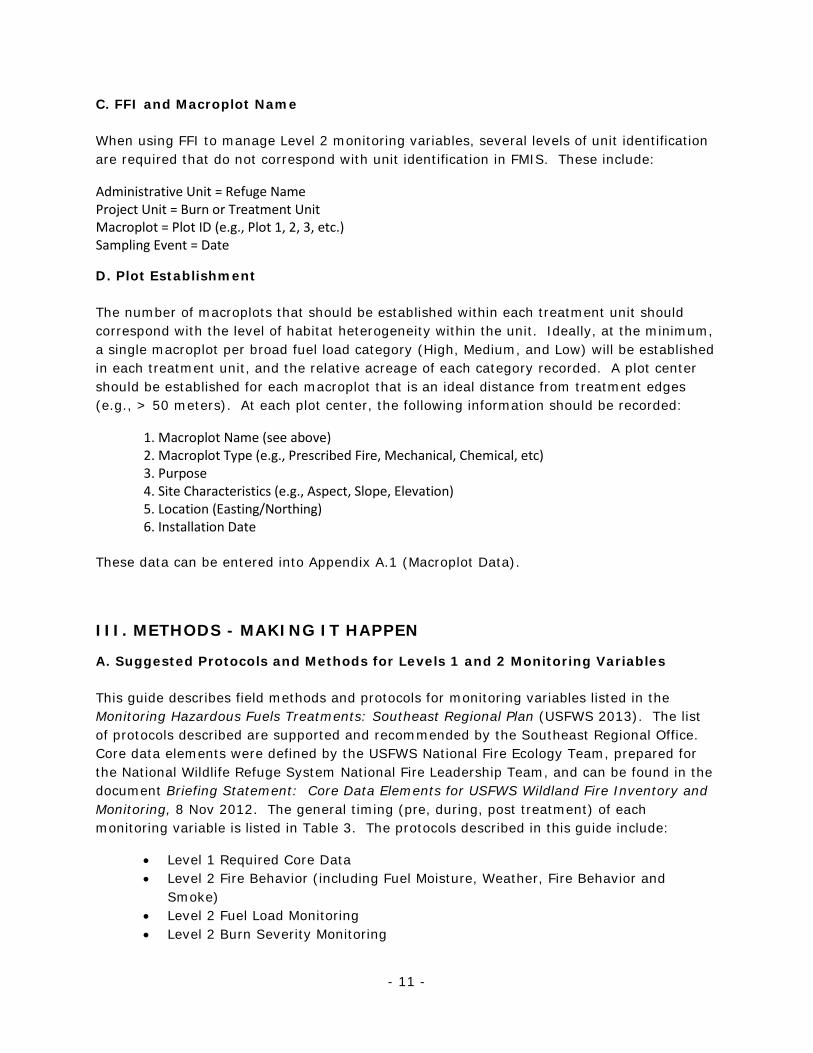
2. Layout the measuring tape 75 feet (minimum recommended distance) on an azimuth of 90 degrees (due East) from the plot center to define the first sampling plane. The first 15 feet are not used to avoid trampled areas of vegetation. The sampling plane is 6 feet high by 60 feet long. Additional sampling planes may be placed along sequential transects at 60 degree intervals from the end of the first transect, moving counter-clockwise to reduce the potential bias of non-randomly oriented pieces (Figure 1).
Figure 1. Illustration of the plot design for Dead/Downed Woody Fuel Sampling Design showing the position of sequential transects layed out in a hexagon fashion.
3. From 15 - 21 feet along transect, count the number of ALL dead and down fuel particles by size class (1-hour=0-0.25 inches; 10-hour=0.25-1 inch; 100-hour=1-3 inches; 1000-hour=>3 inches) that pass through a 6 x 6 foot plane. For 1000-hour fuels, record the diameter and decay class (Table 4) at the point which the material crosses through the plane. A caliper, small measuring tape or go-no-go gauge may be useful to determine diameter values (Figure 2).
4. At 21 feet along transect, discontinue counting 1- and 10- hour size class fuels. From 21- 30 feet along transect, continue to count 100-hr and 1000-hr fuels (Figure 2).
EAST WEST
NORTH
SOUTH
TRANS #2 330O
TRANS #1 90O
TRANS #3 270O
TRANS #4 210O
TRANS #5 150O
TRANS #6 90O
TRANS #7 30O

- 18 -
5. At 30 feet along transect, discontinue counting 100-hour size class fuels. From 30 feet to end of transect (75 feet), continue to count 1000-hr fuels. Sampling design illustration is displayed in Figure 2.
6. Record the slope (%) of the transect with a clinometer.
7. A minimum of 3 transects should be established within each sampling site. 8. Data entry forms for Dead / Downed Fine and Course Woody Debris can be found
in Appendix A.5.
Table 4. Decay classes and description of 1000hr fuel samples from FFI.
Decay Class
Description
1 All bark is intact. All but the smallest twigs are present. Old needles probably still present. Hard when kicked.
2 Some bark is missing, as are many of the smaller branches. No old needles still on branches. Hard when kicked.
3 Most of the bark is missing and most of the branches less than 1 in. in diameter also missing. Still hard when kicked.
4 Looks like a class 3 log, but the sapwood is rotten. Sounds hollow when kicked and you can probably remove wood from the outside with your boot. Pronounced sagging if suspended for even moderate distances.
5
Entire log is in contact with the ground. Easy to kick apart but most of the piece is above the general level of the adjacent ground. If the central axis of the piece lies in or below the duff layer, then it should not be included in the CWD sampling as these pieces act more like duff than wood when burned.

- 19 -
0 75 FT 15 30 45 60 21
100-hr Fuels
1-hr,10-hr Fuels
1000-hr Fuels
Figure 2. An illustration of sampling design for counting fuel size classes along 75 foot sampling transect.
Time Frame: Data should be collected 1 - 4 months pre-treatment and within 1-4 months post-treatment. Ideally, this information should be captured within the same season.
Spatial Distribution: Data should be collected from multiple (3-5) locations throughout the treatment unit; however, replications may increase depending on several factors that include within-treatment unit habitat heterogeneity and refuge management objectives.
Materials: • Permanent Stakes or Markers • GPS for plot location information • Compass • Fiberglass measuring Tape (at least 75 feet) • Clipboard • Field Datasheet (A.5) • Lead Pencils + Extra Lead • Go/No Go Gauge, caliper, or small measuring tape
Field Data Sheets: Appendix A.5 (Dead/Downed Fine and Coarse Woody Debris)
FFI Protocol Data Entry: FFI (Surface Fuels)
Personnel Needed: 1-2 people
Time for Protocol: 30-90 minutes per sampling site
2. Duff and Litter Depth of duff and litter is measured at select locations along transects established for dead/downed woody fuels or within randomly selected sites of the treatment unit. Duff

- 20 -
and litter loading is computed using bulk density coefficients and automatically converted to tons per acre in FFI once the data is entered.
1. Establish 3 foot radius plots at 45 and 75 feet along each fuel transect. Within
each circular plot, randomly select a location to dig. Use the blade of a trowel to work through the litter and duff layers to expose the mineral soil layer, making a profile of the duff and litter layers. Keep in mind that mineral soil is usually lighter in color than the duff layer and coarser in particle size, often sandy or gravelly. Measure the depth of both the duff and litter layer. Data can be entered in the field datasheet form (Surface Fuels- Duff and Litter) located in Appendix A.6.
2. Field data can be entered into the Surface Fuels - Duff and Litter protocol in FFI. Time Frame: Data should be collected 1 - 4 months pre-treatment and within 1-4 months post-treatment. Ideally, this information should be captured within the same season.
Spatial Distribution: Data should be collected from multiple (3-5) locations throughout the treatment unit; however, replications may increase depending on several factors that include within-treatment unit habitat heterogeneity, and refuge management objectives.
Materials: • Clipboard • Field Datasheet (A.6) • Lead Pencils + Extra Lead • GPS • Wire Survey Flags • Fiberglass Measuring Tape (at least 75 feet) • Compass • Hand Trowel • Small measuring tape or ruler
Field Data Sheets: Appendix A.6 (Duff and Litter)
FFI Protocol Data Entry: FFI (Surface Fuels - Duff and Litter)
Personnel Needed: 1-2 people
Time for Protocol: 15-30 minutes per sampling site
3. Live and Dead Standing Vegetation The biomass of live and dead, woody and non-woody understory, standing vegetation is estimated using cover and average height estimations. The following growth forms are typically labeled as woody species--trees, shrubs, and vines. Forbs and graminoids (grasses, sedges, and rushes) belong in the non-woody understory growth form. Small trees, shrubs, and herbaceous vegetation can significantly influence fire behavior because their branches and foliage are above-ground, allowing for more efficient heating
- 21 -
and burning of fuels. Standing vegetation is estimated along the same transects used to sample dead/downed woody debris and duff/litter or can be randomly located within the treatment unit.
1. Establish 3 foot radius plots at 45 and 75 feet along each transect creating a 6 X 6 foot vertical sampling cylinder within the treatment unit (these sites can be the same as randomly located duff/litter plots).
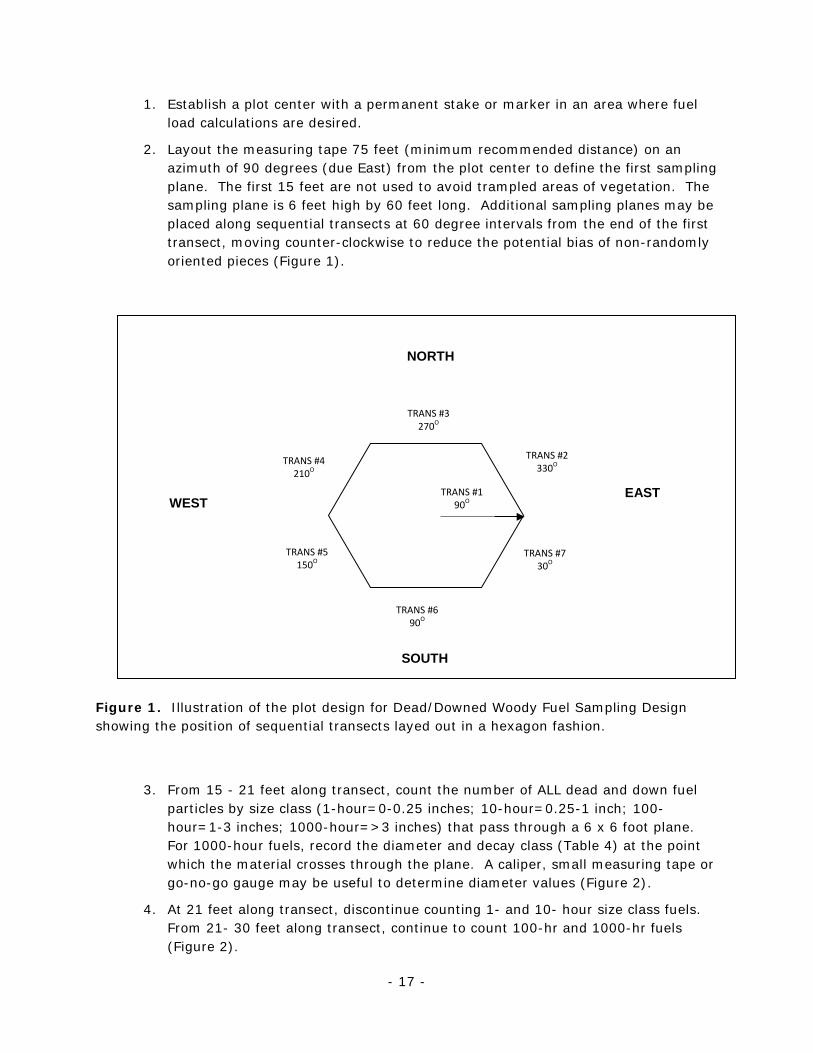
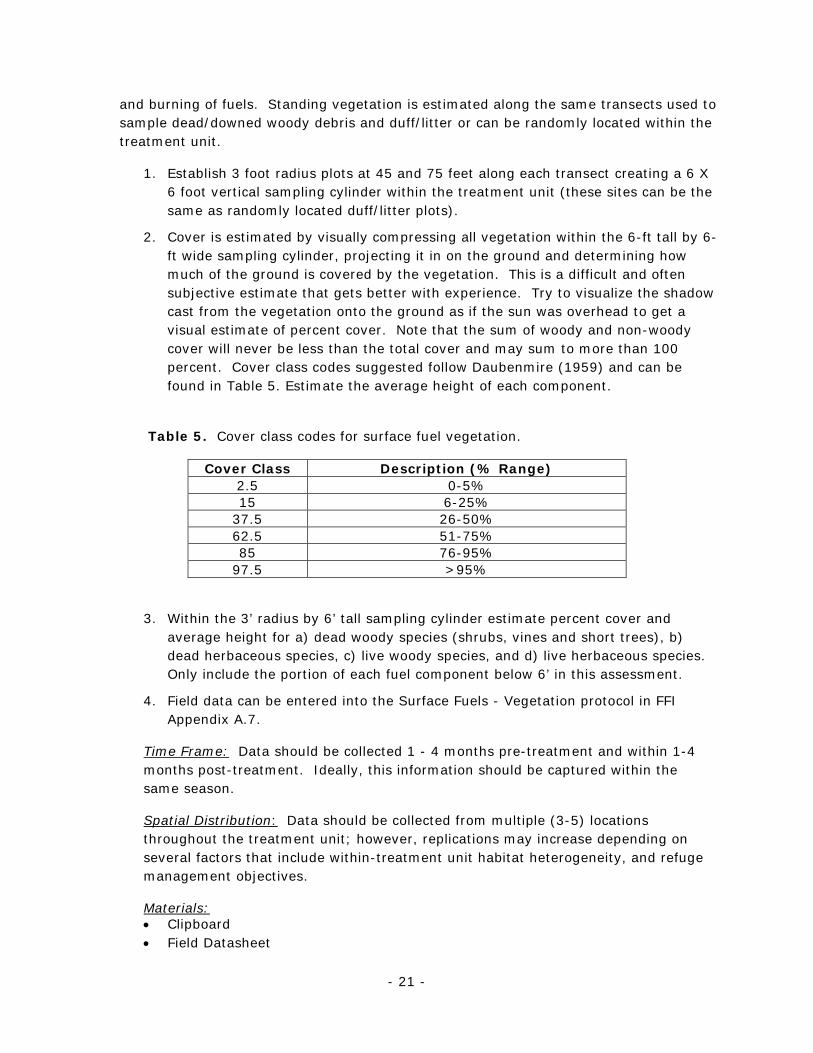
2. Cover is estimated by visually compressing all vegetation within the 6-ft tall by 6-ft wide sampling cylinder, projecting it in on the ground and determining how much of the ground is covered by the vegetation. This is a difficult and often subjective estimate that gets better with experience. Try to visualize the shadow cast from the vegetation onto the ground as if the sun was overhead to get a visual estimate of percent cover. Note that the sum of woody and non-woody cover will never be less than the total cover and may sum to more than 100 percent. Cover class codes suggested follow Daubenmire (1959) and can be found in Table 5. Estimate the average height of each component.
Table 5. Cover class codes for surface fuel vegetation.
Cover Class Description (% Range) 2.5 0-5% 15 6-25%
37.5 26-50% 62.5 51-75% 85 76-95%
97.5 >95%
3. Within the 3’ radius by 6’ tall sampling cylinder estimate percent cover and average height for a) dead woody species (shrubs, vines and short trees), b) dead herbaceous species, c) live woody species, and d) live herbaceous species. Only include the portion of each fuel component below 6’ in this assessment.
4. Field data can be entered into the Surface Fuels - Vegetation protocol in FFI Appendix A.7.
Time Frame: Data should be collected 1 - 4 months pre-treatment and within 1-4 months post-treatment. Ideally, this information should be captured within the same season.
Spatial Distribution: Data should be collected from multiple (3-5) locations throughout the treatment unit; however, replications may increase depending on several factors that include within-treatment unit habitat heterogeneity, and refuge management objectives.
Materials: • Clipboard • Field Datasheet
- 22 -
• Lead Pencils + Extra Lead • Fiberglass Measuring Tape • Compass • Yard/Meter Stick
Field Data Sheets: Appendix A.7 (Live and Dead Standing Vegetation)
FFI Protocol Data Entry: FFI (Surface Fuels - Vegetation)
Personnel Needed: 1-2 people
Time for Protocol: 15-30 minutes per sampling site
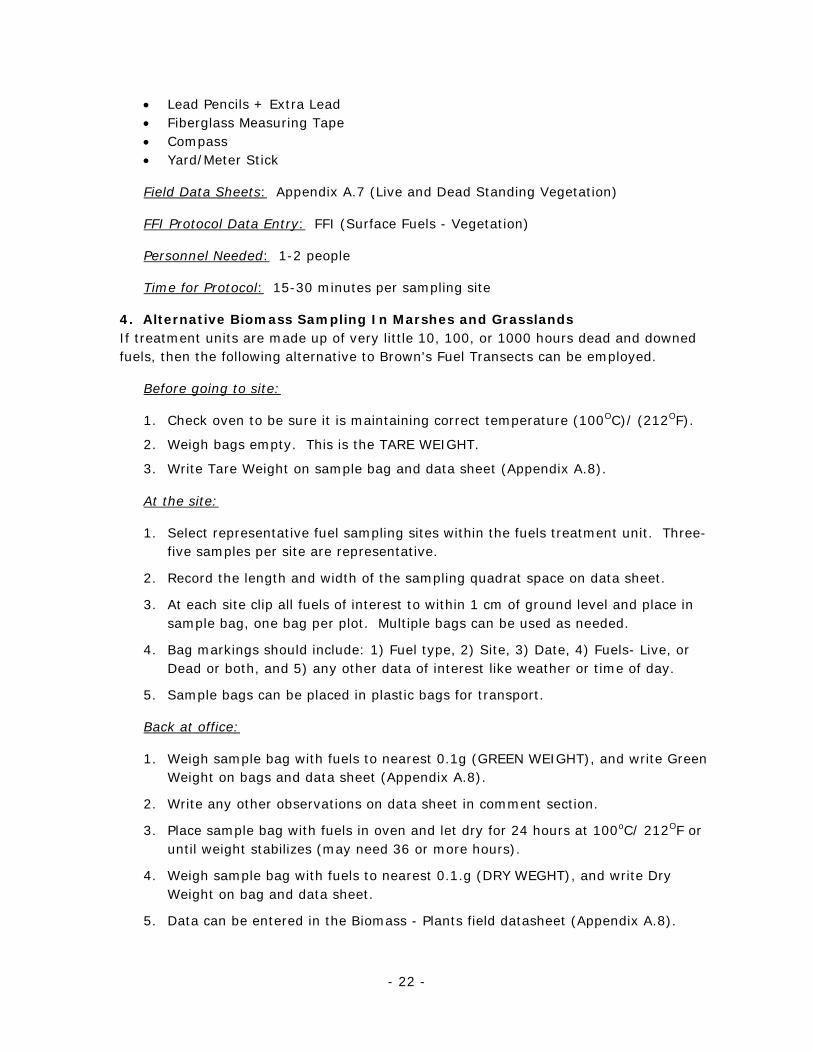
4. Alternative Biomass Sampling In Marshes and Grasslands If treatment units are made up of very little 10, 100, or 1000 hours dead and downed fuels, then the following alternative to Brown's Fuel Transects can be employed.
Before going to site:
1. Check oven to be sure it is maintaining correct temperature (100OC)/ (212OF).
2. Weigh bags empty. This is the TARE WEIGHT.
3. Write Tare Weight on sample bag and data sheet (Appendix A.8). At the site:
1. Select representative fuel sampling sites within the fuels treatment unit. Three-five samples per site are representative.
2. Record the length and width of the sampling quadrat space on data sheet.
3. At each site clip all fuels of interest to within 1 cm of ground level and place in sample bag, one bag per plot. Multiple bags can be used as needed.
4. Bag markings should include: 1) Fuel type, 2) Site, 3) Date, 4) Fuels- Live, or Dead or both, and 5) any other data of interest like weather or time of day.
5. Sample bags can be placed in plastic bags for transport.
Back at office:
1. Weigh sample bag with fuels to nearest 0.1g (GREEN WEIGHT), and write Green Weight on bags and data sheet (Appendix A.8).
2. Write any other observations on data sheet in comment section.
3. Place sample bag with fuels in oven and let dry for 24 hours at 100oC/ 212OF or until weight stabilizes (may need 36 or more hours).
4. Weigh sample bag with fuels to nearest 0.1.g (DRY WEGHT), and write Dry Weight on bag and data sheet.
5. Data can be entered in the Biomass - Plants field datasheet (Appendix A.8).

- 23 -
6. FFI will automatically calculate tons per acre from samples once Sample Area (Quadrat Length and Width), Tare weight, Green Weight and Dry Weight have been entered in Biomass-Plants Protocol.
Time Frame: Data should be collected 1 - 4 months pre-treatment and within 1-4 months post-treatment. Ideally, this information should be captured within the same season.
Spatial Distribution: Data should be collected from multiple (3-5) locations throughout the treatment unit; however, replications may increase depending on several factors that include within-treatment unit habitat heterogeneity and refuge management objectives.
Materials: • Clipboard • Field Datasheet (A.8) • Lead Pencils + Extra Lead • Measuring tape to measure length and width of quadrat • Clippers or Shears • Paper Sample Bags • Permanent Markers (e.g., Sharpies) • Large Plastic Bags • Balance that measures 0.1 g • Drying Oven that reaches 100oC/ 212OF constant temperature
Field Data Sheets: Appendix A.8 (Alternative Biomass Sampling in Marsh and Grasslands)
FFI Protocol Data Entry: FFI (Biomass-Plants)
Personnel Needed: One person
Time for Protocol: 15-30 minutes per sampling site
5. Alternate Biomass Sampling Using Photo Series The natural fuels photo series dataset contains digital images that characterize a range of fuel loadings across a variety of ecosystems throughout the Americas. They can be used to assess living and dead woody material and vegetation within treatment units, with minimal investment in ground inventory. It should be noted that the level of precision this method captures is considerably less precise than direct collection of ground inventory methods (e.g., Brown's Transects) described above. It is recommended that the photo series information be used only if refuges that fall within a 50-miles range of existing photographs and if treatment units are structurally and compositionally similar to existing photographs. Digital photo series information is currently web-based, and can be found at: http://depts.washington.edu/nwfire/dps/. Refuges can develop their own photo series over time.

- 24 -
1. For each general habitat type within a treatment unit, record multiple digital landscape images, both pre- and post-treatment. From each habitat type within a treatment unit, the “best” image is selected and compared with the photo series exhibiting nearly matching fuel and stand conditions. In some instances, multiple photo series may be chosen.
2. Once a photo series is selected, site information is generated in web tabularized format, and can be exported into an Excel Spreadsheet (along with other similar photo series habitat types). NOTE: The exported spreadsheet reports loading in pounds/acre units; convert to tons/acre. These data can be entered into the FFI Biomass - Fuels Data entry form (Appendix A.9).
Time Frame: Data should be collected 1 - 4 months pre-treatment and within 1-4 months post-treatment. Ideally, this information should be captured within the same season.
Spatial Distribution: Data should be collected from multiple (3-5) locations throughout the treatment unit; however, replications may increase depending on several factors that include within-treatment unit habitat heterogeneity, and refuge management objectives.
Materials: • Clipboard • Field Datasheet (A.9) • Lead Pencils + Extra Lead • Digital camera- not sure why we need this? • Photo Series
Field Data Sheets: Appendix A.9 (Alternative Biomass Sampling Using Photo Series)
FFI Protocol Data Entry: FFI (Biomass-Fuels)
Personnel Needed: One person
Time for Protocol: < 30 minutes per sampling site
E. Burn Severity (Level 2, Recommended) Specific measures can be taken to assess burn severity in selected treatment units called the Composite Burn Index (CBI). A detailed description of these methods is given in Lutes et al. (2006), and a brief description of this protocol is given below. This method gives a single index value that summarizes general fire effects found within a given area following burns. It is generally used in wildfire situations, but can be applied in fuel treatment situations as well. This measure is an attempt to quantify the range of variation in burn severity found within the treatment unit.
Burn severity is estimated for each of five strata (see Table 6 below): 1) substrate; 2) herbs and understory less than 3ft; 3) tall shrubs and small trees 3-16ft; 4) sub canopy; and 5) dominant and co-dominant canopy trees. A composite index is then calculated for all strata

- 25 -
combined. The composite rating can be reported separately for each stratum depending on the objectives. Only strata present should be included in the estimated burn severity.
The CBI represents the amount of change that occurred after fire, or how fire has altered the biophysical condition of a treatment unit. It is important to note that this measure indicates severity and not the intensity of a particular treatment which is generally indicated by fire behavior variables, and includes only the upward heat flux above the soil surface. On-site fire behavior observations will provide information about fireline intensity (see Section C-3 above).
The CBI data collected were originally intended for Landsat Data Analysis purposes and serve as part of a larger protocol to measure burn severity estimates over large landscape wildfires (see Monitoring Trends in Burn Severity (MTBS) website: http://www.mtbs.gov/). In the context of fuel treatments, it is simply used as a general indicator of the severity of an applied treatment. In addition to the data collected on site, additional severity map products may be available on the MTBS website.
1. For pre-burn data identify sampling sites within the treatment unit that best represent the range of variation in fuel loading across the treatment unit for data collection. If only post burn data is collected, identify sampling sites within the treatment unit that best represent the range of variation in burn severity. This information may be provided by remote sensing products or by visually walking the site and determining what amount of variation in fuel loads or burn severity exists.
2. Establish 3-5 sampling sites per treatment unit sampled, depending on the variation of the burn severity within the unit. The number of CBI plots can be collapsed or expanded, depending on the size of the treatment area, the variation in burn severity and the resources available to complete the work. When setting up plots, try to find a homogeneous area of about 200 X 200 feet with similar fuel loads or post-fire effects. Ensure a 100 ft buffer from the road is maintained.
3. Establish a plot center (permanently if possible) and record location, slope, aspect, and diameter in the top of the Burn Severity Data Form, A.10.
4. From the plot center, stretch a measuring tape to a radius of 100 feet (approx. 30m). Use flagging to mark the perimeter of the 100 foot radius circular area. This is the sampling macroplot.
5. Collect pre-burn CBI burn severity data at each site by estimating: 1) percent cover of litter, duff, and soil; 2) depth of litter and duff; 3) height of surface fuel bed; 4) percent cover of herbaceous strata (less than 3 feet), tall shrubs (3-16 feet), intermediate trees (> 16 feet), canopy trees; and 5) total number of living and dead intermediate and canopy trees. Enter this data of the CBI data form as pre-burn data (Burn Severity Data Form, A.10).
6. Collect post-burn CBI burn severity data within 2-4 weeks after fire. It is important to collect burn severity data as soon as possible within the first growing season after fire. Burn Severity measures can extend for longer term monitoring as needed, but the immediate impacts should be quantified within 2-4 weeks following fire with a possible follow up within 6 months of the treatment or within the same growing season.
7. Rate each stratum rating factor, (see Table 7), on a scale from 0 (no effect) to 3 (high burn severity effect) using the burn severity scale descriptions found in the data form (A.10) or Table 7.

- 26 -
8. Rate all severity factors that apply with a severity factor from 0 (no burn effect) to 3 (high burn effect) and record data into Burn Severity Data Form (Appendix A.10).
9. If a given strata is not present, record an 'NP' (not present), but do not record a 0! Decimal scores are acceptable. Consider the entire plot for each rating score. Numeric scores may be intermediate between the integer levels of the scale. Scores are entered into the Burn Severity Data Form (A.10) and used in calculating CBI for understory, overstory, and total sampling site.
10. Collect and record the treatment data and enter this data on the Burn Severity Data Form, Appendix A.10.
Table 6. Descriptions of strata used in burn severity protocol (CBI).
STRATA DESCRIPTION Substrates Inert surface materials-
rock, soil, duff, litter, and light fuels Herbs, Low Shrubs and Trees
Grasses, forbs, shrubs and small trees< 3ft tall
Tall shrubs, trees Shrubs and trees >3ft tall and < 16ft tall
Intermediate Trees Trees >16ft tall and < the canopy Trees Big Trees Dominant,
Co-dominant and Canopy Trees
Table 7. Description of Burn Severity Ratings for each Strata used in CBI protocol.
STRATA RATING FACTORS BURN SEVERITY RATINGS
0 1.0 2.0 2.5 3.0 A. SUBSTRATES
Litter and Light Fuel Consumed (Fuels < 3 inches)
Unchanged 50% litter consumed
100% litter consumed
100% litter and >80% light fuels consumed
100% litter and >98% light fuels consumed
Duff Consumption Unchanged Light Char 50% loss, deep char
consumed
Medium Fuel Consumption (Fuels 3-8 inches)
Unchanged 20% consumed
40% consumed
>60% loss, deep char
Heavy Fuel Consumption (Fuels >8 inches)
Unchanged 10% loss 10% loss >40% loss, deep char
Soil and Rock Cover and Color Change
Unchanged 10% change
40% change
>80% change
B. HERBS, LOW SHRUBS, TREES < 3FT

- 27 -
Percent Foliage Altered and Branch Loss
Unchanged 30% change
80% change
95% change
100% change and branch loss
Percent Living (or re-sprouting)
100% 90% 50% <20% None
Increase in Colonizers or Invasive Species
Unchanged Low Moderate High; or low if high severity
Low to none in very high severity
Change in Species Composition Over Time
Unchanged Little Change
Moderate Change
High Change
C. TALL SHRUBS, TREES 3-16FT Percent Foliage Altered and Branch Loss
0% 20% 60-90% >95% Significant Branch Loss
Percent Living (or resprouting)
100% 90% 30% <15% <1%
Change in Cover Unchanged 15% 70% 90% 100% Change in Species Composition Over Time
Unchanged Little Change
Moderate Change
High Change
D. INTERMEDIATE TREES, SUBCANOPY Percent Green 100% 80% 40% <10% None Percent Black None 5-20% 60% >85% 100% black
and branch loss
Percent Brown Scorch None 5-20% 40-80% <40% or > 80% in high burn severity
None due to torching
Percent Canopy Mortality None 15% 60% 80% 100% Char Height None 1.5m 2.8m >5m
E. BIG TREES, DOMINANTS, CO-DOMINANTS Percent Green 100% 95% 50% <10% None Percent Black None 5-10% 50% >80% 100% and
Branch Loss Percent Brown Scorch None 5-10% 30-70% <30% or
in high severity> 70%
None due to torching
Percent Canopy Mortality None 10% 50% 70% 100% Char Height None 1.8m 4m >7m
Time Frame: Within 2-4 weeks post-treatment. A follow-up measure can be taken within 6 months or within growing season.

- 28 -
Spatial Distribution: Data should be collected from multiple (3-5) locations throughout the treatment unit; however, replications may increase depending on several factors that include within-treatment unit habitat heterogeneity, variation of burn severity, and refuge management objectives.
Materials: • Clipboard • Field Datasheet • Lead Pencils + Extra Lead • Flagging Tape • Fiberglass Measuring Tape of at least 100 feet • Calculator
Field Data Sheets: Appendix A.10 (Burn Severity (CBI))
FFI Protocol Data Entry: FFI (CBI)
Personnel Needed: 1-2 people
Time for Protocol: 10-20 minutes per sampling site
F. Photo Documentation (Level 1, Required) Photographs are a useful means of documenting horizontal and vertical visual changes in fuels before and after treatments. If desired, links to electronic photographs can be entered in FFI on the Plot Description protocol. Photographs are good visual aids for showing the changes that occur over time, providing one can identify the time, location and scale at which the previous photographs were taken. Consequently, it is important to identify these attributes when the photographs are being taken. It is also important to take photographs before, as well as after, the treatments have been applied. This applies to both panoramic and single image photography. For Photo Documentation, the Southeast Regional Office recommends the following:
1. At the plot center, use a tripod or monopod to raise the camera or to a standard height that will be used for all subsequent photos (4 feet is recommended). On a hill slope or ravine, angle the camera with the slope.
2. It is highly recommended to monument the location of the tripod (photopoint center) with rebar, light-gauge aluminum conduit, or cement. Record the location with a GPS device, and provide description on how to navigate to the exact site. It is important to have the exact location for any subsequent photos to be able to closely match the photo taken before treatment.
3. A marker or scale board, must be used to indicate the fuel density and height. From the photopoint center, place scale board 30 feet away from the plot center at least one of the FOUR cardinal directions, and take 2-5 pictures. If a significant slope is present use upslope, downslope or side slope locations for the photos taken. The location of the scale board may also be monumented to more

- 29 -
closely represent the pre-treatment photo.It is important to document the photograph identification information (treatment unit, habitat, cardinal direction faced when taking picture, date/time). Record this data in the Plot Description Data Sheet (A. 11).
4. Instructions for constructing a scale board are located in Appendix B.
5. Back at the office the photos should be downloaded into a consistent electronic file structure that identifies the plot name, the date, and the description of the photo (north, east south, west, upslope, downslope, side slope and etc.)
6. The 'best' quality pre- and post-treatment image should be pasted into a Microsoft Word or PowerPoint document named for that particular treatment unit. A summary paragraph comparing the two images should be written, including descriptions of dominant fuel strata height and both pre- and post-treatment condition (See Appendix C).
Time Frame: Data should be collected 1 - 4 months pre-treatment and within 1-4 months post-treatment. Ideally, this information should be captured within the same season.
Spatial Distribution: At the minimum, a single representative site within each treatment unit.
Materials: • GPS • Rebar/Conduit • Hammer/Mallet • Clipboard • Field Datasheet • Lead Pencils + Extra Lead • Tripod/ Monopod • Digital Camera or Video Camera • Compass • Fiberglass Measuring Tape at least 30 feet • Photo Scale Board
Field Data Sheets: Appendix A.11 (Plot Description)
FFI Protocol Data Entry: FFI (Plot Description)
Personnel Needed: 1-2
Time for Protocol: <15 minutes per sampling site

- 30 -
IV. DATA COLLECTION, STORAGE, AND ARCHIVING
A. Field Data Forms The Southeast Regional Office recommends using standard field data forms (located in Appendix A of this document) that can be printed on water resistant (e.g., Rite in the Rain) paper, or standard paper. If individualized data forms are desired they should clearly define the types of data collected. Be sure to leave plenty of room for general comments, so if the data forms were not set up adequately beforehand notes can be added and forms can be modified for the next time out in the field. Be adaptive; if the data form does not seem to be capturing the data desired, modify it and make it customized to individual need. Hand-held computers and palm pilots have the capability to modify data forms on-site as needed there is a PDA version of FFi available, see details on the FFI website (http://www.frames.gov/index.php/partner-sites/ffi/ffi-home/). Also, do not try to enter too much on one data form. Many data forms may be needed for the different types of data that will be collected; for example, one data form may be needed for vegetation measurements before fire and a separate one for after fire, or one data form for vegetation data and one for fire behavior, etc.
B. Reviewing the Data - Early Quality Control Once the data are collected, it is important to review and note any outliers or problems while out in the field. Write up any comments about what was missed or needs to be address on the notes themselves while out in the field. If you use an abbreviation in your notes, make sure you have written down what it stands for. Relying on memory is not a good way to clean up data after the fact. Try to review the data briefly in the field and revisit the plots if needed. Before leaving the field, the following questions should be asked: Did all the data get collected that was set out to be collected? Were all off the plots measured? Were there any plots missed? Were all the variables measured that were planned to be measured?
C. Copies, Copies, and More Copies! There can never be enough copies of the completed data forms. Having many copies of the original data forms is the best defense against the “oops” factor. Get a hard copy of the data as soon as possible after leaving the field. Several hard copies would be best (2-3). If there is no time to enter data from a field notebook, copy the pages as is. Make hard copies of electronic spreadsheet pages (no matter how big the data set!). If a computer system fails for any reason, the electronic data is gone for good.
D. Data Entry and Storage Options Level 1 Core Data can be directly entered into the on-line FMIS database. All Level 2 Immediate Fire Effects data can be entered into the downloadable desktop version of FFI. Instructions for entering data into FFI can be found below and in the FFI User Guide (FFI v1.04.02, Aug 2012). Level 2 data that is not stored in FFI (photos) should be kept in an appropriate electronic filing structure accessible by all staff. Links to these files can be

- 31 -
stored in FFI. Data error checking is a critical step in the entry process. There are many ways to check the data for entry errors: visually or verbally checking all data against originals, or looking at the distribution of data and determining if the minimum or maximum values exceed expected values (indicating an outlier point). The query tool in FFI can be used to show any outliers in the dataset.
Once a year, back-up copies of the FFI database should be sent to the Regional Ecologists ([email protected] or [email protected]).
E. FFI Software, Installation, and Use
1. Installation FFI is currently run on individual stand-alone computers. In the future, the goal is to have one server location where all data can be uploaded, stored and analyzed across many refuges, but for the time being each computer involved with data set development will need to have the current version of FFI installed (Version 1.04.02) on it as a stand-alone copy.
The current version of FFI software (Version 1.04.02) and other necessary software can be downloaded from the FFI website: http://www.frames.gov/partner-sites/ffi/software-and-manuals/. Be sure to download all pertinent software and the most recent version of the User’s Guide (August 2012). Installation instructions are given in the FFI Installation Process Section.
You will need to have administrative access for downloading this software. For the installation process you must download the FFI software, and the appropriate Sequel Server 2005 Express version for either a 32-Bit or 64-Bit machine. Be sure you have all the requirements below on the stand alone machine.
General requirements include: • Minimum screen resolution of 1024 X 768 (XGA). • Windows XP, Windows Vista or Windows 7. • Microsoft .NET 3.5 SP1 Framework. • Microsoft SQL Server 2005 Express Edition.
Specific Requirements include:
• Free disk space: 600 MB before installing SQL Server Express, plus sufficient space for database storage.
• Memory: 512 MB or more of RAM. • Processor: 1 GHz or higher.
For large datasets requirements include:
• Free disk space: 600 MB before installing SQL Server Express, plus sufficient space for databases, which can range in size from 600 MB to 4 GB each.
• Memory: 1 GB of RAM. • Processor: 2 GHz or higher.
There are four parts to the installation process on individual, stand-alone computers; 1) Install FFI and .NET, and 2) Install SQL Server 2005 Express, 3) Create a database using FFI Database Administration and 4) Open FFI, log on and select database. The last two steps will be described in the Plot set up and Database Administration section below.

- 32 -
IT IS CRITICAL TO FOLLOW ALL INSTRUCTIONS COMPLETELY AND CAREFULLY when installing SQL Server 2005 Express. Follow the installation instructions exactly. Do not skip a step and check to be sure that all instructions are followed in one step before going to the next step. If the install process fails, most likely it is a problem with SQL Server Express installation, uninstall and try again and be sure to follow all instructions exactly.
2. Creating a FFI Dataset FFI uses a SQL Server 2005 database to store protocols and methods. If a database is not already available for your project, you must create one before you can begin to work with FFI. Use FFI Database Administration to create a new database. 1. Double-click the FFI Database Administration icon on your desktop. 2. In the Connect menu, select SQL Server. 3. If the SQL Server Instances field is blank click the Find Servers button to refresh the list. It may take a minute to find all of the servers. During that time the hour glass will be displayed. When the hourglass disappears click the down arrow to select the SQL instance you created during the installation process. 4. Enter sa (which stands for System Administrator) as the User Name and the SQL password that you created during the installation process. Click Connect. 5. In the tree view of the Database Manager window, highlight the name of the SQL server instance. 6. In the Server menu, select Create Database. Select FFI. 7. Enter a unique name, such as a refuge or forest name, for the new database and click OK. 8. A DOS window and a progress bar open, as shown below. Wait while the database is created, which could take up to 5 minutes, depending on your computer. 9. A dialogue box will notify you when the database has been created. 10. In the tree view of the Database Manager window, open the Databases folder by clicking on the plus sign to the left of the Databases label. The new database will be listed. The schema name, schema version and other information is displayed in the right pane. 11. Close FFI Database Administration.
3. Opening FFI and logging in to FFI 1. Double-click the FFI icon on your desktop, or launch FFI from your Start menu (Start > All Programs > FFI 1.04.02> FFI 1.04.02). The Database Select window opens. 2. If the SQL Server Instances field is blank click the Find Servers button. An hourglass will be displayed for up to a minute as the FFI locates SQL instances. When the hourglass disappears click the down arrow to see the available servers. Select your SQL server instance from the dropdown. 3. Enter the User Name, which will be sa (System Administrator), enter the SQL password you selected in Part 2 and click the down arrow on the Select or Enter a Database Name field. An hourglass will appear while the list is populated, then the list will flash briefly. Click the down arrow again to select the database you created in Part 3 of the installation. 4. FFI will open and the new database will be connected.
4. Backing up a Database 1. In the Database Manager tree view, highlight the name of the database. 2. Click Backup Database in the Database menu 3. After a moment or two, a confirmation box opens. Note the name of the backup file and click OK.

- 33 -
NOTE: The default location for backup files is C:\Program Files\Microsoft SQL Server\MSSQL.1\MSSQL\Backup. You should save the backup file in a safe location preferably on a server at an external site.
5. Restoring a Database 1. A backed-up database can be restored if it is inadvertently deleted or damaged. 2. In the Database Manager tree view, highlight the name of the SQL server instance in the tree view and select Restore Database in the Server menu. 3.The Database Restore window opens. Enter the Database Backup File Name by clicking the top Browse button and navigating to the backup file (it has a .bak extension). Highlight the backup file and click Open. Leave the Database Restoration Location as the default. Click Restore. Depending on the computer speed and database size it can take several minutes for the database to be restored. During that time it will look as though nothing is happening. 4.Click OK to close the message window.
6. Importing Protocols and Methods FFI incorporates the field sampling methods used in FEAT and FIREMON as its standard methods and protocols. In addition, FFI adds several new protocols. Table 8 lists the standard protocols that are available. Each of the standard protocols has its own forms, data summary reports, and data analyses. When you use the Data Entry and Edit function to enter monitoring data for a completed sample event, you will use familiar data entry forms that specifically correspond to each protocol that is assigned to the sample event.
1. In FFI, select Utilities > Import Protocols. 2. Navigate to the protocol file you wish to import and click Open. (The .pmd files are included in the installation file you downloaded from FRAMES and will be found in the temporary folder you created during the installation process.) 3. A query window opens. Review the message. To continue, click Yes. If you select No, your database will not be changed. 4. It may take up to 5 minutes for protocols to import. While they are importing an hourglass may or may not be displayed. A dialog will inform you when the protocols have imported. Click OK.
7. Creating a New Project Unit Project Units are usually defined so that they represent an area on the ground. For example, a project unit should consist of a burn or treatment unit boundary. Project units provide a means to functionally group macro plots for management and analysis. They can be defined so that they overlap spatially, and you can associate macro plots with multiple project units. You can spatially define project units using the FFI GIS module.
To create a new project unit in FFI, select New > Project Unit. The Project Unit window opens.
1. Add Identity information for the new project unit. • Name. Enter a meaningful name for the unit. • Date. The default is the date that you create the project unit. Use the dropdown
calendar or enter text to select a different date.

- 34 -
2. Add Properties information about the new project unit. • Agency. Enter the agency name. • GRID file location. This is the file location of the GIS layer, if used. This field will
auto-fill if the project unit is spatially defined. • Area. Enter the number of acres or hectares contained in the project unit. • Units. Use the dropdown to select acres or hectares.
Table 8. Protocol list available in FFI. Protocols denoted by * indicate those defined as required or recommended in this regional monitoring field guide.
Standard Protocols Biomass – Fuels* Biomass - Plants* CBI* Cover - Line Intercept Cover - Points Cover - Points by Transect Cover - Species Composition Cover/Frequency Density - Belts Density - Quadrats Disturbance History FCCS* Fire Behavior* Pilot Sampling Plot Description* Post Burn Severity Rare Plant Species Surface Fuels* Surface Fuels - Alaska Duff/Litter Surface Fuels - Piles Surface Fuels - Vegetation* Trees Trees - Individuals Trees - Saplings (diameter class) Trees - Seedlings (diameter class)
3. Macro plots tab. In this tab, click Assign Macro Plots to open the Macro Plot Selection form, which lets you assign macro plots to a project unit. Select the desired macro plots from the left-hand pane and assign them to the project unit by clicking the >> arrow. Click OK when finished. The assigned macro plots will be listed in the Macro plots window after you save your work. 4. Monitoring status tab. This tab contains the Monitoring Status Builder, which lets you add, edit, delete, and order monitoring status for a project unit. Monitoring status identifies the project unit's status in time in relationship to a treatment or disturbance 5. Click Add to open the Monitoring Status Builder. After you have assigned monitoring statuses to each project unit, the status list can be edited or deleted, and rearranged in any order. You can either assign the standard criteria listed below, or build your own.
• Prefix: Pre, Post, Re. • Base: Burn, Disturbance, Measure, Treatment.

- 35 -
• Suffix: Years 1 – 5 or a specific year: 2013 • Example: Pre Burn 2013 OR Post Burn Year 1
6. In the Objectives tab in the Project Unit window, enter the monitoring objective. 7. In the Description tab in the Project Unit window, enter a description for the project unit. 8. Use the Comment tab in the Project Unit window to enter any pertinent notes and comments.
8. Creating a Macroplot The macroplot is the sampling area within the treatment unit. To create a new macro plot in a project unit: in Project Management click once on the desired project unit folder to highlight it. The Macro Plot window opens. The numbered sections correspond to the functions in the Macro Plot window, described below. Select New > Macro Plot. 1. Add Identity information for the new macro plot.
• Name. Add a meaningful name for the macro plot. For example: MSC-G06E-001 MSC=Mississippi Sandhill Crane NWR G06E=Treatment Unit 001=Plot ID
• Type. Use the dropdown menu to select the appropriate plot type. • Purpose. Briefly describe the purpose of the plot.
2. To assign the macro plot to a new or different project unit, click the Assign to project units button. Available project units will be listed in the Project Unit Selector. Check the appropriate checkboxes and click OK. Properties information for the new macro plot, using dropdown menus where provided to assign values. Site Characteristics:
• Elevation • Elevation Units • Azimuth • Aspect • Hill slope • Transect slope • Location: • UTM Easting • UTM Northing • UTM Zone • Datum • Error (m) • PDOP • Longitude (decimal degrees) • Latitude (decimal degrees)
Installation: • Install date - Enter the date when the macro plot was created. • Retire date - Enter a date when the macro plot will no longer be used. • Located by - Enter the name of the individual who located the macro plot.
3. In the Directions tab, enter direction and location data in the Start Point and Directions fields. 4. In the Metadata tab, enter metadata as appropriate. 5. In the Comments tab, add comments as appropriate. 6. In the User Variables tab, enter any additional notes or criteria that pertain to the macro plot. You can add up to eight strings of information.

- 36 -
7. Click Save to save the new macro plot.
9. Scheduling a Sampling Event In FFI, a sample event is the date of a sample event, treatment, or disturbance. The sample event is a specific point in time at which sampling is to be conducted, and identifies which sampling protocols are to be applied. This section explains how to schedule a sample event and assign the protocols to be used. To schedule a sample event, select the appropriate project unit and macro plot in the Project Management window. In the New menu at the top of the pane, select Sample Event. 1. Identity. Assign a Date for the event, using the dropdown calendar. The Macro Plot field fills in automatically with the macro plot name. 2. If desired, add User Variables (UV1) in the Properties pane. User variables can be simple notes or descriptors. In this context, they are not used for stratifying or filtering records. 3.Use the Protocols tab in the main Sample Event window to select the protocols to be used during the sample event:
• Click Add/Remove Protocols to open the Protocol Selector. Scroll through or filter the listing to locate the protocols you wish to assign to the sample event.
• Highlight the desired protocol and either double-click or use the >> button. • Click OK when all applicable protocols have been added to the sample event.
NOTE: To store photos associated with a sample event, assign the Plot Description protocol to the event. See Using photos in FFI for more information.
4. In the Team tab in the main Sample Event window, identify the team scheduled to conduct the sample event.
5. Use the Comments tab in the main Sample Event window to enter any additional notes or information. 6. Click Save in the Sample Event window toolbar to save the scheduled sample event.
10. Photos in FFI You can file photographs taken during sample events and link them to your macro plot using the Plot Description protocol. About Naming and filing photos When naming your photos, be as descriptive as possible. A photo named plot1.jpg is difficult to tie to plot data. Instead, try something like Refuge_TreatmentUnit_Macroplot_Date_Dir. For example, CarolinaSandhills_15_001_Jun1013_North.jpg would be a photo of plot 1, facing north, on Treatment Unit 15, macroplot 001 on Carolina Sandhills NWR taken on June 10, 2013. Choose whatever format works best for you, but be sure to record the format in your project metadata so photos can be located at a later date. Store plot photos in the C:\FFI\Photos subdirectory. You can capture digital images at every sample visit and store their location and file names in the FFI database. To link photos, assign the Plot Description protocol to the sample event. When you go to the Plot Description form for the sample event in Data Entry and Edit, you can link ten photos using the hyperlink fields in Plot Photos.
11. Data Entry To enter data for a completed sample event: 1. With Data Entry and Edit navigation bar selected click a sample event in the tree view to open the Data Entry and Edit Details window. 2. In the Data Entry and Edit Details window, select a protocol data collection tab to work with.

- 37 -
3. Begin to enter data by clicking in the first cell. Use the Tab key on your keyboard to move between cells. When you have completed entering data for the record hit the Enter key on your keyboard to begin a new row. Click Save when you are finished entering data on the current form.
V. RESULTS REPORTING For every treatment implemented, Level 1 - Core Data elements will be entered into FMIS. This data will serve as a general summary and reporting format for every treatment implemented. For Level 2 –Immediate Response Monitoring variables all information collected will be entered into FFI with the exception of photo monitoring data and burn severity maps. The Reports and Analysis Tool in FFI will be used to describe and produce general summaries and reports for immediate treatment effects. Reports will be submitted at the end of each fiscal year.
A. Creating Reports In FFI, you can create data summary reports for a project unit based on the standard FFI protocols or other protocols that you have imported. Reports can be printed, or exported as comma delimited, Excel, Acrobat PDF or Microsoft Word files.
To create a basic report:
1. Select Reports and Analysis navigation bar to open the Reports and Analysis Details window. 2. Select the desired project unit. The Monitoring Status Assignment window opens, listing all associated macro plots and sample events for the selected project unit. 3. Using the dropdown lists, assign the appropriate monitoring status for each sample event to be analyzed. Click Save when finished. NOTE: A monitoring status can be set for only one sample event per macro plot. 4. Using the Settings tab, you can select report options.
• Use the Stratify by: dropdown to select stratification criteria, if desired. • Select either English or metric Report Units. • Select the desired data summary report in the Report Settings tab.
NOTE: For information on the data summary reports available in FFI • In the Included Monitoring Statuses tab, unselect any monitoring statuses that you
do not wish to include in the report. • In the Included Macro Plots tab, unselect any macro plots that you do not wish to
include in the report. 5. To view the report, click View Report in the Report dropdown. NOTE: Reports can also be saved as .csv files. The comma delimited files are easier to work with in Excel because they do not have multiple row headers or merged cells.
B. Annual Reporting
• Complete monitoring Accomplishment Table (Table 9 below).
• Complete Photopoint Monitoring Report - See Section III.F.

- 38 -
• Submit Accomplishment Report annually including: 1) Accomplishment Table, 2) Back-up copy of FFI, and 3) Photopoint Monitoring Report to Regional Fire Ecologist ([email protected]) or Regional I&M Botanist ([email protected]).
Table 9. Annual Monitoring Accomplishment Table.
Protocol Number of Sampling Events Completed
Location of Data (FMIS, FFI, Local, Other)
Core Data Fuel Moisture Fire Weather Fire Behavior
Smoke Surface Fuels - FWD and
CWD
Surface Fuels-Duff and Litter
Surface Fuels-Vegetation Burn Severity Photopoints
C. Measuring Success The level of success or failure of a fuels treatment is dependent on a well-defined monitoring objective tied to the overall refuge management objectives. A well-defined monitoring objective must be quantifiable, i.e., Specific, Measurable, Achievable, Realistic and include a Time Frame for the desired change (SMART criteria). To assist with measuring the performance of a treatment, FFI has developed a Reports and Analysis Tool that creates a general report of fuels conditions before and after treatment. In addition, simple statistical analysis can be performed if adequate sampling has occurred.
In general, analysis of the monitoring data and post treatment report for every treatment monitored should address the following:
1. How were the fuels and fire behavior altered by the fuels treatment? Consider all components of fuels structure, fire behavior, and burn severity.
2. What was the objective of the fuels treatment and was it accomplished? To what degree? Recommendations for future treatments?
3. Did the monitoring objective follow SMART criteria? Does it need revision?
In answering these questions the adaptive management process of planning, action, monitoring, evaluation and adjustment will be followed, and further understandings of management actions will be provided from monitoring data.
- 39 -
VI. REFERENCES Brown, J.K. 1974. Handbook for inventorying downed woody material. U.S. Department of Agriculture, Forest Service. Intermountain Forest and Range Experiment Station, INT-GTR-16, 24 pp.
Brown, J.K., Oberheu, R.D., and Johnston, C.M. 1982. Handbook for inventorying surface fuels and biomass in the Interior West. U.S. Department of Agriculture, Forest Service. Intermountain Forest and Range Experiment Station, INT-GTR-129, 48 pp.
Daubenmire, R. 1959. A canopy-coverage method of vegetational analysis. Northwest Sci. 33:43-64.
FEAT / FIREMON Integrated (FFI) User Guide. 2012. URL Access 10/25/2012: http://www.frames.gov/partner-sites/ffi/software-and-manuals/
Lutes, D.C., Keane, R.E., Caratti, J.F., Key, C.H., Benson, N.C.. Sutherland, S., Gangi, L.J. 2006. FIREMON: Fire Effects Monitoring and Inventory System. U.S. Department of Agriculture, Forest Service. Rocky Mountain Research Station, RMRS-GTR-164-CD, 400 pp. Website: http://www.frames.gov/partner-sites/firemon/sampling-methods/
Pollet, J. and Brown, A. 2007. Fuel moisture sampling guide. Bureau of Land Management, Utah State Office, Salt Lake City, UT. URT Access 10/31/2012: http://72.32.186.224/nfmd/references/fmg.pdf
U.S. Fish and Wildlife Service. 2004. Writing Refuge Management Goals and Objectives: A Handbook. US Department of Interior, US Fish and Wildlife Service, Washington, DC 34 pp.
U.S. Fish and Wildlife Service. 2013. Monitoring Hazardous Fuels Treatments: Southeast Regional Plan. Southeast Regional Office, Atlanta, GA. 19 pp.

40
VII. APPENDICES
A. Field Datasheets
A.1. Macroplot Data

41
A.2. Level 1 Core Data
Core Elements / Source Entry
USFWS Unit Name
USFWS Unit Location
Management Activity Name
Management Activity Type
Management Activity Location
Management Activity #
Management Activity Size, acres
Objective(s)
Fire Regime
Dominant Fuel Model
Initiation Date and Time
Completion Date and Time
Qualitative Narrative
Comments (pictures, additional info, etc.)
Contact Information

42
A.3. Fuel Moisture Content Form Agency State Field Office Site Name/Number
Collection Record Moisture Determination Record Observer Date Time Observer Date in oven Time put in oven
Container Number Species
(Live)(Dead) Size Class
A B C D E F Gross
Weight Tare Weight
Water Weight Dry
Weight Percent Moisture Wet Dry
Sample Material Collected Calculation Summary
A - B = D B - C = E (D / E) * 100 = F Live Fuels [ ] Dead Fuels [ ]
Average of Samples =
Weather (Optional)
Dry Bulb _______ RH _______% Wet Bulb _______ Cloud Cover _______
Remarks:

43
A.4. Fire Behavior, Fuel Moisture, Weather, and Smoke

44
A.5. Dead/Downed Fine and Coarse Woody Debris

45

46
A.6. Duff/Litter

47
A.7. Live and Dead Standing Vegetation

48
A.8. Alternative Biomass Sampling in Marshes and Grasslands

49
A.9. Alternative Biomass Sampling Using Photo Series

50

51
A.10. Burn Severity (CBI)
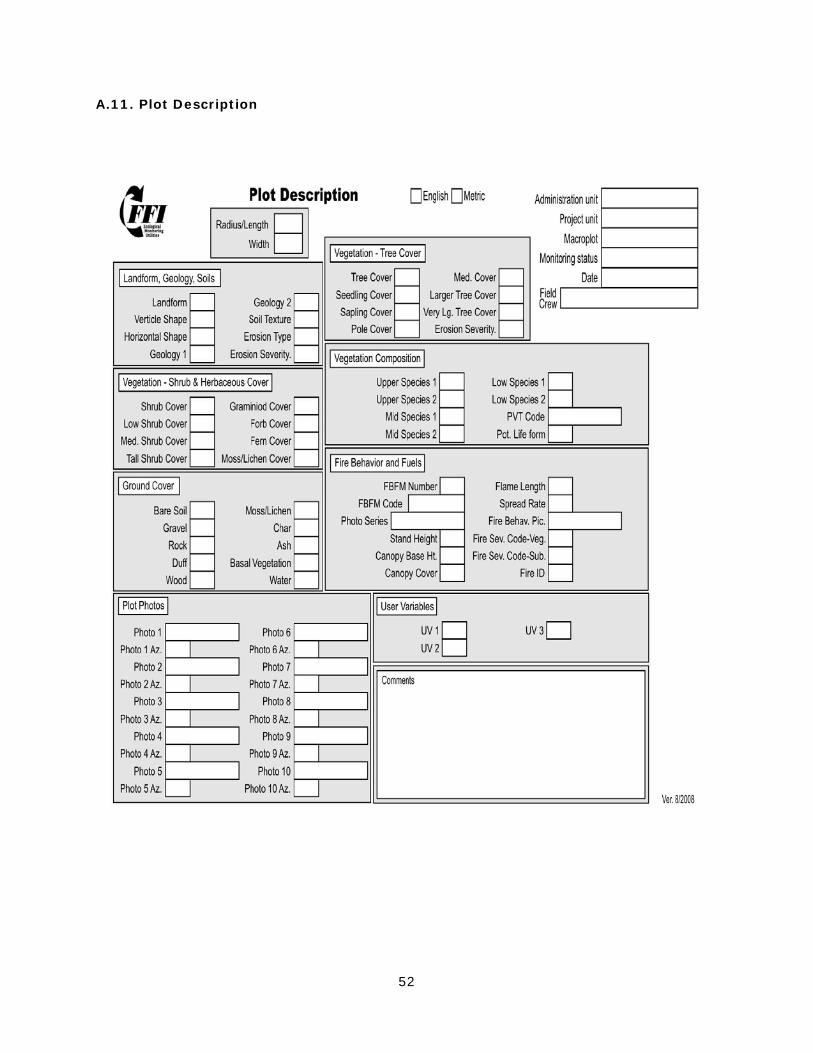
52
A.11. Plot Description
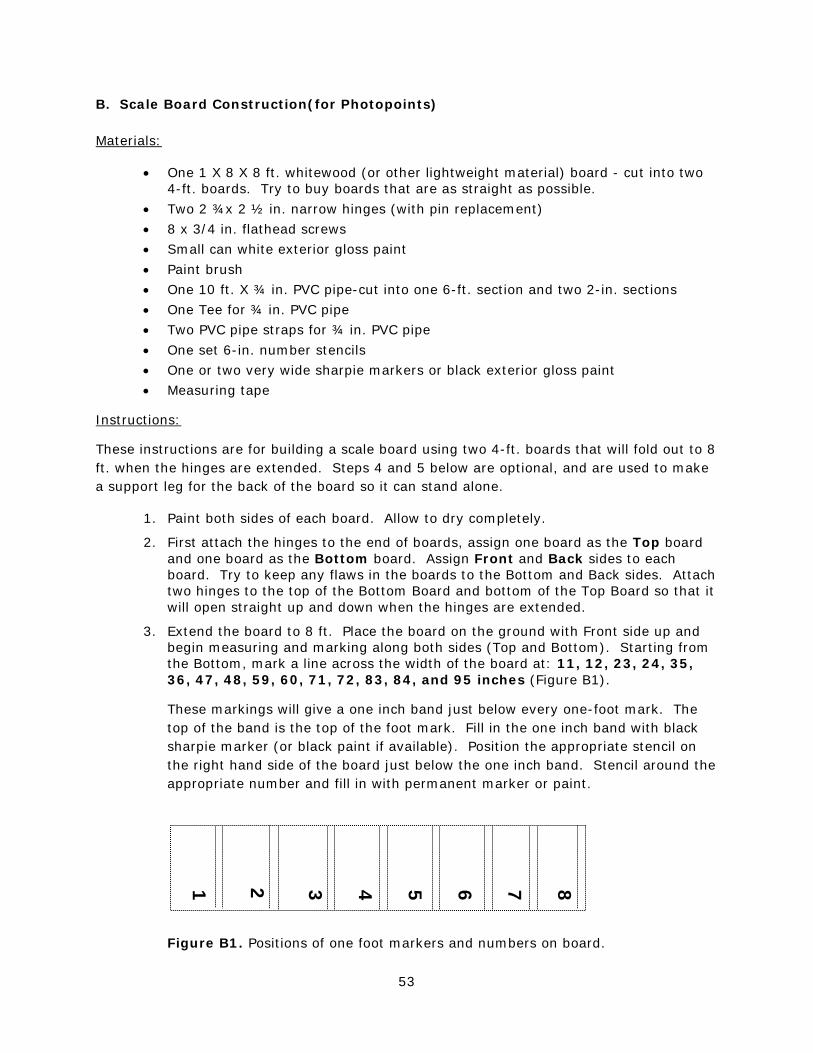
53
2 1 3 4 5 6 7 8
B. Scale Board Construction(for Photopoints) Materials:
• One 1 X 8 X 8 ft. whitewood (or other lightweight material) board - cut into two 4-ft. boards. Try to buy boards that are as straight as possible.
• Two 2 ¾x 2 ½ in. narrow hinges (with pin replacement) • 8 x 3/4 in. flathead screws • Small can white exterior gloss paint • Paint brush • One 10 ft. X ¾ in. PVC pipe-cut into one 6-ft. section and two 2-in. sections • One Tee for ¾ in. PVC pipe • Two PVC pipe straps for ¾ in. PVC pipe • One set 6-in. number stencils • One or two very wide sharpie markers or black exterior gloss paint • Measuring tape
Instructions:
These instructions are for building a scale board using two 4-ft. boards that will fold out to 8 ft. when the hinges are extended. Steps 4 and 5 below are optional, and are used to make a support leg for the back of the board so it can stand alone.
1. Paint both sides of each board. Allow to dry completely.
2. First attach the hinges to the end of boards, assign one board as the Top board and one board as the Bottom board. Assign Front and Back sides to each board. Try to keep any flaws in the boards to the Bottom and Back sides. Attach two hinges to the top of the Bottom Board and bottom of the Top Board so that it will open straight up and down when the hinges are extended.
3. Extend the board to 8 ft. Place the board on the ground with Front side up and begin measuring and marking along both sides (Top and Bottom). Starting from the Bottom, mark a line across the width of the board at: 11, 12, 23, 24, 35, 36, 47, 48, 59, 60, 71, 72, 83, 84, and 95 inches (Figure B1).
These markings will give a one inch band just below every one-foot mark. The top of the band is the top of the foot mark. Fill in the one inch band with black sharpie marker (or black paint if available). Position the appropriate stencil on the right hand side of the board just below the one inch band. Stencil around the appropriate number and fill in with permanent marker or paint.
Figure B1. Positions of one foot markers and numbers on board.

54
Optional:
4. Attach two 2-in PVC pipe pieces to the straight ends of the PVC tee.
5. In the middle of the Top Board on the Back, attach the tee with the two extensions to the board using the two PVC pipe straps.
When the 6 ft PVC pipe is attached to the tee, it should act as a leg to hold up the Top board back and give it some stability for it to stand on its own. Many modifications have been made to this arrangement. Add another tee to the end of the 6 ft PVC pipe and extend out the bottom of the pipe by one foot each side to give it more stability.

55
C. Photopoint Monitoring Report (example)
Macroplot ID BC20E001 Treatment Data Dec 2009
Pre-Burn Post-Burn Photo Date 3-24-2009 12-14-2009 Description/Direction North, East, South, West North, East, South, West Continuous Vertical Fuel Height
Understory 1-2 feet; shrubs 4-5 feet Understory 0-1 foot; dead standing shrubs 4-5 feet
Dominant Vegetation Grasses and bracken fern in understory; scattered shrubs, scattered longleaf pines
Grasses and bracken fern in understory; dead shrubs in midstory; scattered pines in overstory

56