monitoring global supply chains - harvard business …...
TRANSCRIPT

Strategic Management JournalStrat. Mgmt. J., 37: 1878–1897 (2016)
Published online EarlyView 21 September 2015 in Wiley Online Library (wileyonlinelibrary.com) DOI: 10.1002/smj.2417Received 9 February 2014; Final revision received 4 June 2015
MONITORING GLOBAL SUPPLY CHAINS
JODI L. SHORT,1* MICHAEL W. TOFFEL,2 and ANDREA R. HUGILL3
1 University of California Hastings College of the Law, San Francisco, California,U.S.A.2 Technology and Operations Management, Harvard Business School, Boston,Massachusetts, U.S.A.3 Strategy, Harvard Business School, Boston, Massachusetts, U.S.A.
Research summary: Firms seeking to avoid reputational spillovers that can arise from dangerous,illegal, and unethical behavior at supply chain factories are increasingly relying on private socialauditors to provide strategic information about suppliers’ conduct. But little is known about whatinfluences auditors’ ability to identify and report problems. Our analysis of nearly 17,000 supplieraudits reveals that auditors report fewer violations when individual auditors have audited thefactory before, when audit teams are less experienced or less trained, when audit teams are allmale, and when audits are paid for by the audited supplier. This first comprehensive and systematicanalysis of supply chain monitoring identifies previously overlooked transaction costs and suggestsstrategies to develop governance structures to mitigate reputational risks by reducing informationasymmetries in supply chains.
Managerial summary: Firms reliant on supply chains to manufacture their goods risk reputationalharm if the working conditions in those factories are revealed to be dangerous, illegal, or otherwiseproblematic. While firms are increasingly relying on private-sector “social auditors” to assessfactory conditions, little has been known about the accuracy of those assessments. We analyzednearly 17,000 code-of-conduct audits conducted at nearly 6,000 suppliers around the world. Wefound that audits yield fewer violations when the audit team has been at that particular supplierbefore, when audit teams are less experienced or less trained, when audit teams are all male, andwhen the audits were paid for by the supplier instead of by the buyer. We describe implications forfirms relying on social auditors and for auditing firms. Copyright © 2015 John Wiley & Sons,Ltd.
INTRODUCTION
Reputation is a key strategic concern for modernfirms (Roberts and Dowling, 2002) and environ-mental, social, and governance (ESG) performancehas become an increasingly important dimensionof firm reputation. Poor ESG practices may makefirms targets for activists, harming their reputa-tions as well as their bottom lines (King and Soule,2007), and firms are increasingly held accountable
Keywords: monitoring; transaction cost economics; audit-ing; supply chains; corporate social responsibility*Correspondence to: Jodi L. Short, UC Hastings College of theLaw, 200 McAllister Street, San Francisco, CA 94102, U.S.A.E-mail: [email protected]
Copyright © 2015 John Wiley & Sons, Ltd.
by financial analysts and investors for ESG per-formance (Ioannou, 2014). Furthermore, firms thatmislead stakeholders about their ESG performancethrough inaccurate disclosures may find their repu-tations tarnished (Fombrun, Gardberg, and Barnett,2000).
As firms continue to outsource production glob-ally, their reputations have come to depend notsolely on their own practices but also on thoseof the companies in their extended supply chains(Heide, Kumar, and Wathne, 2014), bringing therisk of reputational spillover costs from these trans-actions. That risk is particularly high when pro-duction is outsourced to countries where labor andenvironmental standards are so low that supplierscommonly take “unwarranted risks in their project

Monitoring Global Supply Chains 1879
execution . . . that the outsourcing principal wouldnever tolerate if it kept control of the activity” (Geis,2007: 979). For instance, when the Rana Plazabuilding collapsed in Bangladesh, killing 1,100 fac-tory workers, the bulk of media, consumer, andactivist scrutiny focused not on the suppliers whoused the building but on the global retailers thatsourced from them (Greenhouse, 2013a). Many ofthese global retailers were under such intense repu-tational pressure that they agreed to adopt a legallybinding agreement to spend hundreds of millions ofdollars to fund fire-safety and structural improve-ments in the factories of their Bangladeshi suppliers(Greenhouse, 2013b).
The logic of transaction cost economics (TCE)predicts that firms will vertically integrate activ-ities that pose substantial risks to their reputa-tions so that they have more control over execu-tion (Mayer, 2006; Mayer, Nickerson, and Owan,2004; Nickerson and Silverman, 2003). However,because the potential production-cost economies ofglobal outsourcing are so significant, most firmscontinue to contract out to risky suppliers andhave sought to contain reputational spillover coststhrough intensive supplier monitoring programsthat contractually impose ESG standards and com-pliance inspections (Gereffi, Humphrey, and Stur-geon, 2005; Mayer et al., 2004; Montiel, Husted,and Christmann, 2012).
Supplier monitoring is a transactional gover-nance mechanism designed to provide buyer firmswith information that can help them manage supplychain risk and make strategic outsourcing decisions.However, it is not clear that buyer firms are get-ting complete and accurate information from theirsupply chain monitors (e.g., Esbenshade, 2004;Heras-Saizarbitoria and Boiral, 2013; O’Rourke,2002). For instance, in 2012, just weeks after socialauditors certified that a factory in Pakistan met theSA8000 working conditions standard created by arespected nonprofit, a fire there killed hundreds ofworkers, some of whom were trapped by lockedemergency exits and barred windows—clear viola-tions of that very standard (Walsh and Greenhouse,2012). When monitors fail to accurately assesssuppliers’ adherence to standards, they underminebuyer firms’ ability to make fully informed out-sourcing decisions and subject these firms to the riskof catastrophic reputational consequences.
Despite the importance of supply chain monitorsto firms’ governance of reputational risk, little isknown about how such monitors do their jobs or the
validity of the information obtained through theirinspections (Mayer et al., 2004). To our knowledge,no empirical research has rigorously investigatedwhat factors shape supply chain monitors’ assess-ments of supplier adherence to standards. We seekto fill that gap. Grounding our work in the transac-tion cost economics literature and drawing insightsfrom research on regulatory compliance, financialauditing, and bounded rationality, we argue thatmonitors are not merely objective conduits of infor-mation, but instead that the information they collectand transmit is shaped by a variety of social relation-ships, institutions, and identities. This has importantimplications for outsourcing firms, because het-erogeneity in auditor assessment may underminethe efficacy of the governance structures they haveput into place to contain the costs of reputationalspillovers.
We test our hypotheses in the context of socialauditing for compliance with labor standards con-tained in contractually imposed supplier codes ofconduct. This form of private supply chain mon-itoring has been adopted by thousands of promi-nent multinational corporations (MNCs), includingall U.S. Fortune 500 companies (McBarnet, 2007),yet to our knowledge it has not been addressed inthe TCE literature. We exploit a novel dataset drawnfrom thousands of audits for code-of-conduct com-pliance conducted in 66 countries by one of theworld’s largest supply chain auditing firms. We findthat auditors’ decisions are shaped by factors suchas ongoing client relationships, professional expe-rience, gender, and gender diversity. Specifically,supplier audits yield fewer violations when con-ducted by audit teams that include individual audi-tors who have audited that supplier before, whenaudit teams have less auditing experience and lessin-house audit-skills training, and when audit teamsconsist only of male auditors. Audits also yieldfewer violations when the audits are paid for bythe supplier as opposed to the buyer. These findingssignificantly broaden the prevailing understandingof the supply chain monitoring process and suggestways to design more effective monitoring regimes.
LITERATURE REVIEW
Decisions about outsourcing and supply chainmanagement have become increasingly criticalstrategic concerns (Alcacer and Oxley, 2014;Hult, Ketchen, and Arrfelt, 2007; Reitzig and
Copyright © 2015 John Wiley & Sons, Ltd. Strat. Mgmt. J., 37: 1878–1897 (2016)DOI: 10.1002/smj
1880 J. L. Short, M. W. Toffel, and A. R. Hugill
Wagner, 2010). Current concerns go beyond theparadigmatic “make or buy” dilemma (Williamson,1975) to complex strategic questions about whichsuppliers to buy from. Choosing wisely can enhancea firm’s value by, for instance, improving its finan-cial performance (Doig et al., 2001) or providingopportunities to develop knowledge (Alcacerand Oxley, 2014; Hult et al., 2007). On the otherhand, poor choices can subject firms to significantcosts, including remediation, legal liability, andreputational damage (O’Callaghan, 2007).
To reduce the reputational risks of outsourcingand to protect brand value, firms incur significanttransaction costs to monitor supplier behavior. Asa condition of doing business, most MNCs requiresuppliers to meet globally recognized standards inareas including environmental sustainability, work-ing conditions, and human rights (McBarnet, 2007),and many employ supply chain auditors to monitoradherence to these standards (Montiel et al., 2012).The TCE literature has long theorized that moni-toring is a key governance mechanism for reducingtransaction costs resulting from business partners’opportunistic exploitation of information asymme-tries (Eisenhardt, 1985; Heide et al., 2014). Studieshave found that stringent monitoring is particularlyimportant when opportunism by one party threatensto impose reputational spillover costs on the other(Mayer et al., 2004). In theory, monitoring con-strains opportunism and mitigates spillover costs byreducing information asymmetry (Heide, Wathne,and Rokkan, 2007). The theory assumes, however,that the information firms obtain from their moni-tors is accurate and complete.
This may not always be the case. First, just asbounded rationality constrains transacting parties’ability to foresee and plan for contingencies thatmight arise over the course of a business relation-ship, it is also likely to constrain monitors’ ability toidentify and communicate information about supplychain conditions. Second, many firms that have out-sourced production to global supply chain partnershave likewise outsourced the monitoring of thosetransactions to private, third-party social auditors.This additional layer of contractual relationshipsintroduces the potential for agency problems intomonitoring structures, because third-party moni-tors’ incentives may not always be aligned withthe buyer firm’s incentives (Khalil and Lawarrée,2006). Indeed, research has demonstrated that pri-vate, third-party monitors are more lax in enforcingthe rules imposed by their principal when a stringent
approach could undermine their own opportunitiesfor profit (Montiel et al., 2012; Pierce and Toffel,2013). Consequently, firms that have outsourced thegovernance of their outsourced transactions mustalso consider how to monitor their monitors.
Despite monitoring’s central role in reducingtransaction costs, TCE and supply chain standardsresearch has shed little light on how it works inpractice and what factors contribute to the gener-ation of reliable information (Mayer et al., 2004).TCE studies of monitoring have tended to focus on“ex ante safeguards to deter ex post opportunism”(Williamson, 2008: 6) and facilitate monitoring,including contractual provisions (e.g., Argyres,Bercovitz, and Mayer, 2007; Barthélemy andQuélin, 2006), technological capabilities (Mayerand Salomon, 2006), and a shared knowledge base(Heide et al., 2014). Only a few studies investigatehow this governance structure is put into practiceand, to our knowledge, none addresses factors asso-ciated with the reliability of information obtainedthrough monitoring. Mayer et al. (2004), forinstance, find that firms are more likely to inspectsuppliers’ plants, production processes, and physi-cal output when there is a substantial risk of reputa-tional spillover. Handley and Gray (2013) establishthrough survey data that suppliers subjected to morefrequent quality monitoring are more likely to per-ceive that the buyer has expectations of high quality.
The most extensive analysis of private supplychain standards has been in the organizational andoperations literatures, which document how thesestandards are developed (Wood, 2004), why theyare adopted (e.g., Delmas and Toffel, 2008; Shortand Toffel, 2008; Terlaak and King, 2006), andtheir financial, operational, and compliance out-comes (e.g., Esbenshade, 2004; King and Lenox,2001; Kocer and Fransen, 2009; Levine and Toffel,2010; Locke, Rissing, and Pal, 2013; Potoski andPrakash, 2005; Rodríguez-Garavito, 2005; Shortand Toffel, 2010; Terlaak and King, 2006; Toffeland Short, 2011). This extensive body of researchtacitly assumes a pivotal role for private auditors,but provides little insight into how they play thatrole (Heras-Saizarbitoria and Boiral, 2013).
A few empirical studies have investigatedinfluences on private-sector auditor performance,but have focused almost exclusively on economicconflicts of interest. For example, research findsthat auditors are more lax when monitoring theirown paying clients (e.g., Duflo et al., 2013; Jiang,Stanford, and Xie, 2012; Kinney, Palmrose, and
Copyright © 2015 John Wiley & Sons, Ltd. Strat. Mgmt. J., 37: 1878–1897 (2016)DOI: 10.1002/smj
Monitoring Global Supply Chains 1881
Scholz, 2004), facing more competition (Bennettet al., 2013), enjoying lucrative cross-selling oppor-tunities (Pierce and Toffel, 2013), or operatingin corrupt environments in which they are morelikely to receive side payments from audited firms(Montiel et al., 2012). Based on such findings,the literature has assumed that profit is the privateauditor’s dominant, if not exclusive, motive (Baz-erman, Morgan, and Loewenstein, 1997; Mooreet al., 2006; Partnoy, 2006).
While it is crucial to understand how conflictsof interest affect the quality of information gener-ated through monitoring, our study seeks to movebeyond economic incentives to investigate howsocial institutions and relationships shape and con-strain the performance of monitoring functions.These influences are well established in related lit-eratures, but they have yet to shed light on howmonitoring functions as a governance structuresupporting outsourced production. TCE’s founda-tional assumption is that transacting parties are con-strained by bounded rationality (Williamson, 1979),but it has failed to consider how bounded rational-ity likewise constrains those who do the monitoring.Research on public regulatory implementation sug-gests that government monitors are constrained bybounded rationality. For instance, studies documentsignificant heterogeneity in the way governmentinspectors apply the rules they are charged withenforcing (Feinstein, 1989; Hawkins, 1984; Lemleyand Sampat, 2012; Macher, Mayo, and Nickerson,2011), based on a variety of social factors (Lipsky,1980/2010; Piore, 2005; Schrank, 2009). Experi-mental studies in social psychology similarly revealthe influence of cognitive biases on the performanceof financial auditors (e.g., Asare, Trompeter, andWright, 2000; Tetlock, 1983). But these insightshave not been tested in the context of private sup-ply chain monitoring. We draw on these literaturesto develop hypotheses about the factors influenc-ing private supply chain auditors and to illuminatehow firms can structure governance arrangementsto maximize the reliability of the strategic infor-mation they receive about their suppliers throughmonitoring.
HYPOTHESES
Ongoing auditor–supplier relationships
The primary function of transactional governancestructures is to limit or “economiz[e] on bounded
rationality while simultaneously safeguarding thetransactions in question against the hazards ofopportunism” (Williamson, 1979: 245–6). How-ever, the implementation of governance structuresis itself constrained by bounded rationality and thussubject to opportunism. Many have theorized thatthe performance of monitors who repeatedly inspecta firm is likely to be shaped by cognitive biases andsocial pressures that influence the monitors’ detec-tion and citing of violations. Bounded rationalitylimits the number of issues an auditor can pursueduring any given audit (Jones, 2001; Simon, 1947).As Chugh and Bazerman (2007: 3) have argued,“bounded awareness” causes individuals to “overfo-cus on some information and fail to use other easilyavailable information.” Specifically, people tend tofocus on information that comports with the tacitknowledge they have gained through experience.Though tacit knowledge can be a useful resourcefor decision makers, “dependence on tacit knowl-edge can create bounds on their awareness” (Kumarand Chakrabarti, 2012: 940) that limit their abilityto perceive new issues.
These cognitive constraints are likely to bereinforced by social pressures and opportunism.Returning auditors may develop “cozy relation-ships” (Moore et al., 2006: 24) with an auditedfirm’s management that lead them to identify withand support its positions. In some circumstances,these relationships may go from cozy to corruptif familiarity between auditors and managementemboldens managers to pressure or even bribe audi-tors to report good results (Khalil and Lawarrée,2006; Montiel et al., 2012).
Empirical research has found that managers’awareness is bounded by experience. “Managersuse already established knowledge to determinewhat they see, and they use what they already knowto choose what to look for in their environment”(von Krogh, Roos, and Slocum, 1994: 58); such“perceptual and cognitive limitations” lead to errors(Huber and Power, 1985: 172). Empirical researchhas found that ongoing relationships between gov-ernment inspectors and inspected entities encouragea “benefit of the doubt” style of enforcement ratherthan an arms-length “policing” style (Bardach andKagan, 1982/2002), resulting in milder penalties(Muehlenbachs, Staubli, and Cohen, 2013). Weargue that private supply chain auditors will be sub-ject to similar social pressures and cognitive con-straints. If they repeatedly inspect the same supplier,they are more likely to focus on the domains they
Copyright © 2015 John Wiley & Sons, Ltd. Strat. Mgmt. J., 37: 1878–1897 (2016)DOI: 10.1002/smj

1882 J. L. Short, M. W. Toffel, and A. R. Hugill
highlighted previously and to align their perspec-tives with that of management, whereas a new auditteam would bring a fresh set of eyes and focus ondifferent issues, likely uncovering new violations.We therefore hypothesize:
Hypothesis 1 (H1): An audit will yield fewerviolations when conducted by an audit team thatincludes a member of the supplier’s previousaudit team.
Auditor tenure
Rationality can be bounded not only by cognitiveconstraints, but also by social structures, identities,and socialization (March and Olsen, 1998; Simon,1947). Auditors’ tenure on the job is associatedwith their level of professional knowledge, theirplace in the audit firm’s organizational hierarchy,and their professional self-concept. Scholars andactivists have argued that more experienced sup-ply chain auditors are more effective (Esbenshade,2004; Locke, Qin, and Brause, 2007). It is not clear,however, how experience affects the number of vio-lations cited in a given audit. On the one hand, expe-rience enhances auditors’ practical knowledge andthus their ability to identify violations, as has beendocumented in qualitative studies of governmentinspectors (Bardach and Kagan, 1982/2002). Ourinterviews with managers of social auditors indi-cate that experience acquaints auditors with “tricksof the trade” such as how to detect that a supplieruses child labor even if child workers are not presentduring the audit.
On the other hand, these initial marginal detec-tion gains from experience tend to diminish overtime and it is not clear that more experienced audi-tors will cite more violations even if they detectthem. Scholarship on government regulatory agen-cies has suggested that new inspectors tend toexhibit “a more policing, nit-picking attitude” thanmore seasoned inspectors (Bardach and Kagan,1982/2002: 129). Inexperienced inspectors “knowtoo little about the industries and operations theyare inspecting” and thus “lack the confidence toevaluate actual levels of risk” posed by particularviolations, so they tend to go by the book and citeeverything (Bardach and Kagan, 1982/2002: 129).Experienced inspectors, by contrast, may declineto cite violations lacking the requisite level of riskand culpability as they gain more confidence intheir professional judgment (Bardach and Kagan,
1982/2002; Hawkins, 1984). We therefore expectthat violation counts will initially rise with auditortenure, as auditors gain the experience to detect vio-lations, but that this effect will be tempered as thebenefits of experience attenuate and as experiencedauditors gain the confidence to exercise more dis-cretion about which violations to cite.
Hypothesis 2 (H2): Audits conducted by moreexperienced auditor teams will yield more vio-lations but at a decreasing rate.
Professionalization
Education and training are important sources ofprofessional socialization that should impart tomonitors both the skills to detect more viola-tions and the sense of professional obligation toreport violations to their principal (March andOlsen, 1998). Sociologists have long theorizedthat professionalization—specialized educationand training in a field’s skills and values—is akey constraint on individual discretion in bothcorporate and government bureaucracies (Abbott,1988; Scott, 1966). Lipsky (1980/2010: 201), forinstance, has argued that enhanced profession-alism rationalizes the way front-line workers ingovernment bureaucracies exercise discretion:“[S]treet-level bureaucrats should be professionalswhose relatively altruistic behavior, high standards,and self-monitoring substitute for what the societycannot dictate. Who will watch the watchmen?The watchmen will watch themselves.” Scholarshave also suggested that professionalism can helpinternal corporate compliance monitors at for-profitfirms resist the influence of economic pressures andperform their oversight functions more effectively(Parker, 1999). Research has demonstrated thatprofessionalization can improve the efficacy ofgovernment labor inspectors (Piore, 2005; Schrank,2009). We therefore expect that teams whoseauditors are more professionalized will recordmore violations.
Hypothesis 3 (H3): Audits conducted by teamsthat include auditors who are more professional-ized will yield more violations.
Gender
Research has suggested that, even when constrainedby bureaucratic rules and roles, men and women
Copyright © 2015 John Wiley & Sons, Ltd. Strat. Mgmt. J., 37: 1878–1897 (2016)DOI: 10.1002/smj

Monitoring Global Supply Chains 1883
may perform their work “somewhat differently”(Eagly and Johannesen-Schmindt, 2001: 783). Sev-eral gender-based behavioral distinctions docu-mented in the literature can influence whethersocial auditors discover—and also whether theycite—violations. Research has shown that womenare more persistent at pursuing assigned tasks(Spence and Buckner, 2000; Stonewater, Eveslage,and Dingerson, 1990), potentially motivating themto search more diligently for violations. Researchhas also found that women have perceptual andintegrative processing advantages that may enhancetheir ability to detect violations. For example,women have been found to be more skilled at inter-preting the emotional content of others’ expressions(Killgore and Cupp, 2002; Thayer and Johnsen,2000) and to be “more sensitive to subtle stimu-lus” (Darley and Smith, 1995: 43). Research hasalso found that women tend to use a more compre-hensive information-processing style, whereby they“attempt to assimilate all available cues” (Darleyand Smith, 1995: 43). According to Gold, Hunton,and Gomaa (2009: 3):
[W]omen tend to integrate more of the avail-able evidential cues into their judgments,reflecting an intense level of cognitive pro-cessing. Men, on the other hand, tend to elim-inate what they deem to be irrelevant cues andfocus on a limited set of salient pieces of infor-mation that are relatively easy and quick toprocess.
Thus, women’s style of gathering and processinginformation may better equip them to perceiveviolations in a complex factory setting and to elicitinformation about violations from employees.
Moreover, research suggests that women aremore likely to cite the violations they perceive.Women in bureaucratic organizations are morelikely than men to be strict rule followers (Oberfield,2010; Portillo, 2012; Portillo and DeHart-Davis,2009). A long line of sociological scholarship hasargued generally that “rules are a means of assert-ing power for the less powerful” (Portillo, 2012:91) and that low-status members of organizationsuse rules as a source of authority to compensatefor their lack of personal authority (Green and Mel-nick, 1950; Thompson, 1977). Although we knowof no research on women’s status in supply chainauditing, research on financial auditors and audit
firms suggests that, even as many women haveentered that profession, masculine organizationalcultures still tend to devalue women’s contribu-tions (Haynes, 2012; Jonnergård, Stafsudd, and Elg,2010). Empirical studies of government workersfind that women do indeed “go by the book” (Greenand Melnick, 1950; Portillo, 2012; Portillo andDeHart-Davis, 2009) more strictly than their malecolleagues do. This evidence suggests that supplychain auditors’ gender will influence whether theydetect and cite violations.
Hypothesis 4 (H4): Audits conducted byall-female teams will yield more violations thanthose conducted by all-male teams.
Gender diversity
Supply chain auditing teams are not necessarily allmale or all female. In the organizational literatureon teams, there is significant debate about theeffects of diversity, including gender diversity, onteam performance (Joshi and Roh, 2009; Phillipset al., 2012). We expect that mixed-gender auditteams will exhibit superior performance becausethey benefit from the complementarity of men’sand women’s different perceptual styles andfrom performance-enhancing interpersonal teamdynamics.
First, women’s and men’s different perceptualstyles may cause them to identify different typesof violations, enabling mixed-gender teams to findmore. This should be particularly valuable in elicit-ing information from a diverse set of employees andmanagers. Research has demonstrated that “diver-sity in groups increases the likelihood that therewill be access to different information in a group”(Phillips et al., 2012: 161). Our interviews withsocial auditors indicate that audited factories tendto have predominantly female workers and predom-inantly male managers and that the female workersare more likely to communicate openly with femaleauditors, while, as one interviewee put it, male sup-plier managers, “for cultural reasons, may find itdifficult … to open up to women.”1
Second, research has shown how the interper-sonal dynamics of gender diversity can improveteam performance. For instance, studies find thatpeople on socially diverse teams tend to prepare
1 Personal interview with authors conducted September 2013.
Copyright © 2015 John Wiley & Sons, Ltd. Strat. Mgmt. J., 37: 1878–1897 (2016)DOI: 10.1002/smj
1884 J. L. Short, M. W. Toffel, and A. R. Hugill
more thoroughly and to think through a broaderrange of issues (Loyd et al., 2013). Fenwickand Neal report the superior performance ofgender-diverse teams in management-simulationexercises, crediting it to the “mix of male andfemale operating, decision-making and leadershipstyles” (Fenwick and Neal, 2001: 217). Further-more, men on mixed teams may work harder ifthey sense they are being outperformed by women.Studies have shown that lower performing teammembers often compare themselves to betterperformers and that this motivates them to improvetheir performance to equal or exceed that of thestronger performers (Lount and Phillips, 2007;Weber, Wittchen, and Hertel, 2009). Weber et al.(2009) demonstrate that men are particularly proneto such competitive behavior. Male auditors maytherefore feel compelled to match or beat theirfemale teammates’ higher citation rates.
Although some evidence suggests that genderdiversity can sometimes undermine team perfor-mance (Phillips et al., 2012), a recent meta-studyfound that gender diversity is particularly likely toenhance performance in service industries, whereteam members interact directly with their clientsand their clients’ employees (Joshi and Roh, 2009).Because supply chain auditing is a service industryand auditors interact extensively with the employeesof the firms they audit, we expect gender diversityto improve team performance.
Hypothesis 5 (H5): Audits conducted bygender-diverse teams will yield more violationsthan those conducted by single-gender teams.
DATA AND MEASURES
Empirical context and sample
To test our hypotheses, we obtained data for thou-sands of code-of-conduct audits conducted between2004 and 2009 by one of the world’s largest socialauditing companies.2 During that period, the com-pany, which already had more than a decade’s expe-rience, employed several hundred people in manycountries; they spoke more than 30 languages.
The dataset contains audit results for and infor-mation about each audited supplier, including its
2 The company required anonymity as a condition of sharing itsdata with us.
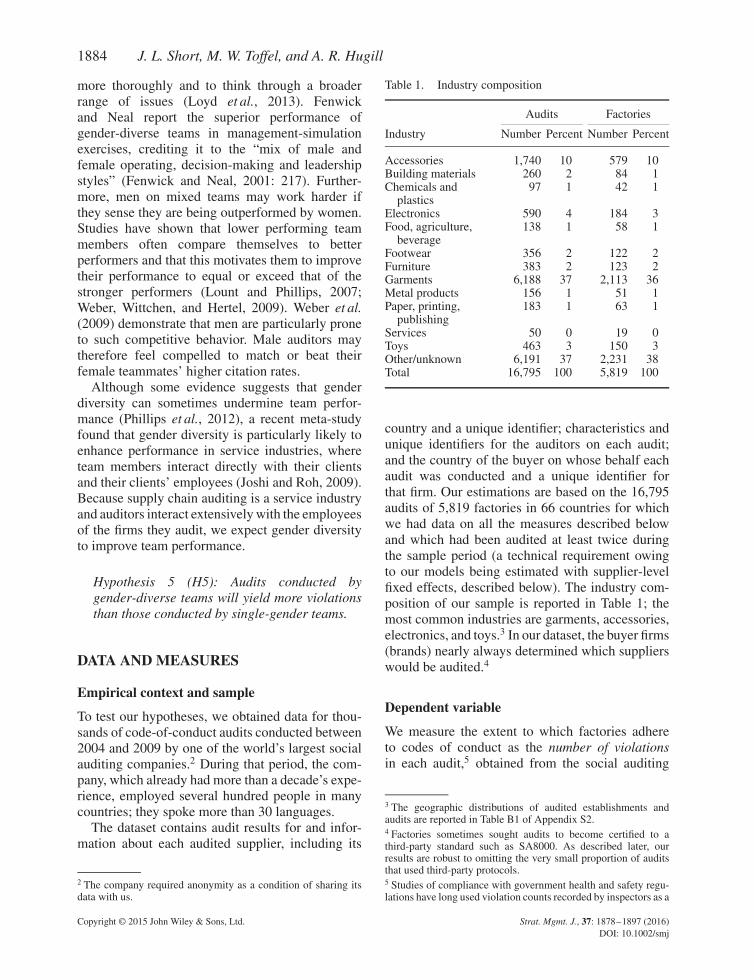
Table 1. Industry composition
Audits Factories
Industry Number Percent Number Percent
Accessories 1,740 10 579 10Building materials 260 2 84 1Chemicals and
plastics97 1 42 1
Electronics 590 4 184 3Food, agriculture,
beverage138 1 58 1
Footwear 356 2 122 2Furniture 383 2 123 2Garments 6,188 37 2,113 36Metal products 156 1 51 1Paper, printing,
publishing183 1 63 1
Services 50 0 19 0Toys 463 3 150 3Other/unknown 6,191 37 2,231 38Total 16,795 100 5,819 100
country and a unique identifier; characteristics andunique identifiers for the auditors on each audit;and the country of the buyer on whose behalf eachaudit was conducted and a unique identifier forthat firm. Our estimations are based on the 16,795audits of 5,819 factories in 66 countries for whichwe had data on all the measures described belowand which had been audited at least twice duringthe sample period (a technical requirement owingto our models being estimated with supplier-levelfixed effects, described below). The industry com-position of our sample is reported in Table 1; themost common industries are garments, accessories,electronics, and toys.3 In our dataset, the buyer firms(brands) nearly always determined which supplierswould be audited.4
Dependent variable
We measure the extent to which factories adhereto codes of conduct as the number of violationsin each audit,5 obtained from the social auditing
3 The geographic distributions of audited establishments andaudits are reported in Table B1 of Appendix S2.4 Factories sometimes sought audits to become certified to athird-party standard such as SA8000. As described later, ourresults are robust to omitting the very small proportion of auditsthat used third-party protocols.5 Studies of compliance with government health and safety regu-lations have long used violation counts recorded by inspectors as a
Copyright © 2015 John Wiley & Sons, Ltd. Strat. Mgmt. J., 37: 1878–1897 (2016)DOI: 10.1002/smj

Monitoring Global Supply Chains 1885
firm’s database. We include only the types of vio-lations that, according to the social auditing firm(hereafter referred to as “the auditing firm”), applyin all industries and are interpreted by auditors inthe same way in all countries; namely, violationsof rules for child labor, forced or compulsory labor,working hours, occupational health and safety, min-imum wage, treatment of foreign workers and sub-contractors, and disciplinary practices.6 During anaudit, the auditors code a common set of dichoto-mous indicators (violation or no violation) in eachcategory.7
Independent variables
To identify the potential for auditors’ relationshipswith audited suppliers to influence the auditors’performance, we coded previous auditor as 1 whenat least one member of the focal audit team hadparticipated in one of the supplier’s previous auditsduring the sample period and 0 otherwise.
We measure an auditor’s experience as his or heryears of service at the auditing firm based on datafrom the auditing firm’s database. We calculatedmaximum tenure as the highest number of years thatany member of the audit team had worked at theauditing firm.8
measure of compliance variation (Braithwaite and Makkai, 1991;Gray and Shadbegian, 2005) and more recent studies of suppliercompliance with private labor standards have used violation datarecorded by private auditors (Ang et al., 2012; Oka, 2010).6 We exclude other categories that, according to our auditorinterviews, are applied only to certain factories or are interpreteddifferently in different countries: the right of association, theright to organize and bargain collectively, legal client regulation,dormitory conditions, and canteen violations.7 The occupational health and safety category, for example,consists of seven indicators pertinent to emergency preparedness(blocked or locked aisles or exits, inadequate first-aid supplies,insufficient emergency exits, lack of emergency lighting, lack ofemployee emergency training, lack of an evacuation plan, andunmarked aisles), five indicators of fire safety, eight related totoilets, and eight related to the work floor.8 Using average tenure rather than the maximum tenure yieldednearly identical results. Tenure is measured as work experience atour focal firm, where audit team tenure averages nearly five years,audit team age averages 30 years old, and nearly all auditorshave at least a bachelor’s degree. Tenure at the focal firm isthus a reasonable proxy for the entire auditing experience ofmany auditors in our sample. To assess whether the potentialinfluence of unobserved auditing experience at prior employersmight be driving our tenure results, we re-estimated our primarymodel on the subsample of audits for which the influence of priorauditing experience is least likely a concern: those conductedby relatively young auditors. Results estimated on the subset ofaudits conducted by teams whose maximum age was no more than30 years old yielded coefficients on maximum tenure (𝛽 = 0.06,
We measure the professionalism of the auditteam in two ways. Because one important sourceof professionalization is “standardized formal train-ing in universities” (Lipsky, 1980/2010: 201), wecode graduate education as 1 when at least onemember of the audit team had a graduate degreeand 0 otherwise. We focused on graduate edu-cation because nearly all auditors in our datasethad a bachelor’s degree.9 We also created auditingskills training as the largest number of the auditingfirm’s training courses that any audit team mem-ber had completed. These courses teach skills suchas how to interpret national labor laws and howto detect payroll manipulation that might indicatewage violations.10
We measure gender composition with threedummy variables—all-female audit team, all-maleaudit team, and mixed-gender audit team.11
Control variables
Using the auditing firm’s database, we calculatedthe proportion of each team that had undergonecertification training—training on the standardsand protocols of a particular certification regime,such as SA8000—because the firm indicated thatsuch training influences the scope of the audit andthe types of violation auditors look for. We alsocalculated the proportion of each team that hadundergone brand training—training provided bythe buyer on its corporate responsibility programand procedures—to account for possible variationin the stringency requested by different brands.
We created a proxy for each audit team’s averageage based on coarsened auditor age data provided bythe auditing firm. To keep precise ages confidential,
p= 0.01) and maximum tenure squared (𝛽 =−0.003, p= 0.04)that are statistically significant and are of the same sign as thoseyielded by our primary model. This bolsters our confidence thattenure, despite being measured only at our focal firm, significantlyinfluences audit results.9 We coded graduate education as a dichotomous variable ratherthan a continuous measure to reflect better the near-binary distri-bution in our sample: 87 percent of the audit teams had no mem-bers with a master’s degree, 7 percent had all members with amaster’s degree, and a mere 6 percent had an intermediate con-figuration.10 Using the average rather than the maximum number of trainingcourses yielded nearly identical results.11 We use these dummies rather than a continuous measure such asthe proportion of the audit team that is female because the databaseindicated that 97 percent of the audit teams in our sample wereall female, all male, or evenly divided. Thus, the three dummiesrepresent the distribution of our data.
Copyright © 2015 John Wiley & Sons, Ltd. Strat. Mgmt. J., 37: 1878–1897 (2016)DOI: 10.1002/smj

1886 J. L. Short, M. W. Toffel, and A. R. Hugill
the firm provided five-year age-range categories(for example, 20–24 years old) for each auditor. Wecalculated the midpoint for each category and thencreated average age as the average of the oldest andyoungest age-range categories on a team.12
We created a dummy variable to indicate whetheran audit was conducted according to a third-partyprotocol—such as that of the Business SocialCompliance Initiative (BSCI), the Initiative ClauseSociale (ICS), the Sedex Members Ethical TradeAudit (SMETA), the International Council ofToy Industries (ICTI), or Worldwide ResponsibleAccredited Production (WRAP).
We measure whether an audit is unannouncedor pre-announced, using a dummy variable, unan-nounced audit, coded 1 for an unannounced auditand 0 for a pre-announced audit.
To indicate which entity paid for each audit,13
we created two dichotomous variables based onthe auditing firm’s database. Audit paid for bysupplier or agent identifies audits with the potentialfor financial conflict of interest. It is coded 1 foraudits paid for by the audited supplier or by agents,vendors, or licensees and coded 0 for audits paid forby the buyer.14 Audit paid for by buyer is coded inthe opposite manner.
We include dummy variables to control for thenumber of auditors on each audit (2–5, with 1 asthe omitted category).
Based on the auditor’s database, we createda dummy variable to distinguish routine auditsfrom re-audits, which tend to have a narrowerfocus on those domains in which violations werepreviously identified. We created dummies to
12 Using the oldest team member’s age rather than the team’saverage age yielded nearly identical results.13 In our dataset, buyers nearly always determined whether theyor the supplier (or its agents) paid for an audit. Our interviewsindicated that this decision was not driven by the supplier’smanagerial attitude, violation rate, or improvement rate. Factoriessometimes sought and paid for audits when they sought to becomecertified to a third-party standard such as SA8000. As describedlater, our results are robust to omitting from the estimation samplethe very small proportion of audits that used third-party protocols.14 We combined these categories of payer because prior researchand our auditor interviews suggest that, in our empirical context,the financial incentives of factories and these intermediaries areclosely aligned. In developing economies, intermediaries’ role isto promote exports by domestic manufacturers by identifying newmarkets for their goods and services (Ellis, 2011) and by reducingtransaction cost barriers to export (Ahn, Khandelwal, and Wei,2011). Our results are robust to an alternative specification inwhich we include two dummies that control separately for auditspaid for by factories and audits paid for by agents, vendors, orlicensees.
indicate a supplier’s audit sequence—its secondaudit, third audit, and so on through sixth-or-higheraudit (because only five percent of the audits inour sample were the seventh or higher), with asupplier’s first audit as the omitted category.15
We measure a supplier country’s averageeconomic development in the year the auditwas conducted as its annual per-capita grossdomestic product (GDP) in 2005 dollars, calcu-lated by the U.S. Department of Agriculture’sEconomic Research Service (obtained fromhttp://www.ers.usda.gov). To reduce skew, weuse the log. To measure the extent to which thegovernment of the supplier’s country fosters aregulatory environment promoting economicdevelopment, we use the annual regulatory qualitymetric corresponding to the year the audit wasconducted, calculated by the World Bank’s World-wide Governance Indicators project (obtained fromhttp://data.worldbank.org/data-catalog/worldwide-governance-indicators) to capture “perceptionsof the ability of the government to formulate andimplement sound policies and regulations thatpermit and promote private sector development”(World Bank, 2013).16
We measure the extent of press freedom inthe supplier’s country the year the audit tookplace via the annual Press Freedom Index pro-duced by Reporters without Borders (obtainedfrom http://en.rsf.org). This index incorporates theextent to which journalists face direct and indirectthreats—including imprisonment, physical attacks,censorship, and self-censorship—and the num-ber of journalists detained, murdered, physicallyattacked, or threatened. We create annual press free-dom by reverse-coding the Press Freedom Index, sothat a higher score represents more press freedom,and then rescaling the result to range from 0 to 1.
Summary statistics are reported in Table 2.17
EMPIRICAL MODEL AND RESULTS
Our empirical model includes all independent andcontrol variables described above and three sets of
15 Using an audit sequence counter variable and its square ratherthan the dummies yielded nearly identical results.16 Controlling instead for supplier countries’ annual CorruptionPerceptions Index scores from Transparency International, whichare highly correlated with the World Bank’s regulatory qualitymetric (𝜌= 0.96), yields nearly identical results.17 Correlations are reported in Table B2 of Appendix S2.
Copyright © 2015 John Wiley & Sons, Ltd. Strat. Mgmt. J., 37: 1878–1897 (2016)DOI: 10.1002/smj

Monitoring Global Supply Chains 1887
Table 2. Summary statistics
Variable Mean SD Min Max
Number of violations 6.49 5.61 0 75Previous auditor 0.15 0.36 0 1Maximum tenure 5.39 2.03 1 15Average tenure 4.86 1.85 0.5 15Graduate education 0.13 0.34 0 1Auditing skills
training2.25 1.74 0 12
All-male audit team 0.33 0.47 0 1All-female audit team 0.50 0.50 0 1Mixed-gender audit
team0.17 0.37 0 1
Certification training 0.50 0.42 0 1Brand training 0.59 0.43 0 1Average age 30.12 4.47 22.5 59Maximum age 30.62 4.66 25 59Third-party protocol 0.04 0.19 0 1Unannounced audit 0.22 0.41 0 1Audit paid for by
supplier or agent0.56 0.50 0 1
Audit paid for bybuyer
0.44 0.50 0 1
Re-audit 0.36 0.48 0 1Number of auditors 1.79 0.58 1 5Audit sequence 2.96 2.25 1 21Per-capita GDP (log) 7.77 0.98 5.61 10.68Regulatory quality −0.04 0.54 −1.64 1.99Press freedom 0.33 0.27 0.12 1.00
Note: N= 16,795 audits except N= 15,812 for audit paid for bysupplier or agent and audit paid for by buyer, N= 11,337 foraverage age and maximum age, and N= 16,676 for press freedom.
fixed effects. Specifically, we estimate the followingmodel:
Yicdj = F(𝜷1Xid + 𝜷2𝝓id + 𝜷3𝝀cd + 𝜷4𝜶i
+𝜷5𝜹t + 𝜷6𝜸j + 𝜀icdj
),
where Yicdj refers to the number of violationsrecorded in the audit of supplier i in country cthat was conducted on date d on behalf of a buyerin country j. F (·) refers to the Poisson function.Xid refers to our hypothesized variables (previousauditor, maximum tenure, average tenure, graduateeducation, auditing skills training, all-male auditteam, all-female audit team, and mixed-genderaudit team).𝝓id refers to the audit-level control variables
described above. We control for certification train-ing and brand training because these types oftraining might influence an audit team’s ability todetect and report violations or the nature of theviolations it detects and reports and because prior
research has indicated that training can influencethe stringency of government monitors (Macheret al., 2011). We control for audit teams’ aver-age age and its square to ensure that the effectsof auditor tenure can be attributed to job experi-ence rather than to the life-cycle effects positedby human capital theory (Diamond, 1984), whichpredicts “an inverse U-shaped relationship betweenproductivity and age” (Teitelbaum, 2006: 166).We control for whether an audit was conductedaccording to a third-party protocol because suchprotocols might limit an auditor’s discretion. Wecontrol for whether an audit was an unannouncedaudit or an announced audit because the latter pro-vides several weeks of notice that might enablethe supplier to remedy violations before the audit.We include controls for which entity paid for theaudit (audit paid for by supplier or agent andaudit paid for by buyer) because research has indi-cated that financial conflicts of interest createdby audit fees undermine auditors’ and inspectors’stringency (Duflo et al., 2013; Moore et al., 2006;Partnoy, 2006). We also control for whether anaudit is a re-audit because those tend to focuson the domains in which violations were previ-ously identified and therefore can yield fewer vio-lations than routine audits. We include dummies tocontrol for the number of auditors because largeraudit teams are assigned to larger and more com-plex establishments and because prior research hasshown that larger teams of government inspectorscan lead to more stringent monitoring (Muehlen-bachs et al., 2013). We include dummies indi-cating the supplier’s audit sequence to controlfor the possibility that successive audits yieldfewer violations as factories address the issuesexposed.𝝀cd refers to the annual supplier-country con-
trol variables described above: per-capita GDP(log), regulatory quality, and press freedom.These country-level governmental, economic, andcivil-society attributes control for institutionalfactors that can influence a supplier’s compliancewith codes of conduct (Toffel, Short, and Ouellet,2015). 𝜸j refers to fixed effects for the headquarterscountry of the buyer firm (brand) on whose behalfeach audit was conducted. This controls for thepossibility that consumers and activist groups indifferent countries vary in their concern for andattentiveness to supply chain conditions, whichmight in turn affect how much pressure firmsheadquartered in those countries exert on their
Copyright © 2015 John Wiley & Sons, Ltd. Strat. Mgmt. J., 37: 1878–1897 (2016)DOI: 10.1002/smj
1888 J. L. Short, M. W. Toffel, and A. R. Hugill
supply chain auditors to audit stringently (Toffelet al., 2015). These fixed effects also control forall other time-invariant differences between theheadquarters countries’ institutional contexts.
We include fixed effects for each supplier (𝜶i) tocontrol for time-invariant characteristics that mightaffect its violation rate, such as size, age, industry,and national institutional context.18 Dummies forthe audit year (𝜹t) control for overall temporaltrends.
Our identification strategy is based on the factthat the process of assigning auditors to audit teamsis unrelated to our independent variables and thusis not a source of endogeneity that should biastheir coefficients. Specifically, our interviews withthe auditing firm indicated that assignments werebased on (1) language skills to communicate withmanagement and workers, (2) availability, and (3)the need for at least one team member to qualify asa lead auditor.19
Results
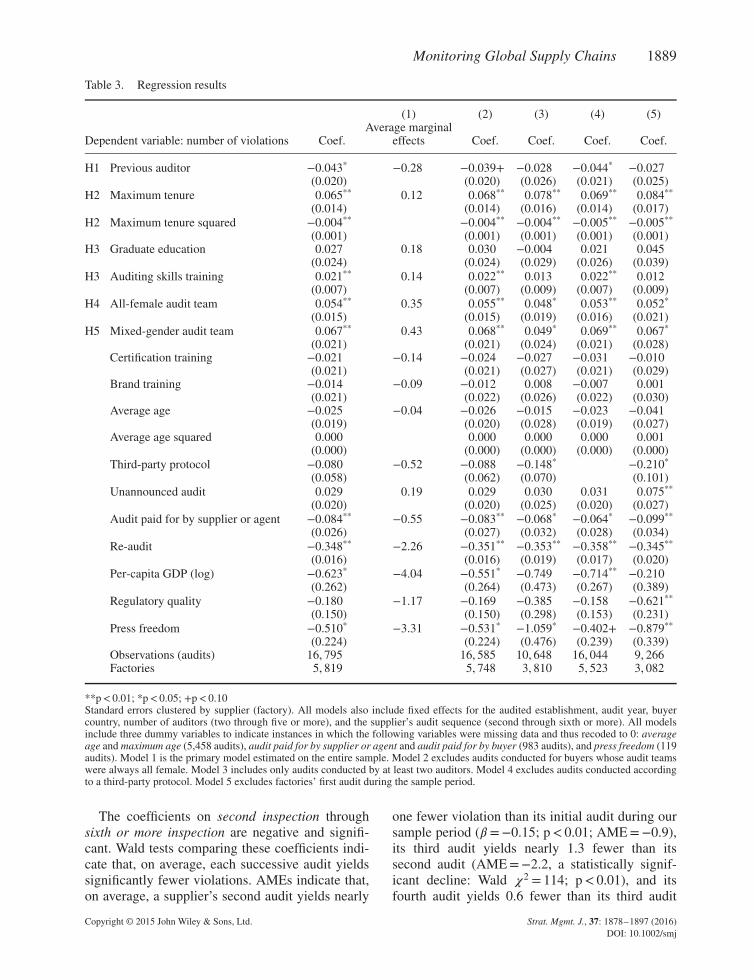
We estimate the model using Poisson regressionwith robust standard errors and report our resultsin Column 1 of Table 3. Negative binomial regres-sion with conditional fixed effects yields nearlyidentical results, indicating that our results are notsensitive to estimation technique. Variance infla-tion factors (VIF) were below 2 for all hypothe-sized variables and below 5 for all variables excepta few buyer-country dummies, which yields noevidence that multicollinearity is a serious con-cern. The explanatory power of the model is indi-cated by a McFadden’s R-squared value of 0.39and a McFadden’s adjusted R-squared value of0.30.
The significant negative coefficient on previousauditor (𝛽 =−0.04; p= 0.03; IRR= 0.96) indicatesthat audits yield four percent fewer violations whena team member had participated in a prior auditof the same supplier, which supports Hypothesis1. The average marginal effect (AME) of −0.3indicates that, compared to the sample average of
18 Because supplier-level fixed effects in our model absorbthe time-invariant portion of supplier country-level variables,per-capita GDP, regulatory quality, and press freedom effectivelycontrol for within-country temporal variation in their effect onsupplier violation rates.19 Potential concerns that endogenous audit assignment might biasresults led us to conduct several supplemental analyses describedbelow and in Appendix S1.
6.5 violations, an audit by a team with a previousauditor would yield 6.2 violations.
The audit team’s maximum tenure has a signif-icant positive coefficient (𝛽 = 0.07; p< 0.01) andits square term has a significant negative coef-ficient (𝛽 =−0.004; p< 0.01), implying that thenumber of violations cited increases as tenureincreases but at a diminishing rate, which supportsHypothesis 2.20
Our results are mixed with respect to profession-alization. The coefficient on graduate educationis positive as predicted but not significant, yield-ing no evidence that audits conducted by teamswith more formal education yielded significantlymore violations. Audits did yield significantly moreviolations when conducted by more profession-alized auditors as measured by auditor training(𝛽 = 0.02; p< 0.01; IRR= 1.02). This result is notdriven by age or tenure, for which we control.The AME indicates that each additional trainingcourse (beyond that possessed by the team’s mosthighly trained member) is associated with an addi-tional 0.14 violations. In other words, an auditteam whose most highly trained member had takennine training courses would, on average, cite onemore violation than a team whose most highlytrained member had taken two training courses.Jointly, these results yield some support for Hypoth-esis 3, but only when professionalization is mea-sured by specific training rather than by broadereducation.
Team gender composition is also significantlyassociated with the number of violations reported.Audits by all-female teams yield six percent moreviolations than those by all-male teams (the base-line) (𝛽 = 0.05; p< 0.01; IRR= 1.05), which sup-ports Hypothesis 4. The average marginal effectindicates that audits by all-female teams yield 0.35more violations than those by all-male teams (thebaseline category).
Mixed-gender teams yield on averageseven percent more violations—or nearly halfa violation more—than all-male teams (the base-line) (𝛽 = 0.07; p< 0.01; IRR= 1.07) and slightlymore violations than all-female teams (ΔAME=0.1), but the latter difference is not statisticallydistinguishable (𝜒2 = 0.55; p= 0.46). These resultspartially support Hypothesis 5.
20 This relationship is illustrated in Figure C1 of Appendix S3,which graphs average predicted violations at varying levels of theaudit team’s maximum experience.
Copyright © 2015 John Wiley & Sons, Ltd. Strat. Mgmt. J., 37: 1878–1897 (2016)DOI: 10.1002/smj
Monitoring Global Supply Chains 1889
Table 3. Regression results
(1) (2) (3) (4) (5)
Dependent variable: number of violations Coef.Average marginal
effects Coef. Coef. Coef. Coef.
H1 Previous auditor −0.043* −0.28 −0.039+ −0.028 −0.044* −0.027(0.020) (0.020) (0.026) (0.021) (0.025)
H2 Maximum tenure 0.065** 0.12 0.068** 0.078** 0.069** 0.084**
(0.014) (0.014) (0.016) (0.014) (0.017)H2 Maximum tenure squared −0.004** −0.004** −0.004** −0.005** −0.005**
(0.001) (0.001) (0.001) (0.001) (0.001)H3 Graduate education 0.027 0.18 0.030 −0.004 0.021 0.045
(0.024) (0.024) (0.029) (0.026) (0.039)H3 Auditing skills training 0.021** 0.14 0.022** 0.013 0.022** 0.012
(0.007) (0.007) (0.009) (0.007) (0.009)H4 All-female audit team 0.054** 0.35 0.055** 0.048* 0.053** 0.052*
(0.015) (0.015) (0.019) (0.016) (0.021)H5 Mixed-gender audit team 0.067** 0.43 0.068** 0.049* 0.069** 0.067*
(0.021) (0.021) (0.024) (0.021) (0.028)Certification training −0.021 −0.14 −0.024 −0.027 −0.031 −0.010
(0.021) (0.021) (0.027) (0.021) (0.029)Brand training −0.014 −0.09 −0.012 0.008 −0.007 0.001
(0.021) (0.022) (0.026) (0.022) (0.030)Average age −0.025 −0.04 −0.026 −0.015 −0.023 −0.041
(0.019) (0.020) (0.028) (0.019) (0.027)Average age squared 0.000 0.000 0.000 0.000 0.001
(0.000) (0.000) (0.000) (0.000) (0.000)Third-party protocol −0.080 −0.52 −0.088 −0.148* −0.210*
(0.058) (0.062) (0.070) (0.101)Unannounced audit 0.029 0.19 0.029 0.030 0.031 0.075**
(0.020) (0.020) (0.025) (0.020) (0.027)Audit paid for by supplier or agent −0.084** −0.55 −0.083** −0.068* −0.064* −0.099**
(0.026) (0.027) (0.032) (0.028) (0.034)Re-audit −0.348** −2.26 −0.351** −0.353** −0.358** −0.345**
(0.016) (0.016) (0.019) (0.017) (0.020)Per-capita GDP (log) −0.623* −4.04 −0.551* −0.749 −0.714** −0.210
(0.262) (0.264) (0.473) (0.267) (0.389)Regulatory quality −0.180 −1.17 −0.169 −0.385 −0.158 −0.621**
(0.150) (0.150) (0.298) (0.153) (0.231)Press freedom −0.510* −3.31 −0.531* −1.059* −0.402+ −0.879**
(0.224) (0.224) (0.476) (0.239) (0.339)Observations (audits) 16, 795 16, 585 10, 648 16, 044 9, 266Factories 5, 819 5, 748 3, 810 5, 523 3, 082
**p< 0.01; *p< 0.05; +p< 0.10Standard errors clustered by supplier (factory). All models also include fixed effects for the audited establishment, audit year, buyercountry, number of auditors (two through five or more), and the supplier’s audit sequence (second through sixth or more). All modelsinclude three dummy variables to indicate instances in which the following variables were missing data and thus recoded to 0: averageage and maximum age (5,458 audits), audit paid for by supplier or agent and audit paid for by buyer (983 audits), and press freedom (119audits). Model 1 is the primary model estimated on the entire sample. Model 2 excludes audits conducted for buyers whose audit teamswere always all female. Model 3 includes only audits conducted by at least two auditors. Model 4 excludes audits conducted accordingto a third-party protocol. Model 5 excludes factories’ first audit during the sample period.
The coefficients on second inspection throughsixth or more inspection are negative and signifi-cant. Wald tests comparing these coefficients indi-cate that, on average, each successive audit yieldssignificantly fewer violations. AMEs indicate that,on average, a supplier’s second audit yields nearly
one fewer violation than its initial audit during oursample period (𝛽 =−0.15; p< 0.01; AME=−0.9),its third audit yields nearly 1.3 fewer than itssecond audit (AME=−2.2, a statistically signif-icant decline: Wald 𝜒2 = 114; p< 0.01), and itsfourth audit yields 0.6 fewer than its third audit
Copyright © 2015 John Wiley & Sons, Ltd. Strat. Mgmt. J., 37: 1878–1897 (2016)DOI: 10.1002/smj
1890 J. L. Short, M. W. Toffel, and A. R. Hugill
(AME=−2.8, a statistically significant decline:Wald 𝜒2 = 20; p< 0.01).21
Consistent with assigning more auditors to largerfactories, which are likely to generate more vio-lations, we find that audits with more auditorsyield significantly more violations. We find no evi-dence that the number of violations varied with theteam’s certification training, brand training, or aver-age age or with a third-party protocol. Our pointestimate indicates that unannounced audits yieldedslightly more violations than announced audits at agiven supplier (AME= 0.2), but the difference wasbeyond conventional significance levels (p= 0.15).
Audits paid for by factories or agents yieldedeight percent fewer violations than audits paid forby the buyer, the baseline category (𝛽 =−0.08;p< 0.01; IRR=−0.92). The average marginal effectindicates that, on average, audits yield 0.6 fewerviolations when the supplier or agent pays thanwhen the buyer pays, a drop from 6.5 to 5.9.
Audits yielded fewer violations in countrieswith greater per-capita GDP (𝛽 =−0.62; p= 0.02;AME=−4.0) and in those with greater press free-dom (𝛽 =−0.51; p= 0.02; AME= 3.3). Our pointestimate indicates fewer violations at factoriesin countries with higher regulatory quality, butthe relationship was not statistically significant(𝛽 =−0.18; p= 0.22).
Robustness tests
Potential concerns that endogenous auditassignment—and, in particular, differencesbetween lead auditors and other auditors—mightbias our results led us to conduct several supple-mental analyses. As described in Appendix S1,instrumenting for the audit team’s maximum audit-ing skills training and maximum tenure—usingaverage values of these characteristics among allauditors based in the auditing firm’s field office thatstaffed each establishment’s audits, an approachbased on Card (1995) and Forman, Goldfarb, andGreenstein (2012)—yielded results statisticallyindistinguishable from our primary results (Haus-man test 𝜒2 = 52.09; p= 0.16), thus offering noevidence of endogeneity bias.
Estimating our primary model using negativebinomial regression yielded results nearly identical
21 This relationship is also apparent in the summary statisticsdepicted in Figure C2 of Appendix S3.
to those of our primary approach, which usedPoisson regression. We also estimated our primarymodel on various subsamples to assess the extentto which our results were driven by certain typesof audits. Column 2 of Table 3 reports estimatesafter excluding the 210 audits performed for buyerswhose audit teams were always all female, in casethat pattern reflected a buyer-firm policy that mightbias our results. Column 3 reports estimates basedon the 10,648 audits conducted by teams of at leasttwo; this is to ensure that our results were not drivenby single-auditor audits. Column 4 reports estimatesafter excluding the 751 audits conducted accordingto third-party protocols, in case the influence ofsuch protocols on the discovery or reporting ofviolations is not adequately controlled for with thedummy variable used in our main specificationand also because, in these cases, the factoriesthemselves might have chosen the protocol andauditor. Column 5 reports results for the subsampleof 9,266 audits that excludes each supplier’s firstaudit in our sample; some of those might have beenpre-assessments of factories that buyers had not yetengaged and our hypothesized relationships mightoperate differently in such cases. Our results arequite robust across these subsamples. The signs andmagnitudes of all hypothesized variable coefficientsare very similar to those in our main results.
DISCUSSION
Our research indicates that supply chain auditors’identification and reporting of violations of sup-plier codes of conduct are shaped not only by thefinancial conflicts of interest that have been thefocus of research to date, but also by social fac-tors that include the auditors’ experience, profes-sional training, and gender; the gender diversityof their teams; and their repeated interactions withthose whom they audit. These findings contributeto the TCE stream within the strategic managementliterature and to the transnational business regula-tion literature. Our results also suggest strategiesfor designing private monitoring regimes to providecompanies with more reliable strategic informationabout their supply chain partners.
Contributions to the strategic managementliterature
While the TCE literature highlights the impor-tant governance function of monitoring, it contains
Copyright © 2015 John Wiley & Sons, Ltd. Strat. Mgmt. J., 37: 1878–1897 (2016)DOI: 10.1002/smj

Monitoring Global Supply Chains 1891
little empirical research on monitoring and has notaddressed monitoring’s distinct role in managingreputational risk in global supply chains. Our studysignificantly extends the TCE literature on monitor-ing to address this key strategic concern. First, wehighlight the particular importance of supply chainmonitoring in mitigating the risk of reputationalspillover. The TCE literature on global outsourc-ing has largely assumed that the transaction costs ofoutsourced production are dwarfed by its produc-tion economies and, moreover, that these costs arebecoming vanishingly small as advances in digitalcommunication radically reduce information, bar-gaining, and monitoring costs (e.g., Levy, 2008).We argue that this perspective obscures the poten-tially large reputational spillover costs of outsourc-ing to suppliers with poor social or environmen-tal practices. Our findings suggest that outsourcingfirms must carefully consider whether their moni-toring arrangements are well designed to managethese costs effectively and at what point the costsof effective monitoring become sufficiently large toundercut the economic gains of outsourcing pro-duction. These insights bridge the TCE literaturewith strategic management perspectives on reputa-tion (Roberts and Dowling, 2002).
Second, we extend the existing literature’s focuson the ex ante design of monitoring structures tohighlight the need for effective ongoing ex postmonitoring to safeguard against opportunism in out-sourcing relationships. TCE studies of monitoringhave tended to focus on “ex ante safeguards todeter ex post opportunism” (Williamson, 2008: 6),such as the appropriate design of contractual provi-sions (Argyres et al., 2007; Barthélemy and Quélin,2006; Gereffi et al., 2005). Our empirical documen-tation of heterogeneity in the reliability of infor-mation generated by monitors makes it clear thatfor monitoring to mitigate the costs of reputationalspillovers, it must be not only properly designed butalso effectively implemented.
Third, we extend TCE’s foundational concernwith the bounded rationality of contracting parties(Williamson, 1979) to third parties—those whosupport outsourced transactions—by demonstrat-ing the ways in which these actors are likewiseconstrained by social, cognitive, and relationalfactors. Research addressing the limitations ofmonitors has, to date, focused on their oppor-tunistic behavior (Khalil and Lawarrée, 2006)rather than on more generic constraints on theirrationality. More generally, the literature tends to
assume that monitoring is becoming increasinglyeffective because of “[advances in] technology,standardization of business processes, and plungingcommunication costs” (Geis, 2007: 998), but thisperspective fails to acknowledge that individualsengaged in monitoring activities remain subject tothe limits of bounded rationality. Our research iden-tifies this important oversight and suggests waysthat managers can economize on not only their ownbounded rationality, but also that of their monitors.
Finally, we identify important second-order mon-itoring problems that arise when firms outsourcemonitoring functions to third parties. Existing TCEaccounts tend to assume that monitoring is carriedout by the transacting parties themselves. Increas-ingly, however, these functions are performed byprivate, third-party firms such as social auditors,certification organizations, assurance services, andconsultants. This introduces potential agency prob-lems, because third-party monitors often have dif-ferent incentive structures from the principals thathire them (Khalil and Lawarrée, 2006; Pierce andToffel, 2013). Our study highlights the need forgreater attention to these complex governance struc-tures and our findings offer strategies that firms canuse to monitor their monitors and increase the reli-ability of the strategic information those monitorssupply. These strategies, discussed below, are rel-atively cost-effective ways to economize on moni-tors’ bounded rationality.
Contributions to the transnational businessregulation literature
Supply chain auditing has become an importantcomponent of transnational business regulatoryschemes that seek to address the social and envi-ronmental risks of global business activities (Braith-waite and Drahos, 2000; Toffel et al., 2015). Pri-vate labeling regimes such as the Forest Stew-ardship Council, the Marine Stewardship Council,and Fair Trade rely on private third-party auditors.International intergovernmental institutions such asthe United Nations have encouraged supply chainauditing by requesting that MNCs conduct “duediligence” to ensure their suppliers’ compliancewith international human rights norms (Ruggie,2008). Many national regulators have followed suit,requiring MNCs to conduct due diligence and dis-close supply chain practices (Zandvliet, 2011). Theefficacy and legitimacy of transnational businessregulation depends largely on the credibility of
Copyright © 2015 John Wiley & Sons, Ltd. Strat. Mgmt. J., 37: 1878–1897 (2016)DOI: 10.1002/smj
1892 J. L. Short, M. W. Toffel, and A. R. Hugill
private monitoring; our study responds to calls formore empirical research on the key actors (Büthe,2010). While our findings of auditor heterogene-ity support those who question the independenceand objectivity of private monitors (Boiral andGendron, 2011; Power, 1997), our identification ofseveral systematic determinants of that heterogene-ity suggests how companies and policymakers canimprove audit validity. In addition, as governmentsbegin to mandate certain environmental and socialstandards and sustainability disclosures that wereonce voluntary, our findings can help firms developcompliance strategies to mitigate emerging legalrisks associated with supply chain monitoring.
Implications for managers
Our study reveals some key characteristics of auditteams that can enhance audit quality, providingvaluable guidance for companies that hire auditorsto monitor their suppliers as well as for the audit-ing firms that do the monitoring. More broadly,our findings can inform those who hire or man-age other private gatekeepers, such as accountingfirms and credit rating agencies—subjects of muchinterest since their failures to detect and reveal cor-porate wrongdoing led to corporate scandals andfinancial meltdowns in the early 21st century (Part-noy, 2006).22 Our work should also spur companiesemploying internal auditors to monitor their suppli-ers to consider whether the mechanisms revealed inthis study are at play.
Research suggests that managers tend to assumethe professional independence and objectivity oftheir supply chain auditors (Dogui, Boiral, andGendron, 2013). Our interviews with managers ofcompanies that hire supply chain auditors indicatethat these managers pay a great deal of attentionwhen selecting audit firms, but then mainly leave itto the auditing firms to select the individual auditorswho assess their suppliers. It may seem logicalto “leave it to the experts,” but our results showthat audit report quality suffers when the corporateclient overlooks the auditor assignment process. Inparticular, managers of companies that hire supplychain auditors should pay closer attention to auditortraining and experience, the gender composition of
22 The gatekeeper literature, like the auditing literature, hasfocused almost exclusively on the influence of economic conflictsof interest (Bazerman et al., 1997; Moore et al., 2006; Partnoy,2006).
teams, and auditor rotation. Our work also confirmsprior research that questions the quality of auditspaid for by the audited factory.
Moreover, our interviews with managers ofseveral supply chain auditing firms indicatethat, when composing audit teams, they do notconsider the key characteristics we identified.Auditor assignments are based largely on logisticalconsiderations like availability, language skills,minimum required training, and (in some cases)industry-specific experience. None of the managerswe interviewed indicated that they consideredgender. Few expressed concerns about re-assigningauditors to a supplier, though several remarked thatdoing so could expedite the audit (thereby reducingits cost) by leveraging the auditors’ familiarity withthe facility and staff.
Considering these prevailing practices, ourresults equip both the managers of firms that hiresupply chain auditors and the auditing firms them-selves to understand better how team characteristicscan influence audit quality. Our interviews withseveral auditing firms indicate that clients have theability to influence audit team composition, butvery few clients actually seek to do so. Greater con-sideration by clients to their auditing firms’ teamcomposition can increase those firms’ attention toassessing and improving audit quality.
Because we find that auditors tend to cite fewerviolations at factories where they have ongoingrelationships, client firms should consider requir-ing that their auditing firms regularly rotate theauditing staff.23 There are also clear managerialimplications from our finding that audit teamswhose members had more training documentedsignificantly more violations than less well-trainedteams did. Clients should insist that highly trainedauditors be assigned to their suppliers, whileauditing firms truly dedicated to providing reliableaudits—observable when different audit teamsyield indistinguishable audit reports—shouldreassess their minimum training requirements.
Auditing firms and their clients should also mindthe gender composition of audit teams. Our findings
23 Others have advocated rotation of auditors (e.g., Moore et al.,2006; U.S. Public Company Accounting Oversight Board, 2011),although such calls have focused on financial auditors and onrotation of audit firms rather than of individual auditors. Afew schemes have explicitly stipulated term limits for auditingcompanies; for example, California’s greenhouse gas regulationrequires regulated entities to change verification companies everysix years.
Copyright © 2015 John Wiley & Sons, Ltd. Strat. Mgmt. J., 37: 1878–1897 (2016)DOI: 10.1002/smj
Monitoring Global Supply Chains 1893
reveal that all-male teams yielded significantlyfewer violations. Audit firms should examine howgender composition leads to such disparities so thatthey can enhance their training to achieve betterthe goal of audit teams yielding comprehensiveresults irrespective of gender composition. Inthe meantime, companies hiring supplier auditorsshould examine whether their audit results correlatewith the gender composition of their audit teamsand, if so, press those firms to understand why.This might lead clients to develop evidence-basedpolicies for their third-party auditors to followwhen assembling audit teams. If more clients seekto influence audit team composition in order toincrease audit quality, auditing firms may beginto compete on their attention to—and ongoingassessment of—audit quality. Should such clientdemands face insurmountable resistance fromauditing firms in some markets, clients shouldconsider relying on their own employees to monitortheir suppliers in those markets.
Limitations and future research
Given the nature of our large quantitative study, weare unable to pinpoint the precise mechanisms bywhich the factors we identify influence individualauditor decisions. We encourage future research toinvestigate the social processes underlying theseoutcomes.
Discussions with social auditors at the firm thatprovided our data and at competing firms pro-voked no suspicion that endogeneity drives ourresults. Its team assignment process (described ear-lier) yields no endogeneity concerns that woulddrive our hypothesized results. Our discussions alsoindicated that MNCs determine which factories areaudited, obviating the risk of a selection effectwhereby better-than-average or worse-than-averagefactories choose to be audited or to pay for their ownaudits, as happens in some voluntary environmentalprograms (King and Toffel, 2009). Even so, we can-not rule out the possibility that omitted variables arecorrelated with our independent variables and vio-lation rates; we therefore encourage future random-ized field experiments (e.g., Hainmueller, Hiscox,and Sequeira, 2015).
Our findings relating to gender and gender diver-sity may be influenced by the gender compo-sition of the supplier’s workforce. Although wedo not have such demographic data, availablemeta-data and our own interviews with social
auditors suggest that women dominate the work-force in the export-intensive industries—such asgarments, textiles, and electronics—that accountfor most of our sample (Dejardin and Owens, 2009).Future research could explore how auditors’ deci-sions are influenced by the interaction of the gen-der composition of the audit team and that ofthe audited organization. Similarly, future researchcould explore the influence of auditors’ culturalbackgrounds and, especially, how that might influ-ence their interactions with the supplier’s manage-ment and workforce.
Future research can also explore how auditors’decisions are influenced by various short- andlong-term organizational structures and incentives.For instance, differing compensation systems mayinfluence the extent to which supply chain audi-tors’ decisions are shaped by economic incen-tives and other factors. Field experiments mightshow which technical and managerial training mostimproves auditors’ objectivity. More broadly, it isimportant to investigate whether our findings aregeneralizable to other types of private gatekeep-ers, such as financial auditors, credit rating agen-cies, and attorneys. Do they respond similarly toeconomic incentives, professional obligations, andsocial pressures? Direct comparison of the prac-tices of private-sector monitors such as social audi-tors and public-sector monitors such as governmentinspectors could reveal opportunities to enhance theefficiency and effectiveness of both. For example,whereas less stringency has been observed amongmore experienced government inspectors (Lem-ley and Sampat, 2012; Macher et al., 2011), weobserve greater stringency (albeit at a decreasingrate) among more experienced private monitors.Finally, from the TCE perspective, it is important toinvestigate whether social monitoring actually doesmitigate reputational transaction costs for outsourc-ing firms, either by improving the supplier’s socialpractices or by providing firms with timely action-able information.
CONCLUSION
Although private supply chain auditors are increas-ingly important to strategic corporate outsourcingdecisions and to public and private transnationalbusiness regulation, they have seldom attractedacademic attention. Our investigation of supplychain auditing practices at thousands of factories
Copyright © 2015 John Wiley & Sons, Ltd. Strat. Mgmt. J., 37: 1878–1897 (2016)DOI: 10.1002/smj

1894 J. L. Short, M. W. Toffel, and A. R. Hugill
around the world reveals several social factorsthat influence auditors’ decisions. More broadly,our work contributes to the literatures on strategicmanagement, private supply chain monitoring, andregulatory compliance mechanisms and high-lights opportunities to improve the design andimplementation of governance regimes monitoringoutsourced production.
ACKNOWLEDGEMENTS
We gratefully acknowledge the research assis-tance of Melissa Ouellet as well as that of ChrisAllen, John Galvin, Erika McCaffrey, and Chris-tine Rivera. Xiang Ao, Max Bazerman, ShaneGreenstein, Jeffrey Macher, Andrew Marder,Justin McCrary, Morris Ratner, Bill Simpson, andVeronica Villena provided helpful comments. Har-vard Business School’s Division of Research andFaculty Development provided financial support.
REFERENCES
Abbott A. 1988. The System of Professions: An Essay onthe Division of Expert Labor. University of ChicagoPress: Chicago, IL.
Ahn J, Khandelwal AK, Wei S-J. 2011. The role of inter-mediaries in facilitating trade. Journal of InternationalEconomics 84(1): 73–85.
Alcacer J, Oxley J. 2014. Learning by supplying. StrategicManagement Journal 35(2): 204–223.
Ang D, Brown D, Dehejia R, Robertson R. 2012.Public disclosure, reputation sensitivity, and laborlaw compliance: evidence from Better FactoriesCambodia. Review of Development Economics 16(4):594–607.
Argyres NS, Bercovitz J, Mayer KJ. 2007. Complementar-ity and evolution of contractual provisions: an empiri-cal study of IT services contracts. Organization Science18(1): 3–19.
Asare SK, Trompeter GM, Wright AM. 2000. The effectof accountability and time budgets on auditors’ testingstrategies. Contemporary Accounting Research 17(4):539–560.
Bardach E, Kagan RA. 1982/2002. Going by the Book: TheProblem of Regulatory Unreasonableness. Transaction:New Brunswick, NJ.
Barthélemy J, Quélin BV. 2006. Complexity of outsourc-ing contracts and ex post transaction costs: an empiricalinvestigation. Journal of Management Studies 43(8):1775–1797.
Bazerman MH, Morgan K, Loewenstein GF. 1997. Theimpossibility of auditor independence. MIT Sloan Man-agement Review 38(4): 89–94.
Bennett VM, Pierce L, Snyder JA, Toffel MW. 2013.Customer-driven misconduct: how competition cor-rupts business practices. Management Science 59(8):1725–1742.
Boiral O, Gendron Y. 2011. Sustainable developmentand certification practices: lessons learned andprospects. Business Strategy and the Environment20(5): 331–347.
Braithwaite J, Drahos P. 2000. Global Business Regula-tion. Cambridge University Press: Cambridge, UK.
Braithwaite J, Makkai T. 1991. Testing an expected utilitymodel of corporate deterrence. Law & Society Review25(1): 7–40.
Büthe T. 2010. Global private politics: a research agenda.Business and Politics 12(3 Article): 12.
Card D. 1995. Using geographic variation in collegeproximity to estimate the return to schooling. In Aspectsof Labor Market Behaviour: Essays in Honour of JohnVanderkamp, Christofides LN, Grant EK, Swidinsky R(eds). University of Toronto Press: Toronto, Canada;201–222.
Chugh D, Bazerman MH. 2007. Bounded awareness: whatyou fail to see can hurt you. Mind and Society 6(1):1–18.
Darley WK, Smith RE. 1995. Gender differences in infor-mation processing strategies: an empirical test of theselectivity model in advertising response. Journal ofAdvertising 24(1): 41–56.
Dejardin AK, Owens J. 2009. Asia in the Global EconomicCrisis: Impacts and Responses from a Gender Perspec-tive. International Labour Organization Regional Officefor Asia and the Pacific: Bangkok, Thailand.
Delmas M, Toffel MW. 2008. Organizational responsesto environmental demands: opening the black box.Strategic Management Journal 29(10): 1027–1055.
Diamond AM Jr. 1984. An economic model of thelife-cycle research productivity of scientists. Sciento-metrics 6(3): 189–196.
Dogui K, Boiral O, Gendron Y. 2013. ISO auditingand the construction of trust in auditor independence.Accounting, Auditing & Accountability Journal 26(8):1279–1305.
Doig SJ, Ritter RC, Speckhals K, Woolson D. 2001.Has outsourcing gone too far? McKinsey Quarterly,Autumn 4: 25–37.
Duflo E, Greenstone M, Pande R, Ryan N. 2013.Truth-telling by third-party auditors and the responseof polluting firms: experimental evidence from India.Quarterly Journal of Economics 128(4): 1499–1545.
Eagly AH, Johannesen-Schmindt MC. 2001. Leadershipstyles of women and men. Journal of Social Issues57(4): 781–797.
Eisenhardt KM. 1985. Control: organizational andeconomic approaches. Management Science 31(2):134–149.
Ellis PD. 2011. International trade intermediaries. In WileyInternational Encyclopedia of Marketing, Part 6. Inter-national Marketing, Sheth JN, Malhotra NK (eds).Wiley-Blackwell: West Sussex, UK.
Esbenshade J. 2004. Monitoring Sweatshops: Workers,Consumers and the Global Apparel Industry. TempleUniversity Press: Philadelphia, PA.
Copyright © 2015 John Wiley & Sons, Ltd. Strat. Mgmt. J., 37: 1878–1897 (2016)DOI: 10.1002/smj

Monitoring Global Supply Chains 1895
Feinstein JS. 1989. The safety regulation of U.S. nuclearpower plants: violations, inspections, and abnormaloccurrences. Journal of Political Economy 97(1):115–154.
Fenwick GD, Neal DJ. 2001. Effect of gender compositionon group performance. Gender, Work & Organization8(2): 205–224.
Fombrun CJ, Gardberg NA, Barnett ML. 2000. Opportu-nity platforms and safety nets: corporate citizenship andreputational risk. Business and Society Review 105(1):85–106.
Forman C, Goldfarb A, Greenstein S. 2012. The Internetand local wages: a puzzle. American Economic Review102(1): 556–575.
Geis GS. 2007. Business outsourcing and the agency costproblem. Notre Dame Law Review 82(3): 955–1004.
Gereffi G, Humphrey J, Sturgeon T. 2005. The governanceof global value chains. Review of International PoliticalEconomy 12(1): 78–104.
Gold A, Hunton JE, Gomaa MI. 2009. The impact of clientand auditor gender on auditors’ judgments. AccountingHorizons 23(1): 1–18.
Gray WB, Shadbegian R. 2005. When and why do plantscomply? Paper mills in the 1980s. Law & Policy 27(2):238–261.
Green AW, Melnick E. 1950. What has happened tothe feminist movement?. In Studies in Leadership,Gouldner AW (ed). Harper: New York; 277–302.
Greenhouse S. 2013a. $40 million in aid set for Bangladeshgarment workers. New York Times 24 December: B1.
Greenhouse S. 2013b. Major retailers join Bangladeshsafety plan. New York Times 13 May: B1.
Hainmueller J, Hiscox MJ, Sequeira S. 2015. Consumerdemand for the Fair Trade label: evidence from amulti-store field experiment. Review of Economics andStatistics 97(2): 242–256.
Handley SM, Gray JV. 2013. Inter-organizational qual-ity management: the use of contractual incentives andmonitoring mechanisms with outsourced manufactur-ing. Production and Operations Management 22(6):1540–1556.
Hawkins K. 1984. Environment and Enforcement: Regu-lation and the Social Definition of Pollution. OxfordUniversity Press: London, UK.
Haynes K. 2012. Body beautiful? Gender, identity and thebody in professional services firms. Gender, Work &Organization 19(5): 489–507.
Heide JB, Kumar A, Wathne KH. 2014. Concurrent sourc-ing, governance mechanisms, and performance out-comes in industrial value chains. Strategic ManagementJournal 35(8): 1164–1185.
Heide JB, Wathne KH, Rokkan AI. 2007. Inter-firm mon-itoring, social contracts, and relationship outcomes.Journal of Marketing Research 44(3): 425–433.
Heras-Saizarbitoria I, Boiral O. 2013. Research agenda onmanagement system standards. International Journal ofManagement Reviews 15(1): 47–65.
Huber GR, Power DJ. 1985. Retrospective reports ofstrategic-level managers: guidelines for increasingtheir accuracy. Strategic Management Journal 6(2):171–180.
Hult GTM, Ketchen DJ, Arrfelt M. 2007. Strategicsupply chain management: improving performancethrough a culture of competitiveness and knowledgedevelopment. Strategic Management Journal 28(10):1035–1052.
Ioannou I. 2014. Redefining strategy in the age of sus-tainability and social responsibility. Available at SSRN:http://ssrn.com/abstract=2429870 (accessed 25 Febru-ary 2015).
Jiang JX, Stanford MH, Xie Y. 2012. Does it matter whopays for bond ratings? Historical evidence. Journal ofFinancial Economics 105(3): 607–621.
Jones BD. 2001. Politics and the Architecture of Choice:Bounded Rationality and Governance. University ofChicago Press: Chicago, IL.
Jonnergård K, Stafsudd A, Elg U. 2010. Performance eval-uations as gender barriers in professional organizations:a study of auditing firms. Gender, Work & Organization17(6): 721–747.
Joshi A, Roh H. 2009. The role of context in work teamdiversity research: a meta-analytic review. Academy ofManagement Journal 52(3): 599–627.
Khalil F, Lawarrée J. 2006. Incentives for corruptibleauditors in the absence of commitment. Journal ofIndustrial Economics 54(2): 269–291.
Killgore WDS, Cupp DW. 2002. Mood and sex of partici-pant in perception of happy faces. Perceptual and MotorSkills 95: 279–288.
King A, Lenox M. 2001. Lean and green? An empiricalexamination of the relationship between lean produc-tion and environmental performance. Production andOperations Management 10(3): 244–257.
King B, Soule SA. 2007. Social movements asextra-institutional entrepreneurs: the effect ofprotest on stock price returns. Administrative ScienceQuarterly 52(3): 413–442.
King AA, Toffel MW. 2009. Self-regulatory institutionsfor solving environmental problems: perspectives andcontributions from the management literature. In Gov-ernance for the Environment: New Perspectives, Del-mas M, Young O (eds). Cambridge University Press:New York; 98–115.
Kinney WR Jr, Palmrose Z, Scholz S. 2004. Auditorindependence, non-audit services, and restatements:was the U.S. government right? Journal of AccountingResearch 42(3): 561–588.
Kocer GR, Fransen L. 2009. Codes of conduct and thepromise of a change of climate in worker organiza-tion. European Journal of Industrial Relations 15(3):237–256.
von Krogh G, Roos J, Slocum K. 1994. An essay oncorporate epistemology. Strategic Management Journal15(1): 53–71.
Kumar JA, Chakrabarti A. 2012. Bounded awareness andtacit knowledge: revisiting Challenger disaster. Journalof Knowledge Management 16(6): 934–949.
Lemley MA, Sampat B. 2012. Examiner characteristicsand patent office outcomes. Review of Economics andStatistics 94(3): 817–827.
Levine DI, Toffel MW. 2010. Quality management andjob quality: how the ISO 9001 standard for quality
Copyright © 2015 John Wiley & Sons, Ltd. Strat. Mgmt. J., 37: 1878–1897 (2016)DOI: 10.1002/smj

1896 J. L. Short, M. W. Toffel, and A. R. Hugill
management systems affects employees and employers.Management Science 56(6): 978–996.
Levy DL. 2008. Political contestation in global produc-tion networks. Academy of Management Review 33(4):943–963.
Lipsky M. 1980/2010. Street-Level Bureaucracy: Dilem-mas of the Individual in Public Services. Russell SageFoundation: New York.
Locke RM, Qin F, Brause A. 2007. Does monitoringimprove labor standards? Lessons from Nike. Industrialand Labor Relations Review 61(1): 3–31.
Locke RM, Rissing BA, Pal T. 2013. Complements orsubstitutes? Private codes, state regulation and theimprovement of labor standards in global supply chains.British Journal of Industrial Relations 51(3): 519–552.
Lount RB Jr, Phillips KW. 2007. Working harder with theout-group: the impact of social category diversity onmotivation gains. Organizational Behavior and HumanDecision Processes 103(2): 214–224.
Loyd DL, Wang CS, Phillips KW, Lount RB Jr. 2013.Social category diversity promotes premeeting elabo-ration: the role of relationship focus. Organization Sci-ence 24(3): 757–772.
Macher JT, Mayo JW, Nickerson JA. 2011. Regulator het-erogeneity and endogenous efforts to close the infor-mation asymmetry gap. Journal of Law and Economics54(1): 25–54.
March JG, Olsen JP. 1998. The institutional dynamics ofinternational political orders. International Organiza-tion 52(4): 943–969.
Mayer KJ. 2006. Spillovers and governance: an analysisof knowledge and reputational spillovers in informationtechnology. Academy of Management Journal 49(1):69–84.
Mayer KJ, Nickerson JA, Owan H. 2004. Are supplyand plant inspections complements or substitutes? Astrategic and operational assessment of inspection prac-tices in biotechnology. Management Science 50(8):1064–1081.
Mayer KJ, Salomon RM. 2006. Capabilities, contractualhazards, and governance: integrating resource-basedand transaction cost perspectives. Academy of Manage-ment Journal 49(5): 942–959.
McBarnet D. 2007. Corporate social responsibility beyondlaw, through law, for law: the new corporate account-ability. In The New Corporate Accountability: Corpo-rate Social Responsibility and the Law, McBarnet D,Voiculescu A, Campbell T (eds). Cambridge UniversityPress: Cambridge, UK; 9–56.
Montiel I, Husted BW, Christmann P. 2012. Using pri-vate management standard certification to reduce infor-mation asymmetries in corrupt environments. StrategicManagement Journal 33(9): 1103–1113.
Moore DA, Tetlock PE, Tanlu L, Bazerman MH.2006. Conflicts of interest and the case of auditorindependence: moral seduction and strategic issuecycling. Academy of Management Review 31(1):10–29.
Muehlenbachs L, Staubli S, Cohen MA. 2013. The effectof inspector group size and familiarity on enforcementand deterrence. Discussion paper 13–36, Resources forthe Future, Washington, DC.
Nickerson JA, Silverman BS. 2003. Why aren’t all truckdrivers owner-operators? Asset ownership and theemployment relation in interstate for-hire trucking.Journal of Economics & Management Strategy 12(1):91–118.
Oberfield ZW. 2010. Rule following and discretion atgovernment’s frontlines: continuity and change duringorganization socialization. Journal of Public Adminis-tration Research and Theory 20(4): 735–755.
O’Callaghan T. 2007. Disciplining the multinational enter-prise: the regulatory power of reputation risk. GlobalSociety 21(1): 95–117.
Oka C. 2010. Accounting for the gaps in labour standardcompliance: the role of reputation-conscious buyers inthe Cambodian garment industry. European Journal ofDevelopment Research 22(1): 59–78.
O’Rourke D. 2002. Monitoring the monitors: a critique ofPricewaterhouseCooper’s labor monitoring. In Corpo-rate Responsibility and Ethical Trade: Codes of Con-duct in the Global Economy, Jenkins R, Pearson R,Seyfang G (eds). Earthscan: London, UK; 196–207.
Parker C. 1999. Compliance professionalism and regula-tory community: the Australian trade practices regime.Journal of Law and Society 26(2): 215–239.
Partnoy F. 2006. How and why credit rating agencies arenot like other gatekeepers. In Financial Gatekeepers:Can they Protect Investors?, Fuchita Y, Litan RE (eds).Brookings Institution Press: Baltimore, MD; 59–99.
Phillips KW, Duguid M, Thomas-Hunt M, Uparna J.2012. Diversity as knowledge exchange: the roles ofinformation processing, expertise, and status. In TheOxford Handbook of Diversity and Work, Roberson QM(ed). Oxford University Press: New York; 157–178.
Pierce L, Toffel MW. 2013. The role of organizationalscope and governance in strengthening private monitor-ing. Organization Science 24(5): 1558–1584.
Piore MJ. 2005. Rethinking international labor standards.In Labor and the Globalization of Production: Causesand Consequences, Milberg W (ed). Macmillan: NewYork; 249–265.
Portillo S. 2012. The paradox of rules: rules as resourcesand constraints. Administration and Society 44(1):87–108.
Portillo S, DeHart-Davis L. 2009. Gender and organi-zational rule abidance. Public Administration Review69(2): 339–347.
Potoski M, Prakash A. 2005. Green clubs and voluntarygovernance: ISO 14001 and firms’ regulatory com-pliance. American Journal of Political Science 49(2):235–248.
Power M. 1997. The Audit Society: Rituals of Verification.Oxford University Press: Oxford, UK.
Reitzig M, Wagner S. 2010. The hidden costs of outsourc-ing: evidence from patent data. Strategic ManagementJournal 31(11): 1183–1201.
Roberts PW, Dowling GR. 2002. Corporate reputationand sustained superior financial performance. StrategicManagement Journal 23(12): 1077–1093.
Rodríguez-Garavito C. 2005. Global governance and laborrights: codes of conduct and anti-sweatshop strugglesin global apparel factories in Mexico and Guatemala.Politics and Society 33(2): 203–233.
Copyright © 2015 John Wiley & Sons, Ltd. Strat. Mgmt. J., 37: 1878–1897 (2016)DOI: 10.1002/smj

Monitoring Global Supply Chains 1897
Ruggie J. 2008. Protect, Respect and Remedy: A Frame-work for Business and Human Rights. Report ofthe Special Representative of the Secretary-Generalon the Issue of Human Rights and TransnationalCorporations and Other Business Enterprises. UnitedNations, Human Rights Council: Geneva, Switzer-land. Available at: http://www.reports-and-materials.org/Ruggie-report-7-Apr-2008.pdf (accessed 5 July2015).
Schrank A. 2009. Professionalization and probity in apatrimonial state: labor inspectors in the DominicanRepublic. Latin American Politics and Society 51(2):91–115.
Scott RW. 1966. Professionals in bureaucracies—areasof conflict. In Professionalization, Vollmer HM,Mills DL (eds). Prentice-Hall: Englewood Cliffs, NJ;265–275.
Short JL, Toffel MW. 2008. Coerced confessions:self-policing in the shadow of the regulator. Journalof Law, Economics, and Organization 24(1):45–71.
Short JL, Toffel MW. 2010. Making self-regulation morethan merely symbolic: the critical role of the legalenvironment. Administrative Science Quarterly 55(3):361–396.
Simon HA. 1947. Administrative Behavior: A Study ofDecision-Making Processes in Administrative Organi-zations. Free Press: New York.
Spence JT, Buckner CE. 2000. Instrumental and expressivetraits, trait stereotypes, and sexist attitudes: what dothey signify? Psychology of Women Quarterly 24(1):44–62.
Stonewater BB, Eveslage SA, Dingerson MR. 1990. Gen-der differences in career helping relationships. CareerDevelopment Quarterly 39(1): 72–85.
Teitelbaum JC. 2006. Age and tenure of the justices andproductivity of the Supreme Court: are term limitsnecessary? Florida State University Law Review 34(1):161–182.
Terlaak A, King AA. 2006. The effect of certificationwith the ISO 9000 Quality Management Standard: asignaling approach. Journal of Economic Behavior andOrganization 60(4): 579–602.
Tetlock PE. 1983. Accountability and complexity ofthought. Journal of Personality and Social Psychology45(1): 74–83.
Thayer JF, Johnsen BH. 2000. Sex differences in judg-ment of facial affect: a multivariate analysis of recogni-tion errors. Scandinavian Journal of Psychology 41(3):243–246.
Thompson VA. 1977. Modern Organization (2nd edn).Alfred A. Knopf: New York.
Toffel MW, Short JL. 2011. Coming clean and clean-ing up: is voluntary disclosure a signal of effective
self-policing? Journal of Law and Economics 54(3):609–649.
Toffel MW, Short JL, Ouellet M. 2015. Codes in context:how states, markets, and civil society shape adherenceto global labor standards. Regulation & Governance9(3): 205–223.
U.S. Public Company Accounting Oversight Board. 2011.Concept release on auditor independence and auditfirm rotation. Release No. 2011–006 (August 16).Washington, DC. Available at: http://pcaobus.org/Rules/Rulemaking/Docket037/Release_2011-006.pdf(accessed 5 July 2015).
Walsh D, Greenhouse S. 2012. Certified safe, a factoryin Karachi still quickly burned. New York Times 8December: A1.
Weber B, Wittchen M, Hertel G. 2009. Gendered waysto motivation gains in groups. Sex Roles 60(9/10):731–744.
Williamson OE. 1975. Markets and Hierarchies: Analysisand Antitrust Implications. Free Press: New York.
Williamson OE. 1979. Transaction-cost economics: thegovernance of contractual relations. Journal of Law andEconomics 22(2): 233–261.
Williamson OE. 2008. Outsourcing: transaction cost eco-nomics and supply chain management. Journal of Sup-ply Chain Management 44(2): 5–16.
Wood S. 2004. The role of the International Organizationfor Standardization (ISO) in governing environmentalconflict and corporate social responsibility in develop-ing countries: questions for research. In Propriedad,Conflicto y Medio Ambiente, Toro BL (ed). Universidaddel Rosario: Bogotá, Colombia; 15–56.
World Bank. 2013. Worldwide governance indicators:frequently asked questions. Available at: http://info.worldbank.org/governance/wgi/faq.htm (accessed1 April 2013).
Zandvliet R. 2011. Corporate social responsibilityreporting in the European Union: towards a moreunivocal framework. Columbia Journal of EuropeanLaw 18(1): 38–45. Available at: http://www.cjel.net/online/18_1-zandvliet/ (accessed 25 February 2015).
SUPPORTING INFORMATION
Additional supporting information may be foundin the online version of this article:
Appendix S1. Endogeneity assessment.Appendix S2. Sample description.Appendix S3. Figures depicting results of empiricalanalysis.
Copyright © 2015 John Wiley & Sons, Ltd. Strat. Mgmt. J., 37: 1878–1897 (2016)DOI: 10.1002/smj
Appendices - 1
Appendix S1. Endogeneity Assessment
Our interviews with the social auditing firm that provided our data consistently indicated that auditors were assigned to audit teams according to three criteria: (1) their language skills, to ensure they could communicate with the audited supplier’s managers and workers; (2) their availability, given their other auditing assignments; and (3) the need for at least one team member to qualify as a lead auditor. We conducted several empirical tests to assess whether lead auditors and non-lead auditors differed along dimensions that we hypothesized would affect the discovery and reporting of violations and found some evidence that they did: Graduate education. The distribution of educational attainment does not significantly differ
between lead auditors and non-lead auditors, as indicated by a Pearson chi-squared test (2 = 4.2; p = 0.24) of an ordinal educational attainment variable coded 1 for high school, 2 for associate degree, 3 for bachelor’s degree, and 4 for graduate degree.
Gender. Lead auditors are no more likely than non-lead auditors to be a particular gender.
Males make up 37 percent of the firm’s lead auditors and 33 percent of its non-lead auditors, a nonsignificant difference according to a test-of-proportions analysis (z = -1.06; p = 0.29).
Tenure. The average tenure of lead auditors is 4.4 years of service, which is significantly
more than the 2.3 average for non-lead auditors (Wilcoxon rank-sum test: z = -10.1; p < 0.01).
Auditing skills training. Lead auditors averaged 5.5 auditing skills training sessions, which is
significantly more than the non-lead auditors’ average of 2.6 (Wilcoxon rank-sum test: z = -9.3; p < 0.01).
The latter two results imply that larger audit teams would tend to have lower average tenure and lower average auditing skills training because the higher values for the lead auditors would be increasingly ‘diluted’ by additional non-lead team members. However, in our analysis, we measure audit team tenure and auditing skills training based on each team’s maximum values, which do not suffer this dilution problem. (Furthermore, our model specification includes a series of dummies to control for audit team size.) These factors isolate our analysis from differences between lead and non-lead auditors, since all audit teams need one lead auditor. We nonetheless conducted additional analyses to investigate whether endogeneity bias might affect our primary results. Given the differences in auditing skills training and tenure between lead and non-lead auditors, we explored whether the estimated coefficients on our other hypothesized variables were substantially altered if we omitted those two variables from our model. The results of the more parsimonious model (reported in Column 2 of Table A1 in Appendix S1) do not differ substantially from our primary results (reproduced in Column 1 of that table). In particular, the coefficient magnitudes and statistical significance of the other hypothesized variables (previous auditor, graduate education, all-female audit team, and mixed-gender audit team) are remarkably stable across these two models. This indicates that irrespective of potential endogeneity concerns associated with auditing skills training and maximum tenure, we find no evidence to suggest that such concerns spill over to the inferences

Appendices - 2
associated with our other hypotheses (that is, H1, H3 when professionalism is measured by education, H4, and H5). Our primary model is vulnerable to the possibility that endogeneity would bias our estimates on maximum tenure and maximum auditing skills training if the auditing firm deployed teams whose members had higher maximum values of either or both to particular types of establishment that varied in ways that were unobservable but would influence violations. One possible scenario is that the auditing firm assigned auditors with more skill and/or experience to ‘bad apples’; that is, establishments suspected of being egregiously unconcerned with working conditions. Those lead auditors might be better able to extract information from managers and workers at such establishments, which are likely to have many violations. But the obverse might also be true: the auditing firm might send less-trained and/or less-skilled lead auditors to establishments suspected of having very safe working conditions on the grounds that less expertise would be required to audit them adequately. If these stories are true in our empirical context, we would expect to see much less variation in auditing skills training and maximum tenure within the teams auditing the same establishment than between the teams auditing different establishments. In fact, we do not see such a pattern in our data when we decompose variation into within- and between-establishment components. For auditing skills training, the within-establishment standard deviation (SDw) is calculated based on all audit-level auditing skills training values after de-meaning them at the establishment level and adding back the grand mean (that is, xit - i + i). The between-establishment standard deviation (SDb) is calculated based on establishment-level averages (that is, i). For auditing skills training, the between-establishment variation (SDb = 1.32) is very similar to the within-establishment variation (SDw = 1.21). That is, the variation in auditing skills training among audit teams for two randomly drawn establishments is nearly identical to the variation in auditing skills training among audit teams conducting two randomly selected audits of the same establishment. The same is true for maximum tenure: the between-establishment variation (SDb = 1.51) is very similar to the within-establishment variation (SDw = 1.44). These results fail to support the notion that establishments tend to be consistently assigned teams with any particular average auditing skills training or maximum tenure. Establishments whose audit teams have the highest or lowest average auditing skills training in our sample might be the most vulnerable to endogeneity, as they might represent the worst of the ‘bad apples’ or the best of the ‘good apples.’ We therefore reestimated our primary model on a subsample that excluded those outlier establishments whose audit teams’ average levels of auditing skills training fell below the 1st percentile or exceeded the 99th percentile. Similarly, we estimated our model on a subsample that excluded establishments whose audit teams’ average levels of maximum tenure fell below the 1st percentile or exceeded the 99th percentile. The results of these models, reported in Columns 3 and 4 of Table A1 in Appendix S1, are nearly identical to the results of our primary model estimated on the full sample (Column 1). These results provide no evidence that endogeneity is driving our primary results. Another approach to investigating whether endogeneity might be biasing our primary results is to instrument for the audit team’s maximum auditing skills training and maximum tenure. We used average values of these characteristics among all auditors based in the auditing firm’s field office that staffed each establishment’s audits, an approach based on (a) Card’s (1995) instrumenting an
Appendices - 3
individual’s propensity to attend college using the distance between that individual’s domicile and the nearest college and (b) Forman, Goldfarb, and Greenstein’s (2012) instrumenting a firm’s propensity to adopt Internet technology using the propensity of nearby firms. Because these office averages vary little over time, the primary form of variation is cross-sectional (that is, between offices). We instrument for auditing skills training, maximum tenure, maximum tenure squared, and—to be as thorough as possible—certification training by including the office-level corollaries to these variables using the audit year’s values at each audited establishment’s audit field office. The validity of our instruments requires that office-level averages of auditing skills training and tenure (1) be correlated with audit teams’ auditing skills training and tenure (instrument relevance) and (2) be assumed not to have any direct influence on factories’ violation rates (instrument exogeneity). The first requirement is confirmed by observing that the specific audit-team-level and field-office-level variables are correlated at 0.77 for auditing skills training, 0.58 for tenure, and 0.51 for certification training. The second condition relies on an assumption that field office demographics (our instrument) should not have a direct influence on audit results, but instead exert influence only via the demographics of the team members drawn from the office. We sought to estimate this instrumental variables model using Poisson regression with endogenous regressors, but the matrix size created based on the 16,795 establishment-level fixed effects made this infeasible. As a second-best solution, we compared the results of our primary model estimated using fixed-effects OLS regression on the log number of violations (plus 1 to avoid losing cases with no violations)—that is, assuming all variables were exogenous—to the results of a fixed-effects instrumental-variables OLS regression model on the logged number of violations (plus 1). We used the log of the count as the dependent variable in these two models to make their specifications more comparable to those of our primary Poisson regression approach, which assumes that the logarithm of the violation count can be modeled by a linear combination of the independent variables. A Hausman test failed to reject the null, which is that the difference between the coefficients from the IV and OLS approaches is not systematic ( = 52.09; p = 0.16). This implies that the IV approach in the continuous-dependent-variable context does not significantly alter the results, which provides no evidence suggesting that one cannot rely on the more straightforward modeling approach that assumes that the independent variables are exogenous. Given that (a) the OLS on the logged number of violations and (b) the Poisson model on the number of violations are each modeling the logged counts of violations, we infer that the IV Poisson model would not yield results systematically different from those of our primary fixed-effects Poisson model. In sum, several alternative investigative approaches yield no evidence that endogeneity is biasing our results.

Appendices - 4
Table A1. Regression results
Dependent variable: Number of violations
See notes for model definitions (1) (2) (3) (4) (5) (6) Previous auditor -0.042* -0.039* -0.040* -0.043* -0.044* -0.034*
[0.020] [0.020] [0.020] [0.020] [0.020] [0.017] Maximum tenure 0.065** 0.065** 0.073** 0.061** 0.049**
[0.014] [0.014] [0.014] [0.014] [0.012] Maximum tenure squared -0.004** -0.004** -0.005** -0.004** -0.003**
[0.001] [0.001] [0.001] [0.001] [0.001] Graduate education 0.028 0.027 0.012 0.027 0.026 -0.001
[0.024] [0.024] [0.025] [0.024] [0.025] [0.022] Auditing skills training 0.020** 0.020** 0.019** 0.018** 0.024**
[0.007] [0.007] [0.007] [0.007] [0.006] All-female audit team 0.054** 0.057** 0.050** 0.052** 0.054** 0.041**
[0.015] [0.015] [0.015] [0.015] [0.015] [0.014] Mixed-gender audit team 0.067** 0.075** 0.068** 0.065** 0.065** 0.064**
[0.021] [0.021] [0.021] [0.021] [0.021] [0.019] Average age -0.026 -0.011 -0.026 -0.027 -0.031+ -0.022
[0.019] [0.019] [0.019] [0.019] [0.019] [0.018] Average age squared 0.000 0.000 0.000 0.001+ 0.001+ 0.000
[0.000] [0.000] [0.000] [0.000] [0.000] [0.000] Certification training -0.024 0.021 -0.024 -0.026 -0.017 -0.030+
[0.020] [0.018] [0.021] [0.020] [0.020] [0.018] Third-party protocol -0.081 -0.084 -0.089 -0.077 -0.086 -0.112*
[0.058] [0.058] [0.059] [0.059] [0.062] [0.056] Unannounced audit 0.029 0.028 0.034 0.025 0.025 0.057**
[0.020] [0.020] [0.021] [0.020] [0.020] [0.018] Audit paid for by supplier or agent -0.084** -0.085** -0.087** -0.085** -0.087** -0.063*
[0.026] [0.026] [0.027] [0.026] [0.026] [0.025] Re-audit -0.348** -0.348** -0.341** -0.349** -0.358** -0.297**
[0.016] [0.016] [0.016] [0.016] [0.016] [0.014] Per-capita GDP (log) -0.631* -0.678** -0.747** -0.675* -0.653* -0.761**
[0.262] [0.262] [0.265] [0.264] [0.263] [0.243] Regulatory quality -0.177 -0.185 -0.262+ -0.163 -0.191 -0.221
[0.150] [0.150] [0.157] [0.151] [0.152] [0.141] Press freedom -0.511* -0.530* -0.532* -0.576* -0.559* -0.464*
[0.224] [0.223] [0.232] [0.227] [0.224] [0.212] Firm FE Yes Yes Yes Yes Yes Yes Number of auditors FE (2 to 5+) Yes Yes Yes Yes Yes Yes Audit-sequence dummies Yes Yes Yes Yes Yes Yes Year FE Yes Yes Yes Yes Yes Yes Client-country FE Yes Yes Yes Yes Yes Yes Audits (N) 16,795 16,795 15,698 16,496 16,200 15,209 Firms 5,819 5,819 5,328 5,693 5,551 5,321 All results are from Poisson regression. Brackets contain standard errors clustered by supplier; ** p < 0.01, * p < 0.05, + p < 0.10. Column 1 reports estimates of the primary model (reproduced from Table 3, Column 1). Column 2 reports estimates of a model that omits maximum tenure and auditing skills training. Column 3 reports estimates on the subsample that excludes audited factories whose audit teams’ average auditing skills training falls below the 1st percentile or exceeds the 99th percentile of the sample distribution. Column 4 reports estimates on the subsample that excludes audited factories whose audit teams’ average maximum tenure falls below the 1st percentile or exceeds the 99th percentile of the sample distribution.

Appendix S2. Sample Description
Table B1. Geographic composition of supplier locations
Audits Factories
Number Percent Number Percent
Africa 100 1% 38 1%
Americas 1,509 9% 522 9%
United States 949 285
Mexico 172 75
Brazil 84 37
Elsewhere in Americas 304 125
Asia and Australia 14,773 88% 5,084 87%
China (incl. Macao and Hong Kong) 11,746 3,917
India 708 277
Vietnam 424 153
Indonesia 377 137
Bangladesh 321 140
Philippines 270 96
Pakistan 184 71
Sri Lanka 159 61
Taiwan 131 56
Korea 120 49
Elsewhere in Asia & Australia 333 127
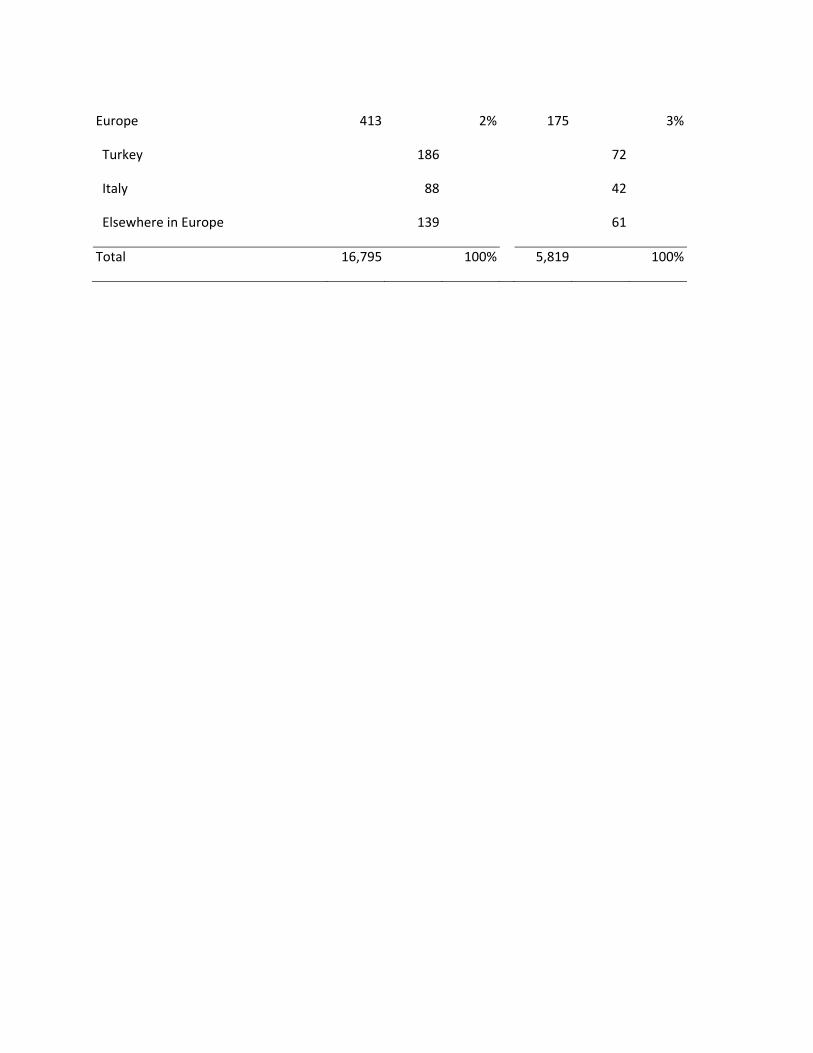
Europe 413 2% 175 3%
Turkey 186 72
Italy 88 42
Elsewhere in Europe 139 61
Total 16,795 100% 5,819 100%
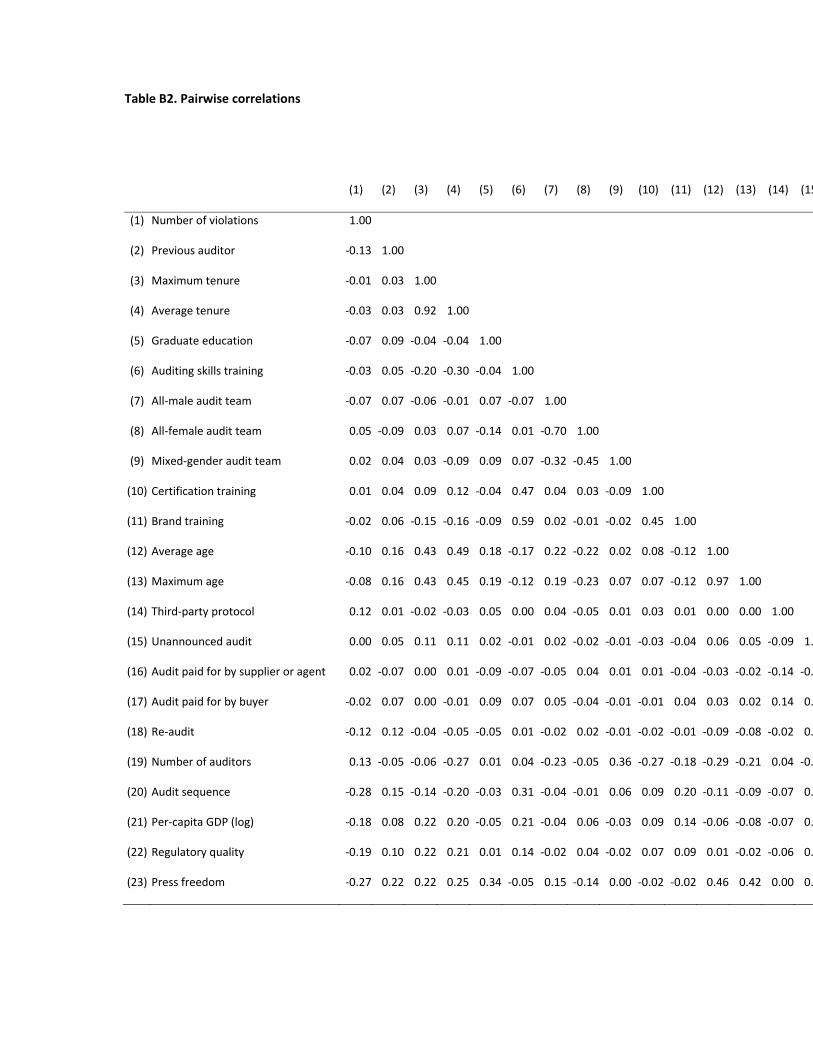
Table B2. Pairwise correlations
(1) (2) (3) (4) (5) (6) (7) (8) (9) (10) (11) (12) (13) (14) (15
(1) Number of violations 1.00
(2) Previous auditor ‐0.13 1.00
(3) Maximum tenure ‐0.01 0.03 1.00
(4) Average tenure ‐0.03 0.03 0.92 1.00
(5) Graduate education ‐0.07 0.09 ‐0.04 ‐0.04 1.00
(6) Auditing skills training ‐0.03 0.05 ‐0.20 ‐0.30 ‐0.04 1.00
(7) All‐male audit team ‐0.07 0.07 ‐0.06 ‐0.01 0.07 ‐0.07 1.00
(8) All‐female audit team 0.05 ‐0.09 0.03 0.07 ‐0.14 0.01 ‐0.70 1.00
(9) Mixed‐gender audit team 0.02 0.04 0.03 ‐0.09 0.09 0.07 ‐0.32 ‐0.45 1.00
(10) Certification training 0.01 0.04 0.09 0.12 ‐0.04 0.47 0.04 0.03 ‐0.09 1.00
(11) Brand training ‐0.02 0.06 ‐0.15 ‐0.16 ‐0.09 0.59 0.02 ‐0.01 ‐0.02 0.45 1.00
(12) Average age ‐0.10 0.16 0.43 0.49 0.18 ‐0.17 0.22 ‐0.22 0.02 0.08 ‐0.12 1.00
(13) Maximum age ‐0.08 0.16 0.43 0.45 0.19 ‐0.12 0.19 ‐0.23 0.07 0.07 ‐0.12 0.97 1.00
(14) Third‐party protocol 0.12 0.01 ‐0.02 ‐0.03 0.05 0.00 0.04 ‐0.05 0.01 0.03 0.01 0.00 0.00 1.00
(15) Unannounced audit 0.00 0.05 0.11 0.11 0.02 ‐0.01 0.02 ‐0.02 ‐0.01 ‐0.03 ‐0.04 0.06 0.05 ‐0.09 1.
(16) Audit paid for by supplier or agent 0.02 ‐0.07 0.00 0.01 ‐0.09 ‐0.07 ‐0.05 0.04 0.01 0.01 ‐0.04 ‐0.03 ‐0.02 ‐0.14 ‐0.
(17) Audit paid for by buyer ‐0.02 0.07 0.00 ‐0.01 0.09 0.07 0.05 ‐0.04 ‐0.01 ‐0.01 0.04 0.03 0.02 0.14 0.
(18) Re‐audit ‐0.12 0.12 ‐0.04 ‐0.05 ‐0.05 0.01 ‐0.02 0.02 ‐0.01 ‐0.02 ‐0.01 ‐0.09 ‐0.08 ‐0.02 0.
(19) Number of auditors 0.13 ‐0.05 ‐0.06 ‐0.27 0.01 0.04 ‐0.23 ‐0.05 0.36 ‐0.27 ‐0.18 ‐0.29 ‐0.21 0.04 ‐0.
(20) Audit sequence ‐0.28 0.15 ‐0.14 ‐0.20 ‐0.03 0.31 ‐0.04 ‐0.01 0.06 0.09 0.20 ‐0.11 ‐0.09 ‐0.07 0.
(21) Per‐capita GDP (log) ‐0.18 0.08 0.22 0.20 ‐0.05 0.21 ‐0.04 0.06 ‐0.03 0.09 0.14 ‐0.06 ‐0.08 ‐0.07 0.
(22) Regulatory quality ‐0.19 0.10 0.22 0.21 0.01 0.14 ‐0.02 0.04 ‐0.02 0.07 0.09 0.01 ‐0.02 ‐0.06 0.
(23) Press freedom ‐0.27 0.22 0.22 0.25 0.34 ‐0.05 0.15 ‐0.14 0.00 ‐0.02 ‐0.02 0.46 0.42 0.00 0.

Appendices - 1
Appendix S3. Figures Depicting Results of Empirical Analysis
Average
predicted
number of
violations
Audit team’s maximum tenure
Figure C1. Effect of audit team’s maximum tenure on average predicted violations per supplier
The figure depicts average predicted number of violations from the fixed‐effects Poisson model
estimated in Column 1 of Table 3, spanning the 5th to 95th percentiles of audit tenure. Dashed
lines represent the 95% confidence interval.
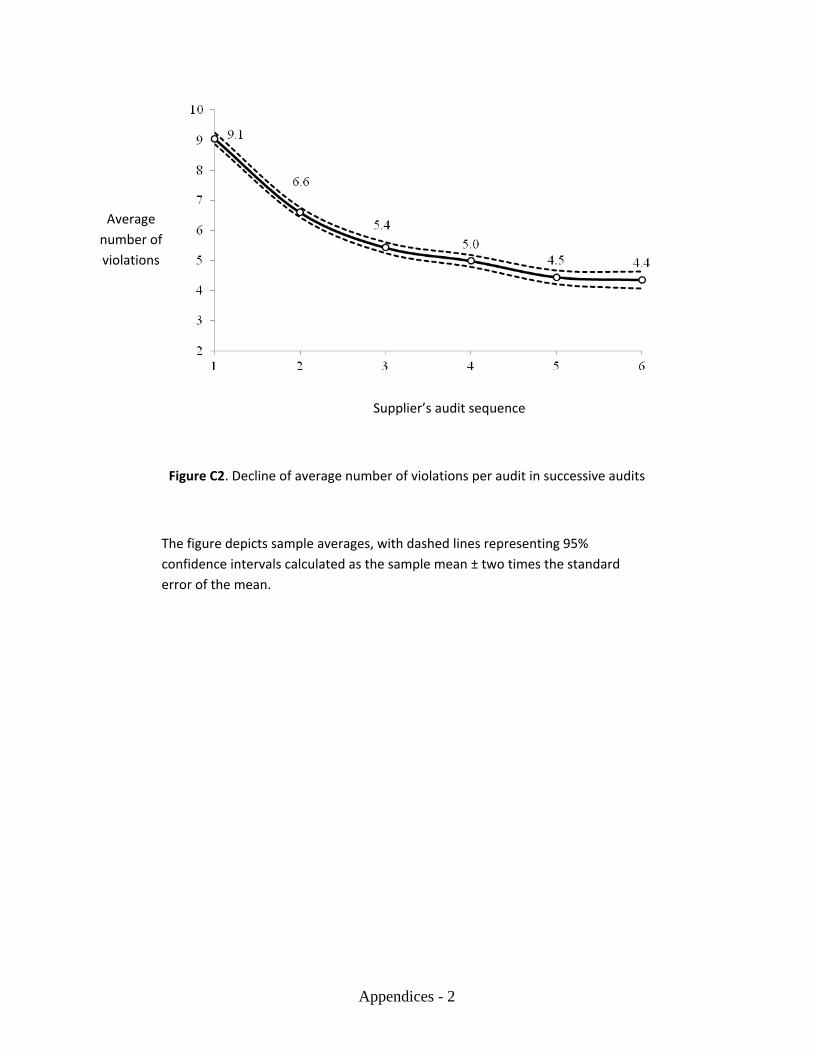
Appendices - 2
Average
number of
violations
Supplier’s audit sequence
Figure C2. Decline of average number of violations per audit in successive audits
The figure depicts sample averages, with dashed lines representing 95%
confidence intervals calculated as the sample mean ± two times the standard
error of the mean.