monitoring global supply chains - harvard business school files/14-032_a106325c-070b-403d... ·...
TRANSCRIPT

Copyright © 2013, 2014, 2015 by Jodi L. Short, Michael W. Toffel, and Andrea R. Hugill
Working papers are in draft form. This working paper is distributed for purposes of comment and discussion only. It may not be reproduced without permission of the copyright holder. Copies of working papers are available from the author.
Monitoring Global Supply Chains Jodi L. Short Michael W. Toffel Andrea R. Hugill
Working Paper
14-032 June 4, 2015
Monitoring Global Supply Chains†
Jodi L. Short UC Hastings College of the Law
Michael W. Toffel
Harvard Business School
Andrea R. Hugill Harvard Business School
June 4, 2015
Research Summary Firms seeking to avoid reputational spillovers that can arise from dangerous, illegal, and unethical behavior at supply chain factories are increasingly relying on private social auditors to provide strategic information about suppliers’ conduct. But little is known about what influences auditors’ ability to identify and report problems. Our analysis of nearly 17,000 supplier audits reveals that auditors report fewer violations when individual auditors have audited the factory before, when audit teams are less experienced or less trained, when audit teams are all-male, and when audits are paid for by the audited supplier. This first comprehensive and systematic analysis of supply chain monitoring identifies previously overlooked transaction costs and suggests strategies to develop governance structures to mitigate reputational risks by reducing information asymmetries in supply chains.
Managerial Summary
Firms reliant on supply chains to manufacture their goods risk reputational harm if the working conditions in those factories are revealed to be dangerous, illegal, or otherwise problematic. While firms are increasingly relying on private-sector “social auditors” to assess factory conditions, little had been known about the accuracy of those assessments. We analyzed nearly 17,000 code-of-conduct audits conducted at nearly 6,000 suppliers around the world. We found that audits yield fewer violations when the audit team had been at that particular supplier before, when audit teams are less experienced or less trained, when audit teams are all-male, and when the audits were paid for by the supplier instead of by the buyer. We describe implications for firms relying on social auditors and for auditing firms.
Keywords monitoring, transaction cost economics, industry self-regulation, auditing, supply chains, codes of conduct, corporate social responsibility
† We gratefully acknowledge the research assistance of Melissa Ouellet as well as that of Chris Allen, John Galvin, Erika McCaffrey, and Christine Rivera. Xiang Ao, Max Bazerman, Shane Greenstein, Justin McCrary, Jeffrey Macher, Andrew Marder, Morris Ratner, Bill Simpson, and Veronica Villena provided helpful comments. Harvard Business School’s Division of Research and Faculty Development provided financial support.
1
Monitoring Global Supply Chains
Reputation is a key strategic concern for modern firms (Roberts and Dowling, 2002), and
environmental, social, and governance (ESG) performance has become an increasingly important
dimension of firm reputation. Poor ESG practices may make firms targets for activists, harming
their reputations as well as their bottom lines (King and Soule, 2007), and firms are increasingly
held accountable by financial analysts and investors for ESG performance (Ioannou, 2014).
Furthermore, firms that mislead stakeholders about their ESG performance through inaccurate
disclosure may find their reputations tarnished (Fombrun, Gardberg, and Barnett, 2000).
As firms continue to outsource production globally, their reputations have come to
depend not solely on their own practices but also on those of the companies in their extended
supply chains (Heide, Kumar, and Wathne, 2014), raising the risk of reputational spillover costs
from these transactions. That risk is particularly high when production is outsourced to countries
where labor and environmental standards are so low that suppliers commonly take “unwarranted
risks in their project execution. . . that the outsourcing principal would never tolerate if it kept
control of the activity” (Geis, 2007: 979). For instance, in the wake of the Rana Plaza building
collapse in Bangladesh that killed 1,100 factory workers, the bulk of media, consumer, and
activist scrutiny focused on the global retailers that sourced from suppliers using the building
(Greenhouse, 2013a). Many of these global retailers were under such intense reputational
pressure that they agreed to adopt a legally binding agreement to spend hundreds of millions of
dollars to fund fire-safety and structural improvements in the factories of their Bangladeshi
suppliers (Greenhouse, 2013b).
The logic of transaction cost economics (TCE) predicts that firms will vertically integrate
activities that pose substantial risks to their reputations so that they have more control over
2
execution (Mayer, 2006; Mayer, Nickerson and Owan, 2004; Nickerson and Silverman, 2003).
However, firms continue to outsource production globally to realize production cost economies
and instead have sought to contain potential reputational spillover costs through intensive
supplier monitoring programs that contractually impose labor and environmental standards of
conduct as well as inspection for compliance (Gereffi, Humphrey, and Sturgeon, 2005; Mayer,
Nickerson, and Owan, 2004; Montiel, Husted, and Christmann, 2012).
Such supplier monitoring is a transactional governance mechanism designed to provide
buyer-firms with information that can help them manage supply chain risk and make strategic
outsourcing decisions. However, it is not clear that buyer-firms are getting complete and
accurate information from their supply chain monitors (e.g., Esbenshade, 2004; Heras-
Saizarbitoria and Boiral, 2013; O’Rourke, 2002). For instance, in 2012, just weeks after social
auditors certified that a factory in Pakistan met the SA8000 working conditions standard created
by a respected nonprofit, a fire there killed hundreds of workers, some of whom were trapped by
locked emergency exits and barred windows—clear violations of that very standard (Walsh and
Greenhouse, 2012). When monitors fail to accurately assess suppliers’ adherence to standards,
they undermine buyer-firms’ ability to make fully informed outsourcing decisions and subject
these firms to the risk of catastrophic reputational consequences.
Despite the importance of supply chain monitors to firms’ governance of reputation risk,
little is known about how such monitors do their jobs or the validity of the information obtained
through their inspections (Mayer, Nickerson, and Owan, 2004). To our knowledge, no empirical
research has rigorously investigated what factors shape supply chain monitors’ assessments of
supplier adherence to standards. We seek to fill that gap. Grounding our work in the transaction
cost economics literature and drawing insights from research on regulatory compliance, financial

3
auditing, and bounded rationality, we argue that monitors are not merely objective conduits of
information, but instead that the information they collect and transmit is shaped by a variety of
social relationships, institutions, and identities. This has important implications for outsourcing
firms, because heterogeneity in auditor assessment may undermine the efficacy of the
governance structures they have put into place to contain the costs of reputational spillovers.
We test our hypotheses in the context of social auditing for compliance with labor
standards contained in contractually imposed supplier codes of conduct. This form of private
supply chain monitoring has been adopted by thousands of prominent multinational corporations
(MNCs), including all U.S. Fortune 500 companies (McBarnet, 2007), yet to our knowledge it
has not been addressed in the TCE literature. We exploit a novel dataset drawn from thousands
of audits for code-of-conduct compliance in over 66 countries by one of the world’s largest
supply chain auditing firms. We find that auditors’ decisions are shaped by factors such as
ongoing client relationships, professional experience, gender, and gender diversity. In particular,
supplier audits yield fewer violations when conducted by audit teams that include individual
auditors who have audited that supplier before, when audit teams have less auditing experience
and less in-house audit skills training, and when audit teams consist only of male auditors.
Audits also yield fewer violations when the audits are paid for by the supplier as opposed to the
buyer. These findings significantly broaden the prevailing understanding of the supply chain
monitoring process and suggest ways to design more effective monitoring regimes.
LITERATURE REVIEW
Decisions about outsourcing and supply chain management have become increasingly critical
strategic concerns (Alcacer and Oxley, 2014; Hult, Ketchen, and Arrfelt, 2007; Reitzig and
Wagner, 2010). Current concerns go beyond the paradigmatic “make or buy” dilemma

4
(Williamson, 1975) to complex strategic questions about which suppliers to buy from. Choosing
wisely can enhance a firm’s value by, for instance, improving its financial performance (Doig et
al., 2001) or providing opportunities to develop knowledge (Alcacer and Oxley, 2014; Hult,
Ketchen, and Arrfelt, 2007). On the other hand, poor choices can subject firms to significant
costs, including remediation, legal liability, and reputation damage (O’Callaghan, 2007).
To reduce the reputational risks of outsourcing and to protect brand value, firms incur
significant transaction costs to monitor supplier behavior. As a condition of doing business,
most MNCs require suppliers to meet globally recognized standards in areas including
environmental sustainability, working conditions, and human rights (McBarnet, 2007) and many
employ supply chain auditors to monitor adherence to these standards (Montiel, Husted, and
Christmann, 2012). The TCE literature has long theorized that monitoring is a key governance
mechanism for reducing transaction costs resulting from business partners’ opportunistic
exploitation of information asymmetries (Eisenhardt, 1985; Heide, Kumar, and Wathne, 2014).
Studies have found that stringent monitoring is particularly important when opportunism by one
party threatens to impose reputational spillover costs on the other (Mayer, Nickerson, and Owan,
2004). In theory, monitoring constrains opportunism and mitigates spillover costs by reducing
information asymmetry (Heide, Wathne, and Rokkan, 2007). The theory assumes, however, that
the information firms obtain from their monitors is accurate and complete.
This may not always be the case. First, just as bounded rationality constrains transacting
parties’ ability to foresee and plan for contingencies that might arise over the course of a
business relationship, it is also likely to constrain monitors’ ability to identify and communicate
information about supply chain conditions. Second, many firms that have outsourced production
to global supply chain partners have likewise outsourced the monitoring of those transactions to

5
private, third-party social auditors. This additional layer of contractual relationships introduces
the potential for agency problems into monitoring structures, because third-party monitors’
incentives may not always be aligned with the buyer-firm’s (Khalil and Lawarrée, 2006).
Indeed, research has demonstrated that private, third-party monitors are more lax in enforcing the
rules imposed by their principal when a stringent approach could undermine their own
opportunities for profits (Montiel, Husted, and Christmann, 2012; Pierce and Toffel, 2013).
Consequently, firms that have outsourced the governance of their outsourced transactions must
consider ways to effectively monitor their monitors.
Despite monitoring’s central role in reducing transaction costs, TCE and supply chain
standards research shed little light on how it works in practice and what factors contribute to the
generation of reliable information (Mayer, Nickerson, and Owan, 2004). TCE studies of
monitoring have tended to focus on “ex ante safeguards to deter ex post opportunism”
(Williamson, 2008), including contractual provisions (e.g., Argyres, Bercovitz, and Mayer, 2007;
Barthélemy and Quélin, 2006), technological capabilities (Mayer and Salomon, 2006), and a
shared knowledge base (Heide, Kumar, and Wathne, 2014) that might facilitate monitoring.
Only a few studies investigate how this governance structure is put into practice and, to our
knowledge, none addresses factors associated with the reliability of information obtained through
monitoring. Mayer, Nickerson, and Owan (2004), for instance, find firms more likely to inspect
suppliers’ plants, production processes, and physical output when there is a substantial risk of
reputational spillover. Handley and Gray (2013) establish through survey data that suppliers
subjected to more frequent quality monitoring are more likely to perceive that the buyer has
expectations of high quality.
The most extensive analysis of private supply chain standards has been in the

6
organizational theory and operations literatures, which document how these standards are
developed (Wood, 2004), why they are adopted (e.g., Delmas and Toffel, 2008; Short and
Toffel, 2008; Terlaak and King, 2006), and their financial, operational, and compliance
outcomes (e.g., Esbenshade, 2004; King and Lenox, 2001; Kocer and Fransen, 2009; Levine and
Toffel, 2010; Locke, Rissing, and Pal, 2013; Potoski and Prakash, 2005; Rodríguez-Garavito,
2005; Short and Toffel, 2010; Terlaak and King, 2006; Toffel and Short, 2011). This extensive
body of research tacitly assumes a pivotal role for private auditors, but provides little insight into
how they play that role (Heras-Saizarbitoria and Boiral, 2013).
A few empirical studies have investigated influences on private-sector auditor
performance, but have focused almost exclusively on economic conflicts of interest. For
example, research finds auditors more lax when monitoring their own paying clients (e.g., Duflo
et al., 2013; Jiang, Stanford, and Xie, 2012; Kinney, Jr., Palmrose, and Scholz, 2004), facing
more competition (Bennett et al., 2013), enjoying lucrative cross-selling opportunities (Pierce
and Toffel, 2013), or operating in corrupt environments in which they are more likely to receive
side payments from audited firms (Montiel, Husted, and Christmann, 2012). Based on such
findings, the literature has assumed that profit is the private auditor’s dominant, if not exclusive,
motive (Bazerman, Morgan, and Loewenstein, 1997; Moore et al., 2006; Partnoy, 2006).
While it is crucial to understand how conflicts of interest affect the quality of information
generated through monitoring, our study seeks to move beyond economic incentives to
investigate how social institutions and relationships shape and constrain the performance of
monitoring functions. These influences are well established in related literatures, but they have
yet to inform understandings of monitoring as a governance structure supporting outsourced
production. TCE’s foundational assumption is that transacting parties are constrained by

7
bounded rationality (Williamson, 1979), but it has failed to consider how bounded rationality
likewise constrains those who do the monitoring. Research on public regulatory implementation
suggests that government monitors are constrained by bounded rationality. For instance, studies
document significant heterogeneity in the way government inspectors apply the rules they are
charged with enforcing (Feinstein, 1989; Hawkins, 1984; Lemley and Sampat, 2012; Macher,
Mayo, and Nickerson, 2011) based on a variety of social factors (Lipsky, 1980/2010; Piore,
2005; Schrank, 2009). Experimental studies in social psychology similarly reveal the influence
of cognitive biases on the performance of financial auditors (e.g., Asare, Trompeter, and Wright,
2000; Tetlock, 1983). But these insights have not been tested in the context of private supply
chain monitoring. We draw on these literatures to develop hypotheses about the factors
influencing private supply chain auditors and to illuminate how firms can structure governance
arrangements to maximize the reliability of the strategic information they receive about their
suppliers through monitoring.
HYPOTHESES
Ongoing auditor-supplier relationships
The primary function of transactional governance structures is to “economiz[e] on bounded
rationality while simultaneously safeguarding the transactions in question against the hazards of
opportunism” (Williamson, 1979: 245–6). However, the implementation of governance
structures is itself constrained by bounded rationality and thus subject to opportunism. Many
have theorized that monitors who repeatedly inspect a firm are likely to be shaped by cognitive
biases and social pressures that will influence the violations they detect and cite. Bounded
rationality limits the number of issues an auditor can pursue during any given audit (Jones, 2001;
Simon, 1947). As Chugh and Bazerman (2007: 3) have argued, “bounded awareness” causes
8
individuals to “overfocus on some information and fail to use other easily available information.”
Specifically, people tend to focus on information that comports with the tacit knowledge they
have gained through experience. Though tacit knowledge can be a useful resource for decision
makers, “dependence on tacit knowledge can create bounds on their awareness” (Kumar and
Chakrabarti, 2012: 940) that limit their ability to perceive new issues.
These cognitive constraints are likely to be reinforced by social pressures and
opportunism. Returning auditors may develop “cozy relationships” (Moore et al., 2006: 24) with
an audited firm’s management that leads them to identify with and support its positions. In some
circumstances, these relationships may go from cozy to corrupt if familiarity between auditors
and management emboldens managers to pressure or even bribe auditors to report good results
(Khalil and Lawarrée, 2006; Montiel, Husted, and Christmann, 2012).
Empirical research has found that managers’ awareness is bounded by experience.
“Managers use already established knowledge to determine what they see, and they use what
they already know to choose what to look for in their environment” (von Krogh, Roos, and
Slocum, 1994: 58); such “perceptual and cognitive limitations” lead to errors (Huber and Power,
1985: 172). Empirical research has found that ongoing relationships between government
inspectors and inspected entities encourage a “benefit of the doubt” style of enforcement rather
than an arms-length “policing” style (Bardach and Kagan, 1982/2002), resulting in milder
penalties (Muehlenbachs, Staubli, and Cohen, 2013). We argue that private supply chain
auditors will be subject to similar social pressures and cognitive constraints. If they repeatedly
inspect the same supplier, they are more likely to focus on the domains they highlighted
previously and to align their perspective with that of management, whereas a new audit team
would bring a fresh set of eyes and focus on different issues, likely uncovering new violations.

9
Hypothesis 1 (H1): An audit will yield fewer violations when conducted by an audit team that includes a member of the supplier’s previous audit team.
Auditor tenure
Rationality can be bounded not only by cognitive constraints, but also by social structures,
identities, and socialization (March and Olsen, 1998; Simon, 1947). Auditors’ tenure on the job
is associated with their level of professional knowledge, their place in the audit firm’s
organizational hierarchy, and their professional self-concept. Scholars and activists have argued
that more-experienced supply chain auditors are more effective (Esbenshade, 2004; Locke, Qin,
and Brause, 2007). It is not clear, however, how experience affects the number of violations
cited in a given audit. On the one hand, experience enhances auditors’ practical knowledge and
thus their ability to identify violations, as has been documented in qualitative studies of
government inspectors (Bardach and Kagan, 1982/2002). Our interviews with managers of social
auditors indicate that experience acquaints auditors with “tricks of the trade” such as how to
detect that a supplier uses child labor even if child workers are not present during the audit.
On the other hand, these initial marginal detection gains from experience tend to diminish
over time and it is not clear that more-experienced auditors will cite more violations. Scholarship
on government regulatory agencies has suggested that new inspectors tend to exhibit “a more
policing, nit-picking attitude” than more seasoned inspectors (Bardach and Kagan, 1982/2002:
129). Inexperienced inspectors “know too little about the industries and operations they are
inspecting” and thus “lack the confidence to evaluate actual levels of risk” posed by particular
violations, so they tend to go by the book and cite everything (Bardach and Kagan, 1982/2002:
129). Experienced inspectors, by contrast, may decline to cite violations lacking the requisite
level of risk and culpability as they gain more confidence in their professional judgment
(Bardach and Kagan, 1982/2002; Hawkins, 1984). We therefore expect that violation counts will
10
initially rise with auditor tenure, as auditors gain the experience to detect violations, but that this
effect will be tempered as the benefits of experience attenuate and as experienced auditors gain
the confidence to exercise more discretion about which violations to cite.
Hypothesis 2 (H2): Audits conducted by more experienced auditor teams will yield more violations but at a decreasing rate.
Professionalization
Education and training are important sources of professional socialization that should impart to
monitors both the skills to detect more violations and the sense of professional obligation to
report violations to their principal (March and Olsen, 1998). Sociologists have long theorized
that professionalization—specialized education and training in a field’s skills and values—is a
key constraint on individual discretion in both corporate and government bureaucracies (Abbott,
1988; Scott, 1966). Lipsky (1980/2010: 201), for instance, has argued that enhanced
professionalism rationalizes the way front-line workers in government bureaucracies exercise
discretion: “[S]treet-level bureaucrats should be professionals whose relatively altruistic
behavior, high standards, and self-monitoring substitute for what the society cannot dictate. Who
will watch the watchmen? The watchmen will watch themselves.” Scholars have also suggested
that professionalism can help internal corporate compliance monitors at for-profit firms resist the
influence of economic pressures and perform their oversight functions more effectively (Parker,
1999). Research has demonstrated that professionalization can improve the efficacy of
government labor inspectors (Piore, 2005; Schrank, 2009). We therefore expect that teams whose
auditors are more professionalized will record more violations.
Hypothesis 3 (H3): Audits conducted by teams that include auditors who are more professionalized will yield more violations.
Gender
Research has suggested that, even when constrained by bureaucratic rules and roles, men and
11
women may perform their work “somewhat differently” (Eagly and Johannesen-Schmindt, 2001:
783). Several gender-based behavioral distinctions documented in the literature can influence
whether social auditors discover—and also whether they cite—violations. Research has shown
that women are more persistent at pursuing assigned tasks (Spence and Buckner, 2000;
Stonewater, Eveslage, and Dingerson, 1990), potentially motivating them to search more
diligently for violations. Research has also found that women have perceptual and integrative
processing advantages that may enhance their ability to detect violations. For example, women
have been found to be more skilled at interpreting the emotional content of others’ expressions
(Killgore and Cupp, 2002; Thayer and Johnsen, 2000) and to be “more sensitive to subtle
stimulus” (Darley and Smith, 1995: 43). Research has also found that women tend to use a more
comprehensive information-processing style, whereby they “attempt to assimilate all available
cues” (Darley and Smith, 1995: 43). According to Gold, Hunton, and Gomaa (2009: 3):
[W]omen tend to integrate more of the available evidential cues into their judgments, reflecting an intense level of cognitive processing. Men, on the other hand, tend to eliminate what they deem to be irrelevant cues and focus on a limited set of salient pieces of information that are relatively easy and quick to process.
Thus, women’s style of gathering and processing information may better equip them to perceive
violations in a complex factory setting and to elicit information about violations from employees.
Moreover, research suggests that women are more likely to cite the violations they
perceive. Women in bureaucratic organizations are more likely than men to be strict rule-
followers (Oberfield, 2010; Portillo, 2012; Portillo and DeHart-Davis, 2009). A long line of
sociological scholarship has argued generally that “rules are a means of asserting power for the
less powerful” (Portillo, 2012: 91) and that low-status members of organizations use rules as a
source of authority to compensate for their lack of personal authority (Green and Melnick, 1950;
Thompson, 1977). We know of no research on women’s status in supply chain auditing, but

12
research on financial auditors and audit firms suggests that, even as many women have entered
that profession, masculine organizational cultures still tend to devalue women’s contributions
(Haynes, 2012; Jonnergård, Stafsudd, and Elg, 2010). Empirical studies of government workers
find that women do indeed “go by the book” (Green and Melnick, 1950; Portillo, 2012; Portillo
and DeHart-Davis, 2009) more strictly than their male colleagues do. This evidence suggests that
gender will significantly influence whether supply chain auditors detect and cite violations.
Hypothesis 4 (H4): Audits conducted by all-female teams will yield more violations than those conducted by all-male teams.
Gender diversity
Supply chain auditing teams are not necessarily all-male or all-female. In the organizational
literature on teams, there is significant debate about the effects of diversity, including gender
diversity, on team performance (Joshi and Roh, 2009; Phillips et al., 2012). We expect that
gender diversity will enhance a supply chain auditing team’s performance because of
complementary perceptual styles and interpersonal dynamics.
First, women’s and men’s different perceptual styles may cause them to identify different
types of violation, enabling mixed-gender teams to find more. This should be particularly
valuable in eliciting information from a diverse set of employees and managers. Research has
demonstrated that “diversity in groups increases the likelihood that there will be access to
different information in a group” (Phillips et al., 2012: 161). Our interviews with social auditors
indicate that audited factories tend to have mainly female workers and male managers and that
the female workers are more likely to communicate openly with female auditors, while, as one
interviewee put it, male supplier managers, “for cultural reasons, may find it difficult…to open
up to women.”
Second, research has shown how the interpersonal dynamics of gender diversity can
13
improve team performance. For instance, studies find that people on socially diverse teams tend
to prepare more thoroughly and to think through a broader range of issues (Loyd et al., 2013).
Fenwick and Neal report the superior performance of gender-diverse teams in management-
simulation exercises, crediting it to the “mix of male and female operating, decision-making and
leadership styles” (2001: 217). Furthermore, men on mixed teams may work harder if they sense
they are being outperformed by women. Studies have shown that lower-performing team
members often compare themselves to better performers and that this motivates them to improve
their performance to meet or exceed that of the stronger performers (Lount, Jr. and Phillips,
2007; Weber, Wittchen, and Hertel, 2009). Weber, Wittchen, and Hertel (2009) demonstrate that
men are particularly prone to such competitive behavior. Male auditors may therefore feel
compelled to match or beat their female teammates’ higher citation rates.
Although some evidence suggests that gender diversity can sometimes undermine team
performance (Phillips et al., 2012), a recent meta-study found that gender diversity is particularly
likely to enhance performance in service industries, where team members interact directly with
clients (Joshi and Roh, 2009). Because supply chain auditing is a service industry and auditors
interact extensively with those they audit, we expect gender diversity to improve team
performance.
Hypothesis 5 (H5): Audits conducted by gender-diverse teams will yield more violations than those conducted by single-gender teams.
DATA AND MEASURES
Empirical context and sample
To test our hypotheses, we obtained data for thousands of code-of-conduct audits conducted in
66 countries between 2004 and 2009 by one of the world’s largest social auditing companies.1
1 The company required anonymity as a condition of sharing its data with us.

14
During that period, the company, which already had more than a decade’s experience, employed
several hundred people in many countries; they spoke over 30 languages.
The dataset contains audit results for and information about each audited supplier,
including its country and a unique identifier; characteristics and unique identifiers for the
auditors on each audit; and the country of the multinational firm on whose behalf each audit was
conducted and a unique identifier for that firm. Our estimations are based on the 16,795 audits of
5,819 factories (in 66 countries) for which we had data on all the measures described below and
which had been audited at least twice during the sample period (a technical requirement owing to
our models being estimated with supplier-level fixed effects, described below). The industry
composition of our sample is reported in Table 1; the most common industries are garments,
accessories, electronics, and toys.2 In our dataset, the brands nearly always determined which
suppliers would be audited.3
[Insert Table 1 about here]
Dependent variable
We measure the extent to which factories adhere to codes of conduct as the number of violations
in each audit,4 obtained from the social auditing firm’s database. We include only the types of
violation that, according to the social auditing firm (hereafter referred to as “the auditing firm”),
apply in all industries and are interpreted by auditors in the same way in all countries; namely,
violations of rules for child labor, forced or compulsory labor, working hours, occupational
health and safety, minimum wage, treatment of foreign workers and subcontractors, and
2 The geographic distribution of audited establishments and audits are reported in Table B1 of Appendix B. 3 Factories sometimes sought audits to become certified to a third-party standard such as SA8000. As described later, our results are robust to omitting the very small proportion of audits that used third-party protocols. 4 Studies of compliance with government health and safety regulations have long used violation counts recorded by inspectors as a measure of compliance variation (Braithwaite and Makkai, 1991; Gray and Shadbegian, 2005) and more recent studies of supplier compliance with private labor standards have used violation data recorded by private auditors (Ang et al., 2012; Oka, 2010).

15
disciplinary practices.5 During an audit, the auditors code a common set of dichotomous
indicators (violation or no violation) in each category.6
Independent variables
To identify the potential for auditors’ relationships with audited suppliers to influence their
behavior, we coded previous auditor as 1 when at least one member of the focal audit team had
participated in one of the supplier’s previous audits during the sample period and 0 otherwise.
We measure an auditor’s experience as his or her years of service at the auditing firm
based on data from the auditing firm’s database. We calculated maximum tenure as the highest
number of years that any member of the audit team had worked at the company.7
We measure the professionalism of the audit team in two ways. Because one important
source of professionalization is “standardized formal training in universities” (Lipsky,
1980/2010: 201), we code graduate education as 1 when at least one member of the audit team
had a graduate degree and 0 otherwise. We focused on graduate education because nearly all
auditors in our dataset had a bachelor’s degree.8 We also created auditing skills training as the
5 We exclude other categories that, according to our auditor interviews, are applied only to certain factories or are interpreted differently in different countries: the right of association, the right to organize and bargain collectively, legal client regulation, dormitory conditions, and canteen violations. 6 The occupational health and safety category, for example, consists of seven indicators pertinent to emergency preparedness (blocked or locked aisles or exits, inadequate first-aid supplies, insufficient emergency exits, lack of emergency lighting, lack of employee emergency training, lack of an evacuation plan, and unmarked aisles), five indicators of fire safety, eight related to toilets, and eight related to the work floor. 7 Using average tenure rather than the maximum tenure yielded nearly identical results. Tenure is measured as work experience at our focal firm, where audit team tenure averages nearly 5 years, audit team age averages 30 years old, and nearly all auditors have at least a bachelor’s degree. Tenure at the focal firm is thus a reasonable proxy for the entire auditing experience of many auditors in our sample. To assess whether the potential influence of unobserved auditing experience at prior employers might be driving our tenure results, we re-estimated our primary model on the subsample of audits where the influence of prior auditing experience is least likely a concern: those conducted by relatively young auditors. Results estimated on the subset of audits conducted by teams whose maximum age was no more than 30 years old yielded coefficients on maximum tenure (= 0.06, p=0.01) and maximum tenure squared (= -0.003, p=0.04) remain statistically significant and are of the same sign as those yielded by our primary model. This bolsters our confidence that tenure, despite being measured only at our focal firm, significantly influences audit results. 8 We coded graduate education as a dichotomous variable rather than a continuous measure to better reflect the near-binary distribution in our sample: 87 percent of the audit teams had no members with a master’s degree, 7 percent had all members with a master’s degree, and a mere 6 percent had an intermediate configuration.
16
highest number of the auditing firm’s training courses that any audit team member had
completed. These courses teach skills such as how to interpret national labor laws and how to
detect payroll manipulation that might indicate wage violations.9
We measure gender composition with three dummy variables—all-female audit team,
all-male audit team, and mixed-gender audit team.10
Control variables
Using the auditing firm’s database, we calculated the proportion of each team that had undergone
certification training—training on the standards and protocols of a particular certification
regime, such as SA8000—because the firm indicated that such training influences the scope of
the audit and the types of violation auditors look for. We also calculated the proportion of each
team that had undergone brand training—training provided by the multinational firm on its
corporate responsibility program and procedures—to account for possible variations in
stringency requested by different brands.
We created a proxy for each audit team’s average age based on coarsened auditor age
data provided by the auditing firm. To keep precise ages confidential, the firm provided five-year
age-range categories (for example, 20–24 years old) for each auditor. We calculated the midpoint
for each category and then created average age as the average of the oldest and youngest age-
range categories on a team.11
We created a dummy variable to indicate whether an audit was conducted according to a
third-party protocol—such as that of the Business Social Compliance Initiative (BSCI), the
Initiative Clause Sociale (ICS), the Sedex Members Ethical Trade Audit (SMETA), the
9 Using the average rather than the maximum number of training courses yielded nearly identical results. 10 We use these dummies rather than a continuous measure such as proportion female because the database indicated that 97 percent of the audit teams in our sample were all-female, all-male, or evenly divided. Thus, the three dummies represent the distribution of our data. 11 Using the oldest team member’s age rather than the team’s average age yielded nearly identical results.

17
International Council of Toy Industries (ICTI), or Worldwide Responsible Accredited
Production (WRAP).
We measure whether an audit is unannounced or pre-announced, using a dummy
variable, unannounced audit, coded 1 for an unannounced audit and 0 for a pre-announced audit.
To indicate which entity paid for each audit,12 we created two dichotomous variables
based on the auditing firm’s database. Audit paid for by supplier or agent identifies audits with
the potential for financial conflict of interest. It is coded 1 for audits paid for by the audited
supplier or by agents, vendors, or licensees and coded 0 for audits paid for by the multinational
firm.13 Audit paid for by the multinational firm is coded in the opposite manner.
We include dummy variables to control for the number of auditors on each audit (two
through five, with one as the omitted category).
Based on the auditor’s database, we created a dummy variable to distinguish routine
audits from re-audits, which tend to have a narrower focus on those domains where violations
were previously identified. We created dummies to indicate a supplier’s audit sequence—its
second audit, third audit, and so on through sixth-or-higher audit (because only five percent of
the audits in our sample were the seventh or higher), with a supplier’s first audit as the omitted
category.14
We measure a supplier country’s average economic development in the year the audit
12 In our dataset, multinational firms nearly always determined whether they or the supplier (or its agents) paid for an audit. Our interviews indicated that this decision was not driven by the supplier’s managerial attitude, violation rate, or improvement rate. Factories sometimes sought and paid for audits when they sought to become certified to a third-party standard such as SA8000. As described later, our results are robust to omitting from the estimation sample the very small proportion of audits that used third-party protocols. 13 We combined these categories of payer because prior research and our auditor interviews suggest that, in our empirical context, the financial incentives of factories and these intermediaries are closely aligned. In developing economies, intermediaries’ role is to promote exports by domestic manufacturers by identifying new markets for their goods and services (Ellis, 2011) and by reducing transaction-cost barriers to export (Ahn, Khandelwal, and Wei, 2011). Our results are robust to an alternative specification in which we include two dummies that control separately for audits paid by factories and for audits paid by agents, vendors, or licensees. 14 Using an audit sequence counter variable and its square rather than the dummies yielded nearly identical results.

18
was conducted as its annual per-capita gross domestic product (GDP) in 2005 dollars, calculated
by the U.S. Department of Agriculture’s Economic Research Service (obtained from
http://www.ers.usda.gov). To reduce skew, we use the log. To measure the extent to which the
government of the supplier’s country fosters a regulatory environment promoting economic
development, we use the annual regulatory quality metric corresponding to the year the audit
was conducted, calculated by the World Bank’s Worldwide Governance Indicators project
(obtained from http://data.worldbank.org/data-catalog/worldwide-governance-indicators) to
capture “perceptions of the ability of the government to formulate and implement sound policies
and regulations that permit and promote private sector development” (World Bank, 2013).15
We measure the extent of press freedom in the supplier’s country the year the audit took
place via the annual Press Freedom Index produced by Reporters without Borders (obtained from
http://en.rsf.org). This index incorporates the extent to which journalists face direct and indirect
threats—including imprisonment, physical attacks, censorship, and self-censorship—and the
number of journalists detained, murdered, physically attacked, or threatened. We create annual
press freedom by reverse-coding the Press Freedom Index, so that a higher score represents more
press freedom, and then rescaling the result to range from 0 to 1.
Summary statistics are reported in Table 2.16
[Insert Table 2 about here]
EMPIRICAL MODEL AND RESULTS
Our empirical model includes all independent and control variables described above and three
sets of fixed effects. Specifically, we estimate the following model:
15 Controlling instead for supplier countries’ annual Corruption Perceptions Index scores from Transparency International, which are highly correlated with the World Bank’s regulatory quality metric (=0.96), yields nearly identical results. 16 Correlations are reported in Table B2 in Appendix B.

19
Yicdj = F ( β1 Xid + β2 id + β3 cd + β4 i + β5 t + β6 j + εicdj),
where Yicdj refers to the number of violations recorded in the audit of supplier i in country c that
was conducted on date d on behalf of a multinational firm in country j. F (·) refers to the Poisson
function. Xid refers to our hypothesized variables (previous auditor, maximum tenure, average
tenure, graduate education, auditing skills training, all-male audit team, all-female audit team,
mixed-gender audit team).
id refers to the audit-level control variables described above. We control for certification
training and brand training because these types of training might influence an audit team’s
ability to detect and report violations or the nature of the violations it detects and reports and
because prior research has indicated that training can influence the stringency of government
monitors (Macher, Mayo, and Nickerson, 2011). We control for audit teams’ average age and its
square to ensure that the effects of auditor tenure can be attributed to job experience rather than
to the life-cycle effects posited by human capital theory (Diamond, Jr., 1984), which predicts “an
inverse U-shaped relationship between productivity and age” (Teitelbaum, 2006: 166). We
control for whether an audit was conducted according to a third-party protocol because such
protocols might limit an auditor’s discretion. We control for whether an audit was an
unannounced audit or an announced audit because the latter provides several weeks of notice
that might enable the supplier to remedy problems before the audit, which could result in fewer
violations once the auditors arrive. We include controls for which entity paid for the audit (audit
paid for by supplier or agent and audit paid for by multinational firm) because research has
indicated that financial conflicts of interest created by audit fees undermine auditors’ and
inspectors’ stringency (Duflo et al., 2013; Moore et al., 2006; Partnoy, 2006). We also control
for whether an audit is a re-audit because those tend to focus on the domains where violations
20
were previously identified and therefore can yield fewer violations than routine audits. We
include dummies to control for the number of auditors because larger audit teams are assigned to
larger and more complex establishments and because prior research has shown that larger teams
of government inspectors can lead to more stringent monitoring (Muehlenbachs, Staubli, and
Cohen, 2013). We include dummies indicating the supplier’s audit sequence to control for the
possibility that successive audits yield fewer violations as factories address the issues exposed.
cd refers to the annual supplier-country control variables described above: per-capita
GDP (log), regulatory quality, and press freedom. These country-level governmental, economic,
and civil-society attributes control for institutional factors that can influence a supplier’s
compliance with codes of conduct (Toffel, Short, and Ouellet, 2015). j refers to fixed effects for
the headquarters country of the MNC on whose behalf each audit was conducted. This controls
for the possibility that consumers and activist groups in different countries vary in their concern
for and attentiveness to supply chain conditions, which might in turn affect how much pressure
firms headquartered in those countries exert on their supply chain auditors to audit stringently
(Toffel, Short, and Ouellet, 2015). These fixed effects also control for all other time-invariant
differences between the headquarters countries’ institutional contexts.
We include fixed effects for each supplier (i) to control for time-invariant characteristics
that might affect its violation rate, such as size, age, industry, and national institutional context.17
Dummies for the audit year (t) control for overall temporal trends.
Our identification strategy is based on the fact that the process of assigning auditors to
audit teams is unrelated to our independent variables and thus is not a source of endogeneity that
17 Because supplier-level fixed effects in our model absorb the time-invariant portion of supplier-country-level variables, per-capita GDP, regulatory quality, and press freedom effectively control for within-country temporal variation in their effect on supplier violation rates.
21
should bias their coefficients. Specifically, our interviews with the auditing firm indicated that
assignments were based on (1) language skills to communicate with management and workers,
(2) availability, and (3) the need for at least one team member to qualify as a lead auditor.18
Results
We estimate the model using Poisson regression with robust standard errors and report our
results in Column 1 of Table 3. Negative binomial regression with conditional fixed effects
yields nearly identical results, indicating that our results are not sensitive to estimation technique.
Variance inflation factors (VIF) were below 2 for all hypothesized variables and below 5 for all
variables except a few buyer-country dummies, which yields no evidence that multicollinearity is
a serious concern. The explanatory power of the model is indicated by a McFadden’s R-squared
value of 0.39 and a McFadden’s adjusted R-squared value of 0.30.
[Insert Table 3 about here]
The significant negative coefficient on previous auditor (= -0.04; p = 0.03; IRR = 0.96)
indicates that audits yield 4 percent fewer violations when a team member had participated in a
prior audit of the same supplier, which supports Hypothesis 1. The average marginal effect
(AME) of -0.3 indicates that, compared to the sample average of 6.5 violations, an audit by a
team with a previous auditor would yield 6.2 violations.
The audit team’s maximum tenure has a significant positive coefficient ( = 0.07; p <
0.01) and its square term has a significant negative coefficient ( = -0.004; p < 0.01), implying
that the number of violations cited increases as tenure increases but at a diminishing rate, which
supports Hypothesis 2.19
18 Potential concerns that endogenous audit assignment might bias results led us to conduct several supplemental analyses described below and in Appendix A. 19 This relationship is illustrated in Figure C1 in Appendix C, which graphs average predicted violations at varying levels of the audit team’s maximum experience.

22
Our results are mixed with respect to professionalization. The coefficient on graduate
education is positive as predicted but not significant, yielding no evidence that audits conducted
by teams with more formal education yielded significantly more violations. Audits did yield
significantly more violations when conducted by more professionalized auditors as measured by
auditor training ( = 0.02; p < 0.01; IRR = 1.02). This result is not driven by age or tenure, for
which we control. The AME indicates that each additional training course (beyond that
possessed by the team’s most highly trained member) is associated with an additional 0.14
violations. In other words, an audit team whose most highly trained member had taken nine
training courses would, on average, cite one more violation than a team whose most highly
trained member had taken two training courses. Jointly, these results yield some support for
Hypothesis 3, but only when professionalization is measured by specific training rather than by
broader education.
Team gender composition is also significantly associated with the number of violations
reported. Audits by all-female teams yield 6 percent more violations than those by all-male
teams (the baseline) ( = 0.05; p < 0.01; IRR = 1.05), which supports Hypothesis 4. The average
marginal effect indicates that audits by all-female teams yield 0.35 more violations than those by
all-male teams (the baseline category).
Mixed-gender teams yield on average 7 percent more violations—or nearly half a
violation more—than all-male teams (the baseline) ( = 0.07; p < 0.01; IRR = 1.07) and slightly
more violations than all-female teams (AME = 0.1), but the latter difference is not statistically
distinguishable (2 = 0.55; p = 0.46). These results partially support Hypothesis 5.
The coefficients on second inspection through sixth or more inspection are negative and
significant. Wald tests comparing these coefficients indicate that, on average, each successive

23
audit yields significantly fewer violations. AMEs indicate that, on average, a supplier’s second
audit yields nearly one fewer violation than its initial audit during our sample period (= -0.15;
p < 0.01; AME = -0.9), its third audit yields nearly 1.3 fewer than its second audit (AME = -2.2,
a statistically significant decline: Wald 2 = 114; p < 0.01), and its fourth audit yields 0.6 fewer
than its third audit (AME = -2.8, a statistically significant decline: Wald 2 = 20; p < 0.01).20
Consistent with assigning more auditors to larger factories, which are likely to generate
more violations, we find that audits with more auditors yield significantly more violations. We
find no evidence that the number of violations varied with the team’s certification training, brand
training, or average age or with a third-party protocol. Our point estimate indicates that
unannounced audits yielded slightly more violations than announced audits at a given supplier
(AME = 0.2), but the difference was outside conventional significance levels (p = 0.15).
Audits paid for by factories or agents yielded 8 percent fewer violations than audits paid
for by the multinational firm, the baseline category (= -0.08; p < 0.01; IRR = 0.92). The
average marginal effect indicates that, on average, audits yield 0.6 fewer violations when the
supplier or agent pays than when the multinational firm pays, a drop from 6.5 to 5.9.
Audits yielded fewer violations in countries with greater per capita GDP (= -0.62; p =
0.02; AME = -4.0) and in those with greater press freedom ( = -0.51; p = 0.02; AME = 3.3).
Our point estimate indicates fewer violations at factories in countries with higher regulatory
quality, but the relationship was not statistically significant ( = -0.18; p = 0.22).
Robustness tests
Potential concerns that endogenous audit assignment—and, in particular, differences between
lead auditors and other auditors—might bias our results led us to conduct several supplemental
20 This relationship is also apparent in the summary statistics depicted in Figure C2 in Appendix C.

24
analyses. As described in Appendix 1, instrumenting for the audit team’s maximum audit skills
training and maximum tenure—using average values of these characteristics among all auditors
based in the auditing firm’s field office that staffed each establishment’s audits—yielded results
statistically indistinguishable from our primary results (Hausman test = 52.09; p = 0.16), thus
offering no evidence of endogeneity bias.
Estimating our primary model using negative binomial regression yielded results nearly
identical to those of our primary approach, which used Poisson regression. We also estimated our
primary model on various subsamples to assess the extent to which our results were driven by
certain types of audits. Column 2 of Table 3 reports estimates after excluding the 210 audits
performed for multinational firms whose audit teams were always all-female, in case that pattern
reflected a client policy that might bias our results. Column 3 reports estimates based on the
10,648 audits conducted by teams of at least two to ensure that our results were not driven by
single-auditor audits. Column 4 reports estimates after excluding the 751 audits conducted
according to third-party protocols, in case the influence of such protocols on the discovery or
reporting of violations is not adequately controlled for with the dummy variable used in our main
specification and also because, in these cases, the factories themselves might have chosen the
protocol and auditor. Column 5 reports results for the subsample of 9,266 audits that excludes
each supplier’s first audit in our sample; some of those might have been pre-assessments of
factories that multinational firms had not yet engaged and our hypothesized relationships might
operate differently in such cases. Our results are quite robust across these subsamples. The sign
and magnitude of all hypothesized variable coefficients are very similar to those in our main
results.

25
DISCUSSION
Our research indicates that supply chain auditors’ identification and reporting of violations of
supplier codes of conduct are shaped not only by the financial conflicts of interest that have been
the focus of research to date, but also by social factors that include the auditors’ experience,
professional training, and gender; the gender diversity of their teams; and their repeated
interactions with those whom they audit. These findings contribute to the TCE stream within the
strategic management literature and to the transnational business regulation literature. Our results
also suggest strategies for designing private monitoring regimes to provide companies with more
reliable strategic information about their supply chain partners.
Contributions to the strategic management literature
While the TCE literature highlights the important governance function of monitoring, it contains
little empirical research on monitoring and has not addressed monitoring’s distinct role in
managing reputational risk in global supply chains. Our study significantly extends the TCE
literature on monitoring to address this key strategic concern. First, we highlight the particular
importance of supply chain monitoring to mitigate the risk of reputational spillovers. The TCE
literature on global outsourcing has largely assumed that the transaction costs of outsourced
production are dwarfed by its production economies and, moreover, are becoming vanishingly
small with advances in digital communication that have radically reduced information,
bargaining, and monitoring costs (e.g., Levy, 2008). We argue that this perspective obscures the
potentially large reputational spillover costs of outsourcing to suppliers with poor social or
environmental practices, and our findings suggest that outsourcing firms must carefully consider
whether their monitoring arrangements are well designed to effectively manage these costs and
at what point the costs of effective monitoring become sufficiently large to undercut the

26
economic gains of outsourcing production. These insights bridge the TCE literature with
strategic management perspectives on reputation (Roberts and Dowling, 2002).
Second, we extend the existing literature’s focus on the ex ante design of monitoring
structures to highlight the need for effective ongoing ex post monitoring to safeguard against
opportunism in outsourcing relationships. TCE studies of monitoring have tended to focus on
“ex ante safeguards to deter ex post opportunism” (Williamson, 2008), such as the appropriate
design of contractual provisions (Argyres, Bercovitz, and Mayer, 2007; Barthélemy and Quélin,
2006; Gereffi, Humphrey, and Sturgeon, 2005). Our empirical documentation of heterogeneity
in the reliability of information generated by monitors makes it clear that for monitoring to
mitigate the transaction costs of reputational spillovers, it must be not only properly designed,
but also effectively implemented.
Third, we extend TCE’s foundational concern with the bounded rationality of contracting
parties (Williamson, 1979) to third parties—those who support outsourced transactions—by
demonstrating the ways in which these actors are likewise constrained by social, cognitive, and
relational factors. Research addressing the limitations of monitors has, to date, focused on their
opportunistic behavior (Khalil and Lawarrée, 2006) rather than on more generic constraints on
their rationality. More generally, the literature tends to assume that monitoring is becoming
increasingly effective because of advances in “technology, standardization of business processes,
and plunging communication costs” (Geis 2007: 998), but this perspective fails to acknowledge
that individuals engaged in monitoring activities remain subject to the limits of bounded
rationality. Our research identifies this important oversight and suggests ways that managers can
economize not only on their own bounded rationality, but that of their monitors.
Finally, we identify important second-order monitoring problems that arise when firms
27
outsource monitoring functions to third-parties. Existing TCE accounts tend to assume that
monitoring is carried out by the transacting parties themselves. Increasingly, however, these
functions are performed by private, third-party firms such as social auditors, certification
organizations, assurance services, and consultants. This introduces potential agency problems,
because third-party monitors often have different incentive structures than the principals that hire
them (Khalil and Lawarrée, 2006; Pierce and Toffel. 2013). Our study highlights the need for
greater attention to these complex governance structures and our findings offer strategies firms
can use to monitor their monitors and increase the reliability of the strategic information those
monitors supply. These strategies, discussed below, are relatively cost-effective ways to
economize on monitors’ bounded rationality.
Contributions to the transnational business regulation literature
Supply chain auditing has become an important component of transnational business regulatory
schemes that seek to address the social and environmental risks of global business activities
(Braithwaite and Drahos, 2000; Toffel, Short, and Ouellet, 2015). Private labeling regimes such
as the Forest Stewardship Council, the Marine Stewardship Council, and Fair Trade rely on
private third-party auditors. International intergovernmental institutions such as the United
Nations have encouraged supply chain auditing by requesting that MNCs conduct “due
diligence” to ensure their suppliers’ compliance with international human rights norms (Ruggie,
2008). Many national regulators have followed suit, requiring MNCs to conduct due diligence
and disclose supply chain practices (Zandvliet, 2011). The efficacy and legitimacy of
transnational business regulation largely depends on the credibility of private monitoring; our
study responds to calls for more empirical research on the key actors (Büthe, 2010). While our
findings of auditor heterogeneity support those who question the independence and objectivity of

28
private monitors (Boiral and Gendron, 2011; Power, 1997), our identification of several
systematic determinants of that heterogeneity suggests how companies and policymakers can
improve audit validity. In addition, as governments begin to mandate certain ESG measures and
sustainability disclosures that were once voluntary, our findings can help firms develop
compliance strategies to mitigate emerging legal risks associated with supply chain monitoring.
Implications for managers
Our study has implications for companies that hire auditors to monitor their suppliers and for
those auditing firms. Our findings reveal to both some key characteristics of audit teams that can
enhance audit quality. More broadly, our findings can inform those who hire or manage other
types of private gatekeepers, such as accounting firms and credit rating agencies—subjects of
much interest since their failures to detect and reveal corporate wrongdoing led to corporate
scandals and financial meltdowns in the early twenty-first century (Partnoy, 2006).21 Our work
should also spur companies employing auditors to monitor suppliers to consider whether the
mechanisms revealed in this study are at play among these internal auditors.
Research suggests that managers tend to assume the professional independence and
objectivity of their supply auditors (Dogui, Boiral, and Gendron, 2013). Our interviews with
managers of companies that hire supply chain auditors indicate that these managers pay a great
deal of attention when selecting audit firms, but then mainly leave it to the auditing firms to
select the individual auditors who assess their suppliers. It may seem logical to “leave it to the
experts,” but our results show that audit report quality suffers when the corporate client
overlooks the auditor assignment process. In particular, managers of companies that hire supply
chain auditors should pay closer attention to auditor training and experience, the gender
21 The gatekeeper literature, like the auditing literature, has focused almost exclusively on the influence of economic conflicts of interest (Bazerman, Morgan, and Loewenstein, 1997; Moore et al., 2006; Partnoy, 2006).

29
composition of teams, and auditor rotation. Our work also confirms prior research that questions
the quality of audits paid for by the audited factory.
Moreover, our interviews with managers of several supply chain auditing firms indicate
that they do not consider the key characteristics we identified when composing audit teams.
Auditor assignments are based largely on logistical considerations like availability, language
skills, minimum required training, and (in some cases) industry-specific experience. None of the
managers we interviewed indicated that they considered gender. Few expressed concerns about
re-assigning auditors to a supplier, though several remarked that doing so could expedite the
audit (thereby reducing audit cost) by leveraging the auditors’ familiarity with the facility and
staff.
Considering these prevailing practices, our results equip managers of firms that hire
auditors to monitor their suppliers and auditing firms to better understand how team
characteristics can influence audit quality. Our interviews with several auditing firms indicate that
clients have the ability to influence audit team composition, but only a small fraction of clients
actually seek to do so. Greater consideration by clients to their auditing firms’ team composition
can heighten those firms’ attention to assessing and improving audit quality. If clients face
auditing markets in which their heightened interest in audit team composition is met with
insurmountable resistance from auditing firms, clients should consider using their own
employees to monitor suppliers in those markets to assure audit quality
Because we find that auditors tend to cite fewer violations at factories where they have
ongoing relationships, client firms should consider requiring that their auditing firms regularly
rotate the auditing staff to avoid this potential source of bias.22 There are also clear managerial
22 Others have advocated rotation of auditors (e.g., Moore et al., 2006; U.S. Public Company Accounting Oversight Board, 2011)—although such calls have focused on financial auditors—and rotation of audit firms rather than of

30
implications from our finding that audit teams whose members had more training documented
significantly more violations than less-well-trained teams. Clients should insist that highly-
trained auditors be assigned to their suppliers, while auditing firms truly dedicated to providing
reliable audits—observable when different audit teams yield indistinguishable audit reports—
should reassess their minimum training requirements.
Auditing firms and their clients should also mind the gender composition of audit teams.
Our findings reveal that all-male teams yielded significantly fewer violations. Audit firms should
examine how gender composition leads to such disparities so that they can enhance their training
to better achieve the goal of audit teams yielding comprehensive results irrespective of gender
composition. In the meantime, companies hiring supplier auditors should examine whether their
audit results correlate with the gender composition of their audit teams and, if so, press those
firms to understand why. This might lead clients to develop evidence-based policies for their
third-party auditors to follow when assembling audit teams. If more clients seek to influence
audit team composition to increase audit quality, auditing firms may begin to compete on their
attention to—and ongoing assessment of—audit quality. Should such client demands face
insurmountable resistance from auditing firms in some markets, clients using suppliers in those
markets should consider relying on their own employees—rather than outsourcing—to monitor
suppliers in those markets.
Limitations and future research
Given the nature of our large quantitative study, we are unable to identify the precise
mechanisms by which the factors we identify influence individual auditor decisions. We
encourage future research to investigate the social processes underlying these outcomes.
individual auditors. A few schemes have explicitly stipulated term limits for auditing companies; for example, California’s greenhouse gas regulation requires regulated entities to change verification companies every six years.
31
Discussions with social auditors at the firm that provided our data and at competing firms
provoked no suspicion that endogeneity drives our results. Team assignments were driven
largely by language skills, availability, and the team’s need for a qualified lead auditor. Our
discussions also indicated that MNCs determine which factories are audited, obviating the risk of
a selection effect whereby better-than-average or worse-than-average factories choose to be
audited or to pay for their own audits, as happens in some voluntary environmental programs
(King and Toffel, 2009). Even so, we cannot rule out the possibility that omitted variables are
correlated with our independent variables and violation rates; we therefore encourage future
randomized field experiments (e.g., Hainmueller, Hiscox, and Sequeira, forthcoming).
Our findings relating to gender and gender diversity may be influenced by the gender
composition of the supplier’s workforce. Although we do not have such demographic data,
available meta-data and our own interviews with social auditors suggest that women dominate
the workforce in the export-intensive industries—such as garments, textiles, and electronics—
that account for most of our sample (Dejardin and Owens, 2009). Future research could explore
how auditors’ decisions are influenced by the interaction of the gender composition of the audit
team and that of the audited organization. Similarly, future research could explore the influence
of auditors’ cultural background, and especially how that might influence their interactions with
their supplier’s management and workforce.
Future research can also explore how auditors’ decisions are influenced by various short-
and long-term organizational structures and incentives. For instance, differing compensation
systems may influence the extent to which supply chain auditors’ decisions are shaped by
economic incentives and other factors. Field experiments might show which technical and
managerial training most improves auditors’ objectivity. More broadly, it is important to

32
investigate whether our findings are generalizable to other types of private gatekeeper, such as
financial auditors, credit rating agencies, and attorneys. Do they respond similarly to economic
incentives, professional obligations, and social pressures? Direct comparison of the practices of
private-sector monitors such as social auditors and public-sector monitors such as government
inspectors could reveal opportunities to enhance the efficiency and effectiveness of both. For
example, whereas less stringency has been observed among more-experienced government
inspectors (Lemley and Sampat, 2012; Macher, Mayo, and Nickerson, 2011), we observe greater
stringency (albeit at a decreasing rate) among more-experienced private monitors. From the TCE
perspective, it is important to investigate whether social monitoring actually mitigates
reputational transaction costs for outsourcing firms, either by improving the supplier’s social
practices or by providing firms with timely actionable information.
CONCLUSION
Although private supply chain auditors are increasingly important to strategic corporate
outsourcing decisions and to public and private transnational business regulation, they have
seldom attracted academic attention. Our investigation of supply chain auditing practices at
thousands of factories around the world reveals several social factors that influence auditors’
decisions. More broadly, our work contributes to the literatures on strategic management, private
supply chain monitoring, and regulatory compliance mechanisms and highlights opportunities to
improve the design and implementation of monitoring outsourced production.
REFERENCES
Abbott, A. 1988. The System of Professions: An Essay on the Division of Expert Labor. Chicago: University of Chicago Press.
Ahn, JaeBin, Amit K. Khandelwal, and Shang-Jin Wei. 2011. The role of intermediaries in facilitating trade. Journal of International Economics 84(1): 73–85.
Alcacer, J., and J. Oxley. 2014. Learning by supplying. Strategic Management Journal 35(2): 204–223.

33
Ang, D., D. Brown, R. Dehejia, and R. Robertson. 2012. Public disclosure, reputation sensitivity, and labor law compliance: Evidence from Better Factories Cambodia. Review of Development Economics 16(4): 594–607.
Argyres, N. S., J. Bercovitz, and K. J. Mayer. 2007. Complementarity and evolution of contractual provisions: An empirical study of IT services contracts. Organization Science 18(1): 3–19.
Asare, S. K., G. M. Trompeter, and A. M. Wright. 2000. The effect of accountability and time budgets on auditors’ testing strategies. Contemporary Accounting Research 17(4): 539–560.
Bardach, E., and R. A. Kagan. 1982/2002. Going by the Book: The Problem of Regulatory Unreasonableness. New Brunswick, NJ: Transaction.
Barthélemy, J., and B. V. Quélin. 2006. Complexity of outsourcing contracts and ex post transaction costs: An empirical investigation. Journal of Management Studies 43(8): 1775–1797.
Bazerman, M. H., K. Morgan, and G. F. Loewenstein. 1997. The impossibility of auditor independence. MIT Sloan Management Review 38(4): 89–94.
Bennett, V. M., L. Pierce, J. A. Snyder, and M. W. Toffel. 2013. Customer-driven misconduct: How competition corrupts business practices. Management Science 59(8): 1725–1742.
Boiral, O., and Y. Gendron. 2011. Sustainable development and certification practices: Lessons learned and prospects. Business Strategy and the Environment 20(5): 331–347.
Braithwaite, J., and P. Drahos. 2000. Global Business Regulation. Cambridge, UK: Cambridge University Press.
Braithwaite, J., and T. Makkai. 1991. Testing an expected utility model of corporate deterrence. Law & Society Review 25(1): 7–40.
Büthe, T. 2010. Global private politics: A research agenda. Business and Politics 12(3): Article 12.
Card, D. 1995. Using geographic variation in college proximity to estimate the return to schooling. In L. N. Christofides, E. K. Grant, and R. Swidinsky (eds.), Aspects of Labor Market Behaviour: Essays in Honour of John Vanderkamp: 201–222. Toronto: University of Toronto Press.
Chugh, D., and M. H. Bazerman. 2007. Bounded awareness: What you fail to see can hurt you. Mind and Society 6(1): 1–18.
Darley, W. K., and R. E. Smith. 1995. Gender differences in information processing strategies: An empirical test of the selectivity model in advertising response. Journal of Advertising 24(1): 41–56.
Dejardin, A. K., and J. Owens. 2009. Asia in the Global Economic Crisis: Impacts and Responses from a Gender Perspective. Bangkok: International Labour Organization Regional Office for Asia and the Pacific.
Delmas, M., and M. W. Toffel. 2008. Organizational responses to environmental demands: Opening the black box. Strategic Management Journal 29(10): 1027–1055.
Diamond, A. M., Jr. 1984. An economic model of the life-cycle research productivity of scientists. Scientometrics 6(3): 189–196.
Dogui, K., O. Boiral, and Y. Gendron. 2013. ISO auditing and the construction of trust in auditor independence. Accounting, Auditing & Accountability Journal 26(8): 1279–1305.
Doig, S. J., R. C. Ritter, K. Speckhals, and D. Woolson. 2001. Has outsourcing gone too far? McKinsey Quarterly 4(Autumn): 25–37.
Duflo, E., M. Greenstone, R. Pande, and N. Ryan. 2013. Truth-telling by third-party auditors and

34
the response of polluting firms: Experimental evidence from India. Quarterly Journal of Economics 128(4): 1499–1545.
Eagly, A. H., and M. C. Johannesen-Schmindt. 2001. Leadership styles of women and men. Journal of Social Issues 57(4): 781–797.
Eisenhardt, K. M. 1985. Control: Organizational and economic approaches. Management Science 31(2): 134–149.
Ellis, P. D. 2011. International trade intermediaries. In J. N. Sheth and N. K. Malhotra (eds.), Wiley International Encyclopedia of Marketing, Part 6. International Marketing. West Sussex, UK: Wiley-Blackwell.
Esbenshade, J. 2004. Monitoring Sweatshops: Workers, Consumers and the Global Apparel Industry. Philadelphia: Temple University Press.
Feinstein, J. S. 1989. The safety regulation of U.S. nuclear power plants: Violations, inspections, and abnormal occurrences. Journal of Political Economy 97(1): 115–154.
Fenwick, G. D., and D. J. Neal. 2001. Effect of gender composition on group performance. Gender, Work & Organization 8(2): 205–224.
Fombrun, C. J., N. A. Gardberg, and M. L. Barnett. 2000. Opportunity platforms and safety nets: Corporate citizenship and reputational risk. Business and Society Review 105(1): 85–106.
Forman, C., A. Goldfarb, and S. Greenstein. 2012. The Internet and local wages: A puzzle. American Economic Review 102(1): 556–575.
Geis, G. S. 2007. Business outsourcing and the agency cost problem. Notre Dame Law Review 82(3): 955–1004.
Gereffi, G., J. Humphrey, and T. Sturgeon. 2005. The governance of global value chains. Review of International Political Economy 12(1): 78–104.
Gold, A., J. E. Hunton, and M. I. Gomaa. 2009. The impact of client and auditor gender on auditors’ judgments. Accounting Horizons 23(1): 1–18.
Gray, W. B., and R. Shadbegian. 2005. When and why do plants comply? Paper mills in the 1980s. Law & Policy 27(2): 238–261.
Green, A. W., and E. Melnick. 1950. What has happened to the feminist movement? In A. W. Gouldner (ed.), Studies in Leadership: 277–302. New York: Harper.
Greenhouse, S. 2013a. $40 million in aid set for Bangladesh garment workers. New York Times, December 24: B1.
Greenhouse, S. 2013b. Major retailers join Bangladesh safety plan. New York Times, May 13: B1.
Hainmueller, J., M. J. Hiscox, and S. Sequeira. Forthcoming. Consumer demand for the Fair Trade label: Evidence from a multi-store field experiment. Review of Economics and Statistics.
Handley, S. M., and J. V. Gray. 2013. Inter-organizational quality management: The use of contractual incentives and monitoring mechanisms with outsourced manufacturing. Production and Operations Management 22(6): 1540–1556.
Hawkins, K. 1984. Environment and Enforcement: Regulation and the Social Definition of Pollution. London: Oxford University Press.
Haynes, K. 2012. Body beautiful? Gender, identity and the body in professional services firms. Gender, Work & Organization 19(5): 489–507.
Heide, J. B., A. Kumar, and K. H. Wathne. 2014. Concurrent sourcing, governance mechanisms, and performance outcomes in industrial value chains. Strategic Management Journal 35(8): 1164–1185.
35
Heide, J. B., K. H. Wathne, and A. I. Rokkan. 2007. Inter-firm monitoring, social contracts, and relationship outcomes. Journal of Marketing Research 44(3): 425–433.
Heras-Saizarbitoria, I., and O. Boiral. 2013. Research agenda on management system standards. International Journal of Management Reviews 15(1): 47–65.
Huber, G. R., and D. J. Power. 1985. Retrospective reports of strategic-level managers: Guidelines for increasing their accuracy. Strategic Management Journal 6(2): 171–180.
Hult, G. T. M., D. J. Ketchen, and M. Arrfelt. 2007. Strategic supply chain management: Improving performance through a culture of competitiveness and knowledge development. Strategic Management Journal 28(10): 1035–1052.
Ioannou, I. 2014. Redefining strategy in the age of sustainability and social responsibility. Available at SSRN: http://ssrn.com/abstract=2429870, accessed February 25, 2015
Jiang, J. (X.), M. H. Stanford, and Y. Xie. 2012. Does it matter who pays for bond ratings? Historical evidence. Journal of Finance Economics 105(3): 607–621.
Jones, B. D. 2001. Politics and the Architecture of Choice: Bounded Rationality and Governance. Chicago: University of Chicago Press.
Jonnergård, K., A. Stafsudd, and U. Elg. 2010. Performance evaluations as gender barriers in professional organizations: A study of auditing firms. Gender, Work & Organization 17(6): 721–747.
Joshi, A., and H. Roh. 2009. The role of context in work team diversity research: A meta-analytic review. Academy of Management Journal 52(3): 599–627.
Khalil, F., and J. Lawarrée. 2006. Incentives for corruptible auditors in the absence of commitment. Journal of Industrial Economics 54(2): 269–291.
Killgore, W. D. S., and D. W. Cupp. 2002. Mood and sex of participant in perception of happy faces. Perceptual and Motor Skills 95: 279–288.
King, A., and M. Lenox. 2001. Lean and green? An empirical examination of the relationship between lean production and environmental performance. Production and Operations Management 10(3): 244–257.
King, A. A., and M. W. Toffel. 2009. Self-regulatory institutions for solving environmental problems: Perspectives and contributions from the management literature. In M. Delmas and O. Young (eds.), Governance for the Environment: New Perspectives: 98–115. New York: Cambridge University Press.
King, B., and S. A. Soule. 2007. Social movements as extra-institutional entrepreneurs: The effect of protest on stock price returns. Administrative Science Quarterly 52(3): 413–442.
Kinney, W. R., Jr., Z. Palmrose, and S. Scholz. 2004. Auditor independence, non-audit services, and restatements: Was the U.S. government right? Journal of Accounting Research 42(3): 561–588.
Kocer, G. R., and L. Fransen. 2009. Codes of conduct and the promise of a change of climate in worker organization. European Journal of Industrial Relations 15(3): 237–256.
Kumar, J. A., and A. Chakrabarti. 2012. Bounded awareness and tacit knowledge: Revisiting Challenger disaster. Journal of Knowledge Management 16(6): 934–949.
Lemley, M. A., and B. Sampat. 2012. Examiner characteristics and patent office outcomes. Review of Economics and Statistics 94(3): 817–827.
Levine, D. I., and M. W. Toffel. 2010. Quality management and job quality: How the ISO 9001 standard for quality management systems affects employees and employers. Management Science 56(6): 978–996.
Levy, D. L. 2008. Political contestation in global production networks. Academy of Management Review 33(4): 943–963.

36
Lipsky, M. 1980/2010. Street-Level Bureaucracy: Dilemmas of the Individual in Public Services. New York: Russell Sage Foundation.
Locke, R. M., F. Qin, and A. Brause. 2007. Does monitoring improve labor standards? Lessons from Nike. Industrial and Labor Relations Review 61(1): 3–31.
Locke, R. M., B. A. Rising, and T. Pal. 2013. Complements or substitutes? Private codes, state regulation and the improvement of labor standards in global supply chains. British Journal of Industrial Relations 51(3): 519–552.
Lount, R. B., Jr., and K. W. Phillips. 2007. Working harder with the out-group: The impact of social category diversity on motivation gains. Organizational Behavior and Human Decision Processes 103(2): 214–224.
Loyd, D. L., C. S. Wang, K. W. Phillips, and R. B. Lount, Jr. 2013. Social category diversity promotes premeeting elaboration: The role of relationship focus. Organization Science 24(3): 757–772.
Macher, J. T., J. W. Mayo, and J. A. Nickerson. 2011. Regulator heterogeneity and endogenous efforts to close the information asymmetry gap. Journal of Law and Economics 54(1): 25–54.
March, J. G., and J. P. Olsen. 1998. The institutional dynamics of international political orders. International Organization 52(4): 943–969.
Mayer, K. J. 2006. Spillovers and governance: An analysis of knowledge and reputational spillovers in information technology. Academy of Management Journal 49(1): 69–84.
Mayer, K. J., J. A. Nickerson, and H. Owan. 2004. Are supply and plant inspections complements or substitutes? A strategic and operational assessment of inspection practices in biotechnology. Management Science 50(8): 1064–1081.
Mayer, K. J., and R. M. Salomon. 2006. Capabilities, contractual hazards, and governance: Integrating resource-based and transaction cost perspectives. Academy of Management Journal 49(5): 942–959.
McBarnet, D. 2007. Corporate social responsibility beyond law, through law, for law: The new corporate accountability. In D. McBarnet, A. Voiculescu, and T. Campbell (eds.), The New Corporate Accountability: Corporate Social Responsibility and the Law: 9–56. Cambridge, UK: Cambridge University Press.
Montiel, I., B. W. Husted, and P. Christmann. 2012. Using private management standard certification to reduce information asymmetries in corrupt environments. Strategic Management Journal 33(9): 1103–1113.
Moore, D. A., P. E. Tetlock, L. Tanlu, and M. H. Bazerman. 2006. Conflicts of interest and the case of auditor independence: Moral seduction and strategic issue cycling. Academy of Management Review 31(1): 10–29.
Muehlenbachs, L., S. Staubli, and M. A. Cohen. 2013. The effect of inspector group size and familiarity on enforcement and deterrence. Discussion paper 13–36, Resources for the Future, Washington, DC.
Nickerson, J. A., and B. S. Silverman. 2003. Why aren’t all truck drivers owner-operators? Asset ownership and the employment relation in interstate for-hire trucking. Journal of Economics & Management Strategy 12(1): 91–118.
Oberfield, Z. W. 2010. Rule following and discretion at government’s frontlines: Continuity and change during organization socialization. Journal of Public Administration Research and Theory 20(4): 735–755.
O’Callaghan, T. 2007. Disciplining the multinational enterprise: The regulatory power of reputation risk. Global Society 21(1): 95–117.

37
Oka, C. 2010. Accounting for the gaps in labour standard compliance: The role of reputation-conscious buyers in the Cambodian garment industry. European Journal of Development Research 22(1): 59–78.
O’Rourke, D. 2002. Monitoring the monitors: A critique of PricewaterhouseCooper's labor monitoring. In R. Jenkins, R. Pearson, and G. Seyfang (eds.), Corporate Responsibility and Ethical Trade: Codes of Conduct in the Global Economy: 196–207. London: Earthscan.
Parker, C. 1999. Compliance professionalism and regulatory community: The Australian trade practices regime. Journal of Law and Society 26(2): 215–239.
Partnoy, F. 2006. How and why credit rating agencies are not like other gatekeepers. In Y. Fuchita and R. E. Litan (eds.), Financial Gatekeepers: Can They Protect Investors?: 59–99. Baltimore, MD: Brookings Institution Press.
Phillips, K. W., M. Duguid, M. Thomas-Hunt, and J. Uparna. 2012. Diversity as knowledge exchange: The roles of information processing, expertise, and status. In Q. M. Roberson (ed.), The Oxford Handbook of Diversity and Work: 157–178. New York: Oxford University Press.
Pierce, L., and M. W. Toffel. 2013. The role of organizational scope and governance in strengthening private monitoring. Organization Science 24(5): 1558–1584.
Piore, M. J. 2005. Rethinking international labor standards. In W. Milberg (ed.), Labor and the Globalization of Production: Causes and Consequences: 249–265. New York: Macmillan.
Portillo, S. 2012. The paradox of rules: Rules as resources and constraints. Administration and Society 44(1): 87–108.
Portillo, S., and L. DeHart-Davis. 2009. Gender and organizational rule abidance. Public Administration Review 69(2): 339–347.
Potoski, M., and A. Prakash. 2005. Green clubs and voluntary governance: ISO 14001 and firms’ regulatory compliance. American Journal of Political Science 49(2): 235–248.
Power, M. 1997. The Audit Society: Rituals of Verification. Oxford, UK: Oxford University Press.
Reitzig, M., and S. Wagner. 2010. The hidden costs of outsourcing: Evidence from patent data. Strategic Management Journal 31(11): 1183–1201.
Roberts, P. W., and G. R. Dowling. 2002. Corporate reputation and sustained superior financial performance. Strategic Management Journal 23(12): 1077–1093.
Rodríguez-Garavito, C. 2005. Global governance and labor rights: Codes of conduct and anti-sweatshop struggles in global apparel factories in Mexico and Guatemala. Politics and Society 33(2): 203–233.
Ruggie, J. 2008. Protect, Respect and Remedy: A Framework for Business and Human Rights. Report of the Special Representative of the Secretary-General on the Issue of Human Rights and Transnational Corporations and Other Business Enterprises. Geneva: United Nations, Human Rights Council. http://www.reports-and-materials.org/Ruggie-report-7-Apr-2008.pdf.
Schrank, A. 2009. Professionalization and probity in a patrimonial state: Labor inspectors in the Dominican Republic. Latin American Politics and Society 51(2): 91–115.
Scott, R. W. 1966. Professionals in bureaucracies—Areas of conflict. In H. M. Vollmer and D. L. Mills (eds.), Professionalization: 265–275. Englewood Cliffs, NJ: Prentice-Hall.
Short, J. L., and M. W. Toffel. 2008. Coerced confessions: Self-policing in the shadow of the regulator. Journal of Law, Economics, and Organization 24(1): 45–71.
Short, J. L., and M. W. Toffel. 2010. Making self-regulation more than merely symbolic: The critical role of the legal environment. Administrative Science Quarterly 55(3): 361–396.
38
Simon, H. A. 1947. Administrative Behavior: A Study of Decision-Making Processes in Administrative Organizations. New York: Free Press.
Spence, J. T., and C. E. Buckner. 2000. Instrumental and expressive traits, trait stereotypes, and sexist attitudes: What do they signify? Psychology of Women Quarterly 24(1): 44–62.
Stonewater, B. B., S. A. Eveslage, and M. R. Dingerson. 1990. Gender differences in career helping relationships. Career Development Quarterly 39(1): 72–85.
Teitelbaum, J. C. 2006. Age and tenure of the justices and productivity of the Supreme Court: Are term limits necessary? Florida State University Law Review 34(1): 161–182.
Terlaak, A., and A. A. King. 2006. The effect of certification with the ISO 9000 Quality Management Standard: A signaling approach. Journal of Economics Behavior and Organization 60(4): 579–602.
Tetlock, P. E. 1983. Accountability and complexity of thought. Journal of Personality and Social Psychology 45(1): 74–83.
Thayer, J. F., and B. H. Johnsen. 2000. Sex differences in judgment of facial affect: A multivariate analysis of recognition errors. Scandinavian Journal of Psychology 41(3): 243–246.
Thompson, V. A. 1977. Modern Organization, 2nd ed. New York: Alfred A. Knopf. Toffel, M. W., and J. L. Short. 2011. Coming clean and cleaning up: Is voluntary disclosure a
signal of effective self-policing? Journal of Law and Economics 54(3): 609–649. Toffel, M. W., J. L. Short, and M. Ouellet. 2015. Codes in context: How states, markets, and
civil society shape adherence to global labor standards. Regulation & Governance, forthcoming.
U.S. Public Company Accounting Oversight Board. 2011. Concept Release on Auditor Independence and Audit Firm Rotation. Release No. 2011–006 (August 16).
von Krogh, G., J. Roos, and K. Slocum. 1994. An essay on corporate epistemology. Strategic Management Journal 15(1): 53–71.
Walsh, D., and S. Greenhouse. 2012. Certified safe, a factory in Karachi still quickly burned. New York Times, December 8: A1.
Weber, B., M. Wittchen, and G. Hertel. 2009. Gendered ways to motivation gains in groups. Sex Roles 60(9/10): 731–744.
Williamson, O. E. 1975. Markets and Hierarchies: Analysis and Antitrust Implications. New York: Free Press.
Williamson, O. E. 1979. Transaction-cost economics: The governance of contractual relations. Journal of Law and Economics 22(2): 233–261.
Williamson, O. E. 2008. Outsourcing: Transaction cost economics and supply chain management. Journal of Supply Chain Management 44(2): 5–16.
Wood, S. 2004. The role of the International Organization for Standardization (ISO) in governing environmental conflict and corporate social responsibility in developing countries: Questions for research. In B. L. Toro (ed.), Propriedad, Conflicto y Medio Ambiente: 15–56. Bogotá, Colombia: Universidad del Rosario.
World Bank. 2013. Worldwide governance indicators: Frequently asked questions. http://info.worldbank.org/governance/wgi/faq.htm, accessed April 2013.
Zandvliet, R. 2011. Corporate social responsibility reporting in the European Union: Towards a more univocal framework. Columbia Journal of European Law (online) 18(1): 38–45. http://www.cjel.net/online/18_1-zandvliet/ accessed February 25, 2015.
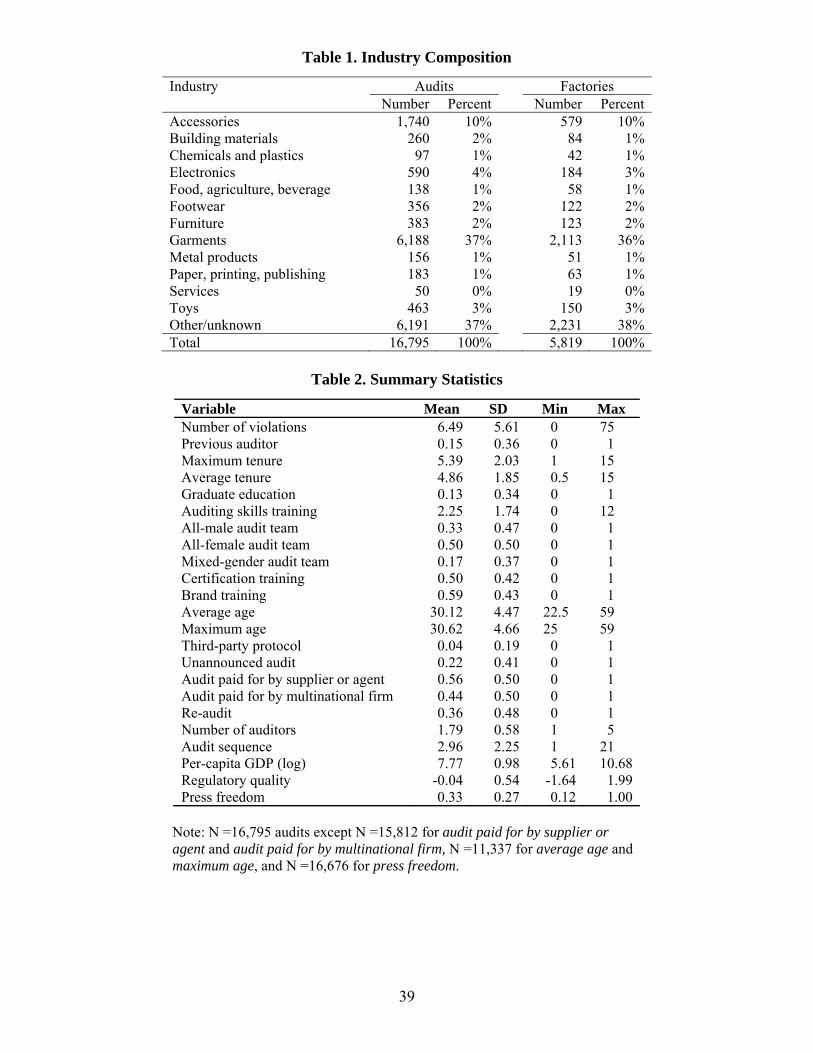
39
Table 1. Industry Composition
Industry Audits Factories Number Percent Number Percent Accessories 1,740 10% 579 10% Building materials 260 2% 84 1% Chemicals and plastics 97 1% 42 1% Electronics 590 4% 184 3% Food, agriculture, beverage 138 1% 58 1% Footwear 356 2% 122 2% Furniture 383 2% 123 2% Garments 6,188 37% 2,113 36% Metal products 156 1% 51 1% Paper, printing, publishing 183 1% 63 1% Services 50 0% 19 0% Toys 463 3% 150 3% Other/unknown 6,191 37% 2,231 38% Total 16,795 100% 5,819 100%
Table 2. Summary Statistics
Variable Mean SD Min Max Number of violations 6.49 5.61 0 75 Previous auditor 0.15 0.36 0 1 Maximum tenure 5.39 2.03 1 15 Average tenure 4.86 1.85 0.5 15 Graduate education 0.13 0.34 0 1 Auditing skills training 2.25 1.74 0 12 All-male audit team 0.33 0.47 0 1 All-female audit team 0.50 0.50 0 1 Mixed-gender audit team 0.17 0.37 0 1 Certification training 0.50 0.42 0 1 Brand training 0.59 0.43 0 1 Average age 30.12 4.47 22.5 59 Maximum age 30.62 4.66 25 59 Third-party protocol 0.04 0.19 0 1 Unannounced audit 0.22 0.41 0 1 Audit paid for by supplier or agent 0.56 0.50 0 1 Audit paid for by multinational firm 0.44 0.50 0 1 Re-audit 0.36 0.48 0 1 Number of auditors 1.79 0.58 1 5 Audit sequence 2.96 2.25 1 21 Per-capita GDP (log) 7.77 0.98 5.61 10.68 Regulatory quality -0.04 0.54 -1.64 1.99 Press freedom 0.33 0.27 0.12 1.00
Note: N =16,795 audits except N =15,812 for audit paid for by supplier or agent and audit paid for by multinational firm, N =11,337 for average age and maximum age, and N =16,676 for press freedom.

40
Table 3. Regression Results Dependent variable: Number of violations
(1) (2) (3) (4) (5)
Coef. Average marginal effects
Coef. Coef. Coef. Coef.
H1 Previous auditor -0.043* -0.28 -0.039+ -0.028 -0.044* -0.027 [0.020] [0.020] [0.026] [0.021] [0.025] H2 Maximum tenure 0.065** 0.12 0.068** 0.078** 0.069** 0.084** [0.014] [0.014] [0.016] [0.014] [0.017] H2 Maximum tenure, squared -0.004** -0.004** -0.004** -0.005** -0.005** [0.001] [0.001] [0.001] [0.001] [0.001] H3 Graduate education 0.027 0.18 0.030 -0.004 0.021 0.045 [0.024] [0.024] [0.029] [0.026] [0.039] H3 Auditing skills training 0.021** 0.14 0.022** 0.013 0.022** 0.012 [0.007] [0.007] [0.009] [0.007] [0.009] H4 All-female audit team 0.054** 0.35 0.055** 0.048* 0.053** 0.052* [0.015] [0.015] [0.019] [0.016] [0.021] H5 Mixed-gender audit team 0.067** 0.43 0.068** 0.049* 0.069** 0.067* [0.021] [0.021] [0.024] [0.021] [0.028] Certification training -0.021 -0.14 -0.024 -0.027 -0.031 -0.010 [0.021] [0.021] [0.027] [0.021] [0.029] Brand training -0.014 -0.09 -0.012 0.008 -0.007 0.001 [0.021] [0.022] [0.026] [0.022] [0.030] Average age -0.025 -0.04 -0.026 -0.015 -0.023 -0.041 [0.019] [0.020] [0.028] [0.019] [0.027] Average age, squared 0.000 0.000 0.000 0.000 0.001 [0.000] [0.000] [0.000] [0.000] [0.000] Third-party protocol -0.080 -0.52 -0.088 -0.148* -0.210* [0.058] [0.062] [0.070] [0.101] Unannounced audit 0.029 0.19 0.029 0.030 0.031 0.075** [0.020] [0.020] [0.025] [0.020] [0.027] Audit paid for by supplier or agent -0.084** -0.55 -0.083** -0.068* -0.064* -0.099** [0.026] [0.027] [0.032] [0.028] [0.034] Re-audit -0.348** -2.26 -0.351** -0.353** -0.358** -0.345** [0.016] [0.016] [0.019] [0.017] [0.020] Per-capita GDP (log) -0.623* -4.04 -0.551* -0.749 -0.714** -0.210 [0.262] [0.264] [0.473] [0.267] [0.389] Regulatory quality -0.180 -1.17 -0.169 -0.385 -0.158 -0.621** [0.150] [0.150] [0.298] [0.153] [0.231] Press freedom -0.510* -3.31 -0.531* -1.059* -0.402+ -0.879** [0.224] [0.224] [0.476] [0.239] [0.339] Observations (audits) 16,795 16,585 10,648 16,044 9,266 Factories 5,819 5,748 3,810 5,523 3,082
Standard errors clustered by supplier (factory); ** p < 0.01, * p < 0.05, + p < 0.10. All models also include fixed effects for the audited establishment, audit year, multinational firm country, number of auditors (2 through 5 or more), and the supplier’s audit sequence (2nd through 6th or more). All models include three dummy variables to indicate instances in which the following variables were missing data and thus recoded to 0: average age and maximum age (5,458 audits), audit paid for by supplier or agent and audit paid for by multinational firm (983 audits), and press freedom (119 audits). Model 1 is the primary model estimated on the entire sample. Model 2 excludes audits conducted for multinational firms whose audit teams were always all-female. Model 3 includes only audits conducted by at least two auditors. Model 4 excludes audits conducted according to a third-party protocol. Model 5 excludes factories’ first audit during the sample period.

Appendices - 1
Appendix 1. Endogeneity Assessment
Our interviews with the social auditing firm that provided our data consistently indicated that auditors were assigned to audit teams according to three criteria: (1) their language skills, to ensure they could communicate with the audited supplier’s managers and workers; (2) their availability, given their other auditing assignments; and (3) the need for at least one team member to qualify as a lead auditor. We conducted several empirical tests to assess whether lead auditors and non-lead auditors differed along dimensions that we hypothesized would affect the discovery and reporting of violations and found some evidence that they did: Graduate education. The distribution of educational attainment does not significantly differ
between lead auditors and non-lead auditors, as indicated by a Pearson chi-squared test (2 = 4.2; p = 0.24) of an ordinal educational attainment variable coded 1 for high school, 2 for associate degree, 3 for bachelor’s degree, and 4 for graduate degree.
Gender. Lead auditors are no more likely than non-lead auditors to be a particular gender.
Males make up 37% of the firm’s lead auditors and 33% of its non-lead auditors, a non-significant difference according to a test-of-proportions analysis (z = -1.06; p = 0.29).
Tenure. The average tenure of lead auditors is 4.4 years of service, which is significantly
more than the 2.3 average for non-lead auditors (Wilcoxon rank-sum test: z = -10.1; p < 0.01).
Audit skills training. Lead auditors averaged 5.5 audit skills training sessions, which is
significantly more than the non-lead auditors’ average of 2.6 (Wilcoxon rank-sum test: z = -9.3; p < 0.01).
The latter two results imply that larger audit teams would tend to have lower average tenure and lower average audit skills training because the higher values for the lead auditors would be increasingly “diluted” by additional non-lead-auditor team members. However, in our analysis, we measure audit team tenure and audit skills training based on each team’s maximum values, which do not suffer this “dilution” problem. (Furthermore, our model specification includes a series of dummies to control for audit team size.) These factors isolate our analysis from differences between lead and non-lead auditors, since all audit teams need one lead auditor. We nonetheless conducted additional analyses to investigate whether endogeneity bias might affect our primary results. Given the differences in audit skills training and tenure between lead and non-lead auditors, we explored whether the estimated coefficients on our other hypothesized variables were substantially altered if we omitted those two variables from our model. The results of the more parsimonious model (reported in Column 2 of Table A1 in Appendix A) do not differ substantially from our primary results (reproduced in Column 1 of that table). In particular, the coefficient magnitudes and statistical significance of the other hypothesized variables (previous auditor, graduate education, all-female audit team, and mixed-gender audit team) are remarkably stable across these two models. This indicates that irrespective of potential endogeneity concerns associated with audit skills training and maximum tenure, we find no evidence to suggest that such concerns spill over to the inferences associated with our other
Appendices - 2
hypotheses (that is, H1, H3 when professionalism is measured by education, H4, and H5). Our primary model is vulnerable to the possibility that endogeneity would bias our estimates on maximum tenure and maximum audit skills training if the auditing firm deployed teams whose members had higher maximum values of audit skills training and/or maximum tenure to particular types of establishment that varied in ways that were unobservable but would influence violations. One possible scenario is if the auditing firm assigned auditors with more skill and/or experience to “bad apples”; that is, establishments suspected of being egregiously unconcerned with working conditions. Those lead auditors might be better able to ascertain information from managers and workers at such establishments, which are likely to have many violations. But the obverse might also be true: the auditing firm might send less-trained and less-skilled lead auditors to establishments suspected of having very safe working conditions on the grounds that less expertise would be required to audit them adequately. If these stories are true in our empirical context, we would expect to see much less variation in audit skills training and maximum tenure within the teams auditing the same establishment than between the teams auditing different establishments. In fact, we do not see such a pattern in our data when we decompose variation into within- and between-establishment components. For audit skills training, the within-establishment standard deviation (SDw) is calculated based on all audit-level audit skills training values after de-meaning them at the establishment level and adding back the grand mean (that is, xit - xi + xi). The between-establishment standard deviation (SDb) is calculated based on establishment-level averages (that is, xi). For audit skills training, the between-establishment variation (SDb = 1.32) is very similar to the within-establishment variation (SDw = 1.21). That is, the variation in audit skills training among audit teams for two randomly drawn establishments is nearly identical to the variation in audit skills training among the audit teams conducting two randomly selected audits of the same establishment. The same is true for maximum tenure: the between-establishment variation (SDb = 1.51) is very similar to the within-establishment variation (SDw = 1.44). These results fail to support the notion that establishments tend to be consistently assigned teams with any particular average audit skills training or maximum tenure. Establishments whose audit teams have the highest or lowest average audit skills training in our sample might be the most vulnerable to endogeneity, as they might represent the worst of the “bad apples” or the best of the “good apples.” We therefore reestimated our primary model on a subsample that excluded these outlier establishments whose audit teams’ average levels of audit skills training fell below the 1st percentile or exceeded the 99th percentile. Similarly, we estimated our model on a subsample that excluded establishments whose audit teams’ average levels of maximum tenure fell below the 1st percentile or exceeded the 99th percentile. The results of these models, reported in Columns 3 and 4 of Table A1 in Appendix A, are nearly identical to the results of our primary model estimated on the full sample (Column 1). These results provide no evidence that endogeneity is driving our primary results. Another approach to investigating whether endogeneity might be biasing our primary results is to instrument for the audit team’s maximum audit skills training and maximum tenure. We used average values of these characteristics among all auditors based in the auditing firm’s field office that staffed each establishment’s audits, an approach based on (a) Card’s (1995) instrumenting an individual’s propensity to attend college using the distance between that individual’s domicile
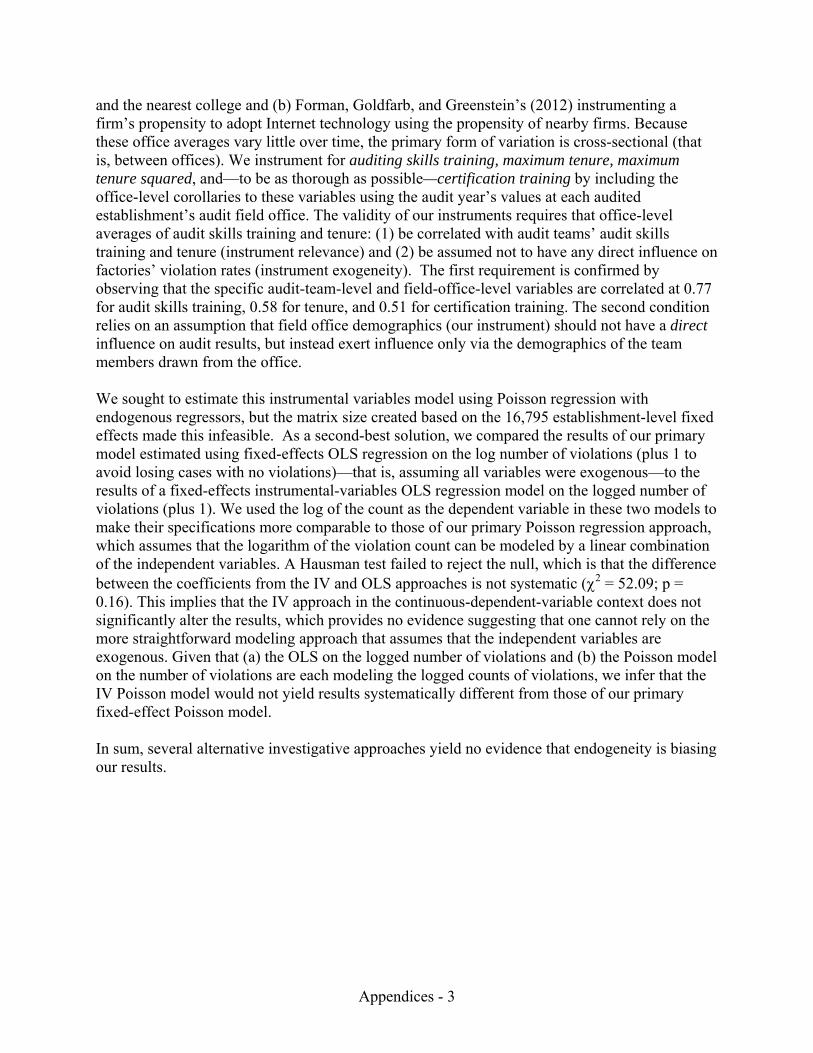
Appendices - 3
and the nearest college and (b) Forman, Goldfarb, and Greenstein’s (2012) instrumenting a firm’s propensity to adopt Internet technology using the propensity of nearby firms. Because these office averages vary little over time, the primary form of variation is cross-sectional (that is, between offices). We instrument for auditing skills training, maximum tenure, maximum tenure squared, and—to be as thorough as possible—certification training by including the office-level corollaries to these variables using the audit year’s values at each audited establishment’s audit field office. The validity of our instruments requires that office-level averages of audit skills training and tenure: (1) be correlated with audit teams’ audit skills training and tenure (instrument relevance) and (2) be assumed not to have any direct influence on factories’ violation rates (instrument exogeneity). The first requirement is confirmed by observing that the specific audit-team-level and field-office-level variables are correlated at 0.77 for audit skills training, 0.58 for tenure, and 0.51 for certification training. The second condition relies on an assumption that field office demographics (our instrument) should not have a direct influence on audit results, but instead exert influence only via the demographics of the team members drawn from the office. We sought to estimate this instrumental variables model using Poisson regression with endogenous regressors, but the matrix size created based on the 16,795 establishment-level fixed effects made this infeasible. As a second-best solution, we compared the results of our primary model estimated using fixed-effects OLS regression on the log number of violations (plus 1 to avoid losing cases with no violations)—that is, assuming all variables were exogenous—to the results of a fixed-effects instrumental-variables OLS regression model on the logged number of violations (plus 1). We used the log of the count as the dependent variable in these two models to make their specifications more comparable to those of our primary Poisson regression approach, which assumes that the logarithm of the violation count can be modeled by a linear combination of the independent variables. A Hausman test failed to reject the null, which is that the difference between the coefficients from the IV and OLS approaches is not systematic ( = 52.09; p = 0.16). This implies that the IV approach in the continuous-dependent-variable context does not significantly alter the results, which provides no evidence suggesting that one cannot rely on the more straightforward modeling approach that assumes that the independent variables are exogenous. Given that (a) the OLS on the logged number of violations and (b) the Poisson model on the number of violations are each modeling the logged counts of violations, we infer that the IV Poisson model would not yield results systematically different from those of our primary fixed-effect Poisson model. In sum, several alternative investigative approaches yield no evidence that endogeneity is biasing our results.

Appendices - 4
Table A1. Regression Results
Dependent variable: Number of violations
See notes for model definitions (1) (2) (3) (4) (5) (6) Prior inspector -0.042* -0.039* -0.040* -0.043* -0.044* -0.034*
[0.020] [0.020] [0.020] [0.020] [0.020] [0.017] Maximum tenure 0.065** 0.065** 0.073** 0.061** 0.049**
[0.014] [0.014] [0.014] [0.014] [0.012] Maximum tenure, squared -0.004** -0.004** -0.005** -0.004** -0.003**
[0.001] [0.001] [0.001] [0.001] [0.001] Graduate education 0.028 0.027 0.012 0.027 0.026 -0.001
[0.024] [0.024] [0.025] [0.024] [0.025] [0.022] Auditing skills training 0.020** 0.020** 0.019** 0.018** 0.024**
[0.007] [0.007] [0.007] [0.007] [0.006] All-female audit team 0.054** 0.057** 0.050** 0.052** 0.054** 0.041**
[0.015] [0.015] [0.015] [0.015] [0.015] [0.014] Mixed-gender audit team 0.067** 0.075** 0.068** 0.065** 0.065** 0.064**
[0.021] [0.021] [0.021] [0.021] [0.021] [0.019] Average age -0.026 -0.011 -0.026 -0.027 -0.031+ -0.022
[0.019] [0.019] [0.019] [0.019] [0.019] [0.018] Average age, squared 0.000 0.000 0.000 0.001+ 0.001+ 0.000
[0.000] [0.000] [0.000] [0.000] [0.000] [0.000] Certification training -0.024 0.021 -0.024 -0.026 -0.017 -0.030+
[0.020] [0.018] [0.021] [0.020] [0.020] [0.018] Third-party protocol -0.081 -0.084 -0.089 -0.077 -0.086 -0.112*
[0.058] [0.058] [0.059] [0.059] [0.062] [0.056] Unannounced audit 0.029 0.028 0.034 0.025 0.025 0.057**
[0.020] [0.020] [0.021] [0.020] [0.020] [0.018] Audit paid for by supplier or agent -0.084** -0.085** -0.087** -0.085** -0.087** -0.063*
[0.026] [0.026] [0.027] [0.026] [0.026] [0.025] Re-audit -0.348** -0.348** -0.341** -0.349** -0.358** -0.297**
[0.016] [0.016] [0.016] [0.016] [0.016] [0.014] Per-capita GDP (log) -0.631* -0.678** -0.747** -0.675* -0.653* -0.761**
[0.262] [0.262] [0.265] [0.264] [0.263] [0.243] Regulatory quality -0.177 -0.185 -0.262+ -0.163 -0.191 -0.221
[0.150] [0.150] [0.157] [0.151] [0.152] [0.141] Press freedom -0.511* -0.530* -0.532* -0.576* -0.559* -0.464*
[0.224] [0.223] [0.232] [0.227] [0.224] [0.212] Firm FE Yes Yes Yes Yes Yes Yes Number of auditors FE (2 to 5+) Yes Yes Yes Yes Yes Yes Audit-sequence dummies Yes Yes Yes Yes Yes Yes Year FE Yes Yes Yes Yes Yes Yes Client-country FE Yes Yes Yes Yes Yes Yes Audits (N) 16,795 16,795 15,698 16,496 16,200 15,209 Firms 5,819 5,819 5,328 5,693 5,551 5,321 All results are from Poisson regression. Brackets contain standard errors clustered by supplier; ** p < 0.01, * p < 0.05, + p < 0.10. Column 1 reports estimates of the primary model (reproduced from Table 3, Column 1). Column 2 reports estimates of a model that omits maximum tenure and auditing skills training. Column 3 reports estimates on the subsample that excludes audited factories whose audit teams’ average auditing skills training falls below the 1st percentile or exceeds the 99th percentile of the sample distribution. Column 4 reports estimates on the subsample that excludes audited factories whose audit teams’ average maximum tenure falls below the 1st percentile or exceeds the 99th percentile of the sample distribution.

Appendices - 5
Appendix B. Sample Description
Table B1. Geographic Composition of Supplier Locations
Audits Factories Number Percent Number Percent
Africa 100 1% 38 1%
Americas 1,509 9% 522 9% United States 949 285 Mexico 172 75 Brazil 84 37 Elsewhere in Americas 304 125
Asia and Australia 14,773 88% 5,084 87% China (incl. Macao and Hong Kong) 11,746 3,917 India 708 277 Vietnam 424 153 Indonesia 377 137 Bangladesh 321 140 Philippines 270 96 Pakistan 184 71 Sri Lanka 159 61 Taiwan 131 56 Korea 120 49 Elsewhere in Asia & Australia 333 127
Europe 413 2% 175 3% Turkey 186 72 Italy 88 42 Elsewhere in Europe 139 61 Total 16,795 100% 5,819 100%
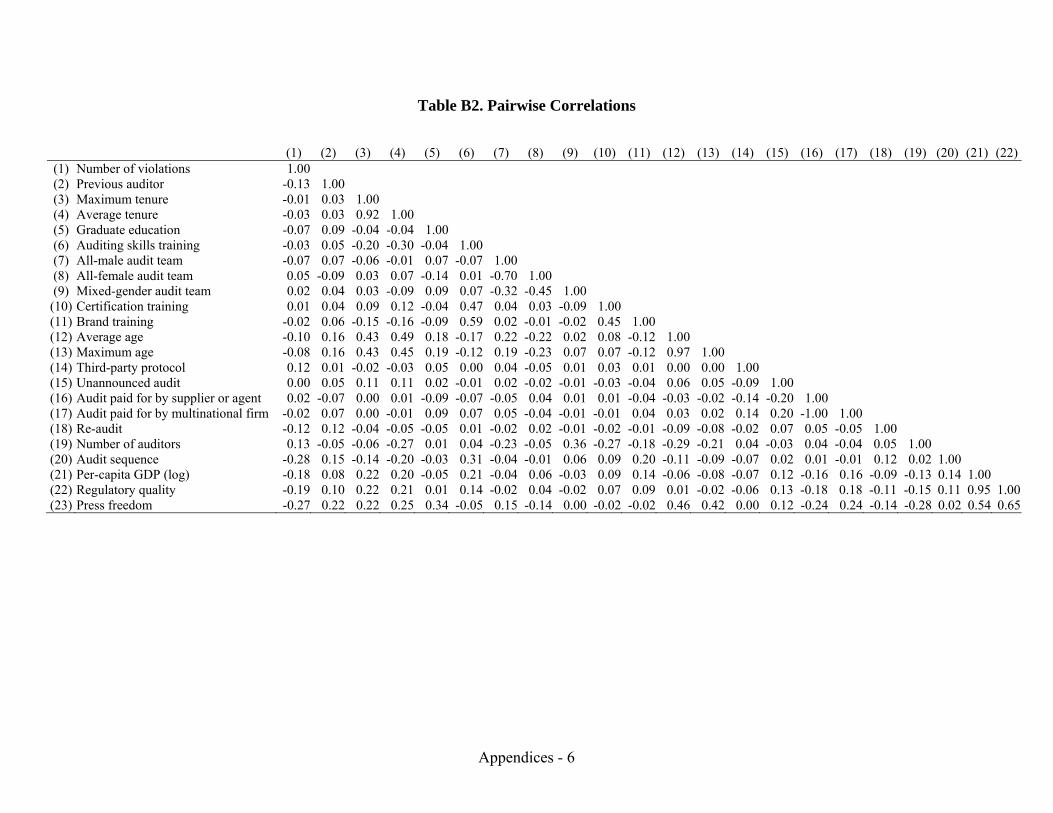
Appendices - 6
Table B2. Pairwise Correlations
(1) (2) (3) (4) (5) (6) (7) (8) (9) (10) (11) (12) (13) (14) (15) (16) (17) (18) (19) (20) (21) (22) (1) Number of violations 1.00 (2) Previous auditor -0.13 1.00 (3) Maximum tenure -0.01 0.03 1.00 (4) Average tenure -0.03 0.03 0.92 1.00 (5) Graduate education -0.07 0.09 -0.04 -0.04 1.00 (6) Auditing skills training -0.03 0.05 -0.20 -0.30 -0.04 1.00 (7) All-male audit team -0.07 0.07 -0.06 -0.01 0.07 -0.07 1.00 (8) All-female audit team 0.05 -0.09 0.03 0.07 -0.14 0.01 -0.70 1.00 (9) Mixed-gender audit team 0.02 0.04 0.03 -0.09 0.09 0.07 -0.32 -0.45 1.00
(10) Certification training 0.01 0.04 0.09 0.12 -0.04 0.47 0.04 0.03 -0.09 1.00 (11) Brand training -0.02 0.06 -0.15 -0.16 -0.09 0.59 0.02 -0.01 -0.02 0.45 1.00 (12) Average age -0.10 0.16 0.43 0.49 0.18 -0.17 0.22 -0.22 0.02 0.08 -0.12 1.00 (13) Maximum age -0.08 0.16 0.43 0.45 0.19 -0.12 0.19 -0.23 0.07 0.07 -0.12 0.97 1.00 (14) Third-party protocol 0.12 0.01 -0.02 -0.03 0.05 0.00 0.04 -0.05 0.01 0.03 0.01 0.00 0.00 1.00 (15) Unannounced audit 0.00 0.05 0.11 0.11 0.02 -0.01 0.02 -0.02 -0.01 -0.03 -0.04 0.06 0.05 -0.09 1.00 (16) Audit paid for by supplier or agent 0.02 -0.07 0.00 0.01 -0.09 -0.07 -0.05 0.04 0.01 0.01 -0.04 -0.03 -0.02 -0.14 -0.20 1.00 (17) Audit paid for by multinational firm -0.02 0.07 0.00 -0.01 0.09 0.07 0.05 -0.04 -0.01 -0.01 0.04 0.03 0.02 0.14 0.20 -1.00 1.00 (18) Re-audit -0.12 0.12 -0.04 -0.05 -0.05 0.01 -0.02 0.02 -0.01 -0.02 -0.01 -0.09 -0.08 -0.02 0.07 0.05 -0.05 1.00 (19) Number of auditors 0.13 -0.05 -0.06 -0.27 0.01 0.04 -0.23 -0.05 0.36 -0.27 -0.18 -0.29 -0.21 0.04 -0.03 0.04 -0.04 0.05 1.00 (20) Audit sequence -0.28 0.15 -0.14 -0.20 -0.03 0.31 -0.04 -0.01 0.06 0.09 0.20 -0.11 -0.09 -0.07 0.02 0.01 -0.01 0.12 0.02 1.00 (21) Per-capita GDP (log) -0.18 0.08 0.22 0.20 -0.05 0.21 -0.04 0.06 -0.03 0.09 0.14 -0.06 -0.08 -0.07 0.12 -0.16 0.16 -0.09 -0.13 0.14 1.00 (22) Regulatory quality -0.19 0.10 0.22 0.21 0.01 0.14 -0.02 0.04 -0.02 0.07 0.09 0.01 -0.02 -0.06 0.13 -0.18 0.18 -0.11 -0.15 0.11 0.95 1.00 (23) Press freedom -0.27 0.22 0.22 0.25 0.34 -0.05 0.15 -0.14 0.00 -0.02 -0.02 0.46 0.42 0.00 0.12 -0.24 0.24 -0.14 -0.28 0.02 0.54 0.65

Appendices - 7
Appendix C. Figures Depicting Results of Empirical Analysis Figure C1. Effect of audit team’s maximum tenure on average predicted violations per supplier
Average predicted number of violations
Audit team’s maximum tenure
Note: The figure depicts average predicted number of violations from the fixed-effects Poisson model estimated in Column 1 of Table 3, spanning the 5th to 95th percentiles of audit tenure. Dashed lines represent the 95-percent confidence interval.
Figure C2. Decline of average number of violations per audit in successive audits
Average number of violations
Supplier’s audit sequence
Note: The figure depicts sample averages, with dashed lines representing 95-percent confidence intervals calculated as the sample mean ± two times the standard error of the mean.
6.146.36
6.53 6.65 6.71 6.71
4
5
6
7
8
2 3 4 5 6 7
9.1
6.6
5.4
5.04.5 4.4
2
3
4
5
6
7
8
9
10
1 2 3 4 5 6