monitoring for pests and diseases in native oak woodland
TRANSCRIPT

Monitoring for pests and diseases in native
oak woodland:
Acute Oak Decline in the UK.
N. Brown , S. Parnell, M. Jeger, F. van den Bosch,
and S. Denman
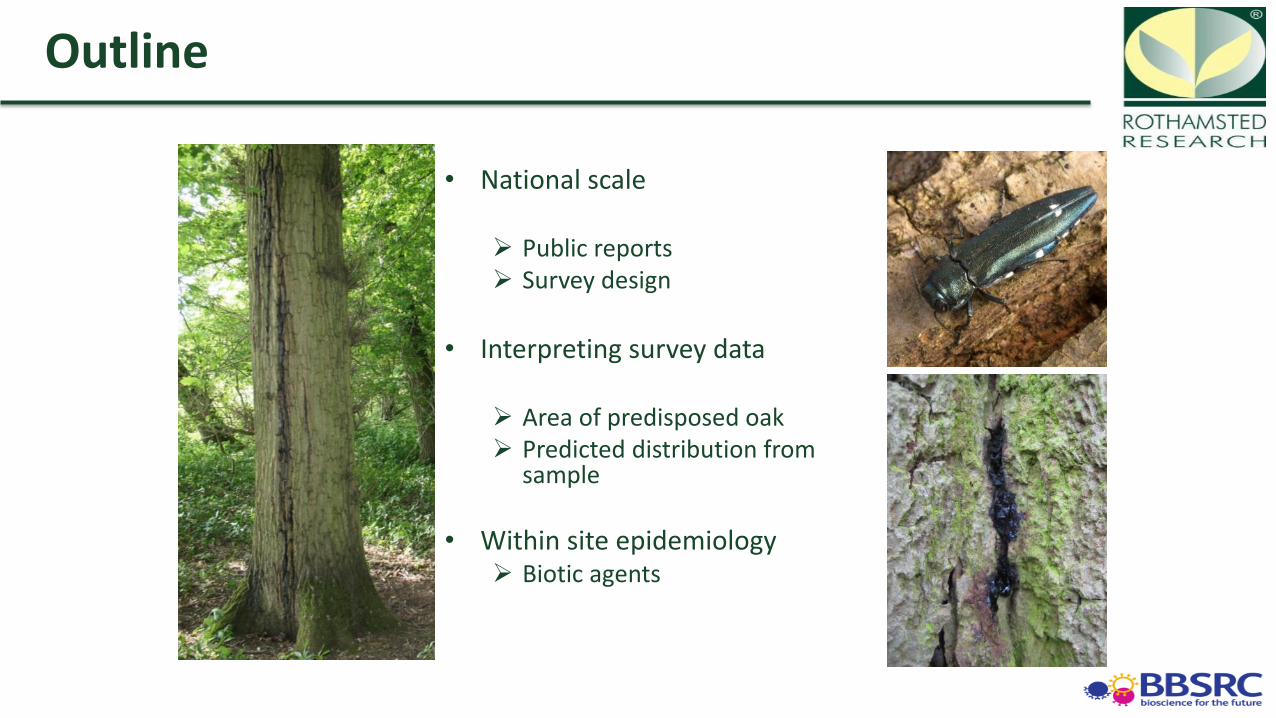
• National scale Public reports Survey design
• Interpreting survey data
Area of predisposed oak Predicted distribution from
sample
• Within site epidemiology Biotic agents
Outline

The case study
1) Stem “bleeds”
• Dark liquid runs from cracks between
bark plates.
• Necrotic tissue below bark
• Lab tests to confirm presence of bacteria
2) Agrilus biguttatus
• Larval development cryptic and may
take 1-2 years.
• Exit holes first external sign of presence
• Adults present briefly in a single
summer.
Acute Oak Decline (AOD) is a distinct syndrome that falls within the
wider context of oak decline.

• Predisposition/ inciting factors
Landscape scale effects
• Biotic agents
Local scale effects
Decline spiral

National distribution
Observations by both foresters and entomologists are broadly consistent, but do not account for surveyor effort. Is this representative of the actual distribution? Where are the unaffected woodlands?

The good and bad sides of volunteer data
Introduce bias or maximise discoveries ?
• Can an independent survey cover enough ground?
• 192,800 ha of oak (in 1,039,000 ha of broadleaf)
• Only sample 120 sites each year
• Does the public report accurately? • 436 reports, 208 positive
• Does the public report evenly?

N ational F orest I nventory
Selected for 2014 survey

Squares containing public reports

2014 Survey results: new discoveries
New discoveries are shown in red. Earlier AOD reports are shown as black dots.

• Both methods find AOD in the same areas
• But public reports are clustered within the overall pattern
There may be localised bias in reporting…
or reflect disease prevalence
Do reports occur evenly across England and Wales?
* Now using 2013 and 2014 surveys
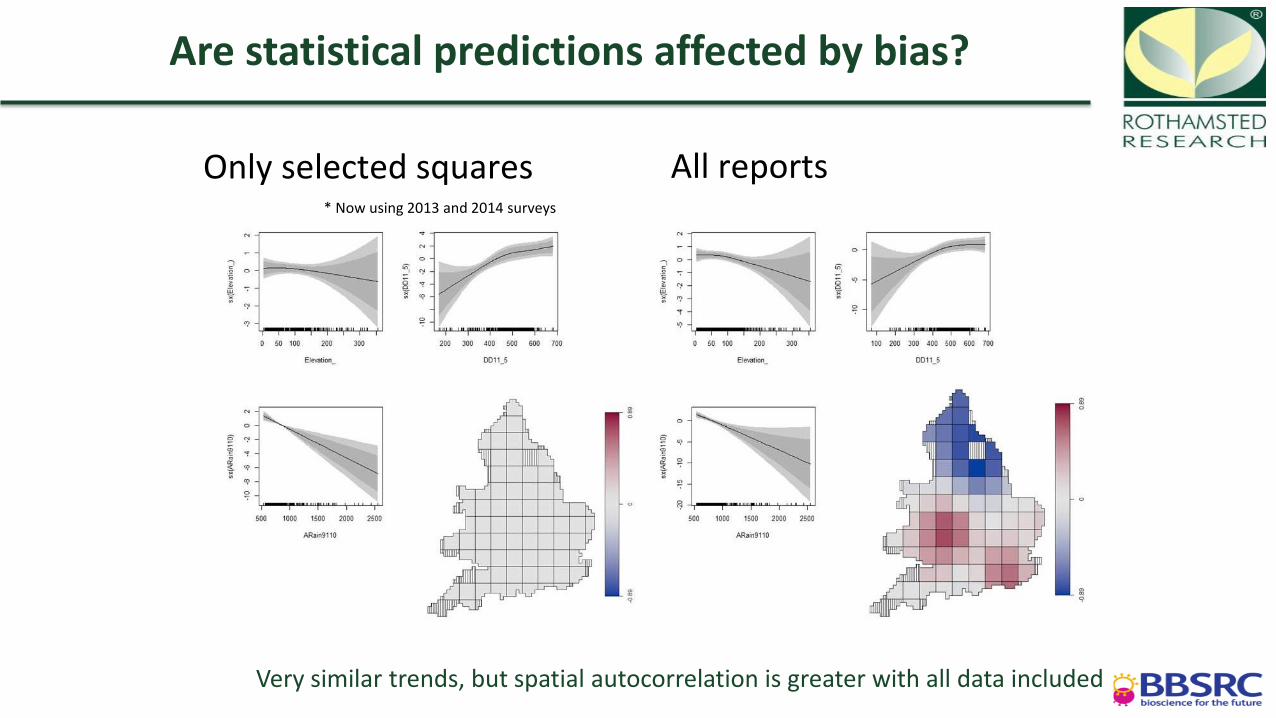
Are statistical predictions affected by bias?
Very similar trends, but spatial autocorrelation is greater with all data included
* Now using 2013 and 2014 surveys
Only selected squares All reports

Final model

Surveys take place in some squares, but what happens in between?
Predicting the distribution from a sample

Disease Incidence
(cell 1)
Host Area
(cell 1)
Distance
(cell 1 to cell 2)
Host Area
(cell 2)
Disease Incidence
(cell 2)
0 2 4 6 8 10
Distance
Dis
pe
rsa
l
X X X =
Principles used to calculate disease incidence:

Probability of disease is calculated from all neighbours
𝑃 𝑖𝑛𝑓𝑒𝑐𝑡𝑒𝑑 𝑖 = 1 − 𝑒−𝑦𝑖
𝑌𝑖 = α 𝐻𝑜𝑠𝑡𝑖 𝑃 𝑖𝑛𝑓𝑒𝑐𝑡𝑒𝑑 𝑗 𝐻𝑜𝑠𝑡𝑗 𝑒−β 𝐷𝑖𝑠𝑡𝑎𝑛𝑐𝑒𝑖𝑗

Initial predictions for AOD

Within site symptom development
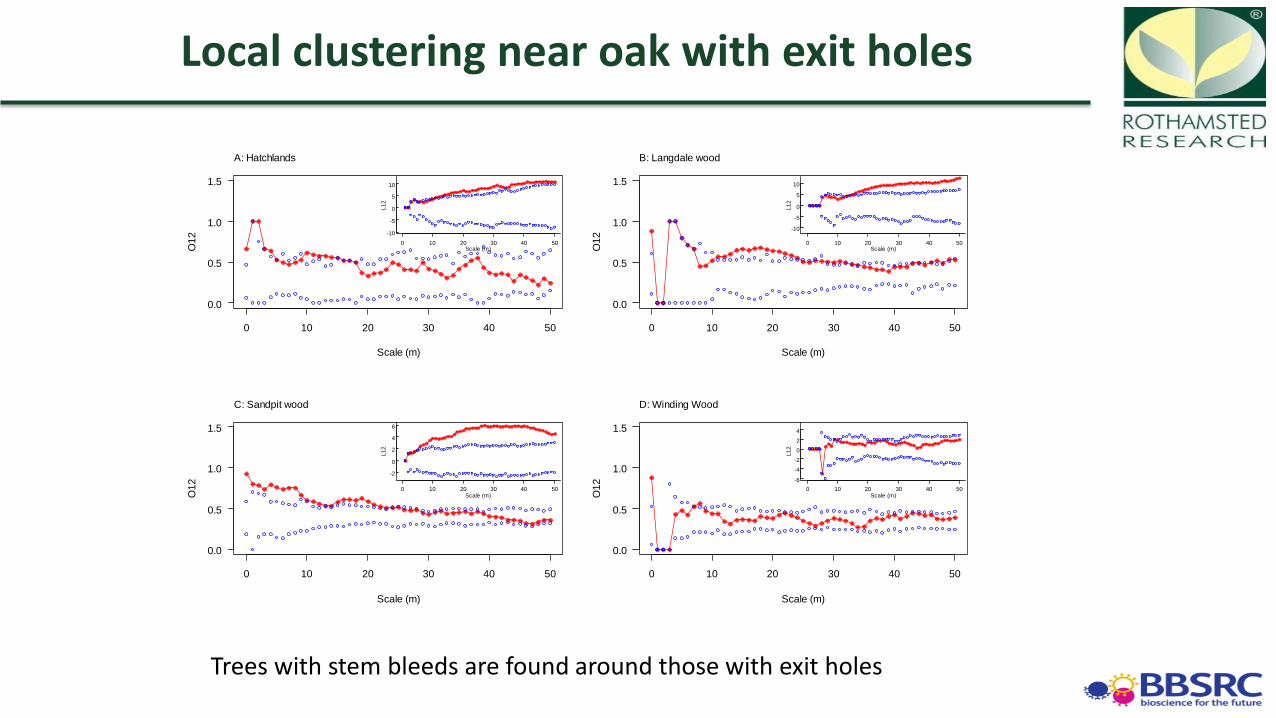
Local clustering near oak with exit holes
Trees with stem bleeds are found around those with exit holes
0 10 20 30 40 50
0.0
0.5
1.0
1.5
Scale (m)
O1
2
A: Hatchlands
-10
-5
0
5
10
0 10 20 30 40 50
L12
Scale (m)
0 10 20 30 40 50
0.0
0.5
1.0
1.5
Scale (m)
O1
2
B: Langdale wood
-10
-5
0
5
10
0 10 20 30 40 50
L12
Scale (m)
0 10 20 30 40 50
0.0
0.5
1.0
1.5
Scale (m)
O1
2
C: Sandpit wood
-2
0
2
4
6
0 10 20 30 40 50
L12
Scale (m)
0 10 20 30 40 50
0.0
0.5
1.0
1.5
Scale (m)O
12
D: Winding Wood
-6
-4
-2
0
2
4
0 10 20 30 40 50
L12
Scale (m)
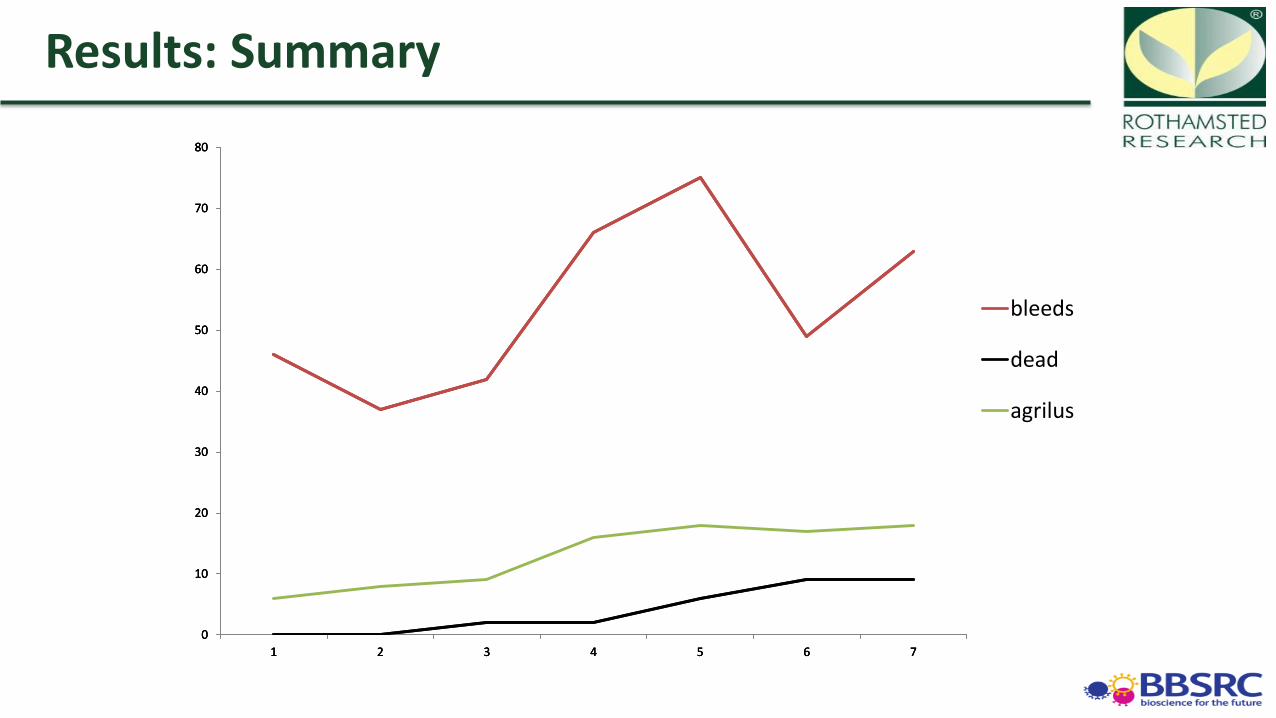
Results: Summary
0
10
20
30
40
50
60
70
80
1 2 3 4 5 6 7
bleeds
0
10
20
30
40
50
60
70
80
1 2 3 4 5 6 7
bleeds
dead
0
10
20
30
40
50
60
70
80
1 2 3 4 5 6 7
bleeds
dead
agrilus

Processes
• Infection • New trees affected • More stem bleeds on affected trees • Heavily infected trees have important role
Beetle emergence
• Remission • Individual bleeds and galleries heal over • Host Health Vs Genetics
• • •
No Bleeds
1 Bleeds
2 Bleeds
3 Bleeds
MAX

Crown Vs Severity

Summary
• The effectiveness of disease surveys can be greatly increase by including public reports
• Sub-sampling can reduce spatial bias
• All data can be used if autocorrelation taken into account
• Extent of long term damage influenced by biotic agents at the local scale.
Acknowledgements
• TSU Staff: Mark Oram, Emyr Algieri, Lee Cooper, Steve Coventry, Craig Griffiths, Justin Hardy, Mark Hilleard, John Manning, Joe McMinn, Liz Richardson, Nicola Rivett, Tony Reeves, Zac Sibthorpe, Paul Turner and Stephen Whall.
• Forest Research Labs: Susan Kirk, Sarah Plummer and Dr Glyn Barrett
• Management of site data collection: Rory Vereker (FR)
• Locating oak woodland: National Forest Inventory (Alan Brewer and Robyn McAlister at IFOS) , Woodland Trust, National Trust, Wildlife Trusts, SSSI sites (Natural England, Countryside Council for Wales and Dr Scott Wilson)
This work was supported by the Forestry Commission and Defra project TH0108