monitoring financial protection
TRANSCRIPT

Division of Health Systems & Public Health
Monitoring financial protection
Tamás Evetovits & Sarah Thomson WHO Barcelona Office for Health Systems
Strengthening
OECD meeting of the Joint Network on Fiscal
Sustainability of Health Systems, 4-5 February 2016


Universal health coverage (UHC)
All people should get access to needed health services of sufficient quality to be effective (including prevention, promotion, treatment, medicine, rehabilitation and palliative care) without the risk of being exposed to financial hardship

Two important measures for UHC
Unmet
need
Financial protection
0
5
10
15
20
25
30
Slo
ve
nia
Neth
erland
s
Austr
ia
Malta
Un
ite
d K
ing
do
m
Spain
Den
mark
Czech R
ep
ublic
Luxem
bo
urg
Slo
va
kia
Sw
ed
en
Germ
any
Ire
lan
d
Lithuan
ia
Port
ugal
Belg
ium
Fra
nce
Fin
land
EU
28
Hun
gary
Cypru
s
Cro
atia
Esto
nia
Pola
nd
Rom
ania
Italy
Gre
ece
Bulg
aria
Latv
ia
%
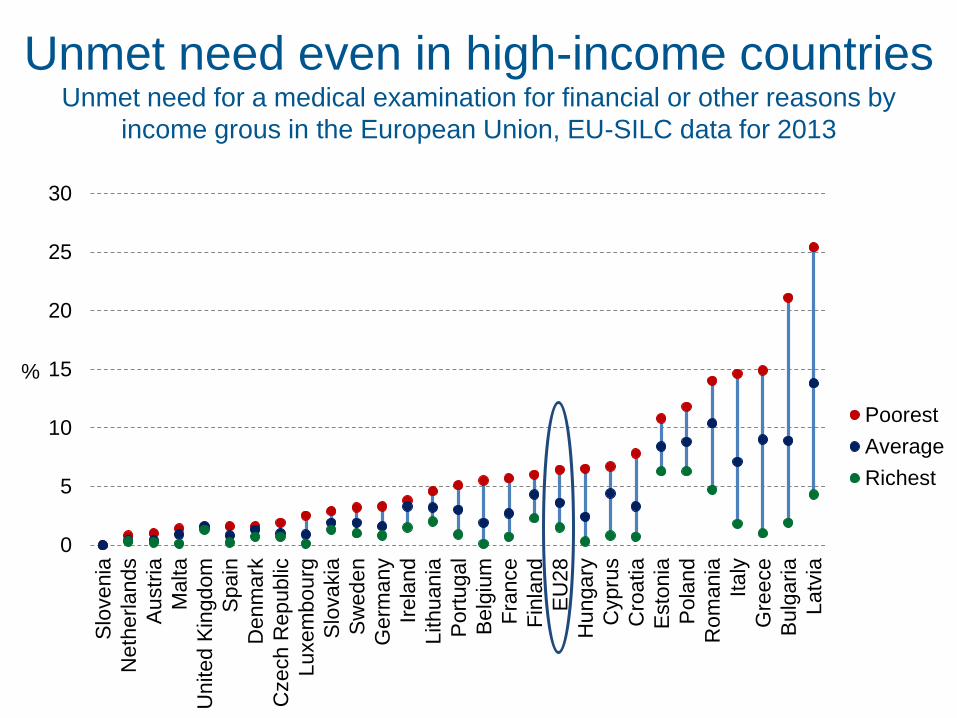
Poorest
Average
Richest
Unmet need even in high-income countries Unmet need for a medical examination for financial or other reasons by
income grous in the European Union, EU-SILC data for 2013
Out-of-pocket spending as a proxy to
financial protection
OOPs
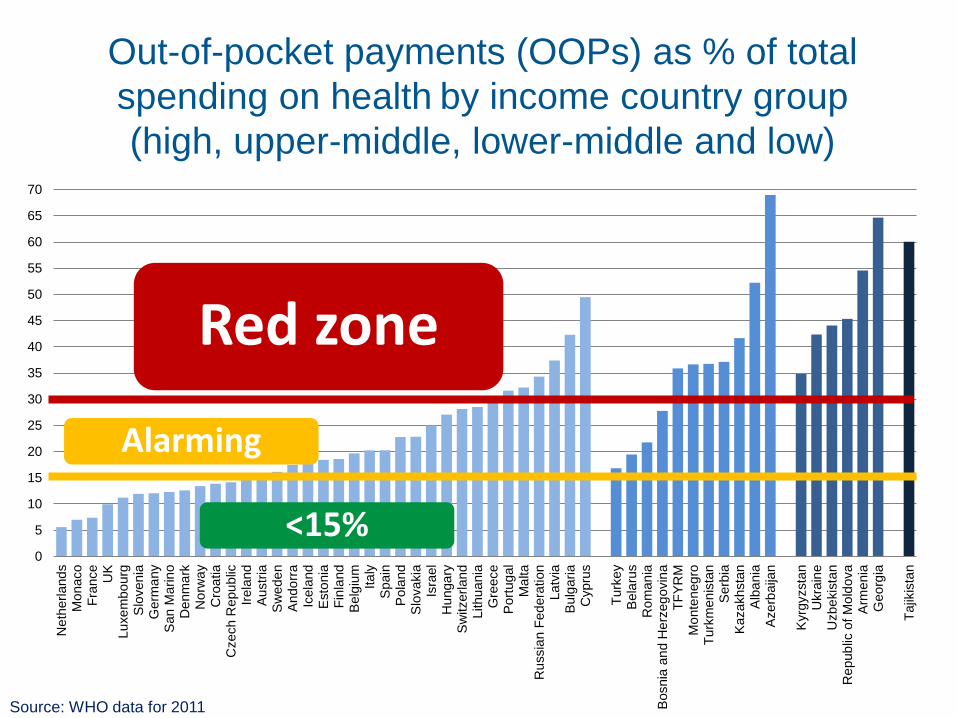
Out-of-pocket payments (OOPs) as % of total
spending on health by income country group
(high, upper-middle, lower-middle and low)
0
5
10
15
20
25
30
35
40
45
50
55
60
65
70
Ne
therl
and
sM
onaco
Fra
nce
UK
Lu
xe
mbo
urg
Slo
ven
iaG
erm
any
San M
arin
oD
enm
ark
No
rwa
yC
roa
tia
Czech R
epu
blic
Irela
nd
Austr
iaS
wede
nA
ndo
rra
Icela
nd
Esto
nia
Fin
land
Belg
ium
Ita
lyS
pain
Pola
nd
Slo
vakia
Isra
el
Hu
nga
ryS
witzerl
and
Lithu
ania
Gre
ece
Port
ug
al
Ma
lta
Ru
ssia
n F
ed
era
tion
La
tvia
Bulg
aria
Cypru
s
Turk
ey
Bela
rus
Ro
man
iaB
osnia
an
d H
erz
eg
ovin
aT
FY
RM
Mo
nte
neg
roT
urk
men
ista
nS
erb
iaK
azakhsta
nA
lba
nia
Aze
rbaija
n
Kyrg
yzsta
nU
kra
ine
Uzbe
kis
tan
Re
pub
lic o
f M
old
ova
Arm
enia
Geo
rgia
Tajik
ista
n
Source: WHO data for 2011
Red zone
Alarming
<15%

Where governments spend more,
patients pay less, but policies matter
Source: WHO estimates for 2012, selected countries with population > 600,000
More public spending and
better health policies

Make sure poorer people are protected
<15%

Reduce OOPs for poorer people
15-30%

Increase public spending
and make it pro-poor
>30%

Measures of financial protection
Impoverishing
health
expenditure
Catastrophic health
expenditure

Basic needs
Cumulative distribution of the population
Househ
old
consum
ption
Before OOPs
After OOPs
no OOPs 1
5 further impoverished by OOPs
4 impoverished by OOPs
at risk of being impoverished by OOPs 3
2 not at risk of being
impoverished by OOPs
Multiple of basic needs (eg 120%)
Source: WHO 2015
Impoverishing health expenditure

Methodology matters: do richer people really suffer
the most? OOPs > 25% of a household’s budget in global monitoring
1
1.4
1.9 1.9
2.7
0.0
0.5
1.0
1.5
2.0
2.5
3.0
Poorest 2 3 4 Richest
%
Source: Median values for 37 countries; WHO-WB global monitoring framework 2015

Capacity to pay
Basic needs
Cumulative distribution of the population
Ho
use
ho
ld c
on
su
mp
tio
n
Before OOPs
After OOPs
Catastrophic health spending: capacity to pay approach
(includes any OOPs that leave households impoverished)
Catastrophic health spending C
C also further impoverished by OOPs
C also impoverished by OOPs
C
C
40%
Source: WHO 2015

Preliminary results for selected EU countries
before the financial and economic crisis 0
.1%
1.1
%
1.2
%
2.9
%
7.4
%
10
.0%
10
.3%
10
.6%
11
.5%
0%
20%
40%
60%
80%
100%
SV
N 2
00
7
IRL
20
09
CZ
E 2
009
CY
P 2
00
9
GR
C 2
008
LV
A 2
00
8
ES
T 2
00
7
PR
T 2
005
LT
U 2
008
No OOP spending
Not-at-risk of impoverishmentafter OOP spending
At-risk of impoverishment afterOOP spending (Below 120%)
Impoverished by OOPspending
More impoverished by OOPspending
Catastrophic (>40%)
Source: WHO 2015

The poorest households are consistently at
greatest risk of catastrophic spending
0%
5%
10%
15%
20%
25%
30%
35%
40%
45%
SV
N 2
007
IRL
20
09
CZ
E 2
009
CY
P 2
009
GR
C 2
00
8
LV
A 2
00
8
ES
T 2
00
7
PR
T 2
005
LT
U 2
008
1 (poorest) 2 3 4 5 (richest)
Source: WHO 2015
Consumption
quintiles:

Removing financial barriers
Increase PUBLIC spending
Reduce OOPs
Reduce waste

Our vision at WHO/Europe
Europe free of
impoverishing health
expenditures

WHO Barcelona Office for Health
Systems Strengthening
Established in 1999
Supported by the Government of the
Autonomous Community of Catalonia, Spain
Focuses on health systems financing:
analytical work and capacity building
Staff work directly with Member States across
the European Region
Part of the Division of Health Systems &
Public Health of the WHO Regional Office for
Europe www.euro.who.int
Contact us:
Sant Pau Art Nouveau Site
Nostra Senyora de La Mercè pavilion
Sant Antoni Maria Claret 167
08025 Barcelona, Spain
Email: [email protected]