monitoring challenges - monitorama 2016 - monitoringless
TRANSCRIPT

Monitoring Challenges
Monitorama June 2016 Adrian Cockcroft
@adrianco

What does @adrianco do?
@adrianco
Technology Due Diligence on
Deals
Presentations at Companies and
Conferences
Tech and Board Advisor
Support for Portfolio
Companies
Consulting and Training
Networking with Interesting PeopleTinkering with
Technologies
Vendor Relationships
Previously: Netflix, eBay, Sun Microsystems, Cambridge Consultants, City University London - BSc Applied Physics

Monitorama 2014…

Monitorama 2016
What problems does monitoring address? Why isn’t this a solved problem already?
Who gets disrupted by what? Stuff I’ve been tinkering with

Measuring business value
Problem detection and diagnosis

“Ultimately business value is what the business values, and that is that.”
Mark Schwartz CIO DHS/DCIS
Business Value of Monitoring
Customer happiness Cost efficiency
Safety and security Compliance

Business Value of Monitoring
Customer happiness Cost efficiency
Safety and security Compliance

Customer Happiness
Time to value Availability
Response time
Cost Efficiency
Utilization Optimization Automation

Why isn’t this a solved problem already?

Why isn’t there one standard for monitoring?
Why isn’t there one standard for monitoring?We tried that once, immediately obsoleted by rise of Windows NT
X/Open Universal Measurement Architecture - 1997 http://pubs.opengroup.org/onlinepubs/009657299/c427-1/front.htm
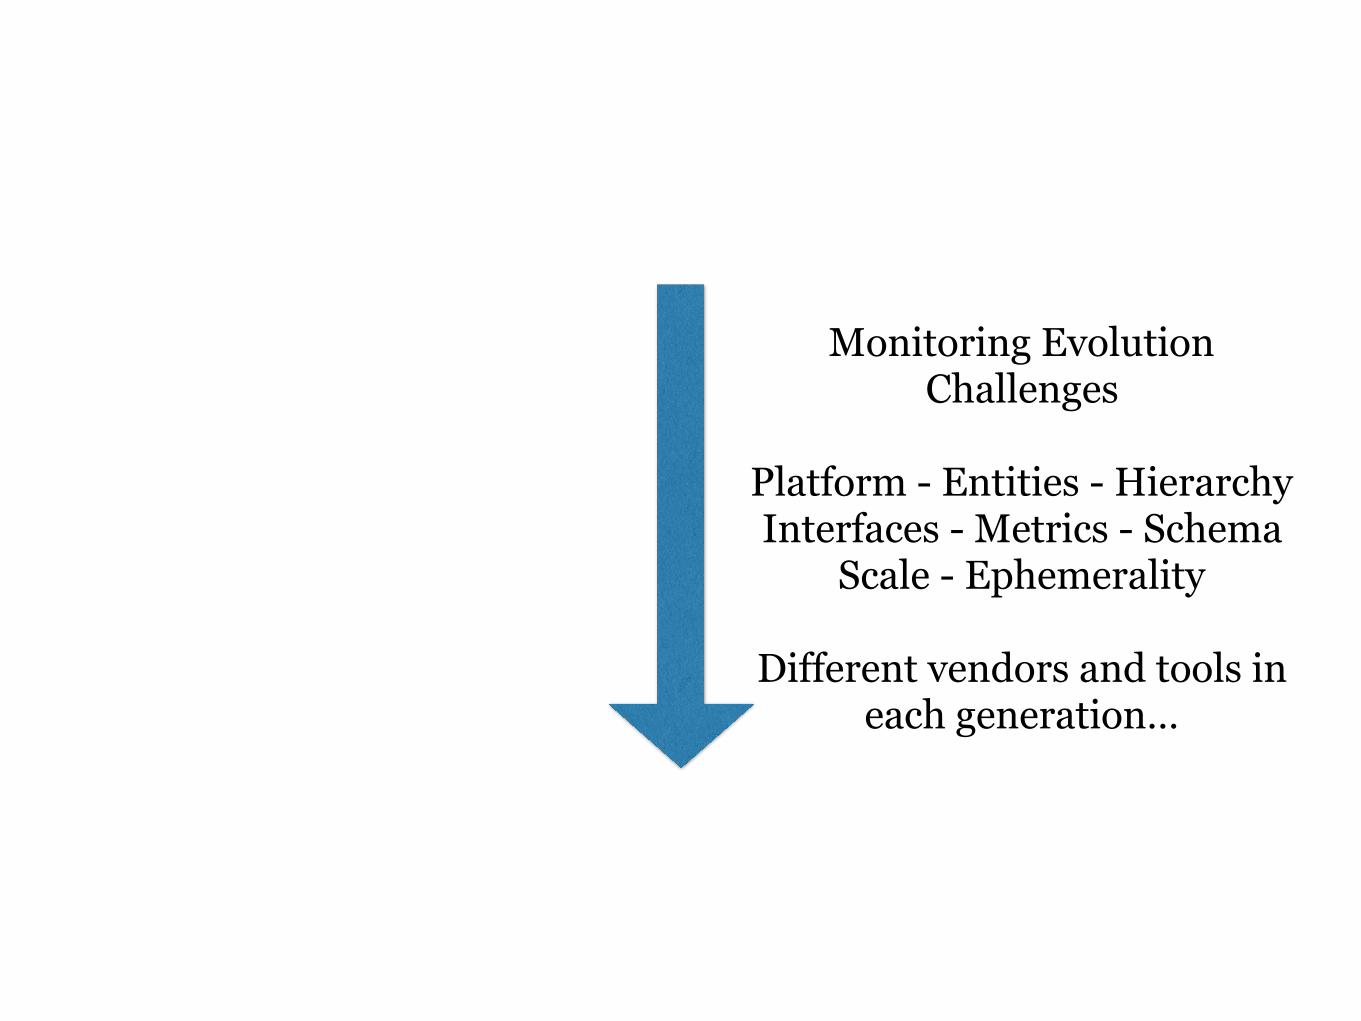
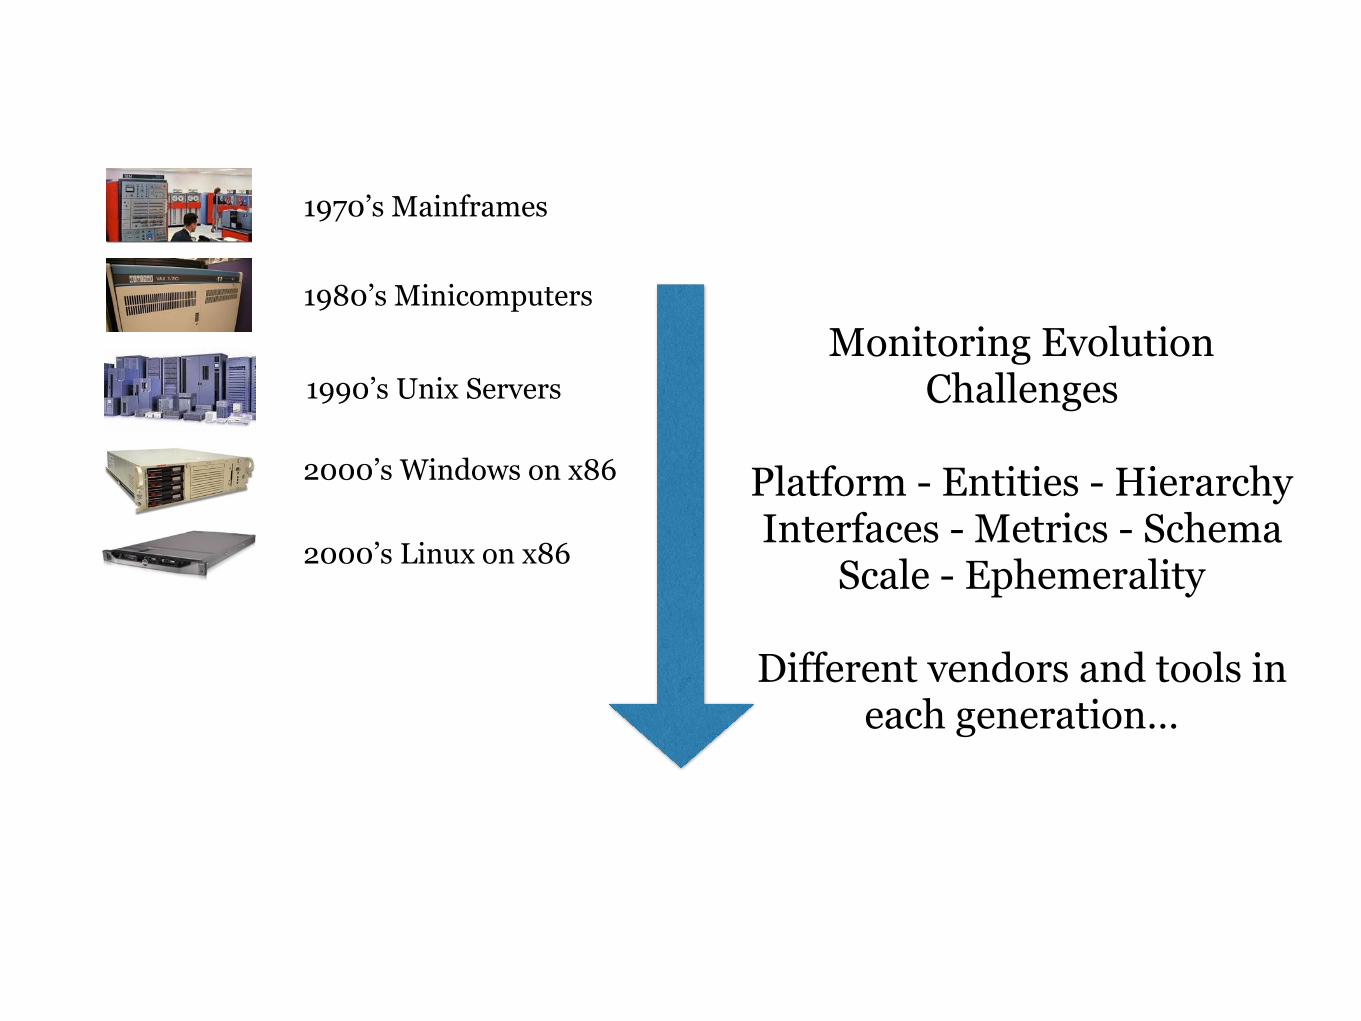
Monitoring Evolution Challenges
Platform - Entities - Hierarchy Interfaces - Metrics - Schema
Scale - Ephemerality
Different vendors and tools in each generation…

1970’s Mainframes
Monitoring Evolution Challenges
Platform - Entities - Hierarchy Interfaces - Metrics - Schema
Scale - Ephemerality
Different vendors and tools in each generation…

1970’s Mainframes
1980’s Minicomputers
Monitoring Evolution Challenges
Platform - Entities - Hierarchy Interfaces - Metrics - Schema
Scale - Ephemerality
Different vendors and tools in each generation…

1990’s Unix Servers
1970’s Mainframes
1980’s Minicomputers
Monitoring Evolution Challenges
Platform - Entities - Hierarchy Interfaces - Metrics - Schema
Scale - Ephemerality
Different vendors and tools in each generation…

1990’s Unix Servers
1970’s Mainframes
2000’s Windows on x86
1980’s Minicomputers
Monitoring Evolution Challenges
Platform - Entities - Hierarchy Interfaces - Metrics - Schema
Scale - Ephemerality
Different vendors and tools in each generation…
1990’s Unix Servers
1970’s Mainframes
2000’s Windows on x86
1980’s Minicomputers
2000’s Linux on x86
Monitoring Evolution Challenges
Platform - Entities - Hierarchy Interfaces - Metrics - Schema
Scale - Ephemerality
Different vendors and tools in each generation…
1990’s Unix Servers
1970’s Mainframes
2000’s Windows on x86
1980’s Minicomputers
2000’s Linux on x86
2000’s VMware on blades
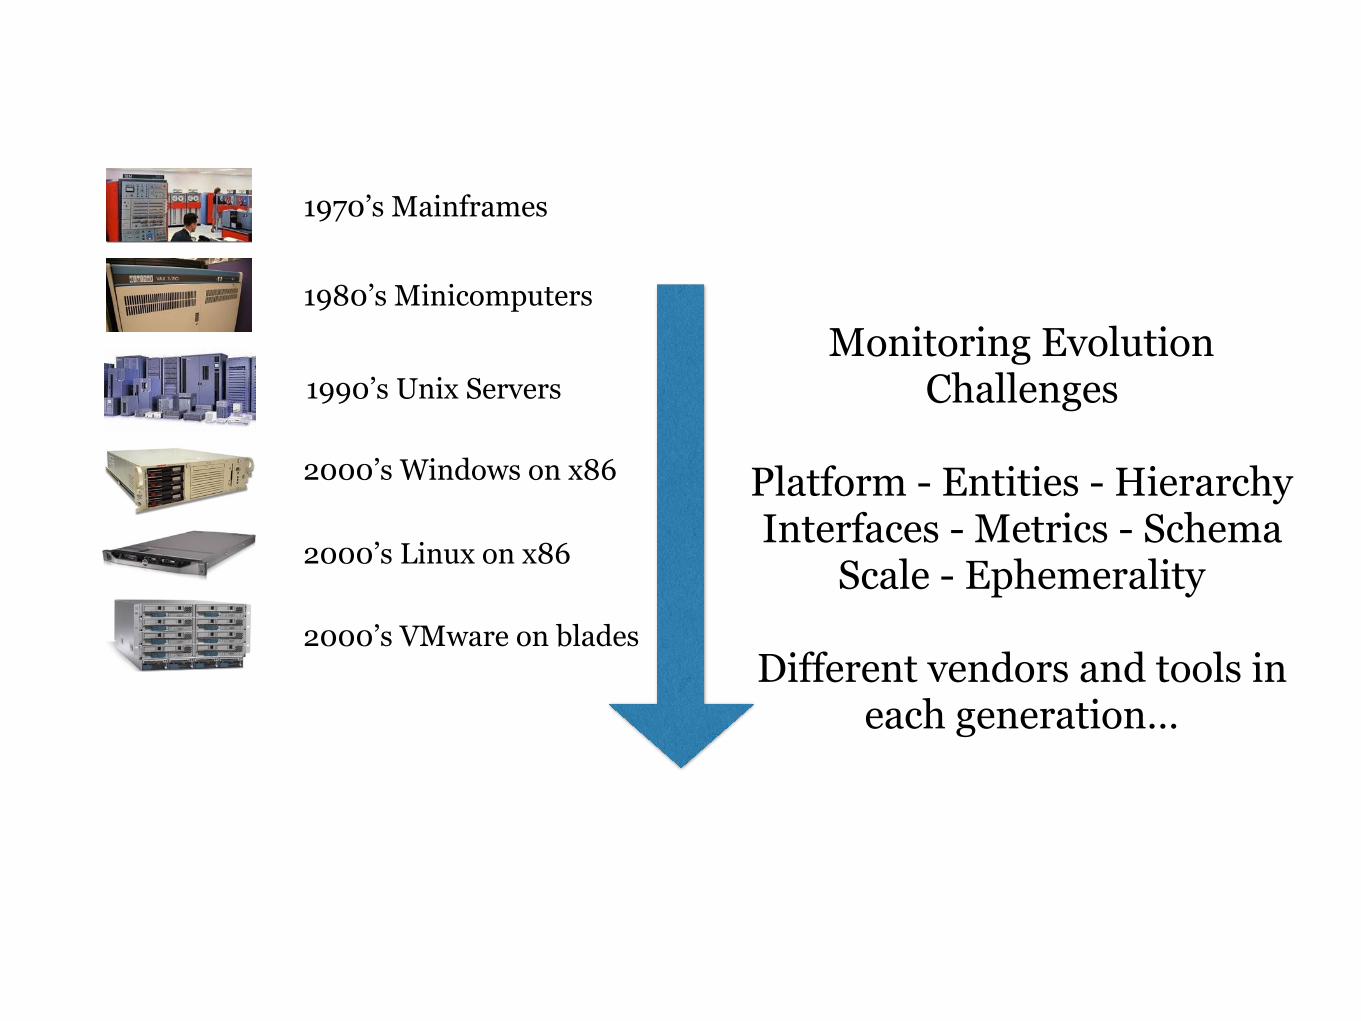
Monitoring Evolution Challenges
Platform - Entities - Hierarchy Interfaces - Metrics - Schema
Scale - Ephemerality
Different vendors and tools in each generation…

1990’s Unix Servers
1970’s Mainframes
2000’s Windows on x86
1980’s Minicomputers
2000’s Linux on x86
2000’s VMware on blades
2010’s Public cloud
Monitoring Evolution Challenges
Platform - Entities - Hierarchy Interfaces - Metrics - Schema
Scale - Ephemerality
Different vendors and tools in each generation…
1990’s Unix Servers
1970’s Mainframes
2000’s Windows on x86
1980’s Minicomputers
2000’s Linux on x86
2000’s VMware on blades
2010’s Public cloud2010’s Containers
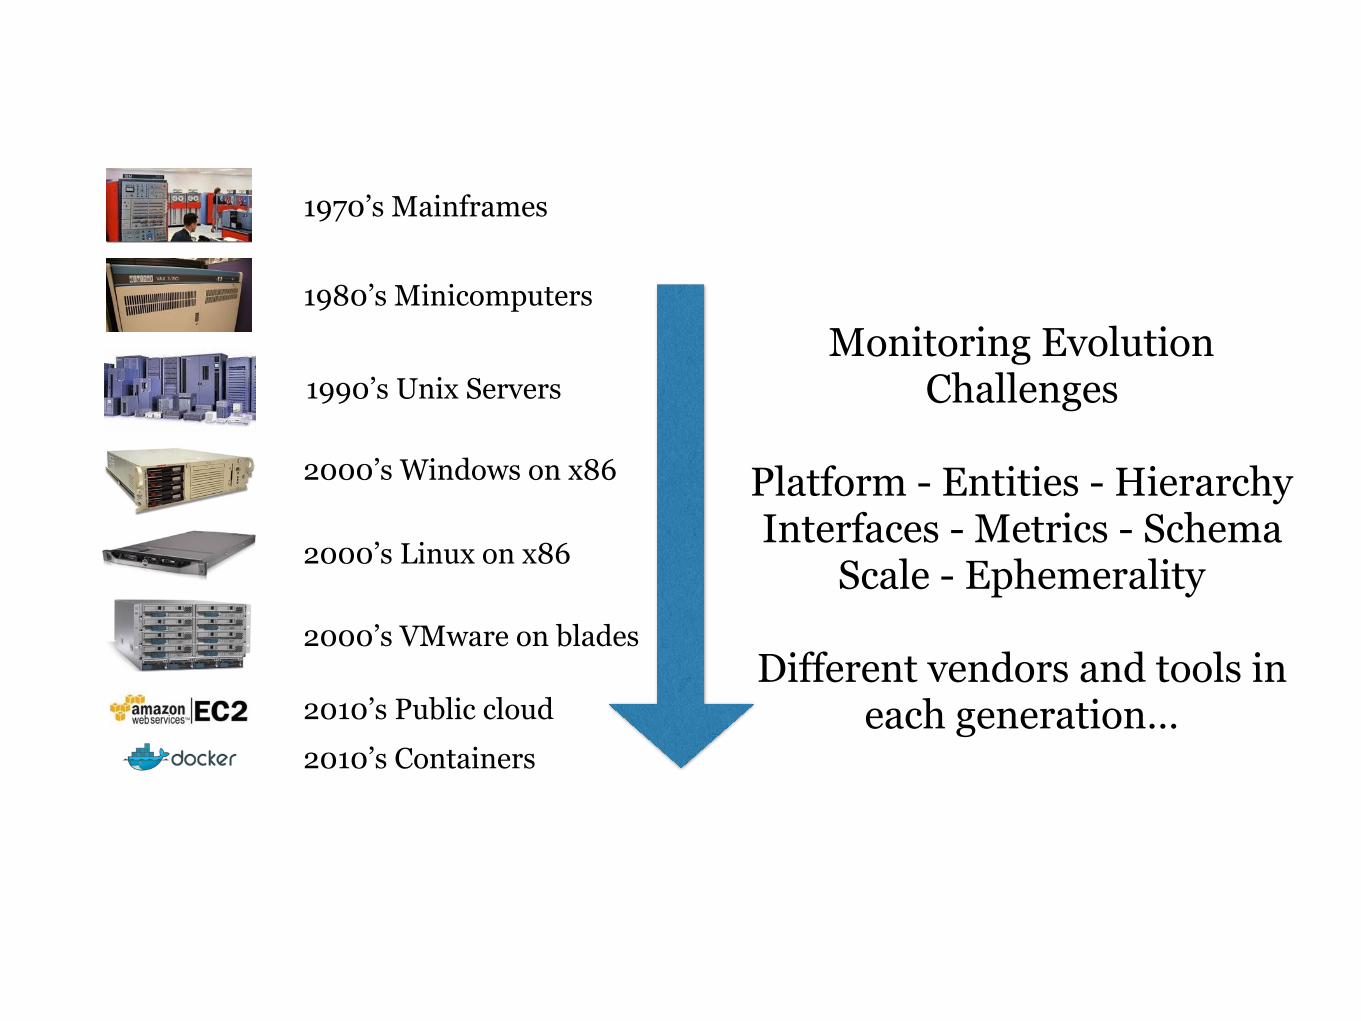
Monitoring Evolution Challenges
Platform - Entities - Hierarchy Interfaces - Metrics - Schema
Scale - Ephemerality
Different vendors and tools in each generation…

1990’s Unix Servers
1970’s Mainframes
2000’s Windows on x86
1980’s Minicomputers
2000’s Linux on x86
2000’s VMware on blades
2010’s Public cloud2010’s Containers
2010’s Serverless
Monitoring Evolution Challenges
Platform - Entities - Hierarchy Interfaces - Metrics - Schema
Scale - Ephemerality
Different vendors and tools in each generation…

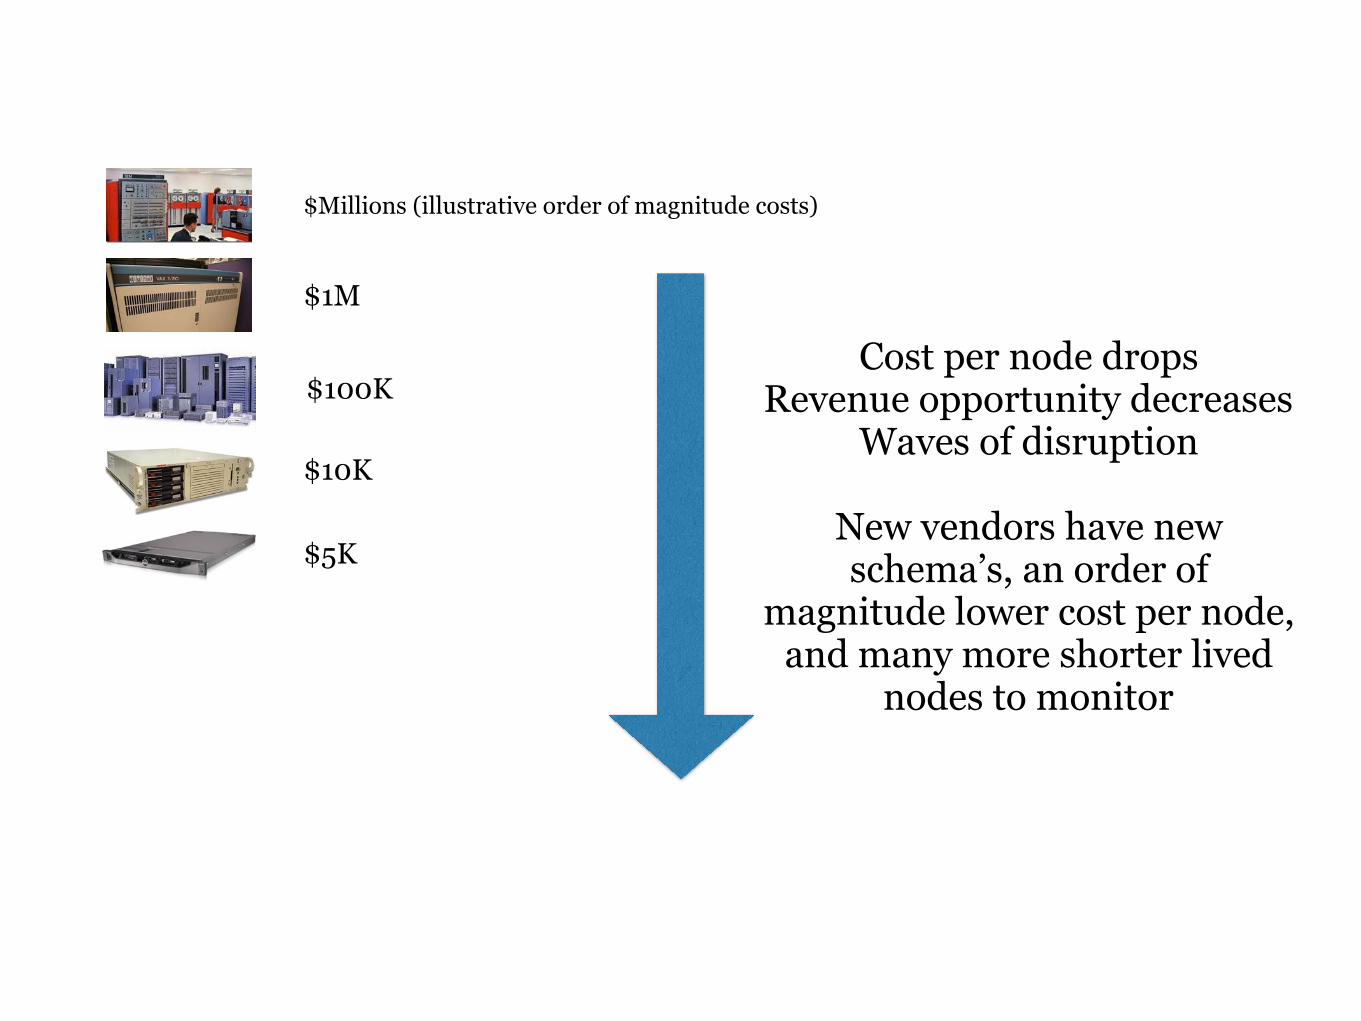
Why don’t monitoring vendors adapt and survive?
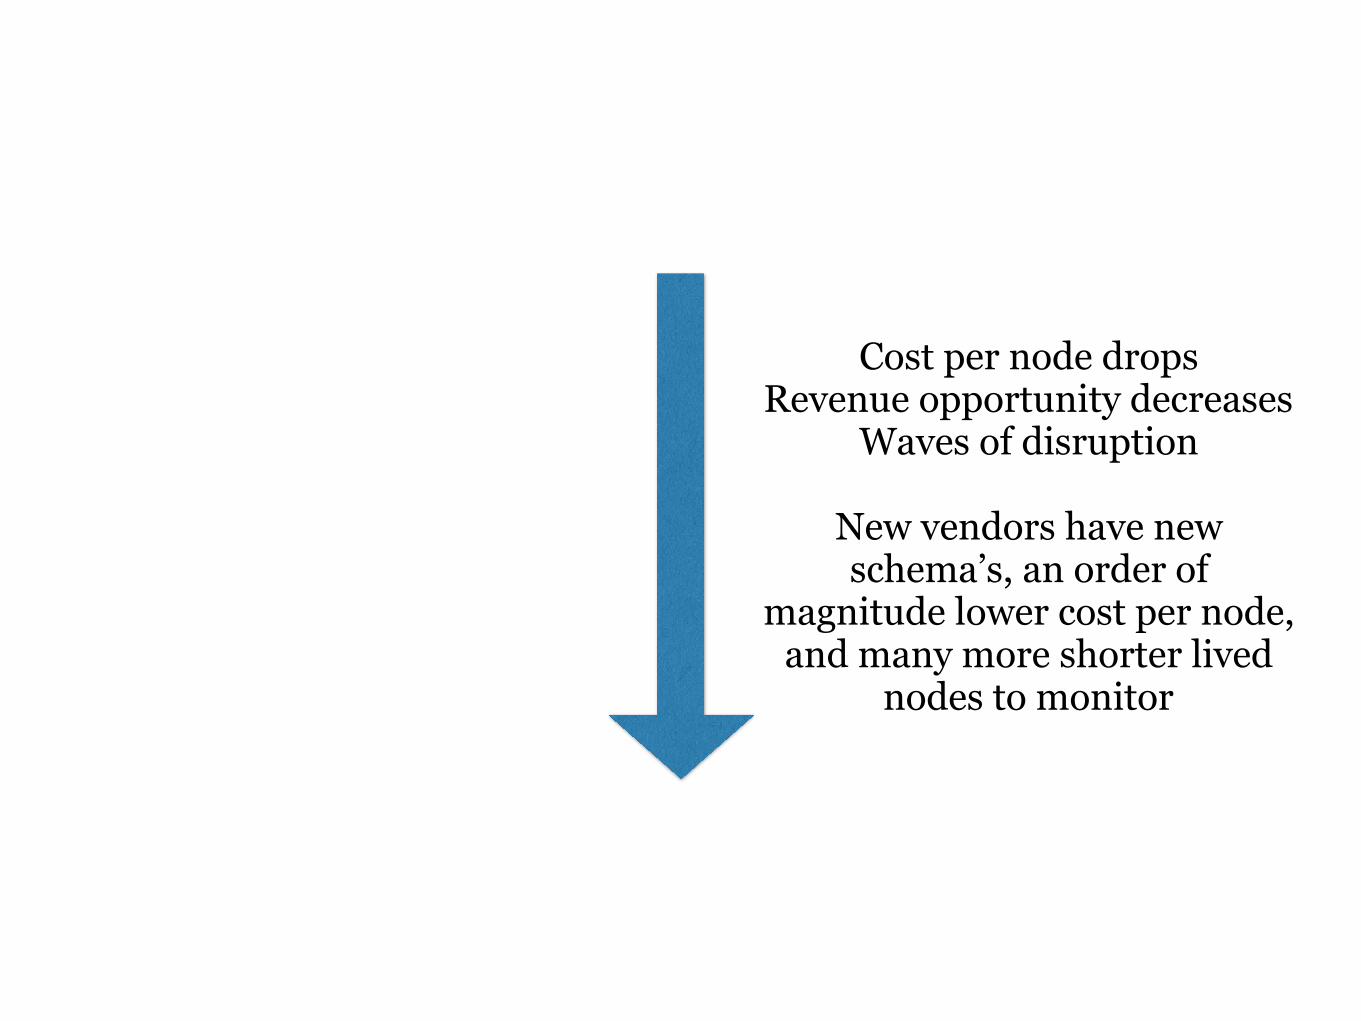
Cost per node drops Revenue opportunity decreases
Waves of disruption
New vendors have new schema’s, an order of
magnitude lower cost per node, and many more shorter lived
nodes to monitor

$Millions (illustrative order of magnitude costs)
Cost per node drops Revenue opportunity decreases
Waves of disruption
New vendors have new schema’s, an order of
magnitude lower cost per node, and many more shorter lived
nodes to monitor

$Millions (illustrative order of magnitude costs)
$1M
Cost per node drops Revenue opportunity decreases
Waves of disruption
New vendors have new schema’s, an order of
magnitude lower cost per node, and many more shorter lived
nodes to monitor
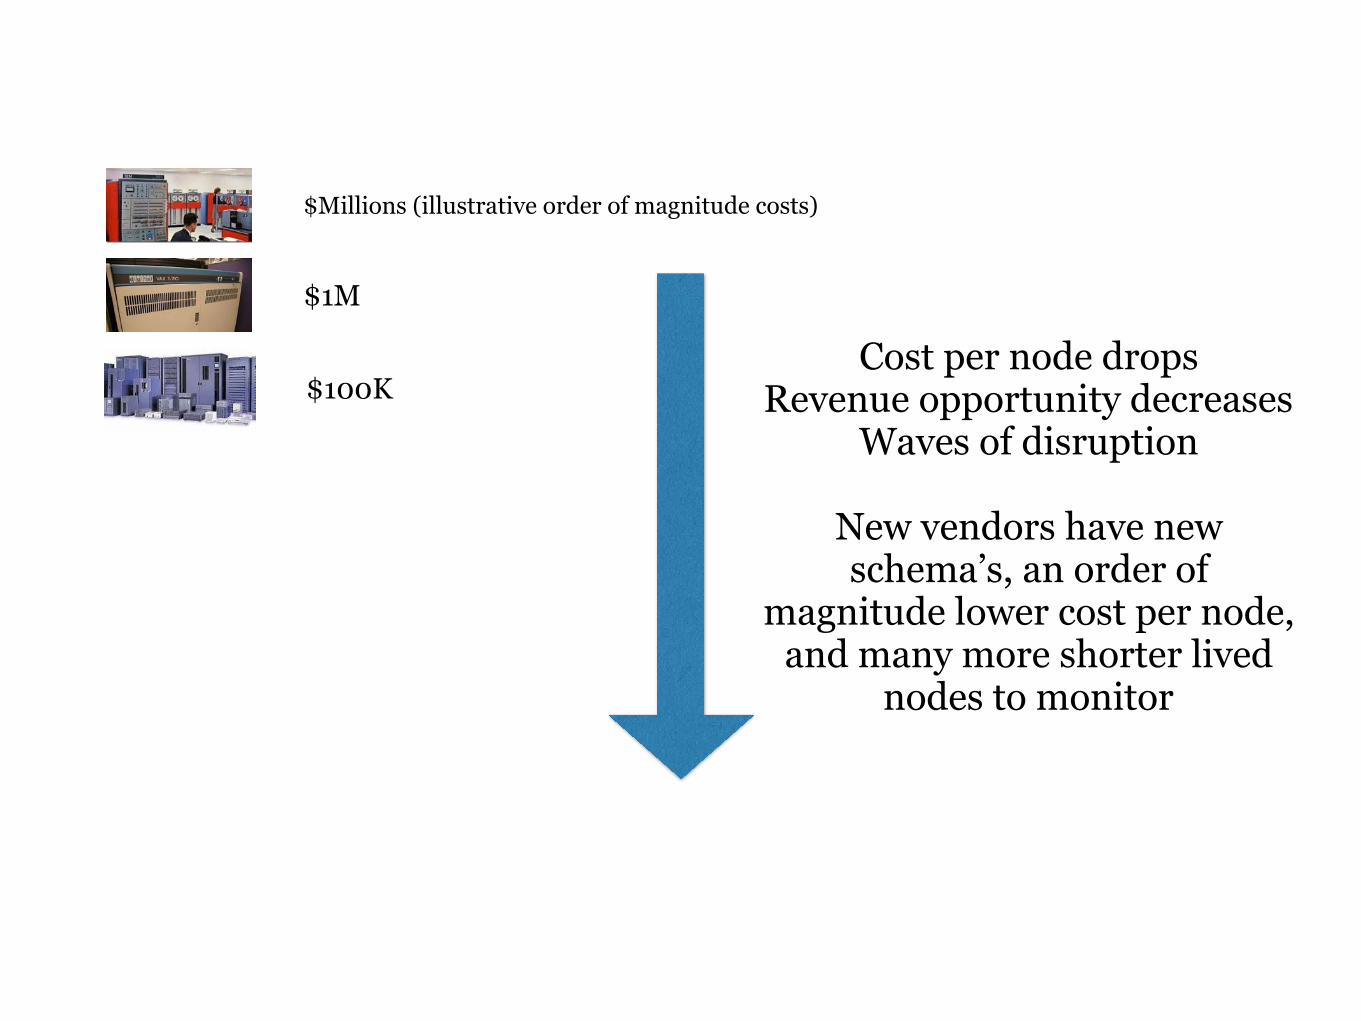
$100K
$Millions (illustrative order of magnitude costs)
$1M
Cost per node drops Revenue opportunity decreases
Waves of disruption
New vendors have new schema’s, an order of
magnitude lower cost per node, and many more shorter lived
nodes to monitor

$100K
$Millions (illustrative order of magnitude costs)
$10K
$1M
Cost per node drops Revenue opportunity decreases
Waves of disruption
New vendors have new schema’s, an order of
magnitude lower cost per node, and many more shorter lived
nodes to monitor
$100K
$Millions (illustrative order of magnitude costs)
$10K
$1M
$5K
Cost per node drops Revenue opportunity decreases
Waves of disruption
New vendors have new schema’s, an order of
magnitude lower cost per node, and many more shorter lived
nodes to monitor

$100K
$Millions (illustrative order of magnitude costs)
$10K
$1M
$5K
$1K per core
Cost per node drops Revenue opportunity decreases
Waves of disruption
New vendors have new schema’s, an order of
magnitude lower cost per node, and many more shorter lived
nodes to monitor

$100K
$Millions (illustrative order of magnitude costs)
$10K
$1M
$5K
$1K per core
$100’s per month
Cost per node drops Revenue opportunity decreases
Waves of disruption
New vendors have new schema’s, an order of
magnitude lower cost per node, and many more shorter lived
nodes to monitor

$100K
$Millions (illustrative order of magnitude costs)
$10K
$1M
$5K
$1K per core
$100’s per month$10’s per month
$1’s per month
Cost per node drops Revenue opportunity decreases
Waves of disruption
New vendors have new schema’s, an order of
magnitude lower cost per node, and many more shorter lived
nodes to monitor

Vendor Landscape
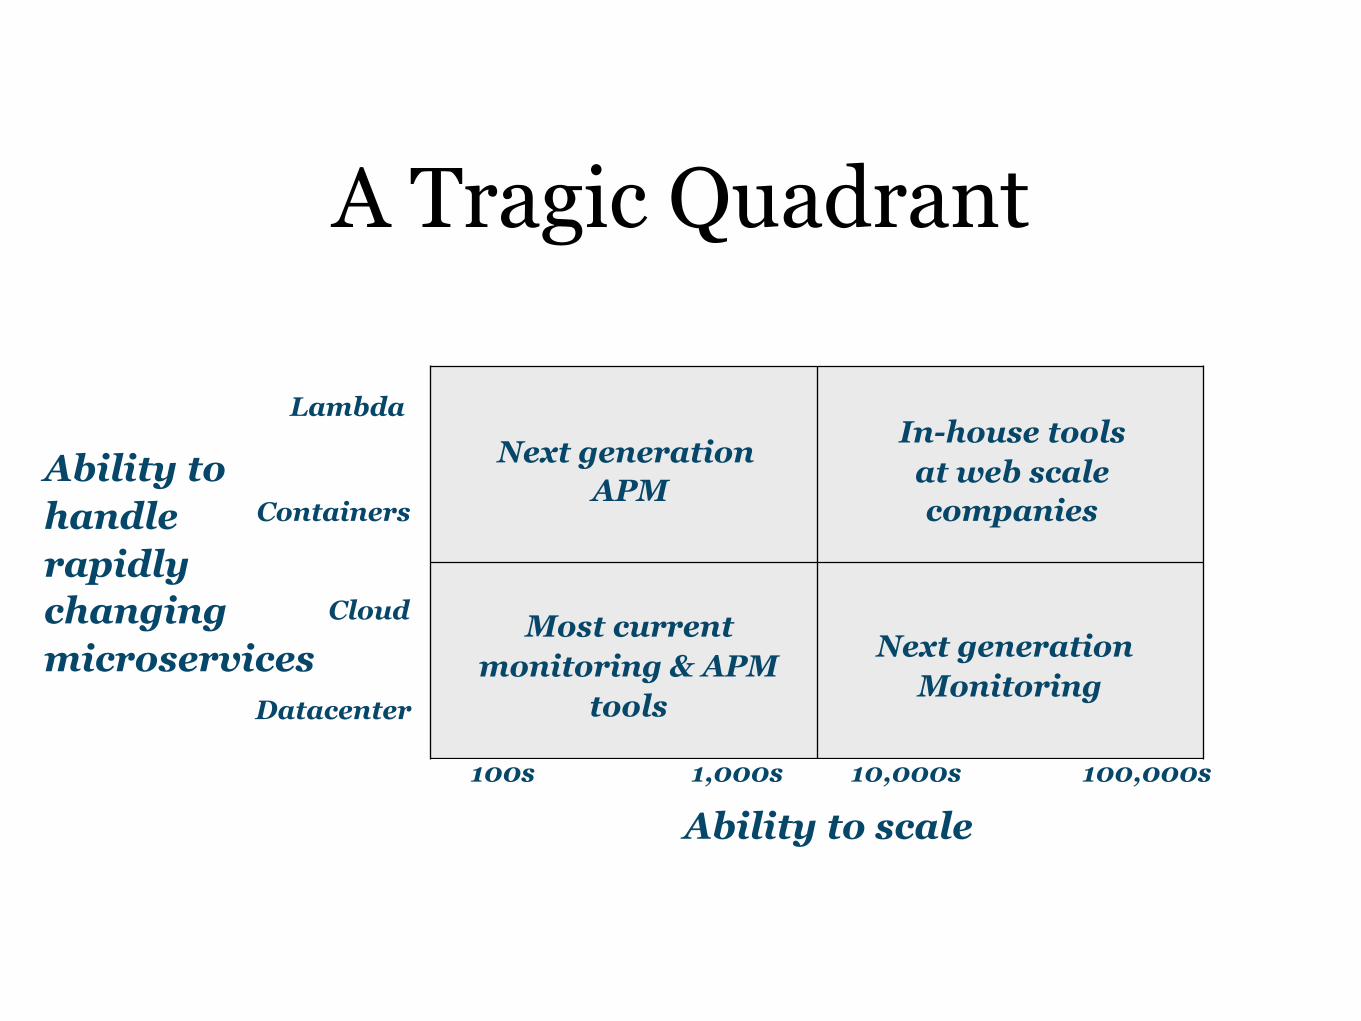
A Tragic Quadrant
Ability to scale
Ability to handle rapidly changing microservices
In-house tools at web scale companies
Most current monitoring & APM
tools
Next generation APM
Next generation Monitoring
Datacenter
Cloud
Containers
100s 1,000s 10,000s 100,000s
Lambda

A Tragic Quadrant
Ability to scale
Ability to handle rapidly changing microservices
In-house tools at web scale companies
Most current monitoring & APM
tools
Next generation APM
Next generation Monitoring
Datacenter
Cloud
Containers
100s 1,000s 10,000s 100,000s
Lambda
Vendors - tell me where you belong on this plot…

Tinkering
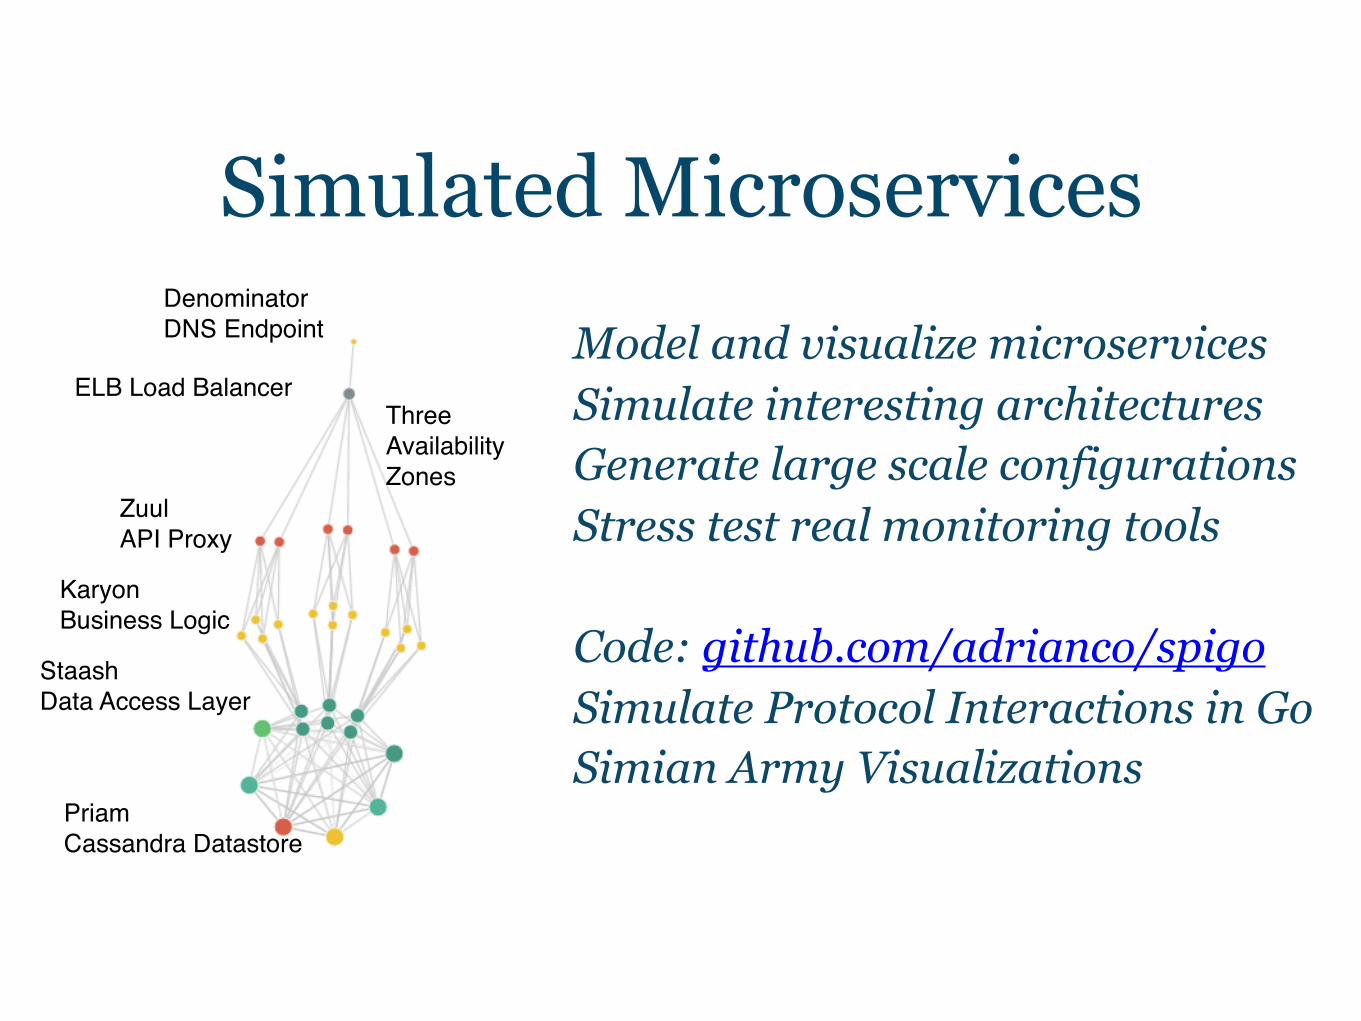
Simulated MicroservicesModel and visualize microservices Simulate interesting architectures Generate large scale configurations Stress test real monitoring tools
Code: github.com/adrianco/spigo Simulate Protocol Interactions in Go Simian Army Visualizations
ELB Load Balancer
ZuulAPI Proxy
KaryonBusiness Logic
StaashData Access Layer
PriamCassandra Datastore
ThreeAvailabilityZones
DenominatorDNS Endpoint

Zipkin Trace for one Spigo Flow

Response Times


memcached hit %
memcached response mysql response
service cpu time
memcached hit mode
mysql cache hit mode
mysql disk access mode
Hit rates: memcached 40% mysql 70%Guesstimate
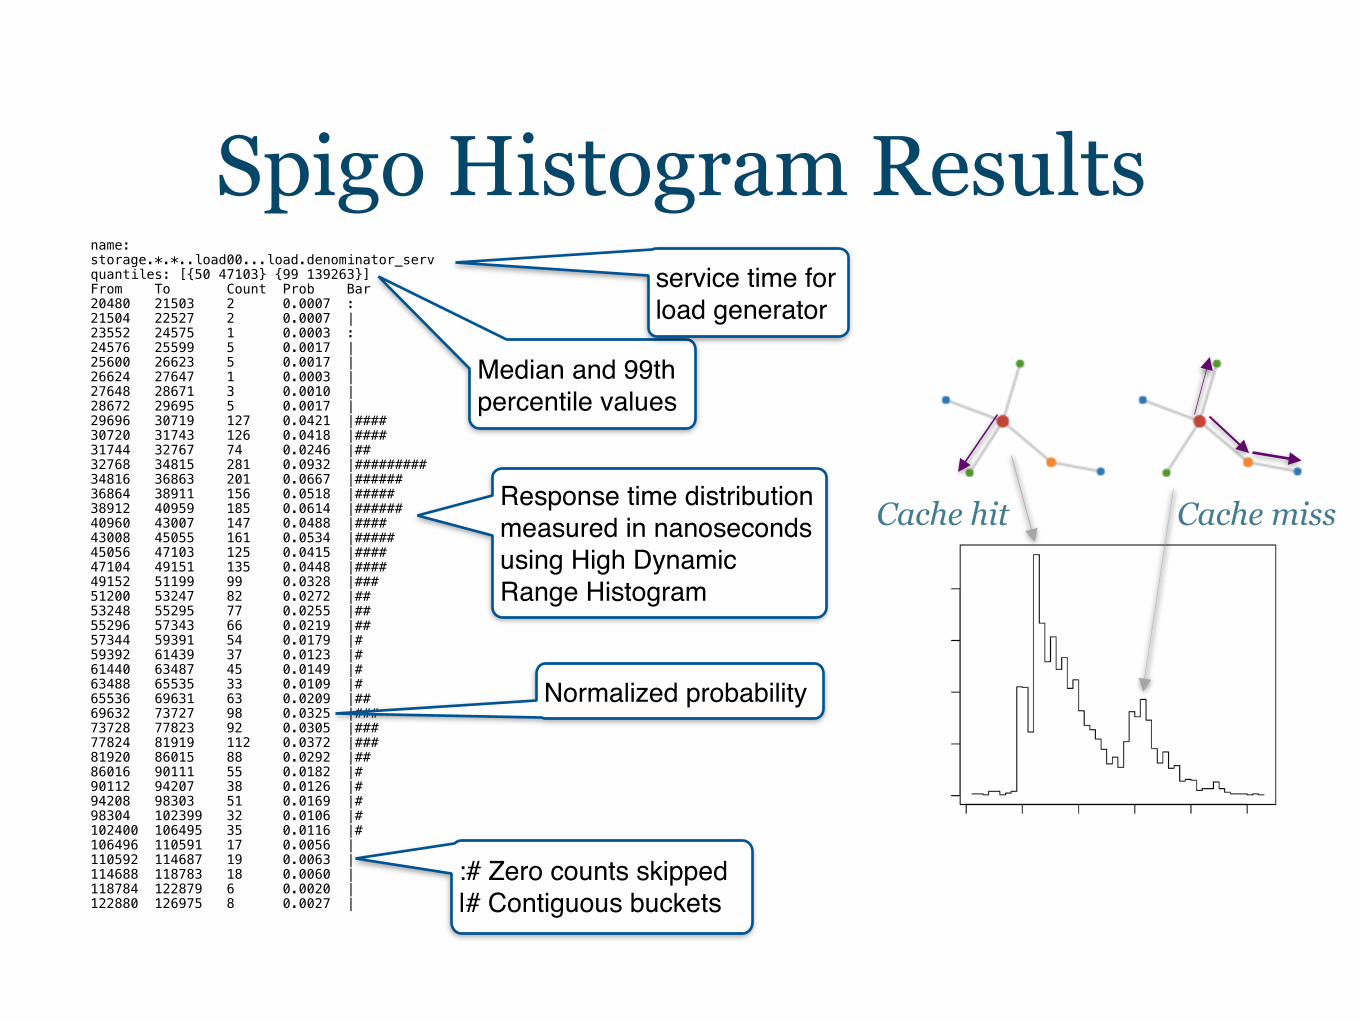
Spigo Histogram Results name: storage.*.*..load00...load.denominator_serv quantiles: [{50 47103} {99 139263}] From To Count Prob Bar 20480 21503 2 0.0007 : 21504 22527 2 0.0007 | 23552 24575 1 0.0003 : 24576 25599 5 0.0017 | 25600 26623 5 0.0017 | 26624 27647 1 0.0003 | 27648 28671 3 0.0010 | 28672 29695 5 0.0017 | 29696 30719 127 0.0421 |#### 30720 31743 126 0.0418 |#### 31744 32767 74 0.0246 |## 32768 34815 281 0.0932 |######### 34816 36863 201 0.0667 |###### 36864 38911 156 0.0518 |##### 38912 40959 185 0.0614 |###### 40960 43007 147 0.0488 |#### 43008 45055 161 0.0534 |##### 45056 47103 125 0.0415 |#### 47104 49151 135 0.0448 |#### 49152 51199 99 0.0328 |### 51200 53247 82 0.0272 |## 53248 55295 77 0.0255 |## 55296 57343 66 0.0219 |## 57344 59391 54 0.0179 |# 59392 61439 37 0.0123 |# 61440 63487 45 0.0149 |# 63488 65535 33 0.0109 |# 65536 69631 63 0.0209 |## 69632 73727 98 0.0325 |### 73728 77823 92 0.0305 |### 77824 81919 112 0.0372 |### 81920 86015 88 0.0292 |## 86016 90111 55 0.0182 |# 90112 94207 38 0.0126 |# 94208 98303 51 0.0169 |# 98304 102399 32 0.0106 |# 102400 106495 35 0.0116 |# 106496 110591 17 0.0056 | 110592 114687 19 0.0063 | 114688 118783 18 0.0060 | 118784 122879 6 0.0020 | 122880 126975 8 0.0027 |
Normalized probability
Response time distribution measured in nanoseconds using High Dynamic Range Histogram
:# Zero counts skipped|# Contiguous buckets
Median and 99th percentile values
service time for load generator
Cache hit Cache miss

Serverless

Serverless AWS Lambda - lots of production examples
Google Cloud Functions Azure Functions alpha launched
IBM OpenWhisk - open source
Startup activity: iron.io , serverless.com, apex.run toolkit

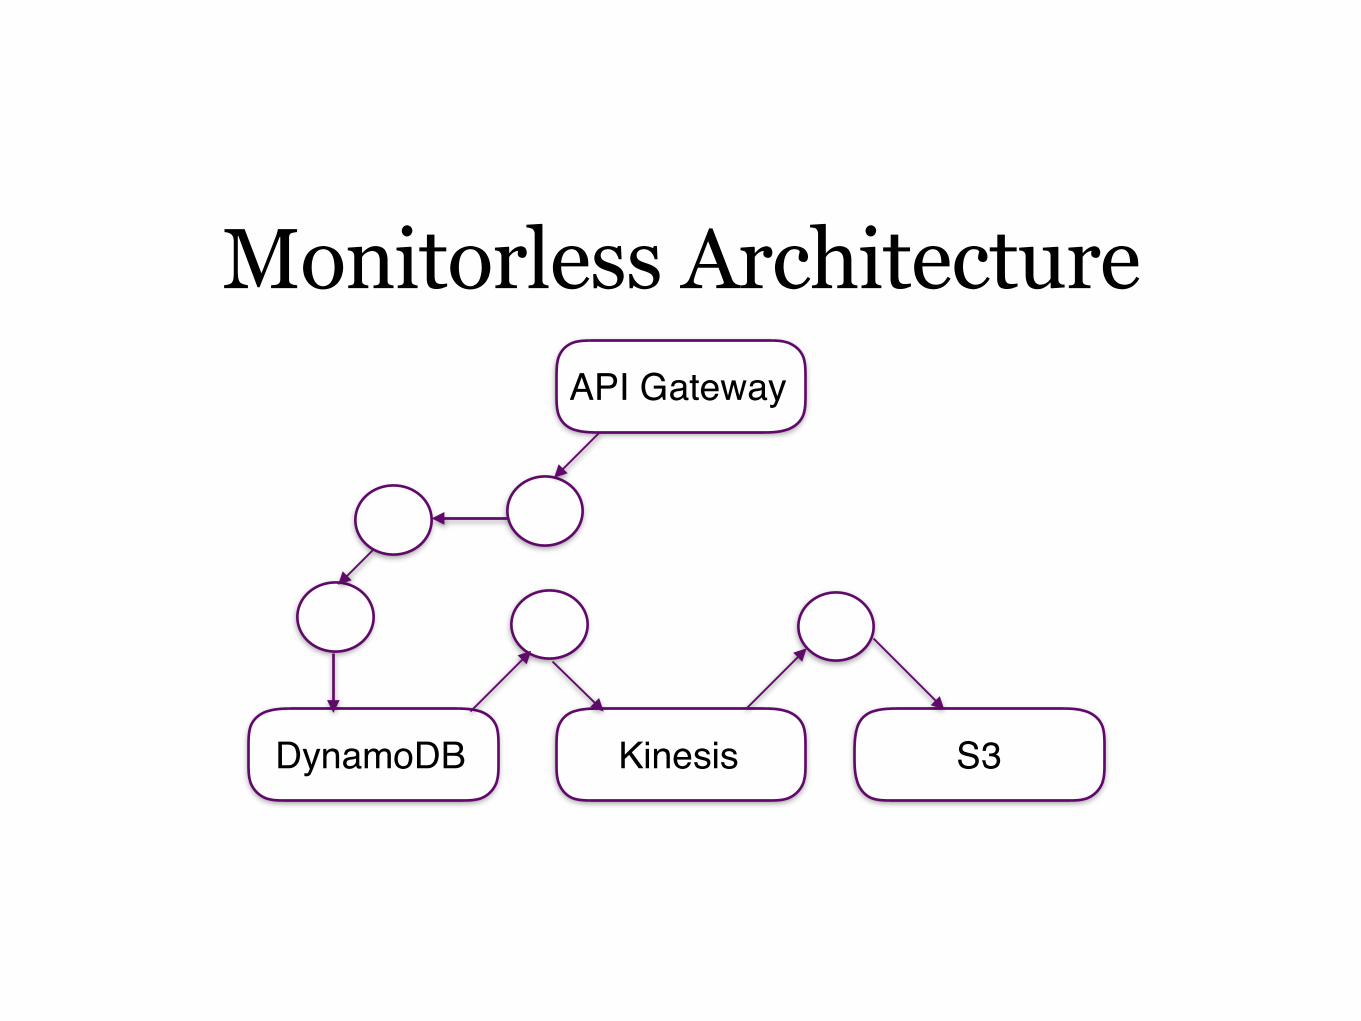
Monitorless ArchitectureAPI Gateway
Kinesis S3DynamoDB
Monitorless ArchitectureAPI Gateway
Kinesis S3DynamoDB

Monitorless ArchitectureAPI Gateway
Kinesis S3DynamoDB
Monitorable entities only exist during an execution trace

AWS Lambda Reference Arch http://www.allthingsdistributed.com/2016/05/aws-lambda-serverless-reference-architectures.html

Serverless Programming Model
Event driven functions Role based permissions
Whitelisted API based security Good for simple single threaded code

Serverless Cost Efficiencies
100% useful work, no agents, overheads 100% utilization, no charge between requests
No need for extra capacity for peak traffic Anecdotal costs ~1% of conventional system
Ideal for low traffic, Corp IT, spiky workloads

Serverless Work in Progress
Tooling for ease of use Multi-region HA/DR patterns
Debugging and testing frameworks Monitoring, end to end tracing
Using AWS Lambda to monitor AWS

DIY On-Premise Serverless Operating Challenges
Scheduling and startup latency Execution and monitoring overhead
Charging model Capacity planning

Monitoring Challenges
Too much new stuff Too ephemeral
Price disruption

Thanks!

Thanks!
Also speaking at: Docker Portland Meetup Wednesday Evening @Puppetlabs - Microservices: Whats Missing
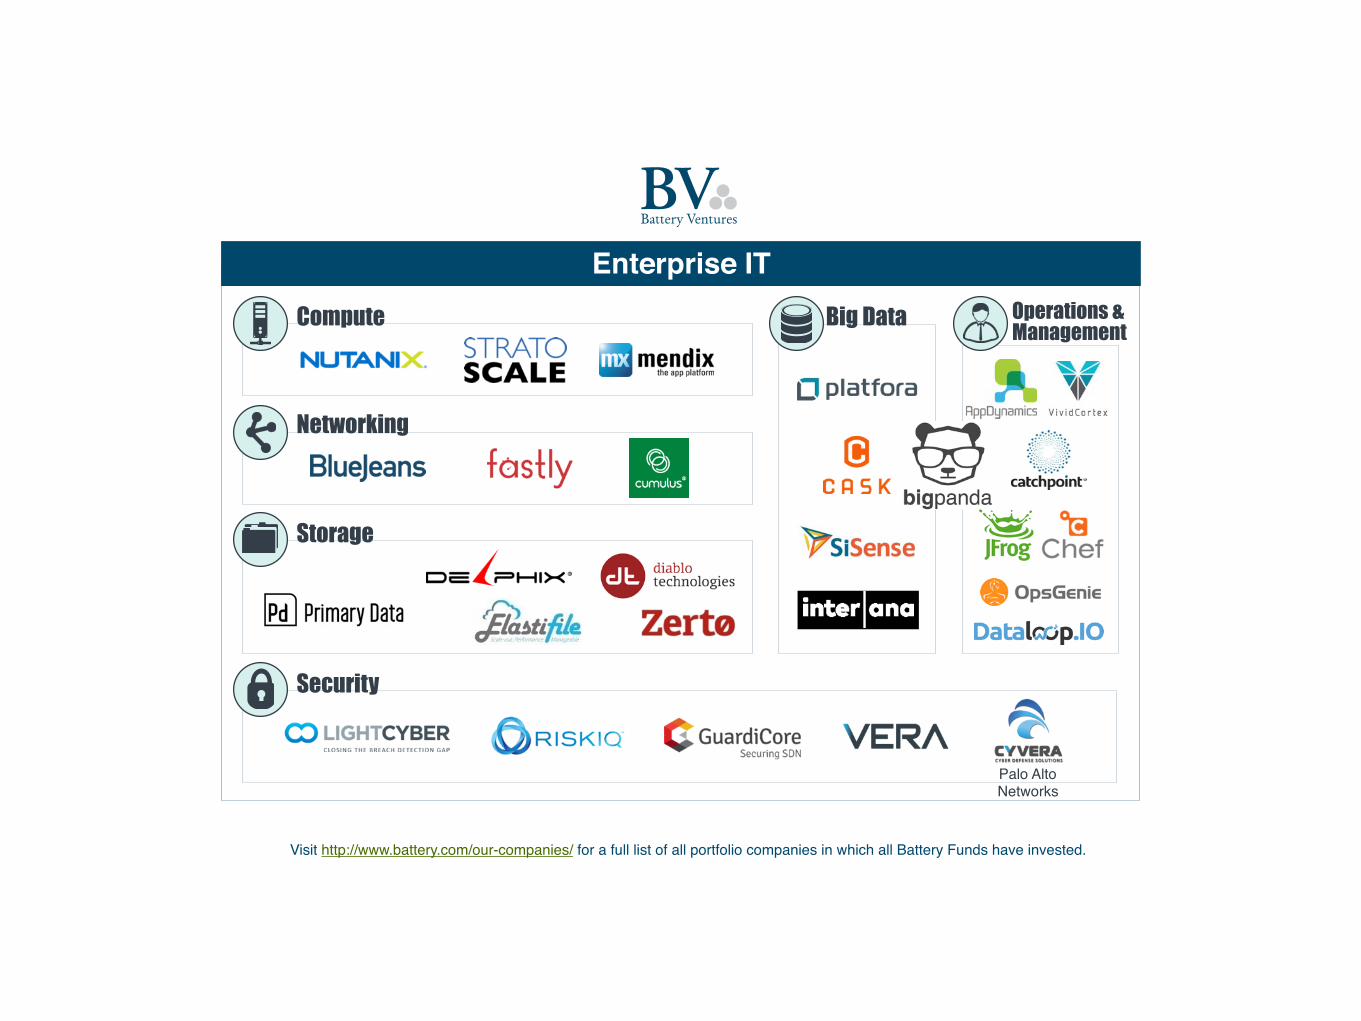
Security
Visit http://www.battery.com/our-companies/ for a full list of all portfolio companies in which all Battery Funds have invested.
Palo Alto Networks
Enterprise ITOperations & ManagementBig DataCompute
Networking
Storage