monitoring biological diversity: strategies, tools, limitations, and challenges
TRANSCRIPT

NORTHWESTERN NATURALIST 87:66-79 SPRING 2006
MONITORING BIOLOGICAL DIVERSITY: STRATEGIES, TOOLS, LIMITATIONS, AND CHALLENGES
ERIK A BE EVER^ USGS-BRD Forest t3 Rangeland Ecosystem Science Center, 3200 SW Jefferson Way,
Corvallis, Oregon 97331; [email protected]
ABSTRACT-Monitoring is an assessment of the spatial and temporal variability in one or more ecosystem properties, and is an essential component of adaptive management. Monitoring can help determine whether mandated environmental standards are being met and can provide an early-warning system of ecological change. Development of a strategy for monitoring biological diversity will likely be most successful when based upon clearly articulated goals and objectives and may be enhanced by including several key steps in the process. Ideally, monitoring of bi- ological diversity will measure not only composition, but also structure and function at the spatial and temporal scales of interest. Although biodiversity monitoring has several key lim- itations as well as numerous theoretical and practical challenges, many tools and strategies are available to address or overcome such challenges; I summarize several of these. Due to the di- versity of spatio-temporal scales and comprehensiveness encompassed by existing definitions of biological diversity, an effective monitoring design will reflect the desired sampling domain of interest and its key stressors, available funding, legal requirements, and organizational goals.
Key words: definitions of biological diversity, methodological considerations, indicators, an- alytical tools, sampling designs, structure-composition-function framework, Pacific Northwest
Ecological monitoring encompasses the as- sessment across time and space of biological communities and the systems in which they oc- cur. Typically, such monitoring focuses on tracking one or more aspects of biological di- versity through time, primarily to assess whether persistent change is occurring. The impetus for monitoring of biological diversity looms now as urgently as ever, given the accel- erated rates of habitat loss and degradation oc- curring globally. Monitoring primarily in- volves either detecting difference~ in the value of one or more ecosystem components across an area at a given moment (status) or, more commonly, detecting changes in values over time (trend) at a given location or within a do- main of interest. UItimately, however, monitor- ing results may serve numerous other func- tions (Noon and others 1999; Niemi and Mc- Donald 2004). For exampIe, targeted monitor- ing can provide information on whether environmental standards (for example, federal Northwest Forest Plan, Endangered Species
Act, National Forest Monitoring Act, National Environmental Policy Act, Clean Water Act) are being met and in some cases may identify ac- tions for remediation. Monitoring results can also provide an earIy-warning system of eco- logical change, before unacceptable environ- mental losses occur, and provide data to fore- cast future changes in the environment. Fur- thermore, monitoring is essential for facilitat- ing adaptive management (Holling 1978), in which management actions such as particular timber-harvest strategies or creation of wilder- ness are viewed as ecological experiments in an iterative process of corrective improvements. Monitoring can provide the data upon which such iterations rely.
Monitoring has been subdivided (Mulder and Palmer 1999) into implementation moni- toring (namely, evaluation of compliance with standards and guidelines), validation monitor- ing (which establishes the link between those standards and guidelines [the cause] and ob- served trends [effect]), and effectiveness mon- itoring, which establishes status or trends for
Present address: NPS Great Lakes Network, 2800 Lake particular aspects of biological diversity under Shore Drive East, Ashland, Wisconsin 54806. a particular conservation strategy or manage-
ment action. Unfortunately, these types of mon- itoring are infrequently performed currently; I thus focus on trend monitoring in a general sense.
Why monitor biodiversity in the 1st place? Striving to monitor biological diversity rather than simply 1 or 2 charismatic ecosystem com- ponents acknowlkdges the multi-scale nature and complexity of ecosystems and envisions a proactive rather than reactive approach to spe- cies conservation, likely a more effective and cost-efficient approach in the long run (Scott and others 1995). Furthermore, monitoring bio- diversity seems more likely than other ap- proaches to simultaneously track health and function of ecosystems as well as the capacity to promote human well-being.
Herein, I examine alternative definitions of biological diversity and alternative strategies for monitoring. I also review analytical and methodological tools that are used to monitor biological diversity and advocate a unifying framework for monitoring ecosystems at vari- ous levels of biological organization. Further, I outline the limitations and challenges of bio- diversity monitoring, as well as common defi- ciencies of past monitoring. This review of monitoring issues will have value for individ- uals who are designing, administrating, and especially those who are implementing biodi- versity monitoring.
Noon and colleagues (Noon and others 1999; Noon 2003) identified a 7-step process for de- signing a monitoring program. These steps in- cluded: 1) clearly articulating program goals and objectives; 2) identifying the barriers to achieving management goals, which are usu- ally stressors and disturbances; 3) developing a heuristic model that summarizes the mecha- nisms of stressor effects on indicators and all inter-relationships; 4) selecting indicators that will detect stressors acting on ecosystem com- ponents; 5) setting detection limits for indica- tors, which will in turn prescribe the experi- mental design of the monitoring program; 6) determining the indicator values at which man- agement intervenes; and 7) ensuring through- out the process that a linkage to decision-mak- ing is retained lest the program be marginal- ized. Clearly, the program design should reflect available funding, the natural resources pres- ent, dominant disturbances and ecological pro- cesses, size of the sampling domain, and the
management philosophy, as well as legal, so- cial, and economic contexts (Salafsky and oth- ers 2002; Parrish and others 2003; Green and others 2005). To achieve long-term success in monitoring programs, it is essential to include cooperators and partners in the setting of mon- itoring objectives.
STRATEGIES FOR MONITORING BIOLOGICAL DIVERSITY
' These general issues of designing monitor- ing programs apply specifically to the moni- toring of biological diversity through the artic- ulation of biodiversity goals during the 1st of Noon's (2003) 7 steps of design of a monitoring program. However, creating an operational def- inition of biodiversity has often proven difficult in practice (Salafsky and others 1999), and bio- diversity targets for monitoring are not straightforward. An essential prerequisite of the goal-setting process involves clearly defin- ing the domain of inference, both spatially and temporally. Once this is chosen, it is critically important to understand scales of variability in monitoring targets to determine meaningful values.
Noss (1990), in an article that used monitor- ing of public lands in the Pacific Northwest as a central theme, suggested that monitoring in- dicators should a) be sufficiently sensitive to disturbance to provide an early-warning sig- nal, b) allow differentiation between natural cyclicity and human-caused effects, c) be rele- vant to ecologically significant phenomena, d) provide assessment over a broad range of stress (levels), e) be broadly distributed or widely ap- plicable, f) be feasible to monitor by agency staff, and g) be useful independent of sample size.
At the most fundamental level, there are sev- eral alternative ways to structure a monitoring program for biodiversity. Given that monitor- ing resources are limited, various authors in the conservation literature have debated the question of which taxa to track (Table 1). Alter- natively, monitoring may focus on habitat (for example, cover of specific types, spatial pattern, metrics of "quality"), particular geographic lo- cations, or ecosystem structure and function, all of which have direct or indirect bearing on species (Table 2). Again, selection of compo- nents to monitor should relate closely to the overall goals of monitoring. Given that con-
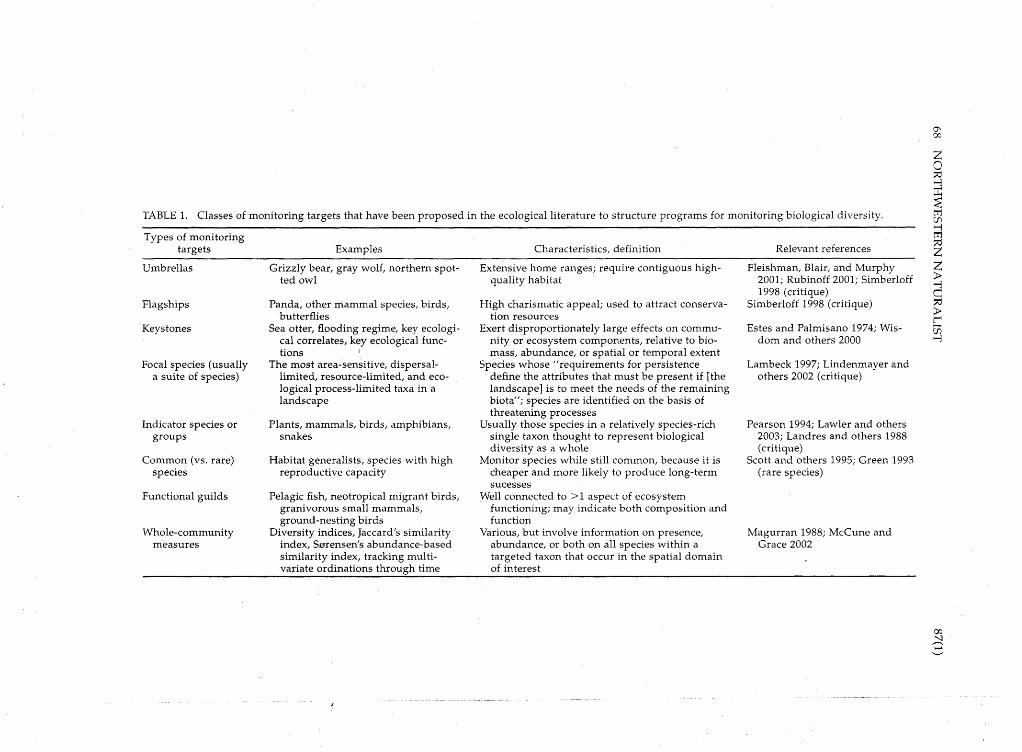
TABLE 1. Classes of monitoring targets that have been proposed in the ecological literature to structure programs for monitoring biological diversity.
Types of monitoring targets Examples Characteristics, definition Relevant references
- Umbrellas
Flagships
Keys tones
Focal species (usually a suite of species)
Indicator species or groups
Common (vs. rare) species
Functional guilds
Whole-community measures
- - -- - Grizzly bear, gray wolf, northern spot-
ted owl
Panda, other mammal species, birds, butterflies
Sea otter, flooding regime, key ecologi- cal correlates, key ecological func- tions I
The most area-sensitive, dispersal- limited, resource-limited, and eco- logical process-limited taxa in a landscape
Plants, mammals, birds, amphibians, snakes
Habitat generalists, species with high reproductive capacity
Pelagic fish, neotropical migrant birds, granivorous small mammals, ground-nesting birds
Diversity indices, Jaccard's similarity index, Sarensen's abundance-based similarity index, tracking multi- variate ordinations through time
Extensive home ranges; require contiguous high- quality habitat
High charismatic appeal; used to attract conserva- tion resources
Exert disproportionately large effects on commu- nity or ecosystem components, relative to bio- mass, abundance, or spatial or temporal extent
Species whose "requirements for persistence define the attributes that must be present if [the landscape] is to meet the needs of the remaining biota"; species are identified on the basis of threatening processes
Usually those species in a relatively species-rich single taxon thought to represent biological diversity as a whole
Monitor species while still common, because it is cheaper and more likely to produce long-term sucesses
Well connected to >1 aspect of ecosystem functioning; may indicate both composition and function
Various, but involve information on presence, abundance, or both on all species within a targeted taxon that occur in the spatial domain of interest
Fleishman, Blair, and Murphy 2001; Rubinoff 2001; Simberloff 1998 (critique)
Simberloff 1998 (critique)
Estes and Palmisano 1974; Wis- dom and others 2000
Lambeck 1997; Lindenmayer and others 2002 (critique)
Pearson 1994; Lawler and others 2003; Landres and others 1988 (critique)
Scott and others 1995; Green 1993 (rare species)
Magurran 1988; McCune and Grace 2002

TABLE 2. Examples of types of monitoring foci and sampling designs that will more commonly be appro- priate for each focus.
Monitoring focus Sampling design(s)
Areas of high risk of degradation or Cluster sampling; two-stage cluster sampling disturbance
Areas with potential for recoverya Nonrandom, targeted sampling (perhaps at small scales) Specific disturbances or management Replication within each treatment or across treatment levels
actions, to determine their impacts Status and trend of all areas Simple random sampling; systematic sampling "Effort (spatial and taxonomic) Geographic Information Systems (GIs)-based algorithms (for
example, buffers, density of studies within spatial subunits, biogeographic analyses)
Status and trend of all "ubiquitous" Stratified sampling (for example, stratified systematic sam- habitat types pling)
a This strategy can assume a triage metaphor for prioritizing monitoring effort, striving to get the biggest "bang" for each monitoring "buck". An effort-gap analysis analyzes which taxa have been most intensively studied in different portions of an ecoregion or within a political or
administrative boundary.
straints on programs that monitor biological diversity are not consistent across ecosystems, funding levels, expertise of data collectors, in- stitutions, or grains and extents of measure- ment, iterative and progressively refined mon- itoring strategies (adaptive monitoring) repre- sents an overarching approach that may ad- dress many potential shortcomings of a particular monitoring effort. It simultaneously allows learning from past monitoring, incor- poration of new instruments or methods (es- pecially when results are comparable with those of past monitoring), and focusing efforts on ecosystem components that provide the most information per monitoring dollar.
A variety of surrogate-species approaches have been proposed for multi-species or bio- diversity monitoring. Conservation of umbrella species (Roberge and Angelstam 2004; Table 1) presumes incidental protection of other species that utilize similar habitats. Scott and others (1995) argued that common species may be bet- ter targets for monitoring, given that they pro- vide inference about a greater proportion of the landscape. Common species likely will allow for more powerful statistical tests (given their larger sample sizes) and provide an earlier warning of ecosystem change, before reactive, emergency conservation efforts become pro- hibitively expensive. In contrast, monitoring ef- forts might focus on the most vulnerable spe- cies within a system because these may be most sensitive to change. These may be rare species or those with known declines. Rabinowitz and others (1986) delineated 8 forms of rarity (of which 7 had real-world examples), including
narrow habitat specialists, endemics, species with large body size and large home ranges, and species occupying upper trophic levels. Any of these types of vulnerable elements may be appropriate monitoring variables; however, incorporation of rare ecosystem components should be weighed strongly against their lower sample sizes and, consequently, their limited ability to provide high confidence in results. More generally, numerous authors (for exam- ple, Simberloff 1998; Lindenmayer and others 2002) have commented on the limitations and constraints of using any of these concepts ex- clusively in a monitoring program. Taken col- lectively, these critiques seem to suggest that unfortunately, no single monitoring target will provide information to comprehensively assess ecosystem condition. Rather, employing a suite of targets is more likely to empower informed decision-making in managing for biological di- versity. Functional guilds and specialized types of keystones likely hold the most promise for providing the greatest amount of informa- tion about ecological integrity or biodiversity per monitoring dollar.
A 2nd overall strategy involves monitoring habitats or systems, rather than the species themselves. Table 2 provides examples of sam- pling designs relative to monitoring foci. Ad- ditionally, in an era of scant available resources for natural-resource work, habitat assessments now often involve the use of aerial photogra- phy and other remote sensing repeated through time (such as MODIS, Landsat, SPOT, ICONOS, and LIDAR in order of increasingly fine resolution). This approach is predicated on
70 NORTHWESTERN NATURALIST
the assumptions that organisms are intimately tied to the habitats they occupy and that organ- isms will respond to changes over time in the amount, distribution, and fragmentation of the habitats they inhabit. This landscape-ecology approach may involve investigation of fractal geometry, patch dynamics, biogeographic hy- potheses, and landscape metrics such as vari- ables generated by the FRAGSTATS program (McGarigal and Marks 1995). Especially given the large number of variables produced by FRAGSTATS, numerous authors have suggest- ed the need for a prior understanding of which variables are biologically relevant. In general, this approach will work most consistently for habitat-obligate species and poorest for habitat generalists with large dispersal capabilities. However, examples abound of species whose habitat requirements continue to be refined to finer-scale understanding with further re- search; habitat-based monitoring of these spe- cies will accordingly have to be adaptive. Fur- thermore, time lags in losses or long-term sig- natures of past disturbances may complicate interpretations of species-habitat relationships.
In monitoring programs guided by a stress- or-based heuristic model (in which all change in an indicator is caused by one or more stress- ors), simultaneous monitoring of potential stressors on biodiversity components of inter- est is essential. Metrics of stressors that have been used or proposed for monitoring include human population density (or size), visitor user-days (McKinney 2001), total human ener- gy use (Ehrlich 1994), road density (in km/ km2) (Wisdom and others 2000)' traffic volume (Clevenger and others 2001), distribution of ex- otic species (either plant, animal, or microor- ganisms), and climatic or abiotic variables such as air and water quality, temperature, and pre- cipitation. In any given program, monitoring of these stressors may already be underway by other agencies or groups, thus facilitating po- tentially inexpensive incorporation of the data into a monitoring framework. However, their inclusion should follow clearly from the pre- planned heuristic model.
If a particular taxon or process receives a great deal of monitoring resources, modeling efforts that integrate multiple data types may be appropriate. Broadly speaking, the process involves variable selection, model-building, prediction, and model validation and verifica-
tion (Marcot 2006). Barnosky and others (2001) used such an approach to model richness of ter- restrial vertebrates in North and South Amer- ica and used latitude, habitat heterogeneity, a surrogate for productivity, geographic context, history of the lineage, and the history of the en- vironment to describe patterns. Similarly, Fleishman, MacNally, and others (2002) mod- eled presence-absence of butterflies in eleva- tional bands within mountain ranges of the central Great Basin using aspect, elevation, slope, annual precipitation, solar insolation, to- pographic exposure, and distance to water to predict distributions of species. In an exami- nation of less taxonomic breadth, Mladenoff and others (1995) modeled the number of wolves in the northeastern United States as a function of road density and prey density, after screening a larger array of variables initially. In a monitoring context, data from subsequent sampling periods can be used to validate and verify the existing model-essentially, testing whether the same factors are modulating the status in a monitoring indicator over time.
Finally, co-locating monitoring locations with sites of existing monitoring networks can multiply the information gained per unit in- vested in monitoring. Examples of existing programs include the US Environmental Pro- tection Agency's Environmental Monitoring and Assessment Program, the US National Park Service's Inventory and Monitoring pro- gram, Natural Resource Conservation Service's STATSGO digital soil survey, Breeding Bird Surveys, and the Forest Inventory and Analysis network and system of Current Forest Vegeta- tion Survey plots of the US Forest Service. Fur- thermore, federal governments in Australia (www.csiro.au/sciro/envind/index.html), Eu- rope (www.mpci.org), and the United States and Canada (Environment Canada and US EPA 2003) are developing programs for routine re- porting on ecological indicators.
When considering all strategies collectively, Pullin and Knight (2001) found that most con- servation practitioners relied largely on anec- dotal evidence, fashion, and gut feelings to se- lect which tools and strategies to use. In an adaptive management context, Salafsky and others (2002) suggested that practitioners in- stead use information-sharing networks (both formal and informal) to communicate the con-
ditions under which each tool or strategy works greater incorporation of monitoring of ecosys- and does not work. tem services (for example, Hector and others
2001; Green and others 2005), rather than solely A using the approaches in Table 1. Although eco- B1ODIVERSIT~ IN ECOSYSTEMS: STRUCTURE, system function appears more difficult to mea-
COMPOSITION, AND FUNCTION sure, greater reliance on its incorporation Communities and ecosystems are composed
of interactions among organisms and between organisms and the abiotic environment at lev- els of biological organization ranging from subcellular to ecosystem-wide. Franklin and others (1981) 1st proposed a tripartite model for succinctly describing the character of biotic systems, composed of the elements of struc- ture, composition, and function. Whereas com- position reflects the identity, variety, and rela- tive abundance of elements in a collection (from genetic to landscape diversity), structure denotes the physical organization and pattern of a system (from genetic structure to land- scape pattern). Noss (1990) applied this model to monitoring biological diversity and provid- ed examples of each element at each of 4 levels of biological organization. There are 3 salient features of his heuristic framework that are es-
seems warranted for 2 reasons. First, a recent review by Schwartz and others (2000) found that beyond a low proportion of local species richness (usually the dominant species), great- er richness typically does not increase ecosys- tem stability. Second, managing landscapes of the US Pacific Northwest for spotted owls, mar- bled murrelets, and fishes failed to achieve bio- diversity objectives for 300 other rare taxa that are also closely associated with old-forest con- ditions (USDA and USDI 2004). A particularly intriguing and appealing example of a broad- scale quantitative indicator has been proposed by Meyerson and others (2005), who advocated for the creation and monitoring of an aggregate measure of ecosystem services that is suffi- ciently flexible to represent all ecosystems of North America. Although many details of such a measure remain unresolved, they proposed
pecially applicable for monitoring biological that monitoring of such a measure, especially diversity. First, monitoring is designed to oc- when implemented with monitoring designs cur at hierarchically nested scales of biological that are scaleable, comparable, and statistically organization, such that inferences can be made defensible, could provide an objective litmus at several spatial (and in some cases, temporal) test of the sustainability of areas across the con- scales. Examples of potential monitoring indi- cators at each level of biological organization for structure, composition, and function appear in Noss (1990) and Niemi and McDonald (2004), among other references. Second, design of field-sampling strategies matches the ques- tions of interest (Noss 1990). Furthermore, fo- cusing particularly on monitoring biological diversity on public lands in the Pacific North- west, Noss (1990) advocated that monitoring also integrate the surrounding landscape and that uncertainty be made explicit.
A 3rd and final feature of the framework is that it encompasses not only composition of ecosystem elements but also aspects of ecosys- tem structure and function (ecosystem servic- es). Composition, structure, and function col- lectively serve as a concise yet effective frame- work for ecosystem conservation, because they affect a site's potential for restoration, resis- tance and resilience to disturbance, and ability
tinent.
TOOLS FOR MONITORING BIOLOGICAL DIVERSITY
Given that monitoring biological diversity inherently involves multiple spatial scales and many taxa compared to single-species moni- toring, monitoring frameworks should seek to incorporate this complexity to the extent that resources allow. Biodiversity monitoring may thus incorporate attention to functional guilds, key ecological functions and environmental correlates (Marcot and others 1999), species richness, diversity indices, indices of biotic in- tegrity (for example, Karr 1991), or metrics of community composition (McCune 1992; Phi- lippi and others 1998; McCune and Grace 2002). Generally, it is preferable to use exten- sive rather than intensive sampling approaches (in other words, at many rather than only a few sites). In addition to using a greater proportion
to provide consumable goods and ecosystem of the sampling domain to evaluate the moni- services. Increasingly, ecologists are calling for tored component, extensive sampling also pro-
72 NORTHWESTERN NATURALIST
vides better precision in estimates of both sta- tus and trend, which in turn allows for more rapid detection of change. One should note, however, that re-visit designs under a fixed monitoring budget will differ when seeking to maximize understanding of status compared to understanding of trend. Salafsky and others (2002:1474) concluded "there is not one tool that will lead to conservation at all sites, or even at one site over time". A reserve-selection ap- proach used by Lawler and others (2003) aptly illustrated the need for plurality because con- servation of any single taxonomic indicator group (freshwater fish, birds, mammals, fresh- water mussels, reptiles, or amphibians) provid- ed protection for only 17 to 58% of all other at- risk species.
A variety of tools are available for the collec- tion and analysis of such complex data. Espe- cially for remote sampling locations, the use of automated data collectors can increase the ex- tent of data collection. Examples include tem- perature and relative humidity recorders, rain gauges, satellite telemetry radiocollars, other weather-related data recorders, and infrared- triggered cameras. Users of these technologies should plan for large amounts of data and have a clear idea initially of what will be analyzed and how. These technologies, although improv- ing, inherently involve the possibilities of equipment failure and missing data, which suggests the usefulness of "pilot" sampling of equipment being used for the 1st time. Fur- thermore, the strength of these data can be im- proved by their (at least occasional) incorpo- ration with other field-collected information.
In terms of interpreting monitoring data, time-series analysis is a technique likely to be appropriate for monitoring that occurs over time. Repeated-measures analysis of variance, in which the repeated measure is time, consti- tutes an ANOVA-based, alternative analytical framework. Whereas time-series analysis in- volves only 1 measure (either from a single lo- cation or an average across the domain) that is sampled many times (often 230 times are needed to quantify autocorrelation structures), repeated-measures analyses can accommodate spatial replication and can be used with short- er-duration data. The freeware program TRENDS (Gerrodette 1987,1993) is designed to calculate power to detect trends over time at 1 site. Although this program is appropriate if
simple linear regression is used to analyze data, it does not consider repeated measures, variances and covariances of the estimated an- nual parameter of interest, or variance com- ponents, all of which will influence power and should be accounted for after data have been collected for 10 to 30 y.
A variety of other analytical tools have re- cently received attention and use in the litera- ture on natural resource monitoring, and hold great promise for future monitoring and mod- eling studies (Marcot 2006). If abundance and presence of all species in a community are tracked through time, several techniques are available to analyze and help interpret any ob- served changes (McCune and Grace 2002). Af- ter 21 round of sampling is completed, sensi- tivity analyses allow investigators to ascertain how much variability in the values of a moni- toring target is produced by small (for exam- ple, 10%) changes in values of various predictor variables. These analyses allow illumination of which factors exert the strongest influence on values of the monitored indicator. Information- theoretic analyses and multi-model inference (Burnham and Anderson 2002) represent an ex- citing change in how biologists think about and test hypotheses regarding natural resources. Rather than trying to present sufficient evi- dence to reject a null hypothesis constructed in such a manner that the likelihood of its veracity is diminishingly small (a "silly null"), infor- mation-theoretic analyses instead compare the strength of evidence available to support a va- riety of previously constructed models of vary- ing complexity using criteria such as Akaike's Information Criterion (AIC), AIC corrected for small sample sizes, and Bayesian Information Criterion (Burnham and Anderson 2002). Mod- els reflect investigators' understanding of the biological system and are compared on the ba- sis of 2 criteria, collectively known as parsi- mony: fit of the data to the various models and preference for simpler models over more com- plex ones.
Bayesian statistics represent a very different analytical approach than that of traditional fre- quentist (typically, null-hypothesis-testing) statistics, and are enjoying increasing popular- ity among investigators of biological diversity. Namely, the test concerns the probability, given a certain prior set of information, of a certain event happening (for example, abundance of a

particular species averaging >10.5 individu- als /plot). Bayesian-belief-network modeling (Marcot and others 2001) is 1 use of a Bayesian approach. It involves explicit modeling of con- ditional probabilities of population response, given environmental conditions, and quantifies the process of incorporating "expert opinion" into a consistent, testable framework by which to represent simple habitat relations for many species. Finally, simulations (such as Monte Carlo simulations) and stochastic modeling are 2 tools that may assist not only in the analysis and interpretation of monitoring data, but also in sampling design of monitoring strategies. For many of these techniques, collaboration with an experienced statistician will likely prove fruitful.
If population size or even an index of popu- lation size is a monitoring target, it is critical to assess detectability of individuals so that counts or population estimates are unbiased (Mackenzie and others 2003). Furthermore, sampling effort must be documented and ac- counted for (Agresti 1994; McDonald and Har- ris 1999). For example, abundance estimates based on trapping records may be a function of the weather, market prices, and bag limits, rather than true population fluctuations (McDonald and Harris 1999). Mark-recapture methods (Huggins 1989) constitute 1 robust means of assessing population size. Briefly, all animals captured in the 1st capture session, which comprise an unknown percentage of the total population's individuals, are marked (with ear tags, PIT tags, dye, or other means) and released. Population size is estimated by comparing the number of marked versus un- marked animals captured in subsequent cap- ture sessions. Program MARK (White and Burnham 1999) is 1 current standard for ana- lyzing such data and allows for comparisons of models in which catchability varies across cap- ture sessions (for example, between nights 2 and 3 of a 4-d session), among individuals (rel- ative trap-shyness), and across seasons or years.
Distance sampling (Buckland and others 2001) (for example, on line transects or point transects) is another technique for estimating abundance in animals, in which the perpendic- ular distance from the sampling line is record- ed for the location where each animal is ini- tially detected. Program Distance (Thomas and
others 2004) has gained broad approval be- cause it is flexible and powerful enough to han- dle comparisons of models that test a variety of assumptions and hypotheses. Other techniques include variable circular plots, which are statis- tically more robust than point counts (Kissling and Garton 2006), and paired-observer sam- pling (Nichols and others 2000).
If presence-absence data are of greater inter- est as a monitoring target, species incidence functions (Taylor 1991) provide a strong ana- lytical framework. Especially for species with spatially structured populations (such as meta- populations), patch-occupancy models (Lin- denmayer and Lacy 2002) may be appropriate. VORTEX (Lacy 1993; Miller and Lacy 1999), a Monte Carlo simulation of the effects of deter- ministic forces as well as demographic, envi- ronmental, and genetic stochastic events on persistence of wildlife populations, is 1 avail- able conservation-oriented analytical tool. It is worth noting that in presence-absence surveys, absence is inherently harder to demonstrate than presence, especially for species with low detectability. For example, K6ry (2002) found that up to 30 visits were necessary to assert the absence of a particular snake species with 95% confidence.
If species' spatial distributions are of pri- mary interest, resource-selection functions (Manly and others 2002) are a powerful tool. Although a diversity of tests are possible, the most common approach involves comparing the characteristics of used locations (usually obtained from radiocollared animals) with characteristics of a similar number of available locations within the domain of interest. Logis- tic regression is then used in combination with model-selection techniques to illuminate the factors that are apparently driving habitat use. In brief, the technique involves Geographic In- formation Systems (GIs) analyses and remotely sensed data, and the probability of use of a giv- en GIs pixel is a function of the characteristics of that pixel. In terms of monitoring, resource- selection functions can allow practitioners to examine how factors that determine or corre- late with habitat use vary across seasons or years, as well as to compare how various spa- tially explicit disturbances (for example, loca- tions of a timber harvest) may affect animal species of concern.

74 NORTHWESTERN NATURALIST
In designing monitoring programs and in- terpreting resulting information, it is worth re- membering what monitoring, by itself, cannot do. Although monitoring of one or more stress- ors simultaneously with the ecosystem com- ponent(~) of interest can demonstrate a corre- lation of values of the component with one or more putative causes of change, monitoring cannot unambiguously determine the cause of change-concurrent or follow-up experiments are necessary to conclusively demonstrate cause-effect relationships. This is because other unmeasured variables may be the cause of any differences observed, rather than the putative treatment. Nonetheless, the influence of other measured variables suspected to be important can be quantified through such tests as analysis of covariance, multiple linear regression, or joint plots. Furthermore, some investigators (for example, Swihart and Slade 2004) have be- gun to employ in observational studies site-se- Iection algorithms in GIS that explicitly span the range of values existing within the domain for their variables of interest (for example, stressors or drivers) to analyze their effects.
Furthermore, deciding how much change is acceptable (in other words, whether the ob- served change falls within the range of accept- able variation) and deciding on threshold val- ues of an indicator that will trigger a manage- ment response are management or policy de- cisions, rather than an intrinsic aspect of monitoring (Noon and others 1999). Monitor- ing cannot prevent practitioners from conclud- ing that a trend has occurred when in fact it has not (a Type I error); this will instead reflect the chosen alpha and the statistical power of the test used to establish trend. Finally, although ecosystem attributes are often chosen to be monitored on the presumption that they can in- dicate trends in a larger suite of ecosystem components, Landres (1992) argued that mon- itoring will not allow practitioners to draw spe- cific inferences about the status of unmonitored species from the status of monitored species. The degree to which trends in monitored spe- cies will correlate with trends in other species is uncertain and undoubtedly will vary tre- mendously.
In addition to these inherent limitations, there are several deficiencies that have most
commonly plagued monitoring programs im- plemented in the past. Noon (2003) suggested that programs had minimal foundation in eco- logical theory or empiricism, used little logic in selecting condition indicators, had no clear linkage to a cause-effect interpretation of the monitoring signal, did not identify critical in- dicator values that would trigger a manage- ment response, and had no connection between monitoring results and the decision-making process.
THEORETICAL AND PRACTICAL CHALLENGES ASSOCIATED WITH MONITORING
There are 2 5 prominent theoretical challeng- es to the development and implementation of a program to monitor biological diversity. For each challenge, I propose one or more design or analytical solution(s) that may be used to ad- dress the problem, or at least ameliorate its ef- fects. The most universal challenge to monitor- ing programs is that science has an incomplete understanding of ecosystems. Given the exis- tence of nonlinear dynamics, thresholds and multiple steady states, and numerous interact- ing stressors, the task of extracting meaningful conclusions from monitoring results seems .
daunting, especially when the overall goal is something as encompassing as biological di- versity. One solution is to use the iterative pro- cess of adaptive management, which has been defined as "the integration of design, manage- ment, and monitoring to systematically test as- sumptions in order to adapt and learn" (Sal- afsky and others 2002:1471). Furthermore, in view of our generally rudimentary understand- ing of many aspects of ecological systems, a posture of humility may serve investigators well. For example, explicitly considering the ef- fects of covariates as alternative hypotheses (advocated by Noss 1990) often can be very il- luminating.
A 2nd challenge involves trying to separate noise from signal in a target indicator. Sources of noise are numerous and include observer bias, endogenous variability and cyclicity, and small methodological differences. Careful se- lection of a research or monitoring design ap- propriate for the particular ecosystem compo- nent and use of sufficient replication may ad- dress this challenge.
Another challenge, often unacknowledged, is that there is great uncertainty in ecosystem re-

sponses. As with the 1st challenge, adaptive monitoring can address this 3rd challenge by it- eratively improving the utility of the monitor- ing program as new information is learned. Replication and explicit communication of con- fidence intervals also can address this issue of uncertainty. A particularly challenging prob- lem for monitoring programs is that the amount of variability in a given indicator is un- known, making it difficult to perform prior power (Thomas and Krebs 1997) or simulation analyses (Eng 2004) that can prescribe suffi- cient sample sizes to detect a given percentage change with a particular level of confidence. This problem can be overcome by either car- rying out a pilot monitoring project within the domain of inference, by using values from a closely related species or ecosystem attribute, or by bounding expected variability in order to suggest minimum and maximum sample sizes needed.
A 4th challenge is selecting a desired end- point (or range of values) for monitoring, given that all ecosystems have been affected by an- thropogenic influences. The concepts of histor- ical range of variability (Morgan and others 1994), trigger points, acceptable range of vari- ability (Parrish and others 2003), and relatively undisturbed "benchmark" (control) areas have all been proposed as avenues to establish de- sired states (or ranges of states). Although dif- ficult to ascertain in some systems, historical variability for certain questions has been estab- lished using tree rings, packrat (Neofoma sp.) middens, and dated lake-sediment or soil cores.
A final theoretical challenge is whether and how to weight "special" species or communi- ties or habitats. For example, are naturalized species included in calculations of diversity and species richness? What about exotic, mi- gratory, and pelagic species? Do threatened and endangered species inherently merit great- er "value"? Although such decisions are often made politically rather than ecologically, this challenge can be addressed through an explicit goal-setting process that includes prioritization of various aspects of biological diversity. Fur- thermore, for a quantitative approach to the ecological importance of individual species, in- dicator species analysis (DufrGne and Legendre 1997) can supplement the test of no communi- ty-wide difference between groups of sites
with a description of how well each species dis- tinguishes the groups based on how faithful and exclusive a species is to that group.
Although volumes could be written on the practical challenges to monitoring biological diversity, there are 5 that are likely to most commonly pose serious problems for monitor- ing programs. First, given the potentially broad scope of biological diversity, the limited time, personnel, and money available for mon- itoring mean that only highest-priority indica- tors can be monitored. Other than prioritiza- tion, linkages to other efforts can multiply the return on per-unit investment in monitoring. Second, changes in leadership or data collec- tors also pose a challenge, because they com- prise a potentially large source of bias or con- founding of results. Use of accepted, standard methods for data collection holds greatest promise for overcoming this challenge, al- though linkages to other monitoring institu- tions and creation of an appropriate infrastruc- ture may also assist in this regard. Monitoring projects must provide enough detail of their methods somewhere so that future investiga- tors can emulate the work. This can be tested by giving a monitoring report or publication to a colleague and seeing whether the difference between their results and the original results are greater than those expected by variability in weather and other such variable factors. Third, requirements imposed by higher levels of regulation or management may promulgate an atmosphere of crisis management or make goals more diffuse. Fourth, because funding sources for monitoring are uncertain and often variable through time, budget cuts that restrict implementation and inhibit continuity across years often result. To overcome this challenge, practitioners can establish early a commitment to monitoring as a high priority. Furthermore, once the core objectives of a multi-faceted mon- itoring program have been achieved in a given year, creation of a list of other projects (espe- cially for short-term questions or slowly chang- ing indicators) can help prioritize which pro- jects are added during well-funded years. Fifth, missing data and variable data quality can compromise the value of monitoring ef- forts; however, greater replication may amelio- rate effects of inaccurate data, if errors are not systematic (that is, data are not biased). A sta- tistically-driven quality-control process can

76 NORTHWESTERN NATURALIST 87(1)
also help to minimize the effect of poor data ed from practical monitoring experiences with the
quality. Klamath, Mojave, and Great Lakes networks of the
A final difficulty for programs designed to US National Park Service. Discussions with D Hugh-
monitor biological diversity is both a theoreti- son, D Sarr, and D Odion were particularly helpful- D Odion and 2 anonymous reviewers critiqued an
cal and practical challenge and stems from the earlier draft.
very 1st step in Noon's (2003) proposed ap- proach to monitoring. Namely, it is critical to LITERATURE CITED define what biological diversity really encom- passes. Tens to hundreds of definitions of bio- logical diversity have been proposed, including simply the number of different species in a giv- en location (Schwartz and others 1976), "all of the diversity and variability in nature" (Spel- lerberg and Hardes 1992), and ". . .the variety of living organisms, the genetic differences among them, the communities and ecosystems in which they occur, and the ecological and evolutionary processes that keep them func- tioning, yet ever changing and adapting" (Noss and Cooperrider 1994). Definitions vary in nu- merous ways, including a) how many levels of biological organization they include; b) wheth- er diversity is described as richness, evenness, variety, or a composite metric thereof; and c) whether diversity encompasses only composi- tion or whether ecosystem structure, function, and abiotic properties are also included. Work- shops throughout the Pacific Northwest in sup- port of the US Forest Service's Biodiversity Ini- tiative confirmed that defining biodiversity constitutes a major hurdle for collaboration and progress toward conservation (White and Molina 2006). Both that article and Olson (2006) discuss definitions of biodiversity further. Even after an operational definition is selected, sev- eral accompanying questions must be an- swered. Using species as an example, if persis- tence of viable populations is a goal, for how many years, with what probability, and at what population size is persistence sought (Scott and others 1995)? Questions such as these are ad- mittedly determined as much or more through policy-related rather than biological decisions and may often be quantified or revised as a pro- gram matures. Without an explicit definition and decisions on accompanying questions, monitoring biological diversity can simply mean monitoring everything-an overwhelm- ing task.
Although all of the errors that remain in the text can be ascribed only to the author, the work benefit-
AGRESTI A. 1994. Simple capture-recapture models permitting unequal catchability and variable sampling effort. Biornetrics 50:494-500.
BARNOSKY AD, HADLY EA, MAURER BA, CHRISTIE MI. 2001. Temperate terrestrial vertebrate faunas in North and South America: interplay of ecology, evolution, and geography with biodiversity. Con- servation Biology 15:658-674.
BUCKLAND ST, ANDERSON DR, BURNHAM KP, LAAKE JL, BORCHERS DL, THOMAS L. 2001. Introduction to distance sampling. Oxford, England: Oxford University Press. 432 p.
BURNHAM KP, ANDERSON DR. 2002. Model selection and inference: a practical information-theoretic approach. 2nd ed. New York, NY: Springer-Ver- lag. 353 p.
CLEVENGER AP, CHRUSZCZ B, GUNSON K. 2001. Drainage culverts as habitat linkages and factors affecting passage by mammals. Journal of Ap- plied Ecology 38:1340-1349.
DUFRBNE M, LEGENDRE P. 1997. Species assemblages and indicator species: the need for a flexible asymmetrical approach. Ecological Monographs 67:345-366.
EHRLICH PR. 1994. Energy use and biodiversity loss. Philosophical Transactions of the Royal Society of London 344:99-104.
ENG J. 2004. Sample size estimation: a glimpse be- yond simple formulas. Radiology 230:606-612.
ENVIRONMENT CANADA AND US EPA. 2003. State of the Great Lakes 2003. Burlington, ON: Environment Canada, Chicago, IL: Environmental Protection Agency. EPA 905-R-03-004. 102 p. Available at: http: / / www .epa.gov/glnpo/solec/solec-2002/ State-of-the-Great-Lakes-2003Summary-Report. vdf.
ESTES J, PALMISANO J. 1974. Sea otters: their role in structuring nearshore communities. Science 185: 1058-1060.
FLEISHMAN E, BLAIR RB, MURPHY DD. 2001. Empir- ical validation of a method for umbrella species selection. EcologicaI Applications 11 :1489-1501.
FLEISHMAN E, MACNALLY R, FAY JP, MURPHY DD. 2001. Modeling and predicting species occur- rence using broad-scale environmental variables: an example with butterflies of the Great Basin. Conservation Biology 15:1674-1685.
FRANKLIN JF, CROMACK K, DENISON W, MCKEE A, MASER C, SWANSON F, JUDAY G. 1981. Ecological characteristics of old-growth Douglas-fir forests.
Portland, OR: USDA Forest Service, Pacific North- west Research Station. General Technical Report PNW-118. 48 p.
GERRODETTE, T. 1987. A power analysis for detecting trends. Ecology 68:1364-1372.
GERRODETTE, T. 1993. Trends: software for a power analysis of linear regression. Wildlife Society Bul- letin 21:515-516.
GREEN RE, BALMFORD A, CRANE PR, MACE GM, REYNOLDS JD, TURNER RK. 2005. A framework for improved monitoring of biodiversity: responses to the world summit on sustainable development. Conservation Biology 19:56-65-
GREEN RH. 1993. Sampling to detect rare species. Ecological Applications 3:351-356.
HECTOR A, JOSHI J, LAWLER SP, SPEHN EM, WILBY A. 2001. Conservation implications of the link be- tween biodiversity and ecosystem functioning. Oecologia 129:624-628.
HOLLING CS. 1978. Adaptive environmental assess- ment and management. New York, NY: John Wi- ley and Sons. 337 p.
HUGGINS RM. 1989. On the statistical analysis of cap- ture-recapture experiments. Biometrika 76:133- 140.
KARR JR. 1991. Biological integrity: a long-neglected aspect of water resource management. Ecological Applications 1 :66-84.
K ~ R Y M. 2002. Inferring the absence of a species-a case study of snakes. Journal of Wildlife Manage- ment 66:330-338.
KISSLING ML, GARTON EO. 2006. Estimating detec- tion probability and density from point count surveys: a combination of distance and double- observer sampling. Auk 123: in press.
LACY RC. 1993. VORTEX: a computer simulation model for population viability analysis. Wildlife Research 20:45-65.
LAMBECK RJ. 1997. Focal species: a multi-species um- brella for nature conservation. Conservation Bi- ology 11 2349-856.
LANDRES PB. 1992. Ecological indicators: panacea or liability? In: McKenzie DH, Hyatt DE, McDonalds VJ, editors. Ecological indicators. Vol. 2. London, England: Elsevier Applied Science. p 1295-1318.
LANDRES, PB, VERNER J, THOMAS JW. 1988. Ecological use of vertebrate indicator species: a critique. Conservation Biology 7:393-398.
LAWLER JL, WHITE D, SIFNEOS JC, MASTER LL. 2003. Rare species and the use of indicator groups for conservation planning. Conservation Biology 17: 875-882.
LINDENMAYER DB, LACY RC. 2002. Small mammals, habitat patches and PVA models: a field test of model predictive ability. Biological Conservation 103:247-265.
LINDENMAYER, DB, MANNING AD, SMITH PL, POS- SINGHAM HE FISCHER J, OLIVER I, MCCARTHY
MA. 2002. The focal-species approach and land- scape restoration: a critique. Conservation Biolo- gy 16:338-345.
MACKENZIE, DI, NICHOLS JD, HINES JE, KNUTSON MG, FRANKLIN AB. 2003. Estimating site occu- pancy, colonization, and local extinction when a species is detected imperfectly. Ecology 84:2200- 2207.
MAGURRAN AE. 1988. Ecological diversity and its measurement. Princeton University Press, Prince- ton, NJ. 179 p.
MANLY BFJ, MCDONALD LL, THOMAS DL. 2002. Re- source selection by animals: statistical design and analysis for field studies. 2nd ed. London, Eng- land: Chapman and Hall. 221 p.
MARCOT BG. 2006. Habitat modeling for biodiversity conservation. Northwestern Naturalist 87:56-65.
MARCOT, BG, CASTELLANO MA, CHRISTY JA, CROFT LK, LEHMKUHL JF, NANEY RH, NELSON K, NIWA CG, ROSENTRETER RE, SANDQUIST RE, WALES BC, ZIEROTH E. 1999. Terrestrial ecology assessment. In: Quigley TM, technical editor. The Interior Co- lumbia Basin ecosystem management project: sci- entific assessment. Portland, OR: USDA Forest Service, Pacific Northwest Research Station. Gen- eral Technical Report PNW-GTR-405. p 1497- 1713.
MARCOT BG, HOLTHAUSEN RS, RAPHAEL MG, Row- LAND M, WISDOM M. 2001. Using Bayesian belief networks to evaluate fish and wildlife population viability under land management alternatives from an environmental impact statement. Forest Ecology and Management 153:29-42.
MCCUNE B. 1992. Components of error in predictions of species compositional change. Journal of Veg- etation Science 3:27-34.
MCCUNE B, GRACE JB. 2002. Analysis of ecological communities. Gleneden Beach, OR: MjM Soft- ware Design. 300 p.
MCDONALD RA, HARRIS S. 1999. The use of trapping records to monitor populations of stoats Mustela erminea and weasels M. nivalis: the importance of trapping effort. Journal of Applied Ecology 36: 679-688.
MCGARIGAL K, MARKS BJ. 1995. FRAGSTATS: spatial pattern analysis program for quantifying land- scape structure. Portland, OR: USDA Forest Ser- vice, Pacific Northwest Research Station. General Technical Report PNW-351.141 p.
MCKINNEY ML. 2001. Role of human population size in raising bird and mammal threat among na- tions. Animal Conservation 4:45-57.
MEYERSON LA, BARON J, MELILLO JM, NAIMAN RJ, O'MALLEY RI, ORIANS G, PALMER MA, PFAFF ASP, RUNNING SW, SALA OE. 2005. Aggregate mea- sures of ecosystem services: can we take the pulse of nature? Frontiers in Ecology and Environment 3:56-59.
78 NORTHWESTERN NATURALIST
MILLER PS, LACY RC. 1999. VORTEX: a stochastic simulation of the extinction process. Version 8 user's manual. Apple Valley, MN: Conservation Breeding Specialist Group.
MLADENOFF DJ, SICKLEY TA, HAIGHT RG, WYDEVEN AP. 1995. A regional landscape analysis and pre- diction of favorable gray wolf habitat in the northern Great Lakes region. Conservation Biol- ogy 9:279-294.
MORGAN P, APLET GH, HAUFLER JB, HUMPHRIES HC, MOORE MM, WILSON WD. 1994. Historical range of variability: a useful tool for evaluating ecosys- tem change. Journal of Sustainable Forestry 2537- 111.
MULDER BS, PALMER CJ. 1999. Introduction to effec- tiveness monitoring. In: Mulder BS, Noon BR, Spies TA, Raphael MG, Palmer CJ, Olsen AR, Reeves GH, Welsh HH, technical coordinators. The strategy and design of the effectiveness mon- itoring program for the Northwest Forest Plan. Portland, OR: USDA Forest Service, Pacific North- west Research Station. General Technical Report PNW-GTR-437. p 1-20.
NICHOLS JD, HINES JE, SAUER JR, FALLON FW, FAL- LON JE, HEGLUND PJ. 2000. A double-observer ap- proach for estimating detection probability and abundance from point counts. Auk 117:393-408.
NIEMI GJ, MCDONALD ME. 2004. Application of eco- logical indicators. Annual Review of Ecological and Evolutionary Systems 35:89-111.
NOON BR. 2003. Conceptual issues in monitoring ecological resources. In: Busch DE, Trexler JC, ed- itors. Monitoring ecosystems: interdisciplinary approaches for evaluating ecoregional initiatives. Covelo, CA: Island Press. p 27-72.
NOON BR, SPIES TA, RAPHAEL MG. 1999. Conceptual basis for designing an effectiveness monitoring program. In: Mulder BS, Noon BR, Spies TA, Ra- phael MG, Palmer CJ, Olsen AR, Reeves GH, Welsh HH, technical coordinators. The strategy and design of the effectiveness monitoring pro- gram for the Northwest Forest Plan. Portland, OR: USDA Forest Service, Pacific Northwest Re- search Station. General Technical Report PNW- GTR-437. p 49-68.
NOSS RF. 1990. Indicators for monitoring biodiver- sity: a hierarchical approach. Conservation Biol- ogy 4:355-364.
NOSS RF, COOPERRIDER AY. 1994. Saving nature's leg- acy: protecting and restoring biodiversity. Cove- lo, CA: Island Press. 416 p.
OLSON DH. 2006. Biodiversity conservation-a place holder: introduction to papers in this issue. Northwestern Naturalist 87:l-9.
PARRISH JD, BRAUN DP, UNNASCH RS. 2003. Are we conserving what we say we are? Measuring eco- logical integrity within protected areas. Bio- Science 535351-860.
PEARSON DL. 1994. Selecting indicator taxa for the quantitative assessment of biodiversity. Philo- sophical Transactions of the Royal Society of Lon- don B 345:75-79.
PHILIPPI TE, DIXON PM, TAYLOR BE. 1998. Detecting trends in species composition. Ecological Appli- cations 8:300-308.
PULLIN AS, KNIGHT TM. 2001. Effectiveness in con- servation practice: pointers from medicine and public health. Conservation Biology 15:50-54.
RABINOWITZ D, CAIRNS S, DILLON T. 1986. Seven forms of rarity and their frequency in the flora of the British Isles. In: Soul6 ME, editor. Conserva- tion biology: the science of scarcity and diversity. Sunderland, MA: Sinauer Associates. p 182-204.
ROBERGE J-M, ANGELSTAM P. 2004. Usefulness of the umbrella species concept as a conservation tool. Conservation Biology 18:76-85.
RUBINOFF D. 2001. Evaluating the California gnat- catcher as an umbrella species for conservation of southern California coastal sage scrub. Conser- vation Biology 15:1374-1383.
SALAFSKY N, CORDES B, PARKS J, HOCHMAN C. 1999. Evaluating linkages between business, the envi- ronment, and local communities. Washington, DC: Biodiversity Support Program. 51 p.
SALAFSKY N, MARGOULIS R, REDFORD KH, ROBINSON JG. 2002. Improving the practice of conservation: a conceptual framework and research agenda for conservation science. Conservation Biology 16: 1469-1479.
SCHWARTZ CF, THOR EC, ELSNER GH. 1976. Wildland planning glossary. Berkeley, CA: USDA Forest Service, Pacific Southwest Forest and Range Ex- perimental Station. General Technical Report PSW-13. 252 p.
SCHWARTZ MW, BRIGHAM CA, HOEKSEMA JD, LYONS KG, MILLS MH, VAN MANTGEM PJ. 2000. Linking biodiversity to ecosystem function: implications for conservation ecology. Oecologia 122:297-305.
SCOTT JM, ABLES ED, EDWARDS TC JR., ENG RL, GAV- IN TA, HARRIS LD, HAUFLER JB, HEALY WM, KNOPF FL, TORGERSON 0, WEEKS HP JR. 1995. Conservation of biological diversity: perspectives and the future for the wildlife profession. The Wildlife Society committee report. Wildlife Soci- ety Bulletin 23:646-657.
SIMBERLOFF D. 1998. Flagships, umbrellas, and key- stones: is single-species management pass6 in the landscape era? Biological Conservation 83:247- 257.
SPELLERBERG IF, HARDES SR. 1992. Biological conser- vation, Cambridge, England: Cambridge Univer- sity Press. 123 p.
SWIHART RK, SLADE NA. 2004. Modeling interactions of private ownership and biological diversity: an architecture for landscapes with sharp edges. In: Swihart RK, Moore JE, editors. Conserving bio-

diversity in agricultural landscapes: model- based planning tools. West Lafayette, IN: Purdue University Press. p 3-21.
TAYLOR B. 1991. Investigating species incidence over habitat fragments of different areas-a look at er- ror estimation. Biological Journal of the Linnean Society 42:177-191.
THOMAS L, KREBS CJ. 1997. A review of statistical power analysis software. Bulletin of the Ecologi- cal Society of America 78:126-139.
THOMAS L, LAAKE, JL, STRINDBERG, S, MARQUES, FFC, BUCKLAND, ST, BORCHERS, DL, ANDERSON, DR, BURNHAM, KP, HEDLEY, SL, POLLARD, JH AND
BISHOP, JRB. 2004. Distance 4.1. Fife, Scotland: Research Unit for Wildlife Population Assess- ment, University of St. Andrews.
[USDA AND USDI] UNITED STATES DEPARTMENT OF
AGRICULTURE AND UNITED STATES DEPARTMENT OF INTERIOR. 2004. Record of decision to remove or modify the survey and manage mitigation measure standards and guidelines in Forest Ser-
vice and Bureau of Land Management planning documents within the range of the northern spot- ted owl. Portland, OR. Available at: http:// www.or.blm.gov /nwfpnepa /index.htrn. Accessed 30 August 2005.
WHITE GC, BURNHAM KP. 1999. Program MARK: Survival estimation from populations of marked animals. Bird Study 46 Supplement: 120-138.
WHITE R, MOLINA R. 2006. The Pacific Northwest Re- search Station biodiversity initiative: scoping out the challenges in managing for biodiversity. Northwestern Naturalist 87:10-17.
WISDOM MJ, HOLTHAUSEN RS, WALES BC, HARGIS CD, SAAB VA, LEE DC, HANN WJ, TICH TD, ROW- LAND MM, MURPHY WJ, EAMES MR. 2000. Source habitats for terrestrial vertebrates of focus in the interior Columbia basin: broad-scale trends and management implications. Portland, OR: USDA Forest Service, Pacific Northwest Research Sta- tion. General Technical Report PNW-GTR-485. 529 p.