monitoring and evaluation of government performance in...
TRANSCRIPT
Monitoring and Evaluation of Government Performance in Viet Nam
Jairo Acuña-AlfaroPolicy Advisor, Public Administration Reform and Anti-Corruption
UNDP Viet Nam – [email protected]: @acuna_jairo
Presentation prepared for Global Roundtable on Government Performance ManagementCabinet Secretariat, Government of IndiaNew Delhi, India, December 11-12, 2013
1
Contents
• The Context• Description of the main features of the
Government Performance Management in Vietnam = PAPI
• Impact of PAPI• Similarities and differences with Indian
approach• Lessons of experience

Context (i)• Socialist Republic of Viet Nam
• Population: c. 87.84 million• Labour Force: c. 55 million• State Employees: c. 5.2 million• Land area: 331,698 sq. km
• GDP per capita: 1,407 USD• Human Development Index (HDI): 0.617 (medium)• Poverty rate: 10.7%• Ethnic groups: 54 (Kinh c. 84%)
• Government Structure: Single Party Regime• Number of Provinces: 63 including five centrally managed
municipalities• Number of Ministries: 18 + specialized agencies
China
Lao PDR
Thailand
Cambodia
Context (ii)
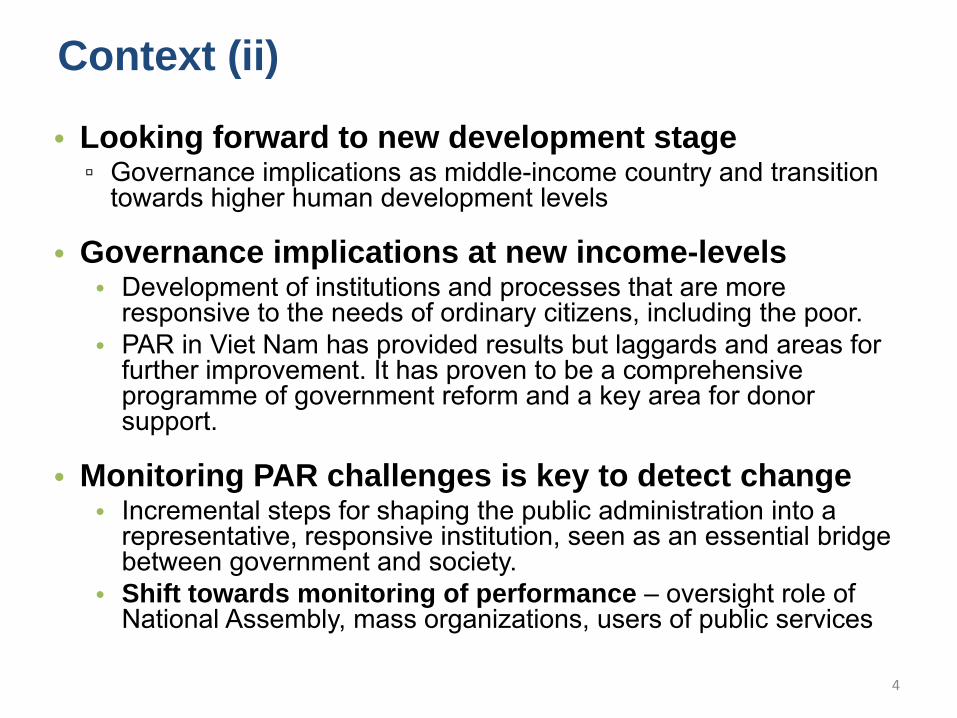
• Looking forward to new development stage▫ Governance implications as middle-income country and transition
towards higher human development levels
• Governance implications at new income-levels• Development of institutions and processes that are more
responsive to the needs of ordinary citizens, including the poor.• PAR in Viet Nam has provided results but laggards and areas for
further improvement. It has proven to be a comprehensive programme of government reform and a key area for donor support.
• Monitoring PAR challenges is key to detect change• Incremental steps for shaping the public administration into a
representative, responsive institution, seen as an essential bridge between government and society.
• Shift towards monitoring of performance – oversight role of National Assembly, mass organizations, users of public services
4

Contents
• The Context• Description of the main features of the
Government Performance Management in Viet Nam = PAPI
• Impact of PAPI• Similarities and differences with Indian
approach• Lessons of experience

What is PAPI?
• PAPI = Provincial Governance and Public Administration Performance Index
• A policy monitoring tool for middle-income Viet Nam
• The largest nationwide governance and public administrationsurvey in Viet Nam
• Second annual iteration – monitoring changes in government performance
• Voice of Vietnamese citizens about governance and public administration experiences
– Since 2010 more than 32,500 citizens surveyed
– In 2012 alone: 13,747 citizens
• A provider of evidence and data to policy makers and a complement to self-assessments and other surveys
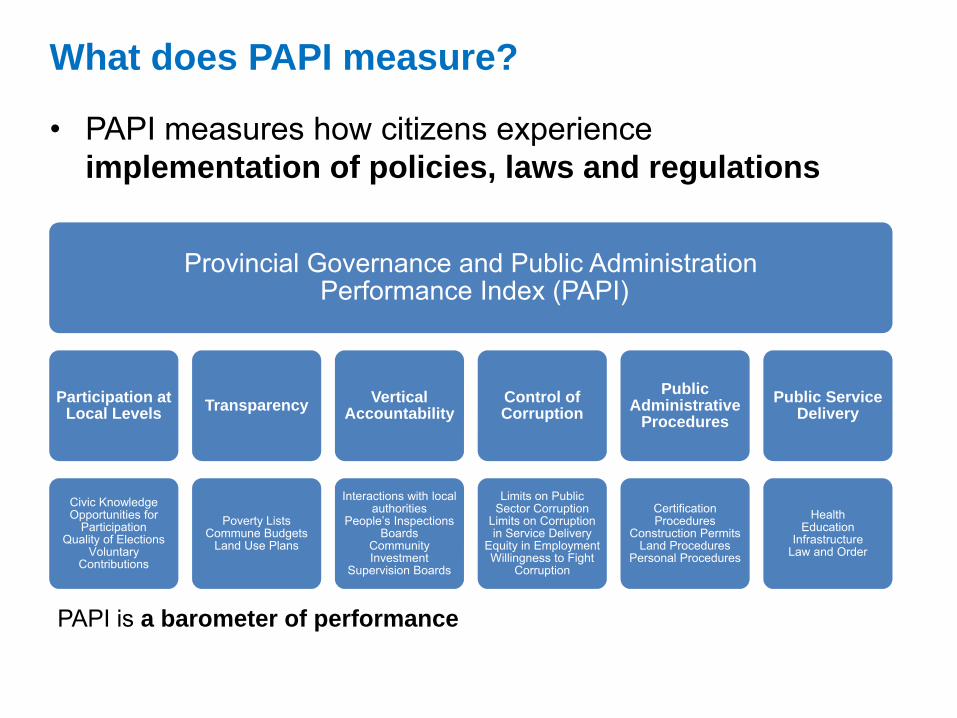
What does PAPI measure?
• PAPI measures how citizens experience implementation of policies, laws and regulations
Provincial Governance and Public AdministrationPerformance Index (PAPI)
Participation at Local Levels
Civic KnowledgeOpportunities for
ParticipationQuality of Elections
Voluntary Contributions
Transparency
Poverty ListsCommune Budgets
Land Use Plans
Vertical Accountability
Interactions with local authorities
People’s Inspections Boards
Community Investment
Supervision Boards
Control of Corruption
Limits on Public Sector Corruption
Limits on Corruption in Service Delivery
Equity in EmploymentWillingness to Fight
Corruption
Public Administrative
Procedures
Certification Procedures
Construction PermitsLand Procedures
Personal Procedures
Public Service Delivery
HealthEducation
InfrastructureLaw and Order
PAPI is a barometer of performance
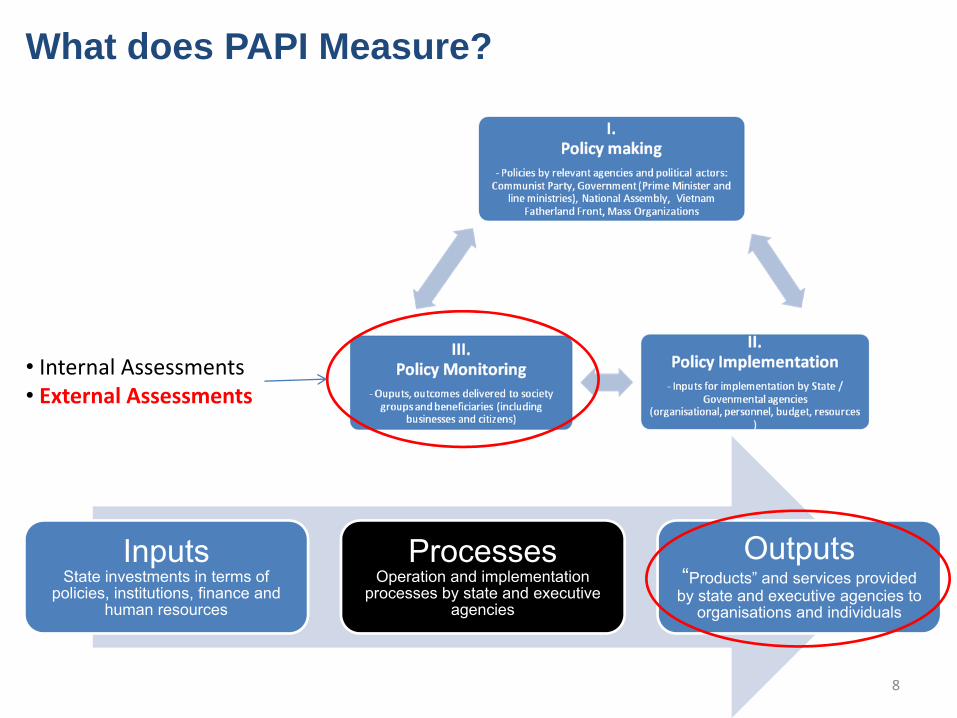
What does PAPI Measure?
InputsState investments in terms of
policies, institutions, finance and human resources
ProcessesOperation and implementation
processes by state and executive agencies
Outputs“Products” and services provided
by state and executive agencies to organisations and individuals
8
• Internal Assessments• External Assessments

“Thước đo năng lực phục vụ dân” [“Measure of capacity to serve citizens”] 20/05/2012. Pháp Luật Thành phố Hồ Chí Minh; “Năng lực lãnh đạo” = “Competence of Leaders”
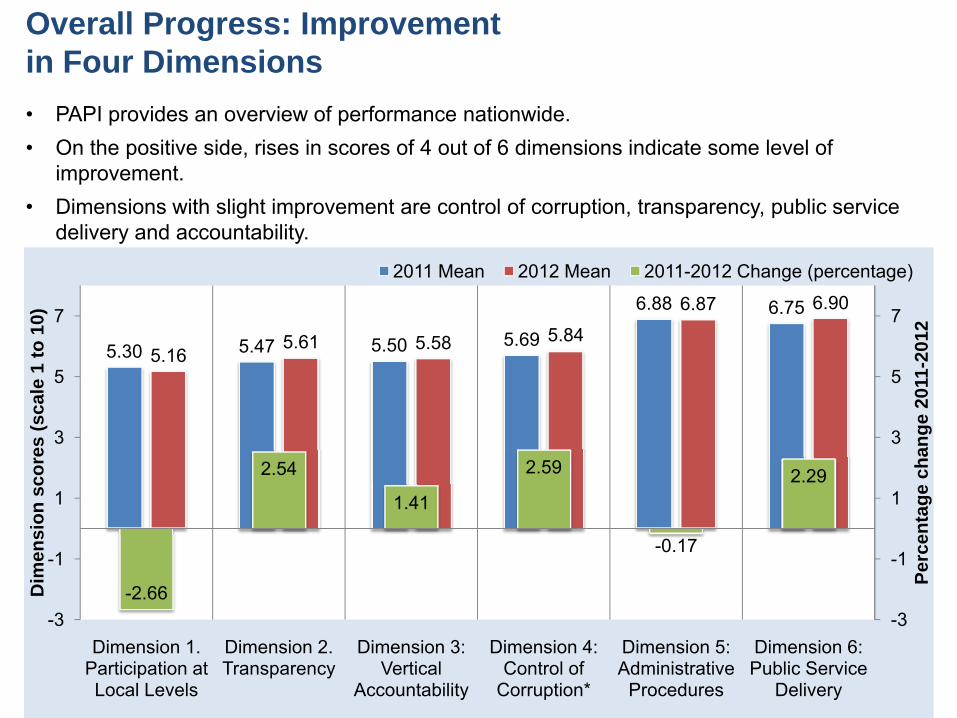
Overall Progress: Improvement in Four Dimensions
5.30 5.47 5.50 5.69
6.88 6.75
5.165.61 5.58 5.84
6.87 6.90
-2.66
2.54
1.41
2.59
-0.17
2.29
-3
-1
1
3
5
7
-3
-1
1
3
5
7
Dimension 1. Participation at Local Levels
Dimension 2. Transparency
Dimension 3: Vertical
Accountability
Dimension 4: Control of
Corruption*
Dimension 5: Administrative
Procedures
Dimension 6: Public Service
Delivery
Perc
enta
ge c
hang
e 20
11-2
012
Dim
ensi
on s
core
s (s
cale
1 to
10)
2011 Mean 2012 Mean 2011-2012 Change (percentage)
• PAPI provides an overview of performance nationwide. • On the positive side, rises in scores of 4 out of 6 dimensions indicate some level of
improvement.• Dimensions with slight improvement are control of corruption, transparency, public service
delivery and accountability.

Improvements in Dimension Scores (lowest, median and maximum provinces)
123456789
10
2011 2012 2011 2012 2011 2012 2011 2012 2011 2012 2011 2012
Dimension 1. Participation at Local Levels
Dimension 2. Transparency
Dimension 3: Vertical
Accountability
Dimension 4: Control of Corruption
Dimension 5: Administrative
Procedures
Dimension 6: Public Service
Delivery
• Dimensional scores of half of the country have marginally edged higher. On every dimension the median score slightly increased in 2012 compared to 2011.
• On average, Vietnamese citizens experienced better local governance and public services in 2012 compared to 2011.

Annual monitoring of changes in performance: % changes 2011‐2012
‐15
‐10
‐5
0
5
10
15
20
Ba Ria Vun
g Tau
Binh
Duo
ngDo
ng Nai
Quang
Ninh
Lai Chau
Bac Ninh
Ninh Th
uan
Ca M
auQuang
Tri
Binh
Phu
ocKien
Giang
Long
An
Soc Trang
Nam
Dinh
Dong
Thap
Hung
Yen
Bac Kan
Bac Giang
Tay Ninh
Bac Lieu
Lam Don
gHa
Tinh
Quang
Binh
Thanh Ho
aKh
anh Ho
aHC
MC
Ha Noi
Dak Lak
Hau Giang
Thai Nguyen
Phu Yen
An Giang
Ninh Binh
Dak Non
gBe
n Tre
Da Nang
Gia Lai
Nghe An
Vinh
Lon
gBinh
Dinh
Binh
Thu
anHa
Giang
Kon Tu
mHo
a Binh
Tuyen Quang
Lang
Son
Cao Ba
ngTh
ai Binh
Tra Vinh
Hai Pho
ngVinh
Phu
cPh
u Th
oSon La
Thua
Thien
Hue
Ha Nam
Yen Ba
iDien
Bien
Quang
Ngai
Hai D
uong
Can Th
oQuang
Nam
Tien
Giang
Lao Ca
i
Public Administrative Procedures

Mapping Differences in Provincial Performance

-42%-36%-35%
-29%-29%
-23%-12%
-9%
-70% -50% -30% -10%
No Clear DeadlineUnrespectfulDeadline not achivedNo Clear InfoIncompetentToo much PaperworkBribeNo Fees Displayed
Certification Procedures
-60%-57%
-40%-25%-23%-22%
-16%-6%
-70% -50% -30% -10%
No Clear InfoUnrespectfulIncompetentToo much PaperworkNo Clear DeadlineBribeDeadline not achivedNo Fees Displayed
Construction Permits
-65%
-62%
-45%
-39%
-37%
-32%
-22%
-70% -50% -30% -10%
Incompetent
Unrespectful
Deadline not achived
No Clear Deadline
Too much Paperwork
No Clear Info
No Fees Displayed
Land Use Right Certificates
-39%-26%-25%-21%-21%-20%
-5%-3%
-70% -50% -30% -10%
Deadline not achivedUnrespectfulNo Clear DeadlineNo Clear InfoToo much PaperworkIncompetentBribeNo Fees Displayed
Commune Administrative Procedures
Drivers of satisfaction towards administrative procedures
• Drivers of satisfaction towards administrative procedures: lack of respect and professionalism stand out prominently.
• For citizens who perceived officials as incompetent, satisfaction diminished 65% with LURC. Those who perceived lack of respect were 62% less satisfied.
Satisfaction Towards Public Administrative Procedures (% change from overall satisfaction)

Satisfaction with District Public Hospital Services (Impact on overall satisfaction – percentage)
-7%
-18%
-19%
-21%
-23%
-36%
-37%
-44%
-51%
-60% -50% -40% -30% -20% -10% 0%
Share beds
Private pharma recommended
Unreasonable wait time
Disease not cured
Restroom unclean
No electric fans
Unreasonable expenses
Not treated with respect
Irregular visits-54%
-25%
-18%
-16%
-12%
-11%
-10%
-5%
-4%
-60% -50% -40% -30% -20% -10% 0%
Unqualified teachers
Unclean toilets
Parents not informed of school revenue
No free drinking water
Classes with poor construction
Teachers' favoritism
Irregular feedback
More than 36 students
3 shifts of classes per day
Satisfaction towards public primary schools (% change from “very good” opinions on quality)
Drivers of satisfaction towards public services
Health Care: Two main drivers of satisfaction are the treatment patients experience and attention received from health care providers.
Primary Education: An important driver of satisfaction is about the skills and qualifications of teachers.

Control Panel of Provincial Performance by Dimensions –6 most populous provinces (+2 million inhabitants)
ProvinceD1.
Participation at local levels
D2. Transparency
D3. Vertical Accountability
D4. Control of Corruption
D5. Public Admin.
Procedures
D6. Public Service Delivery
An Giang 4.691 5.077 5.030 5.293 6.538 6.870
Dong Nai 4.729 5.002 5.135 5.378 6.743 6.920
Ha Noi 5.507 6.263 6.057 5.399 6.868 7.020
HCMC 4.743 5.798 5.144 6.396 7.076 7.517
Nghe An 5.487 6.132 6.151 5.794 7.024 6.553
Thanh Hoa 5.390 6.093 5.629 5.973 7.248 7.026
Color code: Best performer Above 75th percentile Low Average Between 25th and 50th percentileHigh Average Between 50th and 75th percentile Poor Performer Below 25th percentile

Participation/Elections Transparency Accountability Control of Corruption Administrative Procedures Public Service Delivery
Khanh Hoa Kien Giang Bac Lieu Lai Chau Dak Lak An Giang Ca Mau Dien Bien Tay Ninh
Dong Nai Tra Vinh Ninh Thuan Binh Thuan Dong Thap Cao Bang Bac Ninh Ha Giang Soc Trang
Phu Yen Quang Ninh Dak Nong Yen Bai Ninh Binh Tuyen Quang Quang Ngai Hau Giang Bac Giang
Kon Tum Hung Yen Thai Nguyen Hai Phong Hoa Binh Can Tho HCMC TT-Hue Lam Dong
Gia Lai Ben Tre Tien Giang Vinh Phuc Ha Noi Nghe An Son La Binh Duong Lao Cai
Thanh Hoa Quang Nam Lang Son Ha Tinh Hai Duong BRVT Long An Vinh Long Bac Kan
Phu Tho Binh Phuoc Quang Tri Nam Dinh Ha Nam Da Nang Binh Dinh Thai Binh Quang Binh
Zero Perfect
Dashboard of Six Dimensions of PAPI 2012
(Each branch size = level of dimensional performance on the scale from 1-10 per dimension)
• Dashboard helps identify weaknesses even in high-performing provinces.
• For instance, Quang Binh, while the most consistently high-performing province, has room for improvement on control of corruption. Da Nang, another top-performing province, demonstrates weakness in the areas of participation at the local levels and transparency.
• Lowest performing location, Khanh Hoa, scores relatively well on public service delivery. Tay Ninh is another low performer, which is consistent with 2011, presents strength in public administrative procedures, but lags behind other dimensions

Dashboard of Governance and Public AdministrationPAPI 2012 (unweighted)

PAR Index: a Government self-assessment to monitor PAR Master Plan 2011-2020 Implementation (i)
Ministry Level*• PAR Management• Administrative Procedure Reform• Reform of State Administration
apparatus• Building and improving quality of
human resources• Innovation of management
mechanism for public administration agencies and service delivery units
• Modernization of State Administration
• Performance of area management function
• 7 areas – 30 indicators – 79 subindicators
Provincial Level**• PAR Management• Administrative Procedure Reform• Reform of State Administration Apparatus• Building and improving quality of human
resources• Innovation of management mechanism
for public administration agencies and service delivery units
• Modernization of State Administration• Development and dissemination of legal
papers at localities• Implementation of One-Stop-Shops and
Inter-Agency One-Stop-Shops• 8 areas – 32 indicators – 85
subindicators
** Combines assessments from delivery units, citizens/users, enterprises, legislative body members
* Combines assessments from delivery units, citizens/users, enterprises, legislative body members and socio‐political organizations
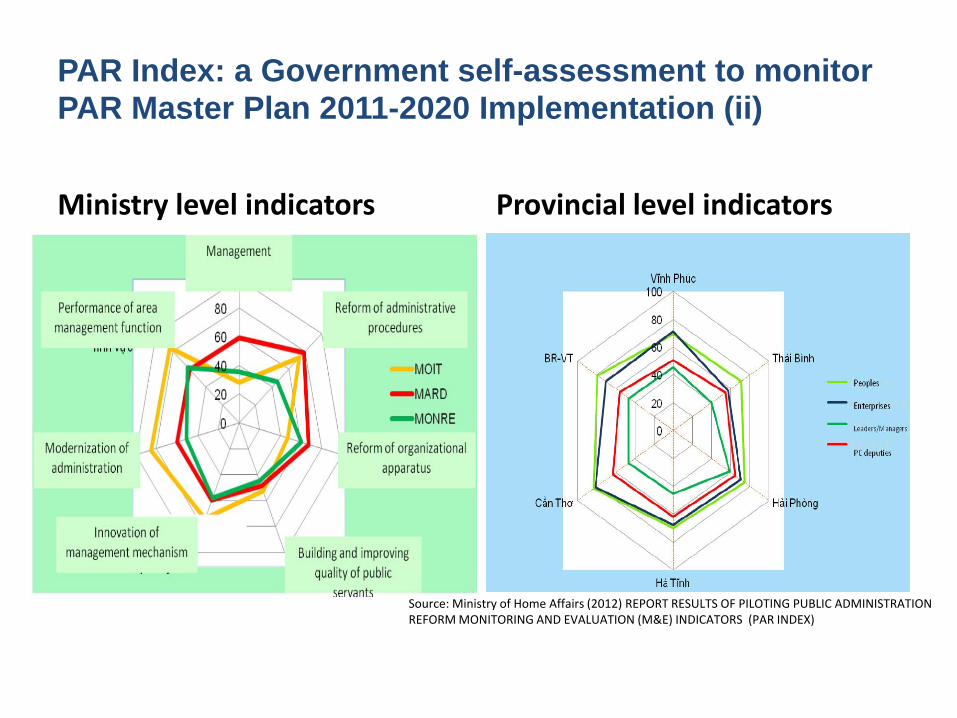
PAR Index: a Government self-assessment to monitor PAR Master Plan 2011-2020 Implementation (ii)
Ministry level indicators Provincial level indicators
Source: Ministry of Home Affairs (2012) REPORT RESULTS OF PILOTING PUBLIC ADMINISTRATION REFORM MONITORING AND EVALUATION (M&E) INDICATORS (PAR INDEX)

PAR Index & dashboard for Government Performance Management: Pilot results 2012
Area/Indicator Ministry of Natural Resources and Environment
Ministry of Industry and Technology
Ministry of Agriculture and Rural
Development
PAR Management 35.71 28.33 59.44
Reform of Administrative Procedures 46.09 72.62 78.60
Reform of State Administration Apparatus 60.58 47.52 67.66
Building and improving quality of human resources
45.04 52.52 48.92
Innovation of management mechanism for public administration agencies and service delivery units
57.88 74.10 59.90
Modernization of State Administration 50.97 85.41 60.23
Performance of area management function 62.05 83.54 59.68
Source: Ministry of Home Affairs (2012) REPORT RESULTS OF PILOTING PUBLIC ADMINISTRATION REFORM MONITORING AND EVALUATION (M&E) INDICATORS (PAR INDEX)
3638
4042
2012
Pro
vinc
ial A
dmin
istra
tive
Per
form
ance
Inde
x
45 50 55 60 652012 Provincial Competitiveness Index
95% CI Fitted valuesPAPI
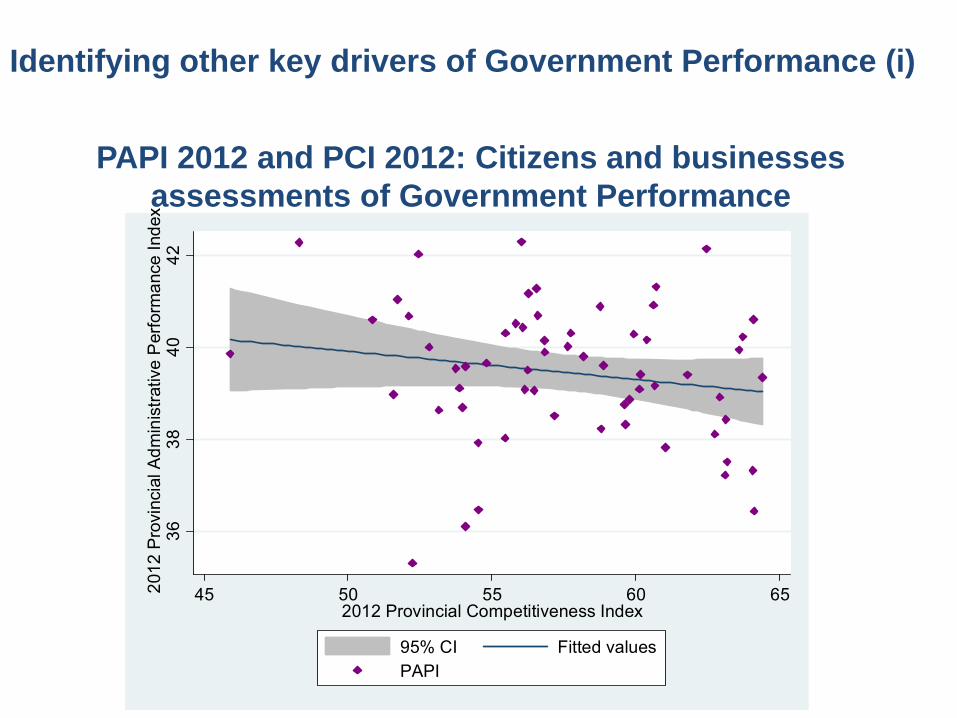
PAPI 2012 and PCI 2012: Citizens and businesses assessments of Government Performance
Identifying other key drivers of Government Performance (i)

Identifying other key drivers of Government Performance (ii)
Integrity Justice & Control Corruption go together in provinces.
Justice & Governance:Hand-in-hand according to citizens

Relevant External Findings from June 2013 Votes of Confidence “The strongest correlates of citizens’ satisfaction with government (measured on a 100‐point feeling thermometer) are perceptions of health and education services. This is the reason that PAPI weights the public services index so highly (about 44% of the total index), above measures of participation, transparency, and corruption control. Further disaggregating the different public services that are measured, it is clear that Education and Health stand alone. Their relationship with citizens’ satisfaction is twice the level of assessments of “infrastructure” and “law & order”. (UNDP, 2012)” Edmund, J. Malesky (2013)
Source: http://tuoitrenews.vn/politics/10538/1st‐confidence‐vote‐results‐for‐vietnam‐leaders‐announced
Identifying other key drivers of Government Performance (iii)

Source: Edmund, J. Malesky (2013) Understanding the Confidence Vote in Vietnamese National Assembly: A Preface to Adverse Effects of Sunshine. In London, Jonathan (2013) (ed) Politics in Viet Nam: Party, State, and Authority Relations. Palgrave MacMillan (forth coming)
President
VP
Prime Minsiter
DPM
DPMDPM
DPM
Culture
Interior
State Bank
MOLIA
MOJ
Construction
OOG
MIT
Education
Foreign Affairs
MARD
Public Security
MONRE
MOSTE
Information
Defense
Transport
Health
Inspectorate
MPI
Chief Justice
Procuracy
0.1
.2.3
.4
Num
ber o
f Tim
es a
Min
iste
r was
Que
ried
(200
7-20
12)
0 2 4 6 8
Proportion of Low Confidence Votes
Relationship between Query Appearances and Confidence Voting
Identifying other key drivers of Government Performance (iii)

Contents
• The Context• Description of the main features of the
Government Performance Management in Vietnam = PAPI
• Impact of PAPI• Similarities and differences with Indian
approach• Lessons of experience

Impacts of PAPI Provincial• Increasing evidence of provinces discussing PAPI findings and ways to improve performance
(e.g. Bình Định, Quảng Ngãi, Hà Tĩnh, Kon Tum, Đắk Lắk, Đắk Nông, TP. Hồ Chí Minh, ĐàNẵng, Hà Giang, Phú Yên, An Giang, Cà Mau, Nghệ An, Bình Thuận, Hà Nam…);
– Kon Tum’s action plan to improve performance (Decision No. 703/QĐ-UBND on 03/08/2012);
– Quảng Ngãi and the Directive No. 19/CT-UBND on 29/11/2012; – Đắk Lắk and the Official Letter No. 2211/UBND-TH on 03/05/2012;– Thái Nguyên and Resolution No. 15/2012/NQ-HĐND dated 15/12/2012 (which provides
for that improving PAPI to enhance public administration reform, transparency, simplification of administrative procedures, and the effectiveness and efficiency of the state apparatus)
– Đồng Tháp and Directive No. 13/CT-UBND– Bình Định and Directive No. 13/CT-UBND– Cà Mau and Directive No. 06/CT-UBND
• Diagnostic workshops with provinces to share concrete findings and advise ways to improve performance (Bình Định, Hà Tĩnh, Kon Tum, Đà Nẵng, Đắk Nông, Thái Nguyên, Hà Giang, An Giang,…)
• Provincial in-depth analysis of PAPI findings (Hồ Chí Minh City, Đà Nẵng, Hà Nam, Ninh Bình, Cao Bằng, Điện Biên, Phú Yên, Quảng Nam…)

Impacts of PAPI
National• PAPI 2011 data used in the report “Corruption from the Perspective of Citizens, Firms and Public Officials”
by the Government Inspectorate and the World Bank;• PAPI 2011 used in donors’ joint policy brief: “Revising the 2003 Law on Land in Vietnam: Creating
Equitable Treatment for Land Use Right Holders” submitted to the National Assembly; • Some PAPI data included in the GI’s report to the Steering Committee of the National Assembly; • Used as external source of data for the monitoring and evaluation of corruption situations and anti-
corruption work being developed by GI;• Used as external source of data for the monitoring and evaluation of public administration reform in the
PAR Index being developed by MOHA;• PAPI as output and means of verification of governance in the One UN Plan 2012-2016 as agreed upon
by the Government of Vietnam and the United Nations in Vietnam (signed on 27 March 2012);• PAPI used in the Vietnam Human Development Report 2011: “Governance and Human Development”
International• PAPI’s framework, methodology and philosophy highlighted as a international example in several
international discussions (Beijing, Nepal, Tunisia, ASEAN + ROK, Indonesia, India, Myanmar) and in the governance assessment portal (GAP)
• PAPI model to be replicated in Thailand – Provincial Governance Index (PGI)• Academic community, i.e. Jandl, Thomas (2013) Vietnam in the Global Economy: The Dynamics of
Integration, Decentralization and Contested Politics. Lexington Books. Makes extensive use of PAPI data.

Contents
• The Context• Description of the main features of the
Government Performance Management in Vietnam = PAPI
• Impact of PAPI• Similarities and differences with Indian
approach• Lessons of experience
Similarities and differences (i)
PAPI is an “independent” but complementary Government Performance Management assessment
• Similarities:– Innovative approaches to measure performance– Efforts to monitor progress and improve provision of public
goods– Put pressure on delivery quality services and achieving results
• Differences– PAPI based on citizens’ experiences– PAPI mostly provincial level based – but can be aggregated at
national level– PAPI external monitoring source (flipping the coin) and
complementing self-assessments

Similarities and differences (ii)
PAR Index from Ministry of Home Affairs most similar with India’s Government Performance Management system
• Similarities:– Government managed exercise– Focus on delivery units assessment and “inputs”
self-assessment– Central (ie Ministerial) and Provincial
• Differences:– PAR Index in Vietnam still a pilot– PAR Index in Vietnam combines samples of sources– PAR Index in Vietnam does not set up benchmarks for Ministries
or Provinces to achive

Contents
• The Context• Description of the main features of the
Government Performance Management in Vietnam = PAPI
• Impact of PAPI• Similarities and differences with Indian
approach• Lessons of experience
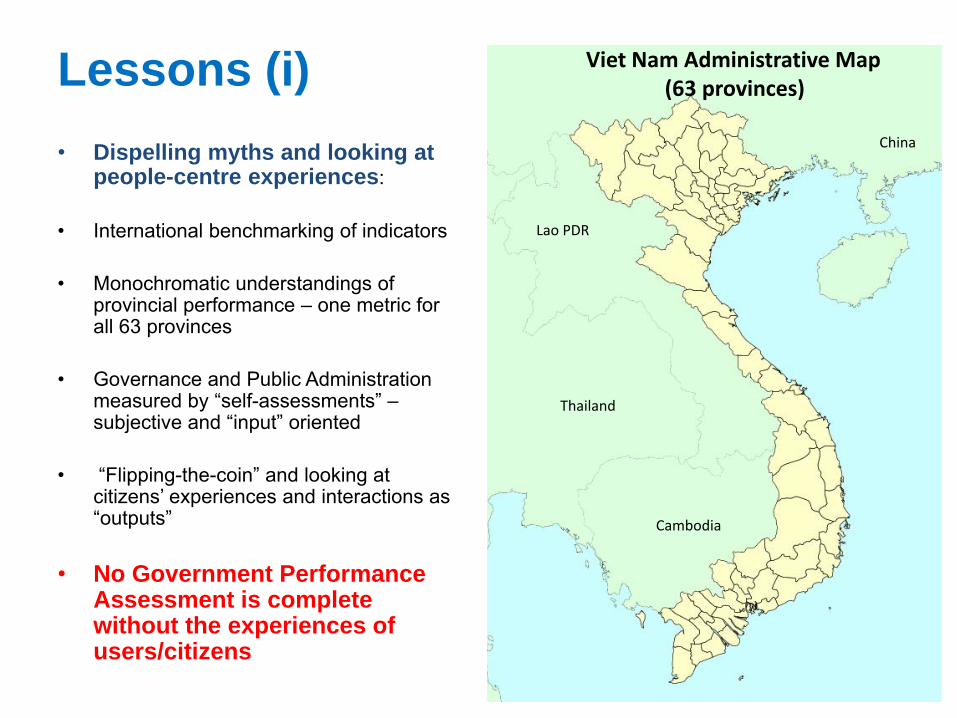
Lessons (i)• Dispelling myths and looking at
people-centre experiences:
• International benchmarking of indicators
• Monochromatic understandings of provincial performance – one metric for all 63 provinces
• Governance and Public Administration measured by “self-assessments” –subjective and “input” oriented
• “Flipping-the-coin” and looking at citizens’ experiences and interactions as “outputs”
• No Government Performance Assessment is complete without the experiences of users/citizens
33
Viet Nam Administrative Map(63 provinces)
China
Lao PDR
Thailand
Cambodia
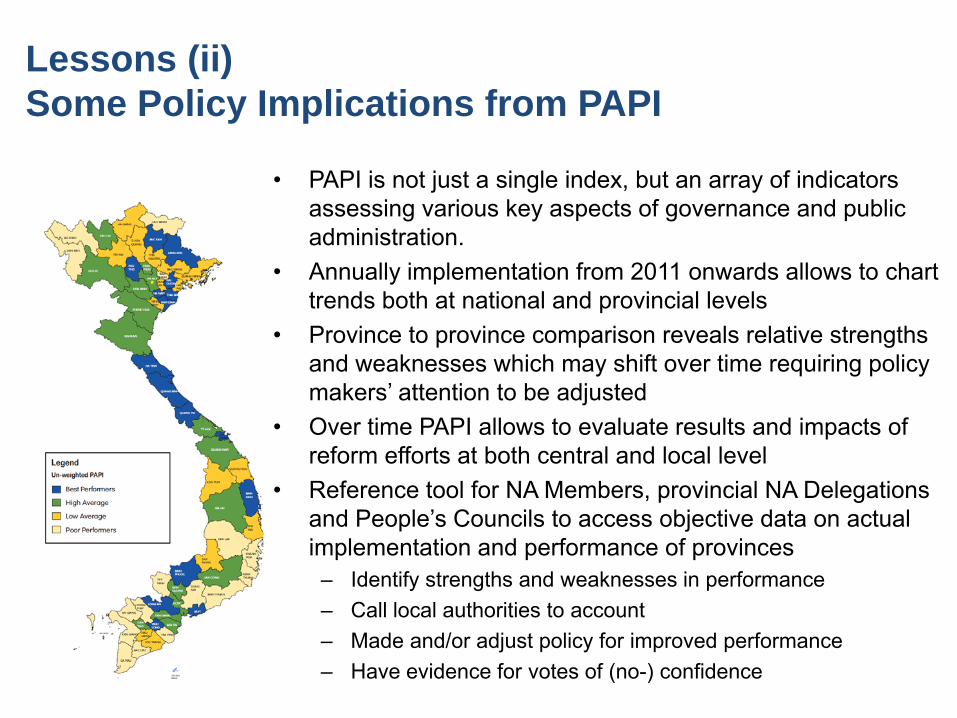
Lessons (ii)Some Policy Implications from PAPI
34
• PAPI is not just a single index, but an array of indicators assessing various key aspects of governance and public administration.
• Annually implementation from 2011 onwards allows to chart trends both at national and provincial levels
• Province to province comparison reveals relative strengths and weaknesses which may shift over time requiring policy makers’ attention to be adjusted
• Over time PAPI allows to evaluate results and impacts of reform efforts at both central and local level
• Reference tool for NA Members, provincial NA Delegations and People’s Councils to access objective data on actual implementation and performance of provinces
– Identify strengths and weaknesses in performance– Call local authorities to account– Made and/or adjust policy for improved performance– Have evidence for votes of (no-) confidence
www.papi.vn
www.facebook.com/papivn
@PAPI_Viet Nam
http://www.youtube.com/channel/UCl9N7_31aHZQ5nqP6U_DVfw