monitoring and enforcement: is two-tier regulation … · monitoring and enforcement: is two-tier...
TRANSCRIPT

Monitoring and Enforcement: Is Two-Tier Regulation Robust?
Vinish Kathuria and Thomas Sterner
April 2002 • Discussion Paper 02-17
Resources for the Future 1616 P Street, NW Washington, D.C. 20036 Telephone: 202–328–5000 Fax: 202–939–3460 Internet: http://www.rff.org
© 2002 Resources for the Future. All rights reserved. No portion of this paper may be reproduced without permission of the authors.
Discussion papers are research materials circulated by their authors for purposes of information and discussion. They have not necessarily undergone formal peer review or editorial treatment.

Monitoring and Enforcement: Is Two-Tier Regulation Robust?
Vinish Kathuria and Thomas Sterner
Abstract
The regulation of industrial pollution is clearly difficult in a rapidly industrializing, low-income setting. In addition to the general lack of resources for monitoring and enforcement, authorities must deal with the asymmetric nature of the information and multiple nonpoint sources of pollution. In this study we look at efforts to regulate chemical plants in Ankleshwar, in the Indian state of Gujarat. The plants are located in an industrial estate, which provides interesting preconditions for a form of two-tier regulation, in which an industry association becomes an intermediary between the government and individual firms: it monitors its members’ pollution and promotes compliance with the government’s environmental regulations. The Indian agency responsible for environmental protection cannot effectively control the many small individual plants within such estates. The local industry association is much better informed and has an incentive to regulate its members to maintain a good reputation but does not possess much formal authority, and its voluntary monitoring and abatement program is akin to managing a common property resource. We study four preconditions for the success of such management: suitable design principles, effective monitoring, objective implementation of rules, and enforcement. We show that these conditions are satisfied at least to some extent in Ankleshwar and that the fines decrease pollution.
Key Words: Industrial estate, two-tier monitoring, common property resource, industry association, nonpoint sources of pollution
JEL Classification Numbers: Q25, P28, K42

Contents
1. Introduction......................................................................................................................... 1
2. Pollution Control in Industrial Estates ............................................................................. 3
4. Effluent Monitoring and Imposition of Fines................................................................... 9
5. Monitoring Effectiveness.................................................................................................. 10
6. Levying and Collecting Fines........................................................................................... 15
6. Concluding Remarks ........................................................................................................ 17

1
Monitoring and Enforcement: Is Two-Tier Regulation Robust?
Vinish Kathuria and Thomas Sterner∗
1. Introduction
The failure of industrial pollution control in many developing countries is due both to rigid command-and-control regulatory approaches and to the large number of small-scale and informal sector pollution sources that lack knowledge, funds, technology and skills to treat their effluent. This nonpoint source pollution aggravates the problems of regulators already constrained by meager resources and limited authority. Low remuneration also invites corruption. In settings marked by large unemployment, these weaknesses may together seriously impair the ability of the environmental regulatory agency to conduct effective monitoring and enforcement (Pargal and Wheeler 1996; Mookherjee and Png 1992, 1995). The problems are compounded by information asymmetries.
The design of policy instruments for industrial pollution is, in fact, a complex task. The regulator can in principle use an array of physical, legal, monetary, and other instruments (Sterner 2002). In the past few years information disclosure and rating have become the center of attention in what is sometimes referred to as the “third wave” of environmental policy (Tietenberg 1998). For developing countries in which regulatory authorities lack the resources to use conventional instruments, information disclosure may at least be an important first step. One of the pillars of this approach is the inclusion of all stakeholders—community, industry, consumers, and nongovernmental organizations, along with government and media representatives (Wheeler et al. 2000). It explicitly acknowledges the difficulties of monitoring
∗ Kathuria ([email protected]) is a visiting researcher at the University of Gothenburg, and Sterner ([email protected]) is professor of environmental economics at the University of Gothenburg and a University Fellow at Resources for the Future. The data used in the paper were provided by the Ankleshwar Industries Association (AIA) in conjunction with an earlier study by Shah and Kathuria of the Gujarat Institute of Development Research on socioeconomic linkages. Earlier versions of this paper were presented in a seminar at the Institute of Economic Growth, Delhi, on September 19, 2000, and in the 11th European Association of Environmental and Resource Economists conference at Southampton, England, June 28–30, 2001. The authors are thankful to the seminar participants and to Lennart Flood for constructive suggestions. The usual disclaimers nevertheless apply.

Resources for the Future Kathuria and Sterner
2
and enforcement and recognizes that there are many more avenues of influence than just through formal regulation or monetary charges. Firms are sensitive, for example, about their reputations and the future costs they may incur as a result of liability or accidents. The emergence of this new paradigm for regulation is also related to the advances made during the past decades in our understanding of asymmetric information. In a setting where the principal has few resources, the agents are many, and the issue to be regulated is complex and hence expensive to monitor, this asymmetry is problematic.
The policy instrument choices are not a simple tax versus regulation, but rather a mix of policies including regulations, information provision, subsidies, charges, and provision of public goods, all molded together through a process of policy dialogue in which the stakeholders really take part. Attention is paid to the implicit property rights to the environment and to the balance of power between regulators and industry. Sanctions are carefully graduated to avoid alienating polluters; attention is paid to the use and not just collection of charges; and regulations are carefully timed to avoid unnecessary costs to industry. Another policy involves peer monitoring, as in the framework of common property resource management.
Indian chemical firms are clustered in industrial estates. These estates have two important characteristics that may make them useful intermediaries in the regulatory process: (a) they are at least partly democratic or cooperative structures managed by their respective industry associations, and (b) they have information on pollution and technology. Although aggregate pollution from an industrial estate is clearly noticeable and attracts attention, it is very difficult for regulators and residents to monitor individual plants. Given the size of the task, the costs involved, and its own limited budget, the state regulatory agency, the Gujarat Pollution Control Board (GPCB), can resort to two-tier regulation by delegating monitoring and enforcement to the estate. The industry association not only has higher monitoring efficiency, which raises the marginal expected penalty for the plant, but it may also lower the plant’s marginal abatement cost (especially if the firm is small) by providing technical and other support. Two-tier regulation has advantages in monitoring but does not solve the problems of collective action, such as free riding. Nevertheless, the association has an incentive for self-regulation, since it must consider the effect on all its members if the estate draws bad publicity. This implies that the reputation of the estate is a form of common good, or a common pool resource.
There is a vast literature on social dilemmas, free riding, and the management of common pool resources, from which we can draw hypotheses concerning the sustainability of an arrangement like two-tier monitoring. Ostrom (1990) focuses on three major puzzles of common action: the supply of the common good, achieving sustained commitment to the group, and
Resources for the Future Kathuria and Sterner
3
designing appropriate incentives for mutual monitoring. By way of a guide she summarizes seven design principles that are prerequisites to sustainable management of a common pool resource. With the wording adapted for our context, the principles are as follows:
1. Because free access to a resource is likely to lead to overutilization, membership and the rights and obligations that go with it must be clearly defined.
2. The rules governing the rights and obligations must be proportionate to one another and appropriate for the local conditions.
3. Structures for decisionmaking should be democratic.
4. Monitoring must be effective, and monitors should be either the participants themselves or at least accountable at the local level.
5. Reasonable and credible sanctions are needed. They are often carefully graduated to avoid alienating first-time offenders. Monitoring itself is often rewarded to create incentives for mutual monitoring.
6. Appropriate mechanisms for conflict resolution are needed.
7. Finally, some recognition by external government authorities is also needed.
This paper evaluates to what extent the Ankleshwar Industrial Estate (AIE) has been able to meet those design principles. Section 2 gives some background on industrial estates in India and AIE in particular. We then look at various aspects of behavior within the estate. Section 3 focuses on the provision of common goods such as effluent treatment and the rules concerning use and cost sharing; section 4 looks at the structure of fines; section 5 is an analysis of their effect on effluents; and section 6 takes a look at the distribution of fines on different types of firms to assess whether they appear to be levied fairly. Section 7 concludes.
2. Pollution Control in Industrial Estates
India’s industrial estates were originally a tool for industrial dispersal. At the time of independence, industries were heavily concentrated in a few regions of the country—essentially around major cities like Calcutta, Bombay, Kanpur, and Madras; the rest of the country was largely unindustrialized. In 1971 planners identified as “backward” about 245 districts, comprising 60% of the population and 70% of the area of the country. Alongside other policies, such as capital investment subsidies, transport subsidies, and income tax concessions, was an Industrial Estates Programme that sought to locate industries in such areas. Besides promoting

Resources for the Future Kathuria and Sterner
4
development by building infrastructure, the program was intended to generate competitiveness through agglomeration economies. At present, there are nearly 867 industrial estates in India (CPCB 2001, 2). In Gujarat alone, the Gujarat Industrial Development Corporation (GIDC) has set up 257 industrial estates, of which 169 are currently operational (see http://www.gidc.gov.in).
The environmental awareness of the industrial estates grew in the late 1980s, when the industries’ development corporations began developing effluent collection networks, combined effluent treatment plants, disposal systems for treated effluents, and tree plantations. Currently, the industrial estates also serve as zoning devices and are an instrument of policy by which state authorities can, in principle, prevent development in ecologically sensitive or heavily populated areas. Even within estates, separate zones for pharmaceuticals, dyes, and pesticides can be a tool to reduce air pollution and facilitate better waste collection and disposal efforts.1
AIE is the largest chemical estate in Asia, covering 16 square kilometers and housing more than 400 chemical plants.2 Its situation on the Bombay-Delhi railway makes it highly visible. Its plants process large quantities of basic chemicals, solvents, acids, and fuels to manufacture more than 25% of Gujarat’s (5% of India’s) output of pharmaceuticals, chemicals, pesticides, dyes, and intermediaries. Assuming the share of pollution is commensurate, AIE may be producing 5% of India’s total chemical pollution in just 16 square kilometers. AIE has estimated that its members generate between 250 million and 270 million liters of liquid waste per day, and roughly 50,000 tons of solid waste annually (Bruno 1995). Ankleshwar’s Amlakhadi3 Creek is completely void of biological life. According to India’s Central Pollution Control Board (CPCB), of the five possible classes of water quality, A to E, the Amlakhadi is below E. Already the groundwater in neighboring villages has been affected, allegedly leading to the death of some cattle.
AIE encourages pollution abatement among its units with such instruments as provision
of information, direct regulation of emissions at individual units, and fines if a unit’s emissions
1 This kind of zoning is being tried by GIDC in new estates. Also in other countries, industrial estates are being used as zoning devices to reduce pollution (see Israngkura 2000, 87). 2 The industrial estate houses 1,600 small, medium, and large units in different sectors, including pharmaceuticals, dyes, chemicals, pesticides, engineering, and plastics. 3 The Amlakhadi Creek is 14 kilometers long; it carries effluents from the Ankleshwar, Panoli, and Jhagadia industrial estates and finally flows into the Narmada River, which meets the Arabian Sea.
Resources for the Future Kathuria and Sterner
5
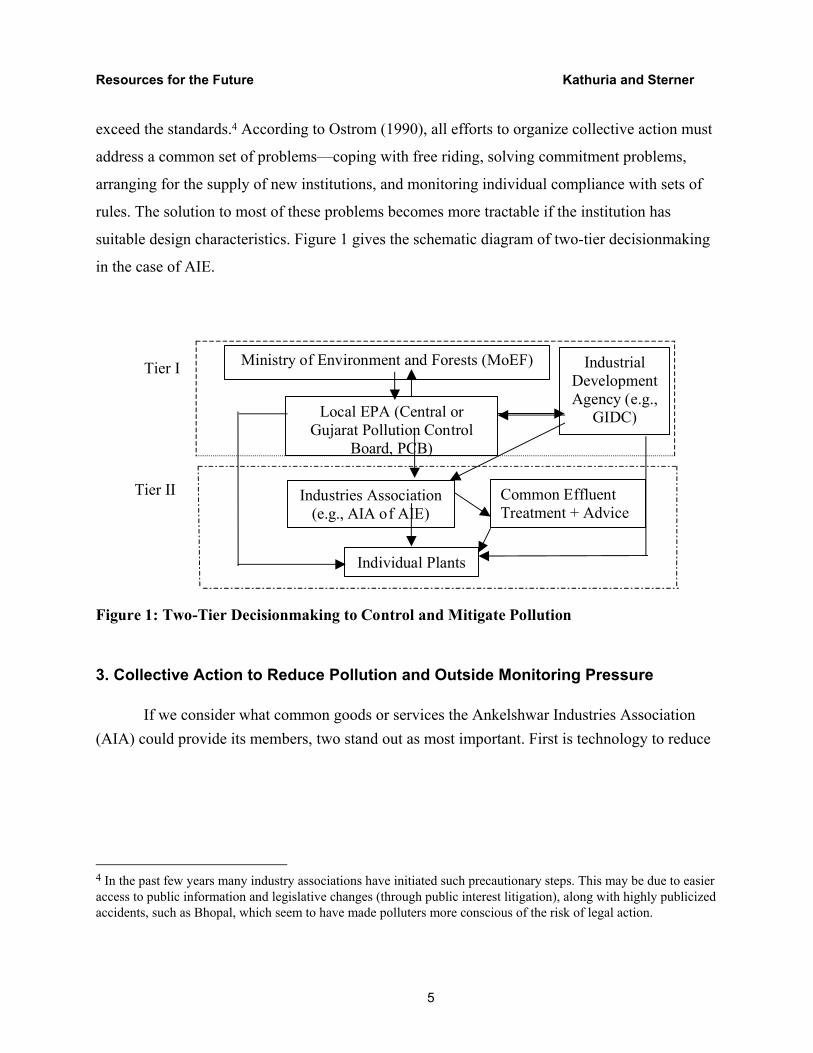
exceed the standards.4 According to Ostrom (1990), all efforts to organize collective action must
address a common set of problems—coping with free riding, solving commitment problems,
arranging for the supply of new institutions, and monitoring individual compliance with sets of
rules. The solution to most of these problems becomes more tractable if the institution has
suitable design characteristics. Figure 1 gives the schematic diagram of two-tier decisionmaking
in the case of AIE.
Figure 1: Two-Tier Decisionmaking to Control and Mitigate Pollution
Ministry of Environment and Forests (MoEF)
Local EPA (Central orGujarat Pollution Control
Board, PCB)
IndustrialDevelopmentAgency (e.g.,
GIDC)
Industries Association(e.g., AIA of AIE)
Individual Plants
Tier I
Tier II Common EffluentTreatment + Advice
3. Collective Action to Reduce Pollution and Outside Monitoring Pressure
If we consider what common goods or services the Ankelshwar Industries Association (AIA) could provide its members, two stand out as most important. First is technology to reduce
4 In the past few years many industry associations have initiated such precautionary steps. This may be due to easier access to public information and legislative changes (through public interest litigation), along with highly publicized accidents, such as Bhopal, which seem to have made polluters more conscious of the risk of legal action.
Resources for the Future Kathuria and Sterner
6
or treat effluents and waste, and thereby reduce attention from regulators.5 Second is less frequent inspections by GPCB—something specifically mentioned by many firms in our interviews as the main benefit of membership in the common effluent treatment plant . The inspections take time, and the inspectors expect special treatment, which is onerous and troubling for the firms. The two goals are closely interrelated since reduced attention by the authorities is brought about by lower pollution, which in turn is a result of both technical investments and changes in behavior among the firms. The two main pieces of infrastructure to reduce or treat effluents provided by AIA are a common effluent treatment plant and a centralized landfill facility.
The effluent treatment plant was initially built6 for the small firms; most of the medium and large units had their own treatment plants. Most small firms are unable to provide such facilities on their own, as they are constrained by space, capital, and expertise. Because of their large number and small size, they may be perceived almost as nonpoint sources, and thus, unlike large firms, cannot be easily forced to treat their waste and take sufficient safety precautions (Gorter 1996). However, in an industrial estate there is such a concentration of small firms that the effect of releasing untreated waste into open drains is catastrophic.
The Ankleshwar plant is the first in Gujarat to do primary,7 secondary, and tertiary treatment and has been awarded ISO 14000 certification. Treatment yields treated effluent and solid waste or sludge. The treated effluent flows into an underground collection system and is then discharged into Amlakhadi Creek. The cost of this underground drainage, built by the Gujarat Industrial Development Corporation, has been shared by the industries through capital contribution charges. The recurring cost is being recovered from the industries through a levy of drainage charges at the rate of Rs. 2 per kiloliter of water consumed.
5 Creating good publicity is another important AIA activity. To quote AIA: “(L)ong before the Judicial activism and various environmental groups started their crusade to safeguard the environment, AIA realised its responsibilities and registered a public charitable trust on 26th April 1989 by the name of Ankleshwar Environment Preservation Society, AEPS” (AIA 1999). Besides planting trees and creating awareness, AEPS aims (i) to assist industries in controlling air pollution and in disposal of their solid and liquid waste; and (ii) to set up a laboratory for testing stack air and liquid effluent samples. AEPS was also in 1994 one of the very first to be successful in getting pollution control projects eligible for tax concessions. 6 As early as in 1988, the Gujarat state government ordered GIDC to develop treatment plants for Ankleshwar, but little progress was made till 1995 (Bruno 1995). 7 Considerable debate took place concerning whether to mandate all units to carry out at least primary treatment in-house. The experience from other estates, however, showed that the small firms were often incapable of doing this properly, and the effort created more problems than it solved.
Resources for the Future Kathuria and Sterner
7
The other residue of the effluent treatment plant, solid waste, also needs to be disposed of properly. Although some medium and large units have their own disposal pits, as recently as 1997 many were disposing of sludge and solid waste in the open or even discharging it back into the drains (Down to Earth 1998). Thus, it was decided that a centralized facility was needed for proper disposal of the hazardous sludge, and AIA took the initiative to develop it. The Ankleshwar Environment Protection Society (AEPS) in collaboration with the National Productivity Council, Delhi, conducted an environmental impact analysis based on guidelines from the Ministry of Environment and Forests and the World Bank. This is the first site in India where a public consultation process was carried out according to these guidelines.8 The landfill facility was developed under German standards and is paid for exclusively by AIA and its members except for a 50% subsidy in land procurement. The banks may have been wary of financing it, since the landfill had already generated negative publicity, but we do not have any evidence.
8 In fact, the public consultation process in Ankleshwar grew out of a previous instance of bad publicity in 1996, when an attempt to set up a landfill in an adjoining village was aborted after stiff local resistance and a public interest lawsuit (Down to Earth 1998).

Resources for the Future Kathuria and Sterner
8
Table 1: Financing of Centralized Effluent Treatment and Solid Waste Landfill Facilities Item Effluent treatment plant Solid waste landfill
Financing (Rs. million) Land: subsidy from GIDC Land: 50% subsidy from GIDC Equity 12.000
Subsidy from GIDC 10.000 IDBIa term loan 33.000 AIA member deposit 15.806 Total 70.806
Equity and deposit 9.80 Subsidy IDBI term loan Total 9.80
Members 193b 206 Membership fee (Rs.) 10,000 fixed 1,500 Membership profile In principle only small firmsc Any unit Operating charges (Rs.) 8 + chemical oxygen demand load
per kiloliterd 365 per metric ton + transportation charges
Treatment charges as recovered from members (Rs. million)
1996–97 3.779 1997–98 49.484 1998 (April–December) 4.893
1996–97 – Nil 1997–98 – Nil 1998 (April–December) – 3.9
Sources: AIA (1999); brochures of the effluent treatment and solid waste landfill facilities; and Enviro Tech. Ltd. members’ list.
a IDBI is the Industrial Development Bank of India.
b Including four units from another industrial estate (Panoli).
c Two multinational corporations and one former subsidiary of a multinational are also members.
d If a unit has no effluent, it still has to pay Rs. 1,500 for a tanker.
Table 1 shows the distribution of capital and operating costs. Note that the outside subsidy is limited and that the firms bear most of the costs. Land has been provided at a concessional rate by GIDC, which has also given Rs. 10 million covering 14% of the total cost of setting up the effluent treatment plant. The association has thus managed to cover the largest share of capital costs and also bears the recurring operating costs. The way in which operating costs are shared has been a source of discord within the association, however. Several large units are members even though subsidies were intended for small firms’ effluent treatment. As can be seen from the table, there are both fixed (membership) fees and variable operating costs. Naturally, the small firms complain that the fixed costs are unfair and seek to base fees on a variable basis. Since monitoring is very difficult, such an arrangement would create incentives to pass untreated effluent into the drains. Thus we observe the classic dilemma between distributional and efficiency goals. Still, it seems that the tariff structure could be improved to allow for greater flexibility for the smallest firms, which have to pay a fixed charge even when they do not generate enough waste for a tanker (see note d).
Resources for the Future Kathuria and Sterner
9
4. Effluent Monitoring and Imposition of Fines
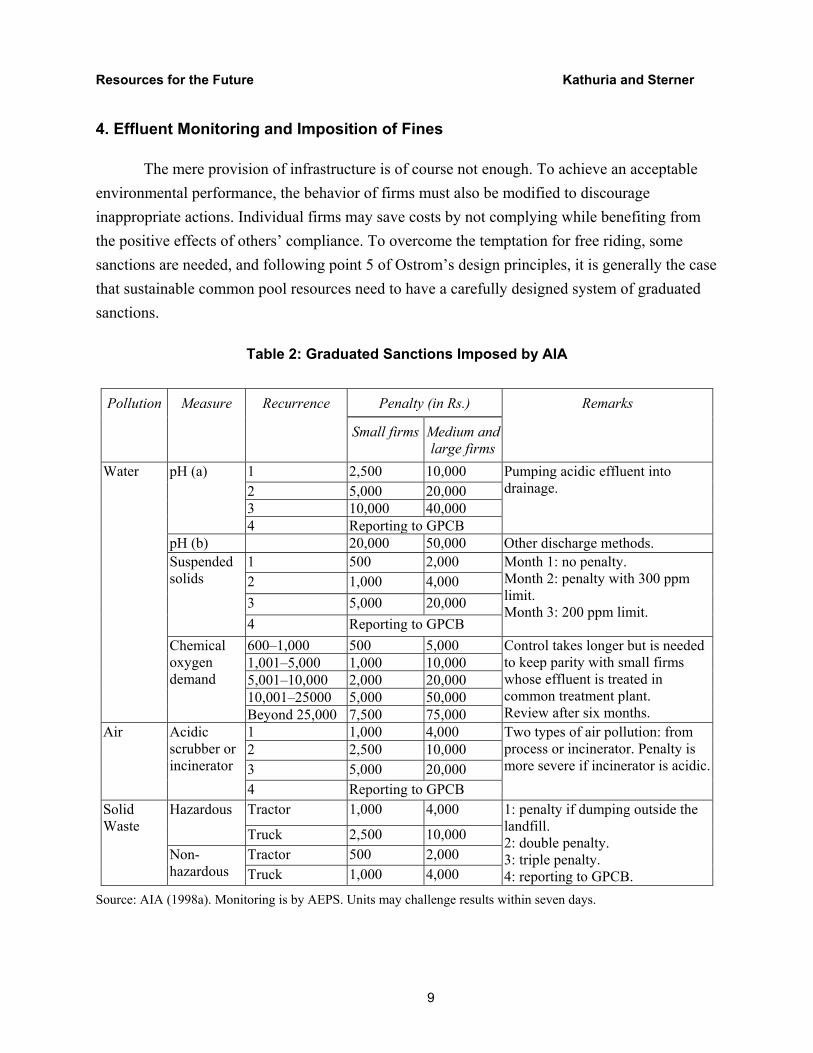
The mere provision of infrastructure is of course not enough. To achieve an acceptable environmental performance, the behavior of firms must also be modified to discourage inappropriate actions. Individual firms may save costs by not complying while benefiting from the positive effects of others’ compliance. To overcome the temptation for free riding, some sanctions are needed, and following point 5 of Ostrom’s design principles, it is generally the case that sustainable common pool resources need to have a carefully designed system of graduated sanctions.
Table 2: Graduated Sanctions Imposed by AIA
Penalty (in Rs.) Pollution Measure Recurrence
Small firms Medium and large firms
Remarks
1 2,500 10,000 2 5,000 20,0003 10,000 40,000
pH (a)
4 Reporting to GPCB
Pumping acidic effluent into drainage.
pH (b) 20,000 50,000 Other discharge methods. 1 500 2,000 2 1,000 4,000 3 5,000 20,000
Suspended solids
4 Reporting to GPCB
Month 1: no penalty. Month 2: penalty with 300 ppm limit. Month 3: 200 ppm limit.
600–1,000 500 5,0001,001–5,000 1,000 10,0005,001–10,000 2,000 20,00010,001–25000 5,000 50,000
Water
Chemical oxygen demand
Beyond 25,000 7,500 75,000
Control takes longer but is needed to keep parity with small firms whose effluent is treated in common treatment plant. Review after six months.
1 1,000 4,000 2 2,500 10,000 3 5,000 20,000
Air Acidic scrubber or incinerator
4 Reporting to GPCB
Two types of air pollution: from process or incinerator. Penalty is more severe if incinerator is acidic.
Tractor 1,000 4,000 Hazardous
Truck 2,500 10,000 Tractor 500 2,000
Solid Waste
Non-hazardous Truck 1,000 4,000
1: penalty if dumping outside the landfill. 2: double penalty. 3: triple penalty. 4: reporting to GPCB.
Source: AIA (1998a). Monitoring is by AEPS. Units may challenge results within seven days.
Resources for the Future Kathuria and Sterner
10
Monitoring and imposition of fines are the most important instruments employed by AIA to control the release of pollution in the estate. AEPS is responsible for monitoring and has adopted the following procedure. Two effluent samples are taken from each chemical unit every month. If samples exceed the GPCB standards in pH, chemical oxygen demand, or other indicators, the test reports are sent to the environment committee of AIA. The committee calls the concerned units for discussion, and if the firms remain in noncompliance, financial penalties are levied or other sanctions imposed. Table 2 gives the structure of the penalties for each type of measure and industry size group.
Note that the penalty (except for chemical oxygen demand) increases with both the severity of the infringement and the frequency with which the polluter has violated rules in the past. This is exactly the main feature Ostrom considers important. The last “threat point” punishment to which AIA resorts after repeated infractions (or nonpayment of penalties) is reporting the polluter to GPCB. This is critical: some form of ultimate threat is needed because the association does not have the authority to force plants to pay fines or to close them down. On the other hand, AIA is not keen to report polluters to GPCB because this is a sign of failure, and such reports may lead to inspection not only of the unit but of the whole estate, with dramatic social ramifications if plants are closed, given the high unemployment in the region. In the period studied, up till early 1999, on only three occasions did AIA reported defaulters to GPCB.9 Clearly, GPCB’s response to reports will also be important for the success of AIA’s “voluntary” activities in future monitoring and detection situations.
The major difference between government and AIA monitoring is that the participants themselves have framed the rules in light of the information they have. According to Ostrom (1990, 17), the self-interest of those who have negotiated the rules will lead them to monitor one another and report observed infractions so that the rules are enforced. The agency, however, hires its monitors and thus faces the principal-agent problem of ensuring that they do their job.
5. Monitoring Effectiveness
Successful monitoring should lead to compliance and lower pollution. Unfortunately, the data we have to test for this are incomplete and show only pH and suspended solids of the
9 Source: Personal communication with the executive committee member of AIA on March 6, 1999.

Resources for the Future Kathuria and Sterner
11
effluent from the estate for 1998.10 The sampling point is at Valia Chokdi, after the effluent has been treated by individual units and the common treatment plant, and is at the mouth of the Amlakhadi. AEPS takes three effluent samples a day. Figure 2 gives the monthly averages and extreme values for pH for the month.
Figure 2. Trend and Range of pH during 1998
The figure shows some improvement over the period studied: the effluent has become less acidic.11 This change could be due to (1) stricter regulations through enforcement of penalties; (2) seasonal variation, such as dilution by monsoon rains; or (3) increased publicity leading to behavioral changes in the firms. To get some idea of these effects, a model is formulated that explains the variation in the effluent characteristics in the estate.
The effluent characteristic from a plant in an industrial estate depends on a number of factors, including technology used, production level, abatement, and management attention. Lacking data on production levels or technology, we will assume these are constant during the
10 pH and suspended solids may not be ideal or unique indicators of water pollution, but unfortunately they are the only indicators we have. 11 Data for suspended solids were similar but were not considered for our analysis since CPCB does not stipulate any standard for suspended solids in its designated-best-use water classification.
pH (Average of all three shifts)
1
2
3
4
5
6
7
8
9
Janu
ary 98
Februr
ary 98
March 9
8
April 9
8
May 98
June
98
July
98
Augus
t 98
Septem
ber 9
8
Octobe
r 98
Novem
ber 9
8
Decem
ber 9
8
Month
Ave
rage
val
ue o
f pH
Mean Min. Max.

Resources for the Future Kathuria and Sterner
12
year. The main variable on which we focus is perceived detection probability for discharge of untreated effluent. We assume that evidence of enhanced monitoring will be taken as an indication of a high probability of detection if untreated effluent is discharged. As a consequence, plants will prefer to treat their effluent before discharge rather than risk being caught. Thus effluent quality will be a function of monitoring. We also assume that illegal disposal may be less detectable at certain times of day. Since AEPS takes samples at 8 a.m., 4 p.m., and 12 midnight, corresponding to the three work shifts, we included shift dummies. We are also open to the possibility that dumping may vary by day of the week, depending on details in the schedule of monitoring that are unknown to us but may be known to the plants. Samples are not taken on public holidays; discharge of untreated effluent on these days would be manifested in samples taken immediately after the holiday. To account for this, a holiday dummy is included in the model. Finally, since the samples are taken in a river, water flow will be decisive. Local daily rainfall figures over the year, obtained from the meteorological office in Ahmedabad, should give a good proxy for water flow. To capture other seasonal variations and development over time, monthly dummies and a time trend are included.
Further, there may be short-term effects from one shift to another. Many technical processes involve the use of intermediary storage tanks, and if a tank is emptied in one period, giving high values, the following period may be cleaner. Alternatively, one might also find some form of persistence effect—that is, if the effluent quality is extremely bad in one shift, the effect may persist into the next shift. To capture such effects, a lagged value of the dependent variable is included. Thus, the model to be estimated is
Et = f(Et-1, M, Shift, Weekday, Holiday, Time, Month, Rainfall) (1)
The measure of pollution used is deviation from normal of the acidity or alkalinity of the effluent as measured by its pH. Clean water has a pH of (approximately) 7.0, and deviations either up or down imply the presence of some chemical pollution. Thus, in our analysis, the quality of the
Resources for the Future Kathuria and Sterner
13
effluent (i.e., the dependent variable, Et) has been defined as the deviation from the neutral value of 7: | pH – 7.0 |.12
The most interesting variable is the monitoring plus enforcement in the estate. Each chemical plant is sampled regularly, and if samples exceed the standard, the defaulting units are notified and penalties are imposed. Compliance hinges on the periodicity and effectiveness of enforcement—that is, how frequently fines are imposed and collected. The ideal variable here would have been the firm’s estimate of the perceived likelihood of being fined and of the fines’ being collected. We do not have information on individual fines and much less on expectations. We do know, however, that fines13 have been issued only a very limited number of times; we have the dates of those occasions and the number of notices issued each time. We hypothesize that each such event has a considerable signaling effect within the industrial estate. Since the estate is a close-knit community, the issuance of a notice will be well known to all units. In the days immediately following the highly publicized issuance of notices, the plants will be reminded of AIA’s monitoring efforts and thus be more cautious with their effluent. The variable M has been constructed based on the assumption of adaptive expectations. It is equal to the number of fine letters issued for the three days after the notice is issued and then set equal to zero.14
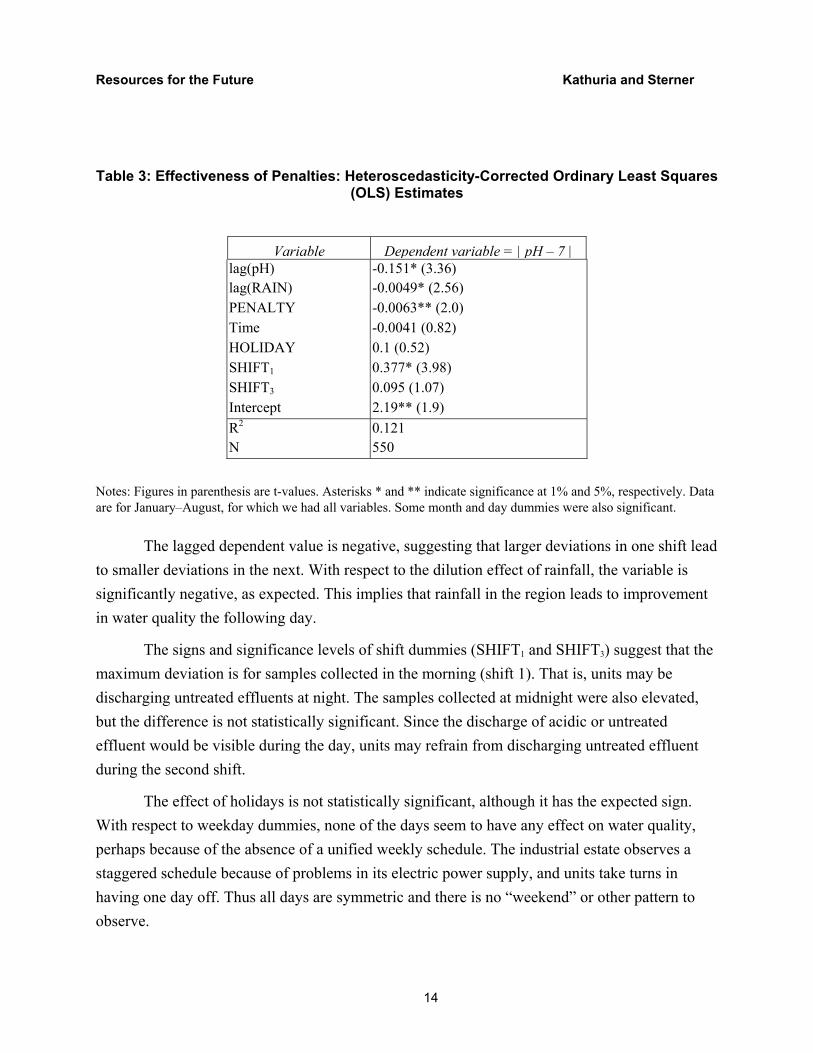
The Breusch-Pagan test gave a chi-square value of 176.41 for 20 degrees of freedom, which is much higher than the tabulated value, thereby indicating the presence of heteroscedasticity in the data.15 The model is thus estimated with White’s (1980) correction for unknown form of heteroscedasticity. Table 3 gives the results for the heteroscedasticity-corrected model.
12 Since pH is in logarithmic scale (a pH of 4 is 10 times as bad as a pH of 5), the ideal measure should have been 10|pH–7.0|, but this introduced considerable heteroscedasticity in the model. We thus used |pH–7.0|, which implies that our model may actually be interpreted as exponential. 13 We have data on penalty letters for chemical oxygen demand violations, but the effluent parameters measured at the end of the estate are pH and suspended solids. We are aware that the relationship between chemical oxygen demand and pH may be very complex, but these were the only data available, and furthermore, fines were assessed only for severe violations that would probably have affected both indicators heavily. 14 Other lags were tested but did not give clearer results. 15 A possible bias could arise from measurement error in the dependent variable. To deal with this, a Probit model was estimated with the dependent variable taking the value 1 if 6.0 ≤ pH ≤7.0 and zero otherwise. The results are not reported, since the predictive power of the model was low. This in turn suggests that a model on the actual values of the dependent variable is preferred.
Resources for the Future Kathuria and Sterner
14
Table 3: Effectiveness of Penalties: Heteroscedasticity-Corrected Ordinary Least Squares (OLS) Estimates
Variable Dependent variable = | pH – 7 | lag(pH) -0.151* (3.36) lag(RAIN) -0.0049* (2.56) PENALTY -0.0063** (2.0) Time -0.0041 (0.82) HOLIDAY 0.1 (0.52) SHIFT1 0.377* (3.98) SHIFT3 0.095 (1.07) Intercept 2.19** (1.9) R2 0.121 N 550
Notes: Figures in parenthesis are t-values. Asterisks * and ** indicate significance at 1% and 5%, respectively. Data are for January–August, for which we had all variables. Some month and day dummies were also significant.
The lagged dependent value is negative, suggesting that larger deviations in one shift lead to smaller deviations in the next. With respect to the dilution effect of rainfall, the variable is significantly negative, as expected. This implies that rainfall in the region leads to improvement in water quality the following day.
The signs and significance levels of shift dummies (SHIFT1 and SHIFT3) suggest that the maximum deviation is for samples collected in the morning (shift 1). That is, units may be discharging untreated effluents at night. The samples collected at midnight were also elevated, but the difference is not statistically significant. Since the discharge of acidic or untreated effluent would be visible during the day, units may refrain from discharging untreated effluent during the second shift.
The effect of holidays is not statistically significant, although it has the expected sign. With respect to weekday dummies, none of the days seem to have any effect on water quality, perhaps because of the absence of a unified weekly schedule. The industrial estate observes a staggered schedule because of problems in its electric power supply, and units take turns in having one day off. Thus all days are symmetric and there is no “weekend” or other pattern to observe.

Resources for the Future Kathuria and Sterner
15
The penalties variable was found to be significant. These results suggest that monitoring, as proxied by penalty notices, does appear to have a deterrence effect in altering the units’ behavior. When periods longer than three days were chosen, however, the effect was weak or absent.
6. Levying and Collecting Fines
The fines serve several purposes: (a) to induce compliance in mitigating the pollution and deter illegal disposal, (b) to remove any competitive advantage for those firms that do not comply, and (c) to finance the current and future monitoring and testing activities of AEPS. The short life of the deterrence effect may be explained by the difficulty of actually collecting the fines. Since having to pay a fine is a more severe punishment than merely receiving notices, the collection rate should show better results, but we have only annual aggregate data on fines collected.
Table 4: Enforcement Effectiveness: Penalties Levied and Recovered by AEPS and AIA
Penalties recovered Year Penalties
levied Amount (Rs.
000) No. (%) % of value
1996–97 150 685 24% 80% 1997–98 196 976 19% 61% 1998–99* 186 1,512 20% 18% Total 532 3,173 111 1,416
Source: AIA (1999). *April through December.
In Table 4, note that though the penalty amounts increase, the collection rate appears to be falling, suggesting some erosion of authority for AIE. The number of observations is too limited to be sure that we are actually observing a trend, but figures point in that direction, with a reduction from 80% to 60% collection between 1996–97 and 1997–98. The figure for 1998–99 is for the first nine months of the financial year 1998–99, and it is conceivable that the firms have tax or other reasons for wishing to postpone payments. Nevertheless, the decline in collection may be attributed to AIA’s and AEPS’s lack of legal authority to impose or collect fines. As a consequence, the defaulting units may not feel obliged to pay.
Although all industries should realize that it is in their common interest to collaborate, since their collective reputation is at stake, compliance depends on voluntary participation. This
Resources for the Future Kathuria and Sterner
16
is a classic Prisoner’s Dilemma situation, and the fall in collections represents a move from an initial collaborative equilibrium to a Nash equilibrium. Once a few firms notice that nothing really bad has happened to the 20% of polluters who did not pay their fines the first year, other firms lose their incentive to collaborate, too.
It is also interesting to consider the distribution of fines and payments between different categories of firms. As Table 4 shows, the percentage of the number of fines collected is much smaller than the percentage of their total value. This suggests that the larger fines, presumably levied on the larger firms, are typically paid, but the collection of small fines appears to be difficult.
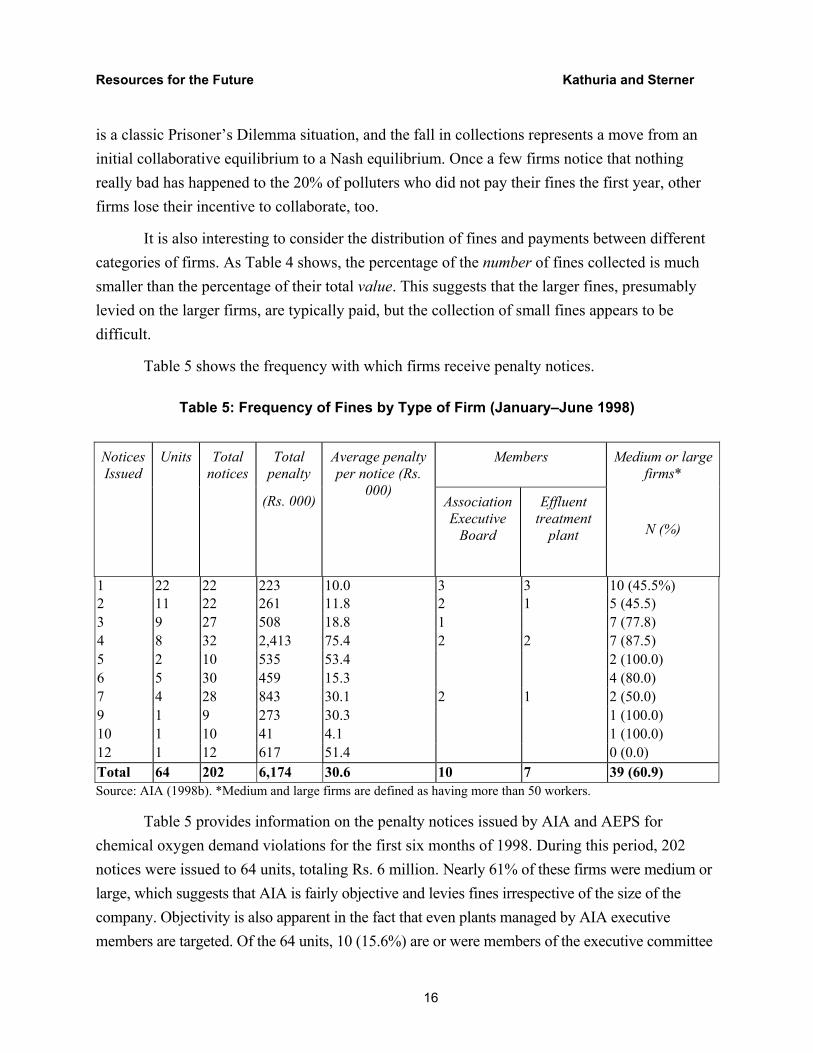
Table 5 shows the frequency with which firms receive penalty notices.
Table 5: Frequency of Fines by Type of Firm (January–June 1998)
Members Medium or large
firms* Notices Issued
Units
Total notices
Total penalty
(Rs. 000)
Average penalty per notice (Rs.
000) Association Executive
Board
Effluent treatment
plant
N (%)
1 22 22 223 10.0 3 3 10 (45.5%) 2 11 22 261 11.8 2 1 5 (45.5) 3 9 27 508 18.8 1 7 (77.8) 4 8 32 2,413 75.4 2 2 7 (87.5) 5 2 10 535 53.4 2 (100.0) 6 5 30 459 15.3 4 (80.0) 7 4 28 843 30.1 2 1 2 (50.0) 9 1 9 273 30.3 1 (100.0) 10 1 10 41 4.1 1 (100.0) 12 1 12 617 51.4 0 (0.0) Total 64 202 6,174 30.6 10 7 39 (60.9) Source: AIA (1998b). *Medium and large firms are defined as having more than 50 workers.
Table 5 provides information on the penalty notices issued by AIA and AEPS for chemical oxygen demand violations for the first six months of 1998. During this period, 202 notices were issued to 64 units, totaling Rs. 6 million. Nearly 61% of these firms were medium or large, which suggests that AIA is fairly objective and levies fines irrespective of the size of the company. Objectivity is also apparent in the fact that even plants managed by AIA executive members are targeted. Of the 64 units, 10 (15.6%) are or were members of the executive committee
Resources for the Future Kathuria and Sterner
17
of AIA at one time or other. One might argue that it is disturbing that plants managed by executive officers of the industrial estate are themselves found to be defaulters. For 12 units (nearly 19%), the default rate was very high, as they were issued at least six notices in as many months16. Interestingly, of these 12 units, one is still holding an executive position in the environment committee of AIA. Our interpretation is, however, the opposite: that there is a fair degree of objectivity and that corruption and nepotism do not appear to characterize the monitoring and enforcement system. That units managed by executive committee members are fined clearly adds to the credibility of the monitoring and compliance efforts.
6. Concluding Remarks
This paper has examined the ability of the Ankleshwar industrial estate and its association to act as an intermediary for government regulators by monitoring and disciplining its own members and building infrastructure for effluent treatment. The provision of these forms of local public goods places considerable demands on the organization to avoid the problems of free riding.
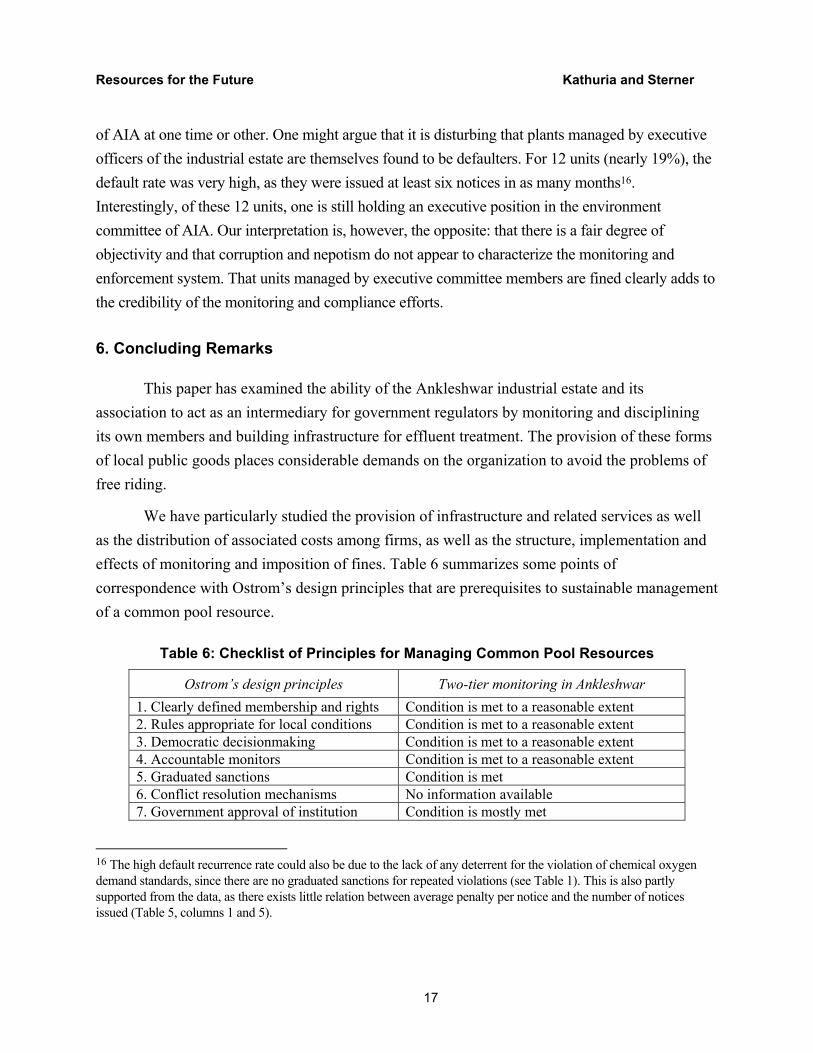
We have particularly studied the provision of infrastructure and related services as well as the distribution of associated costs among firms, as well as the structure, implementation and effects of monitoring and imposition of fines. Table 6 summarizes some points of correspondence with Ostrom’s design principles that are prerequisites to sustainable management of a common pool resource.
Table 6: Checklist of Principles for Managing Common Pool Resources
Ostrom’s design principles Two-tier monitoring in Ankleshwar 1. Clearly defined membership and rights Condition is met to a reasonable extent 2. Rules appropriate for local conditions Condition is met to a reasonable extent 3. Democratic decisionmaking Condition is met to a reasonable extent 4. Accountable monitors Condition is met to a reasonable extent 5. Graduated sanctions Condition is met 6. Conflict resolution mechanisms No information available 7. Government approval of institution Condition is mostly met
16 The high default recurrence rate could also be due to the lack of any deterrent for the violation of chemical oxygen demand standards, since there are no graduated sanctions for repeated violations (see Table 1). This is also partly supported from the data, as there exists little relation between average penalty per notice and the number of notices issued (Table 5, columns 1 and 5).
Resources for the Future Kathuria and Sterner
18
Although usually intended for common pool resources like fishing grounds, the first condition—clearly defined membership—is applicable here because all firms have membership rights within the industrial estate (even though there were conflicts concerning the right of medium and large units to benefit from the common effluent treatment plant, which was built with subsidies intended for small plants). Conditions 2 and 3—rules are appropriate to local conditions and are democratically decided—can also be considered applicable: rules are made by the association members, who are democratically elected by the individual units, and thus the participation is indirect. In practice, larger firms presumably dominate the formulation of rules, and when it came to the costs of effluent treatment, some small firms felt discriminated against.
Condition 4—that monitoring be done by the members themselves or by locally accountable monitors—is clearly fulfilled, as is condition 5, on graduated sanctions. These sanctions may lead to reduced effluents, if only temporarily. The difficulty in getting units to actually pay fines and the lack of legal authority for the association to enforce its penalties, however, cast doubts on the efficacy and long-run sustainability of this system.
Condition 6 concerns conflict resolution, and it is not clear how conflicts among members or between members and the association are to be handled. Last is condition 7—government approval. Though the association is not authorized by the government to monitor and collect fines, there seems to be tacit approval of its efforts. Thus the industrial estate appears to have at least partial backing by the relevant authorities.
Gujarat, and in particular Ankleshwar, figures prominently on the chemical-industrial map of India. It houses a large number of highly polluting industries with few resources or inclination for abatement. The local environmental authorities have a very limited budget and cannot hope to monitor or control pollution effectively. We have here shown that there is some possibility of success in a two-tier arrangement that delegates monitoring to the industry association. However, to supplement the traditional regulatory approach, the association must deal with free riding. The participants in an industrial estate are very heterogeneous and vary greatly in terms of assets, ownership, skills, and size; their owners or managers likewise vary in knowledge, educational background, and ethnicity. Such characteristics might make it more difficult to create the necessary conditions for long-standing collaboration than with traditional common pool resources like fisheries, irrigation canals, or forest meadows.
Our description and analysis of the two-tier monitoring in Ankleshwar has, however, shown than most of the conditions required to manage a common property resource can also exist in an industrial estate setting. Industrial estates wishing to gain collective benefits need to

Resources for the Future Kathuria and Sterner
19
cope with free riding, solve commitment problems, have the backing of institutions, and monitor individual compliance. Though the analysis finds that two-tier monitoring is functional in Ankleshwar, there are still various enforcement difficulties.
The cooperation of large firms in particular may be secured relatively easily by using the threat of public disclosures, since large firms generally value their reputations. They may even be so concerned about the reputation of the whole estate that they help monitor small units to avoid negative publicity for the estate. Olson (1965) argues that voluntary collective action by individuals to achieve their group interest is not possible unless there is coercion or some other device to make individuals behave in the group interest. As we have seen, coercion in the form of fines is indeed a weak point in Ankleshwar. The partial success of the monitoring activity as indicated by our analysis suggests that there is potential for AIE to play the role of an intermediate principal in a two-tier regulation game, but more data and research in this area would be needed to state this authoritatively.
Resources for the Future Kathuria and Sterner
20
References
AIA. 1998a. Ankelshwar Industries Association—Environment Policy for the Year 1998–99. Ankleshwar: AIA, August.
______. 1998b. Ankelshwar Industries Association—Details of Penalty for COD Violation. Ankleshwar: AIA, various months.
______. 1999. Ankelshwar Industries Association—Role in Preservation of Environment. Ankleshwar: AIA.
Bruno, K. 1995. Gujarat's Industrial Sacrifice Zones. Multinational Monitor 16(7,8) July–August.
Central Pollution Control Board (CPCB). 2001. Clean Technology Options in Small Scale Industries. Parivesh: Newsletter. Delhi: CPCB, Ministry of Environment and Forests, July.
Down to Earth. 1998. Hell Hole. N. Delhi 7(14), December 15.
Gorter, P. 1996. Small Industrialists, Big Ambitions. Delhi: Oxford University Press.
Mookherjee, D., and I.P.L. Png. 1992. Monitoring vis-à-vis Investigation in Enforcement of Law. American Economic Review 82(3): 556–65.
Mookherjee, D., and I.P.L. Png. 1995. Corruptible Law Enforcers: How Should They Be Compensated. The Economic Journal 105(January): 145–59.
Olson, M. 1965. The Logic of Collective Action. Cambridge, MA: Harvard University Press.
Ostrom, E. 1990. Governing the Commons. Cambridge, UK: Cambridge University Press.
Pargal, S., and D. Wheeler. 1996. Informal Regulation of Industrial Pollution in Developing Countries: Evidence from Indonesia. Journal of Political Economy 104(6): 1314–27.
Segerson, K. 1988. Uncertainty and Incentives for Non-point Pollution Control. Journal of Environmental Economics and Management 15: 87–98.
Tietenberg, T. 1998. Disclosure Strategies for Pollution Control. Environmental and Resource Economics 11: 587–602.
Wheeler, D., et al. 2000. Greening Industry: New Roles for Communities, Markets and Governments. World Bank Policy Research Report. New York: Oxford University Press.
White, H. 1980. A Heteroscedasticity Consistent Covariance Matrix Estimator and a Direct Test for Heteroscedasticity. Econometrica 48: 817–38.