monica anderson - pew research...
TRANSCRIPT

1
PEW RESEARCH CENTER
www.pewresearch.org
FOR RELEASE October, 29, 2015
BY Monica Anderson
FOR FURTHER INFORMATION
ON THIS REPORT:
Monica Anderson, Research Analyst
Lee Rainie, Director Internet, Science and
Technology Research
Dana Page, Senior Communications Manager
202.419.4372
www.pewresearch.org
RECOMMENDED CITATION: Monica Anderson. “Technology Device Ownership: 2015.” Pew Research Center, October, 2015,
Available at: http://www.pewinternet.org/2015/10/29/technology-device-ownership-2015

2
PEW RESEARCH CENTER
www.pewresearch.org
About This Report
This report is a collaborative effort based on input and analysis from the following individuals.
Find related reports online at pewresearch.org/internet.
Monica Anderson, Research Analyst
Lee Rainie, Director, Internet, Science, and Technology Research
Aaron Smith, Associate Director, Internet, Science, and Technology Research
Maeve Duggan, Research Associate
Andrew Perrin, Research Assistant
Dana Page, Senior Communications Manager
Margaret Porteus, Information Graphics Designer
Shannon Greenwood, Assistant Digital Producer
About Pew Research Center
Pew Research Center is a nonpartisan fact tank that informs the public about the issues, attitudes
and trends shaping America and the world. It does not take policy positions. The center conducts
public opinion polling, demographic research, content analysis and other data-driven social
science research. It studies U.S. politics and policy; journalism and media; internet, science and
technology; religion and public life; Hispanic trends; global attitudes and trends; and U.S. social
and demographic trends. All of the center’s reports are available at www.pewresearch.org. Pew
Research Center is a subsidiary of The Pew Charitable Trusts, its primary funder.
© Pew Research Center 2015

3
PEW RESEARCH CENTER
www.pewresearch.org
Summary of Findings
Today, 68% of U.S. adults have a smartphone, up from 35% in 2011, and tablet computer
ownership has edged up to 45% among adults, according to newly released survey data from the
Pew Research Center.1 Smartphone ownership is nearing the saturation point with some groups:
86% of those ages 18-29 have a smartphone, as do 83% of those ages 30-49 and 87% of those
living in households earning $75,000 and up annually.
At the same time, the surveys suggest the adoption of some digital devices has slowed and even
declined in recent years.
1 Smartphone data are based on a Pew Research Center survey conducted June 10-July 12, 2015; all other data are from a March 17-April
12, 2015 survey.
Smartphones, Tablets Grew in Recent Years; Other Devices Declined or Stayed Flat
% of U.S. adults who own the following devices
Source: Pew Research Center survey conducted March 17-April 12, 2015. Smartphone data based on Pew Research survey conducted June
10-July 12, 2015. Trend data are from previous Pew Research surveys.
PEW RESEARCH CENTER

4
PEW RESEARCH CENTER
www.pewresearch.org
For example, e-reader device ownership has fallen. Today, about one-in-five adults (19%) report
owning an e-reader, while in early 2014 that share was a third (32%). Ownership of MP3 players
has not had a notable decline, but the percentage of adults who own one has hovered around the
40% mark since 2008. And computer ownership levels have stayed roughly where they were a
decade ago. These changes are all taking place in a world where smartphones are transforming
into all-purpose devices that can take the place of specialized technology, such as music players, e-
book readers and gaming devices. Some of the changes in device ownership patterns are
particularly evident for young adults. Among those ages 18-29, ownership of MP3 players and
computers has declined by double digits in the past five years. In 2010, three-quarters of 18- to 29-
year-olds owned an MP3 player; by 2015, only half (51%) had one.
There is a similar pattern with
computer ownership. Today,
78% of adults under 30 own a
laptop or desktop computer,
compared with 88% who did so
in 2010. Smartphone
ownership, on the other hand,
has surpassed both of these
devices, with 86% of 18- to 29-
year-olds owning one in 2015.
In other words, as smartphones
came to prominence several
years ago, younger owners
perhaps did not feel as much of
a need as their older peers to
have other kinds of devices.
MP3, Computer Ownership Has Dropped Among
Younger Adults Since 2010
% of U.S. adults ages 18-29 who own the following devices
2010 2011 2012 2013 2014 2015
Cellphone 96 95 93 97 98 98
Computer 88 88 89 - - 78
MP3 player 75 71 - 62 - 51
Game console 62 - - 71 - 56
Smartphone - 52 65 79 85 86
Tablet computer 5 13 32 36 48 50
E-book reader 5 8 27 24 28 18
Source: Pew Research Center surveys conducted 2000-15. Dashes represent
years when these questions were not asked.
PEW RESEARCH CENTER
5
PEW RESEARCH CENTER
www.pewresearch.org
92
73
68
45
40
40
19
14
Cellphone, including
smartphones
Tablet computer
Game console
E-book reader
Desktop/laptop computer
MP3 player
Portable gaming device
Smartphone
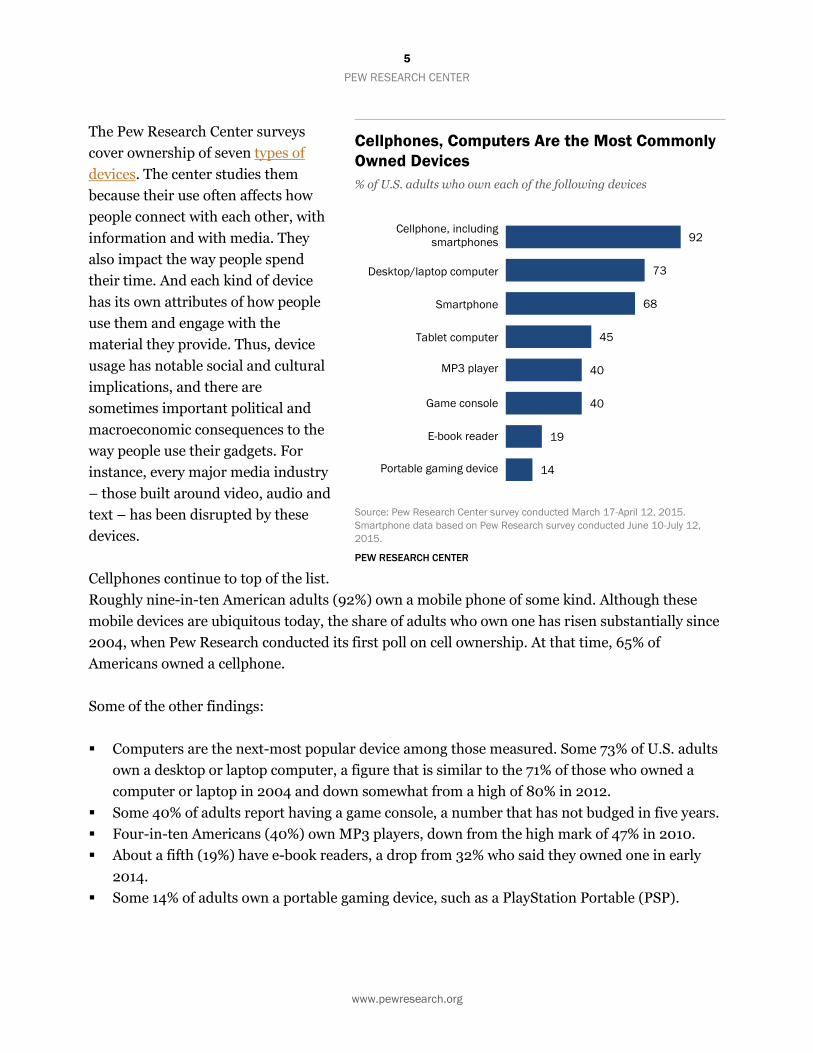
The Pew Research Center surveys
cover ownership of seven types of
devices. The center studies them
because their use often affects how
people connect with each other, with
information and with media. They
also impact the way people spend
their time. And each kind of device
has its own attributes of how people
use them and engage with the
material they provide. Thus, device
usage has notable social and cultural
implications, and there are
sometimes important political and
macroeconomic consequences to the
way people use their gadgets. For
instance, every major media industry
– those built around video, audio and
text – has been disrupted by these
devices.
Cellphones continue to top of the list.
Roughly nine-in-ten American adults (92%) own a mobile phone of some kind. Although these
mobile devices are ubiquitous today, the share of adults who own one has risen substantially since
2004, when Pew Research conducted its first poll on cell ownership. At that time, 65% of
Americans owned a cellphone.
Some of the other findings:
Computers are the next-most popular device among those measured. Some 73% of U.S. adults
own a desktop or laptop computer, a figure that is similar to the 71% of those who owned a
computer or laptop in 2004 and down somewhat from a high of 80% in 2012.
Some 40% of adults report having a game console, a number that has not budged in five years.
Four-in-ten Americans (40%) own MP3 players, down from the high mark of 47% in 2010.
About a fifth (19%) have e-book readers, a drop from 32% who said they owned one in early
2014.
Some 14% of adults own a portable gaming device, such as a PlayStation Portable (PSP).
Cellphones, Computers Are the Most Commonly
Owned Devices
% of U.S. adults who own each of the following devices
Source: Pew Research Center survey conducted March 17-April 12, 2015.
Smartphone data based on Pew Research survey conducted June 10-July 12,
2015.
PEW RESEARCH CENTER

6
PEW RESEARCH CENTER
www.pewresearch.org
The analysis in this report is based mostly on telephone interviews conducted March 17 through
April 12, 2015, among a national sample of 1,907 adults ages 18 and older living in all 50 U.S.
states and the District of Columbia. Of these respondents, 672 were interviewed on a landline
telephone, and 1,235 were interviewed on a cellphone, including 730 who had no landline
telephone.
Of the full sample, 1,612 are internet users. The margin of sampling error for results based on the
full sample is plus or minus 2.6 percentage points. Because many items were based on half
samples, results based on internet users in this report have a margin of error of plus or minus 4.0
percentage points. Results based on smartphone owners come from a survey conducted between
June 10 and July 12, 2015. They have a margin of error of plus or minus 3.1 percentage points. See
the Methods section at the end of this report for more details.

7
PEW RESEARCH CENTER
www.pewresearch.org
The Demographics of Device Ownership
From getting news to playing games to reading a book, Americans now have a plethora of devices
to choose from in order to meet their technology-based needs. For each type of device, the
demographic makeup of owners can vary widely, so this section looks at these differences.
The rise of the smartphone has had a major social,
political and cultural impact. It has changed the way
people reach their friends, obtain data and media, and
share their lives. Fully 68% of adults now have a
smartphone, nearly double the share that Pew Research
Center measured in its first survey on smartphone
ownership in mid-2011. At that point, 35% of adults had
smartphones.
More than half of most demographic groups have a
smartphone. Only those ages 65 and older (30% of whom
own smartphones) and those who do not have a high
school education (41% own smartphones) fall below
majority ownership. On the other hand, those ages 18 to
49 and those in higher-income households are coming
closer and closer to saturation adoption. There are no
differences in smartphone ownership among different
racial and ethnic groups.
Smartphone Owners More Likely
to be Younger, More Affluent
and Highly Educated
% of U.S. adults who own a smartphone, e.g.
iPhone, Android, Blackberry or Windows
phone
U.S. adults 68
Sex
Men 70
Women 66
Race/ethnicity
White 66
Black 68
Hispanic 64
Age group
18-29 86
30-49 83
50-64 58
65+ 30
Household income
<$30K 52
$30K-$49,999 69
$50K-$74,999 76
$75K+ 87
Educational attainment
Less than high school 41
High school 56
Some college 75
College+ 81
Community type
Urban 72
Suburban 70
Rural 52
Source: Pew Research Center survey conducted June
10-July 12, 2015. Whites and blacks include only non-
Hispanics. N=2,001.
PEW RESEARCH CENTER

8
PEW RESEARCH CENTER
www.pewresearch.org
Fully 92% of American adults own a cellphone, which is
similar to the 90% of the public who reported owning
these mobile devices in 2014. Although cellphones are
common today, the share of adults who own one has
risen substantially since 2004, when 65% of Americans
owned a mobile phone.
Cellphone ownership is common across all major
demographic groups, though older adults tend to lag
behind their younger counterparts. Some 78% of adults
ages 65 and older own a cellphone, compared with 98%
of 18- to 29-year-olds. Lower-income adults are less
likely to own a cellphone. Rural residents are slightly
less likely than urban and suburban residents to have
cellphones. Still, nearly nine-in-ten rural residents
(87%) have them.
Cellphone Ownership Is Common
Across All Major Demographic
Groups
% of U.S. adults who own a cellphone
U.S. adults 92
Sex
Men 92
Women 92
Race/ethnicity
White 91
Black 94
Hispanic 92
Age group
18-29 98
30-49 96
50-64 90
65+ 78
Household income
<$30K 86
$30K-$49,999 94
$50K-$74,999 91
$75K+ 98
Educational attainment
Less than high school 86
High school 90
Some college 93
College+ 95
Community type
Urban 94
Suburban 92
Rural 87
Source: Pew Research Center survey conducted March
17-April 12, 2015. Whites and blacks include only non-
Hispanics. N=1,907
PEW RESEARCH CENTER

9
PEW RESEARCH CENTER
www.pewresearch.org
4%
10
24
35
42 45
2010 2011 2012 2013 2014 2015
The share of Americans who own a tablet
computer has risen tenfold since 2010. Today,
45% of U.S. adults own a tablet – a substantial
increase since Pew Research Center began
measuring tablet ownership in 2010. Then,
only 4% of adults in the U.S. were tablet
owners. Ownership, however, is statistically
the same as it was in 2014.
Tablet Ownership, 2010-15
% of U.S. adults that own a tablet computer, e.g. iPad,
Samsung Galaxy Tab, Google Nexus or Kindle Fire
Source for current survey: Pew Research Center survey conducted
March 17-April 12, 2015.
PEW RESEARCH CENTER
10
PEW RESEARCH CENTER
www.pewresearch.org
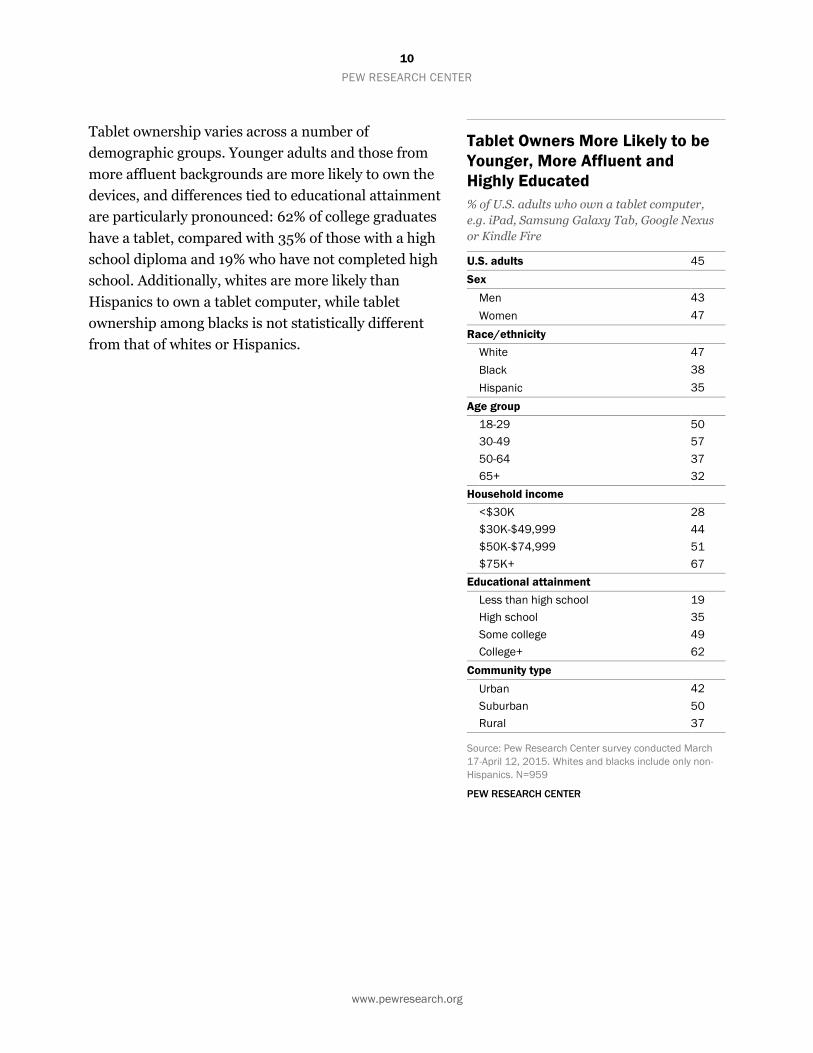
Tablet ownership varies across a number of
demographic groups. Younger adults and those from
more affluent backgrounds are more likely to own the
devices, and differences tied to educational attainment
are particularly pronounced: 62% of college graduates
have a tablet, compared with 35% of those with a high
school diploma and 19% who have not completed high
school. Additionally, whites are more likely than
Hispanics to own a tablet computer, while tablet
ownership among blacks is not statistically different
from that of whites or Hispanics.
Tablet Owners More Likely to be
Younger, More Affluent and
Highly Educated
% of U.S. adults who own a tablet computer,
e.g. iPad, Samsung Galaxy Tab, Google Nexus
or Kindle Fire
U.S. adults 45
Sex
Men 43
Women 47
Race/ethnicity
White 47
Black 38
Hispanic 35
Age group
18-29 50
30-49 57
50-64 37
65+ 32
Household income
<$30K 28
$30K-$49,999 44
$50K-$74,999 51
$75K+ 67
Educational attainment
Less than high school 19
High school 35
Some college 49
College+ 62
Community type
Urban 42
Suburban 50
Rural 37
Source: Pew Research Center survey conducted March
17-April 12, 2015. Whites and blacks include only non-
Hispanics. N=959
PEW RESEARCH CENTER

11
PEW RESEARCH CENTER
www.pewresearch.org
Some 19% of adults report owning an e-reader – a
handheld device such as a Kindle or Nook primarily
used for reading e-books. This is a sizable drop from
early 2014, when 32% of adults owned this type of
device. Ownership of e-readers is somewhat more
common among women (22%) than men (15%). Whites
are more likely than blacks and Hispanics to own an e-
reading device, while ownership also tends to be higher
among those who are more affluent and those with more
education.
E-reader Ownership Differs by
Gender, Income, Education, Race
and Ethnicity
% of U.S. adults who own an e-book, e.g. a Nook
or Kindle e-reader
U.S. adults 19
Sex
Men 15
Women 22
Race/ethnicity
White 21
Black 13
Hispanic 14
Age group
18-29 18
30-49 19
50-64 19
65+ 19
Household income
<$30K 14
$30K-$49,999 16
$50K-$74,999 22
$75K+ 27
Educational attainment
Less than high school 4
High school 13
Some college 24
College+ 25
Community type
Urban 20
Suburban 18
Rural 19
Source: Pew Research Center survey conducted March
17-April 12, 2015. Whites and blacks include only non-
Hispanics. N=959
PEW RESEARCH CENTER

12
PEW RESEARCH CENTER
www.pewresearch.org
Ownership for traditional computers has remained
stable. Some 73% of U.S. adults own a desktop or laptop
computer. This figure has fluctuated a bit in Pew
Research findings over the years, but the 2015 finding is
roughly similar to computer ownership levels of a
decade ago – though slightly down from a high in 2012,
when 80% of Americans said they had a desktop or
laptop.
College graduates and those from higher-income
households are particularly likely to own a computer.
There are also differences based on age as well as race
and ethnicity, with younger groups more likely than
their older counterparts to report owning a laptop or
desktop, and whites (79%) more likely than Hispanics
(63%) and blacks (45%) to own one.
Computer Ownership Varies
Greatly by Race and Ethnicity,
Household Income and
Educational Attainment
% of U.S. adults who own a desktop or laptop
computer
U.S. adults 73
Sex
Men 74
Women 71
Race/ethnicity
White 79
Black 45
Hispanic 63
Age group
18-29 78
30-49 81
50-64 70
65+ 55
Household income
<$30K 50
$30K-$49,999 80
$50K-$74,999 90
$75K+ 91
Educational attainment
Less than high school 29
High school 63
Some college 81
College+ 90
Community type
Urban 67
Suburban 78
Rural 67
Source: Pew Research Center survey conducted March
17-April 12, 2015. Whites and blacks include only non-
Hispanics. N=959
PEW RESEARCH CENTER

13
PEW RESEARCH CENTER
www.pewresearch.org
Game console ownership has remained consistent since
Pew Research last polled about the device in 2010.
Today, 40% of adults report having a game console such
as an Xbox or PlayStation. Those whose households
earn less than $30,000 annually are less likely to own a
game console – a third have one, compared with 54% of
adults from households earning $75,000 or more a year.
There are also differences by educational attainment –
54% of adults who have some college experience own a
game console, a higher share than college graduates
(37%), high school graduates (35%) and those who have
less than a high school diploma (21%). Younger adults
are also more likely than their elders to own a game
console, while there are no differences based on gender
or race and ethnicity.
Four-in-Ten American Adults Have
a Game Console; Ownership
Varies by Age, Household Income
and Education
% of U.S. adults who own a game console, e.g.
Xbox or PlayStation
U.S. adults 40
Sex
Men 37
Women 42
Race/ethnicity
White 39
Black 43
Hispanic 45
Age group
18-29 56
30-49 55
50-64 30
65+ 8
Household income
<$30K 33
$30K-$49,999 43
$50K-$74,999 50
$75K+ 54
Educational attainment
Less than high school 21
High school 35
Some college 54
College+ 37
Community type
Urban 41
Suburban 41
Rural 34
Source: Pew Research Center survey conducted March
17-April 12, 2015. Whites and blacks include only non-
Hispanics. N=948
PEW RESEARCH CENTER
14
PEW RESEARCH CENTER
www.pewresearch.org
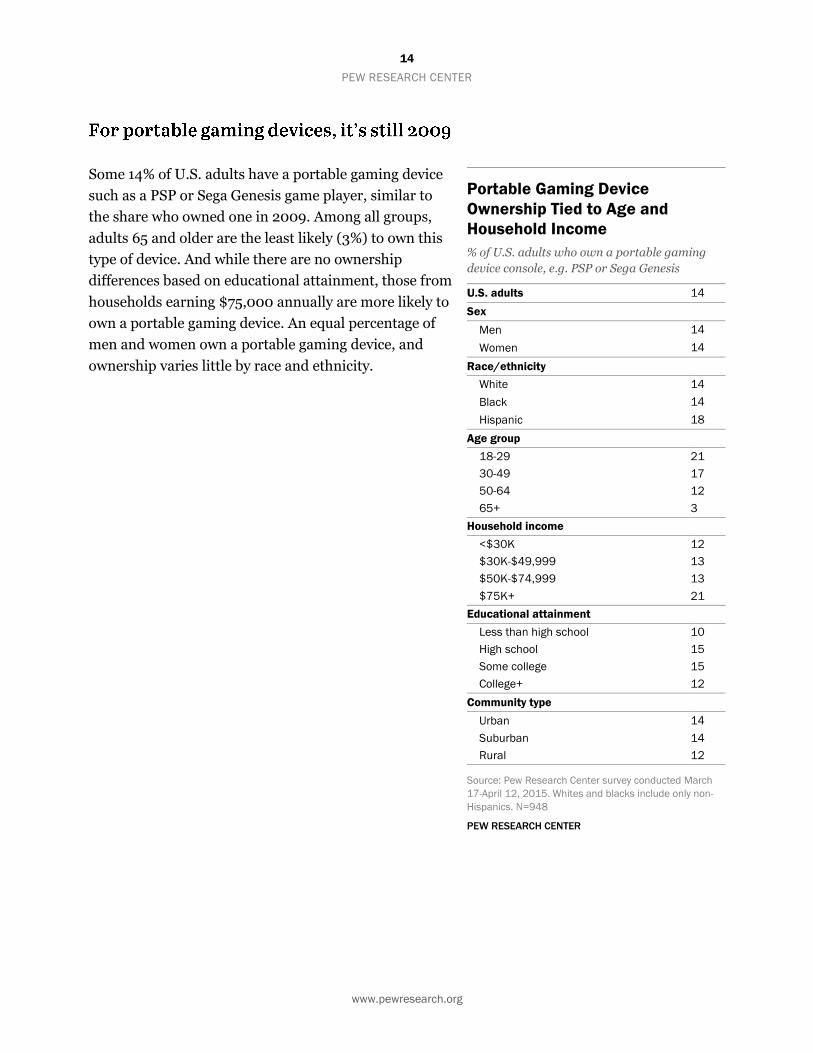
Some 14% of U.S. adults have a portable gaming device
such as a PSP or Sega Genesis game player, similar to
the share who owned one in 2009. Among all groups,
adults 65 and older are the least likely (3%) to own this
type of device. And while there are no ownership
differences based on educational attainment, those from
households earning $75,000 annually are more likely to
own a portable gaming device. An equal percentage of
men and women own a portable gaming device, and
ownership varies little by race and ethnicity.
Portable Gaming Device
Ownership Tied to Age and
Household Income
% of U.S. adults who own a portable gaming
device console, e.g. PSP or Sega Genesis
U.S. adults 14
Sex
Men 14
Women 14
Race/ethnicity
White 14
Black 14
Hispanic 18
Age group
18-29 21
30-49 17
50-64 12
65+ 3
Household income
<$30K 12
$30K-$49,999 13
$50K-$74,999 13
$75K+ 21
Educational attainment
Less than high school 10
High school 15
Some college 15
College+ 12
Community type
Urban 14
Suburban 14
Rural 12
Source: Pew Research Center survey conducted March
17-April 12, 2015. Whites and blacks include only non-
Hispanics. N=948
PEW RESEARCH CENTER

15
PEW RESEARCH CENTER
www.pewresearch.org
While MP3 player ownership grew rapidly in the mid-
2000s, the percentage of Americans who own one has
not changed significantly in recent years.
The percentage of Americans who own an iPod or
another brand of MP3 player has changed little since
2013 (the last time Pew Research polled on ownership of
this device). Today, 40% of U.S. adults have an iPod or
other MP3 player; in 2013, that share was 43%. While
there are no differences based on gender or race and
ethnicity, ownership does vary by age, education and
household income. Older Americans are especially
unlikely to own an MP3 player – only 13% have this type
of device.
Four-in-Ten Adults Own an MP3
Player
% of U.S. adults who own an iPod or other MP3
player
U.S. adults 40
Sex
Men 38
Women 42
Race/ethnicity
White 41
Black 34
Hispanic 40
Age group
18-29 51
30-49 51
50-64 37
65+ 13
Household income
<$30K 26
$30K-$49,999 43
$50K-$74,999 46
$75K+ 63
Educational attainment
Less than high school 21
High school 25
Some college 47
College+ 56
Community type
Urban 42
Suburban 42
Rural 30
Source: Pew Research Center survey conducted March
17-April 12, 2015. Whites and blacks include only non-
Hispanics. N=948
PEW RESEARCH CENTER

16
PEW RESEARCH CENTER
www.pewresearch.org
Methods
The analysis in this report is based on two Pew
Research Center surveys. One survey was
conducted March 17 through April 12, 2015,
among a national sample of 1,907 adults, ages
18 and older, living in all 50 U.S. states and the
District of Columbia. 672 respondents were
interviewed on a landline telephone, and 1,235
were interviewed on a cellphone, including 730
who had no landline telephone. The full survey
included interviews with respondents ages 16
and 17; the 1,907 respondents in this analysis
include only those 18 and older. The survey was
conducted by interviewers at Princeton Data
Source under the direction of Princeton Survey
Research Associates International. The
smartphone ownership data are based on
telephone interviews conducted June 10
through July 12, 2015, among a national sample
of 2,001 adults, ages 18 years and older, living
in all 50 U.S. states and the District of
Columbia. 701 respondents were interviewed on
a landline telephone, and 1,300 were
interviewed on a cellphone, including 709 who
had no landline telephone.
A combination of landline and cellphone
random-digit dial samples were used; both
samples were provided by Survey Sampling
International. Interviews were conducted in
English and Spanish. Respondents in the
landline sample were selected by randomly
asking for the youngest adult male or female who was at home. Interviews in the cellphone sample
were conducted with the person who answered the phone, if that person was 16 years of age or older.
Margin of Error
Group Unweighted sample Size
Margin of error in percentage points
U.S. adults 1,907 +/-2.6
Form A adults 959 +/-3.6
Form B adults 948 +/-3.7
Men 921 +/-3.7
Women 986 +/-3.6
18-29 349 +/-6.0
30-49 510 +/-5.0
50-64 560 +/-4.8
65+ 488 +/-5.1
White, non-Hispanic 1,268 +/-3.2
Black, non-Hispanic 232 +/-7.4
Hispanic 266 +/-6.9
Less than high school 181 +/-8.4
High school diploma 541 +/-4.8
Some college 489 +/-5.1
College+ 687 +/-4.3
Less than $30,000/yr. 604 +/-4.6
$30,000-49,999 300 +/-6.5
$50,000-$74,999 225 +/-7.5
$75,000 or more 494 +/-5.1
Source: Pew Research Center survey conducted March 17-April 12,
2015
PEW RESEARCH CENTER

17
PEW RESEARCH CENTER
www.pewresearch.org
The combined landline and cellphone samples
are weighted using an iterative technique that
matches gender, age, education, race, Hispanic
origin and nativity, and region to parameters
from the 2013 Census Bureau’s American
Community Survey and population density to
parameters from the Decennial Census. The
sample also is weighted to match current
patterns of telephone status (landline only,
cellphone only or both landline and cellphone),
based on extrapolations from the 2014 National
Health Interview Survey. The weighting
procedure also accounts for the fact that
respondents with both landline and cellphones
have a greater probability of being included in
the combined sample and adjusts for household
size among respondents with a landline phone.
The margins of error reported and statistical
tests of significance are adjusted to account for
the survey’s design effect, a measure of how
much efficiency is lost from the weighting
procedures.
These tables show the unweighted sample sizes
and the error attributable to sampling that
would be expected at the 95% level of
confidence for different groups in the survey:
In addition to sampling error, one should bear in mind that question wording and practical
difficulties in conducting surveys can introduce error or bias into the findings of opinion polls.
Pew Research Center is a nonprofit, tax-exempt 501(c)(3) organization and a subsidiary of The
Pew Charitable Trusts, its primary funder.
Margin of Error for Smartphone Data
Group Unweighted sample size
Margin of error in percentage points
U.S. adults 2,001 +/-2.5
Men 989 +/-3.6
Women 1,012 +/-3.5
18-29 325 +/-6.2
30-49 526 +/-4.9
50-64 593 +/-4.6
65+ 513 +/-5.0
White, non-Hispanic 1,384 +/-3.0
Black, non-Hispanic 219 +/-7.6
Hispanic 255 +/-7.0
Less than high school 152 +/-9.1
High school diploma 483 +/-5.1
Some college 523 +/-4.9
College+ 823 +/-3.9
Less than $30,000/yr. 524 +/-4.9
$30,000-49,999 329 +/-6.2
$50,000-$74,999 275 +/-6.8
$75,000 or more 568 +/-4.7
Source: Pew Research Center survey conducted June 10-July 12,
2015.
PEW RESEARCH CENTER

18
PEW RESEARCH CENTER
www.pewresearch.org
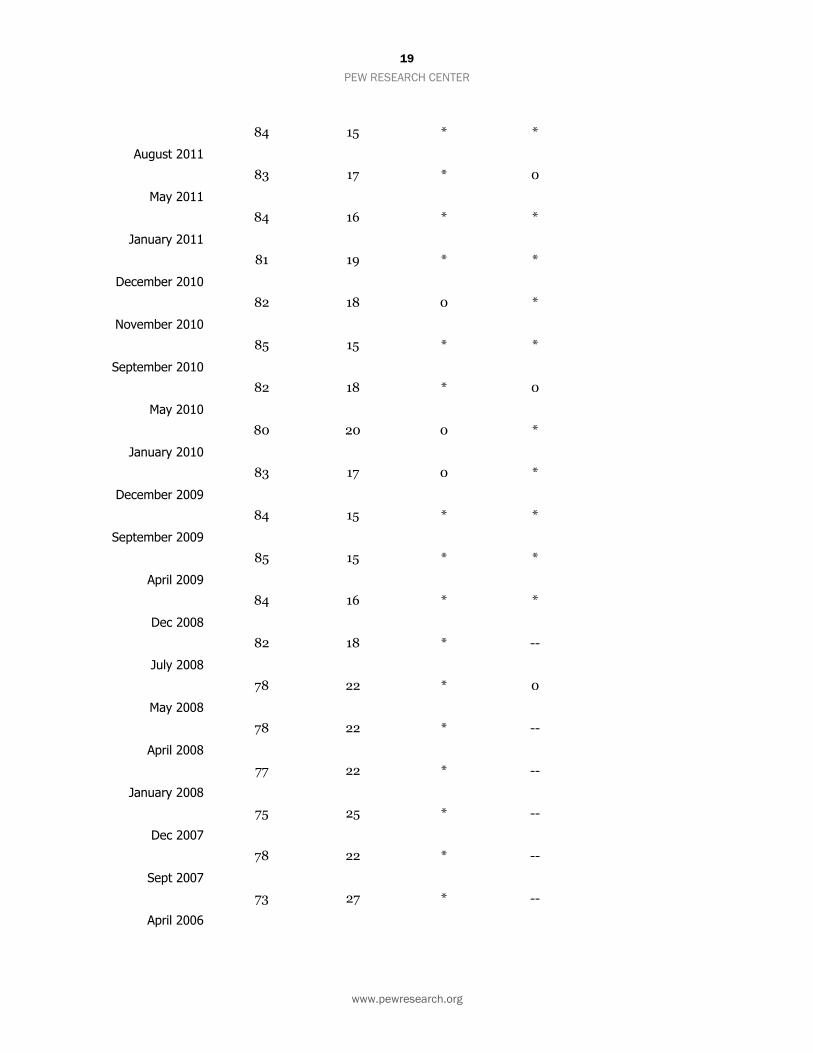
DEVICE1a Next, do you have a cell phone, or not?2
Based on all adults [n=1907]
2 Question was asked of landline sample only. Results shown here have been recalculated to include cell phone sample in the "Yes"
percentage. Beginning September 2007, question/item was not asked of the cell phone sample, but trend results shown here reflect Total
combined Landline and cell phone sample. In past polls, question was sometimes asked as an independent question and sometimes as an
item in a series. Wording may vary from survey to survey. Wording variations include: “Do you have a cell phone or a Blackberry or iPhone or
other device that is also a cell phone?”; “Do you have...a cell phone or a Blackberry or iPhone or other handheld device that is also a cell
phone?”; Do you have a cell phone, or a Blackberry or other device that is also a cell phone?"; "Do you happen to have a cell phone?"; " “Do
you have a cell phone?”
YES NO
(VOL.) DON’T
KNOW (VOL.) REFUSED
Current
92 8 * 0
Sept 2013
91 9 0 0
August 2013
89 11 0 0
May 2013
91 9 0 *
December 2012
87 13 * 0
November 2012
85 15 0 *
Sept 2012
85 15 * 0
August 2012
89 10 0 *
April 2012
88 12 * *
February 2012
88 12 0 *
December 2011
87 13 0 *
19
PEW RESEARCH CENTER
www.pewresearch.org
August 2011
84 15 * *
May 2011
83 17 * 0
January 2011
84 16 * *
December 2010
81 19 * *
November 2010
82 18 0 *
September 2010
85 15 * *
May 2010
82 18 * 0
January 2010
80 20 0 *
December 2009
83 17 0 *
September 2009
84 15 * *
April 2009
85 15 * *
Dec 2008
84 16 * *
July 2008
82 18 * --
May 2008
78 22 * 0
April 2008
78 22 * --
January 2008
77 22 * --
Dec 2007
75 25 * --
Sept 2007
78 22 * --
April 2006
73 27 * --

20
PEW RESEARCH CENTER
www.pewresearch.org
January 2005
66 34 * --
Nov. 23-30, 2004
65 35 * --

21
PEW RESEARCH CENTER
www.pewresearch.org
SMART1 Some cell phones are called “smartphones” because of certain features they have. Is your cell phone a smartphone such as an iPhone, Android, Blackberry or Windows phone, or are you not sure?3
Based on cell phone owners
YES,
SMARTPHONE NO, NOT A
SMARTPHONE NOT SURE/
DON’T KNOW (VOL.) REFUSED
Current [N=1,903] 73 20 7 *
April 2015 [N=1,900] 73 21 5 *
September 2013 [N=5,763] 61 32 7 *
August 2013 [N=1,636] 60 33 6 *
May 2013 [N=2,076] 55 39 5 *
December 2012 [N=1,954] 52 41 6 *
November 2012 [N=1,992] 55 38 6 *
September 2012 [N=2,581] 53 40 6 *
April 2012 [N=1,954] 46 44 10 *
February 2012 [N=1,961] 45 46 8 *
May 2011 [N=1,914] 33 53 14 *
DEVICE1 Please tell me if you happen to have each of the following items, or not. Do you have... [INSERT ITEMS IN ORDER]?
Based on all adults [n=959]
YES NO (VOL.) DON’T
KNOW (VOL.)
REFUSED
3 Wording may vary from survey to survey. Wording variations include: “Some cell phones are called “smartphones” because of certain
features they have. Is your cell phone a smartphone, such as an iPhone, Android, Blackberry or Windows phone, or are you not sure?”; "Some
cell phones are called “smartphones” because of certain features they have. Is your cell phone a smartphone or not, or are you not sure?"

22
PEW RESEARCH CENTER
www.pewresearch.org
Items B-D: Based on Form A
b. A handheld device made primarily for e-book reading, such as a Nook or Kindle e-
reader but NOT a Kindle Fire4
Current
19 80 1 *
January 2014
32 68 * *
September 2013
24 75 1 *
November 2012
19 80 * 0
April 2012
18 81 1 *
February 2012
14 86 * *
December 2011
10 89 1 *
August 2011
9 90 * *
May 2011
12 88 * 0
November 2010
6 94 * *
September 2010
5 95 * *
May 2010
4 96 * *
September 2009
3 97 * *
April 2009
2 98 * *
DEVICE1 continued...
4 From 2012-2013, item wording was “A handheld device made primarily for e-book reading, such as a Nook or Kindle e-reader”. In 2011,
item wording was “An electronic Book device or e-Book reader, such as a Kindle or Nook.” Through November 2010, item wording was “An
electronic book device or e-Book reader, such as a Kindle or Sony Digital Book”.
23
PEW RESEARCH CENTER
www.pewresearch.org
YES NO (VOL.) DON’T
KNOW (VOL.)
REFUSED
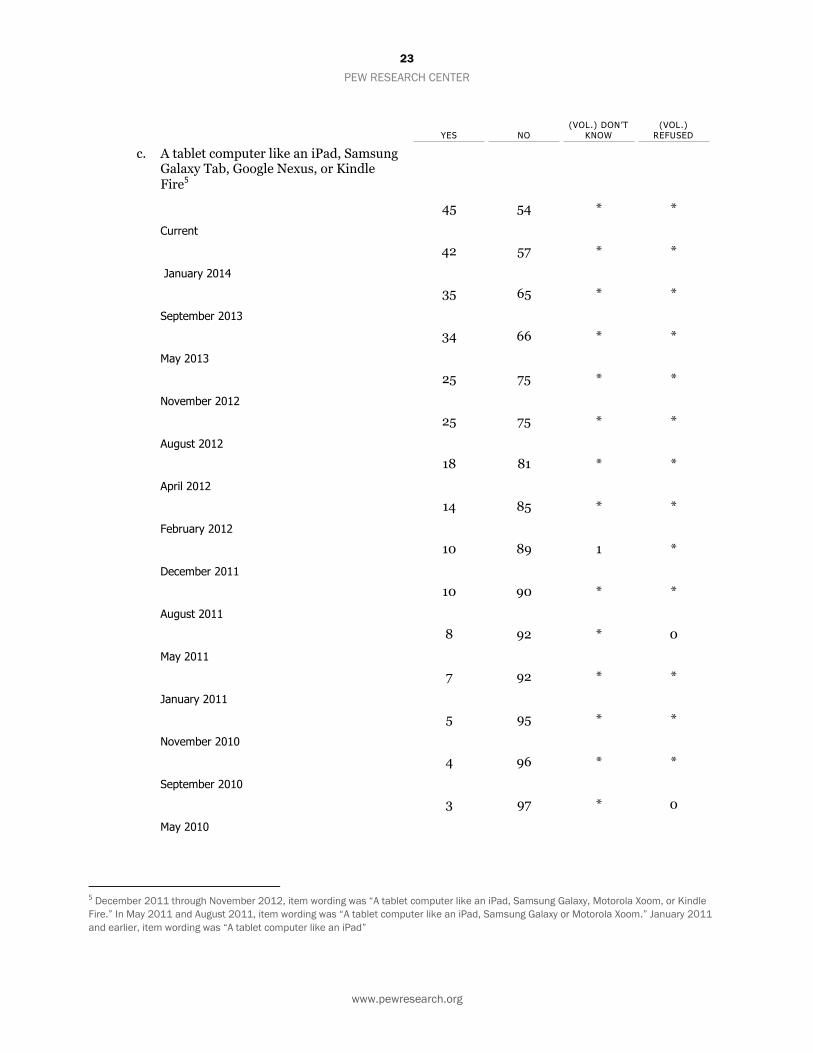
c. A tablet computer like an iPad, Samsung Galaxy Tab, Google Nexus, or Kindle Fire5
Current
45 54 * *
January 2014
42 57 * *
September 2013
35 65 * *
May 2013
34 66 * *
November 2012
25 75 * *
August 2012
25 75 * *
April 2012
18 81 * *
February 2012
14 85 * *
December 2011
10 89 1 *
August 2011
10 90 * *
May 2011
8 92 * 0
January 2011
7 92 * *
November 2010
5 95 * *
September 2010
4 96 * *
May 2010
3 97 * 0
5 December 2011 through November 2012, item wording was “A tablet computer like an iPad, Samsung Galaxy, Motorola Xoom, or Kindle
Fire.” In May 2011 and August 2011, item wording was “A tablet computer like an iPad, Samsung Galaxy or Motorola Xoom.” January 2011
and earlier, item wording was “A tablet computer like an iPad”

24
PEW RESEARCH CENTER
www.pewresearch.org
d. A desktop or laptop computer6
Current
73 27 0 *
November 2012
78 22 * *
April 2012
80 20 * *
December 2011
75 25 * *
August 2011
76 24 * *
May 2011
77 22 * *
November 2010
77 23 0 *
September 2010
76 24 * *
May 2010
79 21 * 0
January 2010
74 26 0 *
December 2009
73 27 * *
September 2009
75 25 * *
April 2009
78 22 * *
April 2008
74 26 * --
Dec 2007
75 25 * --
April 2006
72 27 * --
DEVICE1 continued...
6 In past polls, “A desktop computer” and “A laptop computer or netbook” were asked as separate items in the list. Results shown here have
been recalculated to combine responses for trend purposes.

25
PEW RESEARCH CENTER
www.pewresearch.org
YES NO (VOL.) DON’T
KNOW (VOL.)
REFUSED
Items E-G: Based on Form B
Based on all adults [n=948]
e. A game console like Xbox or Play Station
40 60 * 0
Current
41 59 * *
November 2010
38 62 * *
September 2010
42 57 * *
May 2010
42 58 * *
September 2009
37 63 * *
April 2009
41 59 * *
f. An iPod or other MP3 player7
Current
40 60 * 0
May 2011
44 56 * *
November 2010
43 57 * *
September 2010
47 53 * *
May 2010
46 54 * 0
September 2009
43 57 * 0
April 2009
45 55 * *
7 Through February 2005, question was not asked as part of a series. Question wording as follows: “Do you have an iPod or other MP3 player
that stores and plays music files, or do you not have one of these?”
26
PEW RESEARCH CENTER
www.pewresearch.org
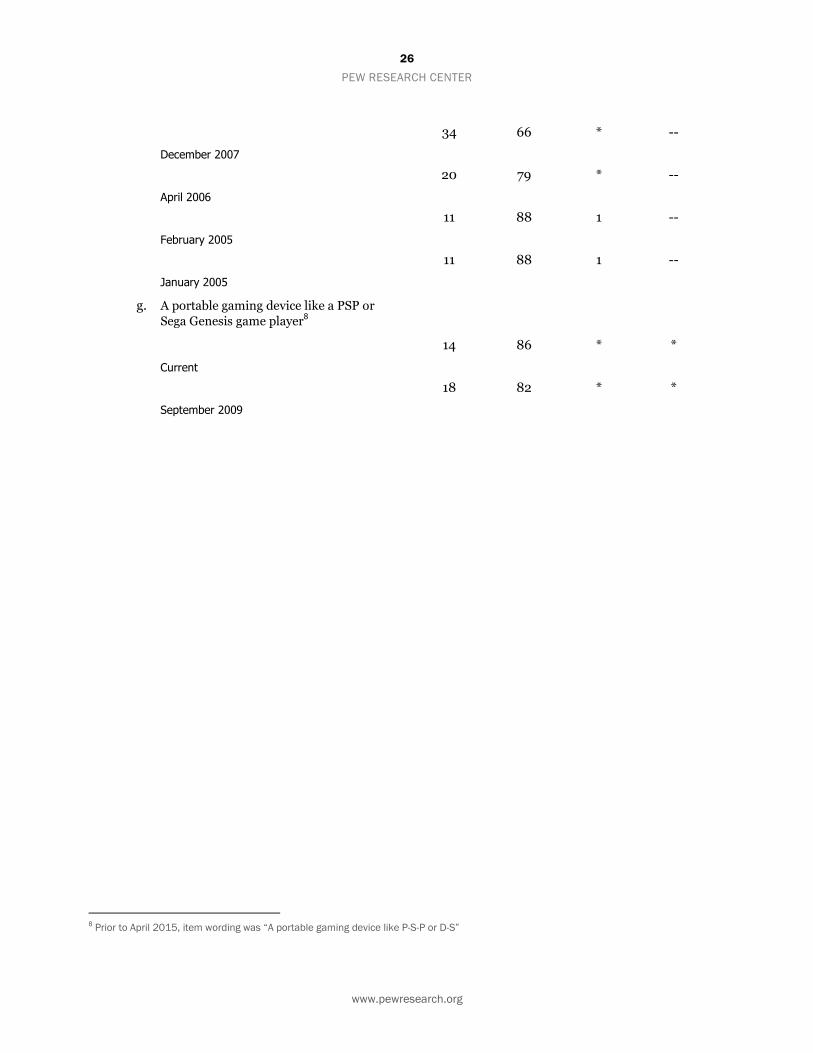
December 2007
34 66 * --
April 2006
20 79 * --
February 2005
11 88 1 --
January 2005
11 88 1 --
g. A portable gaming device like a PSP or
Sega Genesis game player8
Current
14 86 * *
September 2009
18 82 * *
8 Prior to April 2015, item wording was “A portable gaming device like P-S-P or D-S”