mongolia: debt sustainability analysis under the debt ... · this year was marked by the signing of...
TRANSCRIPT

INTERNATIONAL MONETARY FUND
MONGOLIA Debt Sustainability Analysis under the Debt Sustainability Framework for Low-Income
Countries1
Approved by Nigel Chalk and Dhaneshwar Ghura
December 7, 2009 Based on the external Debt Sustainability Analysis (DSA) Mongolia’s risk of debt distress remains low.2 Although the debt ratios will rise significantly over the next two years with the government receiving front-loaded foreign financing, the debt outlook is expected to recover and improve over the medium term. The public DSA suggests that in light of the signing of the Oyu Tolgoi mining agreement, domestic debt is expected to rise significantly in the medium term. However, risks are mitigated by the future associated mineral revenues starting in 2013 and do not lead to a different sustainability assessment than under the external DSA.
A. Background
1. This update reflects new information regarding the recently signed Oyu Tolgoi mining agreement and its impact on the short-, medium-, and long-term outlook. This update assumes that maintaining prudent macroeconomic and structural policies, including establishing a fiscal framework to avoid pro-cyclical policies, will be key for Mongolia to resume sustainable growth. Specifically, in light of tight financing conditions in the coming years, there is little choice but to continue fiscal adjustment until revenues from the Oyu Tolgoi mine, net of amortization, start to hit the budget (around 2016). Good macroeconomic policies will also help avoiding the “resource curse” which will represent a major challenge.
2. The nonconcessional debt limit under the program is linked with the debt sustainability analysis. The program includes a 35 percent minimum concessionality requirement but with added flexibility on nonconcessional external debt.3 Under this ceiling 1 This is a Fund staff update to the joint World Bank/IMF DSA presented in the report for the request for SBA (Country Report No. 09/130). The fiscal year for Mongolia is January-December. 2 Mongolia is rated as a medium performer based on the 2008 World Bank’s Country Performance and Institutional Assessment Index and the debt sustainability uses the indicative threshold indicators for countries in this category. 3 Due mainly to the nonconcessional nature of the SBA, the average grant element of total new borrowing falls to 24–27 percent in 2009–10.

2
US$100 million have been used, of which $75 million have been disbursed for gold operation financing and which are expected to be fully repaid in 2010.
B. Developments in 2009
3. This year was marked by the signing of the Oyu Tolgoi investment agreement. Economic activity has slowed more than expected in 2009, but a sharp rebound is projected, driven largely by capital expenditures related to the Oyu Tolgoi mine. In addition, copper prices are rebounding, mainly driven by renewed Chinese demand, and are projected to be 20 percent higher on average over the medium term and 4 percent in the long-term than projected in the SBA request.
4. Several other major mining projects are being explored which could further improve the outlook. The Tavan Tolgoi deposit, close to the border with China, could transform Mongolia into a major world coal producer. Other investment projects are being considered to tap into Mongolia’s vast mineral resources.
5. Domestic debt will increase due to borrowing agreements signed with the mining conglomerate. The government will borrow US$250 million for budget financing and around $540 million to finance its 34 percent equity share in the project. As both loans will be contracted from a resident company, their impact is reflected in the public DSA. The advance payments for the Oyu Tolgoi project will be saved in 2010 in order to meet the 2011 financing needs and beyond.4
6. The banking system’s financial position has been deteriorating. Costs associated with the restructuring will be fiscalized through the issuance of government bonds in 2009–10 at an estimated 8 percent of GDP. The injection of public funds will be tied to governance and structural reforms.
C. Medium-Term Macro and DSA Assumptions
7. Compared to the previous DSA, the macroeconomic outlook has improved, supported by Mongolia’s strong policy implementation under the SBA-supported program. Market conditions have improved and monetary policy has brought down inflation and rebuilt international reserves with comfortable margins compared to program objectives. In addition, copper prices have been buoyed by restocking in China. Short-term prospects depend on the speed of economic recovery in China, the main recipient of Mongolian exports, and in the rest of the world.
4 These loans are expected to be repaid in 2014–17. The advance payment loans will be repaid from the general budget while government’s equity share borrowing will be repaid from accrued dividends (the government will not be liable for the loan in the unlikely event that dividends are insufficient).

3
Mongolia—Macroeconomic Assumptions
The baseline macroeconomic framework includes the 2009-10 fiscal consolidation and assumes that the economy will be underpinned by the Oyu Tolgoi project.
The real GDP growth outlook is dominated by the Oyu Tolgoi mine. Real growth is expected to bottom-out in 2009 at -1 percent and to rebound to over 8 percent in 2010, boosted by Oyu Tolgoi-related capital expenditures. Once production from the Oyu Tolgoi mine starts in 2013, it will boost growth up to 25 percent. Real GDP growth is expected to average 11 percent over the medium term, taking into account the impact on the nonmineral economy.
The balance of payments will go through large swings. The current account will remain in deficit until 2012 due to large imports of mining-related investment goods. As the project comes on stream, it will jump into a surplus in 2013 and, as the project tapers off, converge to a surplus of 1 percent of GDP by 2029.
After a period of consolidation the overall fiscal deficit is expected to converge to a new equilibrium. Fiscal revenues will be boosted by the project and are expected to reach 60 percent of nonmineral GDP in 2016. In the medium term, fiscal revenues are projected to gradually converge to 25 percent of overall GDP. The Fiscal Responsibility Law will reduce pro-cyclicality by restraining expenditure growth during periods of high mineral revenues and enable the authorities to save a substantial fraction of mineral revenues.
8. The baseline assumes a strong institutional framework and macroeconomic policies to minimize Dutch disease effects. Following the surge in mining production from the Oyu Tolgoi mine, Mongolia will likely experience a substantial real appreciation creating challenges to maintaining low inflation and developing the nonmineral economy. The baseline assumes a restrained fiscal policy, supported by the adoption of a Fiscal Responsibility Law, and a flexible exchange rate so that real exchange rate pressures feed though the nominal exchange rate. Finally, it assumes that structural fiscal reforms including pensions, civil service, and subsidy reforms will contribute to improve the business climate and the overall competitiveness of the economy. The authorities have made progress in becoming Extractive Transparency Industry Initiative (EITI) compliant by next year.
Current Balance, Exports, Imports, and Real Exchange Rate
-25
-5
15
35
55
75
95
200
9
201
0
201
1
201
2
201
3
201
4
201
5
201
6
201
7
201
8
201
9
202
0
202
1
202
2
202
3
202
4
202
5
202
6
202
7
202
8
202
9
-20
-15
-10
-5
0
5
10
15CAB, percent of GDP
Export percent of GDP
Import percent of GDP
REER, - appreciation
Fiscal Stance (Percent of GDP)
-10%
-5%
0%
5%
10%
15%
20%
25%
30%
35%
200
9
201
1
201
3
201
5
201
7
201
9
202
1
202
3
202
5
202
7
202
9
Current baseline
New loans, current
Revenues % total GDP

4
D. External and Public Debt Sustainability Analysis
9. Mongolia’s external risk of debt distress remains low (Figure. 1). External debt ratios will remain broadly in line with the previous DSA over the medium term. Conversely, comparing the previous baseline debt ratios using the same respective PV of debt does not show a substantial difference. The one-off borrowing in 2009–10 will lead to a temporary but significant increase in the level of public debt but will fall rapidly in 2012–14. The debt service-to-exports and debt service-to-revenues ratios will peak in 2011–12 but will stay below the threshold. Pursuing fiscal adjustment in the period before the mining project comes into stream will be key.
10. Stress testing shows that a one-time 30 percent exchange rate depreciation relative to the baseline in 2010 would breach the threshold over the 2010-12 period. However, with the Oyu Tolgoi mine starting production in 2013, the adverse effects of the depreciation would be gradually unwound. The exceptional access under the SBA and the broad program framework have bolstered international reserves and restored confidence in the currency making the probability of a depreciation of this magnitude relatively low.
11. The risks for fiscal sustainability have increased over the medium term but remain low (Figure 2). The baseline includes (i) fiscalization of the banking sector losses through domestic bond issuances, and (ii) loans to the government from the local mining company for acquiring the government’s equity share and a pre-payment on future revenues. However, the government will receive dividends from its 34 percent equity share and government deposits are expected to increase providing a comfortable fiscal reserve cushion.
Public Sector Debt-to-GDP Ratio
0
10
20
30
40
50
60
70
80
20
09
20
10
20
11
20
12
20
13
20
14
20
15
20
16
20
17
20
18
20
19
20
20
20
21
20
22
20
23
20
24
20
25
20
26
20
27
20
28
20
29
SBA request
Current baseline
Government Deposits (Cumulative, in millions of US$)
0
100
200
300
400
500
600
700
800
900
20
09
20
10
20
11
20
12
20
13
20
14
20
15
20
16
20
17
20
18
20
19
20
20
20
21
20
22
20
23
20
24
20
25
20
26
20
27
20
28
20
29

5
E. Country-Specific Alternative Scenario5
12. The scenario assumes a more sizable real appreciation than the baseline. When mineral revenues start materializing they will create macroeconomic challenges. This scenario assumes that fiscal policy is loose and mining revenues are fully spent over the medium to long term. Monetary policy can only counteract inflationary pressures resulting from the fiscal expansion by allowing the nominal exchange rate to adjust. Hence, the scenario assumes a significant real exchange rate appreciation and a deterioration in the current account balance over the long term. However, this country-specific alternative scenario does not result in indicators significantly breaching thresholds.
F. Conclusions
13. The overall assessment has not changed with the last DSA and the external DSA indicates that Mongolia remains at low risk of external debt distress. The short-term macroeconomic outlook has improved due to strong performance under the SBA and a more favorable global outlook than envisaged at the outset of the program. The increase in domestic debt, albeit from a low level, does not lead to a different sustainability assessment that under the external DSA.
5 In the last joint Bank-Fund DSA (Country Report No. 09/130), a 20 percent lower copper price than in the baseline scenario (US$4,500/ton vs. US$5,100/ton in the current baseline) during 2010–15 showed that the economy remained vulnerable to changes in commodity prices despite the substantial increase in export volumes expected with the Oyu Tolgoi mining project.
Current Balance, Exports and Imports(Country-Specific Scenario)
-25
-5
15
35
55
75
95
200
9
201
0
201
1
201
2
201
3
201
4
201
5
201
6
201
7
201
8
201
9
202
0
202
1
202
2
202
3
202
4
202
5
202
6
202
7
202
8
202
9
-40
-30
-20
-10
0
10
20
30CAB, percent of GDP
Export percent of GDP
Import percent of GDPREER, "-" appreciation
\

6
1/ The most extreme stress test is the test that yields the highest ratio in 2019. In figure b., it corresponds to a one-time depreciation shock; in c. to a exports shock; in d. to a one-time depreciation shock; in e. to a exports shock and in picture f. to a exports shock.
Figure 1. Mongolia: Indicators of Public and Publicly Guaranteed External Debt Under Alternatives Scenarios, 2009–2029 1/
Source: IMF staff projections and simulations.
2/ Third review debt assumptions with SBA request macro assumptions.
0
5
10
15
20
25
30
35
2009 2014 2019 2024 2029
Baseline Most extreme shock 1/ Threshold Old baseline 2/ SBA
f.Debt service-to-revenue ratio
-1.0
0.0
1.0
2.0
3.0
4.0
5.0
6.0
2009 2014 2019 2024 20290
5
10
15
20
25
30
35
40
Rate of Debt Accumulation
Grant element of new borrowing (% right scale)
Grant-equivalent financing (% of GDP)
a. Debt Accumulation
0
10
20
30
40
50
60
2009 2014 2019 2024 2029
b.PV of debt-to GDP ratio 2/
0
20
40
60
80
100
120
140
160
2009 2014 2019 2024 2029
c.PV of debt-to-exports ratio
0
50
100
150
200
250
300
2009 2014 2019 2024 2029
d.PV of debt-to-revenue ratio
0
5
10
15
20
25
2009 2014 2019 2024 2029
e.Debt service-to-exports ratio
Old baseline
New baseline
SBA

7
Sources: Mongolian authorities; and IMF staff estimates and projections.
1/ The most extreme stress test is the test that yields the highest ratio in 2019. 2/ Revenues are defined inclusive of grants.
Figure 2. Mongolia: Indicators of Public Debt Under Alternative Scenarios, 2009–2029 1/
0
50
100
150
200
250
300
350
400
450
500
2009 2011 2013 2015 2017 2019 2021 2023 2025 2027 2029
PV of Debt-to-Revenue Ratio 2/
0
20
40
60
80
100
120
140
2009 2011 2013 2015 2017 2019 2021 2023 2025 2027 2029
Baseline Fix Primary BalanceMost extreme shock Growth Historical scenario
PV of Debt-to-GDP Ratio
0
5
10
15
20
25
30
35
40
45
50
2009 2011 2013 2015 2017 2019 2021 2023 2025 2027 2029
Debt Service-to-Revenue Ratio 2/

8
Historical Standard 6/2006 2007 2008 Average Deviation 2009 2010 2011 2012 2013 2014 2009-2014 2019 2029 2015-2029
Average Average
External debt (nominal) 1/ 45.1 40.1 34.7 48.0 59.8 68.4 86.9 68.0 52.4 17.1 14.1Of which: public and publicly guaranteed (PPG) 44.3 38.9 33.9 45.3 44.2 36.3 34.3 27.6 23.5 14.0 13.8
Change in external debt -16.2 -5.0 -5.3 13.3 11.8 8.6 18.5 -18.9 -15.6 -1.1 -0.3Identified net debt-creating flows -32.7 -24.8 -11.7 -2.7 -0.4 4.0 13.0 -24.0 -15.8 -7.7 0.9
Non-interest current account deficit -7.5 -7.1 13.7 2.3 7.5 3.2 15.6 20.7 17.0 -8.5 -7.6 -6.8 2.2 -3.1Deficit in balance of goods and services -4.8 -2.7 15.6 6.5 19.6 25.0 20.8 -8.6 -14.6 -11.7 0.4
Exports 64.4 64.2 58.3 48.1 48.2 46.0 42.1 52.4 55.2 46.1 37.0Imports 59.6 61.5 73.9 54.6 67.8 71.0 62.9 43.8 40.6 34.3 37.5
Net current transfers (negative = inflow) -2.4 -2.1 -1.8 -3.4 2.5 -1.4 -1.5 -1.7 -1.7 -1.7 -1.7 -1.7 -1.6 -1.7Of which: official -3.5 -3.4 -1.7 -3.2 -3.1 -2.2 -2.7 -1.4 -0.8 -0.1 0.0
Other current account flows (negative = net inflow) -0.3 -2.3 -0.1 -1.9 -2.5 -2.7 -2.1 1.8 8.6 6.6 3.4Net FDI (negative = inflow) -9.2 -9.2 -16.2 -7.9 4.0 -6.9 -12.7 -13.8 -1.0 -1.0 -1.0 -1.0 -1.0 -1.0Endogenous debt dynamics 2/ -16.0 -8.5 -9.2 1.0 -3.3 -2.8 -3.0 -14.5 -7.2 0.1 -0.2
Contribution from nominal interest rate 0.5 0.4 0.3 0.6 0.5 0.5 0.5 4.0 3.5 0.5 0.2Contribution from real GDP growth -3.8 -3.7 -2.7 0.4 -3.8 -3.3 -3.5 -18.4 -10.8 -0.4 -0.4Contribution from price and exchange rate changes -12.6 -5.2 -6.8 … … … … … … … …
Residual (3-4) 3/ 16.5 19.8 6.4 16.0 12.1 4.6 5.6 5.1 0.2 6.6 -1.2Of which: exceptional financing 0.0 0.0 0.0 0.0 0.0 0.0 0.0 0.0 0.0 0.0 0.0
PV of external debt 4/ ... ... 27.1 39.2 51.9 64.2 81.1 63.2 48.2 14.8 12.1In percent of exports ... ... 46.5 81.5 107.8 139.8 192.4 120.6 87.3 32.2 32.7
PV of PPG external debt ... ... 26.3 36.5 36.3 32.2 28.4 22.8 19.3 11.7 11.8In percent of exports ... ... 45.1 75.9 75.3 70.0 67.5 43.5 35.0 25.5 31.8In percent of government revenues ... ... 73.4 122.1 111.1 110.3 97.1 93.2 81.9 43.6 44.9
Debt service-to-exports ratio (in percent) 5.9 6.5 4.4 4.5 3.4 3.5 5.8 15.7 19.0 4.1 2.8PPG debt service-to-exports ratio (in percent) 5.4 4.3 3.6 4.5 3.4 3.5 5.8 4.5 3.7 1.5 2.8PPG debt service-to-revenue ratio (in percent) 9.5 6.8 5.9 7.2 5.0 5.5 8.3 9.6 8.6 2.5 4.0Total gross financing need (billions of U.S. dollars) -0.4 -0.5 0.0 0.0 0.2 0.5 1.2 0.0 0.2 -1.1 0.8Non-interest current account deficit that stabilizes debt ratio 8.6 -2.1 19.1 -10.1 3.8 12.1 -1.5 10.4 8.0 -5.7 2.4
Key macroeconomic assumptions
Real GDP growth (in percent) 8.6 10.2 8.9 6.5 3.3 -1.0 8.6 6.5 5.8 26.3 18.8 10.8 2.3 3.1 5.7GDP deflator in U.S. dollar terms (change in percent) 26.0 13.0 20.3 10.0 10.4 -13.2 -0.1 8.6 6.2 -2.0 -0.3 -0.1 4.9 2.2 2.8Effective interest rate (percent) 5/ 1.2 1.1 0.9 1.8 0.7 1.5 1.2 1.0 0.8 5.6 6.2 2.7 2.9 1.5 2.5Growth of exports of G&S (U.S. dollar terms, in percent) 36.9 24.2 18.9 19.7 16.0 -29.0 8.8 10.3 3.0 54.1 24.5 11.9 4.1 1.6 6.0Growth of imports of G&S (U.S. dollar terms, in percent) 19.5 28.5 57.4 19.8 16.1 -36.4 34.8 21.0 -0.4 -13.8 9.8 2.5 8.8 7.1 8.0Grant element of new public sector borrowing (in percent) ... ... ... ... ... 24.2 27.3 35.1 34.0 28.9 28.5 29.7 25.8 24.9 25.3
Government revenues (excluding grants, in percent of GDP) 36.5 40.4 35.8 29.9 32.7 29.2 29.3 24.5 23.6 26.9 26.2 26.2
Aid flows (in billions of U.S. dollars) 7/ 0.0 0.0 0.0 0.0 0.0 0.0 0.0 0.0 0.0 0.0 0.1Of which: Grants 0.0 0.0 0.0 0.0 0.0 0.0 0.0 0.0 0.0 0.0 0.1Of which: Concessional loans 0.0 0.0 0.0 0.0 0.0 0.0 0.0 0.0 0.0 0.0 0.0
Grant-equivalent financing (in percent of GDP) 8/ ... ... ... 3.0 1.4 0.9 0.9 0.8 0.7 0.6 0.6 0.6Grant-equivalent financing (in percent of external financing) 8/ ... ... ... 24.2 27.3 35.1 34.0 28.9 35.9 35.6 37.4 36.3
Memorandum items:Nominal GDP (billions of U.S. dollars) 3.2 3.9 5.1 4.4 4.8 5.6 6.2 7.7 9.1 20.6 30.7Nominal dollar GDP growth 36.8 24.5 31.0 -14.0 8.5 15.6 12.4 23.8 18.3 10.8 7.4 5.3 8.7PV of PPG external debt (in billions of U.S. dollars) 1.4 1.6 1.7 1.8 1.8 1.8 1.8 2.4 3.6(PVt-PVt-1)/GDPt-1 (in percent) 5.1 2.9 0.9 -0.2 -0.2 0.0 1.4 0.8 0.4 0.6
Source: Staff simulations.
1/ Includes both public and private sector external debt.2/ Derived as [r - g - r(1+g)]/(1+g+r+gr) times previous period debt ratio, with r = nominal interest rate; g = real GDP growth rate, and r = growth rate of GDP deflator in U.S. dollar terms.
4/ Assumes that PV of private sector debt is equivalent to its face value.5/ Current-year interest payments divided by previous period debt stock. 6/ Historical averages and standard deviations are generally derived over the past 10 years, subject to data availability. 7/ Defined as grants, concessional loans, and debt relief.8/ Grant-equivalent financing includes grants provided directly to the government and through new borrowing (difference between the face value and the PV of new debt).
3/ Includes exceptional financing (i.e., changes in arrears and debt relief); changes in gross foreign assets; and valuation adjustments. For projections also includes contribution from price and exchange rate changes.
Actual
Table 1. External Debt Sustainability Framework, Baseline Scenario, 2006–2029 1/
(In percent of GDP, unless otherwise indicated)
Projections

9
Estimate2006 2007 2008 Average Standard
Deviation5/ 2009 2010 2011 2012 2013 2014 2009-14
Average2019 2029 2015-29
Average
Public sector debt 1/ 44.3 38.9 33.9 51.6 70.8 69.5 68.0 54.7 46.2 18.6 14.7Of which: foreign-currency denominated 44.3 38.9 33.9 45.3 44.2 36.3 34.3 27.6 23.5 14.0 13.8
Change in public sector debt -15.4 -5.5 -5.0 17.7 19.1 -1.2 -1.5 -13.3 -8.6 -0.2 -0.3Identified debt-creating flows -25.7 -11.6 -2.0 12.6 3.2 -10.1 -4.0 -16.7 -15.0 -3.1 -1.2
Primary deficit -8.7 -3.2 4.6 1.3 5.0 6.0 3.6 1.2 0.4 -2.9 -5.9 0.4 -2.0 -0.5 -1.9Revenue and grants 36.6 40.9 36.1 30.7 33.0 29.5 29.6 24.8 23.8 27.1 26.5
Of which: grants 0.1 0.5 0.3 0.8 0.3 0.3 0.3 0.2 0.2 0.2 0.3Primary (noninterest) expenditure 27.9 37.6 40.6 36.7 36.6 30.7 30.0 21.9 17.9 25.1 25.9
Automatic debt dynamics -16.6 -8.0 -6.4 4.4 -4.6 -10.9 -4.0 -13.6 -8.9 -0.9 -0.6Contribution from interest rate/growth differential -15.5 -8.4 -8.9 6.1 -3.9 -8.4 -6.2 -13.5 -8.9 -1.1 -0.6
Of which: contribution from average real interest rate -10.8 -4.2 -5.7 5.8 0.2 -4.1 -2.4 0.6 -0.2 -0.6 -0.1Of which: contribution from real GDP growth -4.7 -4.1 -3.2 0.3 -4.1 -4.3 -3.8 -14.1 -8.6 -0.4 -0.4
Contribution from real exchange rate depreciation -1.0 0.4 2.5 -1.8 -0.7 -2.5 2.2 0.0 0.0 ... ...Other identified debt-creating flows -0.4 -0.4 -0.1 2.3 4.2 -0.4 -0.4 -0.3 -0.2 -0.1 -0.1
Privatization receipts (negative) -0.4 -0.4 -0.1 -0.5 -0.5 -0.4 -0.4 -0.3 -0.2 -0.1 -0.1Recognition of implicit or contingent liabilities 0.0 0.0 0.0 0.0 0.0 0.0 0.0 0.0 0.0 0.0 0.0Debt relief (HIPC and other) 0.0 0.0 0.0 0.0 0.0 0.0 0.0 0.0 0.0 0.0 0.0Bank restructuring 0.0 0.0 0.0 2.8 4.6 0.0 0.0 0.0 0.0 0.0 0.0
Residual, including asset changes 10.3 6.2 -3.0 5.1 15.9 8.9 2.5 3.4 6.4 2.8 0.8
Other Sustainability Indicators
PV of public sector debt 0.0 0.0 28.5 44.1 63.6 63.8 62.6 50.3 42.3 16.3 12.8Of which: foreign-currency denominated 0.0 0.0 28.5 37.8 37.0 30.6 28.9 23.2 19.7 11.7 12.0Of which: external ... ... 28.5 37.8 37.0 30.6 28.9 23.2 19.7 11.7 12.0
PV of contingent liabilities (not included in public sector debt) ... ... ... ... ... ... ... ... ... ... ...Gross financing need 2/ -5.3 -0.5 6.8 8.1 6.1 3.8 3.7 1.8 -1.5 -0.9 0.6PV of public sector debt-to-revenue and grants ratio (in percent) 0.0 0.0 79.0 143.5 192.8 216.5 211.5 203.2 177.5 60.0 48.5PV of public sector debt-to-revenue ratio (in percent) 0.0 0.0 79.6 147.5 194.7 218.8 213.8 205.3 179.1 60.5 49.0
Of which: external 3/ … … 79.6 126.5 113.2 105.0 98.7 94.7 83.3 43.7 45.6Debt service-to-revenue and grants ratio (in percent) 4/ 9.3 6.8 6.0 6.8 7.6 8.9 11.3 19.1 18.3 4.0 4.2
Debt service-to-revenue ratio (in percent) 4/ 9.4 6.9 6.1 7.0 7.6 8.9 11.4 19.3 18.5 4.0 4.3Primary deficit that stabilizes the debt-to-GDP ratio 6.7 2.2 9.6 -11.8 -15.5 2.4 1.9 10.4 2.7 -1.8 -0.2
Key macroeconomic and fiscal assumptionsReal GDP growth (in percent) 8.6 10.2 8.9 6.5 3.3 -1.0 8.6 6.5 5.8 26.3 18.8 10.8 2.3 3.1 5.7Average nominal interest rate on forex debt (in percent) 1.2 1.1 0.9 1.8 0.7 1.6 1.2 1.3 1.4 1.5 1.5 1.4 1.5 1.5 1.5
Real exchange rate depreciation (in percent, + indicates depreciation) -2.3 1.0 8.4 0.8 3.3 -4.4 ... ... ... ... ... ... ... ... ...
Inflation rate (GDP deflator, in percent) 23.1 12.3 20.2 13.3 6.4 7.5 6.0 5.6 2.9 1.4 3.1 4.4 4.1 5.7 4.7
Growth of real primary spending (deflated by GDP deflator, in percent) 0.1 0.5 0.2 0.1 0.2 -0.1 0.1 -0.1 0.0 -0.1 0.0 0.0 0.1 0.0 0.1Grant element of new external borrowing (in percent) ... ... ... … … 24.2 27.3 35.1 34.0 28.9 28.5 29.7 25.8 24.9 ...
Sources: Mongolian authorities; and Fund staff estimates and projections.
1/ General government or nonfinancial public sector, gross debt.2/ Gross financing need is defined as the primary deficit plus debt service plus the stock of short-term debt at the end of the last period. 3/ Revenues excluding grants.4/ Debt service is defined as the sum of interest and amortization of medium and long-term debt.5/ Historical averages and standard deviations are generally derived over the past 10 years, subject to data availability.
Table 2. Mongolia: Public Sector Debt Sustainability Framework, Baseline Scenario, 2005–2029
(In percent of GDP, unless otherwise indicated)
Actual Projections

10
Table 3. Mongolia: Sensitivity Analysis for Key Indicators of Public Debt 2009-2029
2009 2010 2011 2012 2013 2014 2019 2029
Baseline 44 64 64 63 50 42 16 13
A. Alternative scenarios
A1. Real GDP growth and primary balance are at historical averages 44 63 63 62 63 68 66 60A2. Primary balance is unchanged from 2009 44 66 70 73 67 68 71 126A3. Permanently lower GDP growth 1/ 44 64 65 65 53 46 25 44A4. Alternative Scenario :[Costumize, enter title] 45 69 72 69 67 67 52 32
B. Bound tests
B1. Real GDP growth is at historical average minus one standard deviations in 2010-2011 44 68 73 74 62 54 32 43B2. Primary balance is at historical average minus one standard deviations in 2010-2011 44 66 70 69 56 47 20 11B3. Combination of B1-B2 using one half standard deviation shocks 44 66 69 69 57 49 26 30B4. One-time 30 percent real depreciation in 2010 44 79 77 75 61 51 21 15B5. 10 percent of GDP increase in other debt-creating flows in 2010 44 73 72 70 57 48 20 12
Baseline 144 203 218 212 201 175 59 48
A. Alternative scenarios
A1. Real GDP growth and primary balance are at historical averages 144 200 216 210 253 281 239 223A2. Primary balance is unchanged from 2009 144 210 238 247 269 281 259 467A3. Permanently lower GDP growth 1/ 144 205 223 220 213 190 91 162A4. Alternative Scenario :[Costumize, enter title] 147 260 274 260 250 252 198 123
B. Bound tests
B1. Real GDP growth is at historical average minus one standard deviations in 2010-2011 144 218 249 250 246 223 116 161B2. Primary balance is at historical average minus one standard deviations in 2010-2011 144 211 240 233 223 195 71 41B3. Combination of B1-B2 using one half standard deviation shocks 144 211 236 234 228 204 95 110B4. One-time 30 percent real depreciation in 2010 144 254 263 255 243 212 75 57B5. 10 percent of GDP increase in other debt-creating flows in 2010 144 232 245 238 228 199 74 43
Baseline 7 8 9 11 19 18 4 4
A. Alternative scenarios
A1. Real GDP growth and primary balance are at historical averages 7 5 5 8 11 11 8 15A2. Primary balance is unchanged from 2009 7 5 6 9 11 10 9 30A3. Permanently lower GDP growth 1/ 7 5 6 8 9 8 3 8A4. Alternative Scenario :[Costumize, enter title] 7 6 5 8 9 9 4 6
B. Bound tests
B1. Real GDP growth is at historical average minus one standard deviations in 2010-2011 7 5 6 9 11 10 3 9B2. Primary balance is at historical average minus one standard deviations in 2010-2011 7 5 6 9 10 9 2 2B3. Combination of B1-B2 using one half standard deviation shocks 7 5 6 9 10 9 3 6B4. One-time 30 percent real depreciation in 2010 7 6 8 12 14 12 3 5B5. 10 percent of GDP increase in other debt-creating flows in 2010 7 5 7 9 10 9 2 2
Sources: Country authorities; and IMF staff estimates and projections.1/ Assumes that real GDP growth is at baseline minus one standard deviation divided by the length of the projection period.2/ Revenues are defined inclusive of grants.
PV of Debt-to-GDP Ratio
Projections
PV of Debt-to-Revenue Ratio 2/
Debt Service-to-Revenue Ratio 2/

11
2009 2010 2011 2012 2013 2014 2019 2029
Baseline 36 36 32 28 23 19 12 12
A. Alternative Scenarios
A1. Key variables at their historical averages in 2009-2029 1/ 36 28 17 0 2 3 16 -15A2. New public sector loans on less favorable terms in 2009-2029 2 36 36 32 29 24 20 12 13
B. Bound Tests
B1. Real GDP growth at historical average minus one standard deviation in 2010-2011 36 38 35 31 25 21 13 13B2. Export value growth at historical average minus one standard deviation in 2010-2011 3/ 36 38 37 33 27 23 13 12B3. US dollar GDP deflator at historical average minus one standard deviation in 2010-2011 36 36 35 31 25 21 13 13
B4. Net nondebt creating flows at historical average minus one standard deviation in 2010-2011 4/ 36 43 46 41 34 29 16 13B5. Combination of B1-B4 using one-half standard deviation shocks 36 39 41 37 30 25 14 13B6. One-time 30 percent nominal depreciation relative to the baseline in 2010 5/ 36 52 46 41 33 27 17 17
Baseline 76 75 70 67 44 35 25 32
A. Alternative Scenarios
A1. Key variables at their historical averages in 2009-2029 1/ 76 59 36 0 4 5 34 -39A2. New public sector loans on less favorable terms in 2009-2029 2 76 75 70 69 45 37 27 34
B. Bound Tests
B1. Real GDP growth at historical average minus one standard deviation in 2010-2011 76 75 70 67 43 35 25 31B2. Export value growth at historical average minus one standard deviation in 2010-2011 3/ 76 83 90 87 57 46 32 36B3. US dollar GDP deflator at historical average minus one standard deviation in 2010-2011 76 75 70 67 43 35 25 31B4. Net nondebt creating flows at historical average minus one standard deviation in 2010-2011 4/ 76 90 101 98 64 52 34 34B5. Combination of B1-B4 using one-half standard deviation shocks 76 80 83 81 52 42 29 32B6. One-time 30 percent nominal depreciation relative to the baseline in 2010 5/ 76 75 70 67 43 35 25 31
Baseline 122 117 111 97 92 81 43 44
A. Alternative Scenarios
A1. Key variables at their historical averages in 2009-2029 1/ 122 91 57 0 8 12 58 -55A2. New public sector loans on less favorable terms in 2009-2029 2 122 117 112 99 95 85 45 48
B. Bound Tests
B1. Real GDP growth at historical average minus one standard deviation in 2010-2011 122 123 121 106 100 87 46 48B2. Export value growth at historical average minus one standard deviation in 2010-2011 3/ 122 122 128 113 108 94 48 45B3. US dollar GDP deflator at historical average minus one standard deviation in 2010-2011 122 117 122 106 101 88 47 48B4. Net nondebt creating flows at historical average minus one standard deviation in 2010-2011 4/ 122 139 160 142 136 120 57 47B5. Combination of B1-B4 using one-half standard deviation shocks 122 127 143 126 120 106 52 48B6. One-time 30 percent nominal depreciation relative to the baseline in 2010 5/ 122 167 159 139 131 115 61 63
Source: Staff projections and simulations.
1/ Variables include real GDP growth, growth of GDP deflator (in U.S. dollar terms), non-interest current account in percent of GDP, and non-debt creating flows. 2/ Assumes that the interest rate on new borrowing is by 2 percentage points higher than in the baseline., while grace and maturity periods are the same as in the baseline.3/ Exports values are assumed to remain permanently at the lower level, but the current account as a share of GDP is assumed to return to its baseline level after the shock (implicitly assuming an offsetting adjustment in import levels). 4/ Includes official and private transfers and FDI.5/ Depreciation is defined as percentage decline in dollar/local currency rate, such that it never exceeds 100 percent.
PV of debt-to-exports ratio
PV of debt-to-revenue ratio
Table 4a.Mongolia: Sensitivity Analysis for Key Indicators of Public and Publicly Guaranteed External Debt, 2009-2029(In percent)
PV of debt-to GDP ratio
Projections
12
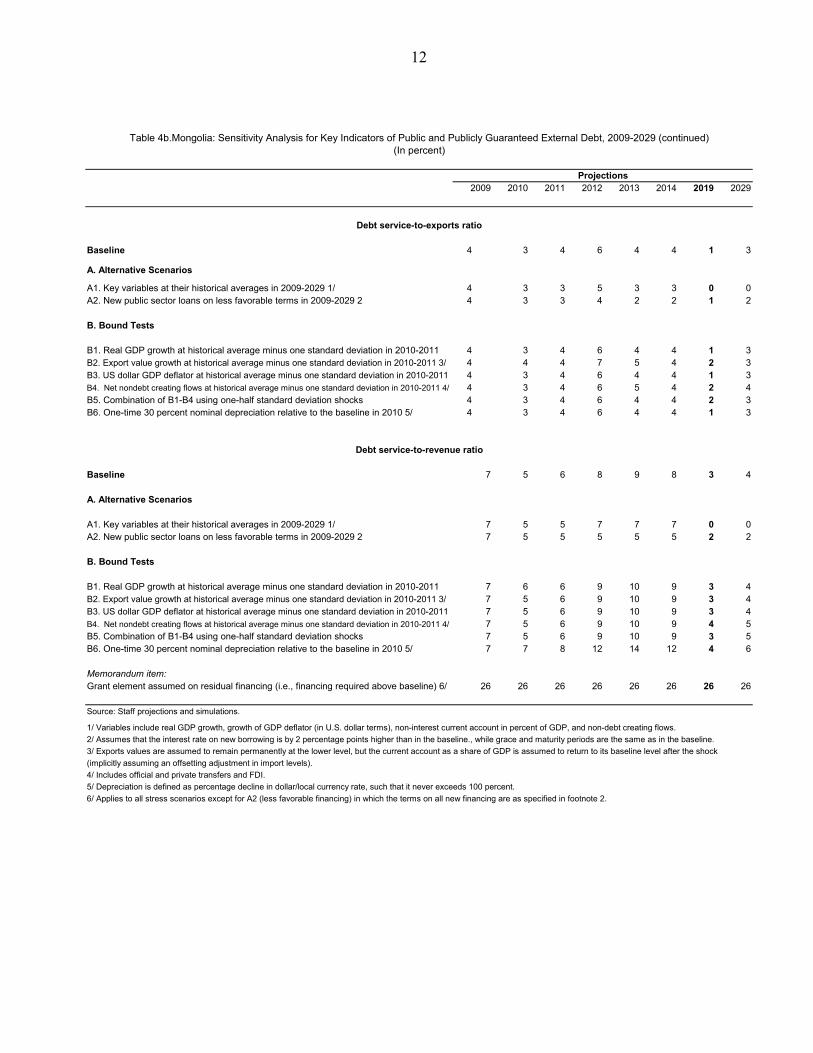
2009 2010 2011 2012 2013 2014 2019 2029
Baseline 4 3 4 6 4 4 1 3
A. Alternative Scenarios
A1. Key variables at their historical averages in 2009-2029 1/ 4 3 3 5 3 3 0 0A2. New public sector loans on less favorable terms in 2009-2029 2 4 3 3 4 2 2 1 2
B. Bound Tests
B1. Real GDP growth at historical average minus one standard deviation in 2010-2011 4 3 4 6 4 4 1 3B2. Export value growth at historical average minus one standard deviation in 2010-2011 3/ 4 4 4 7 5 4 2 3B3. US dollar GDP deflator at historical average minus one standard deviation in 2010-2011 4 3 4 6 4 4 1 3B4. Net nondebt creating flows at historical average minus one standard deviation in 2010-2011 4/ 4 3 4 6 5 4 2 4B5. Combination of B1-B4 using one-half standard deviation shocks 4 3 4 6 4 4 2 3B6. One-time 30 percent nominal depreciation relative to the baseline in 2010 5/ 4 3 4 6 4 4 1 3
Baseline 7 5 6 8 9 8 3 4
A. Alternative Scenarios
A1. Key variables at their historical averages in 2009-2029 1/ 7 5 5 7 7 7 0 0A2. New public sector loans on less favorable terms in 2009-2029 2 7 5 5 5 5 5 2 2
B. Bound Tests
B1. Real GDP growth at historical average minus one standard deviation in 2010-2011 7 6 6 9 10 9 3 4B2. Export value growth at historical average minus one standard deviation in 2010-2011 3/ 7 5 6 9 10 9 3 4B3. US dollar GDP deflator at historical average minus one standard deviation in 2010-2011 7 5 6 9 10 9 3 4B4. Net nondebt creating flows at historical average minus one standard deviation in 2010-2011 4/ 7 5 6 9 10 9 4 5B5. Combination of B1-B4 using one-half standard deviation shocks 7 5 6 9 10 9 3 5B6. One-time 30 percent nominal depreciation relative to the baseline in 2010 5/ 7 7 8 12 14 12 4 6
Memorandum item:Grant element assumed on residual financing (i.e., financing required above baseline) 6/ 26 26 26 26 26 26 26 26
Source: Staff projections and simulations.
1/ Variables include real GDP growth, growth of GDP deflator (in U.S. dollar terms), non-interest current account in percent of GDP, and non-debt creating flows.
2/ Assumes that the interest rate on new borrowing is by 2 percentage points higher than in the baseline., while grace and maturity periods are the same as in the baseline.
3/ Exports values are assumed to remain permanently at the lower level, but the current account as a share of GDP is assumed to return to its baseline level after the shock
(implicitly assuming an offsetting adjustment in import levels).
4/ Includes official and private transfers and FDI.
5/ Depreciation is defined as percentage decline in dollar/local currency rate, such that it never exceeds 100 percent.
6/ Applies to all stress scenarios except for A2 (less favorable financing) in which the terms on all new financing are as specified in footnote 2.
Debt service-to-revenue ratio
Table 4b.Mongolia: Sensitivity Analysis for Key Indicators of Public and Publicly Guaranteed External Debt, 2009-2029 (continued)(In percent)
Projections
Debt service-to-exports ratio