monetarypolicy underinflation- southafrica serenamerrino
TRANSCRIPT
Monetary Policyunder Inflation-Targeting inSouth Africa
Serena Merrino
State of the Art
I RedistributiveChannels
II Data
III VECM
IV Results
Conclusions
Figures
1/21
Monetary Policy under Inflation-Targetingin South Africa
Serena Merrino
UNU-WIDER
02 December 2020
Monetary Policyunder Inflation-Targeting inSouth Africa
Serena Merrino
State of the Art
I RedistributiveChannels
II Data
III VECM
IV Results
Conclusions
Figures
2/21
State of the Art
I Inequality is a direct result of supply-side factors:Education (Mincer 1958), weak unions (Machin 1997), IT (Zeira 2007), greaterreturn on capital (Piketty 2013), globalisation (Jaumotte et al. 2013);
I Central banks act to preserve price stability:From representative to heterogeneous agent models (Gueven 2011 vs Bullard2019);
I MP/Inequality links still under-researched in emerging economies:For SA: Oosthuizen (2007), Aye and Harris (2019).

Monetary Policyunder Inflation-Targeting inSouth Africa
Serena Merrino
State of the Art
I RedistributiveChannels
II Data
III VECM
IV Results
Conclusions
Figures
3/21
I Redistributive ChannelsTheoretical Framework

Monetary Policyunder Inflation-Targeting inSouth Africa
Serena Merrino
State of the Art
I RedistributiveChannels
II Data
III VECM
IV Results
Conclusions
Figures
4/21
I Redistributive ChannelsEmpirical Approaches in Extant Literature
1. General Equilibrium Models with heterogeneous agentsDoepke and Schneider (2006); Villareal (2014); Adam and Zhu (2016); Adam andTzamourani (2016); Doepke et al (2015); Casiraghi et al (2018); Bullard (2019).
2. Time series for one single countrySVAR/VEC: Saiki and Frost (2014); Davtyan (2016); Coibion et al. (2017);Mumtaz and Theophilopoulou (2017); Hafemann et al (2018).
3. Cross-country evidenceRomer and Romer (1999); Bulir (2001); Li and Zou (2002); Albanesi (2007);Baumeister and Benati (2013); Guerello (2016); Altavilla et al (2016);Dell’Ariccia et al (2018).
Monetary Policyunder Inflation-Targeting inSouth Africa
Serena Merrino
State of the Art
I RedistributiveChannels
II Data
III VECM
IV Results
Conclusions
Figures
5/21
The Earnings Heterogeneity Channel in SAHypothesis
I South Africa has a segmented labour market.The (urban) high-skill tier is characterized by excess demand
The (rural) low-skill tier displays large excess supply;
I Monetary expansions supposedly stimulate cyclicalunemployment, thus advantaging a small group of educatedSouth Africans at higher brackets.In 1994-2004, 76 percent of 6.2 million new jobs were skilled or semiskilled (Stats SA 2014).

Monetary Policyunder Inflation-Targeting inSouth Africa
Serena Merrino
State of the Art
I RedistributiveChannels
II Data
III VECM
IV Results
Conclusions
Figures
6/21
The Earnings Heterogeneity Channel in SAGoals
Using detailed micro-level data, I derive a consistent time series for realwage inequality in South Africa since 1993;
I study the effect of monetary policy shock and their historical contributionto wage inequality in South Africa since 2000;
1. Is there a role for monetary policy in wage reallocation?
2. Is the monetary policy redistribution effect asymmetric?
3. Does monetary policy affect inequality differently across sectors?
Monetary Policyunder Inflation-Targeting inSouth Africa
Serena Merrino
State of the Art
I RedistributiveChannels
II Data
III VECM
IV Results
Conclusions
Figures
7/21
II DataMeasuring Labour Earnings Inequality through PALMSv3.3
I The Post-Apartheid Labour Market Series is a stackedcross-section of 68 survey waves (N ∼ 6 million) conducted by StatsSA between 1993 to 2019Q2, and later harmonised by DataFirst.
Monetary Policyunder Inflation-Targeting inSouth Africa
Serena Merrino
State of the Art
I RedistributiveChannels
II Data
III VECM
IV Results
Conclusions
Figures
8/21
II DataMeasuring Labour Earnings Inequality through PALMSv3.3
I The Post-Apartheid Labour Market Series is a stackedcross-section of 68 survey waves (N ∼ 6 million) conducted by StatsSA between 1993 to 2019Q2, and later harmonised by DataFirst.
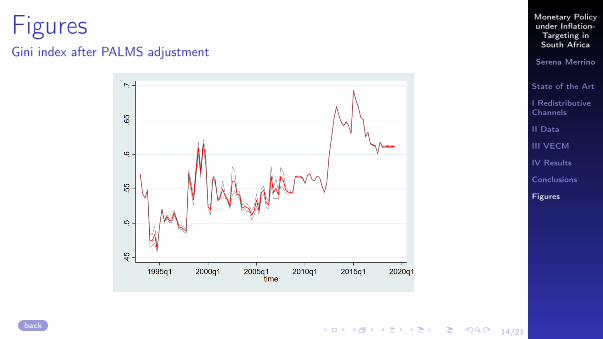
I The inequality time series refers to pre-tax wage income atconstant prices and individual level, for employees in the working age,collected between 2000Q1 and 2019Q2.
Gini after adjustment

Monetary Policyunder Inflation-Targeting inSouth Africa
Serena Merrino
State of the Art
I RedistributiveChannels
II Data
III VECM
IV Results
Conclusions
Figures
9/21
II DataIdentification of Monetary Policy Shocks
To identify monetary policy innovations purged of anticipatory effects, I follow a simpleversion of Romer and Romer (2004):
δim = α + β i ++2∑
t=−1
γt∆ymt ++2∑
t=−1
λt πmt + εm (1)
m indicates MPC meetings from 2000Q3 to 2019Q2im is the change in prime rate (average);i is the Reuters’ forecast prime rate;∆ymt is the forecast real growth rate;πmt is the forecast inflation;εm is the exogenous monetary policy innovation;
All data is sourced from SARB.MP shock

Monetary Policyunder Inflation-Targeting inSouth Africa
Serena Merrino
State of the Art
I RedistributiveChannels
II Data
III VECM
IV Results
Conclusions
Figures
10/21
III VECMThe effect of MP shocks on Labour Earnings Inequality
Given the system of I(1) endogenous variables is found to be cointegrated(r = 1), a VECM(1) is specified (2000Q3-2019Q2):
ytπt
εtIneqt
= c+
∗ 0 0 0∗ ∗ ∗ 0∗ ∗ ∗ 0∗ ∗ ∗ 0
yt−1πt−1εt−1
Ineqt−1
+
p∑i=1
Ct−1
∆yt−1∆πt−1∆εt−1
∆Ineqt−1
+breakt+
∗ ∗ ∗ ∗∗ ∗ ∗ ∗∗ ∗ ∗ ∗∗ 0 ∗ ∗
uy tuπ t
uεtuI ne qt
(2)
yt is Real GDP growthπt is CPI inflationεt is the MP shockIneqt is the Gini index on wage earningsbreakt is the dummy variable that accounts for the 2012 break in the Gini index et is thestructural shock
Monetary Policyunder Inflation-Targeting inSouth Africa
Serena Merrino
State of the Art
I RedistributiveChannels
II Data
III VECM
IV Results
Conclusions
Figures
11/21
IV ResultsImpulse Response Functions
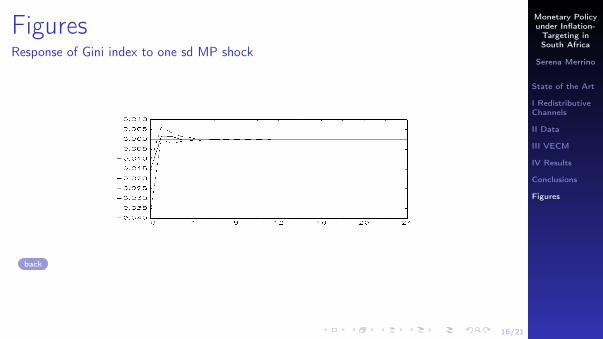
Response of Gini Index
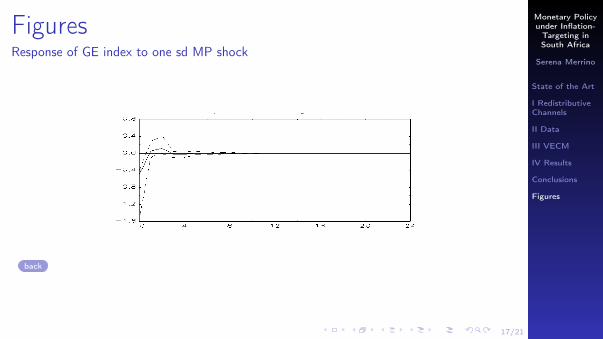
Response of GE index
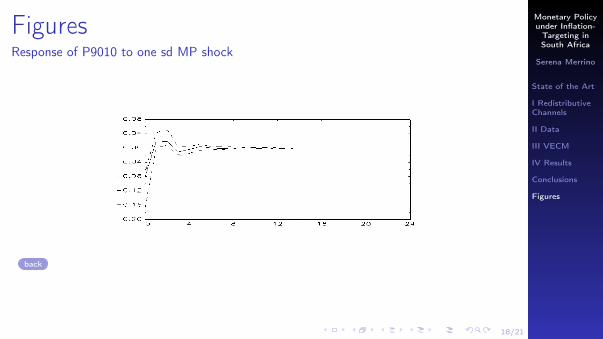
Response of P9010
Response of P9050
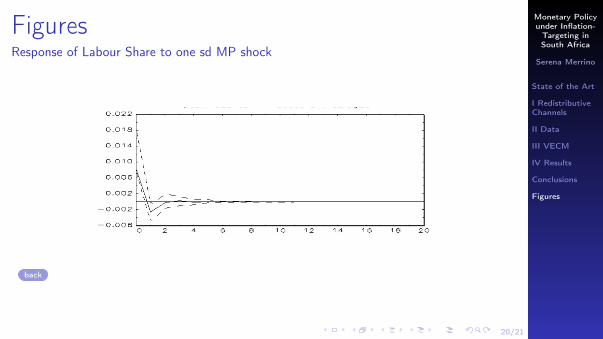
Response of Labour Share of Income
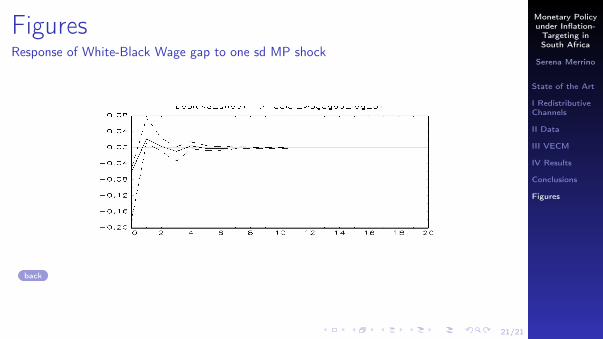
Response of the White-Black wage gap

Monetary Policyunder Inflation-Targeting inSouth Africa
Serena Merrino
State of the Art
I RedistributiveChannels
II Data
III VECM
IV Results
Conclusions
Figures
12/21
Conclusions
I Unexpected monetary policy contractions have tiny but immediate andsignificant effects on wage inequality in South Africa.
Due to the segmentation of the SA labour market, the prime rate deteriorates lowwage-paid employment disproportionally.
The gap between the richest and the poorest 10 per cent of wage-paid workerswidens and overall inequality worsens.
I A contractionary monetary policy shock is also found to widen the black–whitewage gap significantly.
I The biggest sectors (trade, manufacturing, public sector) do not significantlyrespond to monetary policy shocks in distributional terms.
Monetary Policyunder Inflation-Targeting inSouth Africa
Serena Merrino
State of the Art
I RedistributiveChannels
II Data
III VECM
IV Results
Conclusions
Figures
13/21
Conclusions
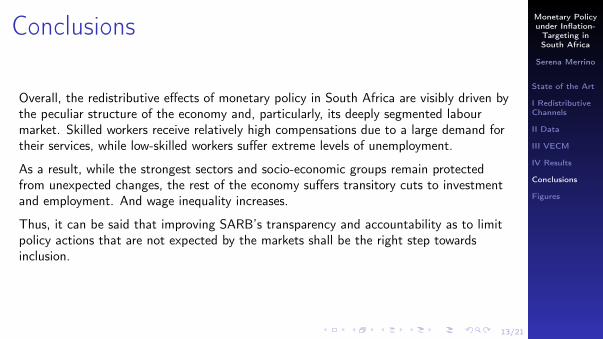
Overall, the redistributive effects of monetary policy in South Africa are visibly driven bythe peculiar structure of the economy and, particularly, its deeply segmented labourmarket. Skilled workers receive relatively high compensations due to a large demand fortheir services, while low-skilled workers suffer extreme levels of unemployment.
As a result, while the strongest sectors and socio-economic groups remain protectedfrom unexpected changes, the rest of the economy suffers transitory cuts to investmentand employment. And wage inequality increases.
Thus, it can be said that improving SARB’s transparency and accountability as to limitpolicy actions that are not expected by the markets shall be the right step towardsinclusion.
Monetary Policyunder Inflation-Targeting inSouth Africa
Serena Merrino
State of the Art
I RedistributiveChannels
II Data
III VECM
IV Results
Conclusions
Figures
14/21
FiguresGini index after PALMS adjustment
back

Monetary Policyunder Inflation-Targeting inSouth Africa
Serena Merrino
State of the Art
I RedistributiveChannels
II Data
III VECM
IV Results
Conclusions
Figures
15/21
FiguresMP shock
back
Monetary Policyunder Inflation-Targeting inSouth Africa
Serena Merrino
State of the Art
I RedistributiveChannels
II Data
III VECM
IV Results
Conclusions
Figures
16/21
FiguresResponse of Gini index to one sd MP shock
back
Monetary Policyunder Inflation-Targeting inSouth Africa
Serena Merrino
State of the Art
I RedistributiveChannels
II Data
III VECM
IV Results
Conclusions
Figures
17/21
FiguresResponse of GE index to one sd MP shock
back
Monetary Policyunder Inflation-Targeting inSouth Africa
Serena Merrino
State of the Art
I RedistributiveChannels
II Data
III VECM
IV Results
Conclusions
Figures
18/21
FiguresResponse of P9010 to one sd MP shock
back

Monetary Policyunder Inflation-Targeting inSouth Africa
Serena Merrino
State of the Art
I RedistributiveChannels
II Data
III VECM
IV Results
Conclusions
Figures
19/21
FiguresResponse of P9050 to one sd MP shock
back
Monetary Policyunder Inflation-Targeting inSouth Africa
Serena Merrino
State of the Art
I RedistributiveChannels
II Data
III VECM
IV Results
Conclusions
Figures
20/21
FiguresResponse of Labour Share to one sd MP shock
back
Monetary Policyunder Inflation-Targeting inSouth Africa
Serena Merrino
State of the Art
I RedistributiveChannels
II Data
III VECM
IV Results
Conclusions
Figures
21/21
FiguresResponse of White-Black Wage gap to one sd MP shock
back