monetary policy in india - cafral policy in india ... weighted average call rate as the explicit...
TRANSCRIPT

1
Monetary Policy in India
Deepak Mohanty Executive Director
Reserve Bank of India
September 16, 2013

2
An Outline
I. Objective(s)
II. Policy Framework
III. Operating Procedure
IV. Outcome
V. Conclusion
3
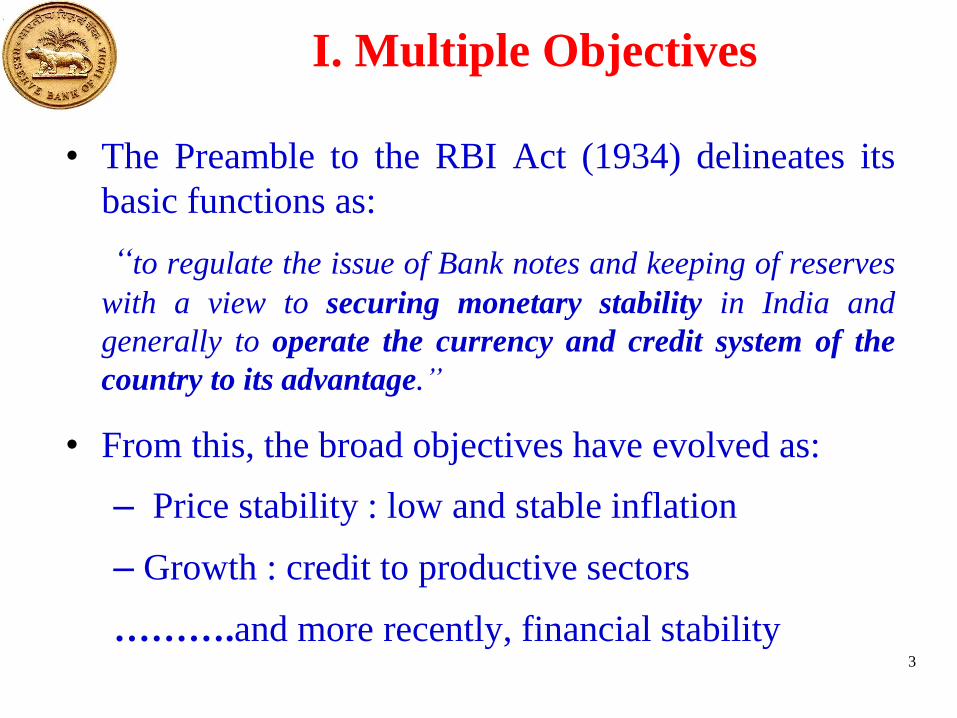
I. Multiple Objectives
• The Preamble to the RBI Act (1934) delineates its
basic functions as:
“to regulate the issue of Bank notes and keeping of reserves
with a view to securing monetary stability in India and
generally to operate the currency and credit system of the
country to its advantage.”
• From this, the broad objectives have evolved as:
– Price stability : low and stable inflation
– Growth : credit to productive sectors
……….and more recently, financial stability

4
II. Monetary Policy Framework
• Significant changes in monetary policy framework
Driven by:
- Financial market developments
- Institutional setting
- openness of the economy
- Shifts in monetary transmission mechanism
• No formal targets till mid-1980s
- Credit planning in mid-1960s
• Monetary Targeting : 1985-86 to 1997-98
• Multiple Indicators Approach : 1998-99 onwards

5
Monetary Targeting Framework (1986-1998)
• Key features
- Relatively closed economy
- Fiscal dominance
- Underdeveloped financial markets: interest rate regulation
• Broad money (M3) growth : the nominal anchor
• Reserve money : the operating target
• Bank Reserves: the operating instrument
• Stable relationship between money, output and prices
• Flexible approach allowing for feedback effects

6
Transition to the Multiple Indicators Approach (MIA)
Key features
- Relatively open economy
- Fiscal consolidation, eventually ‘fiscal rule’
- Financial market integration : through interest deregulation
- Problems in targeting money, rate channels gained importance
Use of multiple indicators
• High frequency data - interest rates/rates in financial markets
• Medium frequency data - currency, credit, banking data, inflation
• Low frequency data - fiscal, trade, capital flows and BoP, GDP
For drawing policy perspectives

7
Increasing Depth in the Financial Markets
0.0
1.0
2.0
3.0
4.0
5.0
6.0
7.0
8.0
9.0
10.0
Per
cen
t o
f G
DP
G-sec (Central Govt) Foreign Exchange Market Money Market (including CP & CD Excl. T Bills )

8
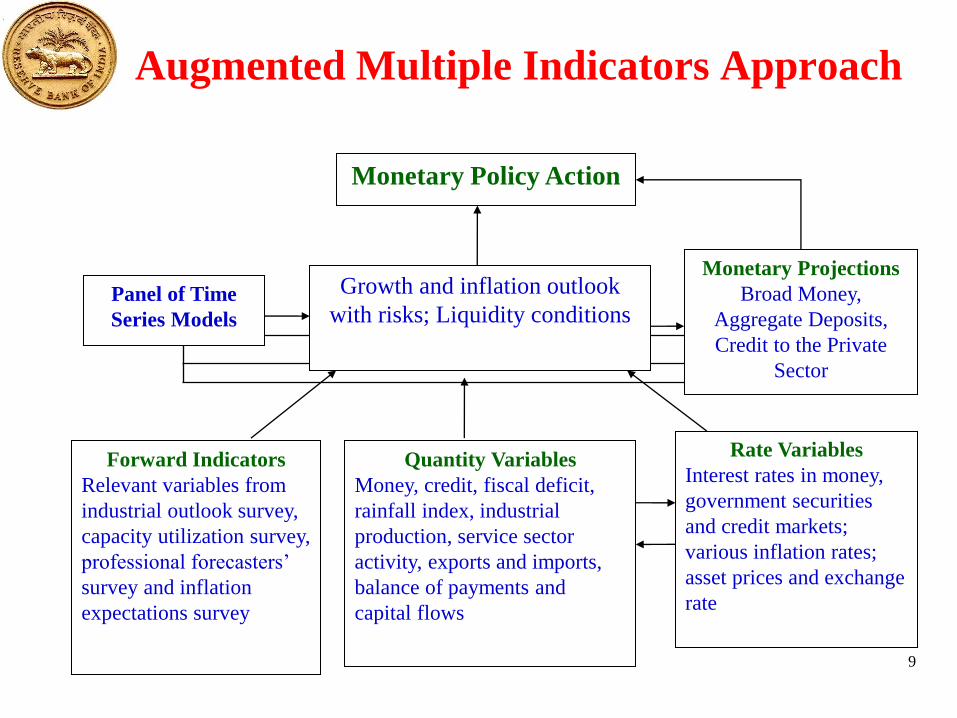
Evolution of Multiple Indicators Approach
• Multiple indicators approach
- Use of both quantity and rate variables
- Broad money continues to be an information variable
• Augmented multiple indicators approach
- Forward looking indicators (mid-2000s)
- Panel of models
9
Augmented Multiple Indicators Approach
Augmented Multiple Indicators Approach
Monetary Policy Action
Growth and inflation outlook
with risks; Liquidity conditions
Quantity Variables
Money, credit, fiscal deficit,
rainfall index, industrial
production, service sector
activity, exports and imports,
balance of payments and
capital flows
Rate Variables
Interest rates in money,
government securities
and credit markets;
various inflation rates;
asset prices and exchange
rate
Forward Indicators
Relevant variables from
industrial outlook survey,
capacity utilization survey,
professional forecasters’
survey and inflation
expectations survey
Monetary Projections
Broad Money,
Aggregate Deposits,
Credit to the Private
Sector
Panel of Time
Series Models

10
III. Operating Procedure
• Shift to indirect instruments of monetary control
• Money market the focal point for liquidity management
Liquidity Adjustment Facility (LAF)
- Repo and Reverse repo rate defines the corridor
- Primary instruments of interest rate signaling
- Primary instrument of managing day-to-day liquidity
Open Market Operations (OMO)
- Outright purchases/sales of G-Sec
Market Stabilisation Scheme (MSS)
- to absorb liquidity of more enduring capital flows
Flexible use of multiple instruments – LAF, OMO, CRR, SLR

11
Moving to a New Operating Procedure
Limitations of Extant LAF
Lack of single policy rate
lack of a firm corridor
Therefore, new operating procedure in May 2011.
Key Features of New LAF:
Weighted average call rate as the explicit operating target
Repo rate: only independently varying policy rate
New Marginal Standing Facility (MSF): linked to repo rate
The revised corridor with a fixed width of 200 basis points

12
New operating procedure
Rate of
interest
X+100 bps
X
X-100 bps
Bank Rate / Marginal Standing
Facility Rate (Ceiling)
Policy Rate (Repo Rate)
Overnight Call Rate (Target
Rate)
Reverse Repo Rate (Floor)
Liquidity
[This standing facility is available unlimited against collateral of
government securities from excess SLR and up to 2 per cent of
banks’ NDTL from required SLR].
[Liquidity against excess SLR securities and export credit refinance
facility for banks and liquidity facility for PDs]
[Liquidity absorption by the Reserve Bank of India against government securities]
• MSF rate recalibrated at 300 basis points above the policy repo rate on July 16, 2013 as part of measures to address exchange rate volatility.

13
Transmission Generally Stronger
Under Liquidity Deficit
-2.5
-2
-1.5
-1
-0.5
0
0.5
1
1.5
2
0
2
4
6
8
10
12
14
16
Oct
/09
Dec
/09
Feb
/10
Ap
r/10
Jun
/10
Au
g/1
0O
ct/1
0D
ec/1
0
Feb
/11
Ap
r/11
Jun
/11
Au
g/1
1O
ct/1
1D
ec/1
1
Feb
/12
Ap
r/12
Jun
/12
Au
g/1
2O
ct/1
2D
ec/1
2
Feb
/13
Ap
r/13
Jun
/13
Au
g/1
3
Liq
uid
ity (
Rs.
Tri
llio
n)
Rat
e (P
erce
nt)
Repo Rate Weighted Call Rate Liquidity (RHS)
-2.5
-2
-1.5
-1
-0.5
0
0
2
4
6
8
10
12
14
16
May
/13
May
/13
May
/13
Jun
/13
Jun
/13
Jul/
13
Jul/
13
Aug
/13
Aug
/13
Sep
/13

14
Call Rate More Stable
Under the New Procedure
Recent volatilities largely due to pressure in foreign exchange market.
4
6
8
10
12
14
02/J
ul/
10
02/S
ep/1
0
02/N
ov
/10
02/J
an/1
1
02/M
ar/1
1
02/M
ay/1
1
02/J
ul/
11
02/S
ep/1
1
02/N
ov
/11
02/J
an/1
2
02/M
ar/1
2
02/M
ay/1
2
02/J
ul/
12
02/S
ep/1
2
02/N
ov
/12
02/J
an/1
3
02/M
ar/1
3
02/M
ay/1
3
02/J
ul/
13
02/S
ep/1
3
Rat
e (P
erce
nt)
Call rate(ON) Average call rate
Average (AV) = 6.32
Standard Deviation (SD) = 0.74
Coefficient of variation (CV) =
11.72
Average (AV) = 8.07
Standard Deviation (SD) = 0.74
Coefficient of variation (CV) = 9.15
4
6
8
10
12
14
02/M
ay/1
3
16/M
ay/1
3
30/M
ay/1
3
13/J
un/1
3
27/J
un/1
3
11/J
ul/
13
25/J
ul/
13
08/A
ug
/13
22/A
ug
/13
05/S
ep/1
3

15
Call Rates Highly Correlated with
Other Money Market Rates
• Weighted call rate explicitly recognised as the operating target
0.0
2.0
4.0
6.0
8.0
10.0
12.0
14.0
2-A
pr-
09
2-J
un
-09
2-A
ug-0
9
2-O
ct-0
9
2-D
ec-0
9
2-F
eb-1
0
2-A
pr-
10
2-J
un
-10
2-A
ug-1
0
2-O
ct-1
0
2-D
ec-1
0
2-F
eb-1
1
2-A
pr-
11
2-J
un
-11
2-A
ug-1
1
2-O
ct-1
1
2-D
ec-1
1
2-F
eb-1
2
2-A
pr-
12
2-J
un
-12
2-A
ug-1
2
2-O
ct-1
2
2-D
ec-1
2
2-F
eb-1
3
2-A
pr-
13
2-J
un
-13
2-A
ug-1
3
Ra
te (
Per
cen
t)
Weighted Money Market Rate (Call+CBLO+MR)
Weighted Call Rate
91 Day T-Bill (secondary market)
0.0
2.0
4.0
6.0
8.0
10.0
12.0
14.0
2-M
ay-1
3
16
-May
-13
30
-May
-13
13
-Jun
-13
27
-Jun
-13
11
-Jul-
13
25
-Jul-
13
8-A
ug-1
3
22
-Aug
-13
5-S
ep-1
3

16
IV: Outcome Improved Macroeconomic Performance
Under MIA albeit Some Recent Deterioration
Indicator
GDP
Growth (%)
Inflation (%) Call Rate
(%) WPI CPI-IW
1 2 3 4 5
Monetary Targeting
1985-86 to1997-98 5.5 8.1 9.1 11.7
(2.2) (3.0) (2.1) (4.0)
Multiple Indicators Approach
Pre-crisis
1998-99 to 2008-09 6.9 5.4 5.7 6.7
(1.9) (1.6) (3.0) (1.5)
Post-crisis
2009-10 to 2012-13
Projection (latest)
2013-14
7.3
5.5
7.4
5.0
10.4
6.3
Post-crisis: Inflation has remained high

17
Inflation Pressures Emerge, though the level is lower
4.0
5.0
6.0
7.0
8.0
9.0
10.0
11.0A
pri
l
May
Ju
ne
Ju
ly
Au
gu
st
Sep
tem
ber
Oct
ob
er
No
vem
ber
Dec
emb
er
Ja
nu
ary
Feb
ruary
Marc
h
Y-o
-Y P
er
Ce
nt
WPI Inflation (Y-o-Y)
2011-12 2012-13 2013-14

18
Inflation Pressures from Food and Fuel Persist
* Three month moving average
0
5
10
15
20
25
Ap
r-1
0
Jun-1
0
Au
g-1
0
Oct
-10
Dec
-10
Feb
-11
Ap
r-1
1
Jun-1
1
Au
g-1
1
Oct
-11
Dec
-11
Feb
-12
Ap
r-1
2
Jun-1
2
Au
g-1
2
Oct
-12
Dec
-12
Feb
-13
Ap
r-1
3
Jun-1
3
Y-o
-y *
per
cen
t
All Commodities Food Articles Fuel & Power Non food manufacturing

19
Second-round Impact on CPI is visible
4
5
6
7
8
9
10
11
12
per
cen
t
WPI, CPI New (Combined) YoY Trends
WPI- All Commodities
New CPI (Combined)
New CPI (Combined)- ex. Food, Fuel and housing (Weight 33.2)

20
Demand Pressures from Fiscal Deficit are Significant
2
3
4
5
6
7
8
9
10
11
200
0-0
1
200
1-0
2
200
2-0
3
200
3-0
4
200
4-0
5
200
5-0
6
200
6-0
7
200
7-0
8
200
8-0
9
200
9-1
0
201
0-1
1
201
1-1
2
201
2-1
3
201
3-1
4
Per
cen
t o
f G
DP
Gross Fiscal Deficit- Budget Estimate vs Outcome
GFD - Centre BE GFD - Centre Outcome
GFD - Combined BE GFD - Combined Outcome

21
CAD Risks Remain
-6.0
-4.0
-2.0
0.0
2.0
4.0
6.0
19
70
-71
19
72
-73
19
74
-75
19
76
-77
19
78
-79
19
80
-81
19
82
-83
19
84
-85
19
86
-87
19
88
-89
19
90
-91
19
92
-93
19
94
-95
19
96
-97
19
98
-99
20
00
-01
20
02
-03
20
04
-05
20
06
-07
20
08
-09
20
10
-11
20
12
-13
Perc
ent
of
GD
P
Both Oil and Non-oil current account balance deteriorated Significantly since 2008-09
Non-oil CAB CAB

22
Monetary Policy: Changes in Key Policy Rate
Overall NFMP Fuel Food
I. Oct-09 to Mar-10 25 75 7.1 1.6 4.6 18.1
II. Apr to Jul-10 75 25 10.4 5.6 13.8 15.4
III. Aug to Nov-10 50 - 8.8 5.4 11.2 10
IV. Dec-10 to Dec-11 225 - 9.5 7.6 13.1 8.1
V. Jan-12 to Aug-13 (-)125 (-)200 6.9 4.5 10.7 8.4
Inflation rates in last row are till July 2013
MSF rate increased by 200 bps from 8.25% to 10.25% w.e.f July 15, 2013
Inflation Phases and Changes in Key Policy Rates
PeriodRepo
(bps)
CRR
(bps)
WPI

23
Monetary Policy Witnessing Calibrated Easing After a Tightening Cycle
-1
0
1
2
3
4
5
6
7
8
9
10
11
12
Ap
r-07
Jul-
07
Oct
-07
Jan
-08
Ap
r-08
Jul-
08
Oct
-08
Jan
-09
Ap
r-09
Jul-
09
Oct
-09
Jan
-10
Ap
r-10
Jul-
10
Oct
-10
Jan
-11
Ap
r-11
Jul-
11
Oct
-11
Jan
-12
Ap
r-12
Jul-
12
Oct
-12
Jan
-13
Ap
r-13
Jul-
13
Repo Rate CRR WPI Inflation 3m-MA

24
V. Conclusion
• Monetary policy in India : more eclectic
• Multiple Objectives: price stability, growth and financial stability
• Multiple instruments : provides flexibility
• Role of other factors: Fiscal consolidation & Globalisation
• Post-crisis:
- Some worsening in growth and inflation
• More-recent:
- Currency market pressure
- Stability? Pass-through?

25
Thank You