monetary policy in asia and the pacific in the post,...
TRANSCRIPT

Monetary Policy in Asia and the Pacific
In the Post, Post-Crisis Era
Hiro Ito*
October 22, 2013
Abstract
As the United States started considering normalizing its monetary policy and tapering unconventional
monetary measures, some of the emerging market economies (EMEs), including those in Asia, that received
massive capital inflows in the immediate aftermath of the global financial crisis of 2008 seem afraid of capital
flight and possibly a financial crisis as it happened in the late 1990s. Several key economic indicators suggest
that the current situation of Asian EMEs is more favorable compared to the pre-Asian crisis period. Most of the
Asian EMEs are experiencing more favorable current account balances and hold much more international
reserves. Asset markets do not show signs of overheating. In terms of open macro policies based on the
trilemma hypothesis, Asian EMEs on average have higher levels of monetary autonomy and exchange rate
flexibility than in the pre-Asian crisis years of the 1990s. However, it has been increasingly argued that
financial globalization has been playing a bigger role in determining domestic asset prices and long-term
interest rates. In fact, in recent years, the correlation of long-term interest rates between Asian EMEs and the
United States has been rising while the correlation of short-term rates does not show such a trend. In other
words, Rey’s (2013) “irreconcilable duo” – the trilemma reduces to a dilemma between monetary autonomy
and free capital mobility – may be applicable to long-term interest rates, though not to the short-term interest
rates. This paper presents empirical results that net capital inflows can contribute to weakening the link
between short-term and long-term interest rates. However, the effect of net capital inflows on the extent of
interest rate pass-through is greater in the pre-Asian crisis period than in recent years including the Great
Moderation period and the post-global financial crisis years. Economies open to cross-border capital flows or
with more developed financial markets tend to have greater negative relationship between net capital inflows
and the extent of interest rate pass-through.
JEL No. F41, O53
Acknowledgements: This paper was prepared for the 36th Pacific Trade and Development (PAFTAD)
Conference “Financial Development and Cooperation in Asia and the Pacific,” November 19-21, 2013. The
financial support of faculty research funds of Portland State University is gratefully acknowledged. I also
thank the discussants for the session Monetary Policy Framework in the Asia and Pacific Region of the
PAFTAD 36 conference.
* Ito: Department of Economics, Portland State University, 1721 SW Broadway, Portland, OR 97201, U.S.A;
e-mail: [email protected]
1
1. Introduction
Countries around the globe have being nervously paying attention to the state of the
advanced economies. Many of the advanced economies still have not been able to embark on a
sustainable recovery path from the recessionary situation caused by the global financial crisis of
2008 followed by the Euro debt crisis. The United States, the Euro area, the United Kingdom,
and Japan have essentially exhausted conventional monetary policy measures by guiding their
policy interest rates to almost zero. These economies have had in place unconventional monetary
policy measures including large-scale asset purchases and quantitative easing (QE).1
While the advanced economies have been struggling to jumpstart their economies, other
economies, especially emerging market economies (EMEs) most of which were barely affected
by the 2008 crisis, have become good investment destinations for international investors.
Shunning extremely low rates of return and growth uncertainties in the advanced economies, a
massive amount of capital inundated many EMEs (Figure 1).
Until recently, policy makers in the EMEs faced a dilemma. On the one hand, the influx
of “hot money” made EMEs’ currencies face appreciation pressure, that could harm the trade
competitiveness of these export-dependent economies. However, the appreciation pressure can
be mitigated by foreign exchange interventions which EMEs did (figure 2). Despite sterilization
efforts, interventions started creating inflationary pressures in some economies. Thus, many
EMEs had to face the trade-off of stabilizing their currency values or retaining monetary
autonomy and restrain inflation pressure.
More recently, the tide of the world economy seems to have changed. The U.S. and
Japanese economies started showing some signs of recovery while the Euro debt situation seems
to have been stabilized. This situation has created a different type of dilemma for many of EMEs.
On the one hand, the recovery of advanced economies is beneficial to these economies because
the advanced economies are important trading partners for EMEs after all. On the other hand,
recovery in the advanced world, that may lead to lifting the extremely low interest rate policies
or a tapering of unconventional monetary measures, could change the direction and volume of
capital flows. In fact, in the summer of 2013, a mentioning of a possible tapering of the QE by
U.S. Federal Reserve officials unnerved the international financial markets especially those in
1 Refer to Fawley and Neely (2013) for an extensive review on unconventional monetary policy measures taken by
the United States, Japan, the United Kingdom, and the Euro area.

2
EMEs. As of the summer of 2013, those EMEs that are particularly dependent on external capital
such as India, Brazil, Indonesia, Turkey, and South Africa have already experienced rapid
depreciation of their currencies.
In the immediate aftermath of the crisis, despite the dilemma of currency appreciation
pressures vs. inflationary expectations, it is also true that the influx of hot money contributed to
lowering the cost of capital and helped the economies of capital recipient countries boom. Along
with being scatheless from the global crisis, easy money created a sense of complacency among
some EMEs.
Now that the United States, the epicenter of the global financial crisis, started considering
normalizing their monetary policy and tapering unconventional measures, it seems that we are
now about to enter the world of the “post-, post-crisis” period. Some of the EMEs that received
massive capital inflows seem afraid of starting the post-, post-crisis era with capital flight and
possibly a financial crisis.
This situation directly applies to the economies in Asia and the Pacific. Especially,
Southeast Asian countries received massive capital inflows and faced high appreciation pressures
in the immediate post-crisis period. Now, these EMEs are feeling nervous about the recovery of
advanced economies and a possible tapering of their monetary measures.
In the Asia and Pacific region, economies are paying close attention to the three
economic giants: the United States, Japan, and China. For the U.S. and Japan, smaller economies
need to be concerned about the potential changes in monetary policies of the two economies, but
especially the United States. As for China, while its monetary policy does not yet have the same
effect on the EMEs to the same extent as the U.S. or Japan, the current slowdown of the
economy and the possibility of a non-performing loans problem due to the implosion of the
shadow banking system may have massive impacts on smaller neighboring economies.
Against this background, this paper examines monetary policy management in the Asia
and Pacific region with focus on the EMEs and their linkages with the economic giants. More
particularly, this paper will explore the following questions. Are the small, open economies in
the region facing a similar situation to the one immediately before the breakout of the Asian
crisis? What kind of challenges are these economies facing in terms of managing monetary
policy in a globalized world? To what extent and how can these economies be affected by the
monetary policy decisions of major advanced economies? What are the issues central bankers

3
and other policy makers should be aware of in managing their economies through the potential
spell-over effects?
2. Are We Seeing the Déjà-vu? – Comparison Between the Pre-Asian Crisis and the
Current Economic Situations for Asia
2.1. Economic Indicators
The first question to explore is whether the economies in the Asian region are facing a
similar situation to the time immediately before the Asian financial crisis of 1997-98. Table 1
reports the key economic indicators, especially those considered as good predictors of financial
crises.2
Overall, the economic conditions of the Asian economies as of 2010-12 do not appear as
overheating as in the pre-Asian crisis years. In those years, the economies that ended up
experiencing financial crises (i.e., Indonesia, Korea, Malaysia, and Thailand) experienced
persistent, sizeable current account deficit. Now, all these economies as well as others have had
better current account balances. Especially, the improvement of current account balances of the
four crisis economies is quite notable. India and Indonesia are the only two economies that have
had cumulative current account deficit in the 2010-12 period. Indonesian current account deficit
situation is still better than in the pre-Asian crisis years whereas India’s current account balances
are worse. As of this writing, both economies are experiencing relatively large currency
depreciation pressure.
Better current account balances are also reflected as higher levels of international
reserves (IR) holding. The former crisis economies, except for Indonesia, have increased the
amount of IR holding significantly, reflecting their precautionary motives to hold a large amount
of IR (Aizenman and Lee, 2007). As for Indonesia, given the size of its economy, the amount of
IR holding does not appear large in terms of both as a ratio to GDP and to total external debt,
which may explain the rapid depreciation of the currency in recent years.
The growth of both private credit creation and stock market capitalization, which can be
good predictors of asset markets overheating, is mostly contained compared to the pre-Asian
crisis period, though several economies such as Korea and Thailand are experiencing rapid
2 “Cumulative CA” is the sum of current account balances over the period and expressed as the ratio to the GDP as
of the last year of the period (i.e., 1996 or 2011). “Credit growth” and “Stock market growth” are the annual changes
in the ratios of private credit creation and stock market capitalization as ratios to GDP, respectively.

4
growth in stock market capitalization and several others such as China, Hong Kong, Malaysia,
Singapore, and Vietnam are experiencing a market slump. Similarly, inflation situations
significantly improved, except for Vietnam.
Like other financial crises in EMEs, the Asian crisis economies experienced an influx of
capital inflows (or “surges” as in Ghosh, et al., 2012 and others). Figure 3 illustrates the averages
of net private capital flows for different country groups including the group of Emerging Asia
excluding China.3 From the figure, it is clear that, as of the last few years, the emerging market
economies in Asia and the Pacific are not experiencing the surges of capital inflows to the same
extent as in the years leading up to the Asian crisis in the late 1990s. In fact, these economies are
on average experiencing moderate outflows of capital since the beginning of the 2000s.
Asset markets in the Asian economies are not overheated as was the case in the years
before the Asian crisis. Table 2 is an excerpt from the IMF’s Regional Economic Outlook (2011)
and reports several asset market indicators often used to examine whether the markets are
experiencing an overheat or bubble. The table shows to what extent such indicators as
price/earning ratios, residential price/rent ratios, growth of credit-to-GDP ratios, and debt/equity
ratios deviates from their long-term averages when the economy of concern is experiencing a
“surge” of capital inflows.4 Figures in the table are the number of standard deviations for the
deviation from the long-term averages. Colors are based on the number of standard deviations.
Green means the variable of concern is not too much above its long-term average (less than 1.5
standard deviations), orange moderately above (between 1.5 and 2 standard deviations), and red
greatly above the long-term average (greater than 2 standard deviations) which suggests an
overheating based on that particular indicator.
Not surprisingly, during the time of surges in the 1990s, many cells are colored red or
orange, indicating that many economies were experiencing an overheat in their asset markets in
the years leading up to the Asian crisis. Clearly, massive increases in capital inflows were
accompanied with much higher asset valuations in those years. More recently (i.e., as of REO
3 See Appendix for the grouping of countries.
4 For the definitions of the ratios, refer to IMF (2010) or Pradhan, et al. (2011). “Surges” refer to the episodes of
temporarily high capital inflows or to a significant increase in net capital flows. While different researchers have
different definitions of “surges,” it is common to set a threshold for the level of capital inflows and define a surge if
the level of net capital flows surpasses the threshold. See Cardarelli et al. (2009), Forbes and Warnock (2012), Gosh,
et al. (2012), and Reinhart and Reinhart (2008).
5
2011), most of the economies are experiencing the “green” state, except for China and Hong
Kong both experiencing rapid growth in credit creation.5
Lastly, real effective exchange rates appear to be relatively stable for emerging market
economies in Asia, except for China (Figure 4).6 In the post-global financial crisis years, real
effective exchange rates for emerging Asian economies are on a appreciation trend, but the
average level is only less than 5% higher than the level as of June 2008, immediately before the
collapse of Lehman Brothers.7 Compared to the years before the Asian crisis, the extent of real
appreciation is much lower. Along with the high levels of IR holding, the pressure on the foreign
exchange markets is not high.
2.2. The Policy Mix
The economic situations we have observed are partially the outcomes of policy decisions.
Now, let us see how the situations of Asian economies’ open macroeconomic management at
present look compared to the pre-Asian crisis period.
An effective way to observe open macroeconomic management is to apply the concept of
the “impossible trinity” or the “trilemma.”
In the hypothesis of the trilemma, countries are supposed to adopt a combination of three
policy goals: monetary independence, exchange rate stability, and financial openness, with
different degrees of attainment in each. In their policy decisions, we assume that policy makers
tend to focus only on the positive aspects of the three open macro policies, and therefore to
prefer pursuing higher levels in all three policies believing that higher levels of these policies
would help them stabilize their economies.8 However, while it is possible to achieve the full
5 As of this writing, China started experiencing a slow down in credit creation after the summer of 2013.
6 The real effective exchange rate is extracted from the BIS effective exchange rate database. It is reindexed to have
the level of the exchange rate as of June 2008 as 100. 7 One exception among Asian emerging market economies is China. Its currency appreciated in real terms by 25%
since the summer of 2008 (20% in nominal terms). Another exception in the region is Japan. Since the summer of
2008, the effective exchange rate for the Japanese yen appreciated by 40% in nominal terms and 20% in real terms
by mid-2012. However, once Prime Minister Shinzo Abe implemented Abenomics at the end of 2012, the currency
depreciated significantly. As of the fall of 2013, the effective exchange rate for the Japanese yen is about 10% above
the pre-global financial crisis level in nominal terms and 5% below in real terms. 8 Greater exchange rate stability or simply adopting a fixed exchange rate regime would help bring out price stability
and foster investment and international trade by lowering risk premium and mitigating uncertainty. Retaining
monetary autonomy or independence could help stabilize the economy. Greater financial openness may allow
countries to share risks, that would also help stabilize output movement. However, each of the policies has its own
downsides. Greater exchange rate stability can lead to the loss of stabilization through exchange rate fluctuations.
High levels of monetary autonomy could harm fiscal discipline through monetization of the debt. Highly open

6
extent of two policy goals, it is impossible to achieve simultaneously the fullest degrees in all the
three policy goals. In other words, policy makers are constrained by the linear relationship of the
three policies.9 As long as the linear constraint is not violated, an economy may adopt a
combination of intermediate degrees of all of the three policy goals. Thus, an infinite number of
policy combinations can exist.
To see the state of policy mix for the economies of our concern, we use a set of the
“trilemma indexes” developed by Aizenman, Chinn, and Ito (2008). These indexes measure the
degree of three policy choices monetary authorities make in the context of the trilemma. In their
metrics, the monetary policy independence index is based on the correlation of a country’s
interest rates with the base country’s interest rate. The index for exchange rate stability is an
inversion of the annual standard deviations of the monthly rate of exchange rate depreciation
where the exchange rate is defined between the home and the base country.10
The degree of
financial market openness is measured by the capital account openness index developed by
Chinn and Ito (2006, 2008).11
In addition to the three trilemma policies, it would be more useful if we incorporate the
level of IR holding in this context. IR holding has been increasing its importance in the
globalized world and is closely related to changing patterns of the trilemma especially for
developing countries and emerging market economies, because these economies are increasingly
exposed to volatile short-term inflows of capital (or “hot money”), subject to frequent sudden
stops and reversals (see Calvo, 1998). The empirical evidence suggests that international reserves
can reduce both the probability of a sudden stop and the depth of the resulting output collapse
when the sudden stop occurs.12
Aizenman and Lee (2007) link the large increase in reserves
holding to the deepening financial integration of developing countries and find evidence that
financial markets would make the economy vulnerable to external financial shocks and therefore susceptible to
boom and bust cycles. 9 That implies that if the extent of achievement in the three policy goals is measured by some normalized indexes,
the sum of the three indexes must be a constant. Aizenman, et al. (2013) and Ito and Kawai (2012) empirically
proved the linearity of the three policy variables. 10
The base country for both exchange rate stability and monetary independence indexes is defined as the country
that a home country’s monetary policy is most closely linked with as in Shambaugh (2004). The base countries are
Australia, Belgium, France, Germany, India, Malaysia, South Africa, the U.K., and the U.S. 11
More details on the construction of the indexes can be found in Aizenman, et al. (2008). The three indexes are
updated to 2012 for monetary independence and exchange rate stability, and 2011 for financial openness. 12
See Ben-Bassat and Gottlieb (1992), Rodrik and Velasco (1999), and Aizenman and Marion (2004) for papers
viewing international reserves as output and consumption stabilizers.

7
international reserves hoarding serves as a means of self-insurance against exposure to sudden
stops.
The “diamond charts” in Figure 5 are an easy and intuitive way to summarize the trend of
open macro policy combinations. The configuration of the four policy variables of a country or a
country group at a given instant is represented by a “generalized diamond,” whose four vertices
measure monetary independence, exchange rate stability, IR holding (as a ratio to GDP), and
financial integration. The origin has been normalized so as to represent zero monetary
independence, pure float, zero international reserves, and financial autarky. Figure 5 display the
diamond charts for Emerging Asian economies excluding China, the four economies that
experienced the Asian crisis of 1997-98, non-Asian emerging economies, and China for three
different time periods: the pre-Asian crisis period (1990-96), the pre-global financial crisis
period (2000-07), and the post-global financial crisis period (2010-12).13
In the figure, we can make several interesting observations about the development of
Asian economies’ open macro policies in recent years compared to the past periods. First, Asian
emerging market economies have reduced the extent of exchange rate stability over time after the
Asian crisis. This also applies to China to a lesser extent, reflecting its decision to allow more
exchange rate fluctuations in 2010 after repegging to the dollar in 2008. Second, while the extent
of financial openness declined slightly for the group of Emerging Asian economies, some of the
extent of exchange rate stability is replaced with a pursuit for greater monetary independence.14
Much of the increase in monetary independence levels can be explained by the zero interest rate
policy implemented by the U.S. In essence, Emerging Asian countries’ monetary policies have
become decoupled from that of the U.S. or other advanced economies, which was also necessary
to shun the influence of the crisis situations in the advanced economies. Third, as has been
widely reported, Asian EMEs have increased the level of IR holding. Not only the Asian crisis
economies, but also the economies that did not experience the Asian crisis have also increased
the level of IR holdings. Dominguez et al. (2011) show that countries with high levels of IR
holding performed better in terms of GDP growth in the post-global financial crisis period.
Obstfeld et al (2009) show that countries with larger international reserve holdings experienced
13
For financial openness, the period average is calculate for 2010-11 since the index is available only up to 2011. 14
The level of financial openness dropped significantly for the four crisis economies because all the economies,
except for Korea, lowered the level of financial openness in 2010-11. For the Emerging Asian group excluding the
four crisis economies, it is found that the degree of financial openness have been increasing over time since the
1990s.

8
smaller sizes of currency depreciations during 2008. Considering these points, it is
understandable for these economies to increase IR holdings. Also, the extent of fall in the level
of exchange rate stability could have been larger if these economies had not had massive IR
holdings. Fourth, China continues to increase its IR holding in the 2010-12 period, making its
GDP ratio up to 43%.15
Chinese monetary authorities have been trying to abate the appreciation
pressure by intervening the foreign exchange market. Furthermore, the global financial crisis
may have convinced Chinese monetary authorities about the importance of international reserves
as buffers to financial globalization, though the depreciation trend of the U.S. dollar has been a
headache for their reserve portfolio management.
Panel (d) of Figure 5 shows that none of the recent characteristics of Asian EMEs applies
to other EMEs. Non-Asian EMEs maintain the same levels of monetary independence and
exchange rate stability for the last two decades, while slightly increasing the level of financial
openness over the years. They have also increased the level of IR holdings, but not to the same
extent as Asian EMEs.
Over all, despite the expectation that advanced economies, mainly the U.S., may
normalize their monetary policy, and that that may lead to capital reversals from emerging
market economies, economic indicators and the current situation of open macro policy
management give us a benign picture of the state of the economy unlike the time immediately
before the Asian crisis.
However, alarmists claim that because of the ostensibly irreversible waves of financial
globalization, the fate of economies outside the advanced world, especially open small ones, is
so intertwined with the policy changes in the economic center country, i.e., the United States.
Now, we need to investigate the issue of financial interlinkages.
3. Interest Rates Linkages and Their Implications on Monetary Policy Management
3.1. Linkages between Domestic Interest Rates and Financial Globalization
Recently, a number of researchers have argued that financial globalization has made
domestic asset prices and interest rates more vulnerable to developments in capital markets
abroad. They also argue that if domestic financial markets are more susceptible to international
15
The volume of China’ reserves is $3.7 trillion as of the end of September 2013. The volume of U.S. treasuries is
$1.3, accounting for about one third of the total.

9
factors, that would help decouple short-term and long-term interest rates. That is, while short-
term interest rates are under more direct controls of monetary policy makers, long-term yields
can be more affected by global factors if the domestic market is more open to international
investors, thereby making it harder for policy makers to control longer-term interest rates
through manipulating the shorter end of the yield curve. Because long-term interest rates affect
both financial and real activities more directly, decoupling of short-term and long-term interest
rates could also mean policy makers would have a harder time in managing both macroeconomic
and financial stability.
In the mid-2000s, when the U.S. Federal Reserve was raising the federal funds rate to
rein in the economy, the longer-end of the yield curve turned out to be less responsive. The
former Federal Reserve Chairman Mr. Alan Greenspan referred to the lack of responsiveness in
the long-term interest rates as “conundrum.” A widely received argument to explain the
conundrum was the “global saving glut” view (Bernanke, 2005; Clarida, 2005; Greenspan,
2005a,b). According to this view, the lack of sophisticated financial assets or other investment
opportunities in countries with excess saving, namely, China, Japan, other East Asian economies,
and oil exporters, had led to massive capital flows to the United States where financial markets
are well-developed and sophisticated, and legal systems and institutions support smooth financial
transactions (Caballero, et al., 2008). Warnock and Warnock (2009) estimate that if there were
no foreign purchase of U.S. Treasury and agency bonds, U.S. long-term interest rates would have
been 80 basis points higher. In a cross-sectional context, Byrne, et al. (2010) provided empirical
evidence that the disconnect of short- and long-term interest rates is not just happening to the
U.S. but also to other industrialized countries.
While the “Greenspan conundrum” received much attention in the debate for the cause of
the U.S. housing bubble or the global imbalances, it has also been pointed that emerging market
economies have also been experiencing their own conundrum. As the financial markets of the
EMEs become more open toward foreign investors, foreign capital flow may have started
affecting the pricing of assets and interest rates in these economies. Both Pradhan, et al. (2010)
and Peiris (2010) found that among major EMEs, a one percentage point increase in nonresident
purchases of local bonds would lead to a 5-6 basis points reduction in long-term yields.
Figure 6 illustrates the development of the degree of financial openness using the Chinn-
Ito de jure measure of financial openness (panel (a)) and the de facto measure based on the Lane

10
and Milesi-Ferretti (2006, 2007, and updates) dataset of external assets and liabilities
(panel(b)).16
Both panels of figures show that emerging market economies have been increasing
the extent of financial openness especially since the mid-1990s, though Emerging Asian
economies, excluding China, Hong Kong, and Singapore, seem to be somewhat lagging behind
other EMEs. Figure 7, however, illustrates that Asian economies have been experiencing a rapid
growth in terms of the share of foreign holdings of government bonds.
In a financially globalized world, global shocks or monetary shocks of the center country,
i.e., the U.S., can influence the ebb and flow of cross-border capital movements, especially for
small open economies. There has been vast literature on identifying “push” (= supply-driven or
global common shocks) and “pull” (= demand-driven or country-specific) factors in determining
the direction and volumes of cross-border capital flows, especially since EMEs with newly
liberalized financial markets experienced financial crises.17
Focusing on the global factors, Forbes and Warnock (2010) categorize episodes of
extreme capital movements into four different types (surges, stops, flights and retrenchments),
and find that global factors such as interest rates in advanced economies, global risk, and
contagion effects affect the retrenchment of residents’ assets abroad. Ghosh, et al. (2012) find
that global factors such as U.S. interest rates and risk aversion (measured by the VIX index)
affect the likelihood of an occurrence of a “surge,” or a rapid increase in capital inflows, while
country-specific factors or structural factors determine the magnitude of capital inflows for the
economies that are experiencing an surge. Ahmed and Zlate (2013) find that global risk appetite
as well as growth and interest rate differentials are important determinants of net private capital
flows to EMEs.18
Figure 8 displays the development of the VIX index, that measures the implied volatility
of S&P 500 index options, as well as the development of net capital flows to EMEs. The VIX
16
The de facto measure is shown as the sum of external assets and liabilities as a ratio to GDP. However, it must be
noted that normalizing the sum of total assets and liabilities as a ratio of GDP would make the resultant index
unnecessarily small for large economies like the U.S. or extremely large for international financial centers such as
Ireland, Luxemburg, Singapore, and Hong Kong. Also, the de facto measure can be subject to cyclical factors as it
appears the index series is dented at the time of the global financial crisis in the figure. For the sample averages of
both measures, the “ex-China Emerging Asia” group excludes Hong Kong and Singapore, both small city states with
the roles as regional financial centers. 17
For the analyses on the “push” and “pull” factors, see Chuhan, et al. (1993), Taylor and Sarno (1997), Griffin, et
al. (2004), and Fratzscher (2011) among many others. 18
The also investigated the impact of U.S. unconventional monetary expansion on net capital flows to EMEs, but
did not find statistically significant effects.
11
index is a measure of uncertainty or risk aversion of the markets, so its scale (on the right-hand
side) is reversed so that it can be seen as a measure of investor risk appetite. From the figure, we
can see that the volumes of capital flows to EMEs tend to rise when risk appetite is higher.
Figure 9 shows the development of VIX and the country group averages of correlations between
long-term yields in the sample countries and the United States.19
Here, when investors have
higher risk appetite, the correlations of long-term yields tend to be higher especially EMEs,
particularly Asian EMEs. In sum, financial globalization may have made asset prices and interest
rates in EMEs more subject to global movements of capital, that is usually heavily influenced by
the monetary policy of the center country, the United States.
More recently, Rey (2013) argues that financial globalization has made countries’
macroeconomic conditions more sensitive to the “global financial cycle” in capital flows, asset
prices, and credit growth. The monetary policy of the center country in the international financial
system is one of the important determinants of the global financial cycle. In the markets where
capital is freely mobile, she continues to argue, the center country’s monetary policy influences
other countries’ national monetary policies through capital flows, credit growth, and bank
leverages. This linkage between the center and other countries’ monetary and financial
conditions is irrespective of the types of exchange rate regime of the non-central countries. In
such a global financial system, the aforementioned monetary trilemma reduces to a mere
dilemma or an “irreconcilable duo” of monetary independence and capital mobility. In other
words, restricting capital mobility is the only way for non-central countries to retain monetary
autonomy.20
While Rey (2013) does not provide any empirical evidence that the trilemma reduces to a
dilemma, or more particularly that the types of exchange rate regimes do not matter for the pass-
through of interest rates from the center country to others, there are several empirical studies
related to this issue. Aizenman, et al. (2013) used the trilemma indexes for 1970 through 2010
and empirically showed that the variables for the three trilemma are linearly related.21
With the
linearity, a rise in one trilemma variable should be traded-off with a drop of the weighted sum of
19
Long-term bond yields are used whenever available. When they are not available for EMEs, lending rates are used. 20
In order for her argument to hold, the world has to have achieved the state of fully free capital mobility. However,
as the previous figures showed, that is true only for traditional advanced economies, not other developing or
emerging market economies. 21
Using a different set of indexes, Ito and Kawai (2012) also evidenced the linearity among the three trilemma
variables.

12
the other two, suggesting that for a given level of financial openness, the type of exchange rate
regime should matter for the extent of monetary independence, which implicitly denies Rey’s
contention of the “irreconcilable duo.” Obstfeld, et al. (2005) examined the extent of the linkage
of the interest rates between the sample countries and their base countries among different
financial openness regimes. They found that in the regime absent of capital controls, countries
with exchange rate pegs lose monetary independence considerably. Klein and Shambaugh (2013)
examined to what extent intermediate levels of exchange rate stability or capital account
openness would allow a country to retain monetary autonomy. They showed that while a full or
even moderate degree of exchange rate flexibility allows a country to retain monetary autonomy,
only extensive, not partial, capital controls would enable a country to have monetary autonomy.
In contrast, Saxena (2008) found the extent of pass-through from foreign interest rates to
domestic interest rates is higher under floating exchange rate regimes than pegging regimes.22
Christiansen and Pigott (1997) also suggest that even under floating exchange rate regimes,
foreign factors play an important role in affecting long-term interest rates.
After all, as previously discussed, like in the case with the U.S. conundrum, external or
global factors have been important determinants of domestic interest rates as Moreno (2008),
Pradhan, et al. (2011), and Ciarlone, et al. (2009) have shown. One way to reconcile Rey’s view
of the “irreconcilable duo” and the trilemma is to allow different degrees of connectivity between
the center and non-central countries depending on what part of the yield curve one is referring to.
In other words, while the concept of monetary autonomy in the trilemma hypothesis is about to
what extent policy makers can have controls over domestic short-term policy interest rates
without being subject to foreign monetary policies, Rey’s “irreconcilable duo” view is more
about interest rates for the longer-end of the yield curve.
Unlike short-term interest rates that are directly under the control of monetary authorities,
long-term interest rates can be influenced by not only short-term policy rates, but also other
factors including future direction of policy, inflation expectations, risk premia, and foreign
interest rates. Hence, as financial globalization proceeds and foreign investors start affecting the
pricing of financial assets, it can become harder for policy makers to have a better grip on the
22
To explain the counterintuitive results, Saxena argues that the classification of exchange rate regimes may allow
some of the countries that conduct active but incomplete foreign exchange interventions to be classified as “floating”
regimes so that the results for the floating regimes may include those of de facto pegging regimes. Also, she argues
countries with floating exchange rates tend to have more developed financial markets which tend to follow the trend
of the center country’s financial markets.

13
longer-end of the yield curve. The possibility of capital reversals or flight, or that of a large
amount of issuances of foreign currency-denominated debt could add to higher risks of longer-
term bonds, and thereby make it harder for policy makers to control the longer-end of the yield
curve. Before examining the possibility, let us see how the correlation between domestic and
foreign interest rates look for Asian and other EMEs.
3.2. Observations of the Interest Rate Pass-through from the Center Country
Panel (a) of Figure 10 illustrates the 36-month rolling correlations of domestic money
market rates with the U.S. money market rate for different country groups, including Asian
EMEs, and China. The figure shows that from 2003 through 2011, the correlation between
domestic and the U.S. interest rates appear relatively high except for 2005 and the time of the
global financial crisis. The two dips in the correlations correspond to the time when the U.S.
Federal Reserve changed its policy rate rapidly.23
For the Asian EMEs, the level of correlations
was high in the early-1990s, reflecting the de facto dollar-pegs many of the economies adopted
during the period. In the last few years, the correlations are negative for all the country groups,
especially Emerging Asia, and China. The figure presents a consistent picture to the previous
diamond charts. As far as the short-term interest rates for Emerging Asia are concerned, the
economies appear to have retained moderately high levels of monetary independence in recent
years.
Panel (b) of Figure 10 displays the correlations between the short-term interest rates of
Emerging Asian economies and those of the U.S., China, and Japan. Since the short-term rates of
China and Japan must be correlated with the U.S. rates, the short-term rates of the two countries
are orthogonalized with respect to the U.S. rates by regressing the Chinese or Japanese rates on
the U.S. rate, respectively, and using the residuals to calculate the correlations with the U.S.
rate.24
Panel (b) makes it clear that it is predominantly the U.S. short-term interest rate that the
short-term rates of Emerging Asian economies are highly correlated with. Chinese and Japanese
short-terms are correlated with those of Emerging Asian economies only briefly, around early
23
The Federal Reserve started raising the federal fund rate target from 1.00% in June 2004 to 5.25% in June 2006. It
started lowering the target from 5.25% in September 2007 all the way essentially to the 0.00-0.25 by December
2008. 24
The blue line for the correlations between Emerging Asian economies’ and U.S. short-term rates is the same as the
blue line in Panel (a). It is included for comparison purposes.

14
2011 for China and around 2000 for Japan. For Emerging Asian economies, clearly, the U.S. is
the center country.
Figure 11 is recreated for long-term interest rates. In Panel (a), the long-term interest
rates of Emerging Asia are highly correlated with that of the U.S. rates in much of the last decade.
Since 2005, the correlation has been on a rising trend despite the global financial crisis and the
rapid decline in the correlations of the short-term interest rates we saw in Figure 10. Since the
late 2000s, it does seem that short- and long-term interest rates have been decoupled, which may
suggest that policy makers may have to find it difficult to control macroeconomic and financial
conditions through maneuvering short-term interest rates.
Furthermore, according to Panel (b) of Figure 11, the U.S. functions as the center country
for Emerging Asian economies in terms of long-term interest rates as well. Figure 12 illustrates
the correlations of stock market price indexes with the U.S. index for different country groups
and China. Since the mid-2000s till recently, all the country groups had maintained high levels of
correlations of stock market price indexes with the U.S. stock market. Since the global financial
crisis, the correlation has been declining for all the groups, but to only a lesser extent for
Emerging Asian economies. In sum, the correlations of both the long-term interest rates and the
stock market price indexes are not well-connected with that of short-term interest rates.
These figures help connect Rey’s view and the trilemma; even if policy makers appear to
have monetary autonomy in the context of the trilemma, it does not necessarily guarantee that
they can well-manage macroeconomic and financial conditions. In other words, the extent of
interlinkages between short-term and long-term interest rates, or the effectiveness of monetary
policy, may be affected by the degree of exposure to cross-border capital flows, which will be
examined in the next subsection. Before conducting a more formal analysis, however, let us see
how the nature of correlations of financial variables between the non-central countries and the
U.S. can depend upon the type of monetary regimes.
Figure 13 displays the 36-month rolling correlations of money market rates with the U.S.
again, but the correlations are averaged for three types of exchange rate regimes: Fixed,
intermediate, and floating.25
In the figure, the difference among the three exchange rate regimes
is not evident. However, the extent of interest rate linkages, or the lack of monetary autonomy, is
25
When the exchange rate stability index is greater than 0.70, it is considered to be “fixed.” The country-years
whose exchange rate stability index is less than 0.30 are considered to be “floating.” The range in-between is
considered to be “intermediate.”

15
a function of both the type of the exchange rate regime and the extent of financial openness.
Hence, without conditioning on the level of financial openness, the extent of interest rate
linkages does not have to differ.
Figure 14 shows the correlations for three types of financial openness regimes: open,
intermediate, and closed.26
The difference in terms of the level of correlations is more distinct
among the three financial openness regimes than among the three exchange rate regimes, though,
again, financial openness alone does not have to make the extent of monetary interdependence
differ. In any case, the correlations of money market rates with that of the U.S. are stronger for
more open regimes.
Given that the strength of interest rate interlinkages has to be conditional upon the extents
of both exchange rate stability and financial openness means, among the financially open
regimes, fixed exchange rate regimes should have the strongest interest rate interlinkages while
floating exchange rate regimes should have the weakest.27
Figure 15 again presents the
correlations of the short-term rates for the three types of exchange rate regimes, but only for the
most open regimes for capital account transactions.
As the trilemma hypothesis predicts, among the economies most open for cross-border
capital flows, fixed exchange rate regimes appear to have the strongest interest rate interlinkages.
As Aizenman, et al. (2013), Obstfeld, et al. (2005), and Ito and Kawai (2012) have shown, the
hypothesis of the trilemma does hold. Hence, in contrast to Rey’s (2013) contention, even among
financially open regimes, the type of exchange rate regimes does matter as far as short-term
interest rates are concerned.
What about the linkages of long-term interest rates between economies and the center
country, i.e., the U.S.? Figure 16 shows the correlations of the long-term interest rates for the
open, intermediate, and closed financial openness regimes. From the early 1990s through the
mid-2000s, the gap between open and closed regimes is large, though the gap has dwindled in
the last decade. Besides the last decade, Rey’s claim seems applicable for the long-term interest
rates.
26
The cutoffs for the three regimes financial openness are comparable to the case of the exchange rate stability
index. 27
Similarly, for the fixed exchange rate regimes, the most open regime for capital account transactions should have
the strongest interest rate interlinkages while the most closed ones should have the weakest.

16
As was previously discussed, there is a possibility that policy makers of an economy
highly open to international financial markets may find it difficult to control the longer end of the
yield curve even when they have monetary autonomy in the context of the trilemma. Hence, it is
reasonable to investigate how greater exposure to international financial markets could affect the
extent of linkages between short-term and long-term interest rates, which the next subsection will
investigate.
3.3. Estimation on the Determinants of the Yield Curve
We first examine to what extent long-term interest rates respond to short-term interest
rates by running the following estimation. The estimated coefficient i in the model can be
considered as a measure of the responsiveness or pass-through, of the long-term interest rates
( tLTii , ) to the short-term interest rates ( tSTii , ).
titSTiitLTi ii ,,, (1)
I estimate the coefficient with a 36-month rolling window for each of the sample
countries, which means that a time-varying measure of the extent of responsiveness can be
obtained for each country. Because it is the long-term interest rates that can affect both real and
financial activities while policy makers try to control short-term interest rates to affect them, ti ,
can be regarded as the measure of monetary policy effectiveness.
Using the estimated ti , , I will investigate the determinants of the extent of interest rate
pass-through using the following estimation model.
tititi uXKFlow ,,10, 'ˆ (2)
KFlow is net capital flows as a share of GDP, and X is a vector of other determinants
including the variables for inflation volatility, output volatility, and output gap as well as the
dummies for currency crisis and high inflation episodes. Inflation volatility and output volatility
are measured as the 5-year standard deviations of CPI-inflation and real output growth rates,

17
respectively. Both inflation and output volatilities would contribute to higher degrees of
uncertainties, either monetary or real, for monetary policy makers.28
Output gap is measured as the difference between real output growth rates and five-year
rolling average growth rates of real output. The extent of interest rate pass-through may differ
depending on whether the policy rate rises or falls because the term premium often makes the
yield curve upward sloping. Output gap may capture whether the economy is on the state of a
rising or falling policy rate. If the coefficient on the output gap variable is found to be positive,
that suggests a fall in the policy rate leads to a smaller response in the longer-term interest rate
compared to when the policy rate is rising. The currency crisis dummy is based on often-used
exchange market pressure (EMP) index (Eichengreen, Rose, and Wyplosz, 1995). X also
includes the dummy for a country-year with the annual inflation of 50% or higher. While both
dummies are supposed to capture noise in the dependent variable, it is likely that the policy rate
disproportionally rises with respect to long-term interest rates in the case of currency crisis and
that the long-term rate disproportionally rises with respect to short-term interest rates in the case
of high inflation.
We apply this estimation model to a panel of 71 countries from the 1970-2011 period,
including 47 developing countries, out of which 31 countries are emerging market economies.29
Table 3 reports the results of the estimations conducted with the Ordinary Least Squares (OLS)
method.30
Among the full sample and the industrial (IDC) and developing countries (LDC)
subsamples, net capital flows are found to contribute negatively to the beta coefficient,
suggesting that a country that receives more net capital inflows tends to have a weaker linkages
28
As for inflation volatility, on the one hand, it is highly correlated with the level of inflation so that the longer-end
may tend to be stuck at higher levels. On the other hand, based on the “Greenspan conundrum” argument, a fall in
the level of inflation volatility during the Great Moderation era may have contributed to underpricing of risk, which
may have helped the longer-end of the yield curve stuck at low levels despite a series of increases in the short-term
interest rates in 2004-05. To a lesser extent, the same explanation may apply to output volatility, though it seems
more reasonable to assume that greater output stability might lead to greater effectiveness of monetary policy due to
increased predictability of both economic conditions and economic policy management. 29
See Appendix for country groups. Not all the countries used for previous summary statistics are included in the
estimations due to data limitations. 30
The estimates for the constant term and the dummies for currency crisis and high inflation are omitted from the
table.
18
between short-term and long-term interest rates.31
For the EMEs, the coefficient on the net
capital flow is found to be negative, but not statistically significant.
Columns (5) through (8) report the estimation results for the same country groups, but for
the subsample period of 1990-1996, the years leading up to the Asian crisis and other EME
crises when many EMEs, especially those in Asia, experienced an influx of capital flows. For
this subsample period, the coefficient on net capital flows is significantly negative for the full
sample, and both LDC and EME subsamples. Furthermore, compared to the estimation for the
full sample period, the magnitude of the significant estimates is considerably larger for this
subsample period.
In the “Great Moderation” period of 2000-2007, the significantly negative coefficient on
net capital flows remain for the full sample and the LDC subsample, but not for the EME group.
For the post-global financial crisis, possibly due to small sample sizes, the estimation results do
not appear to be robust for any of the sample groups.
The net capital inflows variable can be endogenous in the last OLS estimation. Although
the correlations between net capital inflows and other right-hand side variables do not suggest
the possibility of multicollinearity, conceptually, other right-hand side variables can affect net
capital inflows, or vice versa.
As the literature on the “push” and “pull” factors of cross capital flows has shown, a
number of factors affect the direction and the volume of cross-border capital flows. These factors
include global factors such as the monetary policy of the center country and the level of risk
appetite of international investors as well as some domestic factors of capital recipient countries
such as the level of institutional or legal development, growth prospects, the state of its own
monetary policy, and the capital controls policy. These factors could first affect the volumes and
the directions of capital flows, then the latter may affect the interest rate pass-through.
To incorporate the literature on the determinants of capital inflows and the endogeneity
issue, the two stage least square (2SLS) estimation method is applied. First, we regard the
volume of net capital inflows as a function of policy interest rate differentials with the United
States; real output growth differentials with the U.S.; relative real income to the U.S. level; the
domestic country’s level of de jure financial openness (the Chinn-Ito index); and the volatility of
31
The estimation also includes the dummies for Japan in 2005 and 2006, Iceland in 2006-2011, and Bulgaria in
1997-2001 to control for the outliers of the estimated beta. Hence, part of the high adjusted R-squares, especially for
the full and IDC samples, reflect the contributions of the dummies for the outliers.

19
S&P stock market price index (measured by the annual standard deviations of monthly
percentage changes of S&P price index).32
These variables should cover both “pull” and “push”
factors. Also, since currency crisis should affect capital inflows more directly than the measure
for the extent of interest rate pass-through, it is included in the first estimation. The output gap
variable is removed from the estimation since it is redundant with the variable for output growth
differentials with the U.S.
Table 4 reports the results from the 2SLS estimation. Both the magnitude and the
statistical significance of the estimate for net capital inflows increase, especially for the
subsamples of developing countries or emerging market economies. Again, the magnitude of the
estimate for net capital inflows is larger during the pre-Asian crisis years than in the “Great
Moderation” period. Interestingly, the estimate for net capital flows now becomes significantly
negative during the post-global financial crisis period for the group of EMEs. The magnitude of
the estimate is relatively large as well.
In Table 5, the subsample of either LDC or EME is divided depending on whether the
economy of concern is open or closed based on the de jure measure of financial openness
(financially open regime in (1) vs. financially closed regime in (2) for LDC, and open in (3) and
closed in (4) for EMEs). The country-year with the de jure measure of capital openness above
0.70 is regarded as “open,” and the country-year with the openness measure below 0.30 as
“closed.” The subsamples are also divided depending on whether the level of financial
development is “high” ((5) for LDC and (7) for EME) or “low” ((6) for LDC and (8) for EME)).
The level of financial development is measured by the first principal component (FD) of private
credit creation, stock market capitalization, stock market total values, and private bond market
capitalization, all as shares of GDP. If FD is greater than the median level of a particular year, it
is regarded as “high” financial development. “Low” is for the level of FD below the annual
median.33
32
The volatility of the S&P price index is used instead of VIX because the latter dates only back to 1990. However,
the correlation between the two measures of stock market volatility is about 92%. 33
Because the private bond market capitalization data go back only to 1990, the FD series before 1990 are
extrapolated using the FD composed of private credit creation, stock market capitalization, and stock market total
values, which goes back to 1976.

20
Columns (1) through (4) in Table 5 show that only “open” financial openness regimes
have the significantly negative estimates for net capital inflows for both LDC and EME groups.34
That is, if a developing or emerging market economy is highly open to cross-border capital flows
and receives a greater amount of capital inflows, it tends to have a smaller degree of interest rate
pass-through, i.e., monetary policy authorities would have a weaker grip on long-term interest
rates. When the subgroup of developing countries is divided depending on the level of financial
development, again, only developing or emerging market economies with developed financial
markets tend to have a negative correlation between net capital inflows and the degree of interest
rate pass-through. As in the case of external financial openness, more developed financial
markets may make it harder for policy makers to have a control on the longer-term interest rates.
4. Concluding Remarks and Policy Implications
In this paper, I focused on the issue of monetary policy management the Asian and
Pacific emerging market economies when bigger advanced economies started showing some
signs of recovery or economic stabilization and considering to change the direction of their
monetary policies. As the world economy may be moving on to the next phase, or the post-, post-
global financial crisis period, the current situation can be a regime shift for the emerging market
economies. In the immediate post-global financial crisis period, due to advanced countries’ both
conventional and nonconventional monetary measures, many small open emerging market
economies experienced a rise in capital inflows and thereby currency appreciation pressure. Now
that the U.S. has started signaling the possibility of tapering their nonconventional monetary
measures, emerging market economies have started fearing the possibility of capital flight as it
happened in the late 1990s. The fear has been also shared by policy leaders in Asia and the
Pacific, who are concerned about the similarities between the current situation and the situation
of their economies on the eve of the Asian financial crisis in 1997. As the boom induced by the
influx of capital before the crisis was punished by the crisis in 1997-98, they have been
wondering if the immediate post-global financial crisis boom will turn into a similar financial
crisis.
34
The sample period can change depending on the availability of “financially open” regimes. That is, because there
was no “open” regimes for developing or emerging market economies until 1989, the estimation for the “financially
open” regimes can only start for the period starting in 1989. While the “closed regimes” can have a longer sample
period, the starting year is changed to be the same as the one for the open regime estimations, so that the “open” and
“closed” regimes estimations can have the same comparable sample period.

21
This paper first looked into the current economic conditions of Asian EMEs to explore
the similarities and differences between the pre-Asian crisis situation and the current one. The
economic indicators, those often used as predictors of financial crises, showed that the current
situation is more favorable for most of the Asian emerging market economies. Most of the Asian
EMEs are experiencing more favorable current account balances and hold much more
international reserves. Compared to the pre-Asian crisis period, indicators of asset markets do
not suggest signs of overheating.
Second, the current policy mix appears different from that of the pre-crisis period.
Compared to the 1990s before the crisis, emerging market economies in Asia on average have
higher levels of monetary autonomy and exchange rate flexibility. Generally, greater monetary
autonomy and exchange rate flexibility can help policy makers to stabilize their economies.35
However, it has been increasingly argued that financial globalization has been playing a
bigger role in determining domestic asset prices and interest rates. If that is the case, even with
greater monetary autonomy, monetary authorities may not be able to keep controls of financial
markets and the real economy as Rey (2013) argues. In fact, in recent years, the correlation of
long-term interest rates between Asian EMEs and the United States has been rising while the
correlation of short-term rates does not show such a trend. In other words, Rey’s (2013)
“irreconcilable duo” – the trilemma reduces to a dilemma between monetary autonomy and free
capital mobility – may be applicable to long-term interest rates, though not to the short-term
interest rates.
I conducted an estimation exercise to examine whether net capital inflows can contribute
to weakening the link between short-term and long-term interest rates. The estimation results
supported such a possibility. Despite the recent concern, however, the effect of net capital
inflows on the extent of interest rate pass-through is greater in the pre-Asian crisis period than in
recent years including the Great Moderation period and the post-global financial crisis years.
Developing or emerging market economies with regulatory regimes open to cross-border capital
flows tend to have a greater negative relationship between net capital inflows and the extent of
35
More strictly speaking, whether greater monetary autonomy or greater exchange rate flexibility or stability can
help stabilize output movements can depend upon how open the economy of concern is. Aizenman, et al. (2011)
show that for a more closed economy (e.g. Indonesia), greater monetary independence would be more effective to
stabilize output movements because it helps stabilize investment. For a more open economy, greater exchange rate
stability would be more helpful since it stabilizes the real exchange rate movement. The negative impact of greater
exchange rate stability (due to the lack of automatic stabilization from currency movements) can be mitigated if the
economy holds a large amount of international reserves, which many Asian EMEs do.

22
interest rate pass-through. Furthermore, those with more developed financial markets tend to be
more vulnerable to the relationship between net capital inflows and the interest rate pass-through.
Now, what do all these findings mean to the economies in Asia and the Pacific?
First, as the economies in the region become more open toward cross-border capital flows,
policy makers need to be aware of the possibility that receiving more capital flows may lead to
weakening the link between short-term and long-term interest rates, making it more difficult to
manage macroeconomic and financial stability.
Second, despite the possibility of losing a grip on the longer-end of the yield curve, at this
point, there may still be some time before the economies in the region lose the grip, because they
still have some room for further financial liberalization (Figure 6).
Third, as with the case of financial liberalization, there is still room for further financial
development in the Asian economies. Figure 17 illustrates the level of financial development
from various perspectives, such as private credit creation, stock market capitalization, stock
market total value, private bond market capitalization, public bond market capitalization, all as
shares of GDP, and the composite index, or the first principal component, of financial
development constructed using all the other variables except for public bond market
capitalization.36
These panels of figures show that Asian emerging market economies are expected to
continue to develop their financial markets toward catching up with Japan or other industrialized
countries. While China has been on its way to catching up with Japan or even the U.S. in terms
of market size, the U.S. is still the sole winner in terms of stock market total values. More
importantly, China or other emerging market economies have lagged behind industrialized
countries in terms of private bond market capitalization. Considering that only well-developed
financial systems provide deep and liquid private bond markets, Asian EMEs need to further
develop their financial markets.
The lagged development of financial markets, especially bond markets, can mean that
external financing tends to have short-term maturities. According to Figure 18, corporate
securities with the maturities of five years or less account for more than 50% of the total. The
share of corporate securities with longer maturities than 10 years is about 10%. As a reference
36
The sample average for “ex-China Emerging Asia” does not include Hong Kong or Singapore because of these
economies’ special roles as financial centers.

23
point, as of 2013, the average maturity of U.S. corporate bonds is about 14 years, much higher
than that of the Asian counterparts.
Asian economies have traditionally had a corporate finance structure highly dependent on
debt financing (Figure 19). As IMF (2010) and many researchers have argued, heavy reliance on
debt financing can help inhibit the development of investment for long-term and risky projects.
Hence, debt-financing itself also tends to be more short-term oriented.37
At least, it is safe to say
that there is much room for longer-term debt securities to grow in Asian EMEs.
All these points suggest that at present, the possibility of losing controls on longer-term
interest rates can be less of an issue for Asian economies, because their financial system is still
based on short-term financing. Therefore, Asian emerging economies are facing an interesting
dilemma. While they want to develop financial markets to finance more effectively for longer-
term needs, if that happens, the extent of retaining controls over longer-term interest rates will
become a greater issue.
The last issue worth discussing, though briefly, is macro prudential measures, which have
received much attention since the breakout of the global financial crisis. Several EMEs,
including those in Asia and the Pacific, have implemented these measures in the immediate
aftermath of the global crisis to manage potential impacts of surging capital inflows on
macroeconomic and financial stability. Balakrishnan, et al. (2012), IMF (2012), and Pradhan, et
al. (2011) provide comprehensive reviews and analyses pertaining to macro prudential policies
implemented in Asian and other EMEs.
Generally, despite the IMF’s change in the view of capital controls to allow countries to
implement capital controls policies as preemptive measures for macroeconomic and financial
stability – the IMF call such measures “capital flow measures,” the effectiveness of capital
controls is controversial at best. The consensus in the literature is that capital controls can change
the composition of capital flows but not the entire volume of cross-border capital flows. It has
been also argued that capital controls on outflows are more effective than those on inflows
(Hutchison, et al., 2010).38
Rey (2013) supports the idea that countries can resort to capital controls to retain
monetary autonomy as a way to deal better with the global financial cycle. Klein and Shambaugh
37
As Figure 18 shows, it applies to Japan as well. 38
For more on the discussions of capital flow measures, see Habermeier, et al. (2011) and Ostry, et al. (2011)
24
(2013), however, argues that partial capital controls would not allow countries to retain monetary
autonomy, but that only extensive capital controls policy would. We may need to wait for time to
see how effective these prudential capital flow management policies turn out to be.
Even if foreign factors or the monetary policy of the center country is influential and
affects the ebbs and flows of capital for EMEs as an aggregate, it does not mean all the EMEs
would experience the surges of capital flows. To the same extent of global factors, domestic or
“pull” factors also matter. That is, each country’s economic and institutional characteristics do
affect the allocation of global capital. Furthermore, not all the countries that experience massive
capital inflows would experience a financial crisis. However, we need to be aware of all the
potential channels and linkages among economic and noneconomic factors. The link between
financial globalization and the extent of interest pass-through can be one of them.

25
References:
Ahmed, S. and A. Zlate. 2013. “Capital Flows to Emerging Market Economies: A Brave New
World?” Board of Governors of the Federal Reserve System International Finance
Discussion Papers, #1081. Washington, D.C.: Federal Reserve Board (June).
Aizenman, J. and Lee, J. 2007. “International reserves: precautionary versus mercantilist views,
theory and evidence,” Open Economies Review, 2007, 18 (2), pp. 191-214.
Aizenman, J., M. D. Chinn, and H. Ito. 2013. “The 'Impossible Trinity' Hypothesis in an Era of
Global Imbalances: Measurement and Testing,” Review of International Economics,
21(3), 447–458 (August).
Aizenman, J., M. D. Chinn, and H. Ito. 2008. Assessing the Emerging Global Financial
Architecture: Measuring the Trilemma's Configurations Over Time. National Bureau of
Economic Research (NBER) Working Paper 14533.
Aizenman, J., M. D. Chinn, and H. Ito. 2013. “The 'Impossible Trinity' Hypothesis in an Era of
Global Imbalances: Measurement and Testing,” Review of International Economics,
21(3), 447–458.
Aizenman, J., M. D. Chinn, and H. Ito. 2011. “Surfing the Waves of Globalization: Asia and
Financial Globalization in the Context of the Trilemma,” Journal of the Japanese and
International Economies, vol. 25(3), p. 290 – 320 (September).
Aizenman, J. and Marion, N. 2004. “International reserves holdings with sovereign risk and
costly tax collection.” Economic Journal 114, pp. 569–91.
Balakrishnan, R., S. Nowak, S. Panth, and Y. Wu. 2012. “Surging Capital Flows to Emerging
Asia: Facts, Impacts, and Responses,” IMF Working Paper WP/12/130. Washington,
D.C.: International Monetary Fund (May).
Ben-Bassat A. and Gottlieb, D. 1992. “Optimal international reserves and sovereign risk.”
Journal of International Economics 33, pp. 345–62.
Bernanke, B., 2005. The Global Saving Glut and the U.S. Current Account. Remarks at the
Sandridge Lecture, Virginia Association of Economics, Richmond, VA, March 10.
Byrne, Joseph P., Giorgio Fazio, and Norbert Fiess, 2010, “Interest Rate Co-movements, Global
Factors and the Long End of the Term Spread,” Journal of Banking and Finance, Vol. 36,
pp. 183–192.

26
Caballero, R., E. Farhi, and P. O. Gourinchas, 2008, “An Equilibrium Model of ‘Global
Imbalances’ and Low Interest Rates,” American Economic Review, 98(1) (March): 358-
393.
Calvo, G. 1998. “Capital Flows and Capital-market Crises: The Simple Economics of Sudden
Stops.” Journal of Applied Economics 1: 35–54.
Cardarelli, R., S. Elekdag, and A. Kose, 2009. “Capital Inflows: Macroeconomic Implications
and Policy Responses,” IMF Working Paper 09/40, Washington DC: IMF.
Chinn, M. D. and H. Ito. 2008. A New Measure of Financial Openness. Journal of Comparative
Policy Analysis, Volume 10, Issue 3 (September), p. 309 - 322.
Chinn, M. D. and H. Ito, 2006. What Matters for Financial Development? Capital Controls,
Institutions, and Interactions, Journal of Development Economics, Volume 81, Issue 1,
Pages 163-192 (October).
Christiansen, H. and C. Pigott. 1997. “Long-Term Interest Rates in Globalised Markets”, OECD
Economics Department Working Papers no 175.
Chuhan, P., S. Claessens, and N. Mamingi. 1993. “Equity and Bond Flows to Latin America and
Asia: The Role of Global and Country Factors,” World Bank Policy Research Working
Paper 1160 (Washington DC: World Bank).
Ciarlone, A., P. Piselli, and G. Trebeschi. 2009. “Emerging Markets’ Spreads and Global
Financial Conditions,” International Financial Markets, Institutions and Money Vol. 19,
pp. 222–39.
Clarida, R. 2005. Japan, China, and the U.S. Current account deficit. CATO Journal Vol. 25, No.
1 (Winter).
Dominguez, K., Hashimoto, Y., and Ito. T., 2011. “International Reserves and the Global
Financial Crisis”, NBER Working Paper No. 17362.
Eichengreen, B., A. Rose, and C. Wyplosz. 1995. Exchange Market Mayhem: The Antecedents
and Aftermaths of Speculative Attacks. Economic Policy. 21 (October). pp. 249−312.
Fawley, B. W. and C. I. Neely. 2013. “Four Stories of Quantitative Easing,” Federal Reserve
Bank of St. Louis Review, January/February 2013.
Forbes, K. J. and F. E. Warnock, 2012. Capital Flow Waves: Surges, Stops, Flight, and
Retrenchment. Journal of International Economics, 88(2), 235-251.
27
Fratzscher, M. 2011. “Capital Flows, Push Versus Pull Factors and the Global Financial Crisis,”
NBER Working Paper 17357 (Cambridge: NBER).
Ghosh, A. R., J. Kim, M. Qureshi, and J. Zalduendo, 2012. Surges. IMF Working Paper
WP/12/22.
Greenspan, A., 2005a. Current Account. At Advancing Enterprise 2005 Conference, London,
England, February 4.
Greenspan, A., 2005b. Mortgage Banking. At American Bankers Association Annual
Convention, Palm Desert, California, September 26.
Griffin, J., F. Nardari, and R. Stulz. 2004. “Are Daily Cross-Border Equity Flows Pushed or
Pulled?” Review of Economics and Statistics, Vol. 86, No. 3, pp. 642-657.
Habermeier, K., A. Kokenyne, and C. Baba. 2011. “The Effectiveness of Capital Controls and
Prudential Policies in Managing Large Inflows, IMF Staff Discussion Note SDN/11/14,
Washington, D.C.: International Monetary Fund (August 5, 2011).
Policies in Managing Large InflowsHutchison, M., M. Binici, and M. Schindler. 2010.
“Controlling Capital: Legal Restrictions and the Asset Composition of International
Financial Flows, Journal of International Money and Finance, 29 (2010) 666–684.
International Monetary Fund. 2012. Regional Economic Outlook: Asia and Pacific – Managing
Spillovers and Advancing Economic Rebalancing. Washington, D.C.: International
Monetary Fund (April).
International Monetary Fund. 2011. Regional Economic Outlook: Asia and Pacific – Managing
the Next Phase of Growth. Washington, D.C.: International Monetary Fund (April).
International Monetary Fund. 2010. Regional Economic Outlook: Asia and Pacific –
Consolidating the Recovery and Building Sustainable Growth. Washington, D.C.:
International Monetary Fund (October).
International Monetary Fund. 2010. Global Financial Stability Report, Washington, D.C.:
International Monetary Fund (April).
Ito, H. and M. Kawai. 2012. “New Measures of the Trilemma Hypothesis: Implications for Asia,”
Asian Development Bank Institute Working Paper #381. Tokyo: ADBI.
Klein, M. and J. Shambaugh. 2013. “Rounding the Corners of the Policy Trilemma: Sources of
Monetary Policy Autonomy, NBER Working Paper #19461. Cambridge, MA: National
Bureau of Economic Research.

28
Lane, P., Milesi-Ferretti, G. M. 2006. The External Wealth of Nations Mark II: Revised and
Extended Estimates of Foreign Assets and Liabilities, 1970 - 2004. IMF Working Paper,
WP/06/69.
Lane, P. and G. M. Milesi-Ferretti. 2007. The External Wealth of Nations Mark II: Revised and
Extended Estimates of Foreign Assets and Liabilities, 1970–2004. Journal of
International Economics. 73 (2). pp. 223−250.
Moreno, Ramon, 2008, “Monetary Transmission Mechanism and Long Term Interest Rate in
Emerging Markets,” BIS Papers, chapter in Bank for International Settlements (ed.),
Transmission Mechanisms for Monetary Policy in Emerging Market Economies, Vol. 35,
pp. 1–59 (Basle: Bank for International Settlements).
Obstfeld, M., Jay C. Shambaugh, and A. M. Taylor. 2009. “Financial Instability, reserves, and
central bank Swap Lines in the Panic of 2008,” American Economic Review, vol. 99(2),
pages 480-86, May.
Obstfeld, M., J. C. Shambaugh, and A. M. Taylor, 2005. “The Trilemma in History: Tradeoffs among
Exchange Rates, Monetary Policies, and Capital Mobility." Review of Economics and Statistics
87 (August): 423-38.
Ostry, J. D., A. R. Ghosh, K. Habermeier, L. Laeven, M. Chamon, M. S. Qureshi, and A.
Kokenyne. 2011. “Managing Capital Inflows: What Tools to Use,” IMF Staff Position
Note 11/06. Washington: International Monetary Fund.
Peiris, S. J. 2010. “Foreign Participation in Emerging Markets’ Local Currency Bond Markets,”
IMF Working Paper 10/88 (Washington: International Monetary Fund).
Pradhan, M., R. Balikrishnan, R. Baqir, G. Heenan, S. Nowak, C. Oner, and S. Panth, 2011,
“Policy Responses to Capital Flows in Emerging Markets,” Paper for the Bank of
Indonesia and IMF Joint Conference on Coping With Asia’s Large Capital Inflows in a
Multi-Speed Global Economy (Washington: International Monetary Fund).
Reinhart, C., and V. Reinhart. 2008. “Capital Flow Bonanzas: An Encompassing View of the
Past and Present,” NBER Working Paper 14321, Cambridge: National Bureau of
Economic Research.
Rey, H. 2013. “Dilemma not Trilemma: The Global Financial Cycle and Monetary Policy
Independence,” prepared for the 2013 Jackson Hole Meeting.

29
Rodrik, D., and A. Velasco. 1999. "Short-Term Capital Flows." NBER Working Paper No. 7364.
Cambridge, MA : National Bureau of Economic Research.
Shambaugh, Jay C. 2004. “The Effects of Fixed Exchange Rates on Monetary Policy.” Quarterly
Journal of Economics 119 (February): 301-52.
Taylor, M., and L. Sarno. 1997. “Capital Flows to Developing Countries: Long- and Short-Term
Determinants,” World Bank Economic Review, Vo. 11(3), pp. 451-470.
Unsal, D. Filiz, 2012, “Capital Flows and Financial Stability: Monetary Policy and
Macroprudential Responses,” International Journal of Central Banking, forthcoming.
Warnock, F. E., and V. C. Warnock, 2009, “International Capital Flows and U.S. Interest Rates,”
Journal of International Money and Finance, Vol. 28, pp. 903–19.

30
Appendix: Country Groups
Industrialized countries (IDC):
Australia, Austria, Belgium, Canada, Denmark, Finland, France, Germany, Greece, Iceland,
Ireland, Italy, Japan, Luxembourg, Malta, Netherlands, New Zealand, Norway, Portugal, Spain,
Sweden, Switzerland, United Kingdom, United States.
Emerging Market Economies (EMEs)
Argentina, Bangladesh, Botswana, Brazil, Brunei, Bulgaria, Cote d’Ivoire, Cambodia, Chile,
China, Colombia, Czech Republic, Ecuador, Egypt, Arab Rep., Ghana, Hong Kong, China,
Hungary, India, Indonesia, Israel, Jamaica, Jordan, Kenya, Korea, Rep., Lithuania, Malaysia,
Mauritius, Mexico, Morocco, Nigeria, Pakistan, Peru, Philippines, Poland, Russian Federation,
Singapore, Slovak Republic, Slovenia, South Africa, Sri Lanka, Thailand, Trinidad and Tobago,
Tunisia, Turkey, Venezuela, RB, Vietnam, Zimbabwe.
Emerging Asia
China, Hong Kong, China, India, Indonesia, Korea, Rep., Malaysia, Philippines, Singapore,
Thailand, Vietnam
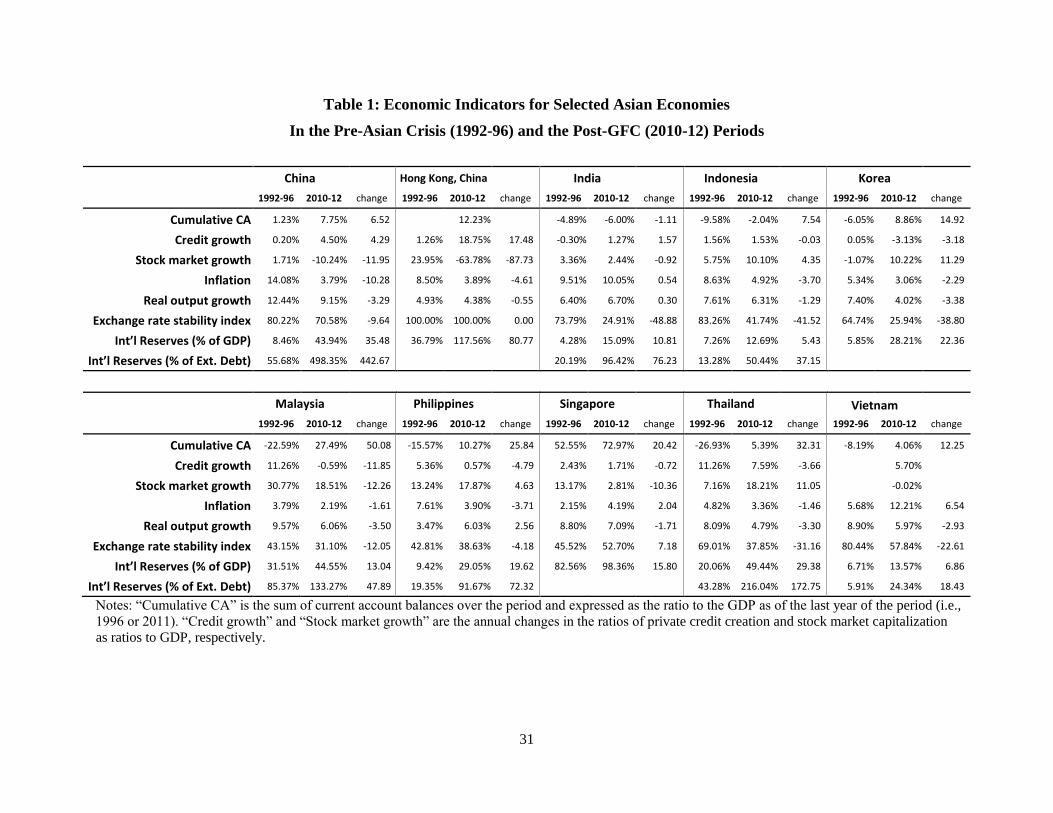
31
Table 1: Economic Indicators for Selected Asian Economies
In the Pre-Asian Crisis (1992-96) and the Post-GFC (2010-12) Periods
China
Hong Kong, China
India
Indonesia
Korea
1992-96 2010-12 change 1992-96 2010-12 change 1992-96 2010-12 change 1992-96 2010-12 change 1992-96 2010-12 change
Cumulative CA 1.23% 7.75% 6.52
12.23%
-4.89% -6.00% -1.11 -9.58% -2.04% 7.54 -6.05% 8.86% 14.92
Credit growth 0.20% 4.50% 4.29 1.26% 18.75% 17.48 -0.30% 1.27% 1.57 1.56% 1.53% -0.03 0.05% -3.13% -3.18
Stock market growth 1.71% -10.24% -11.95 23.95% -63.78% -87.73 3.36% 2.44% -0.92 5.75% 10.10% 4.35 -1.07% 10.22% 11.29
Inflation 14.08% 3.79% -10.28 8.50% 3.89% -4.61 9.51% 10.05% 0.54 8.63% 4.92% -3.70 5.34% 3.06% -2.29
Real output growth 12.44% 9.15% -3.29 4.93% 4.38% -0.55 6.40% 6.70% 0.30 7.61% 6.31% -1.29 7.40% 4.02% -3.38
Exchange rate stability index 80.22% 70.58% -9.64 100.00% 100.00% 0.00 73.79% 24.91% -48.88 83.26% 41.74% -41.52 64.74% 25.94% -38.80
Int’l Reserves (% of GDP) 8.46% 43.94% 35.48 36.79% 117.56% 80.77 4.28% 15.09% 10.81 7.26% 12.69% 5.43 5.85% 28.21% 22.36
Int’l Reserves (% of Ext. Debt) 55.68% 498.35% 442.67
20.19% 96.42% 76.23 13.28% 50.44% 37.15
Malaysia
Philippines
Singapore
Thailand Vietnam
1992-96 2010-12 change 1992-96 2010-12 change 1992-96 2010-12 change 1992-96 2010-12 change 1992-96 2010-12 change
Cumulative CA -22.59% 27.49% 50.08 -15.57% 10.27% 25.84 52.55% 72.97% 20.42 -26.93% 5.39% 32.31 -8.19% 4.06% 12.25
Credit growth 11.26% -0.59% -11.85 5.36% 0.57% -4.79 2.43% 1.71% -0.72 11.26% 7.59% -3.66
5.70%
Stock market growth 30.77% 18.51% -12.26 13.24% 17.87% 4.63 13.17% 2.81% -10.36 7.16% 18.21% 11.05
-0.02%
Inflation 3.79% 2.19% -1.61 7.61% 3.90% -3.71 2.15% 4.19% 2.04 4.82% 3.36% -1.46 5.68% 12.21% 6.54
Real output growth 9.57% 6.06% -3.50 3.47% 6.03% 2.56 8.80% 7.09% -1.71 8.09% 4.79% -3.30 8.90% 5.97% -2.93
Exchange rate stability index 43.15% 31.10% -12.05 42.81% 38.63% -4.18 45.52% 52.70% 7.18 69.01% 37.85% -31.16 80.44% 57.84% -22.61
Int’l Reserves (% of GDP) 31.51% 44.55% 13.04 9.42% 29.05% 19.62 82.56% 98.36% 15.80 20.06% 49.44% 29.38 6.71% 13.57% 6.86
Int’l Reserves (% of Ext. Debt) 85.37% 133.27% 47.89 19.35% 91.67% 72.32 43.28% 216.04% 172.75 5.91% 24.34% 18.43
Notes: “Cumulative CA” is the sum of current account balances over the period and expressed as the ratio to the GDP as of the last year of the period (i.e.,
1996 or 2011). “Credit growth” and “Stock market growth” are the annual changes in the ratios of private credit creation and stock market capitalization
as ratios to GDP, respectively.

32
Table 2: “Heat Map” for Selected Asian Economies (from IMF’s REO 2011)

33
Table 3: Determinants of the Effectiveness of Monetary Policy – OLS
FULL IDC LDC EME FULL IDC LDC EME FULL IDC LDC EME
1970-2011 1970-2011 1970-2011 1970-2011 1990-1996 1990-1996 1990-1996 1990-1996 2000-2007 2000-2007 2000-2007 2000-2007
(1) (2) (3) (4) (5) (6) (7) (8) (9) (10) (11) (12)
Inflation Volatility -0.805 -6.281 -0.200 0.348 -0.819 -1.651 -0.887 -0.772 -0.870 -38.177 0.167 -0.219
(0.493) (1.313)*** (0.514) (0.520) (1.205) (3.505) (1.417) (1.629) (0.539) (9.662)*** (0.517) (0.420)
Output Volatility -1.476 -0.917 -0.677 -2.530 1.604 1.725 2.180 0.442 -3.070 12.677 -0.892 -0.474
(0.740)** (1.008) (0.900) (1.463)* (1.887) (2.563) (2.236) (3.519) (1.256)** (6.699)* (1.384) (1.951)
Output Gap 0.135 0.641 0.113 -0.339 0.361 0.259 0.585 -0.824 1.172 8.706 -0.614 -0.744
(0.373) (0.512) (0.480) (0.744) (0.905) (1.165) (1.187) (2.043) (0.972) (2.573)*** (1.022) (1.227)
Net K Flow -0.396 -0.219 -0.372 -0.209 -1.183 0.003 -1.194 -1.310 -0.804 -0.147 -0.443 -0.217
(0.119)*** (0.123)* (0.156)** (0.218) (0.469)** (0.772) (0.701)* (0.785)* (0.244)*** (0.560) (0.238)* (0.311)
Adjusted R2 0.84 0.93 0.07 0.12 0.04 -0.04 0.09 0.14 0.92 0.96 -0.01 -0.03
N 1,307 666 641 438 218 119 99 59 425 178 247 175
Notes: * p<0.1; ** p<0.05; *** p<0.01. The estimates for constant and the dummy for high inflation ( %)50 are omitted.
FULL IDC LDC EME
2010-2011 2010-2011 2010-2011 2010-2011
(13) (14) (15) (16)
Inflation Volatility -6.096 4.634 -6.588 -10.879
(4.856) (5.795) (5.106) (8.718)
Output Volatility -0.615 -3.596 -0.078 -12.435
(3.498) (2.596) (4.041) (4.683)**
Output Gap 1.234 0.444 1.282 -1.269
(1.627) (0.973) (2.166) (4.144)
Net K Flow 0.309 -0.618 0.689 -1.379
(0.625) (0.655) (0.881) (1.251)
Adjusted R2 -0.01 0.03 -0.03 0.16
N 118 47 71 49

34
Table 4: Determinants of the Effectiveness of Monetary Policy – 2SLS
FULL IDC LDC EME FULL IDC LDC EME FULL IDC LDC EME
1970-2011 1970-2011 1970-2011 1970-2011 1990-1996 1990-1996 1990-1996 1990-1996 2000-2007 2000-2007 2000-2007 2000-2007
(1) (2) (3) (4) (5) (6) (7) (8) (5) (6) (7) (8)
Inflation Volatility -0.548 -6.175 -0.160 0.112 -1.018 -8.885 -1.593 -1.545 -0.655 -34.866 0.000 -0.100
(0.497) (1.356)*** (0.515) (0.535) (1.188) (4.733)* (1.364) (1.358) (0.535) (9.795)*** (0.553) (0.537)
Output Volatility -2.172 -1.615 -1.903 -4.014 2.247 1.845 1.708 0.902 -3.432 5.994 -3.069 -2.898
(0.810)*** (1.300) (1.001)* (1.582)** (2.067) (4.571) (2.842) (2.570) (1.433)** (6.926) (1.843)* (2.305)
Net K Flow -1.258 0.536 -1.815 -2.853 -3.384 7.558 -4.546 -4.439 -1.166 0.485 -1.614 -2.019
(0.463)*** (0.626) (0.541)*** (0.767)*** (0.891)*** (4.125)* (1.969)** (1.898)** (0.540)** (0.608) (0.768)** (0.935)**
Adjusted R2 0.85 0.94 0.03 . . . . . 0.93 0.96 . .
N 1,213 611 602 501 203 112 91 77 398 164 234 191
Notes: * p<0.1; ** p<0.05; *** p<0.01. The estimates for constant and the dummy for high inflation ( %)50 are omitted. The variable for net capital inflows is
instrumented with interest rate differentials with the U.S. rate; real output growth differentials with the U.S.; relative real income to the U.S. level; the domestic
country’s level of de jure financial openness (the Chinn-Ito index); the volatility of S&P stock market price index; and the currency crisis dummy.
FULL IDC LDC EME
2010-2011 2010-2011 2010-2011 2010-2011 (9) (10) (11) (12)
Inflation Volatility -17.341 2.186 -21.578 -36.053
(12.158) (6.459) (14.579) (21.858)
Output Volatility 2.231 -1.593 3.370 -0.240
(4.809) (1.912) (5.886) (9.400)
Net K Flow 1.459 0.215 3.387 3.424
(1.625) (0.730) (3.003) (4.985)
Adjusted R2 0.02 -0.07 -0.00 0.09
N 109 43 66 53
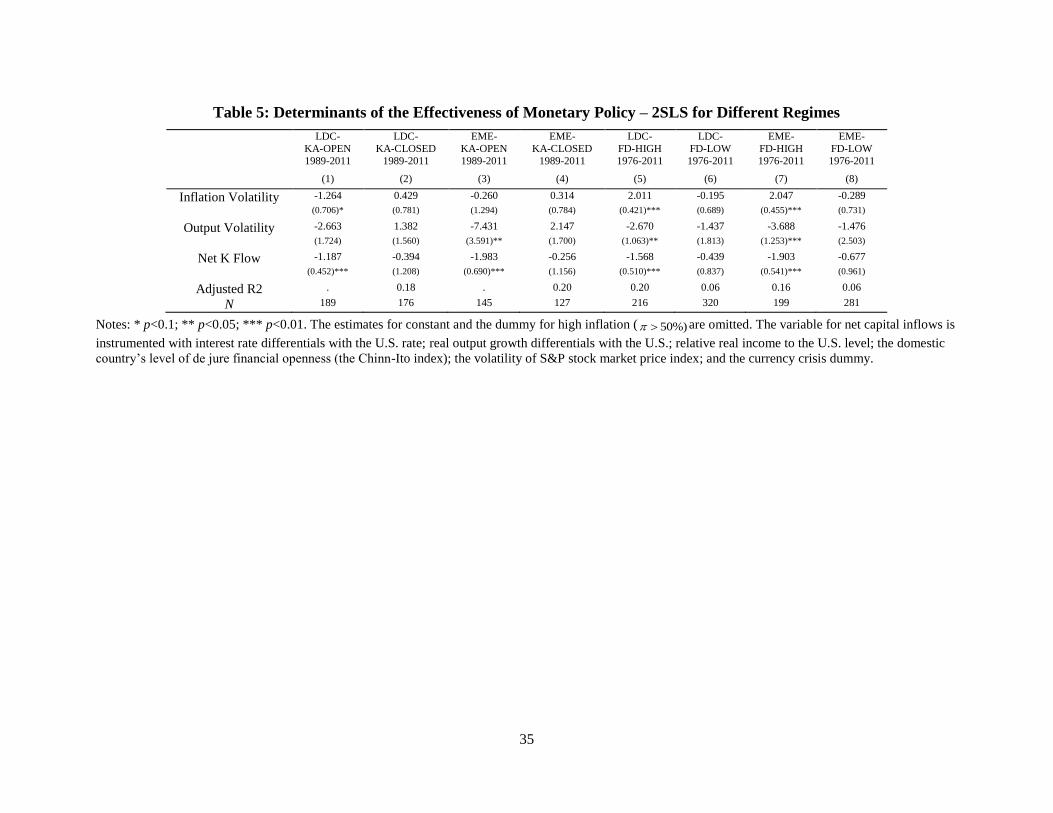
35
Table 5: Determinants of the Effectiveness of Monetary Policy – 2SLS for Different Regimes
LDC-
KA-OPEN
LDC-
KA-CLOSED
EME-
KA-OPEN
EME-
KA-CLOSED
LDC-
FD-HIGH
LDC-
FD-LOW
EME-
FD-HIGH
EME-
FD-LOW
1989-2011 1989-2011 1989-2011 1989-2011 1976-2011 1976-2011 1976-2011 1976-2011
(1) (2) (3) (4) (5) (6) (7) (8)
Inflation Volatility -1.264 0.429 -0.260 0.314 2.011 -0.195 2.047 -0.289
(0.706)* (0.781) (1.294) (0.784) (0.421)*** (0.689) (0.455)*** (0.731)
Output Volatility -2.663 1.382 -7.431 2.147 -2.670 -1.437 -3.688 -1.476
(1.724) (1.560) (3.591)** (1.700) (1.063)** (1.813) (1.253)*** (2.503)
Net K Flow -1.187 -0.394 -1.983 -0.256 -1.568 -0.439 -1.903 -0.677
(0.452)*** (1.208) (0.690)*** (1.156) (0.510)*** (0.837) (0.541)*** (0.961)
Adjusted R2 . 0.18 . 0.20 0.20 0.06 0.16 0.06
N 189 176 145 127 216 320 199 281
Notes: * p<0.1; ** p<0.05; *** p<0.01. The estimates for constant and the dummy for high inflation ( %)50 are omitted. The variable for net capital inflows is
instrumented with interest rate differentials with the U.S. rate; real output growth differentials with the U.S.; relative real income to the U.S. level; the domestic
country’s level of de jure financial openness (the Chinn-Ito index); the volatility of S&P stock market price index; and the currency crisis dummy.

36
Figure 1: Net Capital Flow and GDP Growth Rates
for Industrialized countries and EMEs
Figure 2: Average Amount of Reserve Asset Changes
-4-2
02
46
GD
P g
row
th (
%)
-50
5
Net K
-inflo
w (
% o
f G
DP
)
1990 1995 2000 2005 2010
EMEs IDC
GDP growth rate - IDC GDP growth rate - EMEs
-50
51
0
Cha
ng
es in
Rese
rves (
$ b
illio
ns)
2008q1 2009q1 2010q1 2011q1 2012q1 2013q1date
IDC EMEs
ex-China Emerging Asia

37
Figure 3: Net Capital Flows for Different Country Groups
Figure 4: Real Effective Exchange Rates
-10
-8-6
-4-2
02
46
81
0
Pri
vate
K-in
flow
(%
of G
DP
)
1990q1 1995q1 2000q1 2005q1 2010q1 2015q1
IDC EMEs
ex-China Emerging Asia
80
90
100
110
120
130
RE
ER
(20
08
M6=
10
0)
1995m1 2000m1 2005m1 2010m1 2015m1date
IDC U.S.
ex-China Emerging Asia China
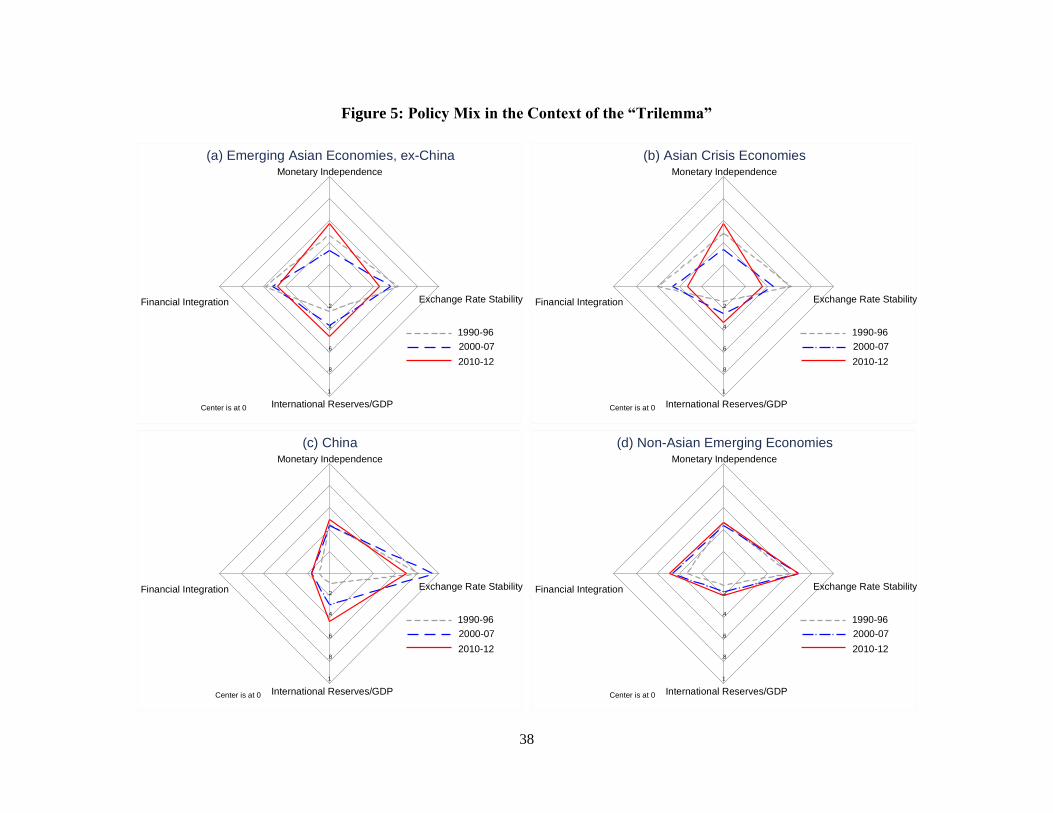
38
Figure 5: Policy Mix in the Context of the “Trilemma”
Monetary Independence
Exchange Rate Stability
International Reserves/GDP
Financial Integration .2
.4
.6
.8
1
Center is at 0
(a) Emerging Asian Economies, ex-China
1990-96
2000-07
2010-12
Monetary Independence
Exchange Rate Stability
International Reserves/GDP
Financial Integration .2
.4
.6
.8
1
Center is at 0
(b) Asian Crisis Economies
1990-96
2000-07
2010-12
Monetary Independence
Exchange Rate Stability
International Reserves/GDP
Financial Integration .2
.4
.6
.8
1
Center is at 0
(c) China
1990-96
2000-07
2010-12
Monetary Independence
Exchange Rate Stability
International Reserves/GDP
Financial Integration .2
.4
.6
.8
1
Center is at 0
(d) Non-Asian Emerging Economies
1990-96
2000-07
2010-12
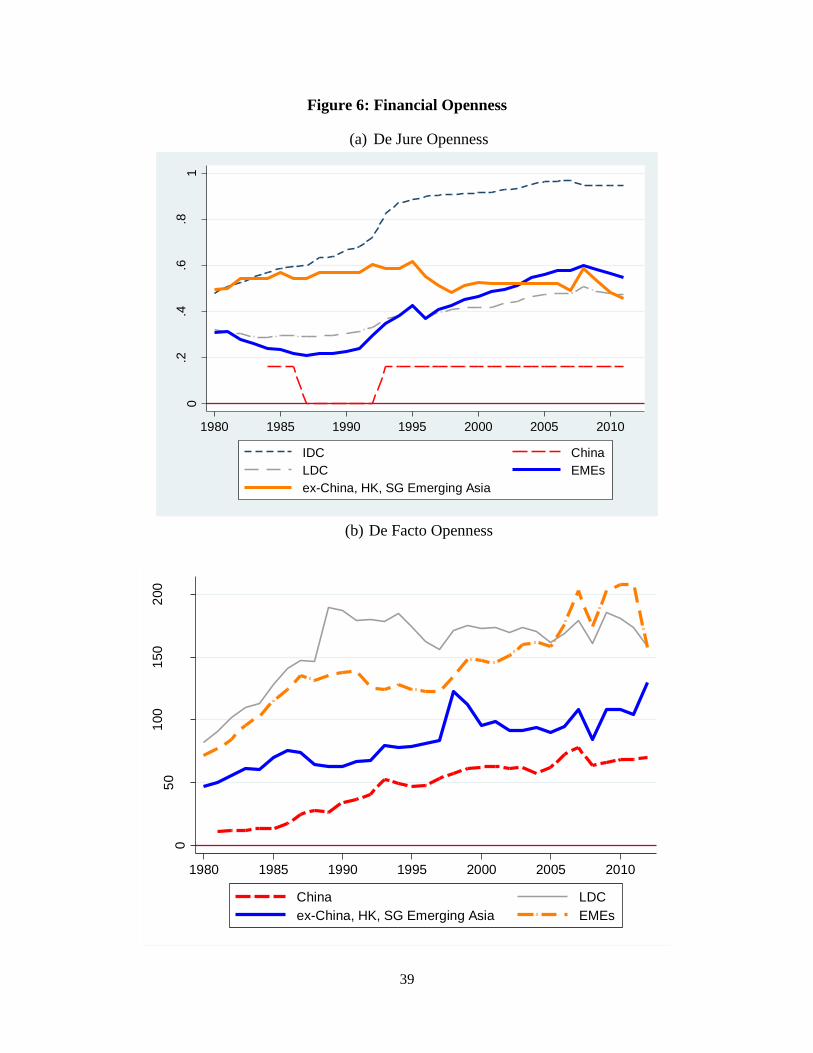
39
Figure 6: Financial Openness
(a) De Jure Openness
(b) De Facto Openness
0.2
.4.6
.81
Fin
an
cia
l O
pen
ne
ss
1980 1985 1990 1995 2000 2005 2010
IDC China
LDC EMEs
ex-China, HK, SG Emerging Asia
05
01
00
150
200
De fa
cto
Fin
an
cia
l O
pen
ne
ss (
% o
f G
DP
)
1980 1985 1990 1995 2000 2005 2010
China LDC
ex-China, HK, SG Emerging Asia EMEs

40
Figure 7: Share of Foreign Holdings in Local Currency Government Bonds
Figure 8: VIX and Net Capital Flows to EMEs
01
02
03
0
% o
f F
ore
ign
Hold
ing
s in L
CY
Govt B
ond
s
1995q1 2000q1 2005q1 2010q1 2015q1date
Japan Indonesia
Korea Malaysia
Thailand
Source: Asian Bond Online
01
02
03
04
05
06
0
VIX
- r
eve
rsed
-50
05
01
00
150
200
Pri
vate
K-in
flow
, $ b
illio
ns
1990q1 1995q1 2000q1 2005q1 2010q1
K-inflow VIX
Source: Asian Bonds Online
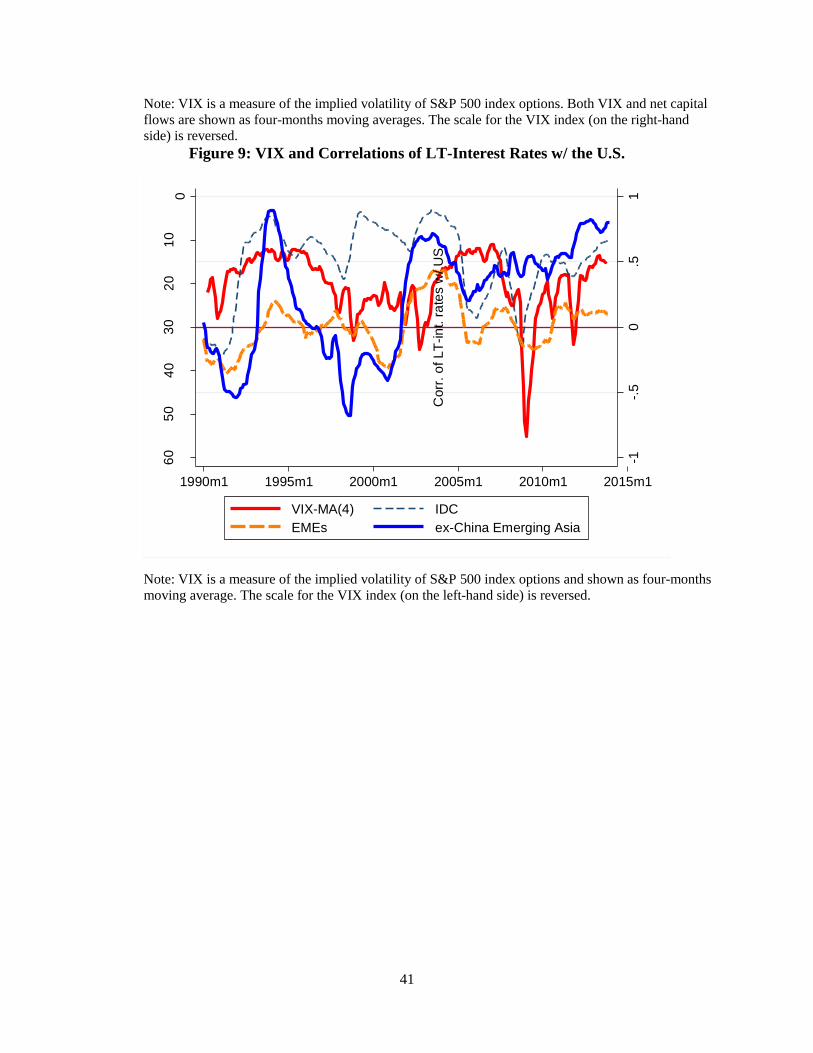
41
Note: VIX is a measure of the implied volatility of S&P 500 index options. Both VIX and net capital
flows are shown as four-months moving averages. The scale for the VIX index (on the right-hand
side) is reversed.
Figure 9: VIX and Correlations of LT-Interest Rates w/ the U.S.
Note: VIX is a measure of the implied volatility of S&P 500 index options and shown as four-months
moving average. The scale for the VIX index (on the left-hand side) is reversed.
-1-.
50
.51
Corr
. o
f LT
-in
t. r
ate
s w
/ U
S
01
02
03
04
05
06
0
VIX
- r
eve
rsed
1990m1 1995m1 2000m1 2005m1 2010m1 2015m1
VIX-MA(4) IDC
EMEs ex-China Emerging Asia
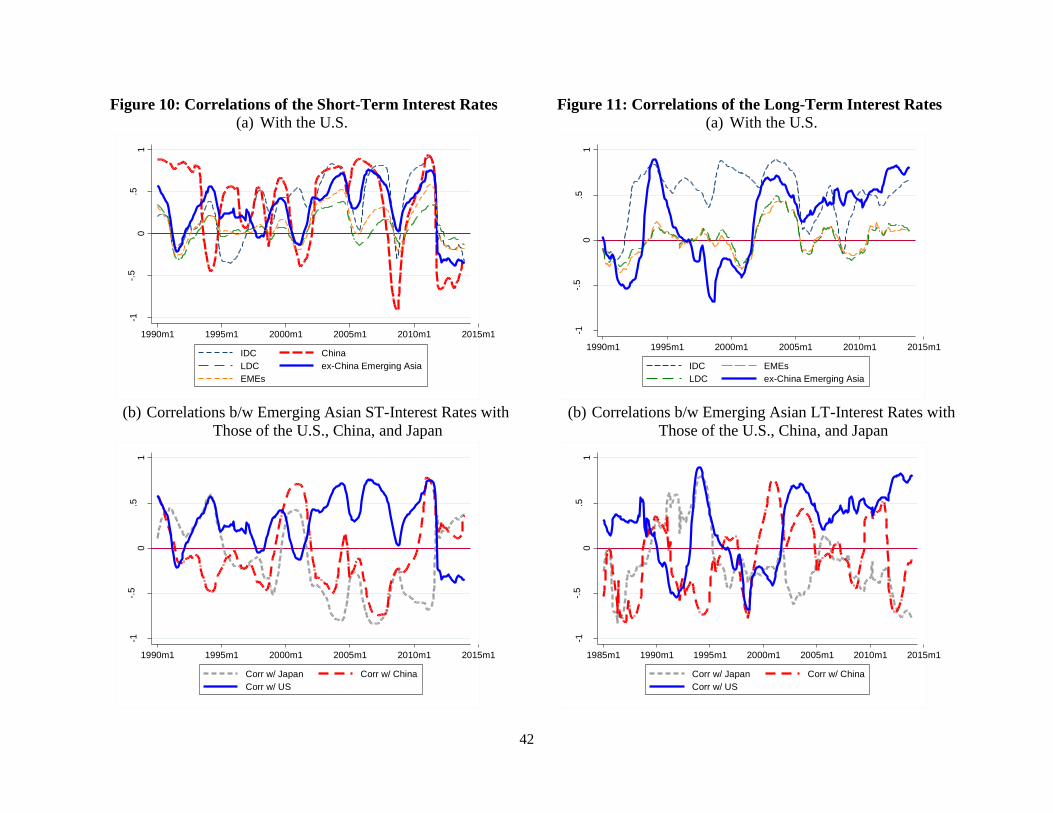
42
Figure 10: Correlations of the Short-Term Interest Rates
(a) With the U.S.
(b) Correlations b/w Emerging Asian ST-Interest Rates with
Those of the U.S., China, and Japan
Figure 11: Correlations of the Long-Term Interest Rates
(a) With the U.S.
(b) Correlations b/w Emerging Asian LT-Interest Rates with
Those of the U.S., China, and Japan
-1-.
50
.51
Corr
. o
f S
T-i
nt. r
ate
s w
/ U
S
1990m1 1995m1 2000m1 2005m1 2010m1 2015m1
IDC China
LDC ex-China Emerging Asia
EMEs
-1-.
50
.51
Corr
. o
f M
M r
ate
s w
/ U
S, Ja
pa
n, a
nd
Chin
a
1990m1 1995m1 2000m1 2005m1 2010m1 2015m1
Corr w/ Japan Corr w/ China
Corr w/ US
-1-.
50
.51
Corr
. o
f LT
-in
t. r
ate
s w
/ U
S
1990m1 1995m1 2000m1 2005m1 2010m1 2015m1
IDC EMEs
LDC ex-China Emerging Asia
-1-.
50
.51
Corr
. o
f LT
-in
t. r
ate
s w
/ U
S, Ja
pa
n, a
nd
Chin
a
1985m1 1990m1 1995m1 2000m1 2005m1 2010m1 2015m1
Corr w/ Japan Corr w/ China
Corr w/ US

43
Figure 12: Correlations of the Stock Market Price Indexes
With the U.S.
Figure 13: Correlations of Money Market Rates with
the U.S. Rates for Different Exchange Rate Regimes
Figure 14: Correlations of Money Market Rates with the U.S.
Rates for Different Financial Openness Regimes
-.5
0.5
1
Corr
. o
f sto
ck m
ark
et in
dexe
s w
ith th
e U
S S
&P
1990m1 1995m1 2000m1 2005m1 2010m1 2015m1
IDC China
EMEs ex-China Asian EMEs
-.25
0
.25
.5.7
5
Corr
. o
f M
M r
ate
s w
/ U
S fo
r d
iffe
ren
t E
RR
s1990 1995 2000 2005 2010
Fixed ERR Intermd. ERR
Flex. ERR
-.25
0
.25
.5.7
5
Corr
. o
f M
M r
ate
s w
/ U
S fo
r d
iffe
ren
t K
AO
PE
N r
egim
es
1990 1995 2000 2005 2010
High KAOPEN Med-KAOPEN
Low KAOPEN

44
Figure15: Correlations of Money Market Rates w/ US for different ERR
with “Most Open” KAOPEN
Figure 16: Correlations of Long-term Interest Rates w/ US for different
Financial Openness Regimes
-.25
0
.25
.5.7
5
1990 1995 2000 2005 2010
High ERR Med-ERR
Low ERR
-.25
0
.25
.5.7
5
1990 1995 2000 2005 2010
High KAOPEN Med-KAOPEN
Low KAOPEN

45
Figure 17: Financial Development for Different Types of Markets
05
01
00
150
200
PC
GD
P (
% o
f G
DP
)
1991-1995 1996-2000 2001-2008 2009-2011
Note: 'ex. China Emerging Asia' does not include HK or Singapore
(a) Private Credit Creation
U.S. ex-US, JP IDC
Japan ex. China Emerging Asia
China Latin America
05
01
00
150
SM
KC
(%
of G
DP
)
1991-1995 1996-2000 2001-2008 2009-2011
Note: 'ex. China Emerging Asia' does not include HK or Singapore
(b) Stock Market Capitalization
U.S. ex-US, JP IDC
Japan ex. China Emerging Asia
China Latin America
0
100
200
300
SM
TV
(%
of G
DP
)
1991-1995 1996-2000 2001-2008 2009-2011
Note: 'ex. China Emerging Asia' does not include HK or Singapore
(c) Stock Market Total Value
U.S. ex-US, JP IDC
Japan ex. China Emerging Asia
China Latin America
02
04
06
08
01
00
PV
BM
(%
of G
DP
)
1991-1995 1996-2000 2001-2008 2009-2011
Note: 'ex. China Emerging Asia' does not include HK or Singapore
(d) Private Bond Market Capitalization
U.S. ex-US, JP IDC
Japan ex. China Emerging Asia
China Latin America
05
01
00
150
200
PB
BM
(%
of G
DP
)
1991-1995 1996-2000 2001-2008 2009-2011
Note: 'ex. China Emerging Asia' does not include HK or Singapore
(e) Public Bond Market Capitalization
U.S. ex-US, JP IDC
Japan ex. China Emerging Asia
China Latin America
0.2
.4.6
.81
FD
2
1991-1995 1996-2000 2001-2008 2009-2011
Note: 'ex. China Emerging Asia' does not include HK or Singapore
(f) Financial Dev. Index
U.S. ex-US, JP IDC
Japan ex. China Emerging Asia
China Latin America
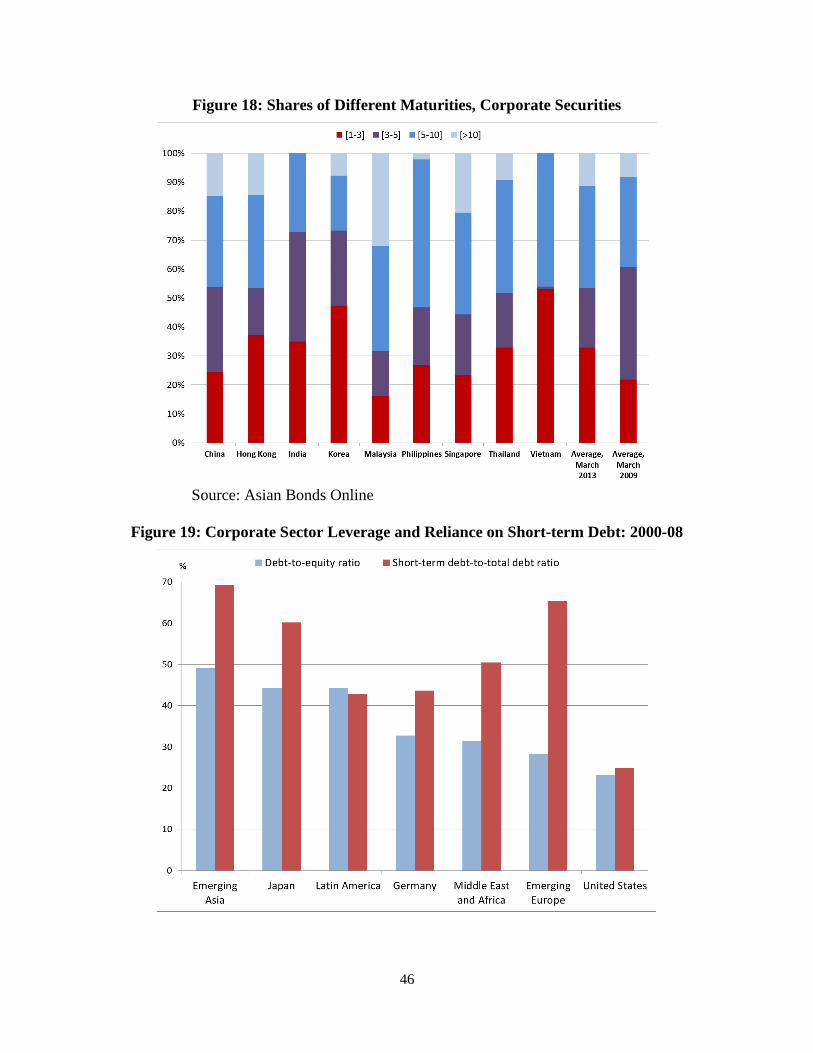
46
Figure 18: Shares of Different Maturities, Corporate Securities
Source: Asian Bonds Online
Figure 19: Corporate Sector Leverage and Reliance on Short-term Debt: 2000-08