monetary policies and its perspectives in advanced economies
TRANSCRIPT

DIRECTORATE GENERAL ECONOMICS, STATISTICS AND RESEARCH – BANCO DE ESPAÑA
MONETARY POLICY AND ITS PERSPECTIVES IN ADVANCED ECONOMIES
ÓSCAR ARCE
Director General Economics, Statistics and Research
XVIII REUNIÓN DE RESPONSABLES DE POLÍTICA MONETARIA
CEMLA and Banco de la República
September 13-15, 2021

DIRECTORATE GENERAL ECONOMICS, STATISTICS AND RESEARCH – BANCO DE ESPAÑA
1. Uneven global recovery with a sharp (temporary) rise in inflation
2. ECB strategy review and monetary policy perspectives
3. US FED new strategy and monetary policy perspectives
4. Monetary policy prospects in other advanced economies
SUMMARY
2

DIRECTORATE GENERAL ECONOMICS, STATISTICS AND RESEARCH – BANCO DE ESPAÑA 3
LARGE HETEROGENEITY IN THE RECOVERY ACROSS ADVANCED ECONOMIES
Sources: Eurostat, ECB, Refinitiv Datastream, Consensus
2,0
2,5
3,0
3,5
4,0
4,5
5,0
5,5
2021 2022 2023
SEP-21 PROJECTIONS (ECB MPE)
JUN-21 PROJECTIONS (EUROSYSTEM BMPE)
EURO AREA GDP GROWTH PROJECTIONS
%
90
92
94
96
98
100
102
104
106
108
2019 2020 2021 2022
EURO AREA UNITED STATES UNITED KINGDOM JAPAN
REAL GDP IN ADVANCED ECONOMIESConsensus forecast. August
100 = 2019
• The US reached 2019 GDP level this year; the euro area, the UK and Japan expected to do so in 2022
• The recovery in the euro area has been more intense and faster than anticipated in June

DIRECTORATE GENERAL ECONOMICS, STATISTICS AND RESEARCH – BANCO DE ESPAÑA 4
VACCINATION AND THE ECONOMIC RE-OPENING, AMID MASSIVE GLOBAL POLICY SUPPORT, AREPUSHING DEMAND UP IN ADVANCED ECONOMIES
Sources: Our World in Data
• Risks persist in emerging countries due to pandemic incidence
0
10
20
30
40
50
60
70
Jan-21 Mar-21 May-21 Jul-21 Sep-21 Nov-21
ADVANCED ECONOMIES% POPULATION FULLY VACCINATED
EURO AREA UNITED STATES UNITED KINGDOM JAPAN
%
0
10
20
30
40
50
60
70
Jan-21 Mar-21 May-21 Jul-21 Sep-21 Nov-21
EMERGING ECONOMIES% POPULATION FULLY VACCINATED
EAST EUROPE LATAM ASIA (EX. CHINA)
%
DIRECTORATE GENERAL ECONOMICS, STATISTICS AND RESEARCH – BANCO DE ESPAÑA 5
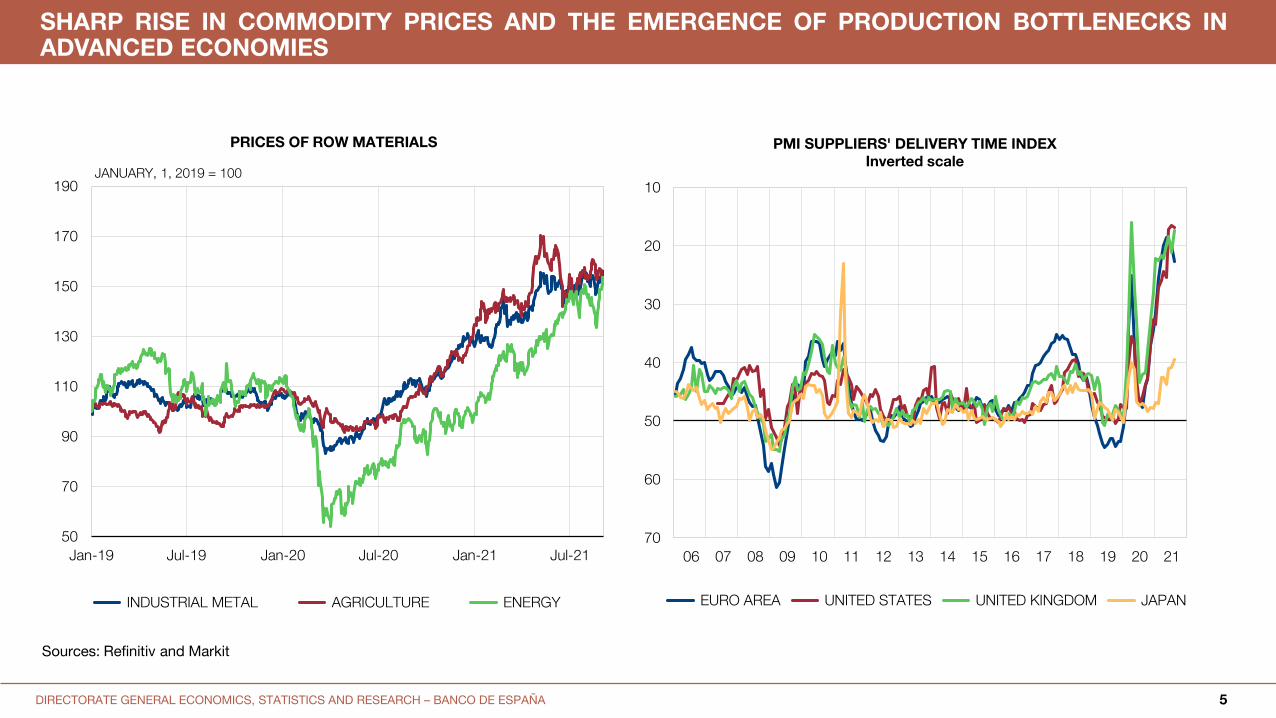
SHARP RISE IN COMMODITY PRICES AND THE EMERGENCE OF PRODUCTION BOTTLENECKS INADVANCED ECONOMIES
Sources: Refinitiv and Markit
50
70
90
110
130
150
170
190
Jan-19 Jul-19 Jan-20 Jul-20 Jan-21 Jul-21
INDUSTRIAL METAL AGRICULTURE ENERGY
PRICES OF ROW MATERIALS
JANUARY, 1, 2019 = 10010
20
30
40
50
60
70
06 07 08 09 10 11 12 13 14 15 16 17 18 19 20 21
EURO AREA UNITED STATES UNITED KINGDOM JAPAN
PMI SUPPLIERS' DELIVERY TIME INDEXInverted scale
DIRECTORATE GENERAL ECONOMICS, STATISTICS AND RESEARCH – BANCO DE ESPAÑA 6
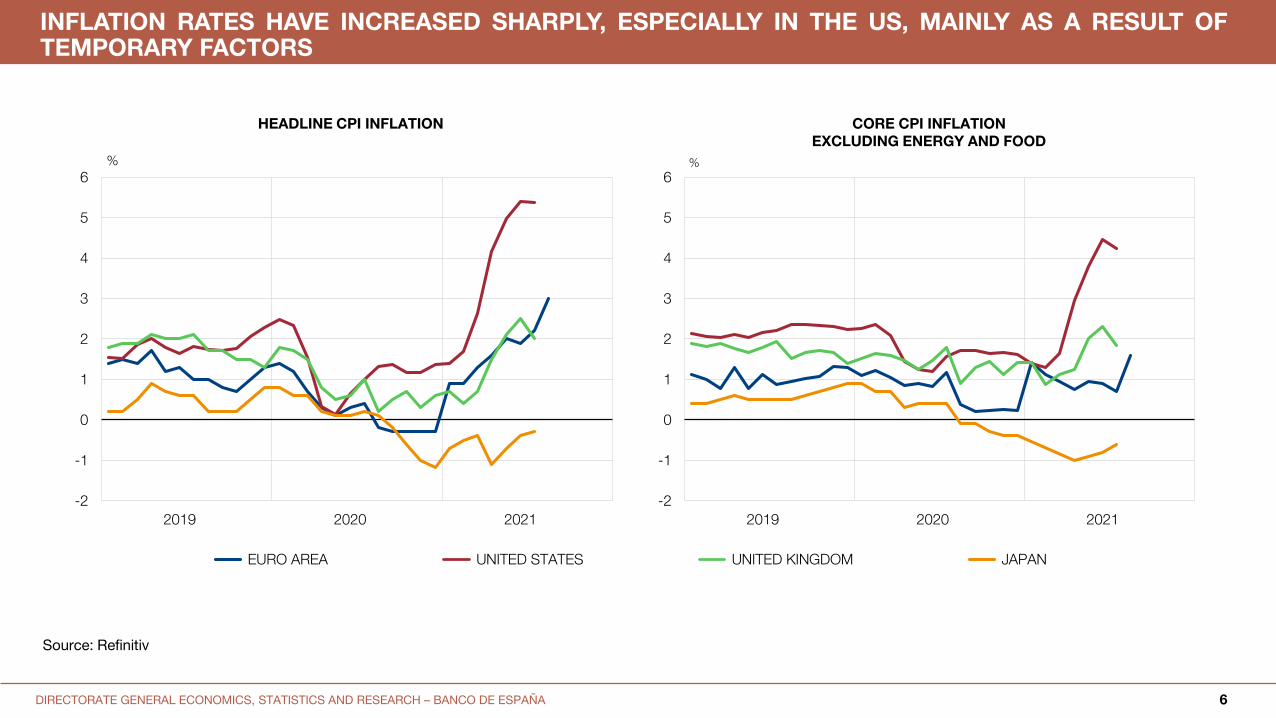
INFLATION RATES HAVE INCREASED SHARPLY, ESPECIALLY IN THE US, MAINLY AS A RESULT OFTEMPORARY FACTORS
Source: Refinitiv
-2
-1
0
1
2
3
4
5
6
2019 2020 2021
CORE CPI INFLATIONEXCLUDING ENERGY AND FOOD
%
EURO AREA UNITED STATES UNITED KINGDOM JAPAN
-2
-1
0
1
2
3
4
5
6
2019 2020 2021
HEADLINE CPI INFLATION
%

DIRECTORATE GENERAL ECONOMICS, STATISTICS AND RESEARCH – BANCO DE ESPAÑA 7
INFLATION PROJECTIONS HAVE INCREASED SHARPLY FOR 2021, BUT REMAIN SOMEWHAT MORE STABLE FOR 2022
Source: Consensus Forecast
1,0
1,5
2,0
2,5
3,0
3,5
4,0
Jan-21 Feb-21 Mar-21 Apr-21 May-21 Jun-21 Jul-21 Aug-21
UNITED STATES: INFLATION FORECAST 2022%
0,0
0,5
1,0
1,5
2,0
2,5
3,0
3,5
4,0
4,5
5,0
Jan-20 Apr-20 Jul-20 Oct-20 Jan-21 Apr-21 Jul-21
UNITED STATES: INFLATION FORECAST 2021%
0,0
0,5
1,0
1,5
2,0
2,5
Jan-21 Feb-21 Mar-21 Apr-21 May-21 Jun-21 Jul-21 Aug-21
EURO AREA: INFLATION FORECAST 2022%
-1,5
-1,0
-0,5
0,0
0,5
1,0
1,5
2,0
2,5
3,0
Jan-20 Apr-20 Jul-20 Oct-20 Jan-21 Apr-21 Jul-21
EURO AREA: INFLATION FORECAST 2021%

DIRECTORATE GENERAL ECONOMICS, STATISTICS AND RESEARCH – BANCO DE ESPAÑA 8
WAGES DO NOT, SO FAR, INCORPORATE SIGNIFICANT SECOND-ROUND EFFECTS
Sources: Eurostat and Fed Atlanta
• Although, second round effects could be more likely than in the past amid the supply sidebottlenecks and high private savings (pent-up demand)
0,0
0,5
1,0
1,5
2,0
2,5
3,0
3,5
4,0
4,5
2018 2019 2020 2021
LABOUR COSTS. UNITED STATESWAGE GROWTH TRACKER (FED ATLANTA (a))
%
0,0
0,5
1,0
1,5
2,0
2,5
3,0
3,5
4,0
4,5
2018 2019 2020 2021
NEGOTIATED WAGES TOTAL LABOUR COSTS
LABOUR COSTS. EURO AREA
%
(a) Median percentage change in hourly wages of individuals, from micro data

DIRECTORATE GENERAL ECONOMICS, STATISTICS AND RESEARCH – BANCO DE ESPAÑA 9
THE LAST ECB PROJECTION EXERCISE REVISES INFLATION UPWARDS
0,7
1,31,4
1,5
1,1
1,31,4
0,0
0,5
1,0
1,5
2,0
2020 2021 2022 2023
HICP EXCLUDING ENERGY AND FOOD
%
2,2
1,7
1,5
0,3
1,9
1,51,4
0,0
0,5
1,0
1,5
2,0
2,5
2020 2021 2022 2023
INFLATION RATE (HICP)
%
SEP - 21 PROJECTIONS (ECB MPE) JUN - 21 PROJECTIONS (EUROSYSTEM BMPE)
EURO AREA INFLATION PROJECTIONS
Source: ECB

DIRECTORATE GENERAL ECONOMICS, STATISTICS AND RESEARCH – BANCO DE ESPAÑA 10
MEDIUM TERM INFLATION EXPECTATIONS HAVE ALSO INCREASED, BUT STILL REMAIN RELATIVELY WELL ANCHORED
Sources: Bloomberg, Barclays. Last observation, August
-1,0
-0,5
0,0
0,5
1,0
1,5
2,0
2,5
3,0
3,5
4,0
4,5
2012 2013 2014 2015 2016 2017 2018 2019 2020 2021
BREAKEVEN 5Y-5Y
%
0,0
0,5
1,0
1,5
2,0
2,5
3,0
3,5
4,0
4,5
2012 2013 2014 2015 2016 2017 2018 2019 2020 2021
BREAKEVEN 2Y-2Y
%
EURO AREA UNITED STATES UNITED KINGDOM JAPAN

DIRECTORATE GENERAL ECONOMICS, STATISTICS AND RESEARCH – BANCO DE ESPAÑA
1. Uneven global recovery with a sharp (temporary) rise in inflation
2. ECB strategy review and monetary policy perspectives
3. US FED new strategy and monetary policy perspectives
4. Monetary policy prospects in other advanced economies
SUMMARY
11

DIRECTORATE GENERAL ECONOMICS, STATISTICS AND RESEARCH – BANCO DE ESPAÑA USO INTERNO 12
THE ECB ANNOUNCED IN JULY ITS NEW MONETARY POLICY STRATEGY
• When the economy is close to the lower bound, this requires especiallyforceful or persistent monetary policy measures to avoid negativedeviations from the inflation target becoming entrenched.
• This may also imply a transitory period in which inflation is moderatelyabove target (overshooting)
• 2 % inflation target over the medium term.
• The commitment to this inflation target is symmetric: negative and positivedeviations of inflation from the target are equally undesirable.
ADDRESSING THE LOWER BOUND
NEW INFLATION TARGET
• Forward guidance, asset purchases and longer-term refinancing operationsremain as an integral part of the ECB’s toolkit.
MONETARY POLICY
INSTRUMENTS
DIRECTORATE GENERAL ECONOMICS, STATISTICS AND RESEARCH – BANCO DE ESPAÑA USO INTERNO 13
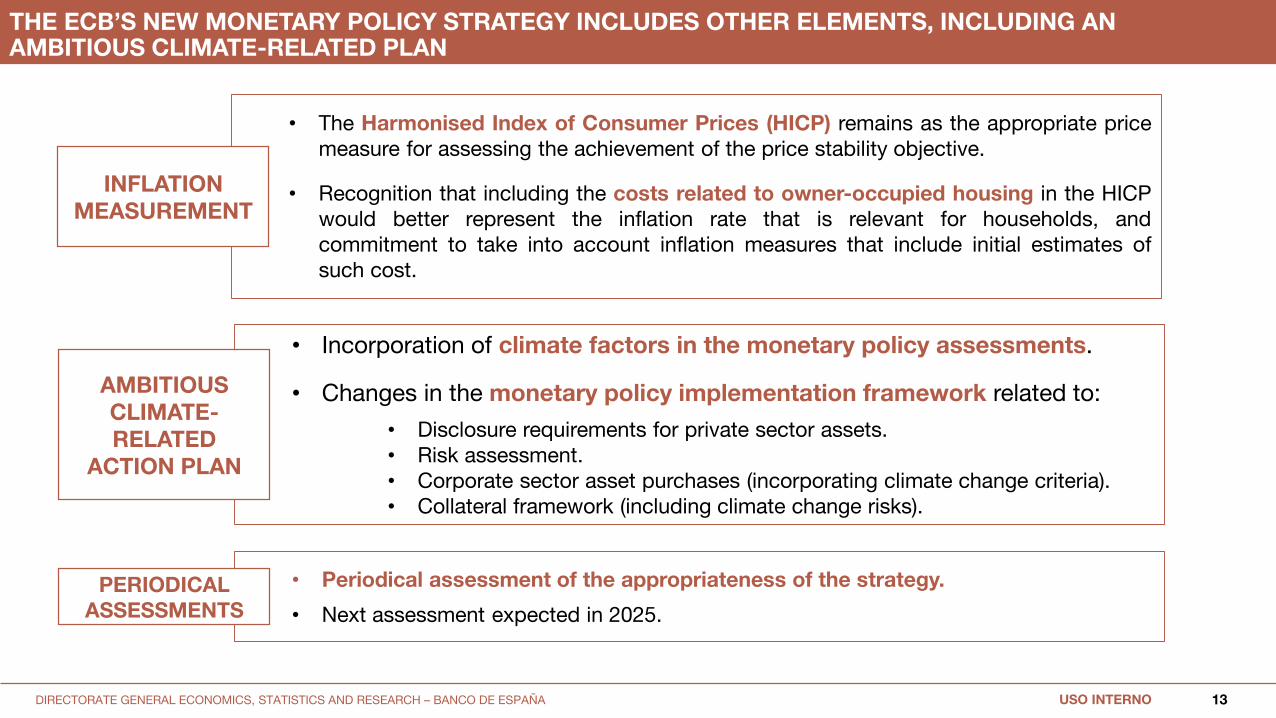
THE ECB’S NEW MONETARY POLICY STRATEGY INCLUDES OTHER ELEMENTS, INCLUDING AN AMBITIOUS CLIMATE-RELATED PLAN
• Incorporation of climate factors in the monetary policy assessments.
• Changes in the monetary policy implementation framework related to:
• Disclosure requirements for private sector assets.• Risk assessment.• Corporate sector asset purchases (incorporating climate change criteria).• Collateral framework (including climate change risks).
• The Harmonised Index of Consumer Prices (HICP) remains as the appropriate pricemeasure for assessing the achievement of the price stability objective.
• Recognition that including the costs related to owner-occupied housing in the HICPwould better represent the inflation rate that is relevant for households, andcommitment to take into account inflation measures that include initial estimates ofsuch cost.
AMBITIOUS CLIMATE-RELATED
ACTION PLAN
• Periodical assessment of the appropriateness of the strategy.
• Next assessment expected in 2025.
PERIODICAL ASSESSMENTS
INFLATION MEASUREMENT

DIRECTORATE GENERAL ECONOMICS, STATISTICS AND RESEARCH – BANCO DE ESPAÑA 14
Source: Refinitiv Datastream and own calculations Source: Refinitiv Datastream and own calculations
SINCE THE STRATEGY REVIEW ANNOUNCEMENT, THE TIMING OF RATE INCREASES HAS BEEN POSTPONED AND THE FUTURE INFLATION PATH HAS MOVED UP
EONIA + 10bp
• ECB monetary policy is likely to remain very accommodative for some time
-0,60
-0,50
-0,40
-0,30
-0,20
-0,10
0,00
Jan-19 Jan-20 Jan-21 Jan-22 Jan-23 Jan-24 Jan-25 Jan-26
Realised EONIA Current EONIA + 10 BP
EONIA Fwd curve 07/07/2021 EONIA Fwd curve 09/09/2021
EONIA FORWARD CURVE
%
0,8
1,0
1,2
1,4
1,6
1,8
2,0
Aug-22 Aug-23 Aug-24 Aug-25 Aug-26
ILS Fwd rates 07/07/21 07/07/21 LIFT-OFF DATE
ILS Fwd rates 09/09/21 09/09/21 LIFT-OFF DATE
PROJECTED INFLATION AND MARKET IMPLIED LIFT-OFF DATE
%
1,24%
1,75%
06/02/2024 30/04/2024

DIRECTORATE GENERAL ECONOMICS, STATISTICS AND RESEARCH – BANCO DE ESPAÑA 15
Source: Refinitiv Datastream and own calculations Source: Refinitiv Datastream and own calculations
EURO AREA: INFLATION AT THE EXPECTED TIME OF LIFT-OFF HAS INCREASED AND NOW STANDS CLOSE TO 1,8 %
• In the US, inflation compensation at the expected lift-off date stands well above 2%
0,20
0,40
0,60
0,80
1,00
1,20
1,40
1,60
1,80
2,00
2,20
2,40
2,60
2,80
3,00
16
Jul 20
20
10
Sep
2020
29
Oct
2020
10
Dec 2
020
21
Jan 2
021
11
Mar
20
21
22
Ap
r 2
021
10
Jun
20
21
7 J
ul 202
1
21
Jul 20
21
31
Aug
2021
9 S
ep
20
21
EMUINFLATION COMPENSATION IN THE LIFT-OFF DATE
%
ECB New Strategy announcement
0,20
0,40
0,60
0,80
1,00
1,20
1,40
1,60
1,80
2,00
2,20
2,40
2,60
2,80
3,00
29
Jul 20
20
16
Sep
2020
5 N
ov
2020
16
Dec 2
020
27
Jan 2
021
17
Mar
20
21
28
Ap
r 2
021
16
Jun
20
21
28
Jul 20
21
31
Aug
2021
9 S
ep
20
21
UNITED STATESINFLATION COMPENSATION IN THE LIFT-OFF DATE
%
FED New Strategy announcement

DIRECTORATE GENERAL ECONOMICS, STATISTICS AND RESEARCH – BANCO DE ESPAÑA
SINCE DECEMBER 2020 PEPP PURCHASES ARE CONDUCTED FLEXIBLY WITH THE OBJECTIVE OF MAINTAINING FAVOURABLE FINANCING CONDITIONS
16
Source: ECB.
• In September, in view of easing of financing conditions (FC) since June and slight improvement in inflation outlook, the
ECB has decided to moderately lower the pace of PEPP purchases
• However, recent reversal in FC is a powerful reminder that they remain volatile and highly dependent on policy support
0,5
0,7
0,9
1,1
1,3
1,5
1,7
1,9
2,1
2,3
2020 2021 2022 2023
DEC-19 DEC-20 JUN-21 SEP-21
ECB/EUROSYSTEM PROJECTIONS OF EURO AREA INFLATION
%
-0,40
-0,30
-0,20
-0,10
0,00
0,10
0,20
0,30
0,40
Dec-20 Feb-21 Apr-21 Jun-21 Aug-21
10-YEAR OIS 10-YEAR SOVEREIGN YIELDS (a)
10-YEAR OIS AND SOVEREIGN YIELDS. EMU
% GovC (10/06/21)GovC (11/03/21) GovC (22/07/21)
09/09/2021Source: Refinitiv Datastream and ECB. Latest observation:(a) GDP-weighted 10y sovereign yield of Big-4 (Germany, France, Italy, Spain).
DIRECTORATE GENERAL ECONOMICS, STATISTICS AND RESEARCH – BANCO DE ESPAÑA
1. Uneven global recovery with a sharp (temporary) rise in inflation
2. ECB strategy review and monetary policy perspectives
3. US FED new strategy and monetary policy perspectives
4. Monetary policy prospects in other advanced economies
SUMMARY
17

DIRECTORATE GENERAL ECONOMICS, STATISTICS AND RESEARCH – BANCO DE ESPAÑA 18
THE FED CONSIDERS THE SPIKE IN INFLATION AS TRANSITORY AND STILL SEES A LARGE GAP TO FILL IN THE EMPLOYMENT OBJECTIVE…
• Fed argues the inflation rise is transitory and concentrates on labor market shortfalls
Source: Federal Reserve.
Notes: Range for PCE refers to the forecast range of FOMC members for PCE inflation
-15
-13
-11
-9
-7
-5
-3
-1
0 6 12 18 24 30 36 42 48 54 60 66 72 78
EMPLOYMENT DESTRUCTION COVID-19 COMPARED TO GFC
GFC COVID-19
Employment destruction relative to peak month (%)
Months since peak month
Source: BLS.
Notes: Peak month for Global Financial Crisis (GFC) and Covid-19,respectively, December 2007 and February 2020.
0,0
0,5
1,0
1,5
2,0
2,5
3,0
3,5
4,0
4,5
Dec-20 Mar-212021
jun-21 Dec-20 Mar-212022
jun-21 Dec-20 Mar-212023
jun-21
FOMC INFLATION PROJECTION (MEDIAN, RANGE AND FORECAST REVISIONS)
RANGE FOR PCE FORECAST REVISION
PCE INFLATION CORE PCE INFLATION
% y-o-y growth, percentage points
Date of FOMC Forecast and Forecast Period

DIRECTORATE GENERAL ECONOMICS, STATISTICS AND RESEARCH – BANCO DE ESPAÑA
0,0
0,5
1,0
1,5
2,0
2,5
2018 2019 2020 2021 2022 2023
FED FUNDS RATE
EFFECTIVE FFR
JUNE 2021 FOMC MEDIAN PROJECTION
MARCH 2021 FOMC MEDIAN PROJECTION
FUTURES AUGUST 31, 2021
%
19
… SO IT WILL BE PATIENT WITH THE NORMALIZATION OF POLICY RATES ALTHOUGH IT IS PLANNING TO START THE TAPERING OF ASSET PURCHASES AT THE END OF THIS YEAR
• Powell’s Jackson Hole speech: The Federal Reserve will still be patient with the normalization ofpolicy rates, while it is considering to start tapering asset purchases at the end of this year.
Source: FRB New York.
Notes: Figures are as of year-end. Figures for 2010-1H 2021 represent historical data; figures for 2H 2021-2030are shaded and represent projections. The range after 2025 reflects outcomes for the portfolio between fullreinvestment and full run-off. Projections for 2H 2021 – 2023 based on the Survey of Primary Dealers conductedby the New York Fed in July 2021. Assumptions for SOMA purchases, interest rates, length of the reinvestmentphase, and the growth of key liabilities for 2024-30 are based on the Survey of Primary Dealers and the Survey ofMarket Participants conducted by the New York Fed in March 2021. Projected figures are rounded.
Source: Federal Reserve, Refinitiv Datastream
0
5
10
15
20
25
30
35
40
45
PROJECTED SOMA DOMESTIC SECURITIES HOLDINGS
Range of Projections
Historical Values
% of GDP

DIRECTORATE GENERAL ECONOMICS, STATISTICS AND RESEARCH – BANCO DE ESPAÑA
1. Uneven global recovery with a sharp (temporary) rise in inflation
2. ECB strategy review and monetary policy perspectives
3. US FED new strategy and monetary policy perspectives
4. Monetary policy prospects in other advanced economies
SUMMARY
20

DIRECTORATE GENERAL ECONOMICS, STATISTICS AND RESEARCH – BANCO DE ESPAÑA USO INTERNO 21
MONETARY POLICY IN OTHER ADVANCED ECONOMIES
• Some central banks are in the process of normalization of monetary policy. Norway projects a rate risethis month (Sept. ‘21). New Zealand postponed last month lift-off because of the new wave; Canada inend of 2022; in 2024 Australia and Sweden (Riksbank set to complete asset purchases this year)
• Bank of England: expected rate rise in 2022, and to cease reinvestments of maturing assets when BankRate has risen to 0.5%
• Bank of Japan still fighting with very low inflation will keep short- and long-term interest rates at theirpresent or lower levels for the foreseeable future
Source: JP Morgan as of August 27.
-0,2
-0,1
0
0,1
0,2
0,3
0,4
0,5
0,6
EXPECTED OFFICIAL INTEREST RATES
CANADA JAPAN UNITED KINGDOM
%
-0,2
0
0,2
0,4
0,6
0,8
1
1,2
EXPECTED OFFICIAL INTEREST RATES
NORWAY SWEDEN AUSTRALIA NEW ZEALAND
%

DIRECTORATE GENERAL ECONOMICS, STATISTICS AND RESEARCH – BANCO DE ESPAÑA
-0,2
0,0
0,2
0,4
0,6
0,8
1,0
1,2
1,4
1,6
1,8 JAPAN: INFLATION FORECAST 2022
-2,0
-1,5
-1,0
-0,5
0,0
0,5
1,0
1,5
2,0
ene-20 abr-20 jul-20 oct-20 ene-21 abr-21 jul-21
JAPAN: INFLATION FORECAST 2021
0,0
1,0
2,0
3,0
4,0
5,0
6,0
ene-21 abr-21 jul-21
UK: INFLATION FORECAST 2022
-0,5
0,0
0,5
1,0
1,5
2,0
2,5
3,0
3,5
ene-20 abr-20 jul-20 oct-20 ene-21 abr-21 jul-21
UK: INFLATION FORECAST 2021
22
INFLATION FORECASTS: UK AND JP
Inflation forecasts for the UK in 2021 and in 2022 have increased slightly in the last months.
However, inflation forecast for Japan have barely moved since the beginning of the year
Source: Consensus Forecast

DIRECTORATE GENERAL ECONOMICS, STATISTICS AND RESEARCH – BANCO DE ESPAÑA
• A central scenario of temporary inflation spikes, with some differences across AEs….. :
• US:
Pre-crisis period: normalization of monetary policy, with inflation outlook in line with objective
Near/medium term: Fast recovery and rising inflation; Fed narrative: inflation rise is transitory, focus on labor
market weaknesses
Yet conditions could be conducive to a relatively early normalization of monetary policy
• Euro area:
Pre-crisis: long period of subdued inflation, persistently low inflation expectations
Near term/medium: Deeper impact of crisis, more gradual recovery, relatively muted inflation expectations
• …but risks of alternative scenarios should not be overlooked:
• Stronger and/or more persistent bottlenecks and second-round effects…
• …potentially leading to tighter policies in AEs and EMEs against a context of high private and public debt
SOME TAKE AWAYS
23

DIRECTORATE GENERAL ECONOMICS, STATISTICS AND RESEARCH – BANCO DE ESPAÑA USO INTERNO 24
RISKS TO GLOBAL ECONOMY PERSIST DUE TO THE PANDEMIC AND ITS IMPACT ON GLOBAL VALUE CHAINS
• Pandemic risks especially affect emerging Asia, where mobility is severely restricted in response to new outbreaks due to low
vaccination rates. This dynamic could exacerbate bottlenecks in global supply chains, given Asia's central role.
40
42
44
46
48
50
52
2018 2019 2020 2021
EURO AREA
UNITED STATES
GLOBAL EXCLUDING EURO AREA AND UNITED STATES
PMI MANUFACTURINGSTOCKS OF FINISHED GOODS INDEX
Three months moving average
y = 0,0143x + 13,122
y = -0,0078x + 10,777
-70
-50
-30
-10
10
30
50
0 200 400 600 800
INCIDENCE AND MOBILITY EMERGING ASIA VS. OTHER EMERGING
ECONOMIES
EMERGING ASIA OTHER EMERGING
MO
BIL
ITY
, M
M7 D
, %
PR
E-P
AN
DE
MIC
LE
VE
L
NEW DAILY CASES / MILLION HAB, MM 7D

DIRECTORATE GENERAL ECONOMICS, STATISTICS AND RESEARCH – BANCO DE ESPAÑA USO INTERNO 25
SECOND ROUND EFFECTS FROM INFLATION SURPRISES COULD BE MORE LIKELY THAN IN THE PAST AMID THE SUPPLY SIDE BOTTLENECKS AND HIGH PRIVATE SAVINGS (PENT-UP DEMAND)COULD SIGNAL A HIGHER PERSISTENCE OF INFLATIONARY PRESSURES DUE TO ENERGY SHOCKS, SUPPLY BOTTLENECKS AND PENT-UP DEMAND• The materialization of these risks could lead to an early tightening of monetary policy in the US, which could have negative
effects on the rest of the advanced economies and, especially, on emerging markets.
-60
-40
-20
0
20
40
60
80
100
2019 2020 2021
CITIGROUP INFLATION SURPRISE INDEX
%
-5
0
5
10
15
20
25
2018 2019 2020 2021
HOUSEHOLD SAVING RATESDeviation from historical average since 2000
%
(a) Net saving rate for Japan.
Sources: Eurostat, Bureau, OECD and ONS.
EURO AREA UNITED STATES UNITED KINGDOM JAPAN (a)

DIRECTORATE GENERAL ECONOMICS, STATISTICS AND RESEARCH – BANCO DE ESPAÑA USO INTERNO 26
ONE OF THE MAIN CONSEQUENCES OF THE PANDEMIC IS THE SURGE IN GLOBAL DEBT
• Global debt has increased around 34 percentage points since the outbreak, especially in the Government and Non-Financial
Corporations sectors.
Source: Institute of International Finance Global Debt Monitor May-21.
0
50
100
150
200
250
300
350
400
2005 2006 2007 2008 2009 2010 2011 2012 2013 2014 2015 2016 2017 2018 2019 2020 2021
GLOBAL DEBT
HOUSEHOLDS NON-FINANCIAL CORPORATIONS GOVERNMENT FINANCIAL CORPORATES TOTAL
% of GDP

DIRECTORATE GENERAL ECONOMICS, STATISTICS AND RESEARCH – BANCO DE ESPAÑA
THANK YOU FOR YOUR ATTENTION
DIRECTORATE GENERAL ECONOMICS, STATISTICS AND RESEARCH – BANCO DE ESPAÑA
-1
-0,5
0
0,5
1
1,5
2
2020 2021
POLICY RATES: ADVANCED ECONOMIES (*)
%
28
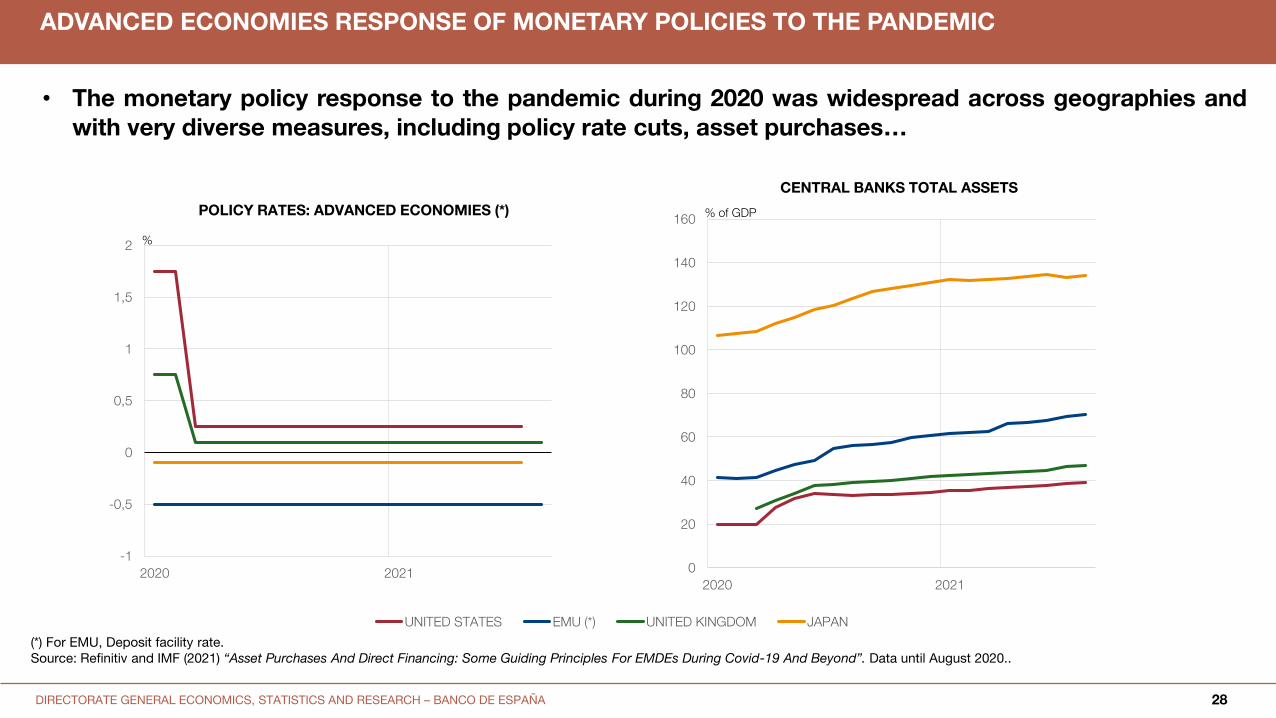
ADVANCED ECONOMIES RESPONSE OF MONETARY POLICIES TO THE PANDEMIC
• The monetary policy response to the pandemic during 2020 was widespread across geographies andwith very diverse measures, including policy rate cuts, asset purchases…
0
20
40
60
80
100
120
140
160
2020 2021
CENTRAL BANKS TOTAL ASSETS
% of GDP
UNITED STATES EMU (*) UNITED KINGDOM JAPAN%
(*) For EMU, Deposit facility rate.Source: Refinitiv and IMF (2021) “Asset Purchases And Direct Financing: Some Guiding Principles For EMDEs During Covid-19 And Beyond”. Data until August 2020..

DIRECTORATE GENERAL ECONOMICS, STATISTICS AND RESEARCH – BANCO DE ESPAÑA 29
THE RANGE OF MONETARY POLICY AND FINANCIAL MEASURES HAS BEEN VERY BROAD
Sources: BIS WP #934
• …and other unconventional monetary and financial measures
0
20
40
60
80
100
120
140
Jan-20 Apr-20 Jul-20 Oct-20
ADVANCED ECONOMIES: MONTHLY ANNOUNCEMENTS OF POLICIES BY CATEGORY
Interest rate Lending operations Reserve policy Foreign exchange Asset purchases Other