momo inc - kgi securities singapore...momo, inc. united states june 6, 2018 kgi securities...
TRANSCRIPT

INITIATION Technology ▪ United States
Momo Inc (MOMO US/MOMO.OQ)
June 6, 2018 KGI Securities (Singapore) Pte. Ltd.
MOMO US (1yr) VS NASDAQ
Source: Bloomberg
Marc Tan 65 6202 1195 [email protected]
Nicholas Siew 65 6202 1193 [email protected]
See the last page for important disclosures.
BUY - INITIATIONPrice as of 6 Jun 2018 49.73
12M target price (US$) 58.93
Previous target price (US$) na
Upside, incl. div (%) 18.5%
Trading data
Mkt Cap (US$m) 10,131
Issued Shares (m) 164
Ave Daily Traded
(3-Month) Vol / Val 4.9m / $190.8m
52 week lo / hi $22.49 / $50.82
Major Shareholders
Pendel Group 6.6%
Prime Capital 4.0%
Blackrock 4.0%
Alibaba Group 3.1%
Momo 8.0: Social Graphing Generation Y
Event Momo Inc. (Momo) is a leading mobile social networking platform in China that allows users to connect and communicate through location-based services. The company has seen its earnings surge 22.2x since the introduction of its Live Video Service segment in 2015. We expect earnings to grow at a CAGR (2017 – 2020F) of 39.2% as it continues to ramp up its monetisation strategy and leverage on its growing Monthly Average Users (MAU). We initiate coverage on Momo with a BUY recommendation and a target price of US$58.93, based on a DCF valuation, implying a 2018F P/E of 24.0x. Impact Enlarged user base for monetisation from recent acquisition of Tantan. Momo has acquired Tantan for US$600.9mn in cash together with 5.3mn newly issued Class A ordinary shares to create one of the largest dating and social networking company in China. We believe this to be a complementary acquisition which will increase monetary utilisation of its combined user base. Continued strong growth from Live Video Streaming. Momo’s live streaming platform became its main revenue driver in 2016 (accounting for 68% and 84% of 2016 and 2017 revenue, respectively) and has continued to drive revenue growth, supported by the management’s ability to retain star performers and introduce new monetisation schemes. As the leading platform in China for the past few years, we believe Momo has become the go-to platform for both established and unestablished performers alike. We expect this segment to continue experiencing strong growth (2017 – 2020F CAGR: 39%) as live video streaming users in China are on track to reach 500mn by 2020F. Enlarged user base to have trickle-down effect on Mobile Marketing. As Momo continues to grow in popularity, its enlarged user base should lead to higher mobile marketing revenues as enterprises in China shift their focus towards engagement with millenials, who form the bulk of Momo’s user base. Risks Decline in popularity due to competition from other platforms could lead to a decline in monetary utilisation. Penalties (monetary and non-monetary) relating to legal and regulatory measures could rise if there are violations on the platform, such as illicit video content and misuse of platform.
Financials & Key Operating Statistics
YE Dec USD (mn) 2016A 2017A 2018F 2019F 2020F
Revenue 553.1 1,318.3 2,024.6 2,669.4 3,392.4 PATMI (GAAP) 145.3 317.5 510.3 666.8 858.0 PATMI (Non-GAAP) 177.0 366.6 559.8 716.3 907.5 Core EPS (US$) 38.5 80.5 127.6 166.8 214.6 Core EPS growth (%) 945.7 114.2 58.7 30.7 28.7 P/E (x) 47.7 30.4 19.2 14.7 11.4 P/B (x) 10.9 9.3 6.0 4.1 2.9 P/S (x) 12.5 7.3 4.8 3.7 2.9 EV/EBITDA (x) 43.7 24.0 15.1 8.2 6.1 Debt / Equity Net cash Net cash Net cash Net cash Net cash Net Margin (%) 26.3 24.1 25.2 25.0 25.3 ROE (%) 26.4 38.0 38.1 32.9 29.6 Source: Company Data, KGI Research

Momo, Inc. United States
June 6, 2018 KGI Securities (Singapore) Pte. Ltd. 2
Contents Investment Thesis ............................................................................................. 3
Enlarged user base from recent acquisition of Tantan ...................................... 3
Continued strong growth from Live Video Streaming ....................................... 4
Enlarged user base to have trickle-down effect on Mobile Marketing.............. 5
Valuation .......................................................................................................... 6
Operational and financial review ...................................................................... 8
Strong balance sheet with zero debt balance .................................................... 8
Higher MAU to should bode well for longer term user monetisation strategy . 8
Revenue to be driven by Live Video Service paying users and higher ARPU ..... 9
Operating leverage ............................................................................................ 9
Slight margin expansion expected ................................................................... 10
Comparables ................................................................................................... 11
Key risks .......................................................................................................... 12
Decline in popularity of Momo may affect long term sustainability ............... 12
Overly aggressive monetisation strategies may not be well received by users ......................................................................................................................... 12
Legal/Regulatory risk arising from improper use of data or platform ............. 12
Increase in attrition rates after relationships are formed ............................... 12
Company Overview......................................................................................... 13
Leading Mobile Social Networking Platform .................................................... 13
Enlarged user base with the acquisition of Tantan .......................................... 16
China Mobile Marketing Sector ...................................................................... 17
China Mobile Internet Market ......................................................................... 17
Evolution of mobile social networking in China ............................................... 18
Financials ........................................................................................................ 19
Appendix ........................................................................................................ 20

Momo, Inc. United States
June 6, 2018 KGI Securities (Singapore) Pte. Ltd. 3
Investment Thesis
Enlarged user base from recent acquisition of Tantan
The acquisition of Tantan makes Momo a dominant player in China’s open social networking scene. On average, 80% of Momo’s users fall within the 19 – 32 age group, with a variety of social objectives, unlike Tantan’s younger users who are very much focused on matching for romantic relationships. Combined together, there are plenty of functionalities on Momo’s platform which Tantan’s users can eventually use. With the advancement of Augmented Reality (AR) technology, we believe gaps between online-offline social interactions and activities will tighten as the millennial generation explores new avenues with different costs and stimulations. While Tantan only began monetising its user base in January 2018, we believe most of Tantan’s users will eventually start using Momo’s live streaming service and other functionalities once synergies between the merged entities are realised. Given that more than 80% of China’s live streaming video viewers fall within the 17 – 33 age group, we expect Tantan’s acquisition will become a strategic complement to the Momo platform and we forecast combined registered users of Momo and Tantan to exceed 300mn users by 2018F, which translates into MAU growing at an average of 28% per year until 2020F, providing support for live video service, value-added service and mobile marketing, which collectively make up more than 97% of Momo’s revenues in 2017. Tantan’s performance: In the latest earnings call, management disclosed that even though Tantan launched its monetisation features in January 2018, its growth trajectory has been impressive, with the number of subscribers outpacing the growth of Momo’s users when they first started membership subscription services. While Tantan will remain independently managed, we expect the combined entity to benefit from economies of scale through cost of revenues (developer costs, bandwidth charges etc.), as well as increased monetisation initiatives on Tantan’s user base.
Figure 1: Culture Disparity in Open Social Scenarios
Figure 2: Demographic Profile of Live Streaming Video Viewers in China
Source: Company Source: eMarketer (Aug 2016), KGI Research
10%
82%
5%3%
11 - 16
17 - 33
34 - 45
46+

Momo, Inc. United States
June 6, 2018 KGI Securities (Singapore) Pte. Ltd. 4
Continued strong growth from Live Video Streaming
According to Huawei’s 2017 mobile video report, China accounts for close to two thirds of the world’s total mobile live video users, but more than 90% of its total value, which includes direct purchase, subscription and advertising values. By 2020F, the total number of users is expected to approach 500mn, which will account for 54% of the global addressable market. Given the above trends, we expect the Live Video Service segment to grow 59.0% YoY, driven by organic and inorganic growth in paying user base (acquisition of Tantan). This should account for 87% of 2018F revenues based on our forecasts.
Tighter regulation: We expect Momo to continue benefitting from this trend especially as smaller players get clamped down due to regulatory restrictions. In April 2016, the Ministry of Culture launched a campaign against violations on China’s large live streaming platforms, requiring real-name authentication of online hosts and recording of content. Increased regulatory scrutiny led more than 4,000 show rooms offering illicit content being shut down that year and the implementation of license requirements for audio/video program transmissions.
To mitigate the new regulatory measures, Momo has obtained an internet audio/video program transmission license through Zhejiang Shengdian, a wholly-owned subsidiary acquired in March 2017. The firm is also in possession of an internet culture operation license and has received the approval to expand the scope of the license to cover the operation of comic and animation products.
Figure 3: Momo Live Video Revenue Recognition Model
Source: Company
Figure 4: Mobile Live Market Size: Users and values
Source: Huawei, Strategy Analytics

Momo, Inc. United States
June 6, 2018 KGI Securities (Singapore) Pte. Ltd. 5
Enlarged user base to have trickle-down effect on Mobile Marketing
The post 80s and 90s generations, which form the bulk of Momo and Tantan’s user base, spend a substantial amount of time on social media platforms and are more likely to be affected by their friends and peers, as well as key opinion leaders on social networks. To capitalize on this trend, retailers and brands now use social media as an alternative channel to distribution and marketing. Since 2013, the proportion of enterprises conducting internet-based marketing and promotion has increased steadily. Enterprises seek to raise awareness of their brands and internet marketing has become an indispensable channel for companies that want to accelerate the integration of traditional and new media.
Figure 5: Marketing and Promotional Channels used by Companies
*Figures do not add to 100% due to overlapping categorisation
Figure 6: Proportion of Companies engaged in Internet-Based Marketing
Source: China Internet Network Information Centre, KGI Research Source: China Internet Network Information Centre, KGI Research
As Momo’s popularity continues to grow alongside its user base, we expect a trickle-down effect on company’s mobile marketing revenue, given that its platform includes many features such as instant messaging, live video streaming, as well as location based social networking services, which will eventually attract more companies to bid up advertisements on their platform. We expect these trends to grow mobile marketing by 32.6% YoY, on the back of a rise in total registered users and positive momentum in MAU.
Figure 7: Use of Internet Marketing Channels by Companies
Source: China Internet Network Information Centre, KGI Research
11%15%
34%
22%
13%
7%11%
1%
18%24%
39%
29%
19%
11% 11%
0%0%
10%
20%
30%
40%
50%
% o
f co
mp
anie
s m
arke
tin
g &
p
rom
oti
on
al c
han
ne
ls
2015 2016
24.2%23.0% 20.9%
24.2%
33.8%38.7%
0.0%
10.0%
20.0%
30.0%
40.0%
50.0%
2011 2012 2013 2014 2015 2016
% o
f co
ma
pn
ies
en
ga
ge
d in
In
tern
et-
Ba
sed
Ma
rke
tin
g (
%)
Internet-Based Marketing
65%
48%
47%
37%
33%
28%
25%
18%
17%
14%
1%
66%
55%
48%
40%
36%
32%
28%
25%
21%
21%
17%
1%
0% 10% 20% 30% 40% 50% 60% 70% 80%
Instant Messaging
E-commerce Platform
Search Engine
Advertorial
Website Ads
Online Alliance Advertising
Group Shopping Website
Online Video Ads
Others
2016 2015

Momo, Inc. United States
June 6, 2018 KGI Securities (Singapore) Pte. Ltd. 6
Valuation We initiate coverage on Momo with a BUY recommendation and a target price of US$58.93, representing an 18.5% upside. Our target price is based on a DCF valuation methodology, implying a 2018F P/E of 24.0x. Earnings: Valuation of Momo was based on a projected earnings CAGR (2017 – 2020F) of 39.2%, driven mainly by the video streaming segment (84% of 2017 revenue), as well as the organic and inorganic growth in its user base and MAU. Margins: We assume gross margins to decrease by 1 ppt from 2017 and remain flat at 50%, operating margins to inch up marginally and remain flat at 29% and net margins to increase to 25% by 2020F. In aggregate, these will be driven by higher revenue sharing costs and an improving operating leverage. Registered users and MAU: We factored in both organic growth in registered users and MAU, and inorganic growth from the acquisition of Tantan, which had 60mn registered users and a MAU of 0.1mn at the time of acquisition. We expect Momo’s total registered users to grow at higher double digit growth rates of about 30% before starting to taper off in 2020F, taking into account the saturation of the industry by then, as well as a higher churn rate as users migrate to other more dedicated and versatile instant communication applications after establishing a relationship with other Momo users. Average Revenue Per User (ARPU): We assume ARPU for the Live Video Service, Value-added Service segment and mobile marketing to grow modestly, led by Momo’s monetisation strategy in the medium term, which should see newer paid features and higher contribution per user. While we maintain a flat ARPU assumption for the Mobile games segment, we expect paying users for this segment to decline. Even when it eventually brings the development in-house, there will still be a lead time before we should start to see some traction.

Momo, Inc. United States
June 6, 2018 KGI Securities (Singapore) Pte. Ltd. 7
Figure 8: DCF Valuation
Source: KGI Research
DCF
2017A 2018F 2019F 2020F 2021F 2022F 2023F 2024F 2025F 2026F
Live video service 1,102.6 1,753.3 2,324.9 2,964.2 3,592.6 4,354.3 5,057.5 5,874.3 6,229.7 6,606.6
Value-added service 103.1 141.0 187.0 238.5 289.0 350.3 406.9 472.6 501.2 531.5
Mobile marketing 76.2 101.0 133.9 170.8 207.0 250.9 291.4 338.4 358.9 380.6
Mobile games 35.6 28.5 22.8 18.2 18.2 18.2 18.2 18.2 18.2 18.2
Other services 0.7 0.7 0.7 0.7 0.7 0.7 0.7 0.7 0.7 0.7
Net revenue 1,318.3 2,024.6 2,669.4 3,392.4 4,107.6 4,974.4 5,774.7 6,704.2 7,108.7 7,537.6
YoY growth (%) 53.6% 31.8% 27.1% 21.1% 21.1% 16.1% 16.1% 6.0% 6.0%
Cost of revenues (649.3) (1,012.3) (1,334.7) (1,696.2) (2,094.9) (2,536.9) (2,945.1) (3,419.2) (3,625.4) (3,844.2)
Research and development (51.5) (60.7) (80.1) (101.8) (123.2) (149.2) (173.2) (201.1) (213.3) (226.1)
Sales and marketing (217.4) (303.7) (400.4) (508.9) (616.1) (746.2) (866.2) (1,005.6) (1,066.3) (1,130.6)
General and administrative (62.6) (81.0) (106.8) (135.7) (164.3) (199.0) (231.0) (268.2) (284.3) (301.5)
Cost and operating expense (980.8) (1,457.7) (1,922.0) (2,442.6) (2,998.6) (3,631.3) (4,215.5) (4,894.1) (5,189.3) (5,502.5)
Other operating profit/(loss) 23.4 20.2 26.7 33.9 41.1 49.7 57.7 67.0 71.1 75.4
EBIT 360.9 587.1 774.1 983.8 1,150.1 1,392.8 1,616.9 1,877.2 1,990.4 2,110.5
Tax (66.0) (103.4) (135.5) (174.6) (206.9) (252.5) (295.8) (345.7) (371.5) (398.6)
Depreciation & amortisation 12.4 12.5 207.3 152.4 114.7 88.8 71.1 58.9 50.6 44.8
Non-cash charges 49.2 44.1 44.1 44.1 44.1 44.1 44.1 44.1 44.1 44.1
Change in net working capital 57.7 86.3 83.9 89.7 90.7 105.9 82.5 108.4 (0.6) (9.6)
Capex (32.3) (633.2) (32.3) (32.3) (32.3) (32.3) (32.3) (32.3) (32.3) (32.3)
FCFF 381.9 (6.6) 941.6 1,063.1 1,160.4 1,346.9 1,486.6 1,710.6 1,680.6 1,759.0
YoY growth (%) 12.9% 9.2% 16.1% 10.4% 15.1% -1.7% 4.7%
Discounted FCFF (5.9) 761.2 772.7 758.4 791.5 785.4 812.6 717.9 675.5
Terminal value 19,986.4
Implied enterprise value 11,175.3
Add: Cash 1,059.6
Less: Debt -
Less: Preferred stock -
Less: Minority interest 0.0
Implied equity value 12,234.9
Diluted ADR 207.6
Implied target price (US$) 58.93
Upside (%) 18.5%
Implied P/E (x) 24.0 18.3 14.3 12.0 9.9 8.4 7.2 6.7
Implied EV/EBITDA (x) 18.6 11.4 9.8 8.8 7.5 6.6 5.8 5.5
Sensitivity Analysis Assumptions
WACC Risk free rate 3.7%
58.93 8% 9% 10% 11.2% 12% 13% 14% Beta 0.76
1.7% 98.26 81.70 66.93 57.76 50.44 44.49 39.59 Market return 13.6%
LTG 1.8% 99.39 82.48 67.45 58.14 50.73 44.72 39.76 Cost of equity 11.2%
1.9% 100.57 83.28 67.97 58.53 51.02 44.94 39.94 Cost of debt 0.0%
2.0% 101.78 84.10 68.51 58.93 51.32 45.17 40.12 Tax rate 25.0%
2.1% 103.03 84.95 69.07 59.33 51.62 45.40 40.30 D/A 0.0
2.2% 104.33 85.82 69.64 59.75 51.93 45.64 40.48 WACC 11.2%
2.3% 105.67 86.72 70.22 60.17 52.25 45.88 40.67 Terminal growth rate 2.0%

Momo, Inc. United States
June 6, 2018 KGI Securities (Singapore) Pte. Ltd. 8
Operational and financial review
Strong balance sheet with zero debt balance
As of 2017, Momo had US$685.5mn of cash and cash equivalents on its balance sheet and no debt. We expect its cash balance to increase marginally in 2018F (as a result of Tantan’s acquisition) and more than double to about US$1,696mn, given its cash generative Live Video Service segment. Adjusting cash balances for expansionary activities, we are expecting free cash flow to be negative in 2018F and positive from 2019F going forward. We believe Momo will continue to invest to accommodate a growing user base and as part of its monetisation strategy, with internally generated cash.
Figure 9: Cash and cash equivalents trend
Figure 10: Free cash flow trend
Source: Company Data, KGI Research Source: Company Data, KGI Research
Higher MAU to should bode well for longer term user monetisation strategy
We expect marketing efforts and brand initiatives to continue to lend support to Momo’s MAU growth in the next three years. MAU should grow at 30% in 2018F (higher than 22% in 2017). We believe its growing user base and MAU would serve as a solid foundation for the growth in Momo’s mobile marketing segment, which generates revenues primarily from advertisements posted on its platform. A higher MAU should translate to higher revenues with the improvement of the following metrics: number of advertisement views, sell-through rate, pricing (based on CPM), click-through rate, and cost per click.
Figure 11: MAU
Figure 12: Revenue/MAU
Source: Company Data, KGI Research Source: Company Data, KGI Research
Figure 13: ARPU trends
Figure 14: Paying users
Source: Company Data, KGI Research Source: Company Data, KGI Research
169 258
686 715
1,696
2,819
-
500
1,000
1,500
2,000
2,500
3,000
3,500
FY15 FY16 FY17 FY18 FY19 FY20
Cas
h (
US$
mn
)
34 206
381
(7)
942 1,063
(200)
-
200
400
600
800
1,000
1,200
1,400
FY15 FY16 FY17 FY18 FY19 FY20
FCF
(US$
mn
)
33.7
69.3 69.8 81.1
99.1
128.8
167.5
209.3
1%
16%
22%
30% 30%
25%
0%
5%
10%
15%
20%
25%
30%
35%
-
50.0
100.0
150.0
200.0
250.0
FY13 FY14 FY15 FY16 FY17 FY18 FY19 FY20
Gro
wth
Yo
Y (
%)
Mo
nth
ly a
vera
ge u
sers
(m
n)
0.6 1.9
6.8
13.3
15.7 15.9 16.2
-
2.0
4.0
6.0
8.0
10.0
12.0
14.0
16.0
18.0
FY14 FY15 FY16 FY17 FY18 FY19 FY20
Re
ven
ue
/MA
U (U
S$)
147.9
58.3
201.6
393.3
302.0 306.3 311.4
-
50.0
100.0
150.0
200.0
250.0
300.0
350.0
400.0
450.0
FY14 FY15 FY16 FY17 FY18 FY19 FY20
AR
PP
U (
US$
)
0.3
2.3 2.7
3.4
6.7
8.7
10.9
-
2.0
4.0
6.0
8.0
10.0
12.0
FY14 FY15 FY16 FY17 FY18 FY19 FY20
Nu
mb
er
of
pay
ing
use
rs (
mn
)

Momo, Inc. United States
June 6, 2018 KGI Securities (Singapore) Pte. Ltd. 9
Revenue to be driven by Live Video Service paying users and higher ARPU
We expect Momo to generate US$2,024.6mn in revenue in 2018F, with the Live video service segment contributing about 87%. Revenues are forecasted to grow at a CAGR (2017 – 2020F) of 37.0%. Live Video Service is expected to grow 59.0% YoY, driven by organic and inorganic growth in paying user base (acquisition of Tantan). Value-added service is expected to grow 36.8% YoY, also led by an enlarged paying user base and higher contribution per paying user. Mobile marketing is expected to grow 32.6% YoY on the back of a rise in total registered users and positive momentum in MAU. Mobile games segment will still remain weak with a 20% YoY decline. We expect paying users in this segment to fall and believe this segment will account for less than 1% of total revenues in the next three years.
Figure 15: Live Video Service revenue growth
Figure 16: Value-added Service revenue growth
Source: Company Data, KGI Research Source: Company Data, KGI Research
Figure 17: Mobile Marketing revenue growth
Figure 18: Mobile Games revenue growth
Source: Company Data, KGI Research Source: Company Data, KGI Research
Operating leverage
Momo’s revenue has grown exponentially since its IPO listing in 2014 and was further boosted by the introduction of its Live Video Services in 2016. While we expect revenue growth to moderate from 138% in 2017 to 54/32/27% in 2018/19/20F, we expect a continued decline in operating leverage, which would represent 22% of revenue in 2018F, compared to an average of 43% (2015 – 2017). This would be driven by an increase in revenue sharing costs (in line with revenue growth) and a marginal decline in fixed costs (R&D and SG&A).
Figure 19: Quarterly cost breakdown
Figure 20: Annual cost breakdown
Source: Company Data, KGI Research Source: Company Data, KGI Research
- 1.2
376.9
1,102.6
1,753.3
2,324.9
2,964.2
-
500.0
1,000.0
1,500.0
2,000.0
2,500.0
3,000.0
3,500.0
FY14 FY15 FY16 FY17 FY18 FY19 FY20
Live
Vid
eo
Se
rvic
e r
eve
nu
e
(US$
mn
)
29.8
58.5 67.6
103.1
141.0
187.0
238.5
-
50.0
100.0
150.0
200.0
250.0
300.0
FY14 FY15 FY16 FY17 FY18 FY19 FY20
Val
ue
-ad
de
d S
erv
ice
re
ven
ue
(U
S$m
n)
2.0
38.9
66.3 76.2
101.0
133.9
170.8
-
20.0
40.0
60.0
80.0
100.0
120.0
140.0
160.0
180.0
200.0
FY14 FY15 FY16 FY17 FY18 FY19 FY20
Mo
bile
Mar
keti
ng
reve
nu
e
(US$
mn
)
11.2
31.1
35.5 35.6
28.5
22.8
18.2
-
5.0
10.0
15.0
20.0
25.0
30.0
35.0
40.0
FY14 FY15 FY16 FY17 FY18 FY19 FY20
Mo
bile
Gam
es
reve
nu
e (
US$
mn
)
0%
20%
40%
60%
80%
100%
4Q141Q152Q153Q154Q151Q162Q163Q164Q161Q172Q173Q174Q171Q18
Co
st a
s a
% o
f re
ven
ue
Cost of revenues Sales and marketing
General and administrative Research and development
0%
20%
40%
60%
80%
100%
FY14 FY15 FY16 FY17 FY18 FY19 FY20
Co
st a
s a
% o
f re
ven
ue
Cost of revenues Sales and marketing
General and administrative Research and development

Momo, Inc. United States
June 6, 2018 KGI Securities (Singapore) Pte. Ltd. 10
Slight margin expansion expected
We expect gross margins to continue to narrow marginally, from 51% in 2017 to 50% in the next three years, on the back of higher cost of revenues as Momo continues to expand its services, as well as enhance the capability and reliability of its infrastructure to support user growth and increased activity on its platform. Revenue sharing accounts for the largest portion of its cost of revenues (81% of total 2017 cost of revenues) and could possibly enlarge further as a result of a larger user base. On a positive note, we expect operating and net margins to improve slightly by 2 ppts and 1 ppt to 29% and 25% respectively, in view of improving operating leverage.
Figure 21: 2017 cost of revenue breakdown
Figure 22: Margins
Source: Company Data, KGI Research Source: Company Data, KGI Research
81%
7%
5%
3%1% 3%
Revenue sharing
Commision fees
Bandwidth costs
Labour costs
Depreciation
Other costs 0%
20%
40%
60%
80%
100%
FY15 FY16 FY17 FY18 FY19 FY20
Mar
gin
s (%
)Gross margin Operating margin Net margin

Momo, Inc. United States
June 6, 2018 KGI Securities (Singapore) Pte. Ltd. 11
Comparables
Figure 23: Peer comparison
Source: Bloomberg, KGI Research
Company Name Currency Last Price
FY17 FY18F FY17 FY18F FY17 FY18F
Momo USD 45.92 9,355 24.3x 20.4x 5.8x 5.2x 0.6x 0.4x 31.2% 88%
Facebook USD 191.78 555,340 28.2x 22.5x 12.5x 9.8x 1.0x 0.9x 21.5% 9%
Alibaba USD 198.01 507,134 49.2x 30.4x 13.0x 8.2x 1.1x 0.9x 26.6% 15%
Tencent HKD 399.40 483,809 38.3x 36.9x 11.7x 9.1x 1.5x 1.1x 24.9% -2%
Baidu USD 242.56 84,588 31.3x 23.6x 6.1x 5.3x 1.2x 1.1x 19.1% 4%
Twitter USD 34.70 26,118 63.2x 49.2x 10.0x 9.0x 1.6x 1.3x 30.7% 45%
Weibo USD 101.91 22,742 55.9x 36.6x 17.4x 12.6x 1.0x 0.7x 35.8% -1%
Match USD 41.15 11,395 23.6x 30.8x 7.7x 6.8x 1.5x 1.3x 20.2% 31%
YY USD 116.53 7,364 18.6x 14.6x 3.8x 3.1x 0.7x 0.6x 19.9% 3%
Sina USD 90.82 6,491 46.7x 28.3x 3.7x 2.9x 3.7x 2.4x 7.6% -9%
Tian Ge HKD 6.98 1,147 23.3x – 8.0x – – – – 13%
Average 37.8x 27.3x 9.4x 6.7x 1.4x 1.0x 20.6%
P/S (x) PEG (x) EPS CAGR
(%)
Currency Adj.
Market Cap
(US$ mn)
P/E (x) (YTD) Price
Performance
(%)
Momo, Inc. United States
June 6, 2018 KGI Securities (Singapore) Pte. Ltd. 12
Key risks
Decline in popularity of Momo may affect long term sustainability
Momo’s user base and the level of user engagements are critical to its success. While its MAUs have grown over time since inception, the growth rate of MAUs stalled in 2015 due to the reduced growth in the number of smartphone users in China. Without a strong user base and vibrant user engagement, Momo’s business model could come under threat, especially since its live video services account for a largest portion of revenues. Additionally, if Momo’s user base or user engagement declines, marketing and advertising may cease to list their advertisements, especially since they do not have long-term advertising commitments.
Overly aggressive monetisation strategies may not be well received by users
Momo’s revenues in 2013 were mainly generated through membership subscriptions, game publishing and other services. However, since the introduction of live video services in 2015, its sales mix has been skewed heavily towards live video services. To attract and retain users, Momo has to increase spending to create new functions, as well as on new monetisation strategies. Monetisation strategies may not take-off, and would be a dampener on margins. Additionally, if popular broadcasters cease to use Momo’s live video services, Momo may see decline in active ratio and time spent on its platform, which would affect its profitability.
Legal/Regulatory risk arising from improper use of data or platform
Negative publicity surrounding Momo’s users or management might adversely harm its businesses, especially if the incidents lead to regulatory intervention. Such scenarios may lead to an increase in legal or compliance costs. Software companies are vulnerable to such incidents, such as the Cambridge Analytica leak of private information on Facebook’s platform in 2018. To date, Momo has terminated tens of millions of user accounts associated with indecent content, spam, and fictitious accounts, and has averted any major regulatory escalations. There is, however, no way of ensuring any such activity does not become an issue in future. In 2014, a small number of sex worker gangs used Momo’s platform to solicit workers and while this did not lead to major consequences, future incidents like this could lead to a regulatory crackdown.
Increase in attrition rates after relationships are formed
Momo’s main goal is to facilitate communication and social networking activities via its location-based services among smartphone users who typically do not have existing relationships. Users may eventually move to other more dedicated and versatile instant communication applications such as WeChat and QQ, after establishing a relationship with other Momo users. This is an inherent risk to Momo’s platform, which seeks to foster new relationships among users.

Momo, Inc. United States
June 6, 2018 KGI Securities (Singapore) Pte. Ltd. 13
Company Overview
Leading Mobile Social Networking Platform
Momo is a mobile-based social networking platform which allows users to establish and expand social relationships based on location, interests and a variety of recreational activities including dating, videos, games and other video/audio based interactive experiences. Momo ranks among China’s leading social networking platform with more than 99mn MAU as of December 2017. Compared to its peers who offer similar functionalities with different objectives, Momo is uniquely positioned as an open social platform which allows its users to find new friends and interact together.
Figure 24: Open Social Network versus Peers
Figure 25: Momo’s Competitive Advantage versus its peers
Source: Company Source: Company
Live Video Service: Live streaming on social networks is the latest trend among China’s millennial generation. Users on Momo’s live streaming platform enjoy videos and shower the performers with virtual gifts, like how baby boomers used to buy tickets to watch live concerts or performances. Other than performers, users can also purchase virtual gifts for each other or discuss performances with the community through fan groups and forums. The live broadcasting segment was introduced in 4Q15 and has almost tripled in revenue from US$376.9mn in 2016 to US$1,102.6mn in 2017, accounting for 84% of total revenues in 2017 and becoming the key growth driver for Momo. The live video service function allows users to live stream a variety of content and activities including talent shows such as singing, dancing and talk shows, as well as casual chatting between broadcasters and viewers. When broadcasters receive virtual gifts purchased on the platform by users, Momo receives a portion of these revenues as revenue.
Figure 26: Quarterly revenue contribution by segment
Figure 27: Live Video’s introduction drove net profits up substantially
Source: Company Data, KGI Research Source: Company Data, KGI Research
0%
20%
40%
60%
80%
100%
4Q141Q152Q153Q154Q151Q162Q163Q164Q161Q172Q173Q174Q171Q18
% o
f to
tal r
eve
nu
e
Live video service Value-added service
Mobile marketing Mobile games
Other services
(3)
7 2
(1)
6 7 15
39
84 81
61
79
97
129
(20)
-
20
40
60
80
100
120
140
4Q141Q152Q153Q154Q151Q162Q163Q164Q161Q172Q173Q174Q171Q18
Ne
t in
com
e (
US$
mn
)
Net income

Momo, Inc. United States
June 6, 2018 KGI Securities (Singapore) Pte. Ltd. 14
Figure 28: Live Video introduced started revenue contribution in 1Q16
Figure 29: Revenue breakdown (ex. Live Video Service)
Source: Company Data, KGI Research Source: Company Data, KGI Research
Value-Added Service: Accounting for 8% of 2017 revenue, this segment derives revenue from membership subscription fees and other miscellaneous service fees. Revenue for the segment rose 53% YoY, from US$67.6mn in 2016 to US$103.1mn in 2017, and was driven by the increase in number of paying users as well as the increase in ARPU per quarter. Users can sign up for memberships, which are divided into two tiers – basic and premium. As a paying member, users enjoy enhanced privileges such as VIP logos, access to special emoticons or to a list of recent visitors to their profile pages. Users who are not members are also able to use the virtual gift service to purchase and send virtual gifts to other users. This segment has seen steady growth since the introduction of the Live Video Service. Mobile Marketing: The segment accounted for 6% of 2017 revenue, and saw revenues rise 15% YoY, from US$67.6mn in 2016 to US$76.2mn in 2017, driven by increased demand from brand marketers, but was partially offset by the decrease in Momo’s advertisement inventories in the upgraded version of the platform – Momo 8.0. Advertisers and marketers are provided with analytical tools to measure the effectiveness of their marketing campaigns on Momo’s platform. Advertising units come in various formats, including text-based content, pictures, video clips, full screen banner ads, and functions that enable direct application downloads. Advertisers can chose to target certain cohorts of users based on geographical locations, gender, age or other parameters.
Figure 30: VAS Monetisation Model
Figure 31: Mobile Marketing Solutions
Source: Company Source: Company
-
100
200
300
400
500
4Q14 1Q15 2Q15 3Q15 4Q15 1Q16 2Q16 3Q16 4Q16 1Q17 2Q17 3Q17 4Q17
Re
ven
ue
(US$
mn
)
Live video service Value-added service Mobile marketing Mobile games Other services
-
10
20
30
40
50
60
70
4Q14 1Q15 2Q15 3Q15 4Q15 1Q16 2Q16 3Q16 4Q16 1Q17 2Q17 3Q17 4Q17
Re
ven
ue
(US$
mn
)
Value-added service Mobile marketing
Mobile games Other services
Momo, Inc. United States
June 6, 2018 KGI Securities (Singapore) Pte. Ltd. 15
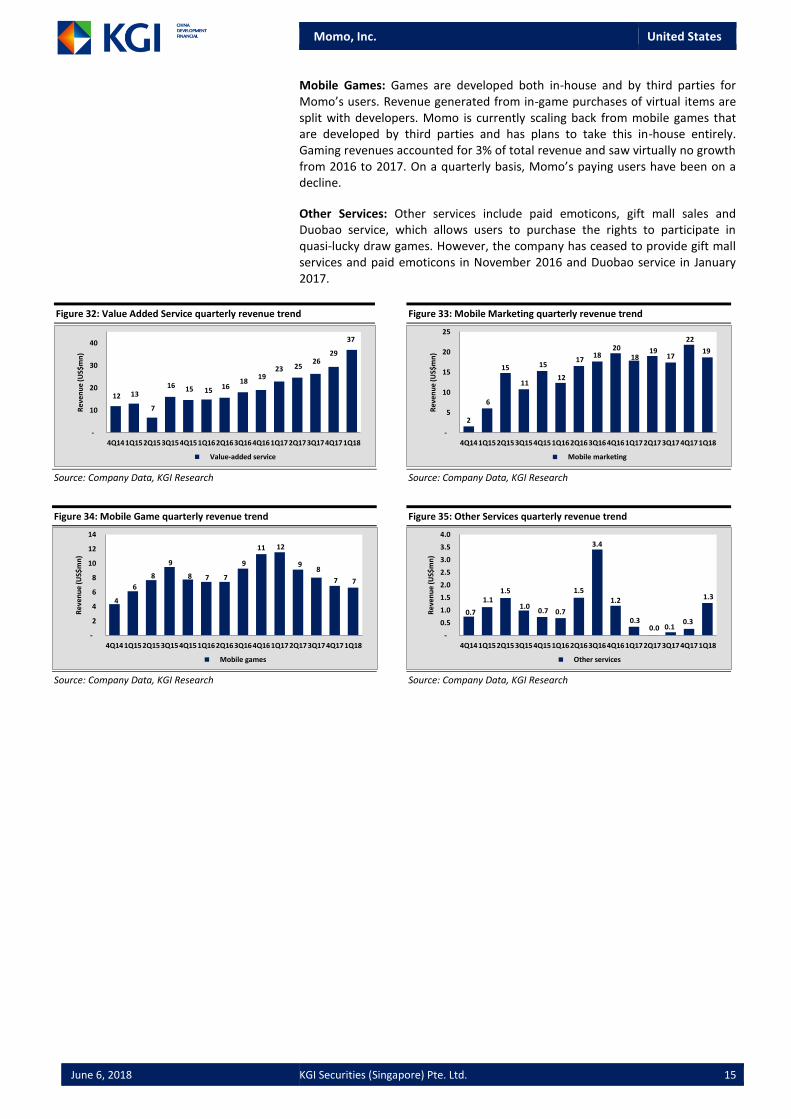
Mobile Games: Games are developed both in-house and by third parties for Momo’s users. Revenue generated from in-game purchases of virtual items are split with developers. Momo is currently scaling back from mobile games that are developed by third parties and has plans to take this in-house entirely. Gaming revenues accounted for 3% of total revenue and saw virtually no growth from 2016 to 2017. On a quarterly basis, Momo’s paying users have been on a decline.
Other Services: Other services include paid emoticons, gift mall sales and Duobao service, which allows users to purchase the rights to participate in quasi-lucky draw games. However, the company has ceased to provide gift mall services and paid emoticons in November 2016 and Duobao service in January 2017.
Figure 32: Value Added Service quarterly revenue trend
Figure 33: Mobile Marketing quarterly revenue trend
Source: Company Data, KGI Research Source: Company Data, KGI Research
Figure 34: Mobile Game quarterly revenue trend
Figure 35: Other Services quarterly revenue trend
Source: Company Data, KGI Research Source: Company Data, KGI Research
12 13
7
16 15 15 16 18
19 23 25
26 29
37
-
10
20
30
40
4Q14 1Q152Q15 3Q154Q15 1Q16 2Q163Q16 4Q161Q17 2Q17 3Q174Q17 1Q18
Re
ven
ue
(US$
mn
)
Value-added service
2
6
15
11
15
12
17 18
20 18
19 17
22
19
-
5
10
15
20
25
4Q14 1Q15 2Q153Q15 4Q151Q162Q16 3Q164Q16 1Q172Q173Q17 4Q171Q18
Re
ven
ue
(US$
mn
)
Mobile marketing
4
6
8
9
8 7 7
9
11 12
9 8
7 7
-
2
4
6
8
10
12
14
4Q141Q15 2Q153Q154Q15 1Q162Q16 3Q16 4Q161Q17 2Q173Q17 4Q17 1Q18
Re
ven
ue
(US$
mn
)
Mobile games
0.7
1.1 1.5
1.0 0.7 0.7
1.5
3.4
1.2
0.3 0.0 0.1
0.3
1.3
-
0.5
1.0
1.5
2.0
2.5
3.0
3.5
4.0
4Q14 1Q152Q153Q15 4Q151Q16 2Q163Q16 4Q16 1Q172Q17 3Q174Q171Q18
Re
ven
ue
(US$
mn
)
Other services

Momo, Inc. United States
June 6, 2018 KGI Securities (Singapore) Pte. Ltd. 16
Enlarged user base with the acquisition of Tantan
Momo bought Tantan for approximately 5.3mn newly issued Class A ordinary shares of the company and US$600.9mn in cash. Tantan is a date matching application which has often been referred to as China’s Tinder. It has matched more than 8.0bn couples in China since its launch in 2012 and has 60mn registered users with 6mn active users. Tantan introduced monetised its users for the first time in January 2018 with membership subscription services. We are expecting the merger to lead Tantan towards more monetisation services in the near future.
Figure 36: Screenshots of Tantan’s app
Source: Google Play Store, Tantan

Momo, Inc. United States
June 6, 2018 KGI Securities (Singapore) Pte. Ltd. 17
China Mobile Marketing Sector
China Mobile Internet Market
Momo’s main platforms, Momo & Tantan are social networking applications that can be downloaded and installed on mobile devices. The firm’s revenues are dependent on the growth of China’s mobile internet market and its users come from a variety of mobile operating system and devices. According to Statista, the mobile internet population in China has continued to grow substantially and is expected to reach 772.9mn mobile phone internet users by 2020F. Momo’s services complement this trend well, as seen in its MAU growth.
Figure 37: Projected number of mobile phone internet users from 2015 to 2020F
Source: Statista, KGI Research
Figure 38: Quarterly MAU still trending upwards
Source: Company Data, KGI Research
588.5 619.2 653.2 690.6
730.9 773.0
5.2%5.5%
5.7%5.8% 5.8%
4.0%
4.5%
5.0%
5.5%
6.0%
6.5%
7.0%
-
100.0
200.0
300.0
400.0
500.0
600.0
700.0
800.0
900.0
FY15 FY16 FY17 FY18 FY19 FY20
Gro
wth
Yo
Y (
%)
Mo
bile
inte
rne
t u
sers
(m
n)
69 78 78 73 70 72 75 77 81 85
91 94 99 103
0%
13%
0%
-7%-4%
4% 3% 3% 5% 5%7%
3% 5% 4%
-10%
-5%
0%
5%
10%
15%
20%
25%
30%
-
20
40
60
80
100
120
Qo
Q C
han
ge (
%)
Nu
mb
er
of
use
rs (
mn
)
Monthly Active Users (MAU) Growth

Momo, Inc. United States
June 6, 2018 KGI Securities (Singapore) Pte. Ltd. 18
Evolution of mobile social networking in China
Mobile social networking platforms have gone through 3 stages of evolution since the launch of Mobile QQ in 2003. Initially, the mobile applications were simple extensions of PC-based social networks and services onto mobile devices as users kept to simple text messages and pictures exchange. Since 2011, the emergence of WeChat introduced new functionalities into mobile platforms with the help of cameras and speakers. Exchanged content became more diverse in terms of formats, including sounds and photos. Today, mobile applications come with location-based services that connect users with each other such as Momo.
Figure 39: Screenshot of Momo’s mobile app, which includes location-based services
Source: Company

Momo, Inc. United States
June 6, 2018 KGI Securities (Singapore) Pte. Ltd. 19
Financials
Source: Bloomberg, KGI Research
FYE 31 December A
INCOME STATEMENT (USD mn) 2016A 2017A 2018F 2019F 2020F
Net revenue 553.1 1,318.3 2,024.6 2,669.4 3,392.4
Cost of revenue (241.5) (649.3) (1,012.3) (1,334.7) (1,696.2)
Gross profit 311.6 669.0 1,012.3 1,334.7 1,696.2
Operating expenses
Research and development (31.4) (51.5) (60.7) (80.1) (101.8)
Sales and marketing (97.2) (217.4) (303.7) (400.4) (508.9)
General and administrative (39.0) (62.6) (81.0) (106.8) (135.7)
Operating profit/(loss) (GAAP) 144.5 360.9 587.1 774.1 983.8
Operating profit/(loss) (Non-GAAP) 176.2 410.5 637.1 824.1 1,033.8
Pre-tax profit (PBT) (GAAP) 146.9 378.1 608.3 796.9 1,027.2
Income tax benefit/(expenses) (5.1) (66.0) (103.4) (135.5) (174.6)
Net income (GAAP) 145.3 318.0 510.8 667.3 858.5
Net income (Non-GAAP) 177.0 367.1 560.3 716.8 908.0
Minority interest 0.0 0.5 0.5 0.5 0.5
Net income (excl. NCI) (GAAP) 145.3 317.5 510.3 666.8 858.0
Net income (excl. NCI) (Non-GAAP) 177.0 366.6 559.8 716.3 907.5
BALANCE SHEET (USD mn) 2016A 2017A 2018F 2019F 2020F
Cash and cash equivalents 257.6 685.8 715.1 1,696.0 2,819.0
Term deposits 393.8 373.8 423.8 473.8 523.8
Trade and other receivables 36.1 39.6 51.5 66.9 87.0
Prepaid expenses and other current assets 32.8 89.5 100.9 120.7 144.5
Total current assets 720.2 1,188.7 1,291.3 2,357.4 3,574.3
Net Property, Plant & Equipment 13.9 39.8 660.5 485.5 365.4
Long term investments 31.9 44.3 44.3 44.3 44.3
Other non-current assets 3.7 29.2 29.3 29.3 29.3
Total assets 769.7 1,302.0 2,025.3 2,916.5 4,013.3
Trade and other payables (current) 40.5 74.5 110.9 146.3 185.9
Deferred revenue 41.3 64.9 81.0 106.8 135.7
Accrued expenses and other current liabilities 52.0 120.6 188.0 246.0 311.1
Total current liabilities 133.7 260.0 379.9 499.1 632.7
Deferred tax liabilities, non-current 0.0 1.9 0.0 0.0 0.0
Other non-current liabilities 2.0 2.3 2.3 2.3 2.3
Total liabilities 135.7 264.2 382.2 501.4 635.0
Shareholder's Equity 634.0 1,037.8 1,643.1 2,415.1 3,378.3
Total liabilities and equity 769.7 1,302.0 2,025.3 2,916.5 4,013.3
CASH FLOW STATEMENT (USD mn) 2016A 2017A 2018F 2019F 2020F
Net income 145.3 318.0 510.8 667.3 858.5
Depreciation & amortisation 8.4 12.4 12.5 207.3 152.4
Other non-cash adjustments 34.0 48.4 44.1 44.1 44.1
Changes in working capital 30.6 48.7 53.1 52.5 58.3
Cash flows from operating activities 218.3 427.6 620.5 971.2 1,113.3
Capital expenditure (7.0) (32.3) (633.2) (32.3) (32.3)
Other investing cashflow (111.3) 5.0 42.0 42.0 42.0
Cash flows from investing activities (118.3) (27.3) (591.2) 9.7 9.7
Borrowings raised / (repaid) 0.0 0.0 0.0 0.0 0.0
Equity raised / (bought back) 0.0 0.0 0.0 0.0 0.0
Dividends paid 0.0 0.0 0.0 0.0 0.0
Other financing cash flow 0.0 0.4 0.0 0.0 0.0
Cash flows from financing activities 0.0 0.4 0.0 0.0 0.0
Net increase/(decrease) in cash and cash equivalents 245.2 718.7 540.1 1,648.2 1,981.5
FX Effects, Others (11.9) 27.5 0.0 0.0 0.0
Beginning Cash 169.5 257.6 685.8 715.1 1,696.0
Ending Cash 257.6 685.8 715.1 1,696.0 2,819.0
KEY RATIOS 2016A 2017A 2018F 2019F 2020F
Core EPS (USD cents) 38.5 80.5 127.6 166.8 214.6
P/E (x) 47.7 30.4 19.2 14.7 11.4
P/B (x) 10.9 9.3 6.0 4.1 2.9
P/S (x) 12.5 7.3 4.8 3.7 2.9
Growth (%)
Revenue growth 312.8 138.3 53.6 31.8 27.1PATMI growth 960.5 118.6 60.7 30.7 28.7EPS growth 945.7 114.2 58.7 30.7 28.7
Profitability (%)
Gross margin 56.3 50.7 50.0 50.0 50.0
Operating margin 26.1 27.4 29.0 29.0 29.0
PATMI margin 26.3 24.1 25.2 25.0 25.3
ROE 26.4 38.0 38.1 32.9 29.6

Momo, Inc. United States
June 6, 2018 KGI Securities (Singapore) Pte. Ltd. 20
Appendix
Key Management
Yan Tang Co-Founder, Chairman and Chief Executive Officer
Mr. Yan Tang is Momo’s co-founder and has served as director and chief executive officer since the Company’s inception in July 2011. Mr. Tang was appointed to be the chairman of the board of directors in November 2014. Prior to founding the company, from 2003 to 2011, Mr. Tang worked at NetEase, Inc. (NASDAQ: NTES), or NetEase, initially as editor and later editor-in-chief. Mr. Tang was named by Fortune Magazine as one of its “40 Under 40,” a list of the most powerful, influential and important business elites under the age of 40, in October 2014. Mr. Tang received his Bachelor of Science degree from Chengdu University of Technology in China in 2000.
Li Wang Chief Director, President and Chief Operating Officer
Mr. Li Wang has been the chief operating officer since June 2014 and president since April 2018. Mr. Wang joined the company as the operation director in July 2011. Prior to joining, Mr. Wang was the managing director of Laoluo English Training School, a start-up education service business from November 2008 to May 2011. He was the general administration staff at NEC China Co., Ltd. from April 2005 to April 2007. Mr. Wang received his Bachelor’s degree in management from Beijing University of Aeronautics and Astronautics in China in 2004.
Xiaoliang Lei Co-Founder and President of Game Operations
Mr. Xiaoliang Lei is Momo’s co-founder and has been the president of game operations since April 2018. Mr. Lei is responsible for game operations. Prior to co-founding the company, Mr. Lei was the product management staff then manager at NetEase, from 2008 to 2011. Mr. Lei was an editor in charge of content development and team management at 21CN Game Channel, a game information exchange platform in China from 2004 to 2008. Mr. Lei received his Bachelor of Science degree in software engineering from South China University of Technology in 2004.
Jonathan Xiaosong Zhang Chief Financial Officer
Mr. Jonathan Xiaosong Zhang has served as chief financial officer since May 2014. From July 2010 to April 2014, Mr. Zhang served as the chief financial officer of iSoftStone Holdings Limited, and was the company’s independent director between February 2010 and July 2010. Prior to joining iSoftStone Holdings Limited, Mr. Zhang served as the chief financial officer of several companies, including BJB Career Education Company Limited from June 2009 to June 2010, and Vimicro International Corporation (NASDAQ: VIMC) from September 2004 to January 2007. From 2000 to 2004, Mr. Zhang worked as a manager and then a senior manager at the Beijing office of PricewaterhouseCoopers. From 1995 to 1999, Mr. Zhang was an auditor and then a senior auditor at the Los Angeles office of KPMG LLP. Mr. Zhang is also an independent director, the chairman of audit committee, and a member of the compensation committee and the nominating and corporate governance committee of Tarena International Inc. (NASDAQ: TEDU). Mr. Zhang received his Master’s degree in accountancy from the University of Illinois in 1994. Mr. Zhang is a Certified Public Accountant in the State of California.
Chunlai Wang Chief Technology Officer
Mr. Chunlai Wang has been othe chief technology officer since August 2017. Mr. Wang served as our vice president of technology since April 2015. From June 2014 to April 2015, Mr. Wang served as the technology director. Before that, he had been in charge of our technology team since June 2013 and had been actively involved in the development of our key technological infrastructures since he joined in February 2012. Prior to joining, Mr. Wang served as an engineer and a senior engineer in NetEase from September 2010 to February 2012. From March 2009 to September 2010, he co-founded a business dedicated to semantic search services. Mr. Wang received his Master’s degree in engineering from Peking University in July 2013 and his Bachelor’s degree from Beijing Jiaotong University in June 2009.

Momo, Inc. United States
June 6, 2018 KGI Securities (Singapore) Pte. Ltd. 21
Figure 40: Company profile
Momo is a leading mobile social networking platform in China. Momo
connects people in a personal and lively way through a revolutionary
mobile-based social networking platform. With powerful and precise
location-based features, Momo enables users to connect with each other
and expand relationships from online to offline. Its platform includes the
Momo mobile application and a variety of related features,
functionalities, tools and services that it provides to users, customers and
platform partners. Leveraging its social interest graph engine and analysis
of user behaviour data, Momo provides users a customized experience.
Figure 41: 2017 Sales mix
Source: Company Source: Company Data, KGI Research
Figure 42: Revenue
Figure 43: Net income and margins
Source: Company Data, KGI Research Source: Company Data, KGI Research
Figure 44: MAU
Figure 45: P/E Band (1 year)
Source: Company Data, KGI Research Source: Company Data, KGI Research
Figure 46: Price/Earnings
Figure 47: Price/Sales
Source: Bloomberg, KGI Research Source: Bloomberg, KGI Research
83.6%
7.8%
5.8%
2.7% Other services, 0.1%
Live video service
Value-added service
Mobile marketing
Mobile games
Other services
44.8 134.0
553.1
1,318.3
2,024.6
2,669.4
3,392.4
199%
313%
138%54%
32% 27%
0%
50%
100%
150%
200%
250%
300%
350%
-
500.0
1,000.0
1,500.0
2,000.0
2,500.0
3,000.0
3,500.0
4,000.0
FY14 FY15 FY16 FY17 FY18 FY19 FY20
Tota
l re
ven
ue
(U
S$m
n)
(25.4)
13.7
145.3
318.0
510.8
667.3
858.5
-80%
-60%
-40%
-20%
0%
20%
40%
60%
80%
100%
(200.0)
-
200.0
400.0
600.0
800.0
1,000.0
FY14 FY15 FY16 FY17 FY18 FY19 FY20
Mar
gin
s (%
)
Ne
t in
com
e (
US$
mn
)
Net income Gross margin Operating margin Net margin
33.7
69.3 69.8 81.1
99.1
128.8
167.5
209.3
1%
16%
22%
30% 30%
25%
0%
5%
10%
15%
20%
25%
30%
35%
-
50.0
100.0
150.0
200.0
250.0
FY13 FY14 FY15 FY16 FY17 FY18 FY19 FY20
Gro
wth
Yo
Y (
%)
Mo
nth
ly a
vera
ge u
sers
(m
n)
13.00
18.00
23.00
28.00
33.00
38.00
P/E
(x)
(29.6x) +1s.d.
(23.7x) Average
(17.9x) -1s.d.
20.4x
22.0x
30.7x
36.8x
23.5x
48.7x
36.7x
31.3x
14.5x
28.0x
10.0x 15.0x 20.0x 25.0x 30.0x 35.0x 40.0x 45.0x 50.0x 55.0x
Momo
Alibaba
Tencent
Baidu
Match
YY
Sina
P/E (x)
Average: 30.0x5.2x
9.6x
8.2x
9.1x
5.3x
8.9x
12.6x
6.9x
3.1x
2.8x
– 2.0x 4.0x 6.0x 8.0x 10.0x 12.0x 14.0x
Momo
Alibaba
Tencent
Baidu
Match
YY
Sina
P/S (x)
Average: 7.2x

Momo, Inc. United States
June 6, 2018 KGI Securities (Singapore) Pte. Ltd. 22
KGI’s Ratings Rating Definition KGI Securities Research’s recommendations are based on an Absolute Return rating system. BUY >10% total return over the next 12 months HOLD -10% to +10% total return over the next 12 months SELL <-10% total return over the next 12 months
Disclaimer This report is provided for information only and is not an offer or a solicitation to deal in securities or to enter into any legal relations, nor an advice or a recommendation with respect to such securities. This report is prepared for general circulation. It does not have regard to the specific investment objectives, financial situation and the particular needs of any recipient hereof. You should independently evaluate particular investments and consult an independent financial adviser before dealing in any securities mentioned in this report. This report is confidential. This report may not be published, circulated, reproduced or distributed and/or redistributed in whole or in part by any recipient of this report to any other person without the prior written consent of KGI Securities. This report is not intended for distribution and/or redistribution, publication to or use by any person in any jurisdiction outside Singapore or any other jurisdiction as KGI Securities may determine in its absolute discretion, where the distribution, publication or use of this report would be contrary to applicable law or would subject KGI Securities and its connected persons (as defined in the Financial Advisers Act, Chapter 110 of Singapore) to any registration, licensing or other requirements within such jurisdiction. The information or views in the report (“Information”) has been obtained or derived from sources believed by KGI Securities to be reliable. However, KGI Securities makes no representation as to the accuracy or completeness of such sources or the Information and KGI Securities accepts no liability whatsoever for any loss or damage arising from the use of or reliance on the Information. KGI Securities and its connected persons may have issued other reports expressing views different from the Information and all views expressed in all reports of KGI Securities and its connected persons are subject to change without notice. KGI Securities reserves the right to act upon or use the Information at any time, including before its publication herein. Except as otherwise indicated below, (1) KGI Securities, its connected persons and its officers, employees and representatives may, to the extent permitted by law, transact with, perform or provide broking, underwriting, corporate finance-related or other services for or solicit business from, the subject corporation(s) referred to in this report; (2) KGI Securities, its connected persons and its officers, employees and representatives may also, to the extent permitted by law, transact with, perform or provide broking or other services for or solicit business from, other persons in respect of dealings in the securities referred to in this report or other investments related thereto; and (3) the officers, employees and representatives of KGI Securities may also serve on the board of directors or in trustee positions with the subject corporation(s) referred to in this report. (All of the foregoing is hereafter referred to as the “Subject Business”.) However, as of the date of this report, neither KGI Securities nor its representative(s) who produced this report (each a “research analyst”), has any proprietary position or material interest in, and KGI Securities does not make any market in, the securities which are recommended in this report. Each research analyst of KGI Securities who produced this report hereby certifies that (1) the views expressed in this report accurately reflect his/her personal views about all of the subject corporation(s) and securities in this report; (2) the report was produced independently by him/her; (3) he/she does not carry out, whether for himself/herself or on behalf of KGI Securities or any other person, any of the Subject Business involving any of the subject corporation(s) or securities referred to in this report; and (4) he/she has not received and will not receive any compensation that is directly or indirectly related or linked to the recommendations or views expressed in this report or to any sales, trading, dealing or corporate finance advisory services or transaction in respect of the securities in this report. However, the compensation received by each such research analyst is based upon various factors, including KGI Securities’ total revenues, a portion of which are generated from KGI Securities’ business of dealing in securities. Copyright 2018. KGI Securities (Singapore) Pte. Ltd. All rights reserved.