moment inersia
DESCRIPTION
inersiaTRANSCRIPT
Nerdear Physics Al79 (1972) 753-768; Q ~orth-~oZ~a~ Polishing Co., Amsterdam
Not to be reproduced by photoprint or microfilm without written permission from the publisher
NUCLEAR MOMENT OF INERTIA
AT HIGH ROTATIONAL FREQUENCIES
A. JOHNSON+, H. RYDE+t and S.A.HJORTHtff
Research Institute for Physics, Sto~kha~~ Sweden
Received 17 September 1971
Abstract: Members of the ground state rotational bands in the doubly even well-deformed nucleides “*Dy, r6’Dy, 16’Er and r6’Yb are populated in (a, xn) reactions and the variation of the moments of inertia with the rotational angular velocity is investigated. In three of these mu&ides abrupt changes in the moment of inertia are observed at high rotational frequencies. This may be inter- preted as a phase transition from the superfluid state to a non-supe~~d state with no pairing due to the Mottelson-Valat~ Coriolis antipairing effect.
NUCLEAR REACTIONS 15sGd, ieOGd, r61Dy, ie’Er (a, x n), E, = 3543 MeV; measured E E,, I&E,, O), ay-delay, y y-coincidences. “‘Dy, r6’Dy, 16’Er, 168Yb deduced rotational
angular velocity, moment of inertia. Enriched targets, Ge(Li) detectors.
1. Introduction
Well-deformed nuclei in their ground states have a moment of inertia which is typically only about half of the value expected for rigid rotors. This is interpreted as due to the presence of a strong pairing force between the nucleons in the nucleus. With increasing frequency of rotation the correlations due to the pairing force are reduced as a result of the Coriolis anti-pairing effect (the CAP effect) until these correlations disappear at a critical angular momentum. As a result the moment of inertia increases with the rotational angular velocity and is expected to adopt the rigid rotor value at the critical angular momentum. This situation was first predicted by Mottelson and Valatin I), who estimated that the critical angular momentum should be around 12 h for Aw 180. Later, theoretical calculations 2-7) predicted critical angular momenta, which also for some nucleides could be as low as 12 h. Since the pairing force is stronger for protons than for neutrons two such transitions may actually take place before the nuclear rotational motion becomes completely rigid.
A strong experimental indication of this effect has recently been found in the nucleide 16’Dy [ref. 8)], in w hich a sudden change of the moment of inertia towards the rigid body value is observed at a spin value of 16 h. In the present paper the
+ Present address: The Niels Bohr Institute, University of Copenhagen, Denmark. it Institute of Physics, University of Stockholm, Sweden.
Stt Present address: Institut des Sciences Nucleaires, Grenoble, France.
753
754 A. JOHNSON et al.
properties of the moments of inertia will be further discussed. The nucleides “*Dy, 16’Dy 7 “j2Er and 16*Yb have been chosen as an illustration out of an extensive investigation concerning the behaviour of the ground state rotational bands in doubly even nucleides in the rare-earth region 9).
A brief report of the present work has been presented at the international con- ference on heavy-ion physics at Dubna, 1.971 [ref. lo)].
2. ~xpe~i~e~t~ procedure
The moment of inertia for these nuclei may be determ~ed from the energy dif- ferences between the members of the ground state rotational band. In the present work high-spin members of such bands are populated in (a, xn) reactions and the de-exciting y-rays are detected. In this section the experimental procedure and the general arguments for placing the observed y-rays into the ground state bands are presented, leaving the details of the situation which is particular to each nucleide to be discussed in sect. 3.
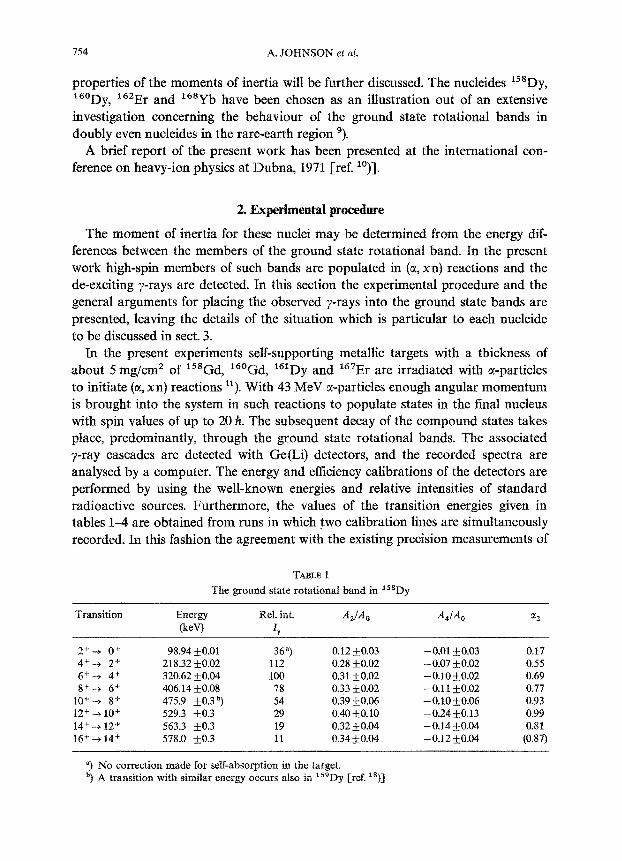
In the present experiments self-supporting metallic targets with a thickness of about 5 mg/cm2 of “*Gd, 16’Gd, 161Dy and 16’Er are irradiated with a-particles to initiate (CX, xn) reactions ll). With 43 MeV a-particles enough angular momentum is brought into the system in such reactions to populate states in the final nucleus with spin values of up to 20 Ft. The subsequent decay of the compound states takes place, predominantly, through the ground state rotational bands. The associated y-ray cascades are detected with Ge(Li) detectors, and the recorded spectra are analysed by a computer. The energy and efficiency calibrations of the detectors are performed by using the well-known energies and relative intensities of standard radioactive sources. Furthermore, the values of the transition energies given in tables 1-4 are obtained from runs in which two calibration lines are simultaneously recorded. In this fashion the agreement with the existing precision measurements of
TABLE I
The ground state rotational band in lssDy
Transition
2++ o+ 4+-P 2+ 4+-+ 4+ 8+-+ 6+
10*--P 8+ 12+ -+ 10+ 14+ -+ 12* 16+ -+ 14’
Energy
fkev
98.94 +0.01 218.32 +0.02 320.62 +0.04 406.14 +0.08 475.9 &0.3b) 529.3 +0.3 563.3 kO.3 578.0 to.3
Rel. int.
‘Y
4/‘%
368) 0.12kO.03 112 0.28 *0.02 100 0.31 kO.02 78 0.33 +0.02 54 0.39 +0.06 29 0.40 to.10 19 0.32 20.04 11 0.34 ~0.04
- 0.01 rt: 0.03 0.17 - 0.07 fr: 0.02 0.55 -0.10~0.02 0.69 -0.11*0.02 0.77 -0.10 f0.06 0.93 -0.24JrO.13 0.99 -0.14 50.04 0.81 -0.121;0.04 (0.87)
3 No correction made for self-absorption in the target. “) A transition with similar energy occurs also in “‘Dy [ref. ‘a)]
NUCLEAR MOMENT OF INERTIA 155
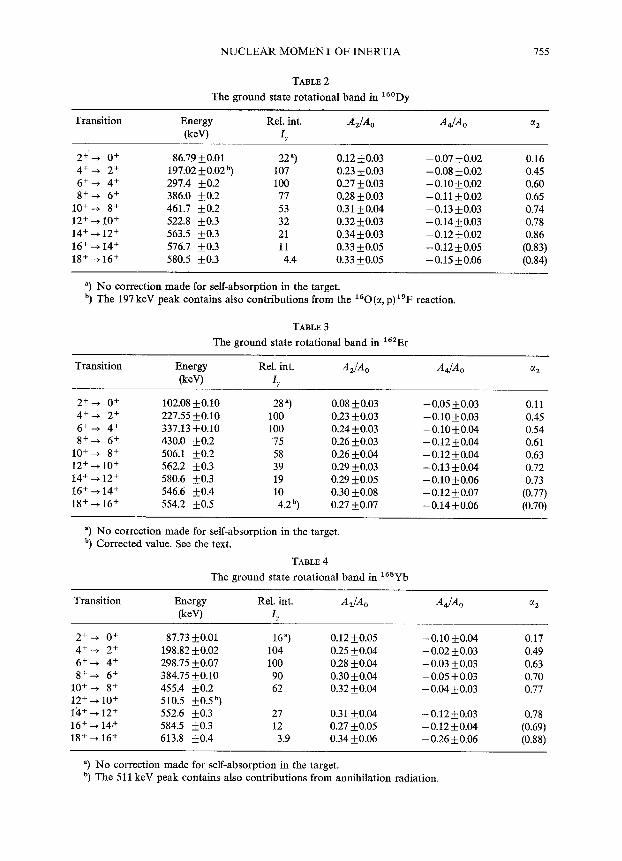
TABLE 2
The ground state rotational band in 16”Dy
Transition Energy Rel. int.
Ocev) I,
A&% A&,
2+-t o+ 4++ 2f 6++ 4+ 8++ 6+
lo+-+ 8+ 12+ + 10’ 14+ -+ 12+ 16+ -+ 14+ 18+ -+ 16+
86.79 ,O.Ol 197.02 kO.02 b, 297.4 +0.2 386.0 +0.2 461.7 +0.2 522.8 +0.3 563.5 +0.3 576.7 +0.3 580.5 iO.3
22”) 0.12 +0.03 107 0.23 +0.03 100 0.27 PO.03 77 0.28 + 0.03 53 0.31 kO.04 32 0.32 +0.03 21 0.34 +0.03 11 0.33 +0.05 4.4 0.33 +0.05
-0.07 *0.02 0.16 -0.08 kO.02 0.45 -0.10 +0.02 0.60 -0.11 kO.02 0.65 -0.13+0.03 0.74 -0.14+0.03 0.78 -0.12 *0.02 0.86 -0.12*0.05 (0.83) -0.15 *0.06 (0.84)
“) No correction made for self-absorption in the target. b, The 197 keV peak contains also contributions from the I60 (a, p) r9F reaction.
TABLE 3
The ground state rotational band in r6’Er
Transition Energy
(keV)
Rel. int.
I?
A,& &IA,
2++ o+ 4++ 2+ 6++ 4+ 8+-t 6+
lo++ s+ 12+ -+ 10+ 14+ --B 12+ 16+ -+ 14+ 18+ -+ 16+
102.08 kO.10 227.55 kO.10 337.13 +0.10 430.0 +0.2 506.1 kO.2 562.2 kO.3 580.6 rfrO.3 546.6 +0.4 554.2 kO.5
28 “) 0.08 +0.03 100 0.23 kO.03 100 0.24 +0.03 ‘75 0.26 kO.03 58 0.26 kO.04 39 0.29 f0.03 19 0.29 IfrO.05 10 0.30 +o.os 4.2 “) 0.27 +0.07
-0.05 +0.03 0.11 -0.10+0.03 0.45 -0.10~004 0.54 -0.12 +0.04 0.61 -0.12 kO.04 0.63 -0.13 +0.04 0.72 -0.10 kO.06 0.73 -0.12 +0.07 (0.77) - 0.14 kO.06 (0.70)
“) No correction made for self-absorption in the target. b, Corrected value. See the text.
TABLE 4
The ground state rotational band in 16’Yb
Transition Energy
(keV)
Rel. int.
I, &IA, A&,
2++ o+ 4++ 2+ 6+-t 4’ 8++ 6’
10+-t s+ 12++ 10+ 14’ -+ 12+ 16+--t 14.+ 18+ + 16+
87.73 +0.01 198.82 kO.02 298.75 +0.07 384.75 *0.10 455.4 kO.2 510.5 f0.5b) 552.6 +0.3 584.5 +0.3 613.8 +0.4
163 0.12 kO.05 104 0.25 +0.04 100 0.28 +0.04 90 0.30 kO.04 62 0.32 f0.04
27 0.31,0.04 12 0.27 +0.05 3.9 0.34 kO.06
-0.10*0.04 0.17 -0.02 +0.03 0.49 - 0.03 *0.03 0.63 - 0.05 kO.03 0.70 - 0.04 *0.03 0.77
-0.12 *0.03 -0.12 +0&I - 0.26 kO.06
0.78 (0.69) (0.88)
“) No correction made for self-absorption in the target. ‘) The 511 keV peak contains also contributions from annihilation radiation.
1.56 A. JOHNSON et al.
the low-energy transitions is in all cases very satisfactory. The values for the low- energy transitions given in the tables are the best found in the literature. The uncer- tainty in the relative intensities for the most intense lines is estimated to be less than 10%.
The information obtained from the variation of the relative y-ray intensities with the energy of the incident beam can be useful in two ways. Firstly, an unambiguous assignment of each y-ray transition to a definite daughter nucleide can be made and secondly, the relative yield of the y-rays at the various a-particle energies can be used to obtain rough spin assignments. A higher bombarding energy is needed-that is, a larger angular momentum has to be brought into the system- in order to increase the population of the high-spin states.
The probability of populating levels with different spin values in the daughter nucleus can be calculated by making statistical assumptions about the neutron evaporation process I’). Since in the (a, xn) processes the angular momentum removed by the primary undetected y-rays is small, the side feeding into the ground state band can be compared with the calculated spin distribution curve. A good agreement between the two curves supports the interpretation.
In the (heavy ion, xn) reactions the spins of the final nuclei are aligned in a plane perpendicular to the incident beam 13). As a result the emitted y-radiation shows an angular anisotropy which depends on the spin values of the initial and the final states as well as on the multipoles which are of importance in the radiation field. In the present experiment the angular distributions of the emitted y-rays are studied in the angular range between 90 and 155”. The normalisation of the spectra is based on the intensity of the K X-rays, the distribution of which is assumed to be isotropic. An independent way of normalisation is obtained from the number of elastically scattered a-particles which are recorded in two monitor detectors positioned at t-25” relative to the axis of the beam. In the present experiments the two means of normalisation are found to agree to within a few percent.
The observed angular distributions are fitted with the expression
W(0) = A, + AT a2 Pz (cos 0) + AT LX, P4 (cos 0)) (1)
where Ay and A:” are the coefficients expected for complete alignment, while CI~ and a4 are attenuation factors expressing the degree of alignment. It is expected that these attenuation factors are positive numbers which are less than unity and that they vary smoothly within the rotational band’14).
It is essential to make sure that the transitions, proposed to belong to the ground state band, do not de-excite an isomeric state e.g. a two-quasiparticle state. In order to investigate this point the decay of the y-ray intensity between the natural pulses of the cyclotron beam is studied 15). For the nuclei discussed here no delayed tran- sitions are observed with half-lives longer than the experimental limit of 20ns. Furthermore, if a low-lying two-quasiparticle state were populated with an ob- servable intensity the decay into the ground state band would in most cases proceed
NUCLEAR MOMENT OF INERTIA 1.51
through more than one branch. No such cross-over transitions are found in our singles spectra.
Finally, further support for the suggested rotational bands is gained from the results of two-dimensional y-y coincidence experiments 16) performed with two 43 cm3 Ge(Li) detectors placed symmetrically at about f 125” relative to the incident beam. The resolving time is about 90ns. The coincidence events are stored in a 4000 x 4000 channel matrix and can be analysed by introducing gates on one of the axes. In the present experiments gates are placed on all the main peaks in the spectrum and for each peak also on a carefully chosen part of the adjacent background. By subtracting the background spectrum a genuine coincidence spectrum is obtained for each peak.
Qualitative conclusions can be drawn from these spectra concerning the coin- cidence relations between the y-ray peaks involved. Indications concerning the position of a y-transition within a cascade can be obtained, as the relative intensities of the transitionsfollowing the gate transition must be equal, while those for the tran- sitions preceeding the gate transition should be the same as in the singles spectrum.
3. The ground state rotational bands
In this section the arguments for assigning the observed y-rays to the ground state rotational bands are discussed separately for the four nucleides 15’Dy, 16’Dy, 16’Er and 16*Yb. As mentioned in sect. 1 these nucleides have been chosen for the present investigation because they show a quite different behaviour of the band structure near the top of the bands and any theoretical description will ultimately have to explain these differences. It should be stressed here that the majority of the nuclei studied until now exhibits a behaviour similar to the one of 16’Yb, i.e. the moment of inertia is a smooth and single-valued function of the rotational frequency.
3.1. THE NUCLEIDE “‘Dy
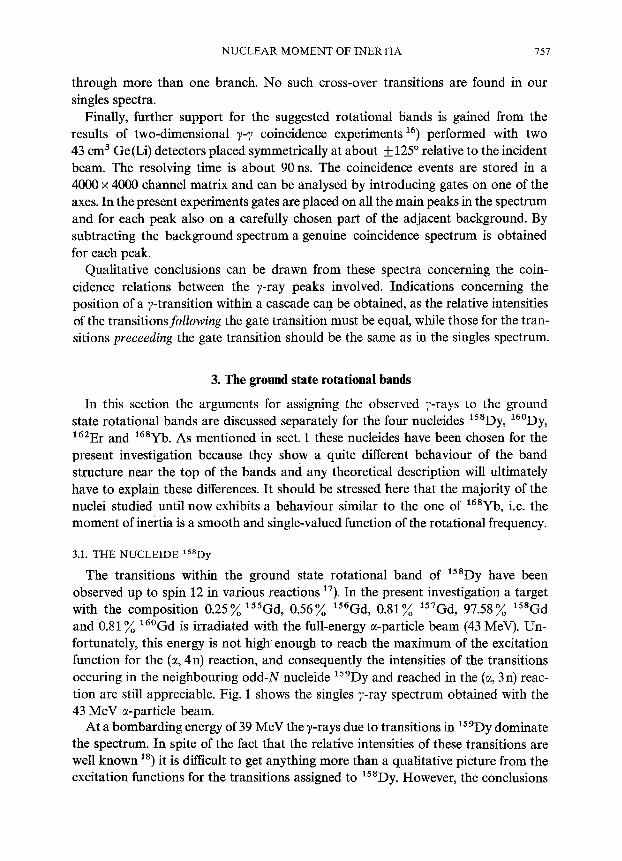
The transitions within the ground state rotational band of ls8Dy have been observed up to spin 12 in various reactions 17). In the present investigation a target with the composition 0.25% 155Gd, 0.56% 15(jGd, 0.81% 157Gd, 97.58% “‘Cd and 0.81% 16’Gd is irradiated with the full-energy or-particle beam (43 MeV). Un- fortunately, this energy is not high,enough to reach the maximum of the excitation function for the (a, 4n) reaction, and consequently the intensities of the transitions occuring in the neighbouring odd-N nucleide 15’Dy and reached in the (a, 3n) reac- tion are still appreciable. Fig. 1 shows the singles y-ray spectrum obtained with the 43 MeV cc-particle beam.
At a bombarding energy of 39 MeV the y-rays due to transitions in 15’Dy dominate the spectrum. In spite of the fact that the relative intensities of these transitions are well known 18) it is difficult to get anything more than a qualitative picture from the excitation functions for the transitions assigned to “‘Dy. However, the conclusions
7.58 A. JOHNSON et al.
104 43 MeV alpha particles on “‘Gd
b & f
l $ ++ m I- ‘O-
T t?f *m
iv b +z p +g
406.l4
ZS 1
7- b '; ',
' 6-
t t & t,
t L
4759 CK
100 200 300 400 500 600 700 SO0 B 900
CHANNEL NUMBER
Fig. 1. Singles y-ray spectrum from the bombardment of lssGd with 43 MeV a-particles. The transitions
assigned to the ground state band in ls8Dy are indicated. The number of counts shown is the content of three original channels.
43 MeV alpha particles on 15*Gd Coincidence measurements
CHANNEL NUMBER
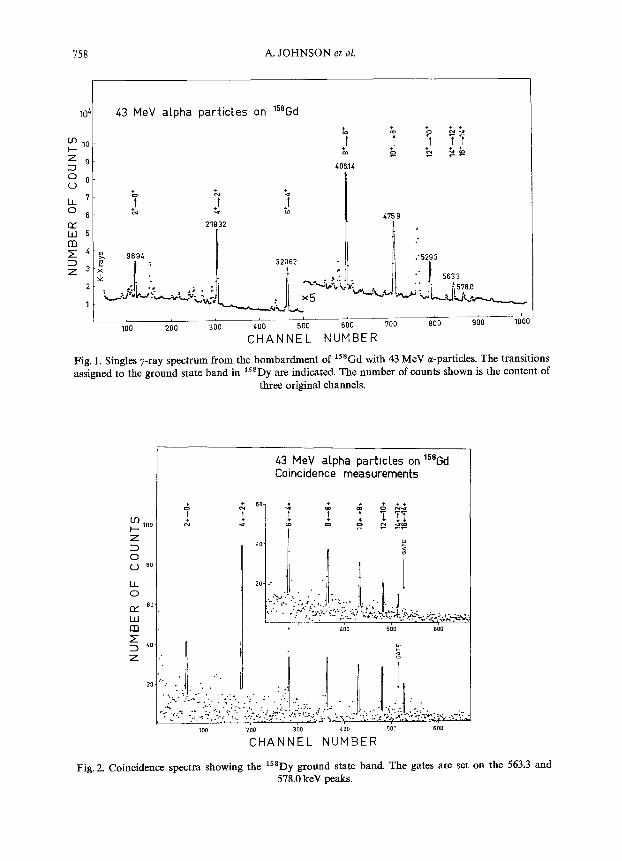
Fig. 2. Coincidence spectra showing the lssDy ground state band. The gates are set on the 563.3 and 578.0 keV peaks.
NUCLEAR MOMENT OF INERTIA 759
which can be drawn support the assignments given in table 1, where, besides the energies, also the relative intensities of the transitions are given. The falling off of the relative intensities with increasing spin follows the trend obtained from the calculation of the spin distribution curve “).
The analysis of the angular distribution measurement gives as a result coefficients and attenuation factors (table 1) which support the assignment of a stretched cascade of E 2 transitions depopulating a 16+ state. Finally, the results of the y-y coincidence experiments displayed in fig. 2 show unambiguously that the 563.5 and 578.0 keV transitions are in coincidence with all the transitions in the cascade from the 12+ state.
It may thus be concluded that a stretched cascade of E2 transitions is observed within the ground state band up to the 16+ member in 15’Dy. A similar observation has been made by Ejiri et al. I’) and more recently by Thieberger et al. ‘O). As is seen in figs. 1 and 2 the regular pattern of the transition energies is broken when the 16+ state is reached.
3.2. THE NUCLEIDE =‘Dy
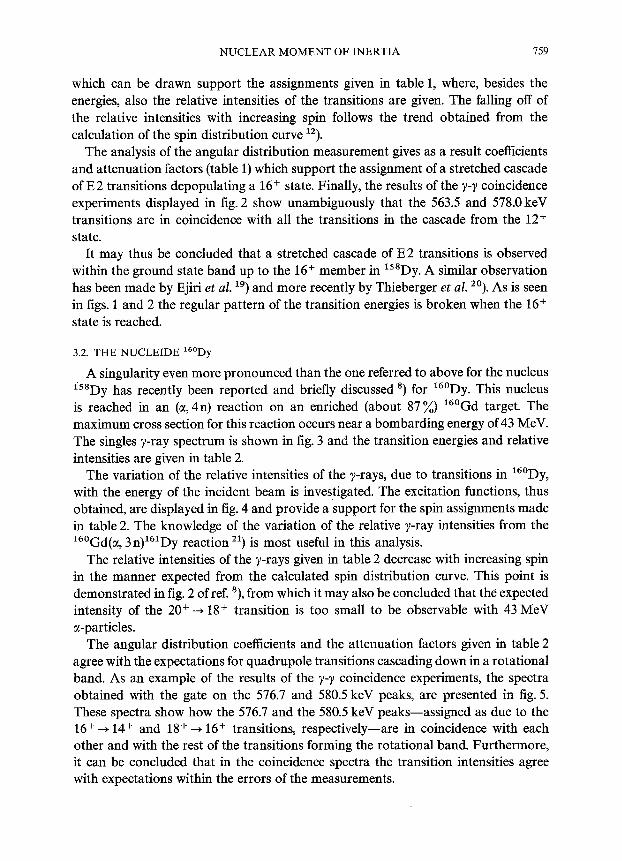
A singularity even more pronounced than the one referred to above for the nucleus is8Dy has recently been reported and briefly discussed ‘) for 16’Dy. This nucleus is reached in an (u, 4n) reaction on an enriched (about 87%) 16’Gd target. The maximum cross section for this reaction occurs near a bombarding energy of 43 MeV. The singles y-ray spectrum is shown in fig. 3 and the transition energies and relative intensities are given in table 2.
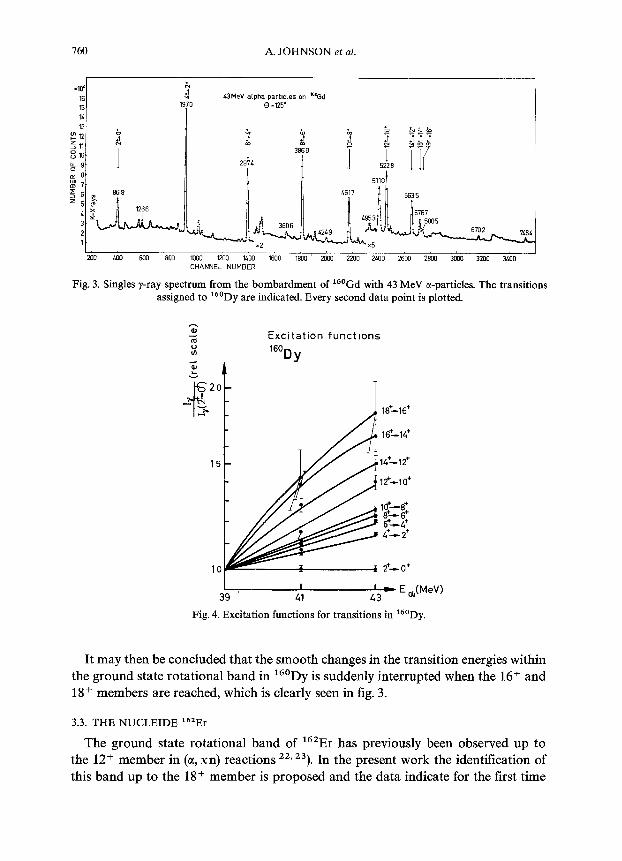
The variation of the relative intensities of the y-rays, due to transitions in 16’Dy, with the energy of the incident beam is investigated. The excitation functions, thus obtained, are displayed in fig. 4 and provide a support for the spin assignments made in table 2. The knowledge of the variation of the relative y-ray intensities from the “j’Gd(a, 3n)161Dy reaction “) is most useful in this analysis.
The relative intensities of the y-rays given in table 2 decrease with increasing spin in the manner expected from the calculated spin distribution curve. This point is demonstrated in fig. 2 of ref. ‘), from which it may also be concluded that the expected intensity of the 20+ -+ 18+ transition is too small to be observable with 43 MeV a-particles.
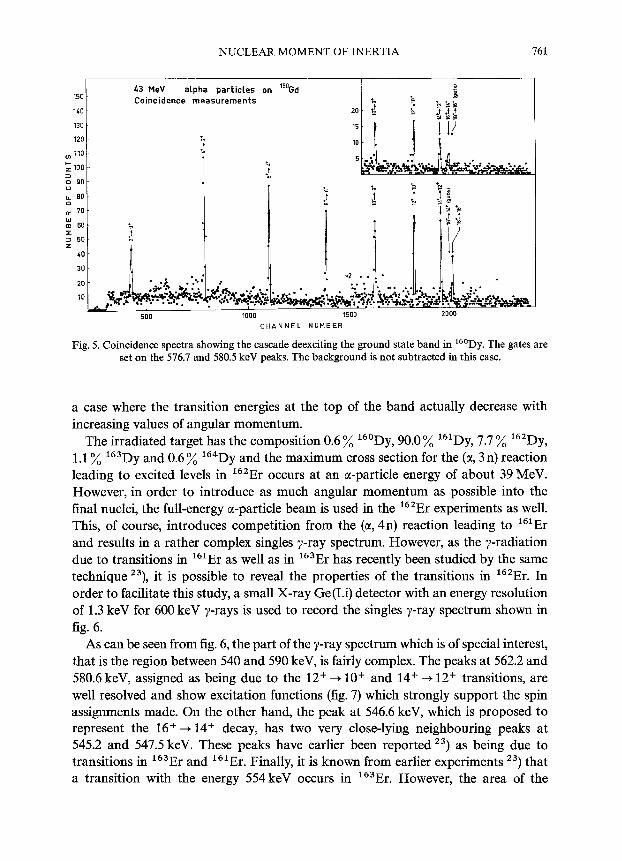
The angular distribution coefficients and the attenuation factors given in table 2 agree with the expectations for quadrupole transitions cascading down in a rotational band. As an example of the results of the y-y coincidence experiments, the spectra obtained with the gate on the 576.7 and 580.5 keV peaks, are presented in fig. 5. These spectra show how the 576.7 and the 580.5 keV peaks-assigned as due to the 16+ + 14+ and 18+ + 16+ transitions, respectively-are in coincidence with each other and with the rest of the transitions forming the rotational band. Furthermore, it can be concluded that in the coincidence spectra the transition intensities agree with expectations within the errors of the measurements.
760
MD 100 600 800 1030 1200 1400 1500 1800 2000 2200 ZOO ma 2800 3000 3200 3030 CHANNEL NUMBER
Fig. 3. Singles y-ray spectrum from the bombardment of 16’Gd with 43 MeV cc-particles. The transitions assigned to 16’Dy are indicated. Every second,data point is plotted.
Excitation functions
16+-16+
16+-v++
15 14+-12+
12+-10+
'ig$
4+-z+
10 2+-o+
’ ) E,(MeV) 43
Fig. 4. Excitation functions for transitions in 16’Dy.
It may then be concluded that the smooth changes in the transition energies within the ground state rotational band in 16’Dy is suddenly interrupted when the 16+ and 18+ members are reached, which is clearly seen in fig. 3.
3.3. THE NUCLEIDE 16’Er
The ground state rotational band of 16’Er has previously been observed up to the 12+ member in (a, xn) reactions “, 23). In the present work the identification of this band up to the 18+ member is proposed and the data indicate for the first time
NUCLEAR MOMENT OF INERTIA 761
43 t-w alpha particles on ‘“‘Gd 150
Coincidence measurements 140
130
120 :.
500
CHANNEL NUMBER
Fig. 5. Coincidence spectra showing the cascade deexciting the ground state band in 16’Dy. The gates are set on the 576.7 and 580.5 keV peaks. The background is not subtracted in this case.
a case where the transition energies at the top of the band actually decrease with increasing values of angular momentum.
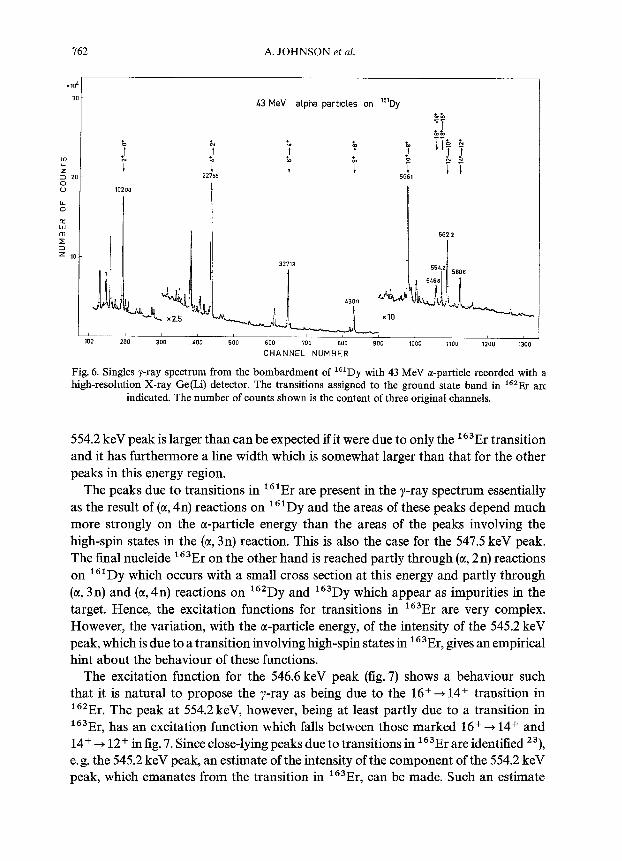
The irradiated target has the composition 0.6 % 16’Dy, 90.0 % 161Dy, 7.7 % 16’Dy, 1.1% 163Dy and 0.6 % 164Dy and the maximum cross section for the (CC, 3 n) reaction leading to excited levels in nj2Er occurs at an a-particle energy of about 39 MeV. However, in order to introduce as much angular momentum as possible into the final nuclei, the full-energy a-particle beam is used in the 162Er experiments as well. This, of course, introduces competition from the (a, 4n) reaction leading to 161Er and results in a rather complex singles y-ray spectrum. However, as the y-radiation due to transitions in 161Er as well as in 163Er has recently been studied by the same technique 23), it is possible to reveal the properties of the transitions in “j2Er. In order to facilitate this study, a small X-ray Ge(Li) detector with an energy resolution of 1.3 keV for 600 keV y-rays is used to record the singles y-ray spectrum shown in fig. 6.
As can be seen from fig. 6, the part of the y-ray spectrum which is of special interest, that is the region between 540 and 590 keV, is fairly complex. The peaks at 562.2 and 580.6 keV, assigned as being due to the 12+ -+ lO+ and 14+ -+ 12+ transitions, are well resolved and show excitation functions (fig. 7) which strongly support the spin assignments made. On the other hand the peak at 546.6 keV, which is proposed to represent the 16+ -+ 14+ decay, has two very close-lying neighbouring peaks at 545.2 and 547.5 keV. These peaks have earlier been reported 23) as being due to transitions in 163Er and 161Er. Finally, it is known from earlier experiments 23) that a transition with the energy 554 keV occurs in 163Er. However, the area of the
A. JOHNSON et al.
43 MeV alpha partlcles on 16’Dy
Fig. 6. Singles y-ray spectrum from the bombardment of 161Dy with 43 MeV cc-particle recorded with a high-resolution X-ray Ge(Li) detector. The transitions assigned to the ground state band in 16’Er arc
indicated. The number of counts shown is the content of three original channels.
554.2 keV peak is larger than can be expected if it were due to only the 163Er transition and it has furthermore a line width which is somewhat larger than that for the other peaks in this energy region.
The peaks due to transitions in 161Er are present in the y-ray spectrum essentially as the result of (a, 4n) reactions on 161Dy and the areas of these peaks depend much more strongly on the a-particle energy than the areas of the peaks involving the high-spin states in the (a, 3n) reaction. This is also the case for the 547.5 keV peak. The final nucleide 163Er on the other hand is reached partly through (LX, 2n) reactions on 161Dy which occurs with a small cross section at this energy and partly through (a, 3 n) and (CC, 4n) reactions on 16’Dy and 163Dy which appear as impurities in the target. Hence, the excitation functions for transitions in 163Er are very complex. However, the variation, with the a-particle energy, of the intensity of the 545.2 keV peak, which is due to a transition involving high-spin states in 163Er, gives an empirical hint about the behaviour of these functions.
The excitation function for the 546.6 keV peak (fig. 7) shows a behaviour such that it is natural to propose the y-ray as being due to the 16++14+ transition in r6’Er The peak at 554.2 keV, however, being at least partly due to a transition in 163Er; has an excitation function which falls between those marked 16+ --f 14+ and 14+ -+ 12+ in fig. 7. Since close-lying peaks due to transitions in 163Er are identified 23), e.g. the 545.2 keV peak, an estimate of the intensity of the component of the 554.2 keV peak, which emanates from the transition in 163Er, can be made. Such an estimate
NUCLEAR MOMENT OF INERTIA 163
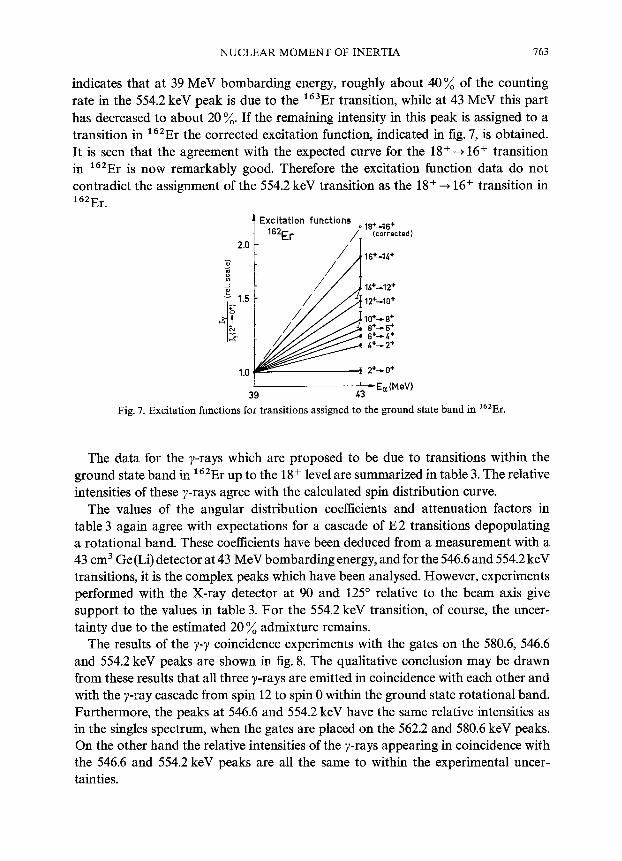
indicates that at 39 MeV bombarding energy, roughly about 40% of the counting rate in the 554.2 keV peak is due to the 163Er transition, while at 43 MeV this part has decreased to about 20 %. If the remaining intensity in this peak is assigned to a transition in 16’Er the corrected excitation function, indicated in fig. 7, is obtained. It is seen that the agreement with the expected curve for the 18+ --p 16+ transition in 16’Er is now remarkably good. Therefore the excitation function data do not contradict the assignment of the 554.2 keV transition as the 18+ + 16+ transition in “j2Er.
Excitation functions o ,6+_,6+
(corrected1
2.0
; 16+-U+
:: 14+-12+
12+-lo+
-E,(MeV) 39 43
Fig. 7. Excitation functions for transitions assigned to the ground state band in 16’Er.
The data for the y-rays which are proposed to be due to transitions within the ground state band in 162Er up to the 18+ level are summarized in table 3. The relative intensities of these y-rays agree with the calculated spin distribution curve.
The values of the angular distribution coefficients and attenuation factors in table 3 again agree with expectations for a cascade of E2 transitions depopulating a rotational band. These coefficients have been deduced from a measurement with a 43 cm3 Ge(Li) detector at 43 MeV bombarding energy, and for the 546.6 and 554.2 keV transitions, it is the complex peaks which have been analysed. However, experiments performed with the X-ray detector at 90 and 125” relative to the beam axis give support to the values in table 3. For the 554.2 keV transition, of course, the uncer- tainty due to the estimated 20 % admixture remains.
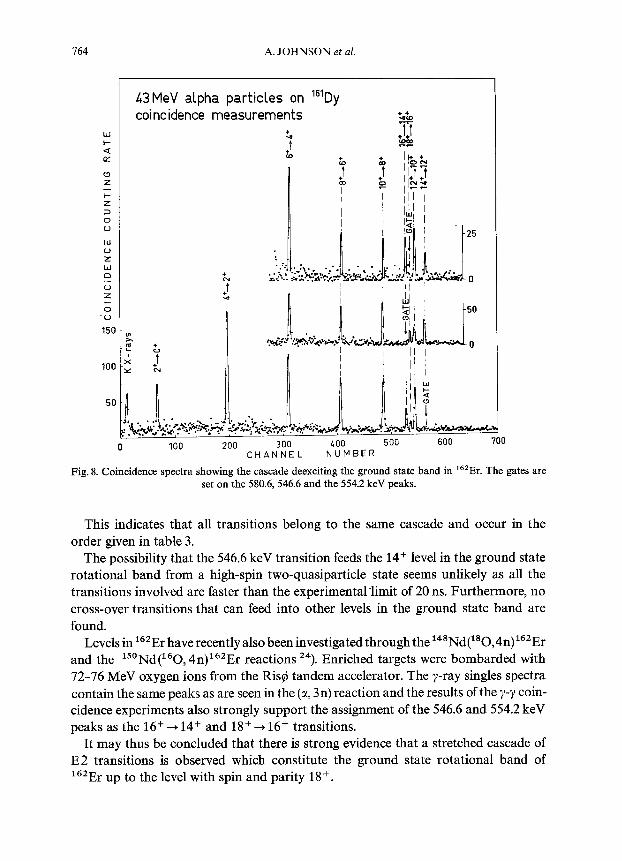
The results of the y-y coincidence experiments with the gates on the 580.6, 546.6 and 554.2 keV peaks are shown in fig. 8. The qualitative conclusion may be drawn from these results that all three y-rays are emitted in coincidence with each other and with the y-ray cascade from spin 12 to spin 0 within the ground state rotational band. Furthermore, the peaks at 546.6 and 554.2 keV have the same relative intensities as in the singles spectrum, when the gates are placed on the 562.2 and 580.6 keV peaks. On the other hand the relative intensities of the y-rays appearing in coincidence with the 546.6 and 554.2 keV peaks are all the same to within the experimental uncer- tainties.
A. JOHNSON et al.
43MeV alpha particles on 161Dy coincidence measurements
0 100 200 300 400 500 600 700
CHANNEL NUMBER
Fig. 8. Coincidence spectra showing the cascade deexciting the ground state band in 16’Er. The gates are set on the 580.6, 546.6 and the 554.2 keV peaks.
This indicates that all transitions belong to the same cascade and occur in the order given in table 3.
The possibility that the 546.6 keV transition feeds the 14+ level in the ground state rotational band from a high-spin two-quasiparticle state seems unlikely as all the transitions involved are faster than the experimental limit of 20 ns. Furthermore, no cross-over transitions that can feed into other levels in the ground state band are found.
Levels in 16’Er have recently also been investigated through the 148Nd(180,4n) 16’Er and the 150Nd(160, 4n)162Er reactions 24) Enriched targets were bombarded with . 72-76 MeV oxygen ions from the Risd tandem accelerator. The y-ray singles spectra contain the same peaks as are seen in the (a, 3n) reaction and the results of the y-7 coin- cidence experiments also strongly support the assignment of the 546.6 and 554.2 keV peaks as the 16+ -+ 14+ and 18++ 16+ transitions.
It may thus be concluded that there is strong evidence that a stretched cascade of E2 transitions is observed which constitute the ground state rotational band of 162Er up to the level with spin and parity 18+.
NUCLEAR MOMENT OF INERTIA 155
L3 MeV alpha particles on 16’Er
L I
100 200 300 100 500 600 700 800 900 1000
CHANNEL NUMBER
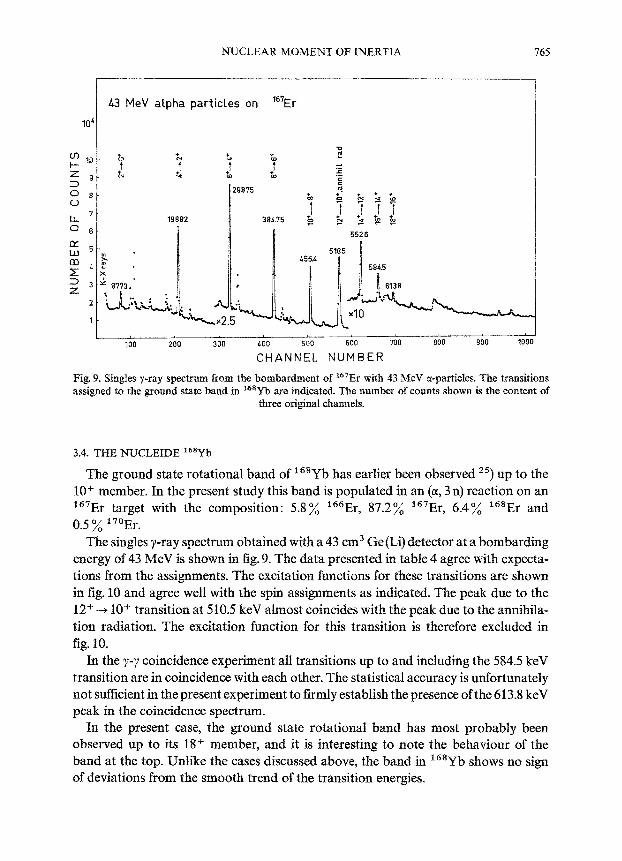
Fig. 9. Singles y-ray spectrum from the bornb~~en~ of 16’Er with 43 MeV or-particles. The transitions assigned to the ground state band in 168Yb are indicated. The number of counts shown is the content of
three original channels.
3.4. THE ~UCLEIDE “=Yb
The ground state rotational band of 168Yb has earlier been observed 2”) up to the lO+ member. In the present study this band is populated in an (a, 3 n) reaction on an 167Er target with the composition: 5.8% 166Er, 87.2% 167Er, 6.4% 16’Er and 0.5 % 17’Er.
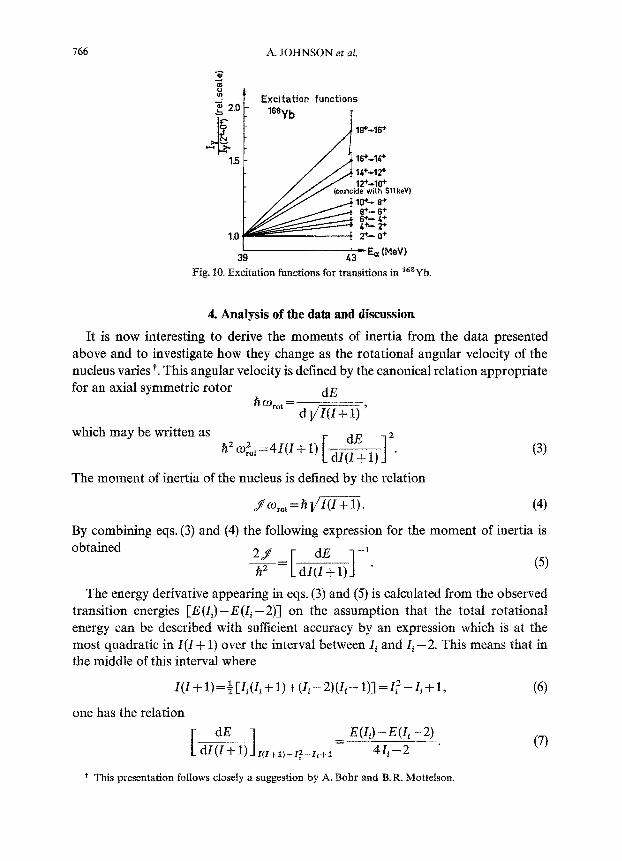
The singles y-ray spectrum obtained with a 43 cm3 Ge(Li) detector at a bombar~ng energy of 43 MeV is shown in fig. 9. The data presented in table 4 agree with expecta- tions from the assignments. The excitation functions for these transitions are shown in fig. 10 and agree well with the spin assignments as indicated. The peak due to the 12+ -+ 10’ transition at 510.5 keV almost coincides with the peak due to the annihila- tion radiation. The excitation function for this transition is therefore excluded in fig. 10.
In the y-y coincidence experiment all transitions up to and including the 584.5 keV transition are in coincidence with each other. The statistical accuracy is unfortunately not sufficient in the present experiment to firmly establish the presence of the 613.8 keV peak in the coincidence spectrum.
In the present case, the ground state rotational baud has most probably been observed up to its 18+ member, and it is interesting to note the behaviour of the band at the top_ Unlike the cases discussed above, the band in 16*Yb shows no sign of deviations from the smooth trend of the transition energies.
766 A. JOHNSON et af.
Excitation functions
‘@%‘b T
16+-1.4+
‘U*~l2+
~EEl(MeVI 39 Fig. 10. Excitation functions for t~ansjtions in *@Yb.
4. Analysis of the data and discussion
It is now interesting to derive the moments of inertia from the data presented above and to investigate how they change as the rotational angular velocity of the nucleus varies?. This angular velocity is defined by the canonical relation appropriate for an axial symmetric rotor dE
which may be written as ~2~~~~=4Z(Z+~) [ ~~~)32.
The moment of inertia of the nucleus is defined by the relation
$Orot=TZfm. (4)
By combining eqs. (3) and (4) the following expression for the moment of inertia is obtained
g=[dZ:l)j-‘- (5)
The energy derivative appearing in eqs. (3) and (5) is calculated from the observed transition energies [E(4)--E(Zi -211 on the assumption that the total rotational energy can be described with su~cient accuracy by an expression which is at the most quadratic in Z(Z + 1) over the interval between Zi and Zi - 2. This means that in the middle of this interval where
Z(z+1)=~[zi(zi+l)+(z~-2)(zi-1)]=z~-zi+1, (6)
one has the relation
[ dZ~l)l,il+l,_l~_ii+l = E(Zil;l,E_(:,-2) ’ (7)
+ This presentation follows closely a suggestion by A. Bohr and B. R. Mottelson.
NUCLEAR MOMENT OF INERTIA 161
23 h2 MOMENT OF INERTIA FOR ROTATING
Me@ DEFORMED NUCLEI
80 -
0 002 004 006 01l8 010 (hw? MeV*
012
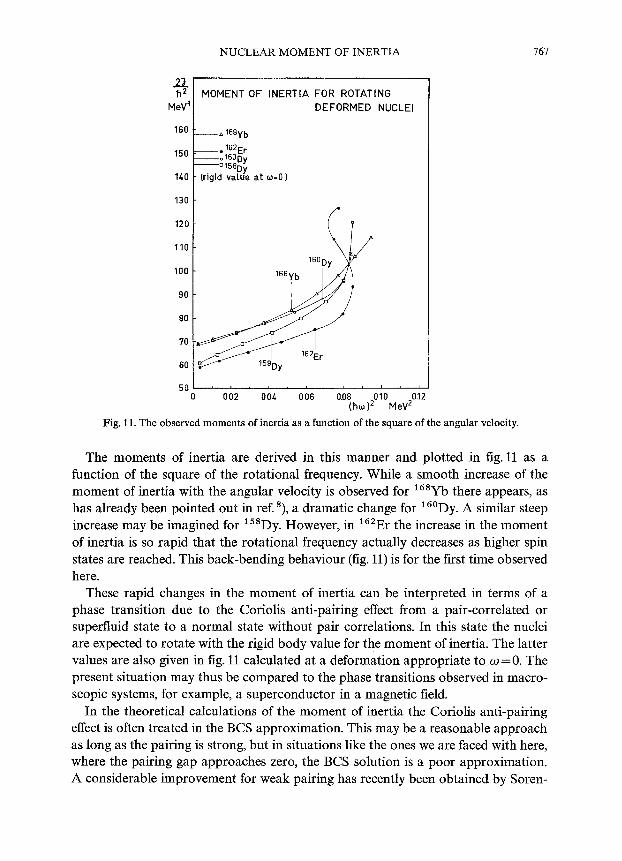
Fig. 11. The observed moments of inertia as a function of the square of the angular velocity.
The moments of inertia are derived in this manner and plotted in fig. 11 as a function of the square of the rotational frequency. While a smooth increase of the moment of inertia with the angular velocity is observed for 168Yb there appears, as has already been pointed out in ref. 8), a dramatic change for 16’Dy. A similar steep increase may be imagined for 158Dy However, in 162Er the increase in the moment .
of inertia is so rapid that the rotational frequency actually decreases as higher spin states are reached. This back-bending behaviour (fig. 11) is for the first time observed here.
These rapid changes in the moment of inertia can be interpreted in terms of a phase transition due to the Coriolis anti-pairing effect from a pair-correlated or superfluid state to a normal state without pair correlations. In this state the nuclei are expected to rotate with the rigid body value for the moment of inertia. The latter values are also given in fig. 11 calculated at a deformation appropriate to .cc) = 0. The present situation may thus be compared to the phase transitions observed in macro- scopic systems, for example, a superconductor in a magnetic field.
In the theoretical calculations of the moment of inertia the Coriolis anti-pairing effect is often treated in the BCS approximation. This may be a reasonable approach as long as the pairing is strong, but in situations like the ones we are faced with here, where the pairing gap approaches zero, the BCS solution is a poor approximation. A considerable improvement for weak pairing has recently been obtained by Soren-
768 A. JOHNSON et nl.
sen 26) who introduced a simpli~ed generator coordinate wave function. As a straight forward result of the Sorensen approach, back-bending curves like the one found for 16’Er (fig. 11) are reproduced, depending on the value of the pairing gap parameter. Recently, Krumlinde and Szymanski 27) have suggested a model for nuclear rotation at high angular momenta which also reproduces the back-bending curve. Effects of this kind have also been obtained by Stephens “) in a Coriolis-mixing calculation taking into account only two-quasiparticle states. The features of the back-bending curve is also being studied by Wahlborn”).
The authors are very much indebted to Professors R. A. Sorensen and Z. Szymanski for many constructive and enlightening discussions on the properties of these nuclei during the course of this work. We should also like to acknowledge Professors A. Bohr and RR. Mottelson for their enthusiastic interest and suggestions for the presentation of the data.
References 1) B.R. Mottelson and J.G. Valatin, Phys. Rev. Lett. 5 (1960) 511 2) J. Krumlinde, Nucl. Phys. A160 (1971) 471 3) J. Krumlinde, Nucl. Phys. A121 (1968) 306 4) M. Sano and M. Wakai, Nucl. Phys. A97 (1967) 298 5) M. Sano and M. Wakai, Nucl. Phys. 67 (1965) 481 6) K.Y. Chan and J. G. Valatin, Nucl. Phys. 82 (1966) 222 7) D. R. Bes, S. Landowne and M.A. J. Mariscotti, Phys. Rev. 166 (1968) 1045 8) A. Johnson, H. Ryde and 3. Sztarkier, Phys. Lett. 34B (1971) 605 9) S. Egare, @. Saetbre, Z. Szymatiski, A. Johnson, H. Ryde and S. A. Hjorth, to be pub~shed
10) A. Johnson, H. Ryde and S.A. Hjorth, Proc. Int. Conf. on heavy ion physics, Dubna, USSR, Feb. 11-17, 1971, to be published
11) S. A. Hjorth, H. Ryde and B. Sklnberg, Ark. Fys. 38 (1968) 537 12) S. Jlgare, Nucl. Phys. A95 (1967) 481 13) R.M.Diamond and F.S. Stephens, Ark. Fys. 36 (1967) 221 14) T. Yamazaki, Nucl. Data 3 (1967) 1 15) P. Thieberger and C. J. Herrlander, Research Institute for Physics, Stockholm, Annual Report, 1968. 16) L. Harms-Ringdahl and J. Sztarkier, to be published 17) P.C. Sood, Phys. Rev. 161(1967) 1063;
C. D. Kavaloski, W. J. Kossler and C. F. Williamson, Nucl. Phys. A 124 (1969) 401; J.H. Jett and D.A. Lind, Nucl. Phys. A155 (1970) 182
18) W. Klamra, AFI, private communication 19) S. Ferguson, I. Halpetn and H. Ejiri, to be published;
S. Ferguson, Thesis, Univ. of Washington (1969) 20) P. Thieberger, private conviction 21) A. Johnson, S. A. Hjorth and G. Ehrling to be published 22) B. J. Stepherd, C.F. Williamson and I. Halpern, Phys. Rev. Lett. 17 (1966) 806 23) S. A. Hjorth, H.Ryde, K.A. Hagemann, G. L@vhmiden and J.C. Waddington, Nucl. Phys. Al44 (1970)
513 24) G. B. Hagemann, B. Herskind and A. Johnson, to be published 25) E. Selin, S.A. Hjorth and H. Ryde, Physica Scripta 2 (1970) 181 26) R.A. Sorensen, Proc. of the Orsay Colloquium on intermediate nuclei, July, 1971, and private com-
munication 27) J.Krumlinde and Z. Szymanski, Phys. Lett. 36B (1971) 157 28) F. S. Stephens, private communication 29) S. Wahlborn, private communication