mom2echap3a
DESCRIPTION
mechanical properties of materialsTRANSCRIPT

12005 Pearson Education South Asia Pte Ltd
3. Mechanical Properties of Materials
CHAPTER OBJECTIVES
• Show relationship of stress and strain using experimental methods to determine stress-strain diagram of a specific material
• Discuss the behavior described in the diagram for commonly used engineering materials
• Discuss the mechanical properties and other test related to the development of mechanics of materials

22005 Pearson Education South Asia Pte Ltd
3. Mechanical Properties of Materials
CHAPTER OUTLINE
1. Tension and Compression Test
2. Stress-Strain Diagram
3. Stress-Strain Behavior of Ductile and Brittle Materials
4. Hooke’s Law
5. Strain Energy
6. Poission’s Ratio
7. Shear Stress-Strain Diagram
8. *Failure of Materials Due to Creep and Fatigue

32005 Pearson Education South Asia Pte Ltd
3. Mechanical Properties of Materials
• Strength of a material can only be determined by experiment
• One test used by engineers is the tension or compression test
• This test is used primarily to determine the relationship between the average normal stress and average normal strain in common engineering materials, such as metals, ceramics, polymers and composites
3.1 TENSION & COMPRESSION TEST

42005 Pearson Education South Asia Pte Ltd
3. Mechanical Properties of Materials
Performing the tension or compression test• Specimen of material is made into “standard”
shape and size• Before testing, 2 small punch marks identified
along specimen’s length• Measurements are taken of both specimen’s initial
x-sectional area A0 and gauge-length distance L0; between the two marks
• Seat the specimen into a testing machine shown below
3.1 TENSION & COMPRESSION TEST

52005 Pearson Education South Asia Pte Ltd
3. Mechanical Properties of Materials
Performing the tension or compression test• Seat the specimen into a testing machine shown
below
3.1 TENSION & COMPRESSION TEST
• The machine will stretch specimen at slow constant rate until breaking point
• At frequent intervals during test, data is recorded of the applied load P.

62005 Pearson Education South Asia Pte Ltd
3. Mechanical Properties of Materials
Performing the tension or compression test
• Elongation δ = L − L0 is measured using either a caliper or an extensometer
• δ is used to calculate the normal strain in the specimen
• Sometimes, strain can also be read directly using an electrical-resistance strain gauge
3.1 TENSION & COMPRESSION TEST

72005 Pearson Education South Asia Pte Ltd
3. Mechanical Properties of Materials
• A stress-strain diagram is obtained by plotting the various values of the stress and corresponding strain in the specimen
Conventional stress-strain diagram• Using recorded data, we can determine nominal
or engineering stress by
3.2 STRESS-STRAIN DIAGRAM
P
A0
σ =
Assumption: Stress is constant over the x-section and throughout region between gauge points
82005 Pearson Education South Asia Pte Ltd
3. Mechanical Properties of Materials
Conventional Stress-Strain Diagram• Likewise, nominal or engineering strain is found
directly from strain gauge reading, or by
3.2 STRESS-STRAIN DIAGRAM
δ
L0
=
Assumption: Strain is constant throughout region between gauge points
By plotting σ (ordinate) against (abscissa), we get a conventional stress-strain diagram

92005 Pearson Education South Asia Pte Ltd
3. Mechanical Properties of Materials
Conventional stress-strain diagram• Figure shows the characteristic stress-strain
diagram for steel, a commonly used material for structural members and mechanical elements
3.2 STRESS-STRAIN DIAGRAM

102005 Pearson Education South Asia Pte Ltd
3. Mechanical Properties of Materials
Conventional stress-strain diagram
3.2 STRESS-STRAIN DIAGRAM
Elastic behavior.• A straight line• Stress is proportional to
strain, i.e., linearly elastic• Upper stress limit, or
proportional limit; σpl
• If load is removed upon reaching elastic limit, specimen will return to its original shape

112005 Pearson Education South Asia Pte Ltd
3. Mechanical Properties of Materials
Conventional stress-strain diagram
3.2 STRESS-STRAIN DIAGRAM
Figure 3-4
Yielding.• Material deforms
permanently; yielding; plastic deformation
• Yield stress, σY
• Once yield point reached, specimen continues to elongate (strain) without any increase in load
• Note figure not drawn to scale, otherwise induced strains is 10-40 times larger than in elastic limit
• Material is referred to as being perfectly plastic

122005 Pearson Education South Asia Pte Ltd
3. Mechanical Properties of Materials
Conventional stress-strain diagram
3.2 STRESS-STRAIN DIAGRAM
Figure 3-4
Strain hardening.
• Ultimate stress, σu
• While specimen is elongating, its x-sectional area will decrease
• Decrease in area is fairly uniform over entire gauge length
132005 Pearson Education South Asia Pte Ltd
3. Mechanical Properties of Materials
Conventional stress-strain diagram
3.2 STRESS-STRAIN DIAGRAM
Figure 3-4
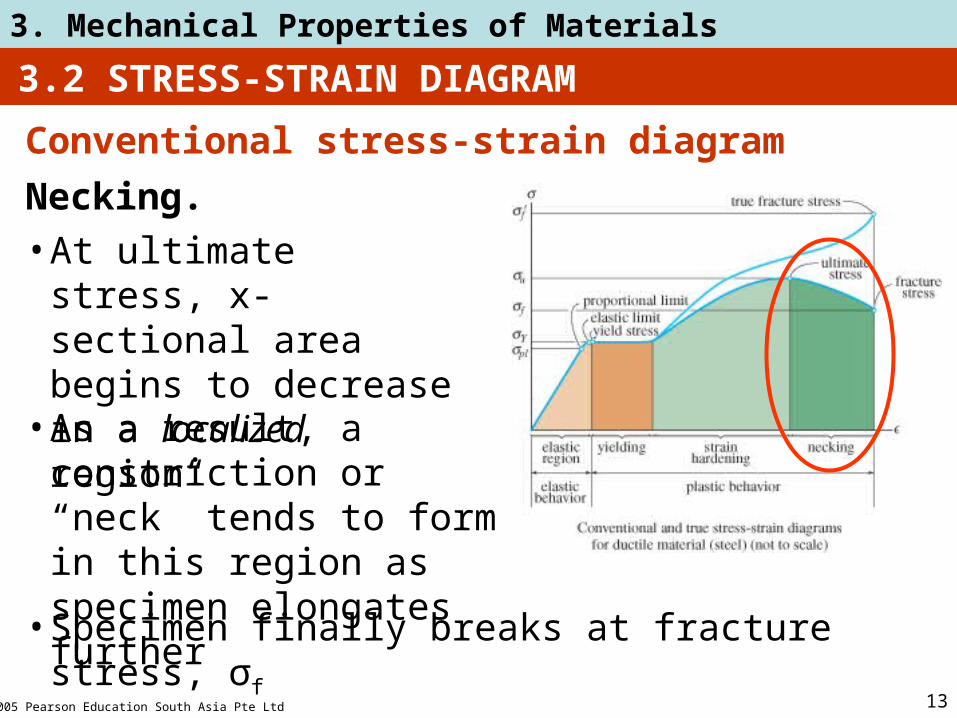
Necking.• At ultimate stress, x-
sectional area begins to decrease in a localized region
• As a result, a constriction or “neck” tends to form in this region as specimen elongates further
• Specimen finally breaks at fracture stress, σf
142005 Pearson Education South Asia Pte Ltd
3. Mechanical Properties of Materials
Conventional stress-strain diagram
3.2 STRESS-STRAIN DIAGRAM
Figure 3-4
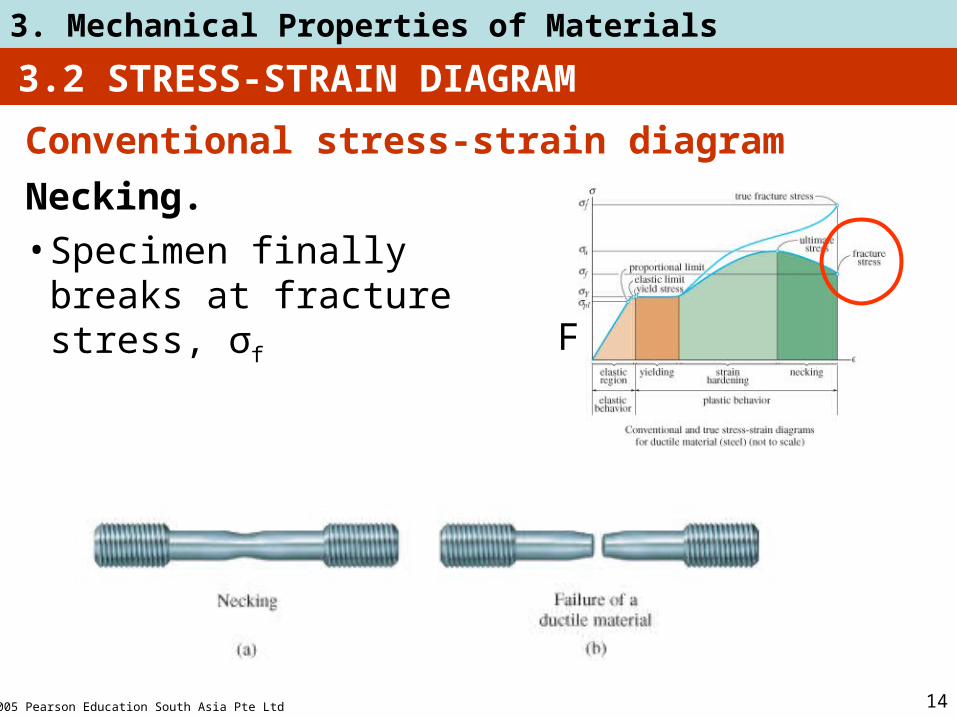
Necking.• Specimen finally breaks
at fracture stress, σf

152005 Pearson Education South Asia Pte Ltd
3. Mechanical Properties of Materials
True stress-strain diagram
3.2 STRESS-STRAIN DIAGRAM
• Instead of using original cross-sectional area and length, we can use the actual cross-sectional area and length at the instant the load is measured
• Values of stress and strain thus calculated are called true stress and true strain, and a plot of their values is the true stress-strain diagram

162005 Pearson Education South Asia Pte Ltd
3. Mechanical Properties of Materials
True stress-strain diagram
3.2 STRESS-STRAIN DIAGRAM
• In strain-hardening range, conventional σ- diagram shows specimen supporting decreasing load
• While true σ- diagram shows material to be sustaining increasing stress

172005 Pearson Education South Asia Pte Ltd
3. Mechanical Properties of Materials
True stress-strain diagram
3.2 STRESS-STRAIN DIAGRAM
• Although both diagrams are different, most engineering design is done within elastic range provided
1.Material is “stiff,” like most metals
2.Strain to elastic limit remains small
3.Error in using engineering values of σ and is very small (0.1 %) compared to true values

182005 Pearson Education South Asia Pte Ltd
3. Mechanical Properties of Materials
Ductile materials• Defined as any material that can be subjected to
large strains before it ruptures, e.g., mild steel• Such materials are used because it is capable of
absorbing shock or energy, and if before becoming overloaded, will exhibit large deformation before failing
• Ductility of material is to report its percent elongation or percent reduction in area at time of fracture
3.3 STRESS-STRAIN BEHAVIOR OF DUCTILE & BRITTLE MATERIALS

192005 Pearson Education South Asia Pte Ltd
3. Mechanical Properties of Materials
Ductile materials• Percent elongation is the specimen’s fracture
strain expressed as a percent
• Percent reduction in area is defined within necking region as
3.3 STRESS-STRAIN BEHAVIOR OF DUCTILE & BRITTLE MATERIALS
Percent elongation =Lf − L0
L0
(100%)
Percent reduction in area =A0 − Af
A0
(100%)

202005 Pearson Education South Asia Pte Ltd
3. Mechanical Properties of Materials
Ductile materials• Most metals do not exhibit constant yielding
behavior beyond the elastic range, e.g. aluminum• It does not have well-defined yield point, thus it is
standard practice to define its yield strength using a graphical procedure called the offset method
3.3 STRESS-STRAIN BEHAVIOR OF DUCTILE & BRITTLE MATERIALS

212005 Pearson Education South Asia Pte Ltd
3. Mechanical Properties of Materials
Ductile materials
Offset method to determine yield strength
3.3 STRESS-STRAIN BEHAVIOR OF DUCTILE & BRITTLE MATERIALS
1. Normally, a 0.2 % strain is chosen.
2. From this point on the axis, a line parallel to initial straight-line portion of stress-strain diagram is drawn.
3. The point where this line intersects the curve defines the yield strength.

222005 Pearson Education South Asia Pte Ltd
3. Mechanical Properties of Materials
Brittle Materials• Material that exhibit little or no yielding before
failure are referred to as brittle materials, e.g., gray cast iron
• Brittle materials do not have a well-defined tensile fracture stress, since appearance of initial cracks in a specimen is quite random
3.3 STRESS-STRAIN BEHAVIOR OF DUCTILE & BRITTLE MATERIALS

232005 Pearson Education South Asia Pte Ltd
3. Mechanical Properties of Materials
Brittle Materials• Instead, the average fracture stress from a set of
observed tests is generally reported
3.3 STRESS-STRAIN BEHAVIOR OF DUCTILE & BRITTLE MATERIALS

242005 Pearson Education South Asia Pte Ltd
3. Mechanical Properties of Materials
• E represents the constant of proportionality, also called the modulus of elasticity or Young’s modulus
• E has units of stress, i.e., pascals, MPa or GPa.
3.4 HOOKE’S LAW
• Most engineering materials exhibit a linear relationship between stress and strain with the elastic region
• Discovered by Robert Hooke in 1676 using springs, known as Hooke’s law
σ = E

252005 Pearson Education South Asia Pte Ltd
3. Mechanical Properties of Materials
• As shown above, most grades of steel have same modulus of elasticity, Est = 200 GPa
• Modulus of elasticity is a mechanical property that indicates the stiffness of a material
• Materials that are still have large E values, while spongy materials (vulcanized rubber) have low values
3.4 HOOKE’S LAW
262005 Pearson Education South Asia Pte Ltd
3. Mechanical Properties of Materials
IMPORTANT• Modulus of elasticity E, can be used only if a
material has linear-elastic behavior.• Also, if stress in material is greater than the
proportional limit, the stress-strain diagram ceases to be a straight line and the equation is not valid
3.4 HOOKE’S LAW

272005 Pearson Education South Asia Pte Ltd
3. Mechanical Properties of Materials
Strain hardening• If a specimen of ductile material (steel) is loaded
into the plastic region and then unloaded, elastic strain is recovered as material returns to its equilibrium state
• However, plastic strain remains, thus material is subjected to a permanent set
3.4 HOOKE’S LAW
282005 Pearson Education South Asia Pte Ltd
3. Mechanical Properties of Materials
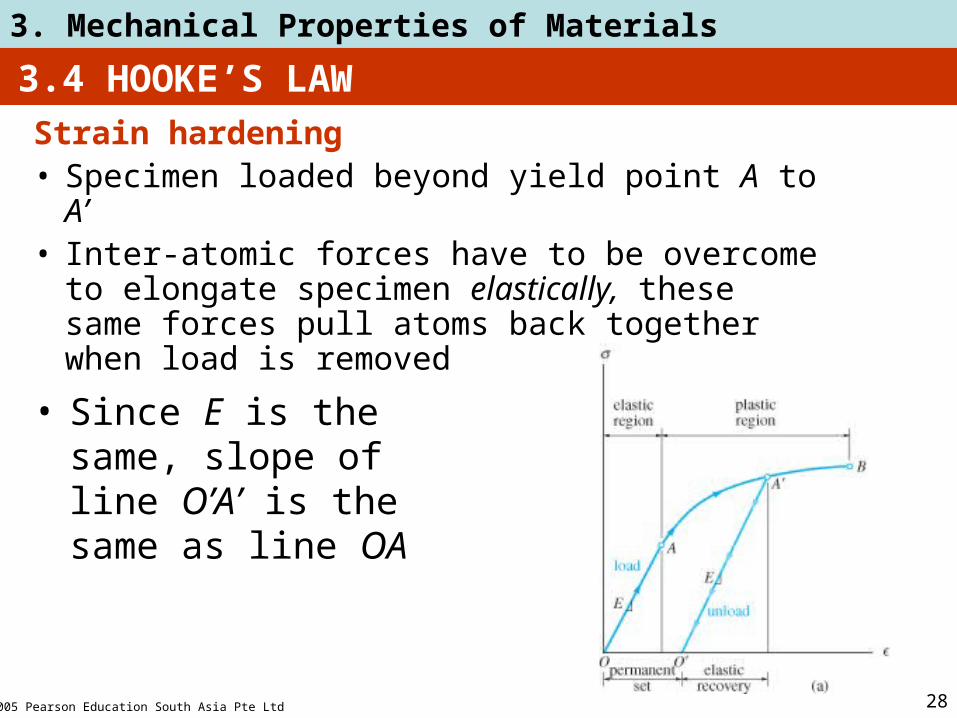
Strain hardening• Specimen loaded beyond yield point A to A’• Inter-atomic forces have to be overcome to
elongate specimen elastically, these same forces pull atoms back together when load is removed
3.4 HOOKE’S LAW
• Since E is the same, slope of line O’A’ is the same as line OA
292005 Pearson Education South Asia Pte Ltd
3. Mechanical Properties of Materials
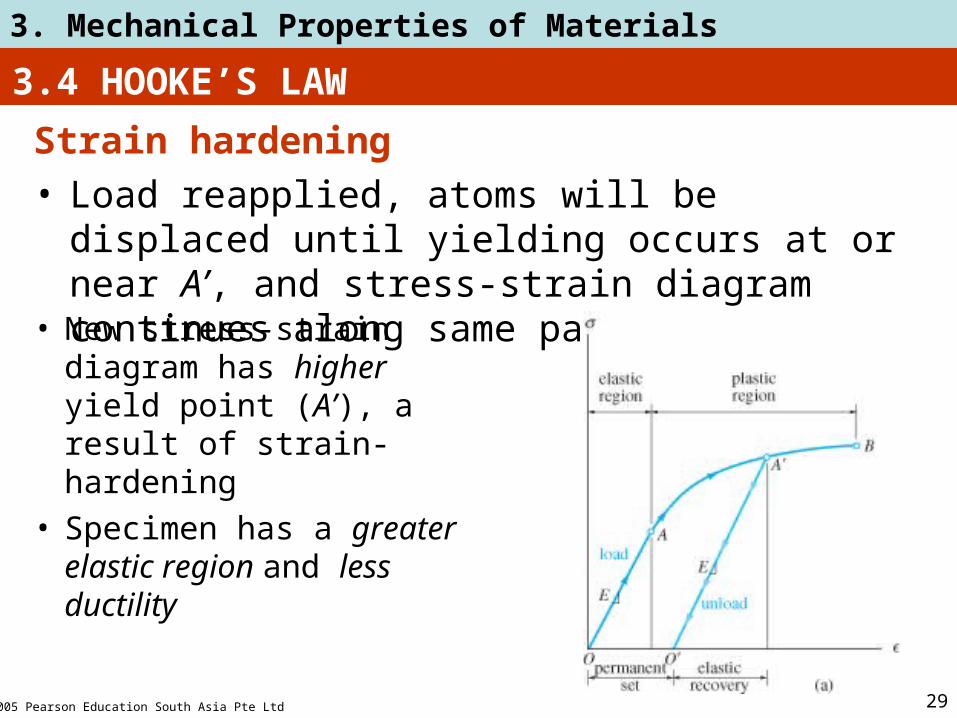
Strain hardening• Load reapplied, atoms will be displaced until
yielding occurs at or near A’, and stress-strain diagram continues along same path as before
3.4 HOOKE’S LAW
• New stress-strain diagram has higher yield point (A’), a result of strain-hardening
• Specimen has a greater elastic region and less ductility
302005 Pearson Education South Asia Pte Ltd
3. Mechanical Properties of Materials
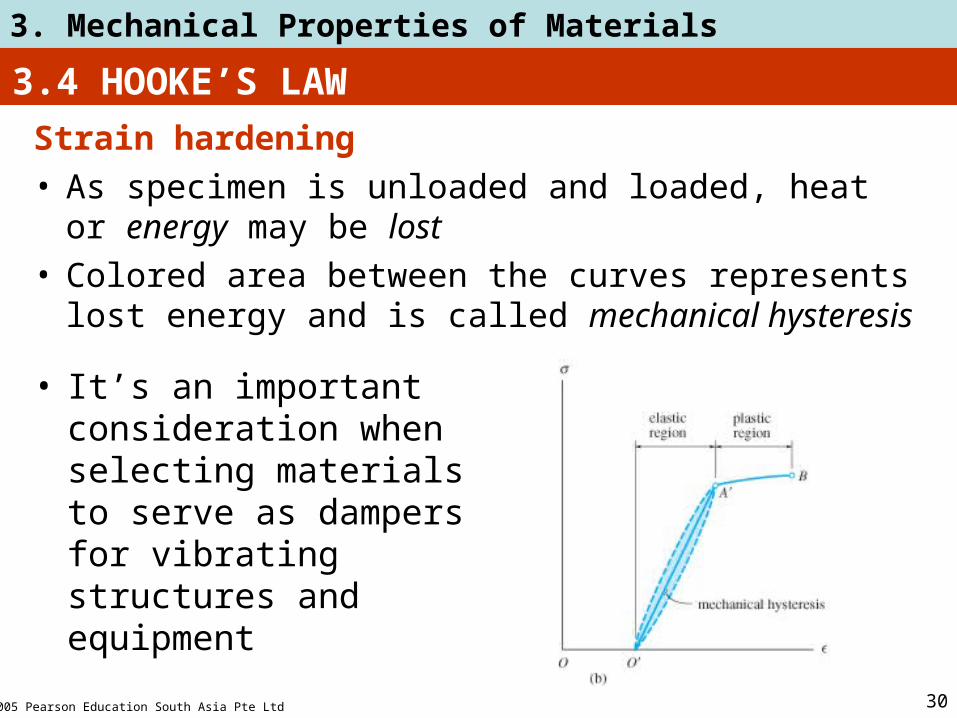
Strain hardening• As specimen is unloaded and loaded, heat or
energy may be lost• Colored area between the curves represents lost
energy and is called mechanical hysteresis
3.4 HOOKE’S LAW
• It’s an important consideration when selecting materials to serve as dampers for vibrating structures and equipment