molybdenum local limit development - us epa · pdf filemolybdenum local limit development ted...
TRANSCRIPT

Molybdenum Local Limit Development
Ted Graber, Industrial Waste SpecialistRegulatory Compliance Division
Metro Wastewater Reclamation District

2
What is the Metro District?
The Metro District is the wholesale treatment facility for the Metro Denver Area.

3
Metro District Fun Facts!
• Serve 57 Municipalities
• Serve 1.6 Million People
• Treat 140 MGD
• Produce 80 Dry Tons/Day of Biosolids

4
Why is Molybdenum a Concern?
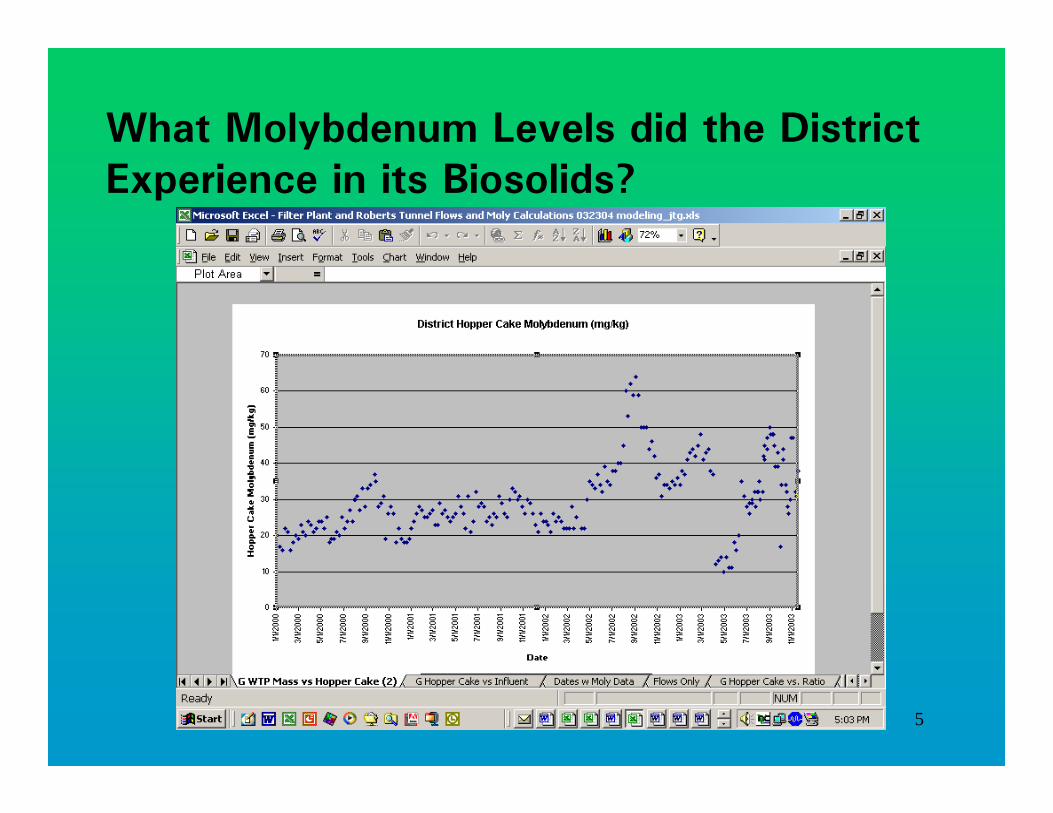
40 CFR 503 – Subpart B, “Land Application.”Ceiling Limit for Molybdenum = 75 mg/kg
5
What Molybdenum Levels did the District Experience in its Biosolids?

6
Investigative and Analytical Efforts (2003)• Surveyed Local Pretreatment Programs.• Question to Yahoo Pretreatment
Coordinators Group.• Implemented Molybdenum Method w/ an
improved Reporting Limit (5 vs. 30 ug/L).• Increased Influent, Effluent and Biosolids
Monitoring for Molybdenum (Removal Efficiency of 20-22%)
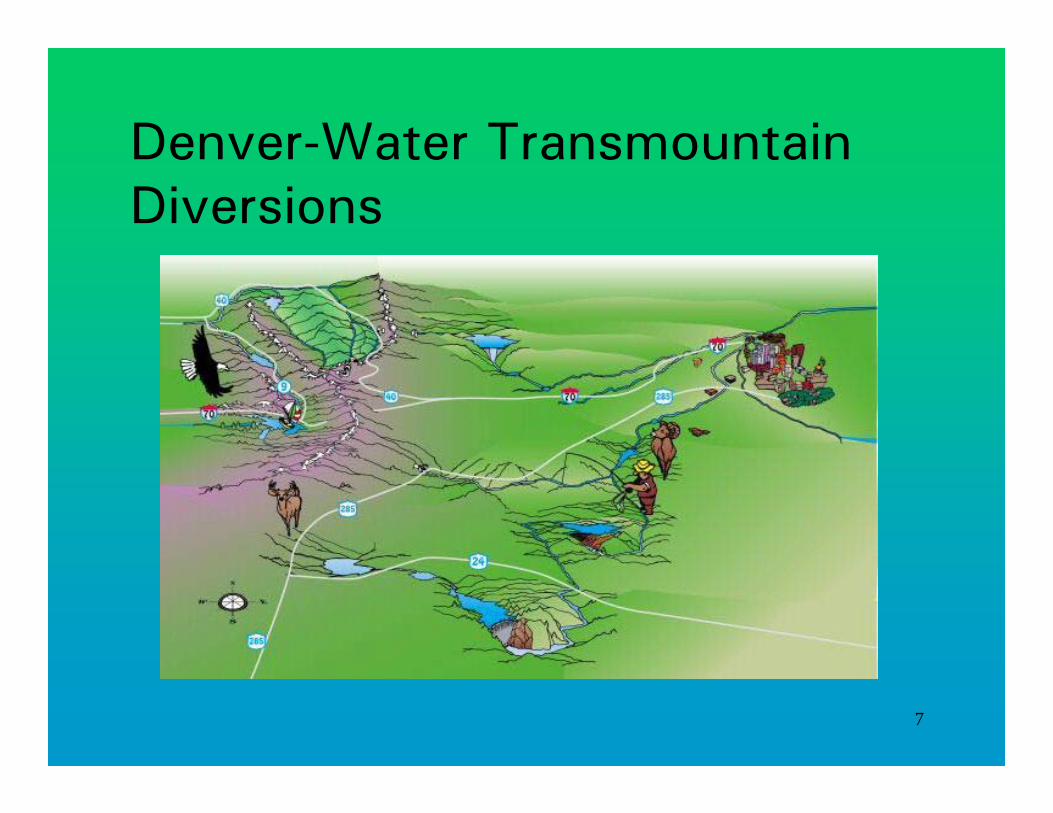
• Contacted Denver Water.
7
Denver-Water TransmountainDiversions
8
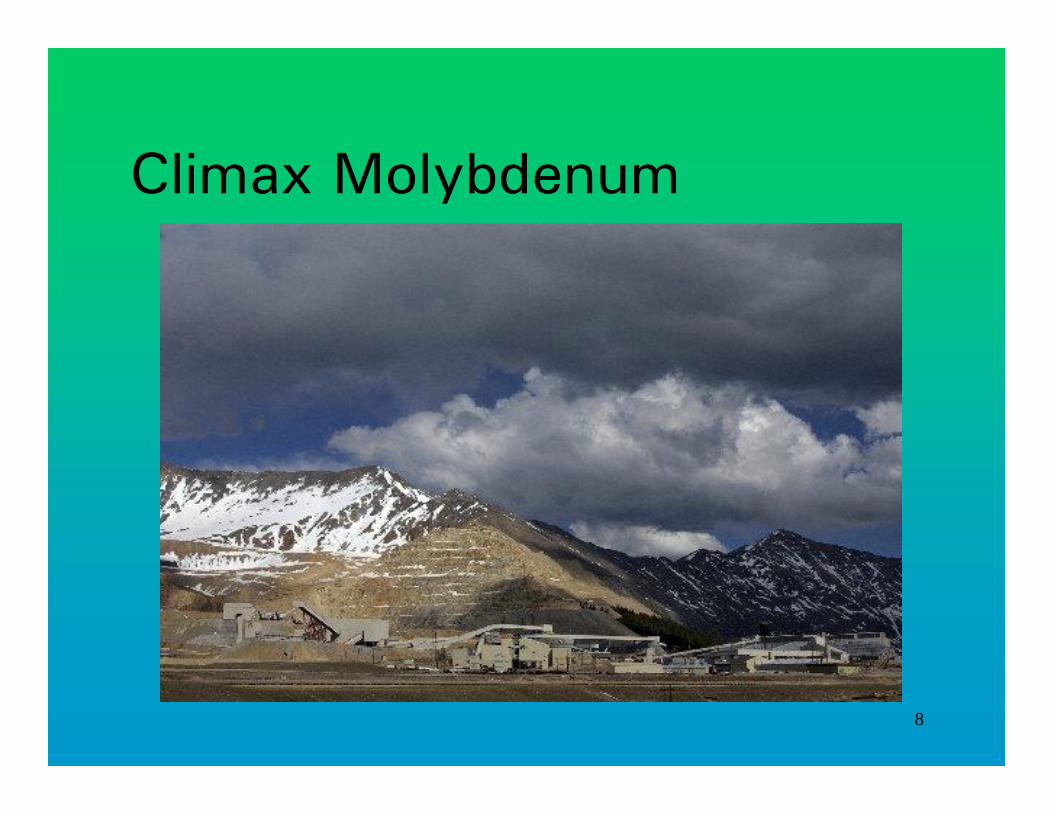
Climax Molybdenum
9
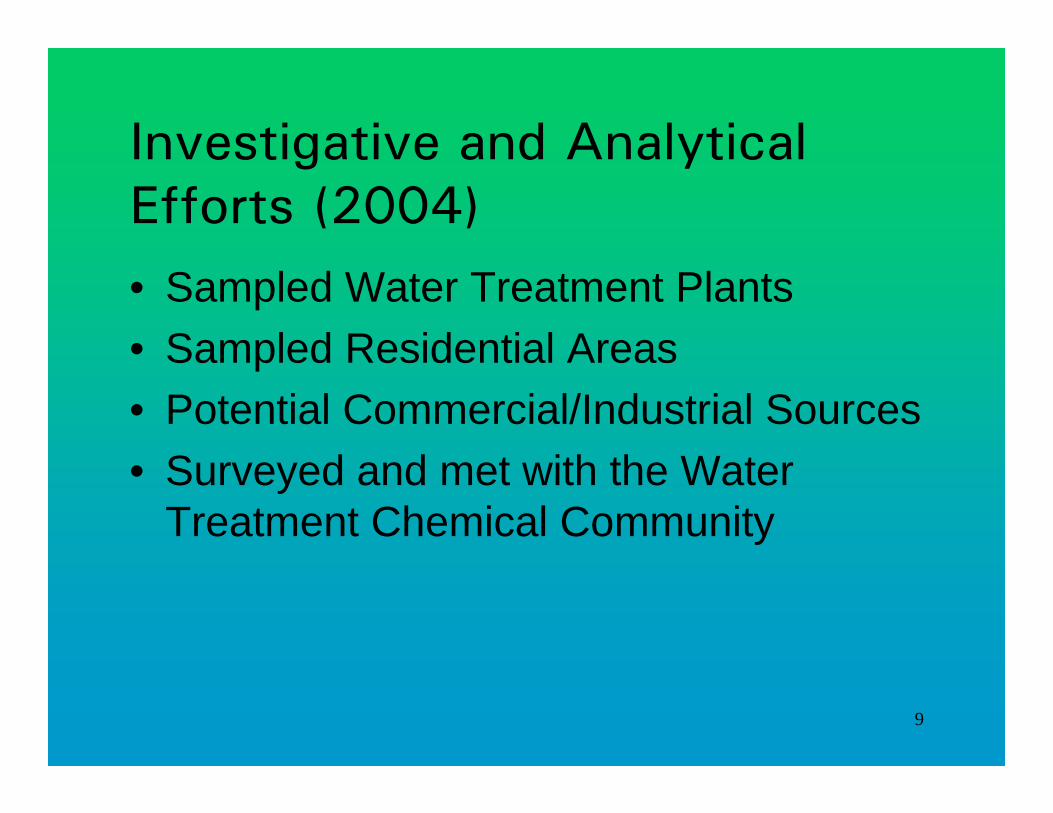
Investigative and Analytical Efforts (2004)• Sampled Water Treatment Plants • Sampled Residential Areas• Potential Commercial/Industrial Sources• Surveyed and met with the Water
Treatment Chemical Community

10
Domestic Sources of MolybdenumForest & Missouri, & Severn & Jasmine vs Denver's Southern WTPs- Summer
2004
0
0.005
0.01
0.015
0.02
0.025
0.03
0.035
0.04
0.045
0.05
4/23/2004 5/13/2004 6/2/2004 6/22/2004 7/12/2004 8/1/2004 8/21/2004 9/10/2004 9/30/2004 10/20/2004Date
mg/
L
Denver Foothills & Marston Flow Weighted Ave [ ] Severn Pl. & Jasmine St. (mg/L) (Loc. Code #2002)
Missouri & Forest (mg/L) (Loc. Code #2001)
11
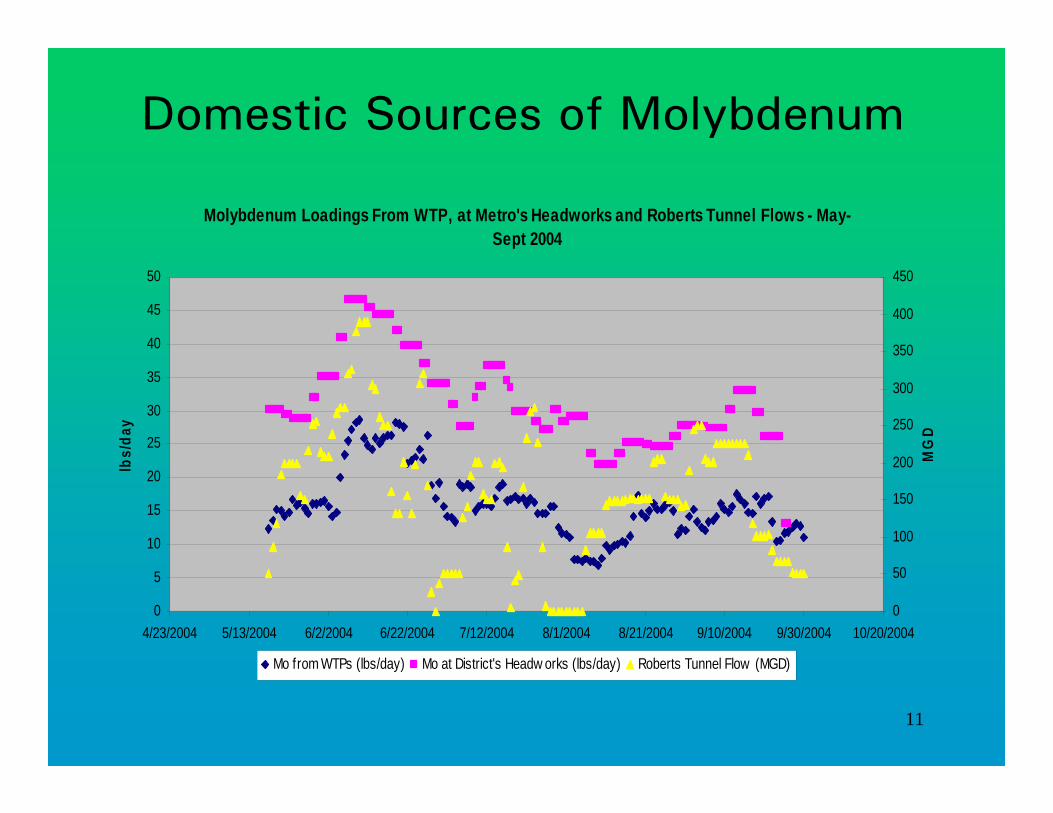
Domestic Sources of Molybdenum
Molybdenum Loadings From WTP, at Metro's Headworks and Roberts Tunnel Flows - May-Sept 2004
0
5
10
15
20
25
30
35
40
45
50
4/23/2004 5/13/2004 6/2/2004 6/22/2004 7/12/2004 8/1/2004 8/21/2004 9/10/2004 9/30/2004 10/20/2004
DATE
lbs/
day
0
50
100
150
200
250
300
350
400
450
MG
D
Mo from WTPs (lbs/day) Mo at District's Headw orks (lbs/day) Roberts Tunnel Flow (MGD)
12
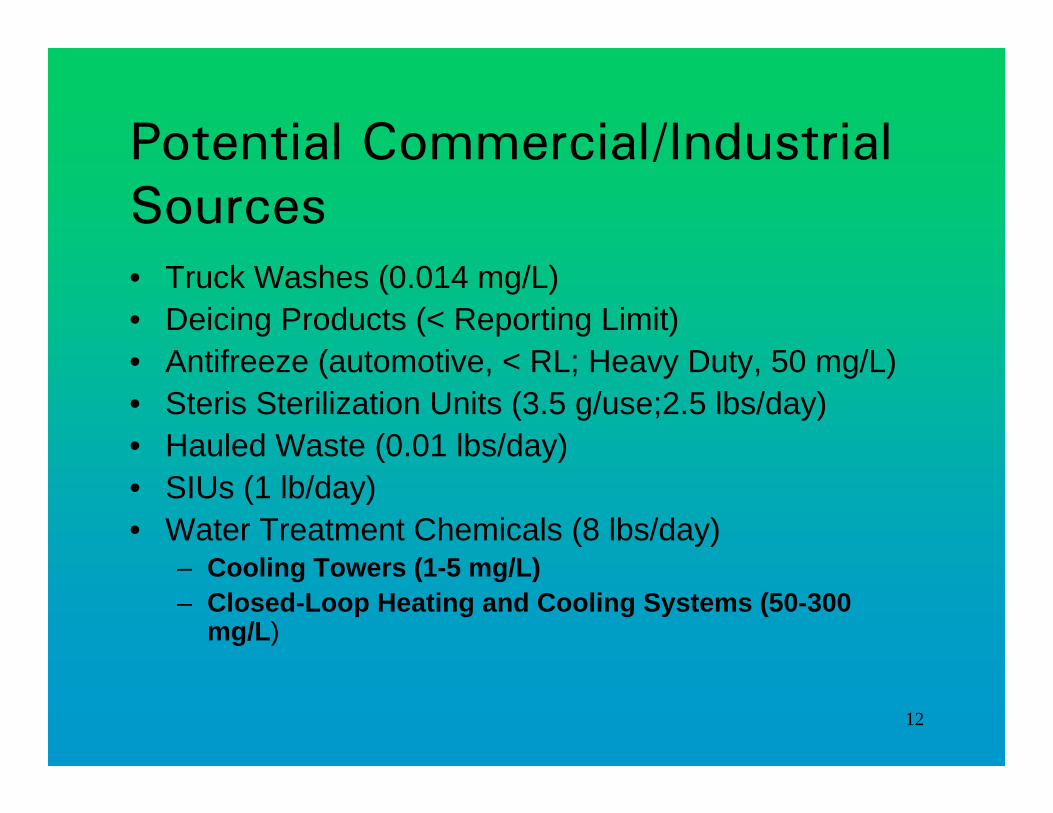
Potential Commercial/Industrial Sources• Truck Washes (0.014 mg/L)• Deicing Products (< Reporting Limit)• Antifreeze (automotive, < RL; Heavy Duty, 50 mg/L)• Steris Sterilization Units (3.5 g/use;2.5 lbs/day)• Hauled Waste (0.01 lbs/day)• SIUs (1 lb/day)• Water Treatment Chemicals (8 lbs/day)
– Cooling Towers (1-5 mg/L)– Closed-Loop Heating and Cooling Systems (50-300
mg/L)
13
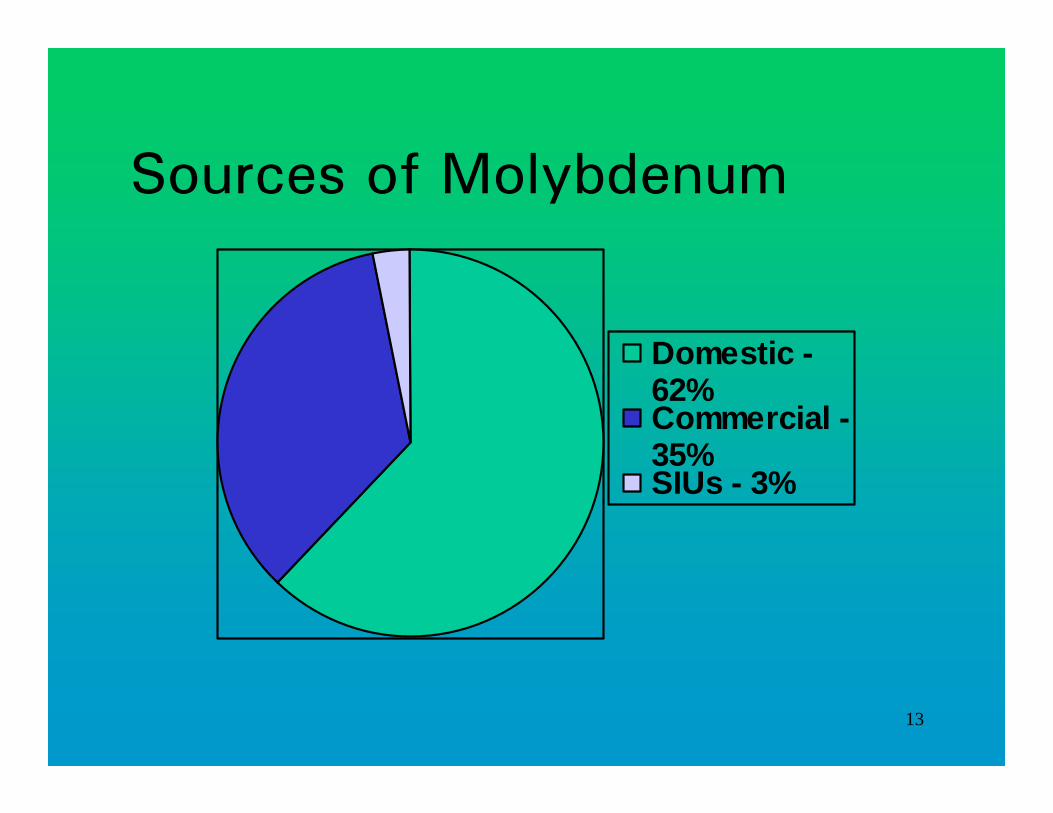
Sources of Molybdenum
Domestic -62%Commercial -35%SIUs - 3%

14
Commercial Sources of Molybdenum
H20 TrtChems -58%HospitalSterilizationUnits -15%Other - 27%

15

16
Rules and Regulations changes, effective June 6, 2006:
• The District’s Molybdenum Local Limit was reduced from 0.71 mg/L to 0.43 mg/L.
• This limit applies to all non-residential users of the Metro District.

17
Rules and Regulations changes, effective January 1, 2007:
• Discharge from cooling towers, boilers, closed-loop heat transfer systems and any other cooling/heating system treated with molybdenum-containing water treatment chemicals is prohibited entirely (8 lbs/day or >).
18
Compliance with prohibition determined by either:
Certification(s) from water treatment chemical blender(s)/manufacturers; or
Laboratory analysis using 40 CFR 136 approved test methods verifying the absence of molybdenum in the discharge.
19
Best Management PracticesOpen Systems
20
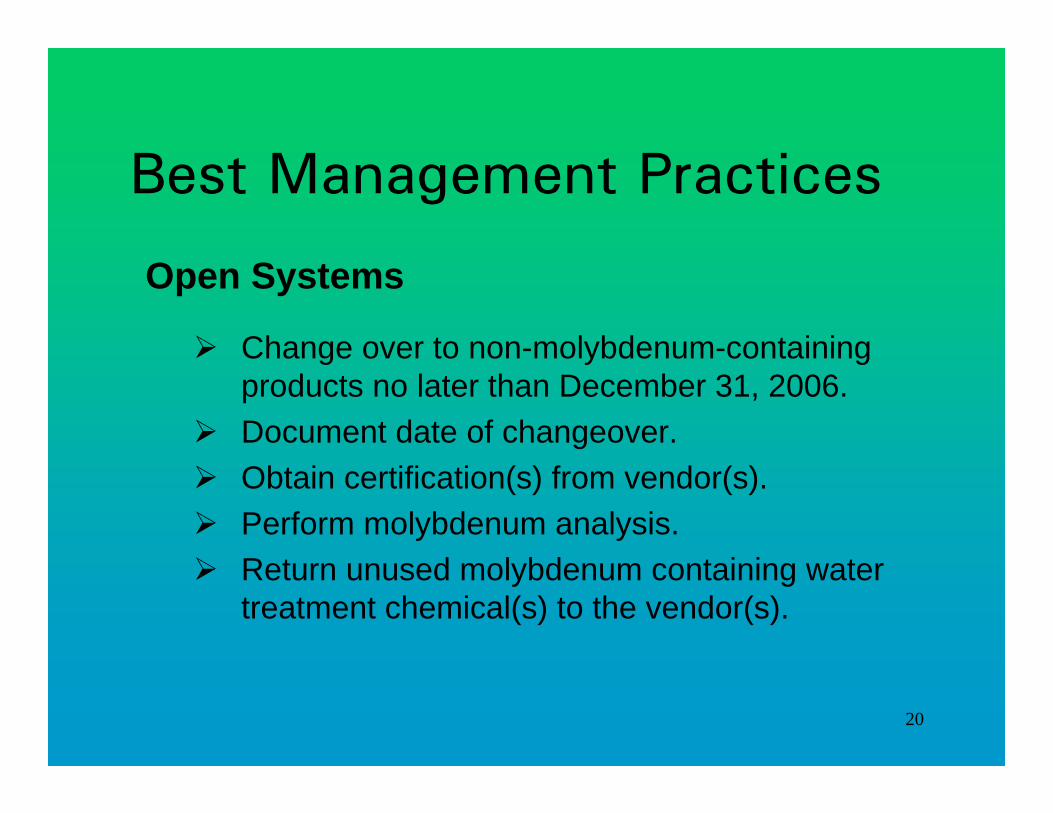
Best Management Practices
Open Systems
Change over to non-molybdenum-containing products no later than December 31, 2006.Document date of changeover.Obtain certification(s) from vendor(s).Perform molybdenum analysis.Return unused molybdenum containing water treatment chemical(s) to the vendor(s).

21
Best Management PracticesClosed Systems
22
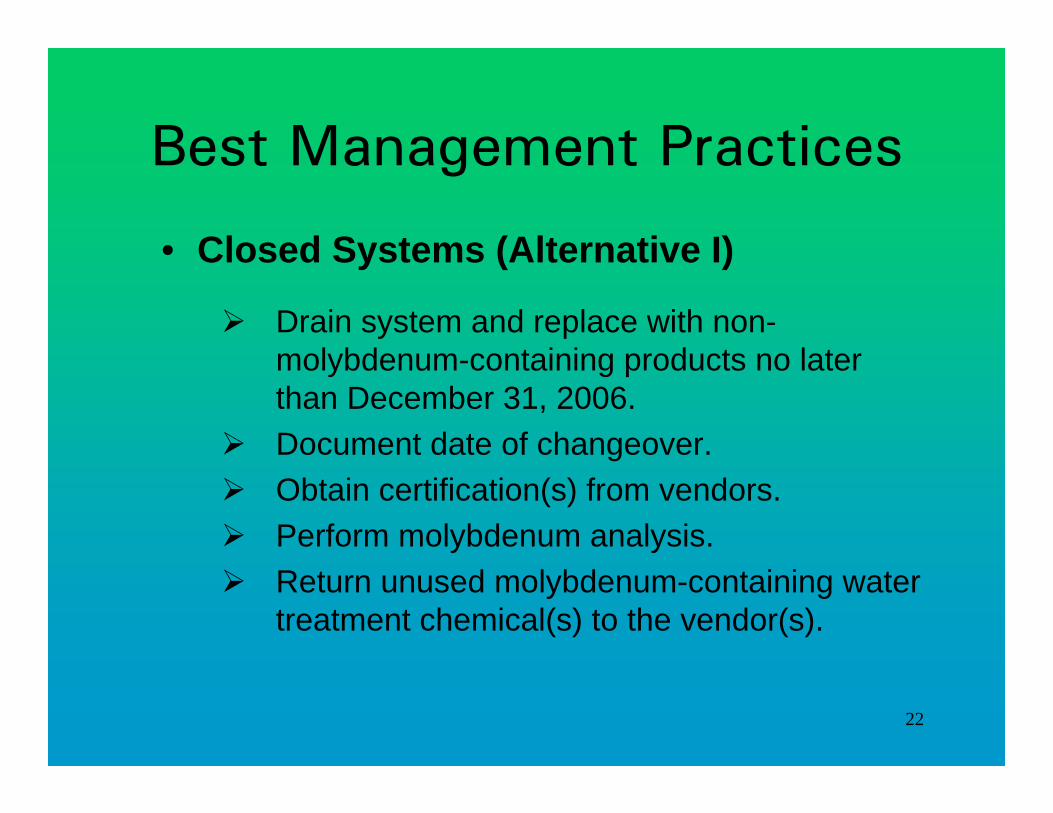
Best Management Practices
• Closed Systems (Alternative I)
Drain system and replace with non-molybdenum-containing products no later than December 31, 2006.Document date of changeover.Obtain certification(s) from vendors.Perform molybdenum analysis.Return unused molybdenum-containing water treatment chemical(s) to the vendor(s).

23
Best Management Practices• Closed Systems (Alternative II)
Begin using non-molybdenum products (without draining system) no later than December 31, 2006.Document date of changeover.Obtain Certification(s) from vendors.Post Advisory.Seal or otherwise protect drain(s) from accidental discharges.Return unused molybdenum-containing water treatment chemical(s) to the vendor(s).Manage all wastewater from the closed-loop system in a zero discharge manner.

24
Steris 1 Sterilization Units• 3.5 grams of Mo/use.• 1000’s of
uses/year/large hospital.
• Estimated 2.5 lbs/day discharged in our Service Area.
• Letter Sent Requesting Voluntary Reduction in Steris Usage. Informed they were required to comply w/ New Local Limit.
25
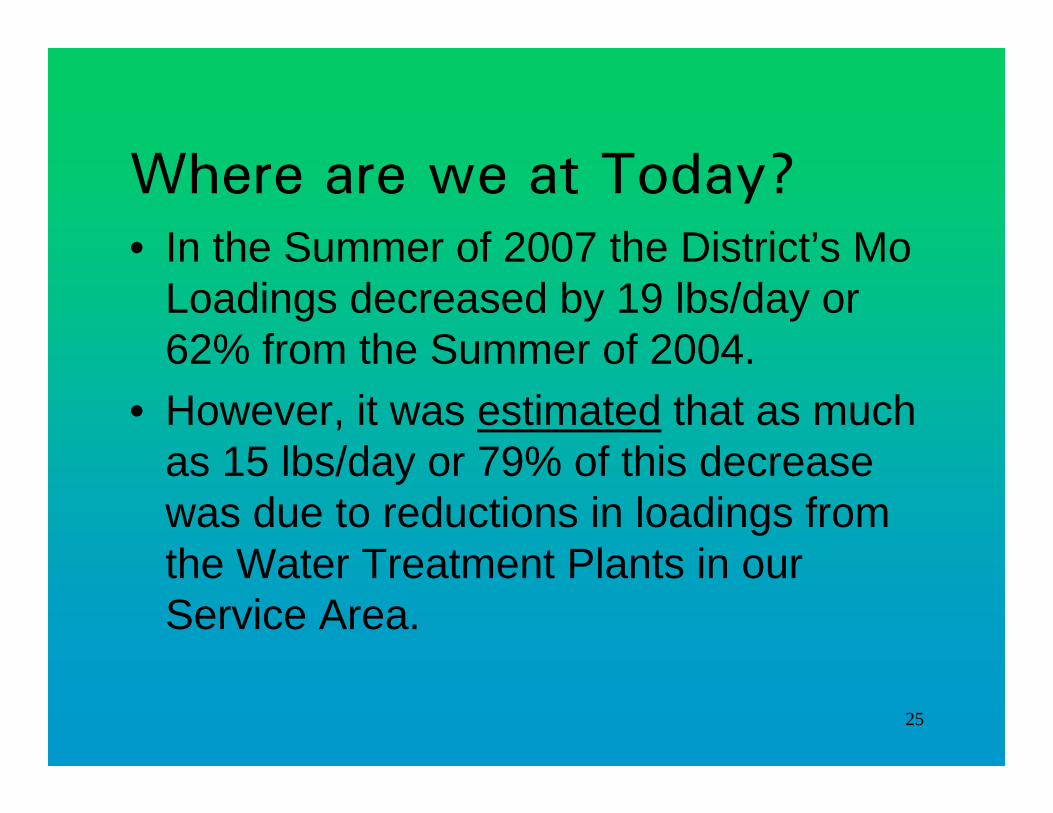
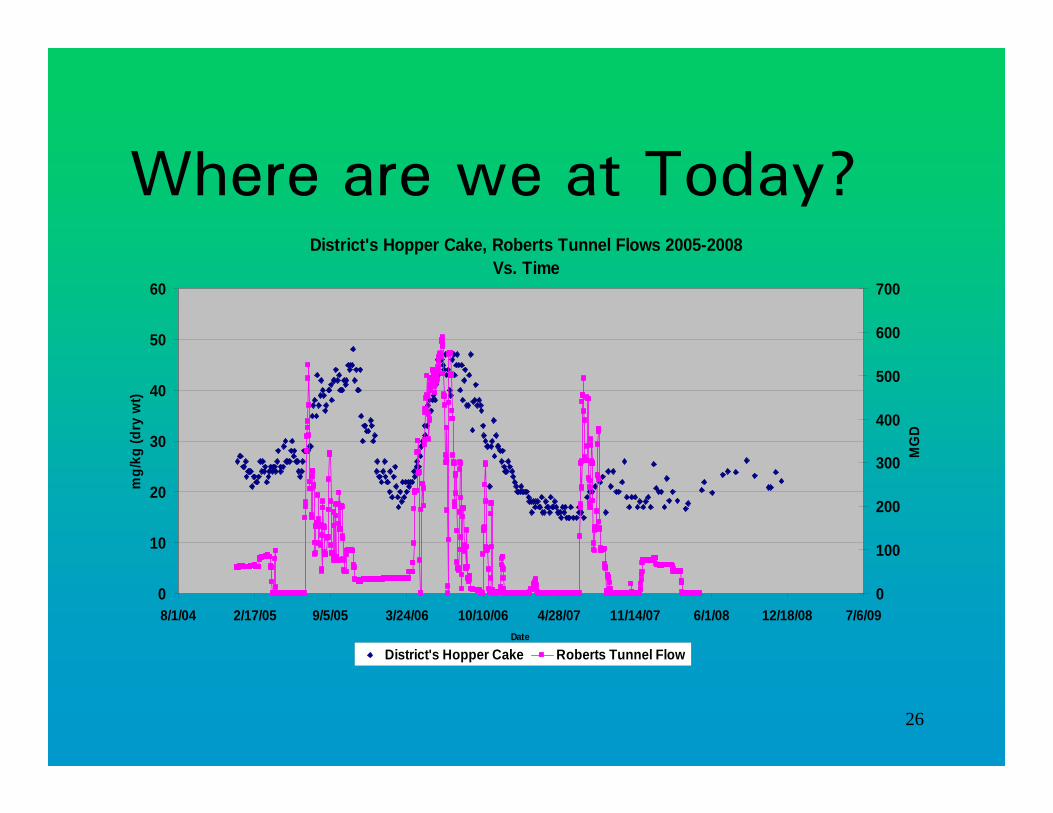
Where are we at Today?• In the Summer of 2007 the District’s Mo
Loadings decreased by 19 lbs/day or 62% from the Summer of 2004.
• However, it was estimated that as much as 15 lbs/day or 79% of this decrease was due to reductions in loadings from the Water Treatment Plants in our Service Area.
26
Where are we at Today?District's Hopper Cake, Roberts Tunnel Flows 2005-2008
Vs. Time
0
10
20
30
40
50
60
8/1/04 2/17/05 9/5/05 3/24/06 10/10/06 4/28/07 11/14/07 6/1/08 12/18/08 7/6/09Date
mg/
kg (d
ry w
t)
0
100
200
300
400
500
600
700
MG
D
District's Hopper Cake Roberts Tunnel Flow

27
Questions
?