molecular signatures to improve diagnosis in peripheral t-cell
TRANSCRIPT

LYMPHOID NEOPLASIA
Molecular signatures to improve diagnosis in peripheral T-cell lymphoma andprognostication in angioimmunoblastic T-cell lymphomaJaveed Iqbal,1 Dennis D. Weisenburger,1 Timothy C. Greiner,1 Julie M. Vose,2 Timothy McKeithan,2 Can Kucuk,1
Huimin Geng,1 Karen Deffenbacher,1 Lynette Smith,3 Karen Dybkaer,4 Shigeo Nakamura,5 Masao Seto,5 Jan Delabie,6
Francoise Berger,7 Florence Loong,8 Wing Y. Au,8 Young-Hyeh Ko,9 Ivy Sng,10 James Olen Armitage,2 andWing C. Chan,1 for the International Peripheral T-Cell Lymphoma Project
Departments of 1Pathology and Microbiology, 2Hematology/Oncology, and 3Preventive Medicine, University of Nebraska Medical Center, Omaha; 4Departmentof Hematology, Aalborg Hospital, Aarhus University Hospital, Aalborg, Denmark; 5Aichi Cancer Center, Nagoya, Japan; 6Norwegian Radium Hospital, Oslo;Norway; 7Centre Hospitalier Lyon-Sud, Lyon, France; 8Queen Mary Hospital, Hong Kong, China; 9Samsung Medical Center, Seoul, Korea; and 10SingaporeGeneral Hospital, Singapore
Peripheral T-cell lymphoma (PTCL) isoften challenging to diagnose and clas-sify. Gene expression profiling was per-formed on 144 cases of PTCL and natu-ral killer cell lymphoma and robustmolecular classifiers were constructedfor angioimmunoblastic T-cell lymphoma(AITL), anaplastic lymphoma kinase-positive (ALK�) anaplastic large-celllymphoma (ALCL), and adult T-cellleukemia/lymphoma. PTCL-unclassifiablewas molecularly heterogeneous, but wewere able to identify a molecular sub-group with features of cytotoxic T lympho-
cytes and a poor survival compared withthe remaining PTCL–not otherwise speci-fied cases. Many of the pathologic fea-tures and substantial components ofthe molecular signature of AITL are con-tributed by the follicular dendritic cells,B-cell, and other stromal components.The expression of Th17-associated mol-ecules in ALK� ALCL was noted andmay represent aberrant activation ofTh17-cell differentiation by abnormal cy-tokine secretion. Adult T-cell leukemia/lymphoma has a homogeneous molecu-lar signature demonstrating high
expression of human T-lymphotropic vi-rus type 1–induced genes. These classifi-ers reflect the biology of the tumor cellsas well as their microenvironment. Wealso constructed a molecular prognostica-tor for AITL that appears to be largelyrelated to the microenvironmental signa-ture, and the high expression of 2 immu-nosuppressive signatures are associatedwith poor outcome. Oncogenic pathwaysand tumor-host interactions also wereidentified, and these findings may lead tobetter therapies and outcome in the fu-ture. (Blood. 2010;115:1026-1036)
Introduction
Peripheral T-cell lymphoma (PTCL) and natural killer–cell lympho-mas (NKCLs) represent approximately 10% to 15% of all non-Hodgkin lymphoma in the western world but occur more fre-quently in Asia.1 The current World Health Organizationclassification recognizes several distinctive subtypes of PTCL,including angioimmunoblastic T-cell lymphoma (AITL), anaplas-tic large-cell lymphoma (ALCL), and adult T-cell leukemia/lymphoma (ATLL), as well as several rare entities that are mostlyextranodal.2 Some types of PTCL have a disease-defining abnormal-ity, such as the t(2;5)(p23;q35) in ALCL3 or human T-lymphotropicvirus 1 (HTLV1) integration in ATLL.4 However, the classificationof PTCL remains challenging, with 30% to 50% of cases classifiedas PTCL unclassifiable (PTCL-NOS [not otherwise specified]),even with current diagnostic approaches. It is also difficult toclassify most cases of PTCL according to the normal stages ofT-cell differentiation, and the expression of T-cell subset markers isof limited value in distinguishing clinically distinct entities.5,6 Withthe exception of ALCL, patients with PTCL generally have a poorprognosis with standard chemotherapy.7
We and others8 have shown that gene expression profiling(GEP) can identify biologically and clinically distinctive subgroups
of B-cell non-Hodgkin lymphoma. Several recent studies9-14 ofT-cell lymphomas, in which the investigators used small numbersof cases, have suggested that some PTCL subtypes have specificmolecular profiles or cellular backgrounds. The cell of origin ofAITL is now thought to be the follicular helper T cell (TFH),11,12 andPTCL-NOS has multiple molecular subgroups,10 frequent expres-sion of platelet-derived growth factor receptor-�,15 and characteris-tics of activated peripheral T lymphocytes.13 The association of ahigh-proliferation gene signature with a shorter survival also wasreported recently in nodal PTCL.14 The authors of recent stud-ies16,17 have reported the adhesion molecule TSLC1 as a possiblemolecular marker for ATLL and the role of TCF-4 in ATLL cellsurvival. Molecular studies of anaplastic lymphoma kinase-positive ALCL, or ALK� ALCL, and anaplastic lymphoma kinase-negative ALCL, or ALK� ALCL, have suggested that somepathogenetic mechanisms may be shared by these 2 entities.18,19
Although these preliminary findings are interesting, these studieswere limited by the small number of cases, and a more in-depthmolecular analysis of a large series of PTCL is warranted.
In this study, we performed GEP on 144 PTCL and NKCL to definemolecular classifiers for the more common entities, to identify unique
Submitted June 12, 2009; accepted September 1, 2009. Prepublished onlineas Blood First Edition paper, November 18, 2009; DOI 10.1182/blood-2009-06-227579.
An Inside Blood analysis of this article appears at the front of this issue.
The online version of this article contains a data supplement.
The publication costs of this article were defrayed in part by page chargepayment. Therefore, and solely to indicate this fact, this article is herebymarked ‘‘advertisement’’ in accordance with 18 USC section 1734.
© 2010 by The American Society of Hematology
1026 BLOOD, 4 FEBRUARY 2010 � VOLUME 115, NUMBER 5
For personal use only.on November 17, 2018. by guest www.bloodjournal.orgFrom

entities within PTCL-NOS, to elucidate unique tumor and microenviron-mental interactions and oncogenic pathways in AITL, and to construct amolecular prognosticator for AITL.
Methods
Tumor specimens and cell lines
The International PTCL project included a consortium of 22 institutionsthat has accessioned 1314 cases of PTCL and NKCL.7 We performed GEPon 144 lymphomas in this study, including AITL (n � 36), ALK� ALCL(n � 20), ALK� ALCL (n � 8), ATLL (n � 12), T/NKCL (n � 14),PTCL-NOS (n � 44), and other rare PTCL entities (n � 10) by usingcryopreserved tissue obtained at the time of diagnosis. The pathologyreview, diagnostic criteria, and clinical data for these cases have beendescribed.7 We also analyzed 25 of the144 cases for T-cell receptor gamma(TCR-�) gene rearrangement to estimate the proportion of tumor cells(Table 1).20 The Institutional Review Board of the University of NebraskaMedical Center approved this study. Patients provided informed consent inaccordandance with the Declaration of Helsinki.
We also profiled 9 NK-cell lines, 7 T-cell lines, normal resting andactivated T cells (CD4�, CD8�), and NK cells.21 The T-cell subsets werepurified through fluorescence-activated cell sorting; stimulated with anti-CD3, anti-CD28, and interleukin-12 (IL-12; BD Biosciences); and har-vested after 2, 8, 24, and 48 hours in culture for GEP. NKCL were includedfor comparative analysis to facilitate the construction of classifiers.
GEP
The methods for isolation and processing of RNA and acquisition of GEPraw data have been described previously.21 We used HG-U133 plus 2 arraysaccording to the manufacturer’s instructions (Affymetrix Inc).
Data analysis
The raw data were uploaded in BRB-ArrayTools (version 3.7.0)22 fornormalization and supervised and unsupervised analysis. Consensus cluster-ing (CC)23 by the use of hierarchical clustering (HC), K-mean clustering(KM), and self-organizing map (SOM) was applied to identify a “core”group of cases from pathologically defined PTCL entities. Classifiers for thePTCL entities were constructed by use of the Bayesian algorithm,22,24
which estimated the probability of a case belonging to 1 subtype of PTCLcompared with other PTCLs. In our series, genes were selected atsignificance (P � .001) and a mean fold-difference (� 4) between the2 groups for Bayesian classification. We arbitrarily chose a 90% or greaterprobability as the cutoff to classify cases, but also examined 70% or greateras a secondary threshold because of the variable number of neoplastic cells,especially in AITL. Classification precision was evaluated by the use ofleave-one-out cross-validation.22,25 Supervised analysis with SAM26 andGSEA27 software programs was used to identify genes and pathways/signatures associated with PTCL subgroups. The microarray data have been
deposited in NCBI’s Gene Expression Omnibus and are accessible throughGEO Series accession number GSE19069.
Developing a molecular prognosticator for AITL
A prognosticator was constructed by use of the methodology described byBair and Tibshirani28 with minor modifications. We first identified differen-tially expressed genes (P � .05) between cases having an overall survival(OS) less than or greater than 3 years. The selected genes were used in theprincipal component analysis, and the first 2 principal components wereselected for Cox regression. To evaluate the predictive value of the model,leave-one-out cross-validation was used. The OS distributions were esti-mated by use of the Kaplan-Meier method.
Clinical correlations
The log-rank test was used to compare the survival distributions betweenPTCL entities.7 The International Prognostic Index (IPI),29 the PrognosticModel for PTCL-NOS (PIT),30 and Ki-67 mRNA expression (measuredfrom HG-U133 plus 2 arrays) also were correlated with overall survival(OS) and event-free survival (EFS). The Fisher exact test was used toanalyze categorical data, and the Wilcoxon rank sum test was used toanalyze continuous data between groups. Post-hoc tests were adjusted formultiple comparisons by use of the Bonferroni method. SAS software wasused for data analysis (SAS Institute Inc).
Evaluation of reclassified cases
The cases reclassified by the molecular classifier were re-reviewed (byD.D.W., T.C.G, and W.C.C.). Additional immunostains, Southern blots forHTLV1 integration, TCR-� gene rearrangement, and fluorescence in situhybridization (FISH) analysis for the t(2;5) were performed when feasibleto evaluate the diagnoses in these cases.
Results
Patient characteristics
A consensus diagnosis for each case was made by a panel of experthematopathologists, who also evaluated the cases for the percent-age of transformed cells present. The distinct PTCL entities in thisstudy and their clinical characteristics are summarized in Table1 and supplemental Table 1 (available on the Blood website; see theSupplemental Materials link at the top of the online article).Approximately one-half of the cases were diagnosed as AITL(n � 36) or PTCL-NOS (n � 44). The median age of patients in these2 groups was 65 years; however, patients in the ALK� ALCL andNKCL groups had much younger median ages (26.5 and 33 years,respectively). The OS and EFS are similar for patients with AITLand PTCL-NOS. As expected, patients with ALK� ALCL had the
Table 1. Clinical characteristics according to their pathologic diagnosis
Pathologicdiagnosis No. cases Male/female ratio
Median age,y (range)
Median transformed (large) T cells,% (range)*
TCR-� gene rearrangementby PCR
AITL 36 1.8 65 (43-87) 30 (12-59) 3/3
ALK� ALCL 20 1.0 27 (12-43) 90 (50-95) 5/8
ALK � ALCL 8 3.0 64 (45-86) 89 (85-94) 2/4
ATLL 12 5.0 60 (47-80) 45 (17-80) ND
T/NKCL 14 0.70 33 (28-72) NA NA
PTCL-NOS 44 2.1 65 (18-65) 58 (7-94) 9/10
Not included in this analysis are other 10 cases of PTCL rare entities, including hepatosplenic T-cell lymphoma, mycosis fungoides, enteropathy-associated T-celllymphoma, and T-cell prolymphocytic leukemia.
AITL indicates angioimmunoblastic T-cell lymphoma; ALCL, anaplastic large-cell lymphoma; ALK, anaplastic lymphoma kinase; ATLL, adult T-cell leukemia/lymphoma;NA, not available; ND, not determined; PCR, polymerase chain reaction; PTCL-NOS, peripheral T-cell lymphoma–not otherwise specified; TCR-�, T-cell receptor-�; andT/NKCL, T-/natural killer-cell lymphomas.
*Average calculated from 4 pathologists.
MOLECULAR SIGNATURES IN PTCL 1027BLOOD, 4 FEBRUARY 2010 � VOLUME 115, NUMBER 5
For personal use only.on November 17, 2018. by guest www.bloodjournal.orgFrom
best 5-year OS (� 70%), and those with ATLL had the worst OS(� 10%; supplemental Figure 1A-B). Similar trends were observedfor EFS analysis. High IPI3-5 and PIT2-4 scores were significantlyassociated with poor OS (P � .001 and P � .008, respectively) andEFS (P � .001 and P � .028, respectively) when PTCL cases wereanalyzed as a single group and for the PTCL-NOS group (supple-mental Figure 1C-J). High Ki-67 mRNA expression also showedmarginal association with worse OS (P � .07) when cases weredivided into quartiles according to their Ki-67 transcript level(supplemental Figure 1K). The initial therapeutic approachesvaried widely in these cases, but the majority (� 60%) with themost common PTCL subtypes received CHOP (ie, cyclophospha-mide, doxorubicin, vincristine, and prednisone) or CHOP-likeregimens (supplemental Table 1).
Correlation of gene expression with the pathologic diagnosis
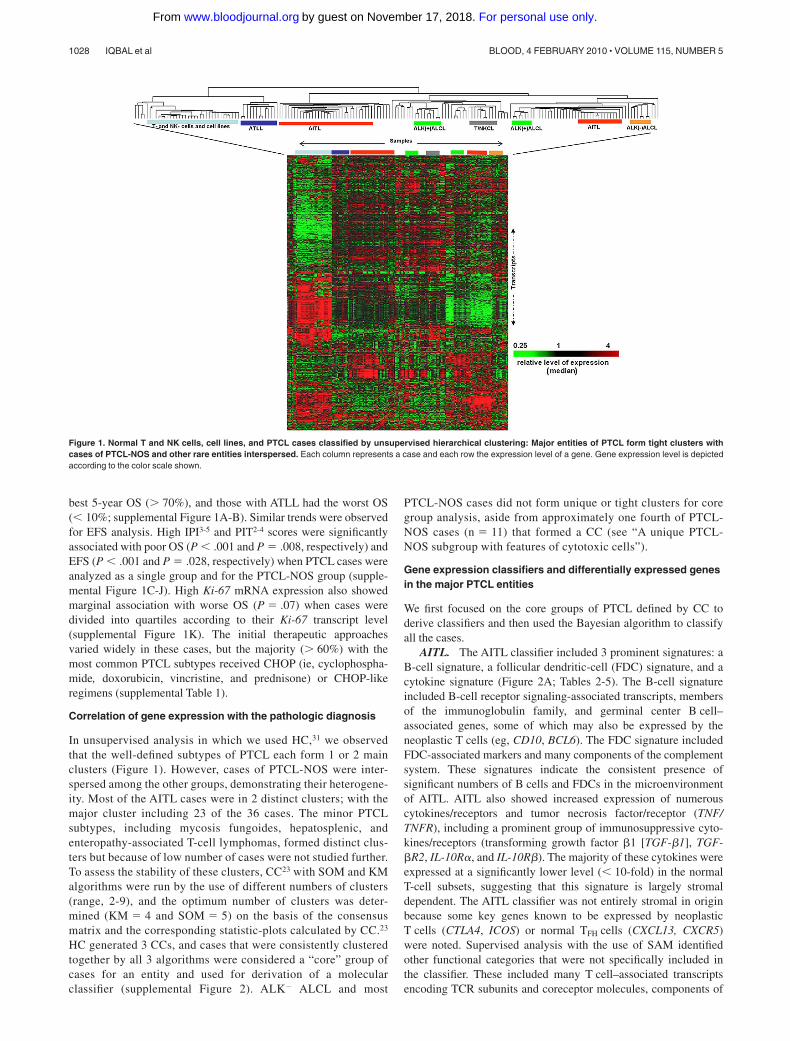
In unsupervised analysis in which we used HC,31 we observedthat the well-defined subtypes of PTCL each form 1 or 2 mainclusters (Figure 1). However, cases of PTCL-NOS were inter-spersed among the other groups, demonstrating their heterogene-ity. Most of the AITL cases were in 2 distinct clusters; with themajor cluster including 23 of the 36 cases. The minor PTCLsubtypes, including mycosis fungoides, hepatosplenic, andenteropathy-associated T-cell lymphomas, formed distinct clus-ters but because of low number of cases were not studied further.To assess the stability of these clusters, CC23 with SOM and KMalgorithms were run by the use of different numbers of clusters(range, 2-9), and the optimum number of clusters was deter-mined (KM � 4 and SOM � 5) on the basis of the consensusmatrix and the corresponding statistic-plots calculated by CC.23
HC generated 3 CCs, and cases that were consistently clusteredtogether by all 3 algorithms were considered a “core” group ofcases for an entity and used for derivation of a molecularclassifier (supplemental Figure 2). ALK� ALCL and most
PTCL-NOS cases did not form unique or tight clusters for coregroup analysis, aside from approximately one fourth of PTCL-NOS cases (n � 11) that formed a CC (see “A unique PTCL-NOS subgroup with features of cytotoxic cells”).
Gene expression classifiers and differentially expressed genesin the major PTCL entities
We first focused on the core groups of PTCL defined by CC toderive classifiers and then used the Bayesian algorithm to classifyall the cases.
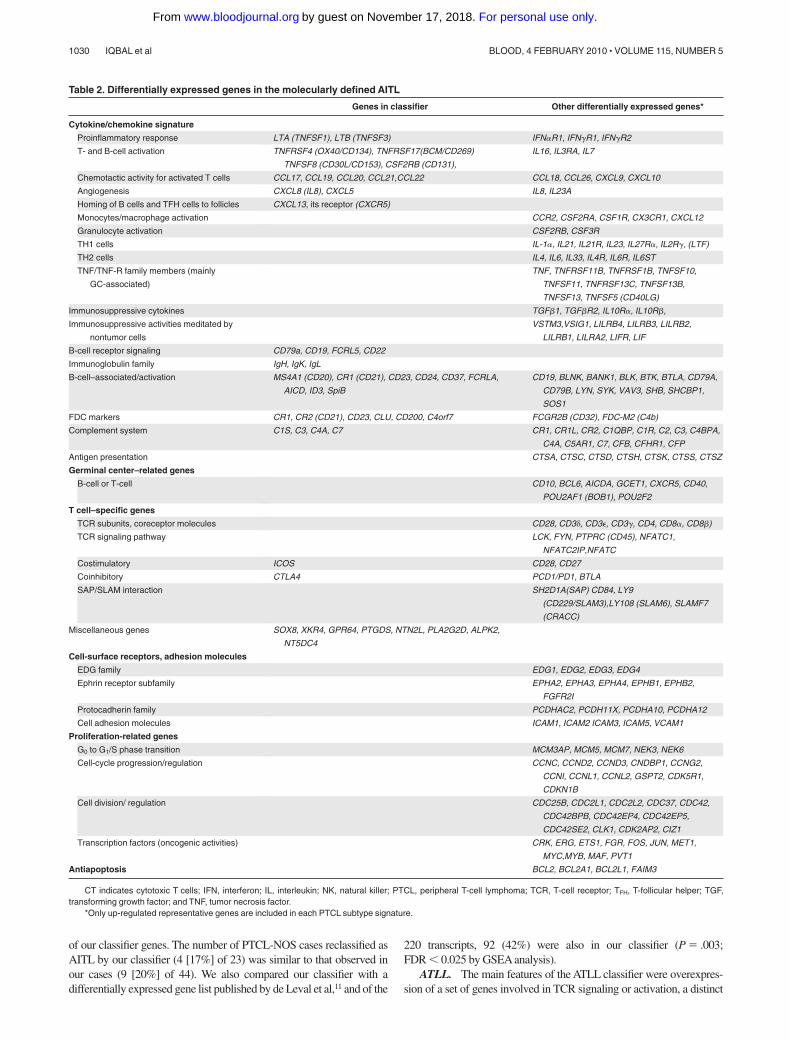
AITL. The AITL classifier included 3 prominent signatures: aB-cell signature, a follicular dendritic-cell (FDC) signature, and acytokine signature (Figure 2A; Tables 2-5). The B-cell signatureincluded B-cell receptor signaling-associated transcripts, membersof the immunoglobulin family, and germinal center B cell–associated genes, some of which may also be expressed by theneoplastic T cells (eg, CD10, BCL6). The FDC signature includedFDC-associated markers and many components of the complementsystem. These signatures indicate the consistent presence ofsignificant numbers of B cells and FDCs in the microenvironmentof AITL. AITL also showed increased expression of numerouscytokines/receptors and tumor necrosis factor/receptor (TNF/TNFR), including a prominent group of immunosuppressive cyto-kines/receptors (transforming growth factor �1 [TGF-�1], TGF-�R2, IL-10R�, and IL-10R�). The majority of these cytokines wereexpressed at a significantly lower level (� 10-fold) in the normalT-cell subsets, suggesting that this signature is largely stromaldependent. The AITL classifier was not entirely stromal in originbecause some key genes known to be expressed by neoplasticT cells (CTLA4, ICOS) or normal TFH cells (CXCL13, CXCR5)were noted. Supervised analysis with the use of SAM identifiedother functional categories that were not specifically included inthe classifier. These included many T cell–associated transcriptsencoding TCR subunits and coreceptor molecules, components of
Figure 1. Normal T and NK cells, cell lines, and PTCL cases classified by unsupervised hierarchical clustering: Major entities of PTCL form tight clusters withcases of PTCL-NOS and other rare entities interspersed. Each column represents a case and each row the expression level of a gene. Gene expression level is depictedaccording to the color scale shown.
1028 IQBAL et al BLOOD, 4 FEBRUARY 2010 � VOLUME 115, NUMBER 5
For personal use only.on November 17, 2018. by guest www.bloodjournal.orgFrom

the TCR signaling pathway, costimulatory and coinhibitory mol-ecules, and molecules critical for bidirectional T- and B-cellinteraction, including SH2D1A(SAP) and SAP-associated recep-tors. Other transcripts were mainly involved in proliferation,angiogenesis, and tumor cell survival (Table 2).
GSEA showed significant enrichment of several pathways(supplemental Table 2) that may be of therapeutic importance,including: (1) nuclear factor (NF)-B pathway: To validate thisobservation, we independently selected 10 representative NF-Btarget genes in T cells for evaluation. According to this 10-genesignature, AITL cases tended to have an activated NF-kB pathwaycompared with PTCL-NOS (P � .001; supplemental Figure 3A).(2) Immunosuppressive pathways: Genes that target the function ofDCs, directly or indirectly, and ligands secreted by tolerogenic DCswere highly expressed. Furthermore, TGF-� pathway–associatedgenes and other gene signatures linked with immunosuppressionwere enriched. (3) IL-6 signaling: IL-6 has diverse functions and isinvolved in TFH-cell, Epstein-Barr virus (EBV)–infected B-cellproliferation, and T-cell subset differentiation (reviewed by Rose-John et al32). The other gene signatures associated with angiogen-esis (vascular endothelial growth factor pathway) and DNAdamage or genotoxic response also showed significant enrichmentin this entity.
Although the pathology review generally showed less than 30%large neoplastic T cells (median � 28.5), gene signatures associ-ated with several T-cell subsets were noted. Consistent with
previous findings,11,12,33 the gene signature of TFH cells34,35 wassignificantly enriched in AITL. The TFH signature was not ex-pressed by other normal T-cell subsets (supplemental Figure 3B),and no enrichment was observed in cases not classified as AITL bythe GEP classifier.
The classifier identified 6 of the 13 noncore AITL cases, 9 of44 PTCL-NOS, and 2 ATLL cases as AITL. Seven cases classified bypathology asAITL were not similarly characterized molecularly (Figure2D). The reclassified cases of PTCL-NOS were compatible with AITLmorphologically upon review in 6 of the 7 cases. The cases were notinitially classified pathologically asAITL because they exhibited certainatypical features such as prominent germinal centers, lower vascularproliferation, low Epstein-Barr encoded RNA (EBER) positivity ornegative for CD10, and/or CD21 expression. The 2 ATLL cases thatwere reclassified as AITL did not show HTLV1 integration in Southernblots. The pathology-defined AITL cases that were not characterizedmolecularly as AITL frequently demonstrated a greater proportion ofeosinophils and low EBERs or CD21 positivity (1 of 5 and 0 of4, respectively). The median number of large transformed cells in thesetumors upon morphologic review was lower than the molecularlydefined subgroup 16% (range, 10%-25%), suggesting a lower numberof tumor cells.
We applied our AITL classifier to a published set of pathologicallydiagnosed cases of AITL (n � 6) and PTCL-NOS (n � 28).12 By usinghierarchical clustering, we observed that 5 of the 6 cases of AITL and4 of 23 PTCL-NOS cases formed a distinct cluster with high expression
Figure 2. Gene expression–based molecular predictors of the major subgroups of PTCL. (A) AITL, (B) ATLL, and (C) ALK� ALCL. (D) The correlation between themolecular and the pathology-based diagnoses is illustrated on the right.
MOLECULAR SIGNATURES IN PTCL 1029BLOOD, 4 FEBRUARY 2010 � VOLUME 115, NUMBER 5
For personal use only.on November 17, 2018. by guest www.bloodjournal.orgFrom
of our classifier genes. The number of PTCL-NOS cases reclassified asAITL by our classifier (4 [17%] of 23) was similar to that observed inour cases (9 [20%] of 44). We also compared our classifier with adifferentially expressed gene list published by de Leval et al,11 and of the
220 transcripts, 92 (42%) were also in our classifier (P � .003;FDR � 0.025 by GSEA analysis).
ATLL. The main features of the ATLL classifier were overexpres-sion of a set of genes involved in TCR signaling or activation, a distinct
Table 2. Differentially expressed genes in the molecularly defined AITL
Genes in classifier Other differentially expressed genes*
Cytokine/chemokine signature
Proinflammatory response LTA (TNFSF1), LTB (TNFSF3) IFN�R1, IFN�R1, IFN�R2
T- and B-cell activation TNFRSF4 (OX40/CD134), TNFRSF17(BCM/CD269)
TNFSF8 (CD30L/CD153), CSF2RB (CD131),
IL16, IL3RA, IL7
Chemotactic activity for activated T cells CCL17, CCL19, CCL20, CCL21,CCL22 CCL18, CCL26, CXCL9, CXCL10
Angiogenesis CXCL8 (IL8), CXCL5 IL8, IL23A
Homing of B cells and TFH cells to follicles CXCL13, its receptor (CXCR5)
Monocytes/macrophage activation CCR2, CSF2RA, CSF1R, CX3CR1, CXCL12
Granulocyte activation CSF2RB, CSF3R
TH1 cells IL-1�, IL21, IL21R, IL23, IL27R�, IL2R�, (LTF)
TH2 cells IL4, IL6, IL33, IL4R, IL6R, IL6ST
TNF/TNF-R family members (mainly
GC-associated)
TNF, TNFRSF11B, TNFRSF1B, TNFSF10,
TNFSF11, TNFRSF13C, TNFSF13B,
TNFSF13, TNFSF5 (CD40LG)
Immunosuppressive cytokines TGF�1, TGF�R2, IL10R�, IL10R�,
Immunosuppressive activities meditated by
nontumor cells
VSTM3,VSIG1, LILRB4, LILRB3, LILRB2,
LILRB1, LILRA2, LIFR, LIF
B-cell receptor signaling CD79a, CD19, FCRL5, CD22
Immunoglobulin family IgH, IgK, IgL
B-cell–associated/activation MS4A1 (CD20), CR1 (CD21), CD23, CD24, CD37, FCRLA,
AICD, ID3, SpiB
CD19, BLNK, BANK1, BLK, BTK, BTLA, CD79A,
CD79B, LYN, SYK, VAV3, SHB, SHCBP1,
SOS1
FDC markers CR1, CR2 (CD21), CD23, CLU, CD200, C4orf7 FCGR2B (CD32), FDC-M2 (C4b)
Complement system C1S, C3, C4A, C7 CR1, CR1L, CR2, C1QBP, C1R, C2, C3, C4BPA,
C4A, C5AR1, C7, CFB, CFHR1, CFP
Antigen presentation CTSA, CTSC, CTSD, CTSH, CTSK, CTSS, CTSZ
Germinal center–related genes
B-cell or T-cell CD10, BCL6, AICDA, GCET1, CXCR5, CD40,
POU2AF1 (BOB1), POU2F2
T cell–specific genes
TCR subunits, coreceptor molecules CD28, CD3�, CD3�, CD3�, CD4, CD8�, CD8�)
TCR signaling pathway LCK, FYN, PTPRC (CD45), NFATC1,
NFATC2IP,NFATC
Costimulatory ICOS CD28, CD27
Coinhibitory CTLA4 PCD1/PD1, BTLA
SAP/SLAM interaction SH2D1A(SAP) CD84, LY9
(CD229/SLAM3),LY108 (SLAM6), SLAMF7
(CRACC)
Miscellaneous genes SOX8, XKR4, GPR64, PTGDS, NTN2L, PLA2G2D, ALPK2,
NT5DC4
Cell-surface receptors, adhesion molecules
EDG family EDG1, EDG2, EDG3, EDG4
Ephrin receptor subfamily EPHA2, EPHA3, EPHA4, EPHB1, EPHB2,
FGFR2I
Protocadherin family PCDHAC2, PCDH11X, PCDHA10, PCDHA12
Cell adhesion molecules ICAM1, ICAM2 ICAM3, ICAM5, VCAM1
Proliferation-related genes
G0 to G1/S phase transition MCM3AP, MCM5, MCM7, NEK3, NEK6
Cell-cycle progression/regulation CCNC, CCND2, CCND3, CNDBP1, CCNG2,
CCNI, CCNL1, CCNL2, GSPT2, CDK5R1,
CDKN1B
Cell division/ regulation CDC25B, CDC2L1, CDC2L2, CDC37, CDC42,
CDC42BPB, CDC42EP4, CDC42EP5,
CDC42SE2, CLK1, CDK2AP2, CIZ1
Transcription factors (oncogenic activities) CRK, ERG, ETS1, FGR, FOS, JUN, MET1,
MYC,MYB, MAF, PVT1
Antiapoptosis BCL2, BCL2A1, BCL2L1, FAIM3
CT indicates cytotoxic T cells; IFN, interferon; IL, interleukin; NK, natural killer; PTCL, peripheral T-cell lymphoma; TCR, T-cell receptor; TFH, T-follicular helper; TGF,transforming growth factor; and TNF, tumor necrosis factor.
*Only up-regulated representative genes are included in each PTCL subtype signature.
1030 IQBAL et al BLOOD, 4 FEBRUARY 2010 � VOLUME 115, NUMBER 5
For personal use only.on November 17, 2018. by guest www.bloodjournal.orgFrom

set of genes previously reported to be expressed in HTLV1-induced celllines orATLLcases,17,16 and a group of genes associated with melanoma(Figure 2B; Table 3). ATLL did not show an elaborate cytokine profilelike AITL, but there was high expression of several cytokines andcytokine receptors involved in T-cell activation and differentiation andrecruitment of Treg cells. Of these, CCR4, CCL13, and IL23R wereincluded in the diagnostic signature. Interestingly, CCR4 protein hasbeen shown to be significantly associated with ATLL,36 and it has beenproposed as a target for immunotherapy.37 Several inhibitory molecules(TIGIT/VSTM3,38 CTLA4) and immunomodulatory genes involved inthe production of prostanoids (PTGER4, PTGER3, PGDS [hematopoi-etic])39 that promote immunosuppression were also up-regulated. HTLV1TAX targets such as IRF4, ATF1, CREB1, NF-�B1, and MYB and theirtarget genes showed high expression in ATLL. GSEA revealed theenrichment of TCR signaling genes, a known gene-signature reported inATLL,17 target genes of the transcription factor retinoic acid receptor-�,and mature CD4� T-cell signature but notTreg-related genes (supplemen-tal Table 3).
By use of this classifier, 3 of the PTCL-NOS cases werereclassified as ATLL. These cases were from HTLV1 endemic areaswith seropositivity and positive polymerase chain reaction amplifi-cation of the viral pX genomic region encoding TAX. However, noclonal integration of HTLV1 DNA was observed by Southernblot.40 These 3 patients died within 3 years from initial diagnosis(range, 0.5-3.0 years) and therefore had a poor prognosis similar tothat of ATLL patients in general.7
ALK� ALCL and ALK� ALCL. Among the top-ranked genes inour classifier were ALK, TNFRSF8(CD30), MUC1, Th17-cell–associated molecules (IL-17A, IL-17F, retinoic acid receptor–related
orphan receptor [ROR]-�), and a small group of immunoregulatorycytokines/receptors regulating STAT3 (IL-26, IL-31RA) or JAK3 (IL-9)activation (Figure 2C; Table 4). There was low expression of transcriptsrelated to TCR components and TCR signaling or activation but highexpression of the cytotoxic molecules GZMB and PRF1. There was lowexpression of GATA3, which negatively regulates Th17-cell differentia-tion.41 GSEA revealed significant enrichment of STAT3, BCL3, ESR1,and ETS1 target signatures but marginal enrichment of the ALKsignature (52 transcripts) derived from ALCL cell lines by Piva et al42
(supplemental Table 4; supplemental Figure 4).The ALK� ALCL classifier identified 15 of 20 pathologically
diagnosed ALK � cases with greater than 90% probability. The other5 ALK� ALCL cases were either negative for TCR-� gene rearrange-ment by polymerase chain reaction (n � 3) or had very low expressionof CD30, suggesting that these samples had a low number of neoplasticcells. Two ALK� ALCL cases had a greater than 80% probability ofbeing ALK� ALCL (supplemental Figure 4B) and showed highexpression of CD30, JAK3, and STAT3 and low expression of TCRtranscripts. These 2 cases also showed slightly increased ( 1.5-fold)expression of ALK transcripts compared with the other PTCLs.However, FISH analysis of the cases did not reveal the t(2;5) transloca-tion or a variant translocation.
The ALK� ALCL cases did not form a unique CC, although GEPanalysis showed significant differences from ALK� ALCL and PTCL-NOS. Compared with PTCL-NOS, genes associated with TCR signal-ing were expressed at a lower level, whereas 2 cytokines, IL-20, whichpromotes angiogenesis, and IL-9, which activates Jak3, were highlyexpressed. Compared with ALK� ALCL, lower expression of ALK,cytotoxic molecules (PRF1, GZMB), cathepsins (CTS-W, -D, -L1, -B),
Table 3. Differentially expressed genes in the molecularly defined ATLL
Genes in classifier Other differentially expressed genes
TCR signaling components and
costimulatory/inhibitory
molecules
TCR�, TCR�, CD1�, CTLA4, CD99, TRAC ICOS, CD28, CD1B, CD1C, CD6, LAT, FYN, FYB
T-cell activation or differentiation TNFRSF25(DR3), CD27, LEF1, NFATC1 IL2RA (CD25), IL4R, IL18R1, IL23R,IL12RB2, MAL, IL4R, GATA3
Proinflammatory CCR4, CCL13, IL23R IL6, IL6ST, CCL26
Melanoma-associated MAGEA4, MAGEA9, MAGEA4B MAGEB1, MAGEA3
Immune modulatory enzymes PGDS (hematopoietic) PTGER4, PTGER3
B cells AICDA, MTA3
Previously published genes
associated with ATLL
IKZF2, RGS13, PTHLH, RGS13, CADM1(TSLC1) TCF4
HTLV-1 Tax target c-Myc, TIAM1, PDE8B, DOK5, ARNT2, UST, PGDSMYCN,
PDE8B, CEBPA, RGS13, PTHLH, SMARCA2, CD99,
CADM1(TSLC1),CCR4, RGS2, SPINK2, RORA
IL2RA, CFLAR
Treg cell chemoattractant CCL22, CCL20, CCL17
Cytotoxic molecules TIA1
For abbreviations, see Table 2.*Only up-regulated representative genes are included in each signature.
Table 4. Differentially expressed genes in the molecularly defined ALK� ALCL
Genes in classifier Other differentially expressed genes
Classical ALCL markers ALK, CD30, MUC1
Immunoregulatory cytokines IL26, IL31RA, IL9, IL1R2 IL20, IL22, IL2RA, IL1RAP, IL1R1
TH17-cell–associated IL17A, IL17F, ROR�
Proliferation-related CCNA1, AGT, PDE4DIP, UPK1B CDC27, FGF5, FOSL2
Genes noted in other tumors RRAD, RAR�, NRCAM, TMEM158, CA12 VCAN, TNFRSF12A
STAT3 regulation targets SERPINB3, SERPINB4 SOCS1, SOCS3
Cytotoxic molecules PRF1, GZMB
Immunosuppressive response LILRA3
For abbreviations, see Table 2.*Only representative genes are included in each signature.
MOLECULAR SIGNATURES IN PTCL 1031BLOOD, 4 FEBRUARY 2010 � VOLUME 115, NUMBER 5
For personal use only.on November 17, 2018. by guest www.bloodjournal.orgFrom
TH17-cell–associated molecules (IL-17-F, -A, ROR�), and B cell–associated transcripts (Ig-H, -K, -L) was noted. However, ALK� ALCLshowed greater expression of a set of cytokine/receptors (CCL1,CCL22, CCR8, CCR4, IL-13RA2, CXCL14, TGF-�R1) and severalantiapoptotic factors (BCL2, BIRC6, BIC) but low expression of certainproapoptotic genes (BAX, BCL2L1, BNIP3). GSEA analysis showed nosignificant enrichment of STAT3 and BCL3 target genes in ALK�
ALCL compared with ALK� ALCL (supplemental Figure 5A-C).Despite these differences, we were not able to derive a robust classifierfor ALK� ALCL, most likely related to the limited number of casesavailable for study.
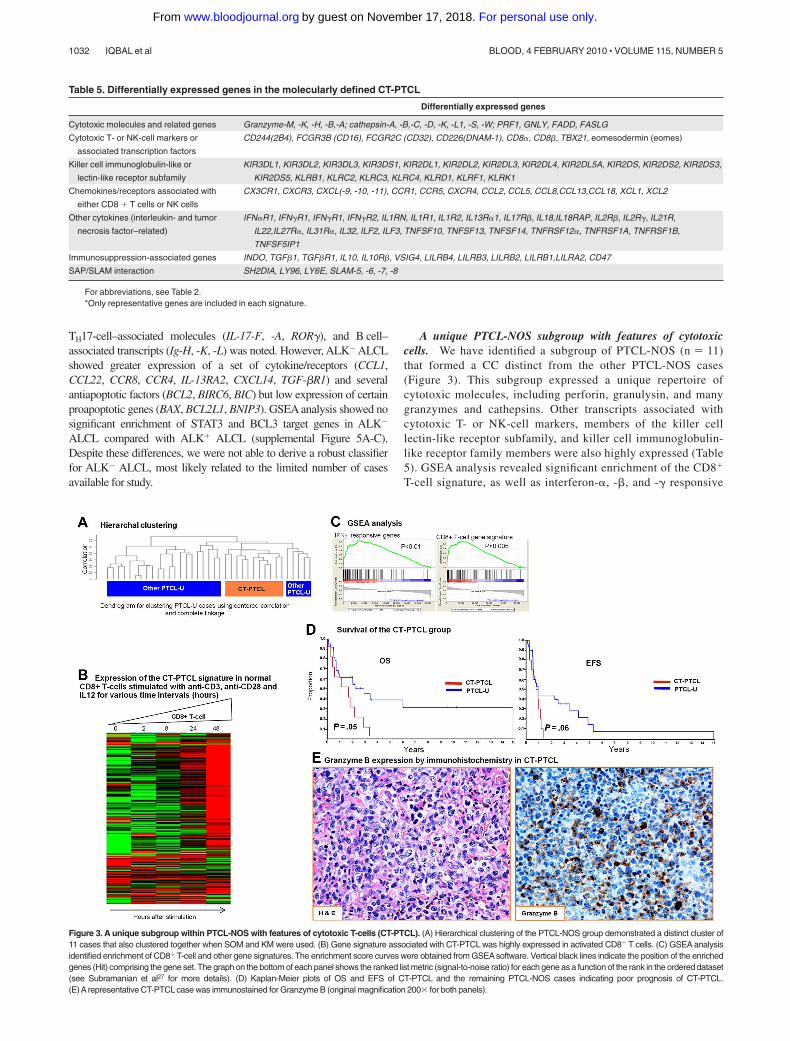
A unique PTCL-NOS subgroup with features of cytotoxiccells. We have identified a subgroup of PTCL-NOS (n � 11)that formed a CC distinct from the other PTCL-NOS cases(Figure 3). This subgroup expressed a unique repertoire ofcytotoxic molecules, including perforin, granulysin, and manygranzymes and cathepsins. Other transcripts associated withcytotoxic T- or NK-cell markers, members of the killer celllectin-like receptor subfamily, and killer cell immunoglobulin-like receptor family members were also highly expressed (Table5). GSEA analysis revealed significant enrichment of the CD8�
T-cell signature, as well as interferon-�, -�, and -� responsive
Figure 3. A unique subgroup within PTCL-NOS with features of cytotoxic T-cells (CT-PTCL). (A) Hierarchical clustering of the PTCL-NOS group demonstrated a distinct cluster of11 cases that also clustered together when SOM and KM were used. (B) Gene signature associated with CT-PTCL was highly expressed in activated CD8� T cells. (C) GSEA analysisidentified enrichment of CD8� T-cell and other gene signatures. The enrichment score curves were obtained from GSEAsoftware. Vertical black lines indicate the position of the enrichedgenes (Hit) comprising the gene set. The graph on the bottom of each panel shows the ranked list metric (signal-to-noise ratio) for each gene as a function of the rank in the ordered dataset(see Subramanian et al27 for more details). (D) Kaplan-Meier plots of OS and EFS of CT-PTCL and the remaining PTCL-NOS cases indicating poor prognosis of CT-PTCL.(E)Arepresentative CT-PTCL case was immunostained for Granzyme B (original magnification 200� for both panels).
Table 5. Differentially expressed genes in the molecularly defined CT-PTCL
Differentially expressed genes
Cytotoxic molecules and related genes Granzyme-M, -K, -H, -B,-A; cathepsin-A, -B,-C, -D, -K, -L1, -S, -W; PRF1, GNLY, FADD, FASLG
Cytotoxic T- or NK-cell markers or
associated transcription factors
CD244(2B4), FCGR3B (CD16), FCGR2C (CD32), CD226(DNAM-1), CD8�, CD8�, TBX21, eomesodermin (eomes)
Killer cell immunoglobulin-like or
lectin-like receptor subfamily
KIR3DL1, KIR3DL2, KIR3DL3, KIR3DS1, KIR2DL1, KIR2DL2, KIR2DL3, KIR2DL4, KIR2DL5A, KIR2DS, KIR2DS2, KIR2DS3,
KIR2DS5, KLRB1, KLRC2, KLRC3, KLRC4, KLRD1, KLRF1, KLRK1
Chemokines/receptors associated with
either CD8 � T cells or NK cells
CX3CR1, CXCR3, CXCL(-9, -10, -11), CCR1, CCR5, CXCR4, CCL2, CCL5, CCL8,CCL13,CCL18, XCL1, XCL2
Other cytokines (interleukin- and tumor
necrosis factor–related)
IFN�R1, IFN�R1, IFN�R1, IFN�R2, IL1RN, IL1R1, IL1R2, IL13R�1, IL17R�, IL18,IL18RAP, IL2R�, IL2R�, IL21R,
IL22,IL27R�, IL31R�, IL32, ILF2, ILF3, TNFSF10, TNFSF13, TNFSF14, TNFRSF12�, TNFRSF1A, TNFRSF1B,
TNFSF5IP1
Immunosuppression-associated genes INDO, TGF�1, TGF�R1, IL10, IL10R�, VSIG4, LILRB4, LILRB3, LILRB2, LILRB1,LILRA2, CD47
SAP/SLAM interaction SH2DIA, LY96, LY6E, SLAM-5, -6, -7, -8
For abbreviations, see Table 2.*Only representative genes are included in each signature.
1032 IQBAL et al BLOOD, 4 FEBRUARY 2010 � VOLUME 115, NUMBER 5
For personal use only.on November 17, 2018. by guest www.bloodjournal.orgFrom
genes, genes down-regulated by rapamycin (deregulated mam-malian target of rapamycin pathway), and several gene signa-tures associated with granule secretion. The 2 key transcriptionfactors for CD8� T cells, T-bet (TBX21) and eomesodermin-(eomes), and their known target genes (CXCR3, IL-2RB, CCL3,interferon-�) also showed greater expression in this subgroup.The overall gene signature associated with this subgroupshowed marked up-regulation in normal activated CD8� T cellscompared with their resting counterparts. This sub-group also expressed a distinct set of cytokines/receptors, themajority of which show high expression in normal CD8� T cellsand NK cells. Unexpectedly, these cases also showed an elabo-rate immunosuppressive gene signature and transcripts associ-ated with SAP/SLAM interaction like AITL. However, theprominent B-cell and FDC signatures were not observed.
Immunohistochemical data could be obtained in several of thesecases and validated expression of T-cell markers (CD3� [6 of 6]and TCR-��� [2 of 4]) and cytotoxic molecules, including TIA(4 of 5) and granzyme B (3 of 4; Figure 3E). Interestingly, morecases were CD4� (6 of 11) than CD8� (3 of 11), indicating thatCD8 expression is not a sufficient marker for identifying thesecases. Necrosis was not prominent in these cases. The patients inthis group had a worse OS (P � .05) and EFS (P � .06) comparedwith the other PTCL-NOS cases.
Molecular prognosticator for AITL
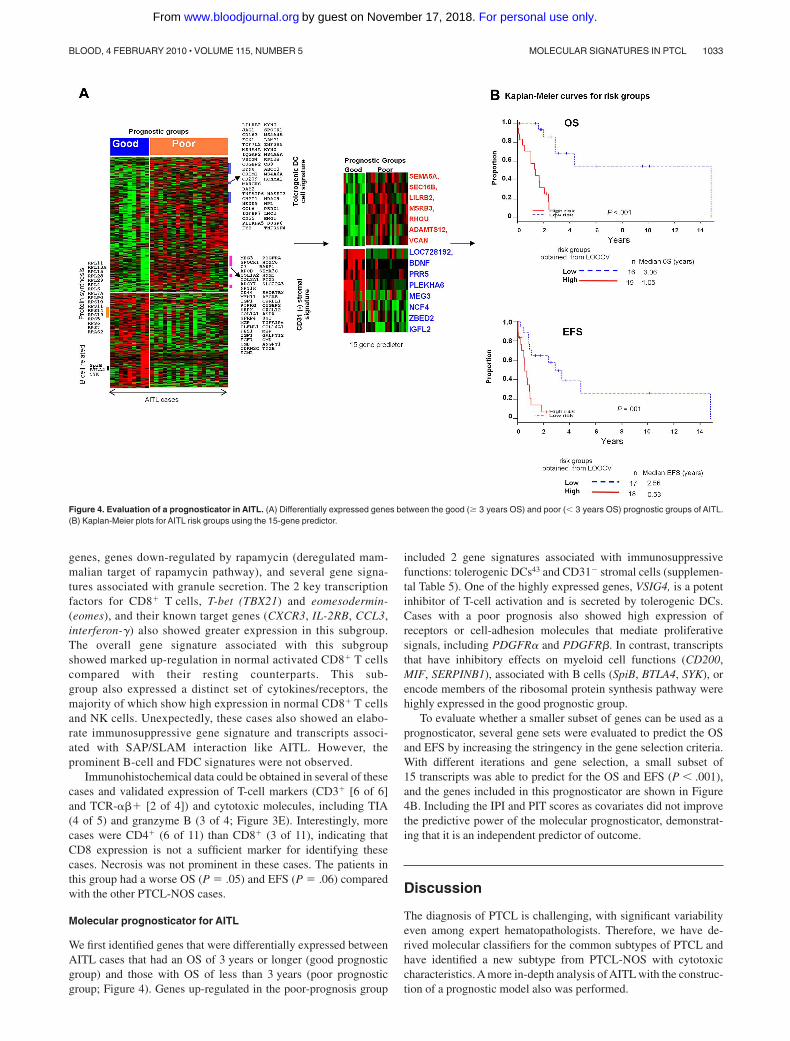
We first identified genes that were differentially expressed betweenAITL cases that had an OS of 3 years or longer (good prognosticgroup) and those with OS of less than 3 years (poor prognosticgroup; Figure 4). Genes up-regulated in the poor-prognosis group
included 2 gene signatures associated with immunosuppressivefunctions: tolerogenic DCs43 and CD31� stromal cells (supplemen-tal Table 5). One of the highly expressed genes, VSIG4, is a potentinhibitor of T-cell activation and is secreted by tolerogenic DCs.Cases with a poor prognosis also showed high expression ofreceptors or cell-adhesion molecules that mediate proliferativesignals, including PDGFR� and PDGFR�. In contrast, transcriptsthat have inhibitory effects on myeloid cell functions (CD200,MIF, SERPINB1), associated with B cells (SpiB, BTLA4, SYK), orencode members of the ribosomal protein synthesis pathway werehighly expressed in the good prognostic group.
To evaluate whether a smaller subset of genes can be used as aprognosticator, several gene sets were evaluated to predict the OSand EFS by increasing the stringency in the gene selection criteria.With different iterations and gene selection, a small subset of15 transcripts was able to predict for the OS and EFS (P � .001),and the genes included in this prognosticator are shown in Figure4B. Including the IPI and PIT scores as covariates did not improvethe predictive power of the molecular prognosticator, demonstrat-ing that it is an independent predictor of outcome.
Discussion
The diagnosis of PTCL is challenging, with significant variabilityeven among expert hematopathologists. Therefore, we have de-rived molecular classifiers for the common subtypes of PTCL andhave identified a new subtype from PTCL-NOS with cytotoxiccharacteristics. A more in-depth analysis of AITL with the construc-tion of a prognostic model also was performed.
Figure 4. Evaluation of a prognosticator in AITL. (A) Differentially expressed genes between the good (� 3 years OS) and poor (� 3 years OS) prognostic groups of AITL.(B) Kaplan-Meier plots for AITL risk groups using the 15-gene predictor.
MOLECULAR SIGNATURES IN PTCL 1033BLOOD, 4 FEBRUARY 2010 � VOLUME 115, NUMBER 5
For personal use only.on November 17, 2018. by guest www.bloodjournal.orgFrom

The AITL classifier largely reflects the nonneoplastic cells inthe microenvironment with a significant contribution by B cellsand FDCs. The complex cytokine milieu may not only recruitvarious inflammatory cells but also may contribute to a microenvi-ronment that supports malignant T-cell growth and cell survival, aswell as angiogenesis and immunosuppression. This classifierallowed us to reclassify a significant number of morphologicPTCL-NOS cases and other PTCLs as AITL. These discrepantcases were rereviewed and demonstrated some morphologic fea-tures of AITL but were not considered to be diagnostic because ofthe absence of certain key features such as numerous EBV-positiveB cells, prominent vascular proliferation, or the presence of largesheets of monomorphic tumor cells. The 2 reclassified ATLL casesfrom Japan had the morphologic features of AITL, and there was noevidence of HTLV1 viral integration in the tumor by Southern blotanalysis. Pathologically diagnosed AITL cases that were notconfirmed molecularly may represent misdiagnosis, AITL withvery low tumor content, or, possibly, nonrepresentative tissue wassubmitted for GEP studies. Our classifier also classified most of theAITL cases from a previous study,13 reclassified a similar propor-tion of PTCL-NOS cases (18%), and significantly overlaps theup-regulated genes identified by de Leval et al.11 A similarobservation also was reported in another study10 in which 5 (16%)of 32 PTCL-NOS cases clustered tightly with the major AITLcluster. Because of a substantially larger number of cases in ourseries, we believe this molecular classifier is robust and willallow us to identify cases of AITL in other categories of PTCL,especially PTCL-NOS.
We also were able to generate robust classifiers for ALK�
ALCL and ATLL. As expected in ALK� ALCL, ALK mRNA wasone of the top genes, along with IL-26 and IL-31RA, which areinvolved in the activation of STAT3.44,45 STAT3 can induce theexpression of ROR� which, in turn, promotes the expression ofIL-17A, IL-17F, and IL-22. The expression of TH17-associatedmolecules may represent aberrant activation of TH17-cell differen-tiation by abnormal cytokine secretion. Interestingly, transcriptscharacteristic of TH17 cells coexisted with cytotoxic molecules andenrichment of the proto-oncogene ETS-1 target gene signature,indicating a profoundly abnormal differentiation program in ALK�
ALCL. ALK� ALCL could not be accurately classified molecu-larly, possibly because of the small number of cases available forstudy. However, ALK� ALCL appeared distinct from PTCL-NOSand ALK� ALCL, specifically in the expression of TCR signaling-associated genes and the STAT3 target signature, respectively.
Unlike ALK� ALCL, our ATLL classifier was characterized byhigh expression of TCR signaling pathway genes, an HTLV1-associated gene signature, and a small subset of MAGE familytranscripts that have not been previously reported in ATLL. Anintact TCR signaling pathway and several TAX-induced genes/pathways (eg, MYC, NFKB1, and ATF1) may be importantfor tumor survival and viral propagation. Although GEP indi-cated an immunosuppressive microenvironment and the expres-sion of chemoattractants for T-reg cells, we were not able todemonstrate enrichment of a Treg-cell signature in ATLL.Consistent with this observation, FOXP3 mRNA was notexpressed in ATLL, even though ATLL cells showed significantup-regulation of IL-2R� (CD25).
Three PTCL-NOS cases were reclassified as ATLL. These caseswere serologically positive for HTLV1, but further molecularanalysis of 2 cases with available materials demonstrated noevidence of viral integration. It is possible that a combination ofmolecular events could give rise to a GEP similar to that observed
in ATLL, leading to the misclassification, or there could havebeen partial deletion of HTLV1 during propagation of thelymphoma cells resulting in failure of detection by Southern blotanalysis. In general, these classifiers are very specific, and therewas little overlap in the molecular diagnosis. However, somecases were missed because of the presence of few tumor cells inthe sample analyzed, especially in ALCL, as suggested bynegative results from T-cell receptor gene rearrangement analy-sis or a low CD30 message.
A small subgroup of PTCL-NOS cases identified by CC showedfeatures of cytotoxic T cells with the expression of cytotoxicmolecules and many markers related to cytotoxic cells (killer cellimmunoglobulin-like receptor and killer cell lectin-like receptorsubfamily families) but lacked the expression of CD56 mRNA.GSEA analysis also revealed significant enrichment of the CD8�
T-cell signature, but these cases could not be identified immunophe-notypically by the use of the CD8 marker alone. Interestingly, animmunosuppressive gene signature mainly mediated by tolero-genic DCs also was noted in this entity. This group of cases had aninferior survival compared with the other PTCL-NOS cases. Thereare several reports indicating that expression of cytotoxic markers(TIA, granzymes, and/or perforin) in some PTCLs and these casesare associated with poor clinical outcome.46-49 Some of these casesmay correspond to the CT-PTCL defined here, but expression ofindividual markers is not sufficient to define this subgroup.A comprehensive and refined gene expression signature as pre-sented will be able to separate these cases from PTCL-NOS forfurther investigations in the future.
The authors of several recent studies6,50-53 also have evaluatedcytokines/receptors for diagnosis as well as prognosis. Theseincluded the cytokines that correlate with the functional subsets ofT cells such as Th1, Th2, and TFH cells.12,54 Although there ispreferential expression of chemokine/receptors with PTCL sub-types (eg, CCR4 in ATLL, CCR3 in ALCL, and CXCL13 inAITL),36 individually they are not sufficiently specific for diagno-sis, nor can they define Th1 or Th2 differentiation of tumor cells.The association with prognosis reported in few studies may berelated to the association of these markers with certain subtypeshaving different prognosis.
Recent studies have shown the association of a high IPI29 scoreand PIT30 with poor survival in PTCL30,55 and PTCL-NOS,respectively. Ki-67 expression has also been evaluated in PTCLand showed association with clinical outcome in some studies.6,56
However, in a recent study, Ki-67 expression by itself was notassociated with clinical outcome in PTCL.14 In our series, bothIP129 and PIT30 had predictive power when PTCL was consideredas a single entity, and there was a trend toward worse outcome withgreater Ki-67 mRNA expression. Prognosticators based on GEPhave been evaluated in PTCL in general14 but not in specificentities. In this study, we have constructed a GEP-derived prognos-ticator for AITL that is independent of IPI. Notably, the highexpression of 2 immunosuppressive signatures was associated withpoor survival. We previously demonstrated that host/tumor interac-tions have a significant impact on survival in follicular lymphomaand diffuse large B-cell lymphoma.57,58 This finding also seems tobe true for AITL and suggests that the tumor microenvironmentmay be an important target for therapy. However, this study was aretrospective one with cases from many centers in which thetherapeutic approaches varied widely. Therefore, a prospectivestudy of a large series of well-defined AITL cases is essential tovalidate and refine this prognosticator in the future.
1034 IQBAL et al BLOOD, 4 FEBRUARY 2010 � VOLUME 115, NUMBER 5
For personal use only.on November 17, 2018. by guest www.bloodjournal.orgFrom
GEP studies are not only useful in providing robust molecularclassifiers but can also illuminate the biology of the tumor andsuggest therapeutic targets. Thus, consistent with previous stud-ies,11,12 AITL demonstrates significant enrichment in the TFH-cellgene signature, supporting the contention of a TFH cellular origin.However, there were also obvious differences with normal TFH
cells, such as low expression of CD57 and high CD10 mRNAexpression.59 SH2DIA (SAP)/SLAM interaction is essential for thelocalization of TFH cells and their cognate B cells into follicles.60
Although SAP and SLAM molecules were expressed at high levelsin AITL, as were molecules that attract B cells, including ICOS,CD40L, OX40, and IL21, follicles are generally poorly developed,and neoplastic T-cells are not concentrated in the follicles in AITL.These findings suggest an abnormality in SAP/SLAM interactionor signaling between the neoplastic T cells and B cells and raise theintriguing possibility that the neoplastic cells may be at a prefollicu-lar stage of development because of their failure to enter follicles,in contrast to the rare follicular T-cell lymphoma.61
Our study found that the NF-B pathway was highlyactivated in AITL cases and that this pathway is a strongcandidate for therapeutic intervention.62 Inhibitors of the NF-Bpathway may provide significant therapeutic benefit by actingagainst both the tumor and microenvironmental components.Because of the enrichment of genes related to genotoxic stress,promoting TP53 activity may tip the balance toward apoptosisand enhance the efficacy of therapeutic agents. A small molecu-lar inhibitor of MDM2, Nutlin-3, can enhance TP53 function.Nutlin3 can also suppress EBV-mediated transformation ofprimary B cells, and its activity is further enhanced by inhibitionof NF-B signaling. A combination of Nutlin 3 and an NF-kBinhibitor may be particularly effective against the neoplasticT cells and EBV-transformed B cells in AITL with intact TP53.
GEP also demonstrated high expression of negative immuneresponse regulators (eg, CTLA4, BTLA, PD1), immunosuppressivecytokines, including IL-10, TGF-�, IL-6, and LIF, and highexpression of INDO, which recruits T-reg cells and tolerogenicDCs. Blockade of this immunosuppression may not only suppressthe EBV-transformed B cells but also promote antitumor immunity.Angiogenic pathways are highly active in AITL and could bepotential targets for therapy. Secretion of IL-6 and IL-21 bymalignant TFH cells may have autocrine activities. The potenteffects of IL-4, IL-6, and IL-2163 on the differentiation of B cells
are likely responsible for the many plasma cells present in AITLand the hypergammaglobulinemia and autoimmune phenomenonoften seen in this disease. Many of the pathologic manifestationsobserved in AITL may be mediated by IL-6 signaling, and targetingthis pathway with the humanized anti-human IL-6 receptor anti-body tocilizumab64 or with small molecules such as capsacin orSD1008 may be a novel treatment approach for AITL.
Acknowledgments
We thank Martin Bast for the clinical data collection and KavitaPatel and Lisa Bough for technical assistance.
This work was supported in part by a National Cancer Institutegrant (5U01/CA114778) and funds from the International Periph-eral T-cell Lymphoma Project and Eppley Core Grant (CA36727from National Cancer Institute). The UNMC Microarray CoreFacility is supported partially by National Institutes of Health grantP20 RR016469 from the INBRE Program of the National Centerfor Research Resources.
Authorship
Contribution: J.I., T.C.G., and W.C.C. designed and performed thestudy, supervised all aspects of the research and analysis, and wroteand finalized the manuscript; D.W.W., T.C.G., and W.C.C. wereresponsible for verifying histology, pathology review, scoringimmunohistochemical stains, and for final approval of the manu-script; J.V. and J.A. were involved in the design of the study andreviewed the clinical aspects and edited the manuscript; T.M.K.,C.K., H.G., K.D.B., L.S., and K.D. assisted in the design of thestudy and statistical analysis of the microarray and clinical data;and S.K., M.S., J.D., F.B., F.L., W.B., Y.H.K., and I.S. providedPCTL cases for the study and also scored the immunohistochemicalstains and provided FISH and Southern blot data for the cases.
Conflict-of-interest disclosure: The authors declare no compet-ing financial interests.
Correspondence: Wing C. Chan, MD, Department of Pathologyand Microbiology, Co-Director, Center for Research in Lymphomaand Leukemia, 983135 Nebraska Medical Center, Omaha, NE68198-3135; e-mail: [email protected].
References
1. Rudiger T, Weisenburger DD, Anderson JR, et al.Peripheral T-cell lymphoma (excluding anaplasticlarge-cell lymphoma): results from the Non-Hodgkin’s Lymphoma Classification Project. AnnOncol. 2002;13(1):140-149.
2. Swerdlow SH, Campo E, Harris NL, et al. WHOClassification: Pathology and Genetics of Tumorsof Haematopoietic and Lymphoid Tissues. Lyon,France: IARC Press; 2008.
3. Morris SW, Kirstein MN, Valentine MB, et al. Fu-sion of a kinase gene, ALK, to a nucleolar proteingene, NPM, in non-Hodgkin’s lymphoma. Sci-ence. 1994;263(5151):1281-1284.
4. Tsukasaki K, Tsushima H, Yamamura M, et al.Integration patterns of HTLV-I provirus in relationto the clinical course of ATL: frequent clonalchange at crisis from indolent disease. Blood.1997;89(3):948-956.
5. Rudiger T, Geissinger E, Muller-Hermelink HK.‘Normal counterparts’ of nodal peripheral T-celllymphoma. Hematol Oncol. 2006;24(4):175-180.
6. Went P, Agostinelli C, Gallamini A, et al. Markerexpression in peripheral T-cell lymphoma: a pro-
posed clinical-pathologic prognostic score. J ClinOncol. 2006;24(16):2472-2479.
7. Vose J, Armitage J, Weisenburger D, for the Inter-national T-Cell Lymphoma Project. Internationalperipheral T-cell and natural killer/t-cell lymphomastudy: pathology findings and clinical outcomes.J Clin Oncol. 2008;26(25):4124-4130.
8. Iqbal J, d’Amore F, Hu Q, Chan WC, Fu K. Genearrays in lymphoma: where will they fit in? CurrHematol Malig Rep. 2006;1(2):129-136.
9. Martínez-Delgado B, Cuadros M, Honrado E, etal. Differential expression of NF-kappaB pathwaygenes among peripheral T-cell lymphomas. Leu-kemia. 2005;19(12):2254-2263.
10. Ballester B, Ramuz O, Gisselbrecht C, et al.Gene expression profiling identifies molecularsubgroups among nodal peripheral T-cell lympho-mas. Oncogene. 2006;25(10):1560-1570.
11. de Leval L, Rickman DS, Thielen C, et al. Thegene expression profile of nodal peripheral T-celllymphoma demonstrates a molecular link be-tween angioimmunoblastic T-cell lymphoma
(AITL) and follicular helper T (TFH) cells. Blood.2007;109(11):4952-4963.
12. Piccaluga PP, Agostinelli C, Califano A, et al.Gene expression analysis of angioimmunoblasticlymphoma indicates derivation from T follicularhelper cells and vascular endothelial growth fac-tor deregulation. Cancer Res. 2007;67(22):10703-10710.
13. Piccaluga PP, Agostinelli C, Califano A, et al.Gene expression analysis of peripheral T-celllymphoma, unspecified, reveals distinct profilesand new potential therapeutic targets. J Clin In-vest. 2007;117(3):823-834.
14. Cuadros M, Dave SS, Jaffe ES, et al. Identifica-tion of a proliferation signature related to survivalin nodal peripheral T-cell lymphomas. J Clin On-col. 2007;25(22):3321-3329.
15. Piccaluga PP, Agostinelli C, Zinzani PL, Baccarani M,Dalla Favera R, Pileri SA. Expression of platelet-derived growth factor receptor alpha in peripheralT-cell lymphoma not otherwise specified. LancetOncol. 2005;6(6):440.
16. Pise-Masison CA, Radonovich M, Dohoney K, et
MOLECULAR SIGNATURES IN PTCL 1035BLOOD, 4 FEBRUARY 2010 � VOLUME 115, NUMBER 5
For personal use only.on November 17, 2018. by guest www.bloodjournal.orgFrom

al. Gene expression profiling of ATL patients:compilation of disease related genes and evi-dence for TCF-4 involvement in BIRC5 gene ex-pression and cell viability. Blood. 2009;113(17):4016-4026.
17. Sasaki H, Nishikata I, Shiraga T, et al. Overex-pression of a cell adhesion molecule, TSLC1,as a possible molecular marker for acute-typeadult T-cell leukemia. Blood. 2005;105(3):1204-1213.
18. Lamant L, de Reynies A, Duplantier MM, et al.Gene-expression profiling of systemic anaplasticlarge-cell lymphoma reveals differences based onALK status and two distinct morphologic ALK�
subtypes. Blood. 2007;109(5):2156-2164.
19. Thompson MA, Stumph J, Henrickson SE, et al.Differential gene expression in anaplastic lym-phoma kinase-positive and anaplastic lymphomakinase-negative anaplastic large cell lymphomas.Hum Pathol. 2005;36(5):494-504.
20. Greiner TC, Rubocki RJ. Effectiveness of capil-lary electrophoresis using fluorescent-labeledprimers in detecting T-cell receptor gamma generearrangements. J Mol Diagn. 2002;4(3):137-143.
21. Dybkaer K, Iqbal J, Zhou G, et al. Genome widetranscriptional analysis of resting and IL2 acti-vated human natural killer cells: gene expressionsignatures indicative of novel molecular signalingpathways. BMC Genomics. 2007;8:230.
22. Simon R, Peng A. BRB-ArrayTools User Guide,version 3.6.0. Biometric Research Branch, Na-tional Cancer Institute. http://linus.nci.nih.gov/BRB-ArrayTools.html. Accessed December 2,2009.
23. Monti S, Tamayo P, Mesirov J, Golub T. A resam-pling-based method for class discovery and visu-alization of gene expression microarray data. Ma-chine Learning. 2003;52(1-2):91-118.
24. Wright G, Tan B, Rosenwald A, Hurt EH, WiestnerA, Staudt LM. A gene expression-based methodto diagnose clinically distinct subgroups of diffuselarge B-cell lymphoma. Proc Natl Acad Sci U S A.2003;100(17):9991-9996.
25. Simon R, Radmacher MD, Dobbin K, McShaneLM. Pitfalls in the use of DNA microarray data fordiagnostic and prognostic classification. J NatlCancer Inst. 2003;95(1):14-18.
26. Tusher VG, Tibshirani R, Chu G. Significanceanalysis of microarrays applied to the ionizingradiation response. Proc Natl Acad Sci U S A.2001;98(9):5116-5121.
27. Subramanian A, Tamayo P, Mootha VK, et al.Gene set enrichment analysis: a knowledge-based approach for interpreting genome-wideexpression profiles. Proc Natl Acad Sci U S A.2005;102(43):15545-15550.
28. Bair E, Tibshirani R. Semi-supervised methods topredict patient survival from gene expressiondata. PLoS Biol. 2004;2(4):E108.
29. Ansell SM, Habermann TM, Kurtin PJ, et al. Pre-dictive capacity of the International PrognosticFactor Index in patients with peripheral T-cell lym-phoma. J Clin Oncol. 1997;15(6):2296-2301.
30. Gallamini A, Stelitano C, Calvi R, et al. PeripheralT-cell lymphoma unspecified (PTCL-U): a newprognostic model from a retrospective multicen-tric clinical study. Blood. 2004;103(7):2474-2479.
31. Eisen MB, Spellman PT, Brown PO, Botstein D.Cluster analysis and display of genome-wide ex-pression patterns. Proc Natl Acad Sci U S A.1998;95(25):14863-14868.
32. Rose-John S, Waetzig GH, Scheller J, GrotzingerJ, Seegert D. The IL-6/sIL-6R complex as a novel
target for therapeutic approaches. Expert OpinTher Targets. 2007;11(5):613-624.
33. Dupuis J, Boye K, Martin N, et al. Expression ofCXCL13 by neoplastic cells in angioimmunoblas-tic T-cell lymphoma (AITL): a new diagnosticmarker providing evidence that AITL derives fromfollicular helper T cells. Am J Surg Pathol. 2006;30(4):490-494.
34. Chtanova T, Tangye SG, Newton R, et al. T fol-licular helper cells express a distinctive transcrip-tional profile, reflecting their role as non-Th1/Th2effector cells that provide help for B cells. J Immu-nol. 2004;173(1):68-78.
35. Kim CH, Lim HW, Kim JR, Rott L, Hillsamer P,Butcher EC. Unique gene expression program ofhuman germinal center T helper cells. Blood.2004;104(7):1952-1960.
36. Ohshima K, Karube K, Kawano R, et al. Classifi-cation of distinct subtypes of peripheral T-celllymphoma unspecified, identified by chemokineand chemokine receptor expression: analysis ofprognosis. Int J Oncol. 2004;25(3):605-613.
37. Ishida T, Iida S, Akatsuka Y, et al. The CC chemo-kine receptor 4 as a novel specific molecular tar-get for immunotherapy in adult T-Cell leukemia/lymphoma. Clin Cancer Res. 2004;10(22):7529-7539.
38. Yu X, Harden K, Gonzalez LC, et al. The surfaceprotein TIGIT suppresses T cell activation by pro-moting the generation of mature immunoregula-tory dendritic cells. Nat Immunol. 2009;10(1):48-57.
39. Sombroek CC, Stam AG, Masterson AJ, et al.Prostanoids play a major role in the primary tu-mor-induced inhibition of dendritic cell differentia-tion. J Immunol. 2002;168(9):4333-4343.
40. Ohshima K, Suzumiya J, Sato K, et al. NodalT-cell lymphoma in an HTLV-I-endemic area: pro-viral HTLV-I DNA, histological classification andclinical evaluation. Br J Haematol. 1998;101(4):703-711.
41. van Hamburg JP, Mus AM, de Bruijn MJ, et al.GATA-3 protects against severe joint inflamma-tion and bone erosion and reduces differentiationof Th17 cells during experimental arthritis. Arthri-tis Rheum. 2009;60(3):750-759.
42. Piva R, Pellegrino E, Mattioli M, et al. Functionalvalidation of the anaplastic lymphoma kinase sig-nature identifies CEBPB and BCL2A1 as criticaltarget genes. J Clin Invest. 2006;116(12):3171-3182.
43. Rutella S, Bonanno G, Procoli A, et al. Hepato-cyte growth factor favors monocyte differentiationinto regulatory interleukin (IL)-10��IL-12low/negaccessory cells with dendritic-cell features.Blood. 2006;108(1):218-227.
44. Sheikh F, Baurin VV, Lewis-Antes A, et al. Cuttingedge: IL-26 signals through a novel receptorcomplex composed of IL-20 receptor 1 and IL-10receptor 2. J Immunol. 2004;172(4):2006-2010.
45. Ghilardi N, Li J, Hongo JA, Yi S, Gurney A, deSauvage FJ. A novel type I cytokine receptor isexpressed on monocytes, signals proliferation,and activates STAT-3 and STAT-5. J Biol Chem.2002;277(19):16831-16836.
46. Asano N, Suzuki R, Kagami Y, et al. Clinicopatho-logic and prognostic significance of cytotoxic mol-ecule expression in nodal peripheral T-cell lym-phoma, unspecified. Am J Surg Pathol. 2005;29(10):1284-1293.
47. Boulland ML, Kanavaros P, Wechsler J, CasiraghiO, Gaulard P. Cytotoxic protein expression innatural killer cell lymphomas and in alpha betaand gamma delta peripheral T-cell lymphomas.J Pathol. 1997;183(4):432-439.
48. Gaulard P, Bourquelot P, Kanavaros P, et al. Ex-pression of the alpha beta and gamma deltaT-cell receptors in peripheral T-cell lymphomas.Nouv Rev Fr Hematol. 1990;32(1):39-41.
49. Kanavaros P, Boulland ML, Petit B, Arnulf B,Gaulard P. Expression of cytotoxic proteins in pe-ripheral T-cell and natural killer-cell (NK) lympho-mas: association with extranodal site, NK orTgammadelta phenotype, anaplastic morphologyand CD30 expression. Leuk Lymphoma. 2000;38(3-4):317-326.
50. Geissinger E, Odenwald T, Lee SS, et al. Nodalperipheral T-cell lymphomas and, in particular,their lymphoepithelioid (Lennert’s) variant are of-ten derived from CD8(�) cytotoxic T-cells. Vir-chows Arch. 2004;445(4):334-343.
51. Gisselbrecht C, Gaulard P, Lepage E, et al. Prog-nostic significance of T-cell phenotype in aggres-sive non-Hodgkin’s lymphomas. Groupe d’Etudesdes Lymphomes de l’Adulte (GELA). Blood. 1998;92(1):76-82.
52. Au WY, Ma SY, Chim CS, et al. Clinicopathologicfeatures and treatment outcome of mature T-celland natural killer-cell lymphomas diagnosed ac-cording to the World Health Organization classifi-cation scheme: a single center experience of10 years. Ann Oncol. 2005;16(2):206-214.
53. Chim CS, Au WY, Shek TW, et al. Primary CD56positive lymphomas of the gastrointestinal tract.Cancer. 2001;91(3):525-533.
54. Tsuchiya T, Ohshima K, Karube K, et al. Th1,Th2, and activated T-cell marker and clinicalprognosis in peripheral T-cell lymphoma, unspeci-fied: comparison with AILD, ALCL, lymphoblasticlymphoma, and ATLL. Blood. 2004;103(1):236-241.
55. Sonnen R, Schmidt WP, Muller-Hermelink HK,Schmitz N. The International Prognostic Indexdetermines the outcome of patients with nodalmature T-cell lymphomas. Br J Haematol. 2005;129(3):366-372.
56. Kim SJ, Kim BS, Choi CW, et al. Ki-67 expressionis predictive of prognosis in patients with stage I/IIextranodal NK/T-cell lymphoma, nasal type. AnnOncol. 2007;18(8):1382-1387.
57. Dave SS, Wright G, Tan B, et al. Prediction of sur-vival in follicular lymphoma based on molecularfeatures of tumor-infiltrating immune cells. N EnglJ Med. 2004;351(21):2159-2169.
58. Lenz G, Wright G, Dave SS, et al. Stromal genesignatures in large-B-cell lymphomas. N EnglJ Med. 2008;359(22):2313-2323.
59. Attygalle A, Al-Jehani R, Diss TC, et al. Neoplas-tic T cells in angioimmunoblastic T-cell lymphomaexpress CD10. Blood. 2002;99(2):627-633.
60. McCausland MM, Yusuf I, Tran H, Ono N, YanagiY, Crotty S. SAP regulation of follicular helperCD4 T-cell development and humoral immunity isindependent of SLAM and Fyn kinase. J Immu-nol. 2007;178(2):817-828.
61. Schwartzberg PL, Mueller KL, Qi H, Cannons JL.SLAM receptors and SAP influence lymphocyteinteractions, development and function. Nat RevImmunol. 2009;9(1):39-46.
62. Karin M. Nuclear factor-kappaB in cancer devel-opment and progression. Nature. 2006;441(7092):431-436.
63. Pene J, Gauchat JF, Lecart S, et al. Cutting edge:IL-21 is a switch factor for the production of IgG1and IgG3 by human B cells. J Immunol. 2004;172(9):5154-5157.
64. Nishimoto N, Kishimoto T. Humanized antihumanIL-6 receptor antibody, tocilizumab. Handb ExpPharmacol. 2008(181):151-160.
1036 IQBAL et al BLOOD, 4 FEBRUARY 2010 � VOLUME 115, NUMBER 5
For personal use only.on November 17, 2018. by guest www.bloodjournal.orgFrom
online November 18, 2009 originally publisheddoi:10.1182/blood-2009-06-227579
2010 115: 1026-1036
Olen Armitage, Wing C. Chan and for the International Peripheral T-Cell Lymphoma ProjectSeto, Jan Delabie, Francoise Berger, Florence Loong, Wing Y. Au, Young-Hyeh Ko, Ivy Sng, JamesKucuk, Huimin Geng, Karen Deffenbacher, Lynette Smith, Karen Dybkaer, Shigeo Nakamura, Masao Javeed Iqbal, Dennis D. Weisenburger, Timothy C. Greiner, Julie M. Vose, Timothy McKeithan, Can lymphoma and prognostication in angioimmunoblastic T-cell lymphomaMolecular signatures to improve diagnosis in peripheral T-cell
http://www.bloodjournal.org/content/115/5/1026.full.htmlUpdated information and services can be found at:
(2926 articles)Lymphoid Neoplasia (5216 articles)Free Research Articles
(4845 articles)Clinical Trials and Observations Articles on similar topics can be found in the following Blood collections
http://www.bloodjournal.org/site/misc/rights.xhtml#repub_requestsInformation about reproducing this article in parts or in its entirety may be found online at:
http://www.bloodjournal.org/site/misc/rights.xhtml#reprintsInformation about ordering reprints may be found online at:
http://www.bloodjournal.org/site/subscriptions/index.xhtmlInformation about subscriptions and ASH membership may be found online at:
Copyright 2011 by The American Society of Hematology; all rights reserved.of Hematology, 2021 L St, NW, Suite 900, Washington DC 20036.Blood (print ISSN 0006-4971, online ISSN 1528-0020), is published weekly by the American Society
For personal use only.on November 17, 2018. by guest www.bloodjournal.orgFrom