molecular profiles of drinking alcohol to intoxication in
TRANSCRIPT

Molecular Profiles of Drinking Alcohol to Intoxication in
C57BL ⁄6J Mice
Megan K. Mulligan, Justin S. Rhodes, John C. Crabbe, R. Dayne Mayfield, R. Adron Harris,and Igor Ponomarev
Background: Alcohol addiction develops through a series of stages, and mechanistic studies areneeded to understand the transition from initial drug use to sustained controlled alcohol con-sumption followed by abuse and physical dependence. The focus of this study was to examine theeffects of voluntary alcohol consumption on brain gene expression profiles using a mouse modelof binge drinking. The main goal was to identify alcohol-responsive genes and functional catego-ries after a single episode of drinking to intoxication.
Methods: We used a modification of a ‘‘Drinking In the Dark’’ (DID) procedure (Rhodeset al., 2005) that allows mice to experience physiologically relevant amounts of alcohol in a non-stressful environment and also allows for detection of alcohol-sensitive molecular changes in adose-dependent manner. C57BL ⁄ 6J male mice were exposed to either 20% ethanol solution orwater (single bottle) starting 3 hours after lights off for 4 hours and brains were harvested imme-diately after the drinking session. cDNA microarrays were used to assess the effects of voluntarydrinking on global gene expression in 6 brain regions. We employed three statistical approachesto analyze microarray data.
Results: A commonly used approach that applies a strict statistical threshold identified theeight top statistically significant genes whose expression was significantly correlated with bloodethanol concentration (BEC) in one of the brain regions. We then used a systems networkapproach to examine brain region-specific transcriptomes and identify modules of co-expressed(correlated) genes. In each brain region, we identified alcohol-responsive modules, i.e., modulessignificantly enriched for genes whose expression was correlated with BEC. A functional over-representation analysis was then applied to examine the organizing principles of alcohol-responsive modules. Genes were clustered into modules according to their roles in differentphysiological processes, functional groups, and cell types, including blood circulation, signaltransduction, cell–cell communication, and striatal neurons. Finally, a meta-analysis across allbrain regions suggested a global role of increasing alcohol dose in coordination of brain bloodcirculation and reaction of astrocytes.
Conclusions: This study showed that acute drinking resulted in small but consistent changes inbrain gene expression which occurred in a dose-dependent manner. We identified both generaland region-specific changes, some of which represent adaptive changes in response to increasingalcohol dose, which may play a role in alcohol-related behaviours, such as tolerance and con-sumption. Our systems approach allowed us to estimate the functional values of individual genesin the context of their genetic networks and formulate new refined hypotheses. An integrativeanalysis including other alcohol studies suggested several top candidates for functional validation,including Mt2, Gstm1, Scn4b, Prkcz, and Park7.
Key Words: Drinking In the Dark, Gene Expression, Brain Region, Network Analysis.
A LCOHOLISM IS A complex disorder affected bygenetic, epigenetic, and environmental factors. Owing
to fundamental differences between human and animalbehaviours, no single animal model can capture all elementsof the disease. However, partial models exist, each designedto replicate an individual feature of alcoholism, such as highalcohol intake. Excessive alcohol consumption is a prerequi-site for the development of alcohol dependence in humanpopulations. Many mouse models of high alcohol drinkinghave employed the two-bottle alcohol preference test, whereaccess to both water and (usually a 10%) ethanol solution isavailable 24 hour per day (Green and Grahame, 2008). A lim-itation of this behavioural assay is that even mice genetically
From the University of Texas at Austin (MKM, RDM, RAH,IP), Waggoner Center for Alcohol and Addiction Research, Austin,Texas; Department of Psychology (JSR), The Beckman Institute,University of Illinois at Urbana-Champaign, Urbana, Illinois;Portland Alcohol Research Center (JCC), Oregon Health & ScienceUniversity and VA Medical Center, Portland, Oregon.
Received for publication May 19, 2010; accepted September 20, 2010.Reprint requests: Igor Ponomarev, PhD, Research Assistant
Professor, The University of Texas at Austin, Waggoner Center forAlcohol and Addiction Research, 2500 Speedway, MBB 1.124, A4800,Austin, TX 78712-0159; Tel.: +1 512 471 5122; Fax: +1 512 2322525; E-mail: [email protected]
Copyright � 2011 by the Research Society on Alcoholism.
DOI: 10.1111/j.1530-0277.2010.01384.x
Alcoholism: Clinical and Experimental Research Vol. 35, No. 4April 2011
Alcohol Clin Exp Res, Vol 35, No 4, 2011: pp 659–670 659

predisposed to drink alcohol rarely display a pattern thatleads to a high blood ethanol concentration (BEC) and physi-ological intoxication. Most genetic studies exploit the geneticpredisposition of the C57BL ⁄6J strain to consume high levelsof alcohol solutions even when other non-alcohol solutionsare available. The recently proposed Drinking-In-the-Dark(DID) model allows the alcohol-preferring C57BL ⁄6J strainto reach physiologically relevant blood alcohol levels afterdrinking an ethanol solution for 2 to 4 hours during the darkphase of the light–dark cycle (Rhodes et al., 2005). Oneadvantage of this drinking paradigm is that it allows animalsto experience intoxicating amounts of alcohol in the non-stressful environment of their home cage.Addiction to alcohol is thought to develop through a series
of stages including acute intermittent alcohol use, chroniccontrolled consumption and transition to a loss of controlover alcohol intake and dependence (Koob et al., 2004).Acute administration of ethanol results in behaviouralresponses associated with drug reward, sensitivity, and toler-ance (Koob et al., 2004; Ponomarev and Crabbe, 2002b;Schuckit, 1994). These initial responses to acute ethanol inhumans may predict the risk for alcohol abuse in the future(Schuckit, 1994), but the mechanistic link between the acuteethanol effects and alcohol addiction is not well understood.A fundamental assumption of addiction research is that someof the initial drug-induced molecular changes mediate theprocesses of cellular adaptation leading to later stages ofaddiction (Kalivas and Volkow, 2005; Koob et al., 2004;McBride et al., 2005; Mcclung and Nestler, 2003; Sommeret al., 2005). Mechanistic studies are needed to understandthe transition from initial drug use to sustained high alcoholconsumption followed by abuse and physical dependence.Acute administration of alcohol, like many other drugs of
abuse, induces changes in brain gene expression (Kerns et al.,2005; Treadwell and Singh, 2004). Gene expression is a sensi-tive measurement of the functional state of a cell or tissue,and the importance of gene expression in drug addiction hasbeen demonstrated by numerous studies in humans and ani-mal models (Liu et al., 2006; Mcclung and Nestler, 2008;Rhodes and Crabbe, 2005; Tabakoff et al., 2003). To identifythe molecular targets affected by alcohol after drinking tointoxication has been initiated, we measured global geneexpression in brains of high alcohol-consuming C57BL ⁄6Jmice after a single bout of voluntary consumption using amodified DID procedure. Our study provides novel insightinto initial drug-induced molecular changes that constitutecellular adaptations to alcohol, which may be important foralcohol-related behavioural changes, such as tolerance andtransition to sustained high alcohol intake.
MATERIALS AND METHODS
Alcohol Self-Administration and Brain Dissections
All animals were purchased from The Jackson Laboratory andallowed to acclimate to individual housing and a reverse light ⁄darkcycle for 2 weeks. One hundred C57BL ⁄6J male mice aged approxi-mately 70 days were used in this study. Ten subjects were randomly
selected to comprise the water group, and the remaining subjectswere selected as the ethanol group and exposed to a modified DIDprotocol (Rhodes et al., 2005) as follows. One hour before the startof the dark cycle, the animals were weighed. Three hours after thestart of the dark cycle, all water bottles were removed from the cages,and the animals in the water group and the ethanol group received a10-ml cylinder containing tap water or 20% v ⁄v ethanol respectively.The total period of access to the cylinders was 4 hours. Fluid levelswere recorded at 2 and 4 hours. Immediately following the final fluidreading, the mice were removed from their cages, and periorbitalblood samples were taken to measure blood ethanol concentration(BEC), and the brains were removed. The olfactory bulbs (OB), fron-tal cortex (FC), striatum (STR, including both dorsal and ventralregions), cerebellum (CB), ventral midbrain (VMB, including ventraltegmental area and substantia nigra pars compacta), and the hippo-campus (HIP) were rapidly dissected from each brain on wet ice andbrain parts immediately frozen on dry ice. FC, STR, VMB, and HIPcontain structures and circuitry involved in both neuroadaptation toalcohol and the neurocognitive processes that underlie addictionbehaviour (Koob and Le Moal, 2006). OB and CB are implicated inthe initial preference drinking in rodents (Tabakoff et al., 2008) andinitial sensitivity and acute tolerance to the ataxic effects of ethanolrespectively (Wallace et al., 2007).
Subject Selection and Sample Preparation
Seven animals from the water group and 21 animals from the alco-hol group were selected for gene expression analysis as control andexperimental subjects respectively. Selection of the alcohol-drinkinganimals was based on responses in 4 drinking variables: the amountof ethanol consumed during the first 2 hours (DID-1), the amount ofalcohol consumed during the final 2 hours (DID-2), total alcoholconsumption over the entire 4-hour period (DID-T), and the BEC.Twenty-one animals were randomly selected from three groupsrepresenting 7 mice for low (L) alcohol consumption and BEC(DID-T: 4.24 to 5.38 g ⁄kg ⁄4 h, �x = 4.76 g ⁄kg ⁄4 h; BEC: 0.47 to1.09 mg ⁄ml, �x = 0.80 mg ⁄ml), 7 for Medium (M) alcohol (DID-T:5.72 to 6.58 g ⁄kg ⁄4 h, �x = 6.27 g ⁄kg ⁄4 h; BEC: 1.16 to 1.50 mg ⁄ml, �x = 1.38 mg ⁄ml) and 7 for High (H) alcohol (DID-T: 6.96 g ⁄kg ⁄4 h, �x = 7.65 g ⁄kg ⁄4 h; BEC: 1.78 to 3.42 mg ⁄ml, �x = 2.32mg ⁄ml) respectively. Control animals were randomly selected fromlittermates of the alcohol-treated animals. They were not given accessto alcohol, and their BEC is assumed to be 0 mg ⁄ml. Total RNAwas extracted from each of the 6 brain regions using a combinationof QIAzol lysis reagent and RNeasy kit (QIAGEN, Valencia, CA)and assayed for gene expression using cDNA microarrays asdescribed below.
Microarray Hybridization
cDNA-spotted arrays were printed in house as described elsewhere(Mulligan et al., 2006). Total RNA (1 to 3 ug) from each experimen-tal sample was hybridized against the same concentration of refer-ence sample according to the manufacturer’s protocol (GenisphereArray 350 Kit; Genisphere, Inc., Hatfield, PA). The reference sampleconsisted of pooled whole-brain total mRNA from 100 adultC57BL ⁄6J male mice (Mulligan et al., 2008). Hybridized microarrayswere scanned using an Axon scanner, and the resulting red (r) andgreen (g) image files were processed using GenePix 6.1 software.Arrays were hybridized in small batches (4 to 18 samples), usuallyconsisting of the same tissue by two experienced technicians.
Data Postprocessing
The Longhorn Array Database (LAD) was used for microarrayexperiment normalization storage and retrieval (Killion and Iyer,2004; Killion et al., 2003). Loess normalization was performed in
660 MULLIGAN ET AL.
LAD by print tip group based on mean r values. Filtering was per-formed in LAD as follows: mean log2 normalized r ⁄g ratios wereretrieved for each spot with both a regression correlation >0.2 and asum of mean raw r and g intensities >100. Filtering was performedfor each brain region individually. cDNA probes containing morethan 30% missing values within a brain region were removed fromfurther analysis. To remove outliers from the data, residuals were cal-culated for each gene based on linear regression of gene expressionon each of the drinking variables (DID-1, DID-2, and DID-T) andthe BEC variable. As the distribution of the residuals was expected tobe normal, samples whose residuals deviated from the mean by morethan 2.5 standard deviations were considered to be outliers, and thecorresponding normalized mean log2 ratios were removed fromfurther analysis. After data postprocessing, the total number ofcDNA probes reliably expressed in each brain region was 7624,12,530, 6445, 6920, 8226, and 8000 for the cerebellum, striatum,frontal cortex, hippocampus, olfactory bulbs, and ventral midbrain,respectively.
Correlation Analysis
Pearson’s correlation (r) was used tomeasure the linear relationshipbetween gene expression and the BEC within each of the 6 brainregions after data postprocessing. Animals from control group wereincluded in the analysis and were assigned BEC values of 0. Signifi-cance was determined from r based on r to t conversion: t = r ⁄�(1-r2) ⁄ (df), where df = n-2. The resulting p-values from t distribu-tions were used to select genes in each brain region that were signifi-cantly correlated with the BEC and to estimate the false discovery rate(FDR) using the q-value package inR (Storey andTibshirani, 2003).
Principal Component Analysis (PCA)
A second data filtering was performed as described earlier with thefollowing exceptions: data for all 6 brain regions were filtered simul-taneously and only genes detected on at least 95% of all arrays (156arrays) were further analyzed. PCA was performed on 3692 genesthat passed the filter using STATISTICA software (Version 6.1; Stat-Soft, Inc., Tulsa, OK). Mean values for each gene were substitutedfor missing values.
Weighted Gene Co-expression Network Analysis (WGCNA)
Data for each brain region were analyzed separately usingWGCNA. For computational reasons, only unique known geneswere included for brain region WGCNA. This reduced the size ofthe data set in each brain region to 3349, 5493, 2839, 3015, 3610,and 3585 in the cerebellum, striatum, frontal cortex, hippocam-pus, olfactory bulbs and ventral midbrain respectively. Weightedgene co-expression networks were constructed from log2 normal-ized r ⁄g ratios after the ‘‘data postprocessing’’ procedure describedabove, using custom functions available at http://www.genetics.ucla.edu/labs/horvath/CoexpressionNetwork/ and the free soft-ware environment for statistical computing and graphics, R,available at http://www.r-project.org/. WGCNA involves the con-struction of: (i) an unsigned similarity matrix based on pair-wisePearson correlations between gene expression profiles; (ii) aweighted adjacency matrix of connection strengths based on thesimilarity matrix and a power adjacency function; (iii) a topologi-cal overlap matrix from the adjacency matrix that measures therelative interconnectedness of the genes in the network; and (iv)average linkage hierarchical clustering of the topological overlapdissimilarity matrix to identify clusters of co-expressed genes,hereby referred to as modules (Zhang and Horvath, 2005). Basedon the number of experiments used to construct the network, theaverage number of connections per node within each brain regionnetwork and the estimated fit of the network with the scale-free
topology criterion proposed by Zhang and Horvath, 2005, thepower was set to b = 5 for each brain region–weighted network.Module identification after hierarchical clustering was performedusing the Dynamic Tree Cut package for R using the ‘‘dynamic’’and ‘‘deep split’’ option and a minimum module size of 30 genes(Langfelder et al., 2008). Dendrogram cut height varied between0.994 and 0.996 for each brain region and was selected based onthe largest height that would create modules spanning the entirelength of the dendrogram. Singular value decomposition (SVD)was used to identify the 1st principal component, or moduleeigengene, and associated variance for each module using the Rpackage moduleColor for R.
Identification of Alcohol-Responsive Modules
The hypergeometric distribution was used to evaluate whether acluster (module) of co-expressed genes determined by WGCNA wasalcohol-responsive, i.e., significantly enriched for genes whose expres-sion was correlated with the BEC at p < 0.05. A module was said tobe alcohol-responsive if it contained more genes whose expressionwas correlated with the BEC than was expected by chance (hypergeo-metric p < 0.05). Alcohol-responsive modules were further subjectedto functional and cell ⁄ tissue type over-representation analyses.
Functional Group Over-Representation Analysis
The NIH Database for Annotation, Visualization, and Inte-grated Discovery (DAVID) Bioinformatics Resource was used todetermine functional group over-representation (Huang Da et al.,2007, 2009). All genes from alcohol-responsive modules wereimported into DAVID based on Genebank Accession IDs. Gene-bank Accessions were later converted to gene symbols using theGene ID conversion tool within the DAVID database. The back-ground list for each brain region consisted of all genes associatedwith the cDNA probe sets used to construct the correspondingbrain region gene networks.
Cell ⁄Tissue Type Over-Representation Analyses
Alcohol-responsive modules were examined on whether theywere enriched with genes that are preferentially expressed in aparticular cell type (astrocyte, oligodendrocyte, and neuron) or tis-sue (blood). Genes enriched in cell types were determined usingpreviously published data (Cahoy et al., 2008). A cutoff of >3-fold enrichment was used to assign cell-type enrichment. Genesenriched in blood were determined from an experiment for a sep-arate project by Dr. Mayfield at the Waggoner Center. Briefly,blood from 9 mice on mixed C57BL ⁄6J x C3H ⁄HeJ genetic back-ground was repeatedly profiled for gene expression. Whole-bloodsamples (300 ul) were obtained from the peri-orbital sinus of indi-vidual mice, and total RNA was extracted (RiboPure�-BloodRNA kit; Ambion, Austin, TX). Globin transcripts were clearedfrom total RNA using the GLOBINclear kit (Applied Biosystems,Foster City, CA). RNA samples were stored at )80�C until use.A total of 4 blood samples were obtained from each animal dur-ing the study (3, 6, 9, and 12 months of age), resulting in 36 sam-ples. Gene expression profiles were obtained using the samecDNA microarrays as used for brain profiling. Microarrayhybridizations were performed using the Genisphere Array900 Kit(Genisphere Inc.). All samples were hybridized to a common ref-erence sample (Universal Mouse Reference RNA, Ambion). Ther ⁄g ratios were calculated, and transcripts enriched more than 50-fold in blood vs the common reference were selected as ‘‘enrichedin blood’’ (Table S1). Genes from alcohol-responsive moduleswere matched by either gene symbols (for cell type) or GenBankIDs (for blood) to determine genes enriched in different celltypes or blood respectively, and the hypergeometric distribution
BRAIN GENE EXPRESSION IN B6 MICE AFTER DID 661

was again used to determine deviation from chance (moduleover-representation).
Meta-Analysis Across Brain Regions
To detect consistently regulated genes, data were combined acrossall 6 brain regions by matching cDNA probes across the brainregions. Fisher’s method was used to combine p-values for the corre-lation between gene expression and the BEC across brain regions(Belknap and Atkins, 2001). The FDR was estimated for each com-bined p-value as described earlier. The criteria for consistent regula-tion across all brain regions were detection in all 6 brain regions andFisher combined p-value <0.002, q < 0.1 (FDR < 10%). Hierar-chical clustering of consistently regulated transcripts was carried outto detect co-expression clusters. Data were normalized by brainregion prior to hierarchical clustering to account for differences inintensity between brain regions and print group. The average log2normalized ratio for each group was used for hierarchical clustering.Only unique transcripts annotated with gene symbols were includedin the cluster analysis. Redundant probe sets having duplicate genesymbols were removed leaving only the probe set with the lowestFisher combined p-value. Average linkage hierarchical clusters basedon euclidean distance were calculated and visualized using the freelyavailable software Cluster 3.0 and JavaTreeView respectively (DeHoon et al., 2004; Saldanha, 2004).
Quantitative RT-PCR
RT-PCR was conducted using total RNA from the same sam-ples used for microarray experiments. Control and high alcoholgroups were compared across several brain regions for 2 selectedgenes: Hba-a1 and Mt2. Expression of Hba-a1 was examined inthe cerebellum, hippocampus, striatum and olfactory bulb andexpression of Mt2 was examined in the striatum, frontal cortexand ventral midbrain. All real-time TaqMan� assays are pre-designed by Applied Biosystems and labeled with FAM as areporter and a non-fluorescent quencher. Detailed TaqMan�
protocols are available on the manufacturer’s website: http://www.appliedbiosystems.com/index.cfm.Mm00845395_s1 and Mm00809556_s1 TaqMan� Gene Expres-
sion Assays were used for Hba-a1 and Mt2 respectively. Control andhigh alcohol groups in each brain region were compared using one-tail t-test and, the overall significance for each gene across brainregions was estimated using the Fisher’s method to combine p-values(Belknap and Atkins, 2001).
RESULTS
Alcohol Self-Administration
Modification of the DID paradigm (Rhodes et al., 2005) toa single-day procedure during which mice are given access to20% (v ⁄v) ethanol for a 4-hour period during the dark cycleresulted in a wide range of responses (Fig. 1). Most mice con-sumed enough alcohol to achieve a BEC of at least0.8 mg ⁄ml, which results in quantifiable signs of intoxication(Crabbe et al., 2009). The amount of ethanol consumed wassignificantly correlated with the BEC (Fig. 1A). Twenty-onemice showing a wide response range of alcohol consumptionand BEC were selected for microarray expression analysis(Fig. 1B). We used this wide range of drinking responsesto identify alcohol-responsive genes, i.e., genes whose expres-sion is significantly correlated with BEC (see methods fordetails).
Global Brain Gene Expression
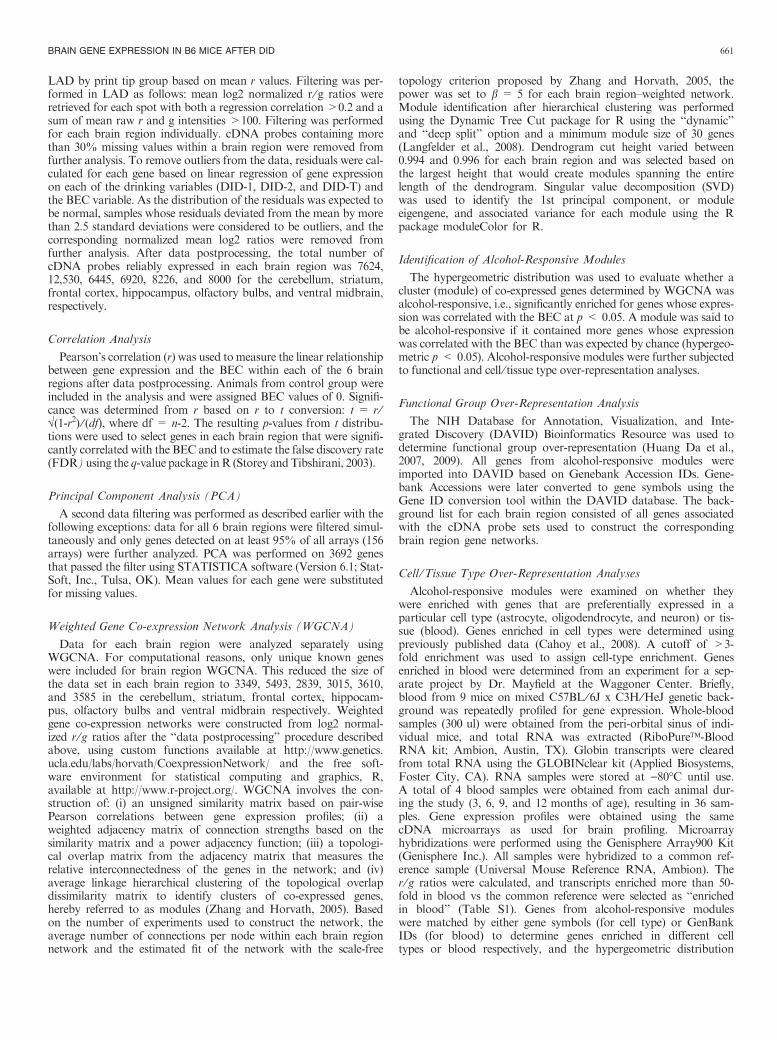
We first examined the underlying structure of the wholemicroarray data set by conducting PCA using �3700 genesthat were reliably detected in all 6 brain regions (see Methodsfor details). PCA is a dimensionality reduction procedure thatis often used to identify latent variables that may reflect bio-logical principles underlying relationships among variables inlarge-scale data sets. The first several new variables or princi-pal components (PCs) account for most of the data variance.Plotting all data in a multidimensional space of the first 2 to 3PCs usually helps determining the main source of data vari-ability as well as detecting technical outliers or proceduralartifacts, such as the batch effect. Data for all 164 arrays plot-ted in a three-dimensional space of the first 3 PCs revealedclustering according to brain region (Fig. 2). Although abatch effect cannot be completely ruled out (see Methods), itis much more likely that this type of clustering reflects truebiological variation in gene expression among brain regions, aresult that would be consistent with findings from previousresearch (Hovatta et al., 2007; Kimpel et al., 2007; Suginoet al., 2006).
Fig. 1. Correlation plots showing relationships between total alcoholconsumed during the 4-hour session at the 4th hour for all animals (A;mean ± SEM; drinking in the dark-T: 5.97 ± 0.14; blood ethanol concentra-tion: 1.15 ± 0.07) and a subset of 21 animals selected for the microarrayexperiment (B).
662 MULLIGAN ET AL.
Brain Region Dependent Gene Expression
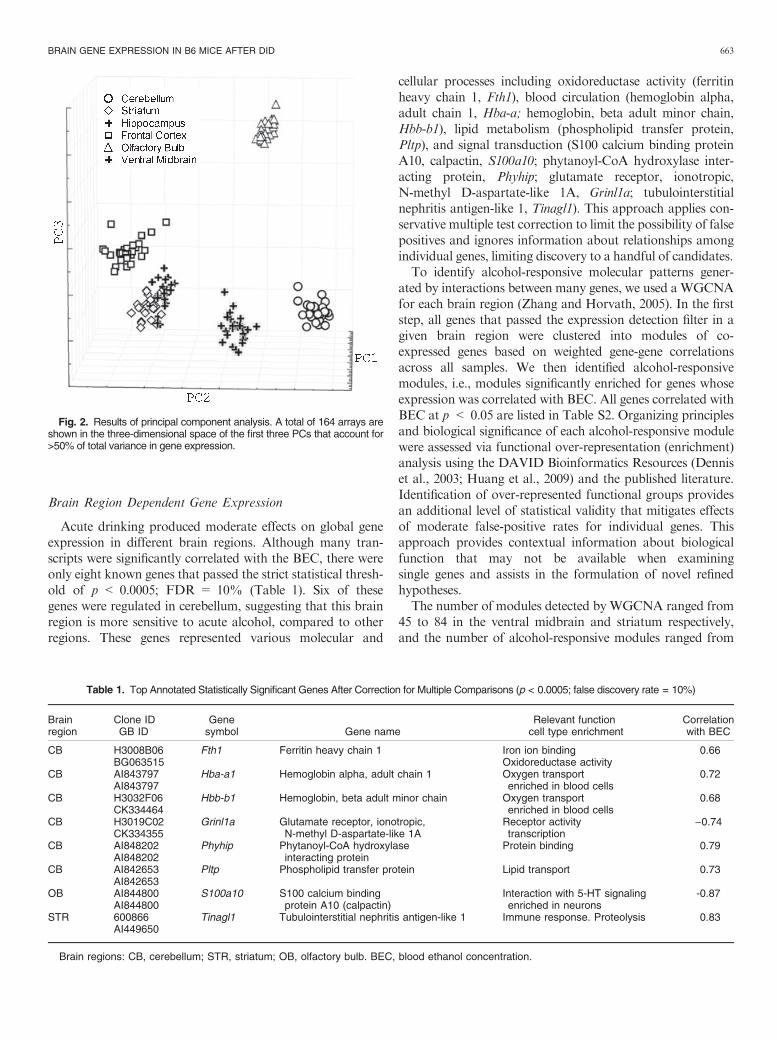
Acute drinking produced moderate effects on global geneexpression in different brain regions. Although many tran-scripts were significantly correlated with the BEC, there wereonly eight known genes that passed the strict statistical thresh-old of p < 0.0005; FDR = 10% (Table 1). Six of thesegenes were regulated in cerebellum, suggesting that this brainregion is more sensitive to acute alcohol, compared to otherregions. These genes represented various molecular and
cellular processes including oxidoreductase activity (ferritinheavy chain 1, Fth1), blood circulation (hemoglobin alpha,adult chain 1, Hba-a; hemoglobin, beta adult minor chain,Hbb-b1), lipid metabolism (phospholipid transfer protein,Pltp), and signal transduction (S100 calcium binding proteinA10, calpactin, S100a10; phytanoyl-CoA hydroxylase inter-acting protein, Phyhip; glutamate receptor, ionotropic,N-methyl D-aspartate-like 1A, Grinl1a; tubulointerstitialnephritis antigen-like 1, Tinagl1). This approach applies con-servative multiple test correction to limit the possibility of falsepositives and ignores information about relationships amongindividual genes, limiting discovery to a handful of candidates.To identify alcohol-responsive molecular patterns gener-
ated by interactions between many genes, we used aWGCNAfor each brain region (Zhang and Horvath, 2005). In the firststep, all genes that passed the expression detection filter in agiven brain region were clustered into modules of co-expressed genes based on weighted gene-gene correlationsacross all samples. We then identified alcohol-responsivemodules, i.e., modules significantly enriched for genes whoseexpression was correlated with BEC. All genes correlated withBEC at p < 0.05 are listed in Table S2. Organizing principlesand biological significance of each alcohol-responsive modulewere assessed via functional over-representation (enrichment)analysis using the DAVID Bioinformatics Resources (Denniset al., 2003; Huang et al., 2009) and the published literature.Identification of over-represented functional groups providesan additional level of statistical validity that mitigates effectsof moderate false-positive rates for individual genes. Thisapproach provides contextual information about biologicalfunction that may not be available when examiningsingle genes and assists in the formulation of novel refinedhypotheses.The number of modules detected by WGCNA ranged from
45 to 84 in the ventral midbrain and striatum respectively,and the number of alcohol-responsive modules ranged from
Fig. 2. Results of principal component analysis. A total of 164 arrays areshown in the three-dimensional space of the first three PCs that account for>50% of total variance in gene expression.
Table 1. Top Annotated Statistically Significant Genes After Correction for Multiple Comparisons (p < 0.0005; false discovery rate = 10%)
Brainregion
Clone IDGB ID
Genesymbol Gene name
Relevant functioncell type enrichment
Correlationwith BEC
CB H3008B06 Fth1 Ferritin heavy chain 1 Iron ion binding 0.66BG063515 Oxidoreductase activity
CB AI843797 Hba-a1 Hemoglobin alpha, adult chain 1 Oxygen transport 0.72AI843797 enriched in blood cells
CB H3032F06 Hbb-b1 Hemoglobin, beta adult minor chain Oxygen transport 0.68CK334464 enriched in blood cells
CB H3019C02 Grinl1a Glutamate receptor, ionotropic,N-methyl D-aspartate-like 1A
Receptor activity )0.74CK334355 transcription
CB AI848202 Phyhip Phytanoyl-CoA hydroxylaseinteracting protein
Protein binding 0.79AI848202
CB AI842653 Pltp Phospholipid transfer protein Lipid transport 0.73AI842653
OB AI844800 S100a10 S100 calcium bindingprotein A10 (calpactin)
Interaction with 5-HT signaling -0.87AI844800 enriched in neurons
STR 600866 Tinagl1 Tubulointerstitial nephritis antigen-like 1 Immune response. Proteolysis 0.83AI449650
Brain regions: CB, cerebellum; STR, striatum; OB, olfactory bulb. BEC, blood ethanol concentration.
BRAIN GENE EXPRESSION IN B6 MICE AFTER DID 663

5 to 12 in the hippocampus and striatum respectively. Allgenes in alcohol-responsive modules are listed in Table S3.The top statistically significant results of subsequent over-representation analysis are presented in Table 2, and allover-represented functional and structural categories inalcohol-responsive modules, detected at FDR < 30%, arelisted in Table S4. The most over-represented functional cate-gory was Blood Circulation, as four of 6 brain regions hadmodules over-represented with genes enriched in blood. Themajority of genes in these modules were positively correlatedwith BEC, suggesting that alcohol dose-dependently increasesblood circulation in brain. Several other general functionalprocesses were affected by alcohol drinking across multiplebrain regions, including signal transduction and cell–cell com-munication. Although the exact genes and pathways werelargely different between regions (see Tables S3 and S4), theseshared higher-order functions are likely common biologicalresponses to alcohol. Several pathways and integrative func-tions, such as ATP-dependent processes, and enzymaticactivity were identified specifically in ventral midbrain andstriatum, suggesting coordinated responses to acute alcohol inthese regions.Of particular interest was the detection of turquoise module
in striatum, which, in addition to be alcohol-responsive, wasenriched with genes highly expressed in neurons. (Table 2,Table S3). To visualize gene–gene relationship in this module,we built a correlation-based network showing highly corre-lated genes from the alcohol-responsive and neuron-enrichedcategories (Fig. 3). This analysis demonstrated that alcohol-
related and neuron-enriched networks are highly overlappingin the striatum. Ninety to 95% of all striatal neurons, a regionimplicated in drug reward and drug reinforcement, areGABAergic medium spiny neurons (MSNs) (Berke andHyman, 2000; Maldve et al., 2002). A survey of striatal geneexpression using Allen Brain Atlas (http://mouse.brain-map.org) revealed that most of the 26 neuronally expressedgenes from this module show a dense pattern of expression,which is consistent with the distribution of MSNs. Severalneuronal genes, including Huntingtin-associated protein 1(Hap1) and guanine deaminase (Gda), were predominantlyexpressed in ventral striatum, a part of the reward pathway,and examination of literature confirmed that these genesare expressed in MSNs (Paletzki, 2002; Tang et al., 2004).Furthermore, the turquoise module includes several genespreviously identified as candidates for genetic regulation oftwo-bottle alcohol preference drinking in mice (Mulliganet al., 2006), including sodium channel beta4 subunit (Scn4b),protein kinase C zeta (Prkcz), and Parkinson’s disease protein7 (Park7) (see Fig. 3). Based on our data and literature, wehypothesize that drinking to intoxication produces changes ingene expression in MSNs, which may contribute to regulationof alcohol consumption and preference.
Meta-Analysis Across Brain Regions
Most genes correlated with BEC at p < 0.05 were specificfor a given brain region (see Table S2), suggesting that differ-ent cell types use different strategies to adapt to acute alcohol.
Table 2. Results of Functional Group Over-Representation Analysis of Alcohol-Responsive Modules
General functional category Functional termFunctional annotation
resourceBrainregion
Expressionmodule p-Value FDR %
Blood circulation Enriched in blood Suppl. Table S1 CB Blue 5.15E-19 <1Enriched in blood Suppl. Table S1 STR Grey60 1.93E-17 <1Enriched in blood Suppl. Table S1 VMB MediumPurple3 1.90E-27 <1Enriched in blood Suppl. Table S1 HIP Cyan 9.61E-22 <1
Signal transduction Regulation of signal transduction Gene Ontology CB Blue 3.03E-03 5Wnt receptor signaling pathway Gene Ontology HIP Blue 4.17E-03 7Signal Swiss-Prot Keywords OB Brown 3.23E-03 5
Cell–Cell communication Cell junction ⁄ synapse Gene Ontology OB Brown 3.41E-03 5Adherens junction Gene Ontology FC Salmon 5.25E-03 7Cell–Cell Signaling Gene Ontology STR Green 5.61E-03 10
ATP-Dependentprocesses
Nucleotide binding ⁄ ATP binding Swiss-Prot Keywords VMB YellowGreen 2.46E-03 4ATP binding Gene Ontology STR SteelBlue 2.06E-05 <1
Cellularcomponent ⁄ transport
Localization Gene Ontology STR Green 4.06E-03 7Receptor-mediated endocytosis Gene Ontology HIP GreenYellow 4.39E-03 8Cation transport Gene Ontology HIP GreenYellow 2.44E-03 4Nucleolar part Gene Ontology OB DarkTurquoise 5.03E-03 7Organelle envelope Gene Ontology FC RoyalBlue 6.80E-03 9Actin cytoskeleton Gene Ontology VMB Orange 5.39E-03 8RNA-Protein Complex Biogenesis Gene Ontology FC Salmon 3.33E-03 6
Enzymatic activity Kinase activity Gene Ontology STR SteelBlue 2.42E-04 <1Transferase Swiss-Prot Keywords STR Grey60 2.15E-03 3Phosphoprotein Swiss-Prot Keywords VMB MediumPurple3 1.06E-03 2
CNS development CNS development Gene Ontology CB Cyan 3.25E-03 6Metabolism Butanoate metabolism KEGG Pathway FC Plum 7.72E-03 9Brain cell type Enriched in neurons Cahoy et al., 2008 STR Turquoise 2.05E-03 7
Only top results are shown [over-representation p < 0.008; false discovery rate (FDR) < 10%]. Brain regions: CB, cerebellum; STR, striatum;VMB, ventral midbrain; HIP, hippocampus; FC, frontal cortex; OB, olfactory bulb.
664 MULLIGAN ET AL.

However, there was a subset of genes that were consistentlyregulated across multiple brain regions. These genes wereidentified using a meta-analysis. Top statistically significanttranscripts (p < 0.002; FDR = 10%) representing 42 uniqueknown genes are shown in Fig. 4. As expected, the four exper-imental groups clustered together across brain regions basedon average linkage hierarchical clustering with the most sepa-ration observed between the control group and the high alco-hol group. Clustering by gene separated genes with a positivevs negative correlation with BEC (clusters A and B respec-tively). Cluster A contained highly intercorrelated genes(Average R > 0.5) that could be further subdivided into twosubclusters. Subcluster A1 was highly enriched for genesexpressed in blood (hypergeometric p < 1E-50), while threeof the members of subcluster A2 (Gstm1, Mt2 and Cst3) wereenriched for expression in astrocytes (hypergeometricp < 3E-4). Analysis of pair-wise Pearson’s correlationsbetween astrocyte- and blood-enriched genes from the twosubclusters resulted in a range of positive correlations, mostof which were significant at p < 0.05 level (averageR = 0.55; p < 0.01). This result suggests coordinated tran-scriptional responses in astroglia to alcohol-induced changesin brain blood circulation. Genes from Fig. 4 which had beenpreviously identified by the Ethanol Related Gene Resource(ERGR) (Guo et al., 2009) as being associated with alcohol-related disease in humans or showing changes in gene expres-sion after exposure to alcohol in mice, rats or humans are
shown in Table S5. RT-PCR of control and high alcoholgroups across several brain regions validated the expressionof representative genes from each category, Hba-a1 (blood)and Mt2 (astrocyte). Expression of both genes was greater inthe high alcohol group compared to control (average foldchange = 45%, combined p = 0.008 for Hba-a1; averagefold change = 23%, combined p = 0.0001 forMt2).
DISCUSSION
Initial administration of addictive substances results inchanges in brain gene expression that may contribute to sus-tained drug intake and the development of tolerance anddependence. To our knowledge, the present study is the firstto examine the effects of alcohol dose on global brain geneexpression in a mouse model of voluntary drinking to intoxi-cation. Compared to previous microarray studies examiningthe effects of acute alcohol on global gene expression (Danielsand Buck, 2002; Kerns et al., 2005; Treadwell and Singh,2004), our approach took advantage of the DID paradigm,which allowed animals to experience intoxicating amounts ofalcohol in the non-stressful environment of their home cages.In this experiment, age, sex and strain were held constant,and environment effects were minimized, yet there wasremarkable variation in BECs after a single four-hour accessperiod, most of which could be explained by differences inalcohol consumption. Some of the variation in initial alcohol
Fig. 3. A correlation-based network formed by a subset of genes from the turquoise module of striatum. Sixty-three highly intercorrelated genes (allR > 0.50; p < 0.01) of total 158 genes in the turquoise module are shown. Additional information for the genes shown, including gene names and correla-tions with blood ethanol concentration (BEC), is available in Supplementary Table S3. Solid lines between genes represent positive correlations, whiledashed lines represent negative correlations and thickness of the lines is proportional to the correlation magnitude. Rectangular boxes represent genes regu-lated by acute drinking in the present study. Thick border lines represent genes differentially regulated between alcohol-preferring and non-preferring micebased on Mulligan and colleagues (2006). Grey background represents genes enriched in neurons based on Cahoy and colleagues (2008). Two separatemodules detected by a layout algorithm are encircled with a dotted line. Functional over-representation analysis determined that Modules 1 and 2 areenriched with genes involved in protein binding (p < 0.003; FDR = 4%) and oxidative phosphorylation (p < 0.002; false discovery rate = 2%), respectively,suggesting that correlation-based gene networks are organized according to some known biological principles.
BRAIN GENE EXPRESSION IN B6 MICE AFTER DID 665

drinking may be because of underlying differences in prenatalenvironment, maternal care, and ⁄or epigenetic factors notmeasured in this study. It is possible that these pre-existingenvironmental or epigenetic factors might affect drinkingresponses through differential expression of some genes.While understanding the role of these factors in alcohol con-sumption should be the focus of future work, the presentstudy took advantage of this wide range of drinking responsesto determine alcohol dose-dependent molecular patterns.These molecular changes, whether pre-existing or alcohol-induced, are related to differential alcohol drinking andshould be considered for generating novel hypotheses.Eight unique known genes were identified as significantly
correlated with BEC using a genome-wide correction forfalse discovery rate. Half of these genes were identified byprevious large-scale studies as alcohol related. Brain expres-sion of Hba-a1 and Hbb-b1 is altered after acute alcoholadministration in mice (Kerns et al., 2005). Fth1 is differ-entially expressed in the brains of inbred rat strains thatdiffer in alcohol preference (Edenberg et al., 2005; Kimpelet al., 2007). Pltp was previously found to be involved in
changes in cholesterol metabolism after ethanol consumption(Lagrost et al., 1996; Liinamaa et al., 1997; Makela et al.,2008; Riemens et al., 1997). Of the remaining genes,S100a10 and Grinl1a are involved in modulating serotoner-gic and glutamatergic neurotransmitter systems, respectively,and Phyhip and Tinagl1 are not well characterized. S100a10is enriched in neurons (Cahoy et al., 2008) and directly regu-lates the trafficking of ion channels and serotonin receptorsincluding, sodium channel, voltage-gated, type X (Scn10a)(Okuse et al., 2002), amiloride-sensitive cation channel2 (Accn2) (Donier et al., 2005), transient receptor potentialcation channel, subfamily V, members 5 (Trpv5) and 6 (Trpv6)(Van De Graaf et al., 2003), potassium channel, subfamily K,member 3 (Kcnk3) (Girard et al., 2002), and serotonin recep-tor 1B (Htr1b) (Svenningsson et al., 2006). Expression ofS100a10 has been shown to be altered in response to stress(Zhang et al., 2008) and depression (Svenningsson et al.,2006; Tzang et al., 2008). Grinl1a is likely to be directlyinvolved in the regulation of glutamatergic signaling via asso-ciation with the Grin1 subunit (Roginski et al., 2008) and hasalso been shown to be down-regulated in Alzheimer’s disease
Fig. 4. A clustergram showing alcohol-responsive genes consistently detected across all brain regions using a meta-analysis. Four groups, one control(C) and three showing relative low (L), medium (M), and high (H) levels of alcohol intake and blood ethanol concentration (BEC) were clustered togetheracross all brain regions (vertical clustering). Genes (horizontal clustering) formed two clusters: A and B corresponding to a positive or negative correlationbetween gene expression and BEC respectively. Two subclusters of cluster A were enriched in either blood (subcluster A1, green box) or astrocytes (sub-cluster A2, red box). Colors represent a relative increase (blue) or decrease (yellow) in gene expression. Brain regions: CB, cerebellum; STR, striatum; OB,olfactory bulb; FC, frontal cortex; VMB, ventral midbrain.
666 MULLIGAN ET AL.

progression along with other glutamatergic receptors (Jacobet al., 2007).Selecting a small number of candidate genes based on strict
statistical thresholds has been widely used in microarraystudies. However, there is growing evidence that statisticalsignificance does not necessarily translate into functionalsignificance and a selection strategy based on overall holisticevidence and biological relevance may be more appropriate.Recent advances in genomics and bioinformatics haveallowed researchers to increase statistical power at a reducedcost per experiment. Combining these global gene expressionassays with network and pathway analyses based on gene co-expression relationships has taken genomic discovery to anew level. These types of analyses will assist in prioritizationof candidate genes for functional validation and formulationof specific hypotheses at the systems level (Oldham et al.,2008; Ponomarev et al., 2010). We used this systems-basedapproach in our study to identify alcohol-responsive mod-ules of co-expressed genes. This analysis revealed alcohol-responsive functional and structural groups that were eitherspecific to a brain region or detected in multiple regions. Astriking example of the latter category was blood circulation,as transcript levels of many genes enriched in blood were cor-related with BEC and clustered together in several brainregions. In principle, a change in expression of a particulargene reflects one of two distinct processes: an actual change inmRNA copy number or a change in the abundance of tissueor the number of cells where this gene is preferentiallyexpressed. Because small doses of acute ethanol have beenshown to increase cerebral blood flow (Mathew and Wilson,1991), we hypothesize that the alcohol-induced increase inmRNA levels of genes enriched in blood reflects changes inblood flow because of BEC in different brain regions.Although this finding is not unexpected, it is reassuring to beable to make predictions at the systems level and validatephysiological findings using genomics approaches.One hypothesis that evolved from our modular network
analysis is that striatal medium spiny neurons may react toacute alcohol consumption with transcriptional changes thatmay underlie subsequent changes in behaviour, includingalcohol preference, tolerance and dependence. Medium spinyneurons are sensitive targets of acute ethanol, as they can beaffected by the drug directly through inhibition of postsy-naptic NMDA receptors or indirectly via ethanol-inducedincrease in synaptic dopamine (Gonzales et al., 2004; Maldveet al., 2002). Repeated alcohol induces cellular adaptation inthese neurons in nucleus accumbens, possibly through inter-play between dopamine and glutamate systems (Chandler,2003; Gonzales et al., 2004; Maldve et al., 2002). Based onthe modular analysis and convergent evidence, we nominate 3genes (Scn4b, Prkcz, and Park7) as functional candidates forethanol-induced plasticity in medium spiny neurons. Sodiumchannel beta4 subunit (Scn4b) is an auxiliary subunit with arole in regulation of neuronal activity (Grieco et al., 2005)and pathogenesis of Huntington’s disease (Oyama et al.,2006). Protein kinase C zeta (Prkcz) is a serine ⁄ threonine
kinase involved in a variety of cellular processes such asproliferation, differentiation, and secretion. A recent studyimplicated striatal expression of this gene in cocaine-inducedsensitization (Chen et al., 2007). Parkinson’s disease protein 7(Park7) is a peptidase with a role in pathogenesis of Parkin-son’s disease and neuronal protection against oxidative stress(Aleyasin et al., 2010). All three of these genes differ inexpression between genetic mouse models of high and lowalcohol preference (Mulligan et al., 2006), Park7 shows differ-ential expression in a similar rat model (Kimpel et al., 2007),and we found both Park7 and Prkcz to be alcohol dose-responsive. In addition, all 3 are candidate genes for 1 of the 2behavioural quantitative trait loci (bQTLs) for alcohol con-sumption (Belknap and Atkins, 2001) because their chromo-somal locations overlap with bQTLs on mouse chromosomes9 (Scn4b) or 4 (Park7, Prkcz) and their expression in nucleusaccumbens is regulated by closely linked genetic polymor-phisms (genenetwork.org). Different validation strategies cannow be used to determine alcohol-related roles of these genesin medium spiny neurons including cell type–specific deletion,downregulation or overexpression of selected genes using acombination of Cre driver lines, viral microinjections andRNAi (Lobo, 2009).Finally, we used a meta-analysis of gene expression across
all brain regions to identify consistent alcohol-responsivemolecular patterns. Blood circulation was enriched in the topgenes from the meta-analysis, an expected result given theidentification of alcohol-responsive and blood-enriched mod-ules in most brain regions. Additionally, this analysis detectedan alcohol-responsive molecular signature specific to astro-glia. These two patterns were highly correlated, suggesting acoordinated response of cerebral blood flow and gene expres-sion in astrocytes to an increasing dose of alcohol. Astrocytesplay active roles in brain physiology. They coordinate neuro-vascular coupling by regulating cerebral blood flow to supplyneurons with energy metabolites in an activity-dependentmanner (Koehler et al., 2009; Takano et al., 2006). Astrocytessense glutamatergic synaptic activity and signal blood vesselsabout the need for regional increases in blood flow (Allen andBarres, 2009; Koehler et al., 2009). Ethanol produces biphasiceffects at molecular, physiological and behavioural levels.Low doses lead to increases in the levels of glutamate inbrain (Moghaddam and Bolinao, 1994), cerebral blood flow(Mathew and Wilson, 1991) and stimulate locomotor activityin mice (Ponomarev and Crabbe, 2002a; Shen et al., 1995),while high doses result in decreases in these responses. Thiscumulative evidence suggests that astrocytes may play anactive role in ethanol-induced changes in cerebral blood flow.Exposure to ethanol has been shown to produce oxidative
stress in the brain (Nordmann, 1987; Reddy et al., 1999;Renis et al., 1996), especially in astrocytes and neurons(Montoliu et al., 1995; Rathinam et al., 2006). Several of thegenes upregulated by ethanol and enriched in astrocytes mayplay a protective role in response to cellular stress. Forexample, glutathione S-transferase mu 1 (Gstm1) is expressedin the brain where its function is to detoxify electrophilic
BRAIN GENE EXPRESSION IN B6 MICE AFTER DID 667

compounds such as ethanol, drugs, and carcinogens (Hayesand Pulford, 1995). Metallothionein 2 (Mt2) synthesis isinduced in the central nervous system in response to a varietyof pathogens and disorders. This gene is involved in hostdefense reactions and neuroprotection during neuropatholog-ical conditions, in which it decreases inflammation and oxida-tive stress and promotes postinjury repair and regeneration(Pedersen et al., 2009). Several of the genes involved inblood circulation (Hba-a1, Hbb-b1, Nfkbia, Pam, Sfrs11, andUnc84a) as well as the astrocyte enriched genes (Gstm1, Mt2and Cst3) have been detected by independent studies asalcohol-responsive or associated with different ethanol traits(ERGR, http://bioinfo.vipbg.vcu.edu/ERGR/). Several genes(Gstm1, Mt2, Fth1, Qdpr, and Nfkbia) displayed an associa-tion with responses to ethanol in two different species or inmultiple independent studies. In many cases, the direction ofchange is similar across studies; however, it is important tonote that brain region sampled, ethanol dose, ethanol admin-istration paradigm and sampling time after ethanol exposurewere not identical across studies. For this reason, expressionchanges are not expected to be directly comparable but simplyto provide additional support for the nomination of thesegenes as strong candidates underlying the initial response tointoxicating doses of alcohol.A recurrent theme in the progression from acute to chronic
alcohol intake is an initial change in mRNA or protein levelsthat likely represent normal adaptive processes invoked tomaintain system homeostasis under the increasing burdenplaced on the system by alcohol. Chronic exposure to alcoholmay cause dysregulation of these homeostatic mechanismsleading to alcohol dependence and abuse. In this study, wegenerated candidate genes and pathways targeted by initialalcohol self-administration by measuring global brain geneexpression in alcohol-preferring C57BL ⁄6J mice after a singlebout of voluntary drinking using a modified DID procedureand by employing several novel approaches and convergentevidence. Consistent with other global gene expression stud-ies, we found that acute alcohol consumption results in smallbut consistent changes in brain gene expression. We identifiedboth common and region-specific changes and generatedhypotheses linking candidate genes to functions of specific celltypes. Future studies will use genetic mouse models for highalcohol consumption, such as ‘‘High Drinking In the Dark’’selectively bred lines (Crabbe et al., 2009) and advanced celltargeting techniques to validate the roles of selected genes inregulation of alcohol drinking.
ACKNOWLEDGMENTS
Authors thank Virginia Bleck, Pamela Metten, JasonSchlumbohm, Stephanie Spence, Lauren Brown, Chia-HuaYu, Lauren Milner, and Laurie Tull for technical assistance.Supported by NIAAA grants from the Integrative Neurosci-ence Initiative on Alcoholism (AA13520, AA13518, AA13475;INIA Pilot Projects), a K award (AA017234), and the Depart-ment of Veterans Affairs grants (AA10760 andAA13519).
REFERENCES
Aleyasin H, Rousseaux MW, Marcogliese PC, Hewitt SJ, Irrcher I, Joselin
AP, Parsanejad M, Kim RH, Rizzu P, Callaghan SM, Slack RS, Mak TW,
Park DS (2010) DJ-1 protects the nigrostriatal axis from the neurotoxin
MPTP by modulation of the AKT pathway. Proc Natl Acad Sci U S A
107:3186–3191.
Allen NJ, Barres BA (2009) Neuroscience: Glia – more than just brain glue.
Nature 457:675–677.
Belknap JK, Atkins AL (2001) The replicability of QTLs for murine alcohol
preference drinking behavior across eight independent studies. Mamm Gen-
ome 12:893–899.
Berke JD, Hyman SE (2000) Addiction, dopamine, and the molecular mecha-
nisms of memory. Neuron 25:515–532.
Cahoy JD, Emery B, Kaushal A, Foo LC, Zamanian JL, Christopherson KS,
Xing Y, Lubischer JL, Krieg PA, Krupenko SA, Thompson WJ, Barres BA
(2008) A transcriptome database for astrocytes, neurons, and oligodendro-
cytes: a new resource for understanding brain development and function.
J Neurosci 28:264–278.
Chandler LJ (2003) Ethanol and brain plasticity: receptors and molecular net-
works of the postsynaptic density as targets of ethanol. Pharmacol Ther
99:311–326.
Chen Q, Lee TH, Wetsel WC, Sun QA, Liu Y, Davidson C, Xiong X, Ellin-
wood EH, Zhang X (2007) Reversal of cocaine sensitization-induced behav-
ioral sensitization normalizes GAD67 and GABAA receptor alpha2 subunit
expression, and PKC zeta activity. Biochem Biophys Res Commun
356:733–738.
Crabbe JC, Metten P, Rhodes JS, Yu CH, Brown LL, Phillips TJ, Finn DA
(2009) A line of mice selected for high blood ethanol concentrations shows
drinking in the dark to intoxication. Biol Psychiatry 65:662–670.
Daniels GM, Buck KJ (2002) Expression profiling identifies strain-specific
changes associated with ethanol withdrawal in mice. Genes Brain Behav
1:35–45.
De HoonMJ, Imoto S, Nolan J, Miyano S (2004) Open source clustering soft-
ware. Bioinformatics 20:1453–1454.
Dennis G Jr, Sherman BT, Hosack DA, Yang J, Gao W, Lane HC, Lempicki
RA (2003) DAVID: Database for Annotation, Visualization, and Inte-
grated Discovery. Genome Biol 4:P3.
Donier E, Rugiero F, Okuse K, Wood JN (2005) Annexin II light chain p11
promotes functional expression of acid-sensing ion channel ASIC1a. J Biol
Chem 280:38666–38672.
Edenberg HJ, Strother WN, Mcclintick JN, Tian H, Stephens M, Jerome RE,
Lumeng L, Li TK, Mcbride WJ (2005) Gene expression in the hippocampus
of inbred alcohol-preferring and -nonpreferring rats. Genes Brain Behav
4:20–30.
Girard C, Tinel N, Terrenoire C, Romey G, Lazdunski M, Borsotto M (2002)
p11, an annexin II subunit, an auxiliary protein associated with the back-
ground K+ channel, TASK-1. EMBO J 21:4439–4448.
Gonzales RA, Job MO, Doyon WM (2004) The role of mesolimbic dopamine
in the development and maintenance of ethanol reinforcement. Pharmacol
Ther 103:121–146.
Green AS, Grahame NJ (2008) Ethanol drinking in rodents: is free-choice
drinking related to the reinforcing effects of ethanol? Alcohol 42:1–11.
Grieco TM, Malhotra JD, Chen C, Isom LL, Raman IM (2005) Open-
channel block by the cytoplasmic tail of sodium channel beta4 as a mecha-
nism for resurgent sodium current. Neuron 45:233–244.
Guo AY, Webb BT, Miles MF, ZimmermanMP, Kendler KS, Zhao Z (2009)
ERGR: an ethanol-related gene resource. Nucleic Acids Res 37:D840–
D845.
Hayes JD, Pulford DJ (1995) The glutathione S-transferase supergene fam-
ily: regulation of GST and the contribution of the isoenzymes to cancer
chemoprotection and drug resistance. Crit Rev Biochem Mol Biol 30:
445–600.
Hovatta I, Zapala MA, Broide RS, Schadt EE, Libiger O, Schork NJ, Lock-
hart DJ, Barlow C (2007) DNA variation and brain region-specific expres-
sion profiles exhibit different relationships between inbred mouse strains:
implications for eQTL mapping studies. Genome Biol 8:R25.
668 MULLIGAN ET AL.

Huang Da W, Sherman BT, Lempicki RA (2009) Systematic and integrative
analysis of large gene lists using DAVID bioinformatics resources. Nat
Protoc 4:44–57.
Huang DaW, Sherman BT, Tan Q, Kir J, Liu D, Bryant D, Guo Y, Stephens
R, Baseler MW, Lane HC, Lempicki RA (2007) DAVID Bioinformatics
Resources: expanded annotation database and novel algorithms to better
extract biology from large gene lists. Nucleic Acids Res 35:W169–W175.
Huang GJ, Shifman S, Valdar W, Johannesson M, Yalcin B, Taylor MS,
Taylor JM, Mott R, Flint J (2009) High resolution mapping of expres-
sion QTLs in heterogeneous stock mice in multiple tissues. Genome Res
19:1133–1140.
Jacob CP, Koutsilieri E, Bartl J, Neuen-Jacob E, Arzberger T, Zander N,
Ravid R, Roggendorf W, Riederer P, Grunblatt E (2007) Alterations in
expression of glutamatergic transporters and receptors in sporadic Alzhei-
mer’s disease. J Alzheimers Dis 11:97–116.
Kalivas PW, Volkow ND (2005) The neural basis of addiction: a pathology of
motivation and choice. Am J Psychiatry 162:1403–1413.
Kerns RT, Ravindranathan A, Hassan S, Cage MP, York T, Sikela JM, Wil-
liams RW, Miles MF (2005) Ethanol-responsive brain region expression
networks: implications for behavioral responses to acute ethanol in DBA ⁄ 2Jversus C57BL ⁄ 6J mice. J Neurosci 25:2255–2266.
Killion PJ, Iyer VR (2004) Microarray data visualization and analysis with the
Longhorn Array Database (LAD). Curr Protoc Bioinformatics 7:10.
Killion PJ, Sherlock G, Iyer VR (2003) The Longhorn Array Database
(LAD): an open-source, MIAME compliant implementation of the Stan-
ford Microarray Database (SMD). BMC Bioinformatics 4:32.
Kimpel MW, Strother WN, Mcclintick JN, Carr LG, Liang T, Edenberg HJ,
Mcbride WJ (2007) Functional gene expression differences between inbred
alcohol-preferring and -non-preferring rats in five brain regions. Alcohol
41:95–132.
Koehler RC, Roman RJ, Harder DR (2009) Astrocytes and the regulation of
cerebral blood flow. Trends Neurosci 32:160–169.
Koob GF, Ahmed SH, Boutrel B, Chen SA, Kenny PJ, Markou A, O’dell
LE, Parsons LH, Sanna PP (2004) Neurobiological mechanisms in the tran-
sition from drug use to drug dependence. Neurosci Biobehav Rev 27:739–
749.
Koob GF, Le Moal M (2006) Neurobiology of Addiction. Academic Press,
London.
Lagrost L, Athias A, Herbeth B, Guyard-Dangremont V, Artur Y, Paille F,
Gambert P, Lallemant C (1996) Opposite effects of cholesteryl ester transfer
protein and phospholipid transfer protein on the size distribution of plasma
high density lipoproteins. Physiological relevance in alcoholic patients.
J Biol Chem 271:19058–19065.
Langfelder P, Zhang B, Horvath S (2008) Defining clusters from a hierarchical
cluster tree: the Dynamic Tree Cut package for R. Bioinformatics 24:719–
720.
Liinamaa MJ, Hannuksela ML, Kesaniemi YA, Savolainen MJ (1997)
Altered transfer of cholesteryl esters and phospholipids in plasma from alco-
hol abusers. Arterioscler Thromb Vasc Biol 17:2940–2947.
Liu J, Lewohl JM, Harris RA, Iyer VR, Dodd PR, Randall PK, Mayfield RD
(2006) Patterns of gene expression in the frontal cortex discriminate alco-
holic from nonalcoholic individuals. Neuropsychopharmacology 31:1574–
1582.
Lobo MK (2009) Molecular profiling of striatonigral and striatopallidal med-
ium spiny neurons past, present, and future. Int Rev Neurobiol 89:1–35.
Makela SM, Jauhiainen M, Ala-Korpela M, Metso J, Lehto TM, Savolainen
MJ, Hannuksela ML (2008) HDL2 of heavy alcohol drinkers enhances cho-
lesterol efflux from raw macrophages via phospholipid-rich HDL 2b parti-
cles. Alcohol Clin Exp Res 32:991–1000.
Maldve RE, Zhang TA, Ferrani-Kile K, Schreiber SS, Lippmann MJ, Snyder
GL, Fienberg AA, Leslie SW, Gonzales RA, Morrisett RA (2002) DARPP-
32 and regulation of the ethanol sensitivity of NMDA receptors in the
nucleus accumbens. Nat Neurosci 5:641–648.
Mathew RJ, WilsonWH (1991) Substance abuse and cerebral blood flow. Am
J Psychiatry 148:292–305.
McBride WJ, Kerns RT, Rodd ZA, Strother WN, Edenberg HJ, Hashimoto
JG, Wiren KM, Miles MF (2005) Alcohol effects on central nervous system
gene expression in genetic animal models. Alcohol Clin Exp Res 29:167–
175.
Mcclung CA, Nestler EJ (2003) Regulation of gene expression and cocaine
reward by CREB and DeltaFosB. Nat Neurosci 6:1208–1215.
Mcclung CA, Nestler EJ (2008) Neuroplasticity mediated by altered gene
expression. Neuropsychopharmacology 33:3–17.
Moghaddam B, Bolinao ML (1994) Biphasic effect of ethanol on extracellular
accumulation of glutamate in the hippocampus and the nucleus accumbens.
Neurosci Lett 178:99–102.
Montoliu C, Sancho-Tello M, Azorin I, Burgal M, Valles S, Renau-Piqueras
J, Guerri C (1995) Ethanol increases cytochrome P4502E1 and induces oxi-
dative stress in astrocytes. J Neurochem 65:2561–2570.
Mulligan MK, Ponomarev I, Boehm SL II, Owen JA, Levin PS, Berman AE,
Blednov YA, Crabbe JC, Williams RW, Miles MF, Bergeson SE (2008)
Alcohol trait and transcriptional genomic analysis of C57BL ⁄ 6 substrains.
Genes Brain Behav 7:677–689.
Mulligan MK, Ponomarev I, Hitzemann RJ, Belknap JK, Tabakoff B, Harris
RA, Crabbe JC, Blednov YA, Grahame NJ, Phillips TJ, Finn DA, Hoff-
man PL, Iyer VR, Koob GF, Bergeson SE (2006) Toward understanding
the genetics of alcohol drinking through transcriptome meta-analysis. Proc
Natl Acad Sci U S A 103:6368–6373.
Nordmann R (1987) Oxidative stress from alcohol in the brain. Alcohol
Alcohol Suppl 1:75–82.
Okuse K, Malik-Hall M, Baker MD, Poon WY, Kong H, Chao MV, Wood
JN (2002) Annexin II light chain regulates sensory neuron-specific sodium
channel expression. Nature 417:653–656.
Oldham MC, Konopka G, Iwamoto K, Langfelder P, Kato T, Horvath S,
Geschwind DH (2008) Functional organization of the transcriptome in
human brain. Nat Neurosci 11:1271–1282.
Oyama F, Miyazaki H, Sakamoto N, Becquet C, Machida Y, Kaneko K,
Uchikawa C, Suzuki T, Kurosawa M, Ikeda T, Tamaoka A, Sakurai T,
Nukina N (2006) Sodium channel beta4 subunit: down-regulation and pos-
sible involvement in neuritic degeneration in Huntington’s disease transgenic
mice. J Neurochem 98:518–529.
Paletzki RF (2002) Cloning and characterization of guanine deaminase from
mouse and rat brain. Neuroscience 109:15–26.
Pedersen MO, Jensen R, Pedersen DS, Skjolding AD, Hempel C, Maretty L,
Penkowa M (2009) Metallothionein-I+II in neuroprotection. Biofactors
35:315–325.
Ponomarev I, Crabbe JC (2002a) Ethanol-induced activation and rapid devel-
opment of tolerance may have some underlying genes in common. Genes
Brain Behav 1:82–87.
Ponomarev I, Crabbe JC (2002b) A novel method to assess initial sensitivity
and acute functional tolerance to hypnotic effects of ethanol. J Pharmacol
Exp Ther 302:257–263.
Ponomarev I, Rau V, Eger EI, Harris RA, Fanselow MS (2010) Amygdala
transcriptome and cellular mechanisms underlying stress-enhanced fear
learning in a rat model of posttraumatic stress disorder. Neuropsychophar-
macology 35:1402–1411.
Rathinam ML, Watts LT, Stark AA, Mahimainathan L, Stewart J, Schen-
ker S, Henderson GI (2006) Astrocyte control of fetal cortical neuron
glutathione homeostasis: up-regulation by ethanol. J Neurochem
96:1289–1300.
Reddy SK, Husain K, Schlorff EC, Scott RB, Somani SM (1999) Dose
response of ethanol ingestion on antioxidant defense system in rat brain sub-
cellular fractions. Neurotoxicology 20:977–987.
Renis M, Calabrese V, Russo A, Calderone A, Barcellona ML, Rizza V
(1996) Nuclear DNA strand breaks during ethanol-induced oxidative stress
in rat brain. FEBS Lett 390:153–156.
Rhodes JS, Best K, Belknap JK, Finn DA, Crabbe JC (2005) Evaluation of a
simple model of ethanol drinking to intoxication in C57BL ⁄ 6J mice. Physiol
Behav 84:53–63.
Rhodes JS, Crabbe JC (2005) Gene expression induced by drugs of abuse.
Curr Opin Pharmacol 5:26–33.
Riemens SC, Van Tol A, Hoogenberg K, Van Gent T, Scheek LM, Sluiter
WJ, Dullaart RP (1997) Higher high density lipoprotein cholesterol associ-
ated with moderate alcohol consumption is not related to altered plasma
BRAIN GENE EXPRESSION IN B6 MICE AFTER DID 669

lecithin:cholesterol acyltransferase and lipid transfer protein activity levels.
Clin Chim Acta 258:105–115.
Roginski RS, Goubaeva F, Mikami M, Fried-Cassorla E, Nair MR, Yang J
(2008) GRINL1A colocalizes with N-methyl D-aspartate receptor NR1
subunit and reduces N-methyl D-aspartate toxicity. Neuroreport 19:1721–
1726.
Saldanha AJ (2004) Java Treeview–extensible visualization of microarray data.
Bioinformatics 20:3246–3248.
Schuckit MA (1994) Low level of response to alcohol as a predictor of future
alcoholism. Am J Psychiatry 151:184–189.
Shen EH, Harland RD, Crabbe JC, Phillips TJ (1995) Bidirectional selective
breeding for ethanol effects on locomotor activity: characterization of FAST
and SLOW mice through selection generation 35. Alcohol Clin Exp Res
19:1234–1245.
Sommer W, Arlinde C, Heilig M (2005) The search for candidate genes of
alcoholism: evidence from expression profiling studies. Addict Biol 10:71–
79.
Storey JD, Tibshirani R (2003) Statistical significance for genomewide studies.
Proc Natl Acad Sci U S A 100:9440–9445.
Sugino K, Hempel CM, Miller MN, Hattox AM, Shapiro P, Wu C, Huang
ZJ, Nelson SB (2006) Molecular taxonomy of major neuronal classes in the
adult mouse forebrain. Nat Neurosci 9:99–107.
Svenningsson P, Chergui K, Rachleff I, Flajolet M, Zhang X, El Yacoubi M,
Vaugeois JM, Nomikos GG, Greengard P (2006) Alterations in 5-HT1B
receptor function by p11 in depression-like states. Science 311:77–80.
Tabakoff B, Bhave SV, Hoffman PL (2003) Selective breeding, quantitative
trait locus analysis, and gene arrays identify candidate genes for complex
drug-related behaviors. J Neurosci 23:4491–4498.
Tabakoff B, Saba L, Kechris K, Hu W, Bhave SV, Finn DA, Grahame NJ,
Hoffman PL (2008) The genomic determinants of alcohol preference in
mice. MammGenome 19:352–365.
Takano T, Tian GF, Peng W, Lou N, Libionka W, Han X, Nedergaard M
(2006) Astrocyte-mediated control of cerebral blood flow. Nat Neurosci
9:260–267.
Tang TS, Tu H, Orban PC, Chan EY, Hayden MR, Bezprozvanny I (2004)
HAP1 facilitates effects of mutant huntingtin on inositol 1,4,5-
trisphosphate-induced Ca release in primary culture of striatal medium
spiny neurons. Eur J Neurosci 20:1779–1787.
Treadwell JA, Singh SM (2004) Microarray analysis of mouse brain gene
expression following acute ethanol treatment. Neurochem Res 29:357–369.
Tzang RF, Hong CJ, Liou YJ, Yu YW, Chen TJ, Tsai SJ (2008) Association
study of p11 gene with major depressive disorder, suicidal behaviors and
treatment response. Neurosci Lett 447:92–95.
Van De Graaf SF, Hoenderop JG, Gkika D, Lamers D, Prenen J, Rescher U,
Gerke V, Staub O, Nilius B, Bindels RJ (2003) Functional expression of the
epithelial Ca(2+) channels (TRPV5 and TRPV6) requires association of
the S100A10-annexin 2 complex. EMBO J 22:1478–1487.
Wallace MJ, Newton PM, Oyasu M, Mcmahon T, Chou WH, Connolly J,
Messing RO (2007) Acute functional tolerance to ethanol mediated by pro-
tein kinase Cepsilon. Neuropsychopharmacology 32:127–136.
Zhang B, Horvath S (2005) A general framework for weighted gene co-
expression network analysis. Stat Appl Genet Mol Biol 4:Article17.
Zhang L, Li H, Su TP, Barker JL, Maric D, Fullerton CS, Webster MJ,
Hough CJ, Li XX, Ursano R (2008) p11 is up-regulated in the forebrain of
stressed rats by glucocorticoid acting via two specific glucocorticoid
response elements in the p11 promoter. Neuroscience 153:1126–1134.
SUPPORTING INFORMATION
Additional Supporting Information may be found in theonline version of this article:Table S1. Transcripts enriched in bloodTable S2.All genes correlated with BEC at p < 0.05Table S3.All genes in alcohol-responsive modulesTable S4.Over-represented functional groupsTable S5. Genes from Fig. 4 that had been previously iden-
tified by the Ethanol Related Gene Resource (ERGR) (Guoet al., 2009) as alcohol-relatedPlease note: Wiley-Blackwell is not responsible for the con-
tent or functionality of any supporting information suppliedby the authors. Any queries (other than missing material)should be directed to the corresponding author for the article.
670 MULLIGAN ET AL.