molecular genetics of growth and development in populus
TRANSCRIPT

Copyright 8 1995 by the Genetics Society of America
Molecular Genetics of Growth and Development in Populus. IV. Mapping QTLs With Large Effects on Growth, Form, and Phenology Traits in a Forest Tree
H. D. Bradshaw, Jr.* and Reinhard F. Stettled
*Center for Urban Horticulture GF-15 and tCollege of Forest Resources AR-IO, University of Washington, Seattle, Washington 98195 Manuscript received June 27, 1994
Accepted for publication November 4, 1994
ABSTRACT We have mapped quantitative trait loci (QTLs) for commercially important traits (stem growth and
form) and an adaptive trait (spring leaf flush) in a Populus F2 generation derived from a cross between interspecific F, hybrids (P. trichocarpa X P. deltoides) . Phenotypic data were collected over a 2-year period from a replicated clonal trial containing ramets of the parental, F,, and F2 trees. Contrary to the assumptions of simple polygenic models of quantitative trait inheritance, 1-5 QTLs of large effect are responsible for a large portion of the genetic variance in each of the traits measured. For example, 44.7% of the genetic variance in stem volume after 2 years of growth is controlled by just two QTLs. QTLs governing stem basal area were found clustered with QTLs for sylleptic branch leaf area, sharing similar chromosomal position and mode of action and suggesting a pleiotropic effect of QTLs ultimately responsible for stem diameter growth.
F OREST tree breeding traditionally has been viewed as an application of quantitative genetics (ZOBEL
and TALBERT 1984). In some ways this approach has been unavoidable since most classical genetic studies depend upon resources generally unavailable to forest geneticists, such as inbred lines, collections of charac- terized mutants and marker stocks. The development of such resources is hampered by the long generation interval, outcrossing mating system and high genetic load typical of forest tree species. Further impetus for the application of quantitative genetics to forest tree breeding arises from the assumption that most commer- cially important traits, such as stem volume growth, are the result of cumulative, integrated physiological pro- cesses that necessarily involve many genes, each with a relatively small contribution to the phenotype.
The fundamental assumptions of the quantitative model in forest tree breeding may now be examined in greater detail using pedigrees that segregate for phe- notypic traits of basic and commercial interest. By con- structing a detailed linkage map within such a pedigree, quantitative trait loci (QTLs) governing the segregating traits may be located and counted, and their magnitude of effect and mode of gene action elucidated (LANDER and BOTSTEIN 1989).
The genus Populus (poplars, cottonwoods and aspens) has several advantages as a model system for forest tree genetics. Interspecific hybridization is usually straightforward (STETTLER et al. 1980) and often pro-
Corresponding author: H. D. Bradshaw, Jr., Center for Urban Horti- culture GF-15, University of Washington, Seattle, WA 98195. E-mail: [email protected]
Genetics 139 963-973 (February, 1995)
duces substantial heterosis for volume growth (above the high parent) in the F1 (ZSUFFA 1975; HEILMAN and STETTLER 1985). The physiological and anatomical bases of this heterosis have been investigated in some depth (HINCKLEY et al. 1989, 1992; CEULEMANS et al. 1992). The F2 of interspecific hybrids segregates for a wide variety of traits, including the growth, form and phenology characters that are the subject of this study. Since most Populus are readily propagated sexually and vegetatively, large segregating progenies may be pro- duced easily and their phenotypes assessed in clonally replicated plantations containing side-by-side ramets of the parental, F, and F2 generations.
We have used a threegeneration Populus pedigree founded by interspecific hybridization to construct a linkage map of the Populus genome (BRADSHAW et al. 1994). In conjunction with a replicated clonal trial we have searched for QTLs with major effects on adaptive and commercial traits: spring leaf phenology, stem pro- portion and height, basal area and volume growth.
MATERIALS AND METHODS
The mapping pedigree: The QTL mapping pedigree was founded in 1981 by interspecific hybridization between Popu- Ius trichocurpa (clone 93-968 from western Washington) and P. deltoides (clone ILL129 from central Illinois). Two siblings from the resulting F1 family (family 53), 53-246 and 53-242, were mated in 1988 to produce the FP family 331.
Linkage map construction: The Populus genetic map con- sists of 343 RFLP, STS and RAPD markers and has been de- scribed elsewhere (BRADSHAW et al. 1994). The map was made from the same pedigree used for phenotypic measurements. To increase the number of informative markers available for estimation of QTL genotypes, additional marker loci found

964 H. D. Bradshaw et al.
A B C D E F G H I PlOn 4 Pl317 ' - 19.7 1 19.8
. PWlZ
P193 5.3 4.6
E14-15 18.4
111-16 5.6 1.8
P755 8.0 F-238
2.1 4.1 4.0
10.1 Pa90
Ell-07 14.7
3.2
11.7
5.0
Plw9 PlZ%2 Pll37 plZ58 33.3
P75 El9-IM
m-@ pzol 14.0 P991
10.4
Ala-04 5.4
PI2003 '1104 17.2
p142 PlMo Plus 3 5 Pl253
14.9
PI72
7.9
win6 p1298 14.3
m-05 P1122 20.1
36.8
Pllzzz
=19 2.2
Pl200 22.5
P1292
P1018 15.0
3.2
P I W 5.6 Gl8-03
14.6
B11-10 6.8
P1340 4.2
19.4 P849
P761
14.7
8.3
12.6
11.3 23.5
P1295 t A"M P11962 m 7 I
11.8
E18-07 3.6
6.8
5.1
11.5
P178 16.2 4.9
4.5 2.8 6.2
6.9
8.8
6.1
1 ClOJl
4.6 1 3 10.5
16.7
5.3
3.3
Am-04
BlS-l5 1 Fls-10 J L M N 0 R X Y Q P
Plw 6.0 3.9
P757 6.3
9.5
P867 3.8 P69
l754
P46 m
6.6
4.4 W-18 Pl140
P12743 PlOlO
Bl5-17
PUl2 p(139
E14-06 17.9
no27
EQl-01
5.6
6.3
12.2
2.3
26.4
11.5 I 12.0 7.7
P1286 10.6
3.2 . 5.7
PIU~ 6.3 3.2
PlUO 2.6
.
15.4 Em-10
15.4
2.0 3.8 2.2 2.8
9.1
13.8
19.9
Pl275 4.0 2.4 s6 2.1
4.5 P773 1.9 t P*9l 12.7 ' P 1 W
p11642 15.4 P1145
7.4 "09
-P865 - Do-07
13.6
8.5 I 7.4
7.0 . . PlOlZ
4.1 3.1 :: E ! 9.8
. . P1068 9.2
4.2 1.4 : : fl&-z
- - Plw7
12.3
. - E18-15
22.1
- COl-16
P 1 W
QTLs in Populus 965
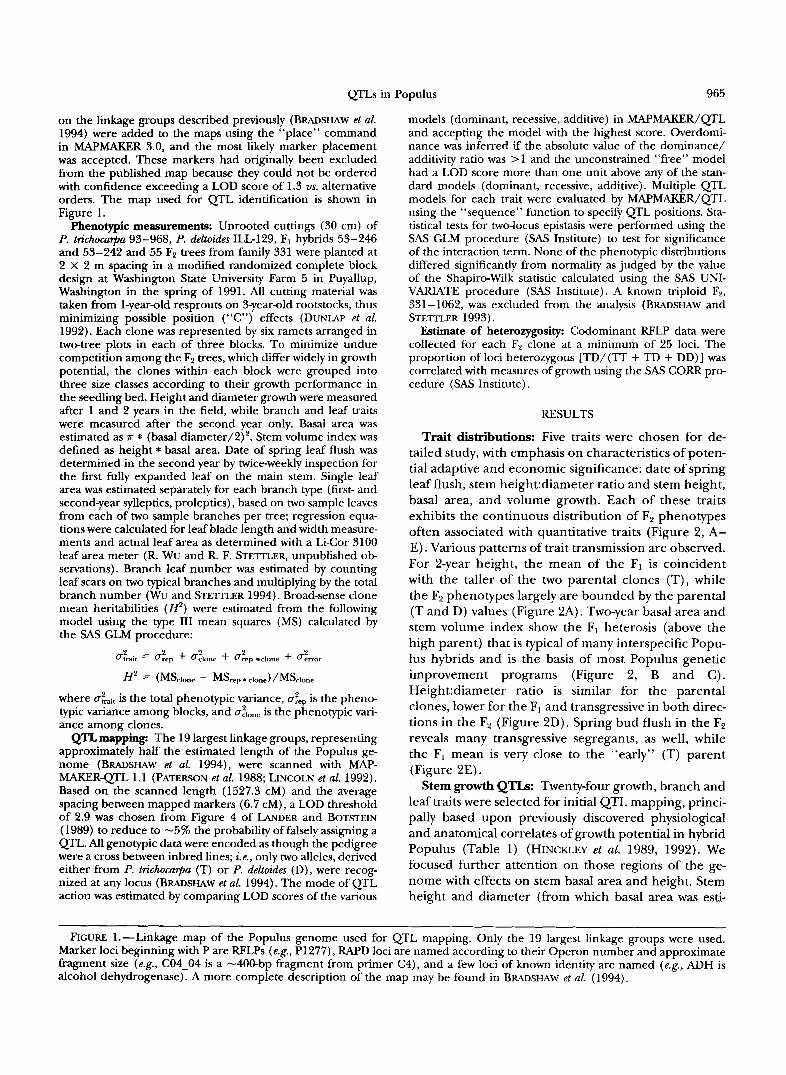
on the linkage groups described previously (BRADSHAW et al. 1994) were added to the maps using the “place” command in MAPMAKER 3.0, and the most likely marker placement was accepted. These markers had originally been excluded from the published map because they could not be ordered with confidence exceeding a LOD score of 1.3 us. alternative orders. The map used for QTL identification is shown in Figure 1.
Phenotypic measurements: Unrooted cuttings (30 cm) of P, trichocarpa 93-968, P. deltoides ILLl29, F, hybrids 53-246 and 53-242 and 55 F2 trees from family 331 were planted at 2 X 2 m spacing in a modified randomized complete block design at Washington State University Farm 5 in Puyallup, Washington in the spring of 1991. All cutting material was taken from 1-year-old resprouts on 3-year-old rootstocks, thus minimizing possible position (“C”) effects (DUNLAP et al. 1992). Each clone was represented by six ramets arranged in two-tree plots in each of three blocks. To minimize undue competition among the F2 trees, which differ widely in growth potential, the clones within each block were grouped into three size classes according to their growth performance in the seedling bed. Height and diameter growth were measured after 1 and 2 years in the field, while branch and leaf traits were measured after the second year only. Basal area was estimated as T * (basal diameter/2)‘. Stem volume index was defined as height * basal area. Date of spring leaf flush was determined in the second year by twice-weekly inspection for the first fully expanded leaf on the main stem. Single leaf area was estimated separately for each branch type (first- and second-year sylleptics, proleptics), based on two sample leaves from each of two sample branches per tree; regression equa- tions were calculated for leaf blade length and width measure- ments and actual leaf area as determined with a Li-Cor 3100 leaf area meter (R. WU and R. F. STETTLER, unpublished ob- servations). Branch leaf number was estimated by counting leafscars on two typical branches and multiplying by the total branch number (Wu and S T E ~ L E R 1994). Broad-sense clone mean heritabilities (ff) were estimated from the following model using the type I11 mean squares (MS) calculated by the SAS GLM procedure:
d a i t = d p + d o n e + d e p clone + d r o r
@ = (MSclone - MSxp * clone) /MSclone
where o:,it is the total phenotypic variance, is the pheno- typic variance among blocks, and c ~ : ~ ~ ~ ~ is the phenotypic vari- ance among clones.
QTL mapping: The 19 largest linkage groups, representing approximately half the estimated length of the Populus ge- nome (BRADSHAW et al. 1994), were scanned with MAP- MAKER-QTL 1.1 (PATERSON et al. 1988; LINCOLN et al. 1992). Based on the scanned length (1527.3 cM) and the average spacing between mapped markers (6.7 cM), a LOD threshold of 2.9 was chosen from Figure 4 of LANDER and BOTSTEIN (1989) to reduce to -5% the probability of falsely assigning a QTL. All genotypic data were encoded as though the pedigree were a cross between inbred lines; i.e., only two alleles, derived either from P. trichocaqa (T) or P. deltoides (D), were recog- nized at any locus (BRADSHAW et al. 1994). The mode of QTL action was estimated by comparing LOD scores of the various
models (dominant, recessive, additive) in MAPMAKER/QTL and accepting the model with the highest score. Overdomi- nance was inferred if the absolute value of the dominance/ additivity ratio was >1 and the unconstrained “free” model had a LOD score more than one unit above any of the stan- dard models (dominant, recessive, additive). Multiple QTL models for each trait were evaluated by MAPMAKER/QTL using the “sequence” function to specify QTL positions. Sta- tistical tests for two-locus epistasis were performed using the SAS GLM procedure (SAS Institute) to test for significance of the interaction term. None of the phenotypic distributions differed significantly from normality as judged by the value of the Shapiro-Wilk statistic calculated using the SAS UNI- VARIATE procedure (SAS Institute). A known triploid F2, 331-1062, was excluded from the analysis (BRADSHAW and STETTLER 1993).
Estimate of heterozygosity: Codominant RFLP data were collected for each F2 clone at a minimum of 25 loci. The proportion of loci heterozygous [TD/(TT + TD + DD)] was correlated with measures of growth using the SAS CORR pro- cedure (SAS Institute).
RESULTS
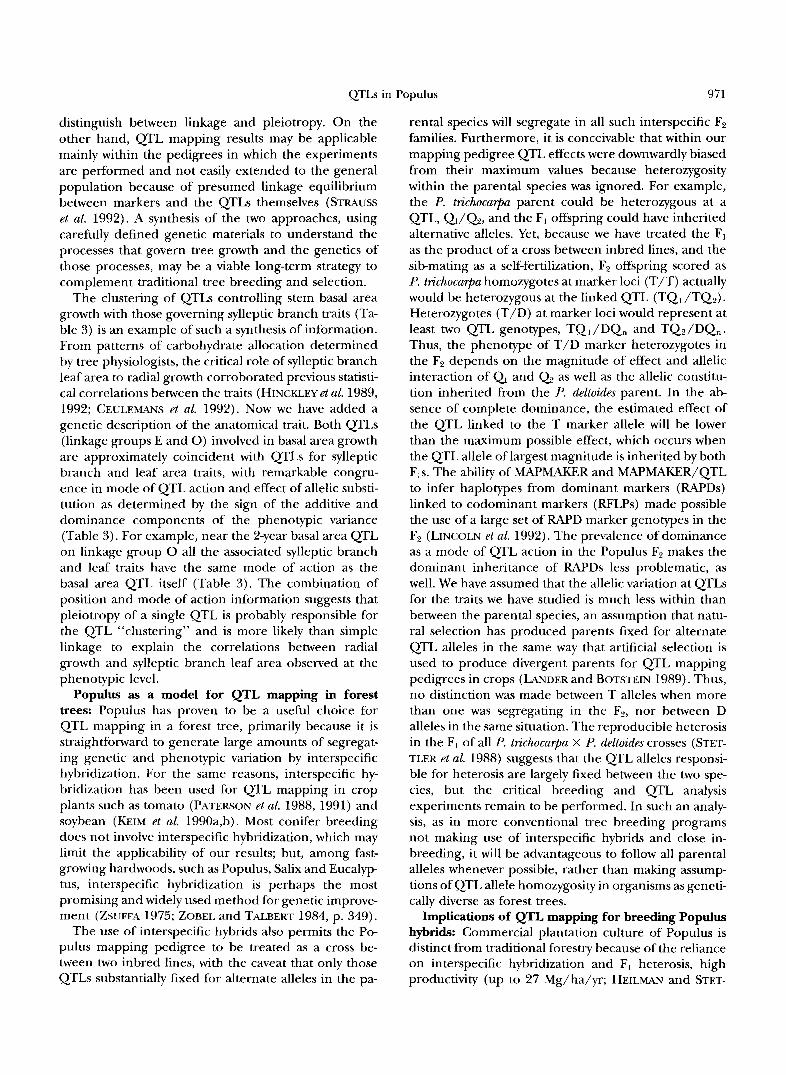
Trait distributions: Five traits were chosen for de- tailed study, with emphasis on characteristics of poten- tial adaptive and economic significance: date of spring leaf flush, stem height:diameter ratio and stem height, basal area, and volume growth. Each of these traits exhibits the continuous distribution of F2 phenotypes often associated with quantitative traits (Figure 2, A- E). Various patterns of trait transmission are observed. For 2-year height, the mean of the F1 is coincident with the taller of the two parental clones (T), while the F2 phenotypes largely are bounded by the parental (T and D) values (Figure 2A). Two-year basal area and stem volume index show the F1 heterosis (above the high parent) that is typical of many interspecific Popu- lus hybrids and is the basis of most Populus genetic improvement programs (Figure 2, B and C) . Height:diameter ratio is similar for the parental clones, lower for the F1 and transgressive in both direc- tions in the F2 (Figure 2D). Spring bud flush in the F2 reveals many transgressive segregants, as well, while the F1 mean is very close to the “early” (T) parent (Figure 2E).
Stem growth QTLS: Twenty-four growth, branch and leaf traits were selected for initial QTL mapping, princi- pally based upon previously discovered physiological and anatomical correlates of growth potential in hybrid Populus (Table 1) (HINCKLEY et al. 1989, 1992). We focused further attention on those regions of the ge- nome with effects on stem basal area and height. Stem height and diameter (from which basal area was esti-
FIGURE 1.-Linkage map of the Populus genome used for QTL mapping. Only the 19 largest linkage groups were used. Marker loci beginning with P are RFLPs (e.g., P1277), RAPD loci are named according to their Operon number and approximate fragment size (e.g., CO4-04 is a -400-bp fragment from primer C4), and a few loci of known identity are named (e.g., ADH is alcohol dehydrogenase). A more complete description of the map may be found in BRADSHAW et al. (1994).

966 H. D. Bradshaw et al
A 2 0 - D T 4 F1
8 16 -
n
Two-year height (cm) c 2 0 D 4
T F1 4 4
It 0 6 0 8 1
1 - I 2 4 32 40
Two-year volume index (dma’)
1
B 20-: T 4
F1 4
t I I I
10
6
0
Two-year basal area (cm2)
D 2 o t F l T 4 D
4
l6 t ’:[A 0
40 so 60
1
Two-year haight:diameter ratio
E 2ot F1 T D
4 4
I l l t ” - 6 - -
0 8 t i l , L 7 0 80 90 100 110 120
Spring bud flush (Julian day)
FIGURE 2.-Phenotypic trait distributions based on clonal means in the F2 generation, with clonal means of the Pqbulus tn’chocu~a parent (T), P. deltoides parent (D) and F1 generation (Fl ) shown.
mated) were measured after one and two seasons of growth in the field. Broad-sense heritabilities for height and basal area were fairly high, ranging from 63.5 to 81.7% (Table 2). For first-year stem height, no QTLs with LOD scores > 2.9 were found. A first-year basal area QTL was found on linkage group E (Table 2). It shows a dominant negative effect of the D allele and accounts for 27.2% of the phenotypic variance and 40.5% of the genetic variance in this trait. For second- year height, a QTL was found on linkage group D (Ta- ble 2). This QTL accounts for 25.9% of the phenotypic variance and 31.7% of the genetic variance in 2-year height, with the T allele having a positive effect domi- nant to the D allele. Second-year basal area is partly controlled by a QTL on linkage group 0, explaining 24.4% of the phenotypic variance, 38.4% of the genetic variance and having the D allele dominant with a posi- tive effect (Table 2).
We attempted to map QTLs directly affecting second- year stem volume index, which is an excellent predictor of subsequent growth and yield in hybrid poplar for which rotation (harvest) age is 6-15 years. No LOD scores z 2.9 were found when 2-year stem volume index was used as the trait variable, but a locus corresponding to the second-year basal area QTL on linkage group 0 gave a LOD score of 2.15, yielding a probability of 0.38 of detecting a QTL somewhere in the Populus genome using the “sparse map” estimator of LANDER and BOTSTEIN (1989). To carry the analysis of the genetic control of stem volume growth further, a model was constructed using the two QTLs identified for the com- ponents of second-year volume index: stem height and basal area. The two-QTL model explains 29.4% of the phenotypic variance and 44.7% of the genetic variance in stem volume index (LOD = 3.86). Genotypic data from the marker nearest each QTL were used to test

QTLs in Populus 967
for epistasis, but no significant interaction term ( P < 0.05) was found.
Marker heterozygosity as a predictor of growth: Be- cause of the heterosis for growth in the F, and the inbreeding depression commonly observed in F2 proge- nies (R. F. STEITLER and R. WU, unpublished observa- tions), the relationship between marker heterozygosity and growth was investigated in the F2. The range of marker heterozygosity in the F2 mapping population (n = 60, not all of which are represented in the clonal field trial) was 25-69%, with a mean 2 SD of 47 k 9.7%. Neither height nor basal area in either year was significantly ( P < 0.05) correlated with heterozygosity as determined by RFLP marker inheritance, and none of the correlation coefficients exceeded k0.16.
Stem form QTL Height:diameter ratio (HDR a sur- rogate for stem taper) was assessed after 2 years of growth. There is a single QTL for HDR on linkage group M (Table 2). The T allele increases the HDR and is dominant to the D allele, as was found for the 2-year height QTL on the same linkage group. This single QTL accounts for 39.0% of the genetic variance in HDR.
Spring leaf phenology: Spring flush had the highest broad-sense heritability of any trait measured (H" = 98.0%; Table 2). Five QTLs with major effects on the timing of spring bud break were identified. The QTLs were distributed among five different linkage groups each accounting for 28.7-51.5% of the phenotypic vari- ance (Table 2). Three of the QTLs showed a dominant mode of action, with early flush dominant to late flush regardless of the origin of the allele (T or D) (Table 2). The two remaining QTLs apparently are additive in effect (Table 2). When all five QTLs are combined in a single model, 84.7% of the genetic variance is explained (LOD = 16.63).
Clustering of QTLs affecting g r o e Both the first- and second-year basal area QTLs, while on different linkage groups, were found in a cluster of QTLs for branch and leaf traits (Table 3). For this analysis, QTLs associated with radial growth were included if the LOD score exceeded 2.0. Since the region of the genome searched for associated traits was restricted to the link- age groups harboring basal area QTLs, the probability of falsely declaring a QTL remains below 0.05 using the "sparse map" estimator of LANDER and BOTSTEIN (1989). The second-year basal area QTL found on link- age group 0 is flanked by likely QTLs for sylleptic branch total leaf area (sylleptic branches arise from buds that have not overwintered) and possible QTLs for first-year basal area, basal area increment (from year 1 to year 2), sylleptic branch number and sylleptic branch leaf number (Table 3). At each of the six QTLs the D allele has a dominant positive effect on the phe- notype (Table 3).
TABLE 1
Traits mapped
Trait QTL number
€P (%) (LOD 2 2.9)
Height Year 1 Year 2
Height increment Year 2
Basal area Year 1 Year 2
Year 2
Year 1 Year 2
Volume index increment
Year 2 Height:diameter ratio
Year 2 Sylleptic branch
Year 1 number Year 2 number
Proleptic branch Year 1 number
Sylleptic branch Year 1 leaf number Year 2 leaf number
Year 1 leaf number
Year 1 single leaf area Year 2 single leaf area
Year 1 single leaf area
Year 1 total leaf area Year 2 total leaf area
Year 1 total leaf area Year 1 origin angle
Basal area increment
Volume index
Proleptic branch
Sylleptic branch
Proleptic branch
Sylleptic branch
Proleptic branch
Spring bud flush
68.9 0 81.7 1
75.0 1
67.2 1 63.5 1
62.1 0
67.2 0 65.7 0
65.4 0
85.7 1
77.3 0 80.4 0
68.3 1
76.5 0 82.8 0
66.3 1
70.5 1 73.0 0
78.0 1
58.5 2 75.3 2
55.2 0 79.3 0 98.0 5
The first-year basal area QTL on linkage group E coincides with QTLs for spring flush, first-year height, second-year basal area, sylleptic branch number and sylleptic branch leaf number (Table 3). The position and mode of QTL action appear similar for first-year basal area, sylleptic branch number and sylleptic branch leaf number with the D allele having a negative effect on both parameters dominant to the T allele (Table 3). The second-year basal area QTL, some distance away, shows the same negative effect of the D allele, but additivity is suggested as the most probable mode of action. However, additivity is only slightly more likely

968 H. D. Bradshaw et al.
TABLE 2
Growth, form and phenology QTL.
Phen. g2 Gen. ~ ~ ~ ~ _ _ _ _ _ _ _ _ ~
Dom d:a Trait/linkage group LOD (%) (%) (%) Mode Mean TT Add D D ratio
Height year 2 (cm)
Height increment year 2 (cm)
Basal area
E
0
D
D
Year 1 (cm‘)
Year 2 (cm‘)
Height:diameter ratio year 2
Spring bud flush Uulian day) M
G M F E P
3.43
3.43
3.01
2.94
4.04
4.71 4.12 3.96 3.21 3.18
25.9
26.1
27.2
24.4
33.4
41.0 34.7 51.5 30.3 28.7
81.7
75.0
67.2
63.5
85.7
98.0 98.0 98.0 98.0 98.0
31.7 T+ > D-
34.8 T+ > D-
40.5 D- > T+
38.4 D+ > T-
39.0 T+ > D-
41.8 T- > D+ 35.4 D+ (additive) 52.6 D- > T+ 30.9 T- > D+ 29.3 D+ (additive)
388.92
204.47
5.74
20.32
66.06
88.50 84.44
108.72 91.25 86.00
-39.06
-23.46
-0.61
3.27
-4.02
8.26 8.50
-9.01 7.31 6.82
41.35 - 1.06
32.46 - 1.38
-1.39 2.28
6.86 2.10
9.88 -2.46
-5.90 -0.71 -0.95 -0.11 -9.99 1.11 -7.84 -1.07 -0.18 -0.03
Linkage group refers to the map in Figure 1. Phen., the proportion of the total phenotypic variance explained by the QTL; Gen., the proportion of the total genotypic variance explained by the QTL (Gen. = Phen./p); >, dominant to; + and -, the direction of effect on the phenotype; Mean T T , the clonal mean phenotype for T/T (Populus trichocarpa) homozygotes at the QTL; Add D, the additive effect of the D (P. deltoides) allele; Dom D, the dominance effect of the D allele; d:a, the dominance:addi- tivity ratio. Increments (e.g., basal area increment) are calculated by subtracting year one growth from total growth measured in year 2 .
-
(LOD = 2.03) than dominance (LOD = 1.97). At the QTLs on linkage group E for first-year height and spring flush, the effect of the D allele is recessive to the T allele, perhaps implying that these QTLs are dis- tinct from the cluster of QTLs with similar modes of action (Table 3). This argument is further supported for the first-year height QTL, which has its most likely placement at some distance from the basal area QTL (Table 3).
The QTL for 2-year height on linkage group D was not closely coincident with any branch and leaf trait QTLs, although a possible QTL for sylleptic branch number was located >88 cM from the height QTL.
DISCUSSION
Commercially important quantitative traits are not necessarily polygenic in forest trees: Growth and adap- tive characters, such as height, basal area, stem propor- tion and leaf phenology, are generally normally distrib- uted in forest tree populations, and the F2 of our three- generation Populus pedigree is no exception (Figure 2, A-E). Such distributions could be due to genetic control by a large number of unlinked genes each with a small effect on the phenotype, as is assumed in the conventional quantitative “polygenic” model. Alterna- tively, these traits could be controlled by a few loci with relatively large effects (the “oligogenic” model), with
nongenetic (environmental) variation masking any dis- crete phenotypes (&LARD 1960).
Genetic improvement strategies in hybrid Populus differ markedly depending upon which of the above models is more nearly correct. Should growth and adap tation be treated as quantitative traits controlled by a large number of unlinked genes and the phenotypes handled as statistical abstractions, or should the breed- ing strategy focus on identifylng, further characterizing and manipulating key QTLs of known number, map position, magnitude of effect and mode of action?
Stem volume is a yield trait, the cumulative result of carbon assimilation and allocation over multiple sea- sons of growth. Since both assimilation and allocation are influenced by many biochemical pathways, physio- logical processes and anatomical traits, as well as envi- ronmental variables such as water and nutrient status, light intensity and duration, air and soil temperature, daylength and heat sum and perhaps pest and pathogen pressure, it is intuitive that the integration of growth with these variables must be genetically complex. Our QTL mapping results suggest that, for 2-year stem vol- ume growth, -30% of the phenotypic variance and 45% of the genetic variance are accounted for by just two QTLs in the F2. This implies that the simplest ver- sion of the polygenic model (ie., many unlinked QTLs of small effect) is not applicable to this F2 family in the

QTLs in Populus
TABLE 3
QTL clusters associated with stem growth
969
~ ~~ ~ ~ ~~
QTL position Gen.
Trait ( C M ) Mode LOD ( % I Linkage group 0
Basal area year 1 (cm2) a 6 D+ > T- 2.83 39.9 Basal area year 2 (cm‘)” 10 D+ > T- 2.94 38.4 Basal area increment year 2 (cm2)o 11 D+ > T- 2.60 34.1 Sylleptic branch year 1 total leaf areab (cm‘) 20 D+ > T- 3.87 48.5 Sylleptic branch year 1 leaf number* 20 D+ > T- 2.60 26.8 Sylleptic branch year 1 numberb 20 D+ > T- 2.00 21.6
Linkage group E
Basal area year 1 (cm‘)” 24 D- > T- 3.01 40.5 Spring bud flush Uulian day) 30 T- > D+ 3.21 30.9 Sylleptic branch year 1 leaf number* 36 D- > T+ 2.63 45.9 Sylleptic branch year 1 numberb 42 D- > T+ 2.11 37.9 Basal area year 2 (cm‘)‘ 73 D - (additive) 2.16 27.4 Height year 1 (cm)” 134 T+ > D- 2.38 55.3
Linkage group refers to the map in Figure 1. QTL position the distance from the “top” of the linkage group shown in Figure I; >, dominant to; + and -, indicate the direction of effect on the phenotype; Gen., the proportion of the total genotypic variance explained by the QTL (as in Table 1).
“ Key growth traits. Measured in year 2.
environment tested. It is an open question whether each of the mapped QTLs represents many tightly linked genes each with a relatively small effect on the phenotype or single genes governing rate-limiting steps in key biochemical pathways.
Height:diameter ratio is a surrogate measure for stem taper and indirectly affects yield and straightness of the bole. Fast-growing trees with low stem taper often have sinuous trunks undesirable for many purposes. Stem straightness is known to be highly heritable in several tree species (ZOBEL and TALBERT 1984, p. 446). As ex- pected, in our Populus mapping pedigree the T allele has the effect of increasing HDR, creating the tall, ta- pered form characteristic of P. trichocuqbu (Table 2).
Spring bud flush was studied for three principal rea- sons: it is an adaptive trait in forest trees (correlated with tolerance of late spring frosts), it segregates trans- gressively in the mapping pedigree (Figure 2E) and it is known to be under very strong genetic control in Populus (WILCOX and FARMER 1967; YING and BACLEY 1976; DUNLAP 1991) and other tree species, including conifers such as Douglas fir (ADAMS et al. 1994). The two parental trees are from very different climates, with the P. trichocurpu female originating in maritime Wash- ington west of the Cascades and the P. deltoides male from continental Illinois in the midwestern United States. Unlike the QTL alleles involved in growth and form traits, we did not expect the parental species to
be substantially fixed for the alleles giving rise to pheno- typic segregation in the Fz. Since the QTL mapping only considered two alleles (T and D) at any locus, although as many as four RFLP alleles (TI, TY, Dl, D2) could be segregating depending upon the allelic consti- tution of the Fls, we anticipated a reduced power to identify QTLs for spring flush. Nevertheless, a large proportion (84.7%) of the genetic variance in spring flush date was accounted for by the simple two-allele model, with contributions from five QTLs. As expected, both T and D alleles were capable of producing “earli- ness” and “lateness” in spring flush, although “earli- ness” was dominant to “lateness” regardless of the source of the allele when dominance was the mode of action (Table 2) . The D allele at the five QTLs, with one exception, delayed the onset of bud burst, probably due to its northern continental origin and perhaps ex- plaining the success of the oversimplified two-allele model.
Heterosis and inbreeding depression in the Populus mapping population: It is likely that interspecific hy- bridization and subsequent inbreeding to produce the F2 have intensified the effects of the dominant QTL alleles contributing to volume growth in this pedigree. The two parental species belong to different sections of the genus (ECKENWALDER 1977) and are adapted to essentially nonoverlapping environments. The hetero- sis for stem volume growth above the high parent seen

970 H. D. Bradshaw et nl.
in F, hybrids indicates that dominance, overdominance and/or epistasis are more important contributors to phenotypic variance in the F2 than is simple additive gene action. The phenotypic variation seen in the rela- tively small F2 family we have tested is, in fact, much more extreme than one could reasonably expect from an intraspecific F, of similar size, facilitating the search for QTLs of large effect. Similarly, close inbreeding is rarely used in operational tree breeding, but simplifies some aspects of QTL mapping by reducing the number of potential QTL alleles segregating in the F2. Inbreed- ing could lead to the identification of “growth” QTLs that are merely expression of the mutational load car- ried by the parental trees, rather than “growth” QTLs that are generally reflective of all F,s derived from the two Populus species, and this possibility is discussed below.
P. trichocarpa, native to the geographic area in which the F, progeny was tested, is characterized by its excel- lent height growth potential and prolific rooting from hardwood cuttings. That the major positive QTL allele for 2-year height growth is dominant and derived from the P. trichocarpa parent (Table 2) is in concordance with previous expectations resulting from the observa- tion that the T parent of T X D hybrids is generally as tall as the F, (Figure 2A). The heterosis for 2-year stem volume in the F1 is due entirely to the superior basal area component of growth. By exclusion, this increased basal area must be derived from a net positive contribu- tion of the P. deltoides parent. QTL mapping shows that the QTL allele on linkage group 0 with a positive effect on 2-year basal area comes from P. deltoides and is domi- nant to the T allele. The positive contribution of P. deltoide~s to stem growth could not have been deduced from its poor performance in the testing environment (Figure 2, A-C) but is revealed clearly in the F2 (see also Wu and STETTLER 1994), analogous to the unexpected direction of some QTL allele effects in wide crosses of Lycopersicon (DEVICENTE and TANKSLEY 1993).
The control of a large proportion of stem growth by relatively few QTLs and the prevalence of dominant allelic interactions at QTLs with effects on growth traits potentially could be explained by the common mecha- nism of inbreeding depression. There is the possibility that the dominant “growth” QTLs we have mapped are simply masking deleterious recessives with effects on some component of growth and reflect the genetic load carried by each of the original P. trichocarpa and P. deltoides parents. This possibility remains to be tested in outcrossed F, progenies, but neither of the regions containing a QTL for 2-year height and 2-year basal area shows significant segregation distortion (BRAD- SHAW and STETTLER 1994). The observed oligo-QTL control of volume growth in the F2 is unlikely to be due simply to inbreeding depression for another reason:
the parental species contributed QTL alleles beneficial for volume growth in the way expected from traditional genetic tests; i.e., increased height growth from the P. trichocarpa parent and net increased basal area from the P. deltoides parent. If inbreeding depression resulting from homozygosity of deleterious alleles were the only cause of growth reduction in the F P , we might expect that either parent would be equally likely as the source of a beneficial QTL.
The role of dominance in stem growth is perhaps to be expected given the wide interspecific hybrid pedi- gree we have used for QTL mapping (STRAUSS et al. 1992). However, nonadditive (dominance, overdomi- nance and /or epistatic) variance also plays a large role even in intraspecific progenies of P. deltoides, where ad- ditive genetic variance was estimated at nearly zero while nonadditive variance accounted for 24% of the phenotypic variance in 4year stem volume index (Fos TER 1985). Nonadditive genetic control of stem growth is also prominent in conifers such as loblolly pine, ex- ceeding the contribution of additive variance for the first 10-12 years of stand development (BALOWHI et al. 1993).
The low and insignificant correlation between marker heterozygosity and growth reinforces the notion that stem growth is not polygenic in this pedigree. If the polygenic model of many unlinked QTLs, each with small effect, were valid for describing growth in this F, family, and heterosis above the high parent is due to dominance and/or overdominance, it might be ex- pected that those F2 offspring approaching the 100% heterozygosity characteristic of the F, generation would grow faster than clones with lower heterozygosity. The superiority of F2s with high heterozygosity should be further enhanced if inbreeding depression in the F2 is due to quantitatively distributed deleterious recessive alleles. The lack of correlation between overall marker heterozygosity and growth implies that neither growth nor inbreeding depression in the F2 are polygenic. The situation in our Populus pedigree is quite different from what is seen in maize, where grain yield is highly correlated ( r = 0.68) with heterozygosity (STUBER et al. 1992).
Clustering of QTLs: In forest tree breeding, molecu- lar markers may he less useful for marker-aided selec- tion (STRAUSS et al. 1992) than for helping to elucidate the connection between specific genetic loci and the anatomical, physiological and biochemical mechanisms that produce desirable phenotypes (but see WIL~LIAMS and NEALE 1992). Traditional morphological and physi- ological predictors of growth have relied upon trait cor- relations whose genetic basis is unknown or described only in statistical terms. Such studies typically cannot accurately estimate the number of loci underlying the trait, determine the mode of action of the QTLs or
QTLs in Populus 971
distinguish between linkage and pleiotropy. On the other hand, QTL mapping results may be applicable mainly within the pedigrees in which the experiments are performed and not easily extended to the general population because of presumed linkage equilibrium between markers and the QTLs themselves (STMUSS et al. 1992). A synthesis of the two approaches, using carefully defined genetic materials to understand the processes that govern tree growth and the genetics of those processes, may be a viable long-term strategy to complement traditional tree breeding and selection.
The clustering of QTLs controlling stem basal area growth with those governing sylleptic branch traits (Ta- ble 3) is an example of such a synthesis of information. From patterns of carbohydrate allocation determined by tree physiologists, the critical role of sylleptic branch leaf area to radial growth corroborated previous statisti- cal correlations between the traits (HINCKLEY et al. 1989, 1992; CEULEMANS et al. 1992). Now we have added a genetic description of the anatomical trait. Both QTLs (linkage groups E and 0) involved in basal area growth are approximately coincident with QTLs for sylleptic branch and leaf area traits, with remarkable congru- ence in mode of QTL action and effect of allelic substi- tution as determined by the sign of the additive and dominance components of the phenotypic variance (Table 3). For example, near the 2-year basal area QTL on linkage group 0 all the associated sylleptic branch and leaf traits have the same mode of action as the basal area QTL itself (Table 3). The combination of position and mode of action information suggests that pleiotropy of a single QTL is probably responsible for the QTL “clustering” and is more likely than simple linkage to explain the correlations between radial growth and sylleptic branch leaf area observed at the phenotypic level.
Populus as a model for QTL mapping in forest trees: Populus has proven to be a useful choice for QTL mapping in a forest tree, primarily because it is straightforward to generate large amounts of segregat- ing genetic and phenotypic variation by interspecific hybridization. For the same reasons, interspecific hy- bridization has been used for QTL mapping in crop plants such as tomato (PATEMON et al. 1988, 1991) and soybean (KEIM et al. 1990a,b). Most conifer breeding does not involve interspecific hybridization, which may limit the applicability of our results; but, among fast- growing hardwoods, such as Populus, Salix and Eucalyp- tus, interspecific hybridization is perhaps the most promising and widely used method for genetic improve- ment (ZSUFFA 1975; ZOBEI. and TALBERT 1984, p. 349).
The use of interspecific hybrids also permits the Po- pulus mapping pedigree to be treated as a cross be- tween two inbred lines, with the caveat that only those QTLs substantially fixed for alternate alleles in the pa-
rental species will segregate in all such interspecific F2 families. Furthermore, it is conceivable that within our mapping pedigree QTL effects were downwardly biased from their maximum values because heterozygosity within the parental species was ignored. For example, the P. tn‘chocarpa parent could be heterozygous at a QTL, Q/@, and the FI offspring could have inherited alternative alleles. Yet, because we have treated the F1 as the product of a cross between inbred lines, and the sib-mating as a self-fertilization, F2 offspring scored as P. trichocarpa homozygotes at marker loci (T/T) actually would be heterozygous at the linked QTL (TQ, /TQ2). Heterozygotes (T/D) at marker loci would represent at least two QTL genotypes, TQ, /DQ,, and TQ2/DQn. Thus, the phenotype of T/D marker heterozygotes in the F2 depends on the magnitude of effect and allelic interaction of Q and Q as well as the allelic constitu- tion inherited from the P. deltoides parent. In the ab- sence of complete dominance, the estimated effect of the QTL linked to the T marker allele will be lower than the maximum possible effect, which occurs when the QTL allele of largest magnitude is inherited by both F,s. The ability of MAPMAKER and “ A K E R / Q T L to infer haplotypes from dominant markers (RAPDs) linked to codominant markers (RFLPs) made possible the use of a large set of RAPD marker genotypes in the F2 (LINCOLN et al. 1992). The prevalence of dominance as a mode of QTL action in the Populus F2 makes the dominant inheritance of RAPDs less problematic, as well. We have assumed that the allelic variation at QTLs for the traits we have studied is much less within than between the parental species, an assumption that natu- ral selection has produced parents fixed for alternate QTL alleles in the same way that artificial selection is used to produce divergent parents for QTL mapping pedigrees in crops (LANDER and BOTSTEIN 1989). Thus, no distinction was made between T alleles when more than one was segregating in the F2, nor between D alleles in the same situation. The reproducible heterosis in the F1 of all P. tnchocarpa X P. deltoides crosses (STET- TLER et al. 1988) suggests that the QTL alleles responsi- ble for heterosis are largely fixed between the two spe- cies, but the critical breeding and QTL analysis experiments remain to be performed. In such an analy- sis, as in more conventional tree breeding programs not making use of interspecific hybrids and close in- breeding, it will be advantageous to follow all parental alleles whenever possible, rather than making assump- tions of QTL allele homozygosity in organisms as geneti- cally diverse as forest trees.
Implications of QTL mapping for breeding Populus hybrids: Commercial plantation culture of Populus is distinct from traditional forestry because of the reliance on interspecific hybridization and F, heterosis, high productivity (up to 27 Mg/ha/yr; HEILMAN and STET-

972 H. D. Bradshaw et al.
TLER 1985), relatively short rotation (time from plant- ing to harvest, typically 4-8 years for a biomass planting and 15-20 years for veneer or solid wood), deployment of clonal material and intensive cultural practices. The benefits from a more detailed understanding of the genetic basis of heterosis in hybrid Populus may be realized quickly because of these factors (ABELSON 1991).
Populus breeding programs around the world have relied upon interspecific hybridization and F1 heterosis to make genetic gains in stem volume growth (ZSUFFA 1975). There has been relatively little work on F2 and/ or backcross breeding (but see JOHNSON 1947; STET- TLER et al. 1988), perhaps because the mean perfor- mance of F2 and backcross families is disappointingly low compared to that of F1 families (Figure 2, A-C). Since Populus plantations are typically clonal, however, the mean family performance is relatively unimportant, and the F2 and backcross generations are richer than the F1 in variation for many traits of basic and commer- cial interest. As long as sufficiently large F2 family sizes can be produced, which is usually not difficult in Popu- lus, there is a potential opportunity to recover trans- gressive segregants above the F, phenotypic values. Fur- ther, advanced generation breeding, as opposed to recurrent F1 breeding, could take advantage of useful germplasm from many other Populus species, such as P. nigra and P. rnaximowinii, known to contribute desirable alleles in hybrid combination with P. trichocaqa and P. deltoides (HANSEN et al. 1992). These species, distributed across temperate latitudes in the northern hemisphere and adapted to many different growing environments, could be treated as a single gene pool.
We thank MILT GORDON for allowing us the laboratory space to carry out the mapping studies, PAUI. HEII.MAN for providing us with cutting material and assistance with plantation design, MARC VILLAR for placing many RAPD markers on the map, RONOLING WU for helpful discussions and for phenotypic data collection, BRIAN WAT- SON, KEVIN OlTO, PAULA GLACKIN, SARAH WOI.POW, DIANE FOGLE, and GORDY EKUAN for technical expertise, CARL RICHES for main- taining the genome mapping and phenotypic trait databases and DOUG EWING for his care of Populus in the greenhouse. DAVID NEALE and BEN LIU provided critical reviews of the manuscript that led to its improvement. This work was supported by grants from the U.S. Department of Agriculture Competitive Grants Plant Genome Prw gram (91-37300-6458 and 92-37300-7656), U.S. Department of Energy (19X43382C), Washington Technology Center (09-1022), Boise Cascade Corporation and James River Corporation. Genome mapping and phenotypic data are maintained in the Poplar Molecu- lar Network databases (gopher poplar1 .cfr.washington.edu for access to the PMN), funded by a U.S. Department of Agriculture/U.S. De- partment of Energy/National Science Foundation Collaborative Re- search in Plant Biology grant (CSRS 92-37105-7764) to R.F.S.
LITERATURE CITED
ABEISON, P., 1991 Improved yields of biomass. Science 252: 1469. ADAMS, W. T., S. N. AITKEN and L. BALDUMAN, 1994 Pacific Northwest
Tree Improvement Cooperative Annual Report 1993-94, Forest
Research Laboratory, Oregon State University, Corvallis, OR, pp. 3-20.
A L ~ , R. W., 1960 Principles ofplant Breeding. John Wiley and Sons, New York.
BALOCCHI, C. E., F. E. BRIDGWATER, B. J. ZOBEL and S. JAHROMI, 1993 Age trends in genetic parameters for tree height in a nonselected population of loblolly pine. For. Sci. 3 9 231-251.
B-SHAW, H. D., JR., and R. F. STETTLER, 1993 Molecular genetics of growth and development in Populus. I. Triploidy in hybrid poplars. Theor. Appl. Genet. 86: 301-307.
B ~ S H A W , H. D., JR., and R. F. STETTLER, 1994 Molecular genetics of growth and development in Populus. 11. Segregation distortion due to genetic load. Theor. Appl. Genet. (in press).
BRADSHAW, H. D., JR., M. VILLAR, B. D. WATSON, K. G. Orro, S. STEWART et al., 1994 Molecular genetics of growth and develop ment in Populus. 111. A genetic linkage map of a hybrid poplar composed of RFLP, STS, and RAPD markers. Theor. Appl. Genet. 89: 551-558.
CEULEMANS, R., G. SCARASCIA-MUGNOZZA, B. M. WIARD, J. H. BRAATNE, T. M. HINCKLEY et al., 1992 Production physiology and morphol- ogy of Populus species and their hybrids grown under short rotation. 1. Clonal comparisons of 4year growth and phenology. Can. J. For. Res. 22: 1937-1948.
DEVICENTE, M. C., and S. D. TANKSI.EY, 1993 QTL analysis of trans- gressive segregation in an interspecific tomato cross. Genetics
DUNLAP, J. M., 1991 Genetic variation in natural populations of Populus trichocarpa T. & G. from four river valleys in Washington. Ph.D. thesis, University of Washington, Seattle.
DUNIN, J. M., P. E. HEILMAN and R. F. STETIXER, 1992 Genetic variation and productivity of Populus trichocaqa and i t s hybrids. V. The influence of ramet position on %year growth variables. Can. J. For. Res. 22: 849-857.
ECKENWALDER, J. E., 1977 Systematics of Populus L. (Salicaceae) in southwestern North America with special reference to Sect. Aigeiros Duby. PhD. Thesis, University of California, Berkeley.
FOSTER, G. S., 1985 Genetic parameters for two Eastern cottonwood populations in the lower Mississippi valley, pp. 258-266 in P m ceedings 18th Southern Forest Tree Improvement Conference, edited by R. C. Schmidtling and M. M. Griggs. Long Beach, MI. National Technical Information Service, Springfield, VA.
HANSEN, E., P. HEILMAN and S. STROBI., 1992 Clonal testing and selection for field plantations, pp. 124- 145 in Structural andFunc- tional Responses to Environmental Stresses, edited by K. H. KREEB, H. RICHTER and T. M. HINCKIBY. SPB Academic Publications, The Hague, The Netherlands.
HEILMAN, P. E., and R. F. STETTLER, 1985 Genetic variation and productivity of Populus trichocarpa T. & G. and its hybrids. 11. Biomass production in a 4year plantation. Can. J. For. Res. 15:
HINCKIXY, T. M., R. CEULEMANS, J. M. DUNIAP, A. FIGLIOLA, P. E. HEILMAN, et al., 1989 Physiological, morphological, and anatomi- cal components of hybrid vigor in Populus, pp. 199-217 in Struc- tural and Functional Responses to Environmental Stresses, edited by K. H. KREEB, H. RICHTER and T. M. HINCKI.EY. SPB Academic Publications, The Hague, The Netherlands.
HINCKLEY, T.M., J. BRAATNE, R. CEULEMANS, P. CLUM, J. DUNLAP et al., 1992 Growth dynamics and canopy structure, pp. 1-34 in Ecophysioloa of Shmt Rotation Forest Crops, edited by C. P. MITCH- ELL, J. B. FORD-ROBERTSON, T. HINCKLEY and L. SENNERBY- FORSSE. Elsevier Applied Science, New York.
JOHNSON, L. P. V., 1947 A note on inheritance in F, and F2 hybrids of Populus alba L. X P. grandidentata Michx. Can. J. Res. C 2 4
KEIM, P., B. W. DIERS, T. C. OLSON and R. C. SHOEMAKER, 1990a RFLP mapping in soybean: association between marker loci and variation in quantitative traits. Genetics 126: 735-742.
KEIM, P., B. W. DIERS and R. C. SHOEMAKER, 1990b Genetic analysis of soybean hard seededness with molecular markers. Theor. Appl. Genet. 79: 465-469.
LANDER, E. S., and D. BOTSTEIN, 1989 Mapping Mendelian factors underlying quantitative traits using RFLP linkage maps. Genetics 121: 185-199.
134: 585-596.
382-388.
313-317.

QTLs in Populus 973
LINCOLN, S. E., M. J. DALY and E. S. LANDER, 1992 Mapping Genes Controlling Bantitatiue Traits urith MAPMAKER/QTL 1.1. Whitehead Institute Technical Report, Cambridge, MA.
PATERSON, A. H., E. S. LANDER, J. D. HEWITT, S. PETERSON, S. E. LINCOLN et al., 1988 Resolution of quantitative traits into Mende- lian factors by using a complete linkage map of restriction frag- ment length polymorphisms. Nature 335: 721-726.
PATERSON, A. H., S. DAMON, J. D. HEWITT, D. ZAMIR, H. D. RABINOW ITCH et al., 1991 Mendelian factors underlying quantitative traits in tomato: comparison across species, generations, and environ- ments. Genetics 127: 181-197.
STETTLER, R. F., R. KOSTER and V. STEENACKERS, 1980 Interspecific crossability studies in poplars. Theor. Appl. Genet. 58: 273-282.
STETTLER, R. E., R. C. FENN, P. E. HEILMAN and B. J. STANTON, 1988 POpulus trichocarpa X Populus deltoides hybrids for short-rotation culture: variation patterns and 4year field perfomance. Can. J. For. Res. 18: 745-753.
STRAWS, S. H., R. LANDE and G. NAMKOONG, 1992 Limitations of molecular-marker-aided selection in forest tree breeding. Can. J. For. Res. 22: 1050-1061.
STUBER, C. W., S. E. LINCOLN, D. W. WOLW, T. HELENTJARIS and E. S. LANDER, 1992 Identification of genetic factors contributing to
heterosis in a hybrid from two elite maize inbred lines using molecular markers. Genetics 132 823-839.
WILCOX, J. R., and R. E. FARMER, JR., 1967 Variation and inheritance of juvenile characters of eastern cottonwood. Silvae Genet. 16: 162-165.
WILLIAMS, C. G., and D. B. NEALE, 1992 Conifer wood quality and marker-aided selection: a case study. Can. J. For. Res. 22: 1009- 1017.
WU, R., and R. F. STETTLER, 1994 Quantitative genetics of growth and development in Populus. I. A three-generation comparison of tree architecture during the first two years of growth. Theor. Appl. Genet. (in press).
YING, C., and W. BAGLEY, 1976 Genetic variation of eastern cotton- wood in an eastern Nebraska provenance study. Silvae Genet.
ZOBEL, B., and J. TALBERT, 1984 Applied Forest Tree Improvement. John Wiley and Sons, New York.
ZSUFFA, L., 1975 A summary review of interspecific breeding in the genus Populus, pp. 107-123 in Proceedings 14th Meeting Canadian Tree Improvement Association, part 2, edited by D. P. FOWLER and C. W. YFATMAN. Fredericton, New Brunswick, Canada.
25: 67-73.
Communicating editor: Z.-B. ZENG